
Ruxolitinib Combined with Gemcitabine against Cholangiocarcinoma Growth via the JAK2/STAT1/3/ALDH1A3 Pathway

 , , , ,
  ,
,  , and
, and 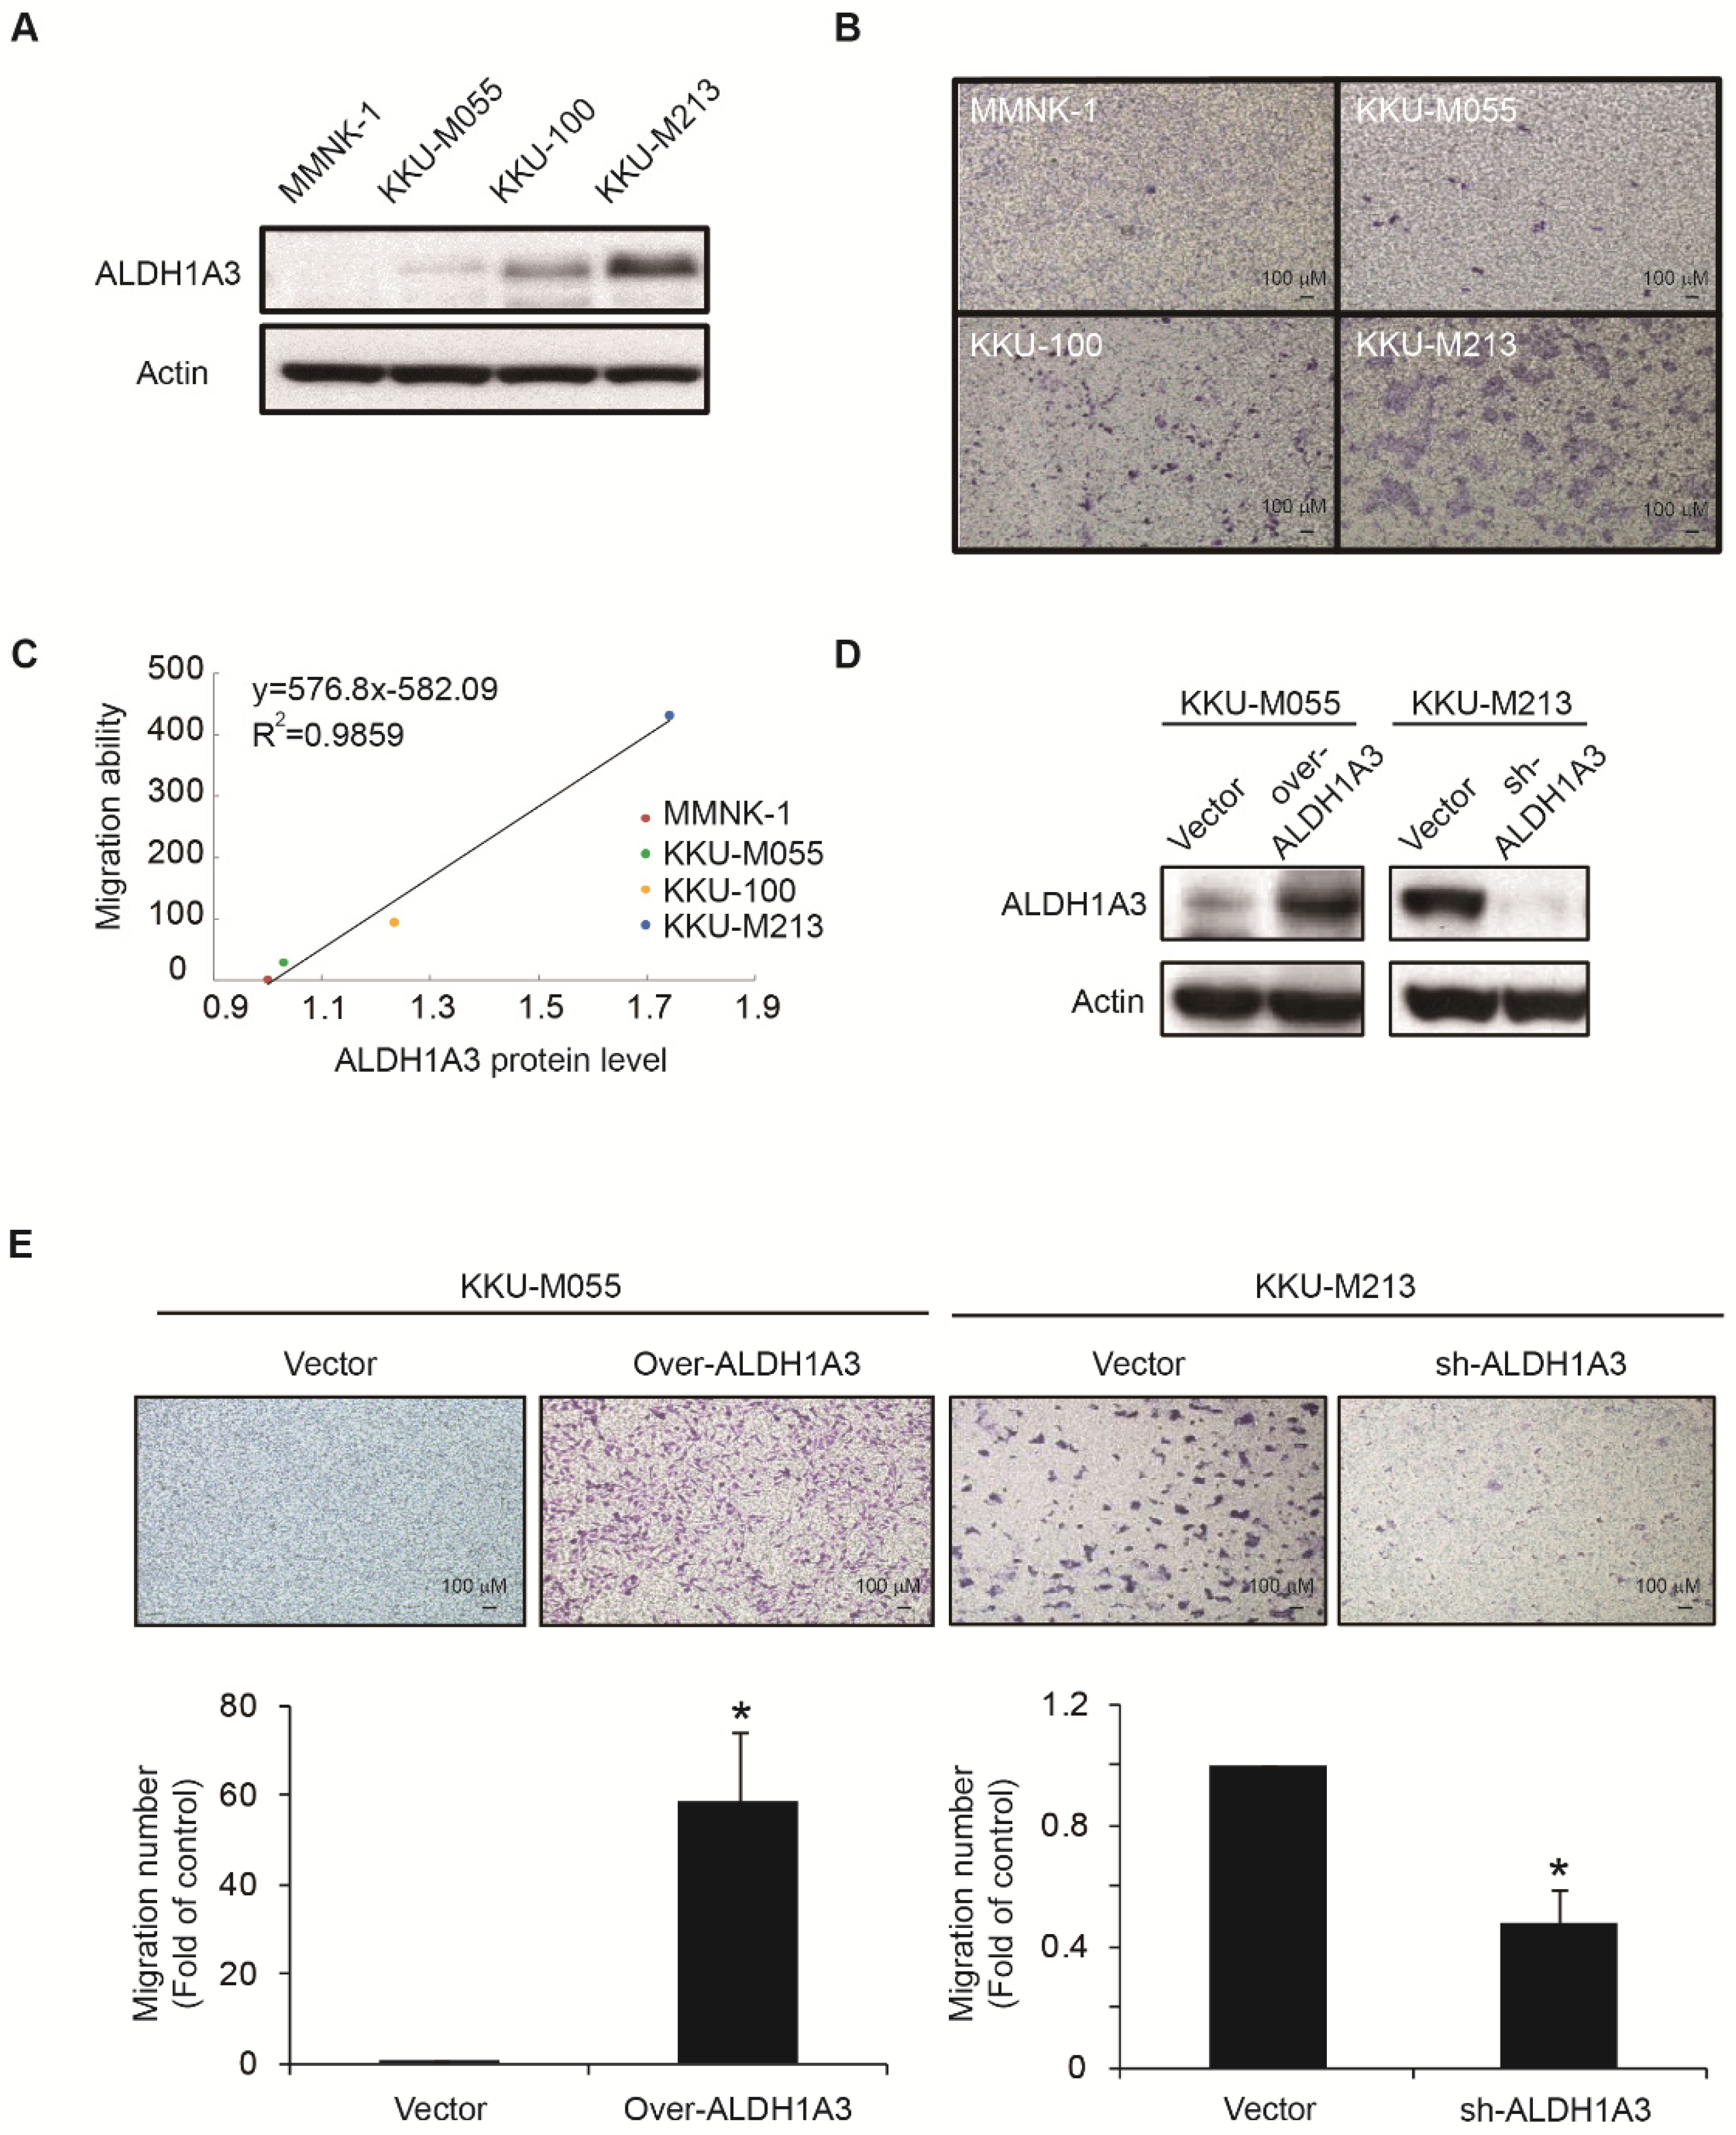
Abstract
:1. Introduction
2. Material and Methods
2.1. Cell Culture
2.2. Virus Production and Infection
2.3. Transwell Migration Assay
2.4. L1000 and LINCS Analysis
2.5. Cell Viability Measurements
2.6. Western Blot Analysis
2.7. Immunohistochemistry Staining
2.8. Quantitative RT-PCR
2.9. Re-Chromatin Immunoprecipitation Assay
2.10. Animal Experiments
2.11. Promo 3.0
2.12. Positron Emission Tomography
2.13. Statistical Analysis
3. Results
3.1. ALDH1A3 Affects the Migration Abilities of Cholangiocarcinoma Cells
3.2. Identify Potential Drugs to Reverse the Gene Signatures of ALDH1A3 in Cholangiocarcinoma Cell Lines
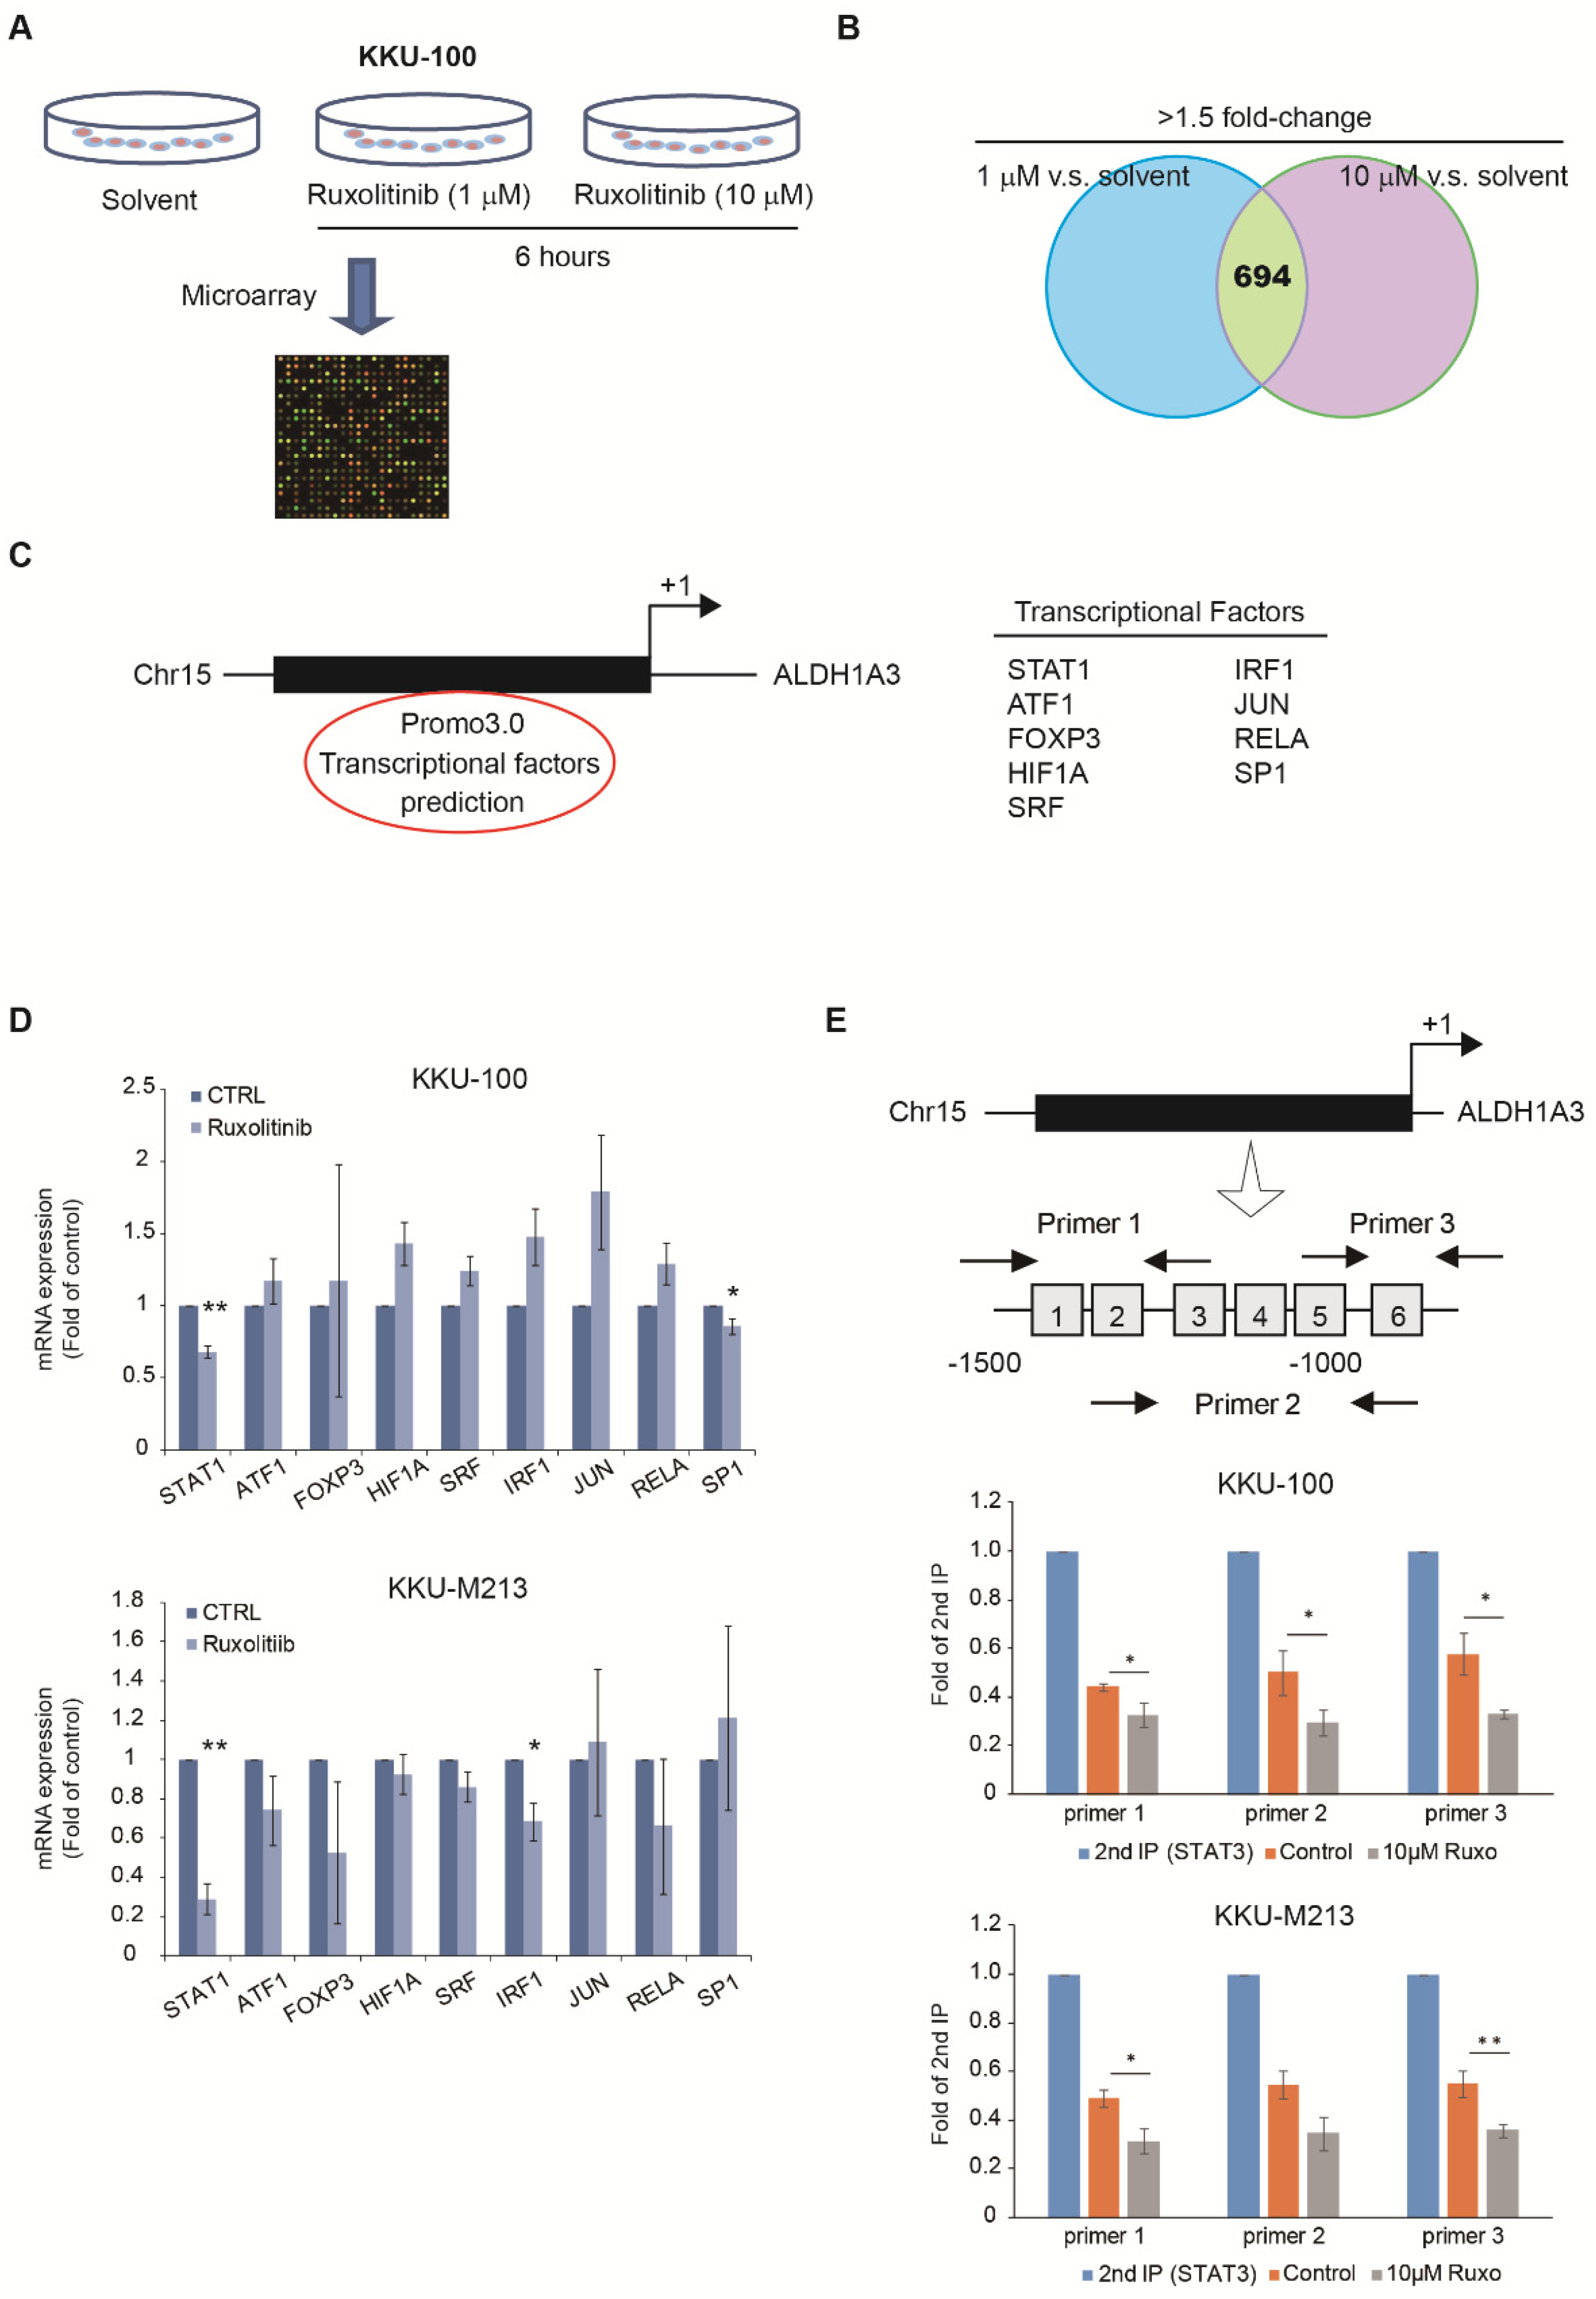
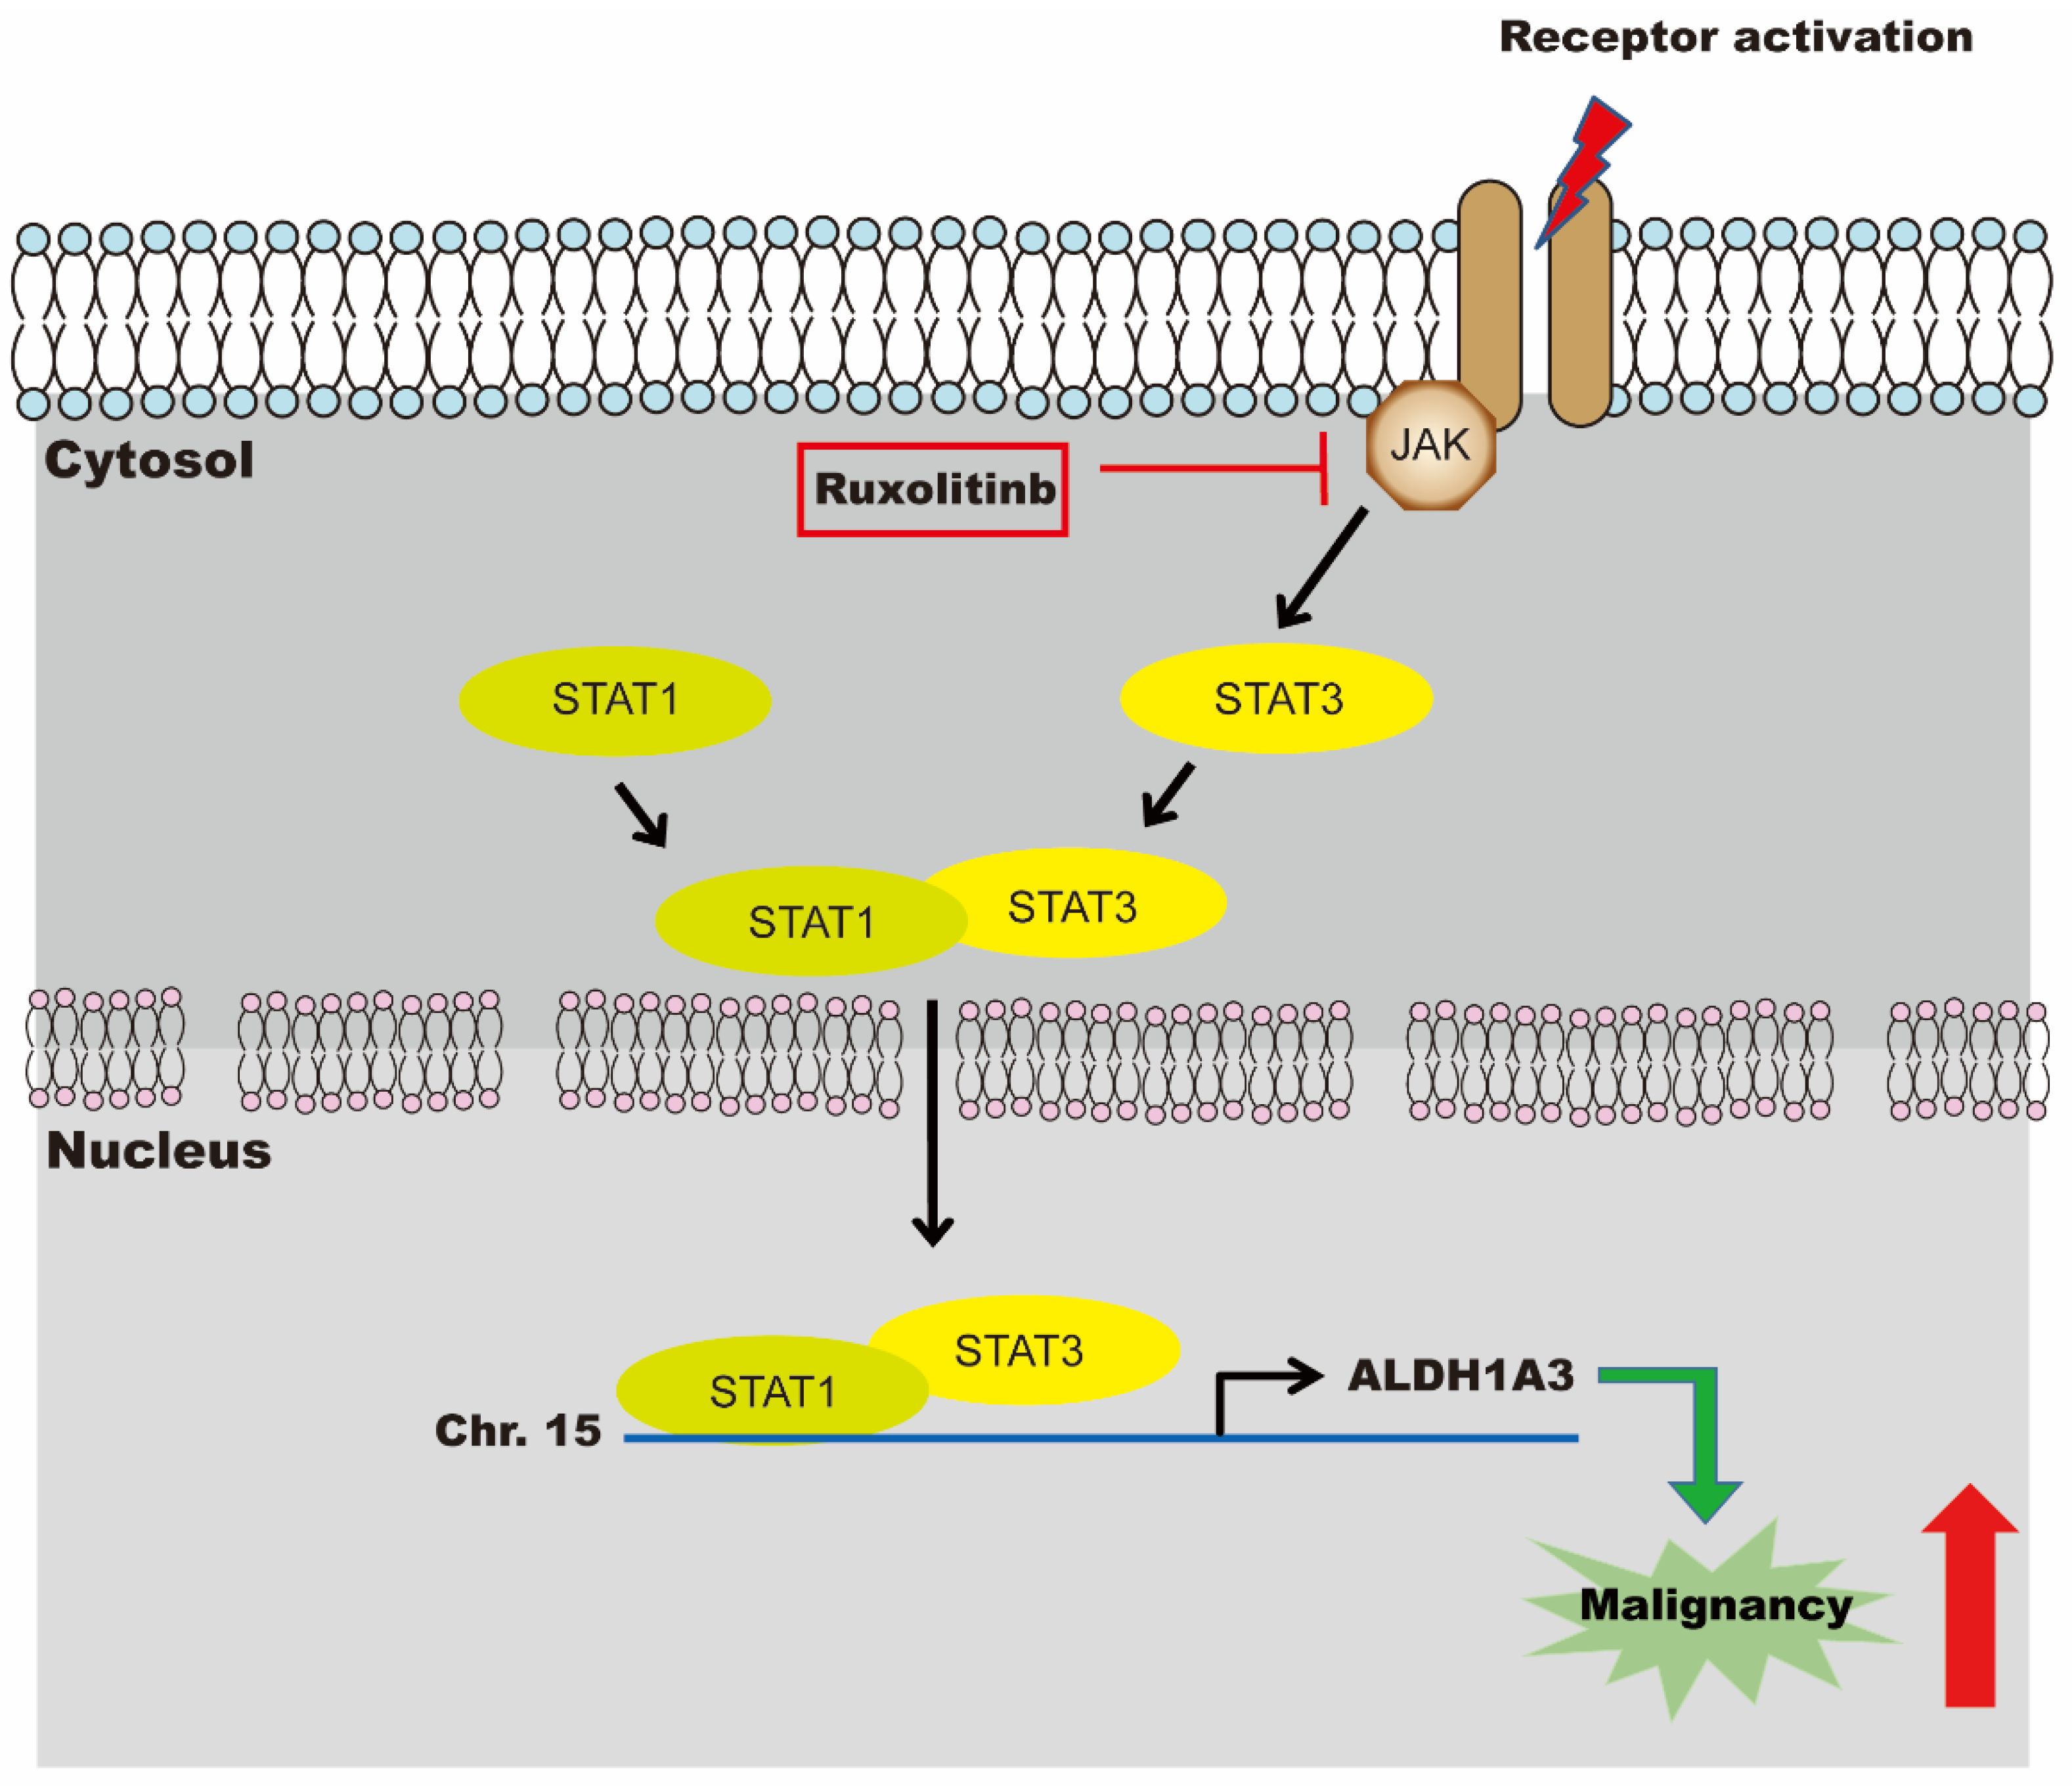
3.3. Expression of ALDH1A3 through Nuclear Translocation of STAT1 and STAT3 Heterodimer
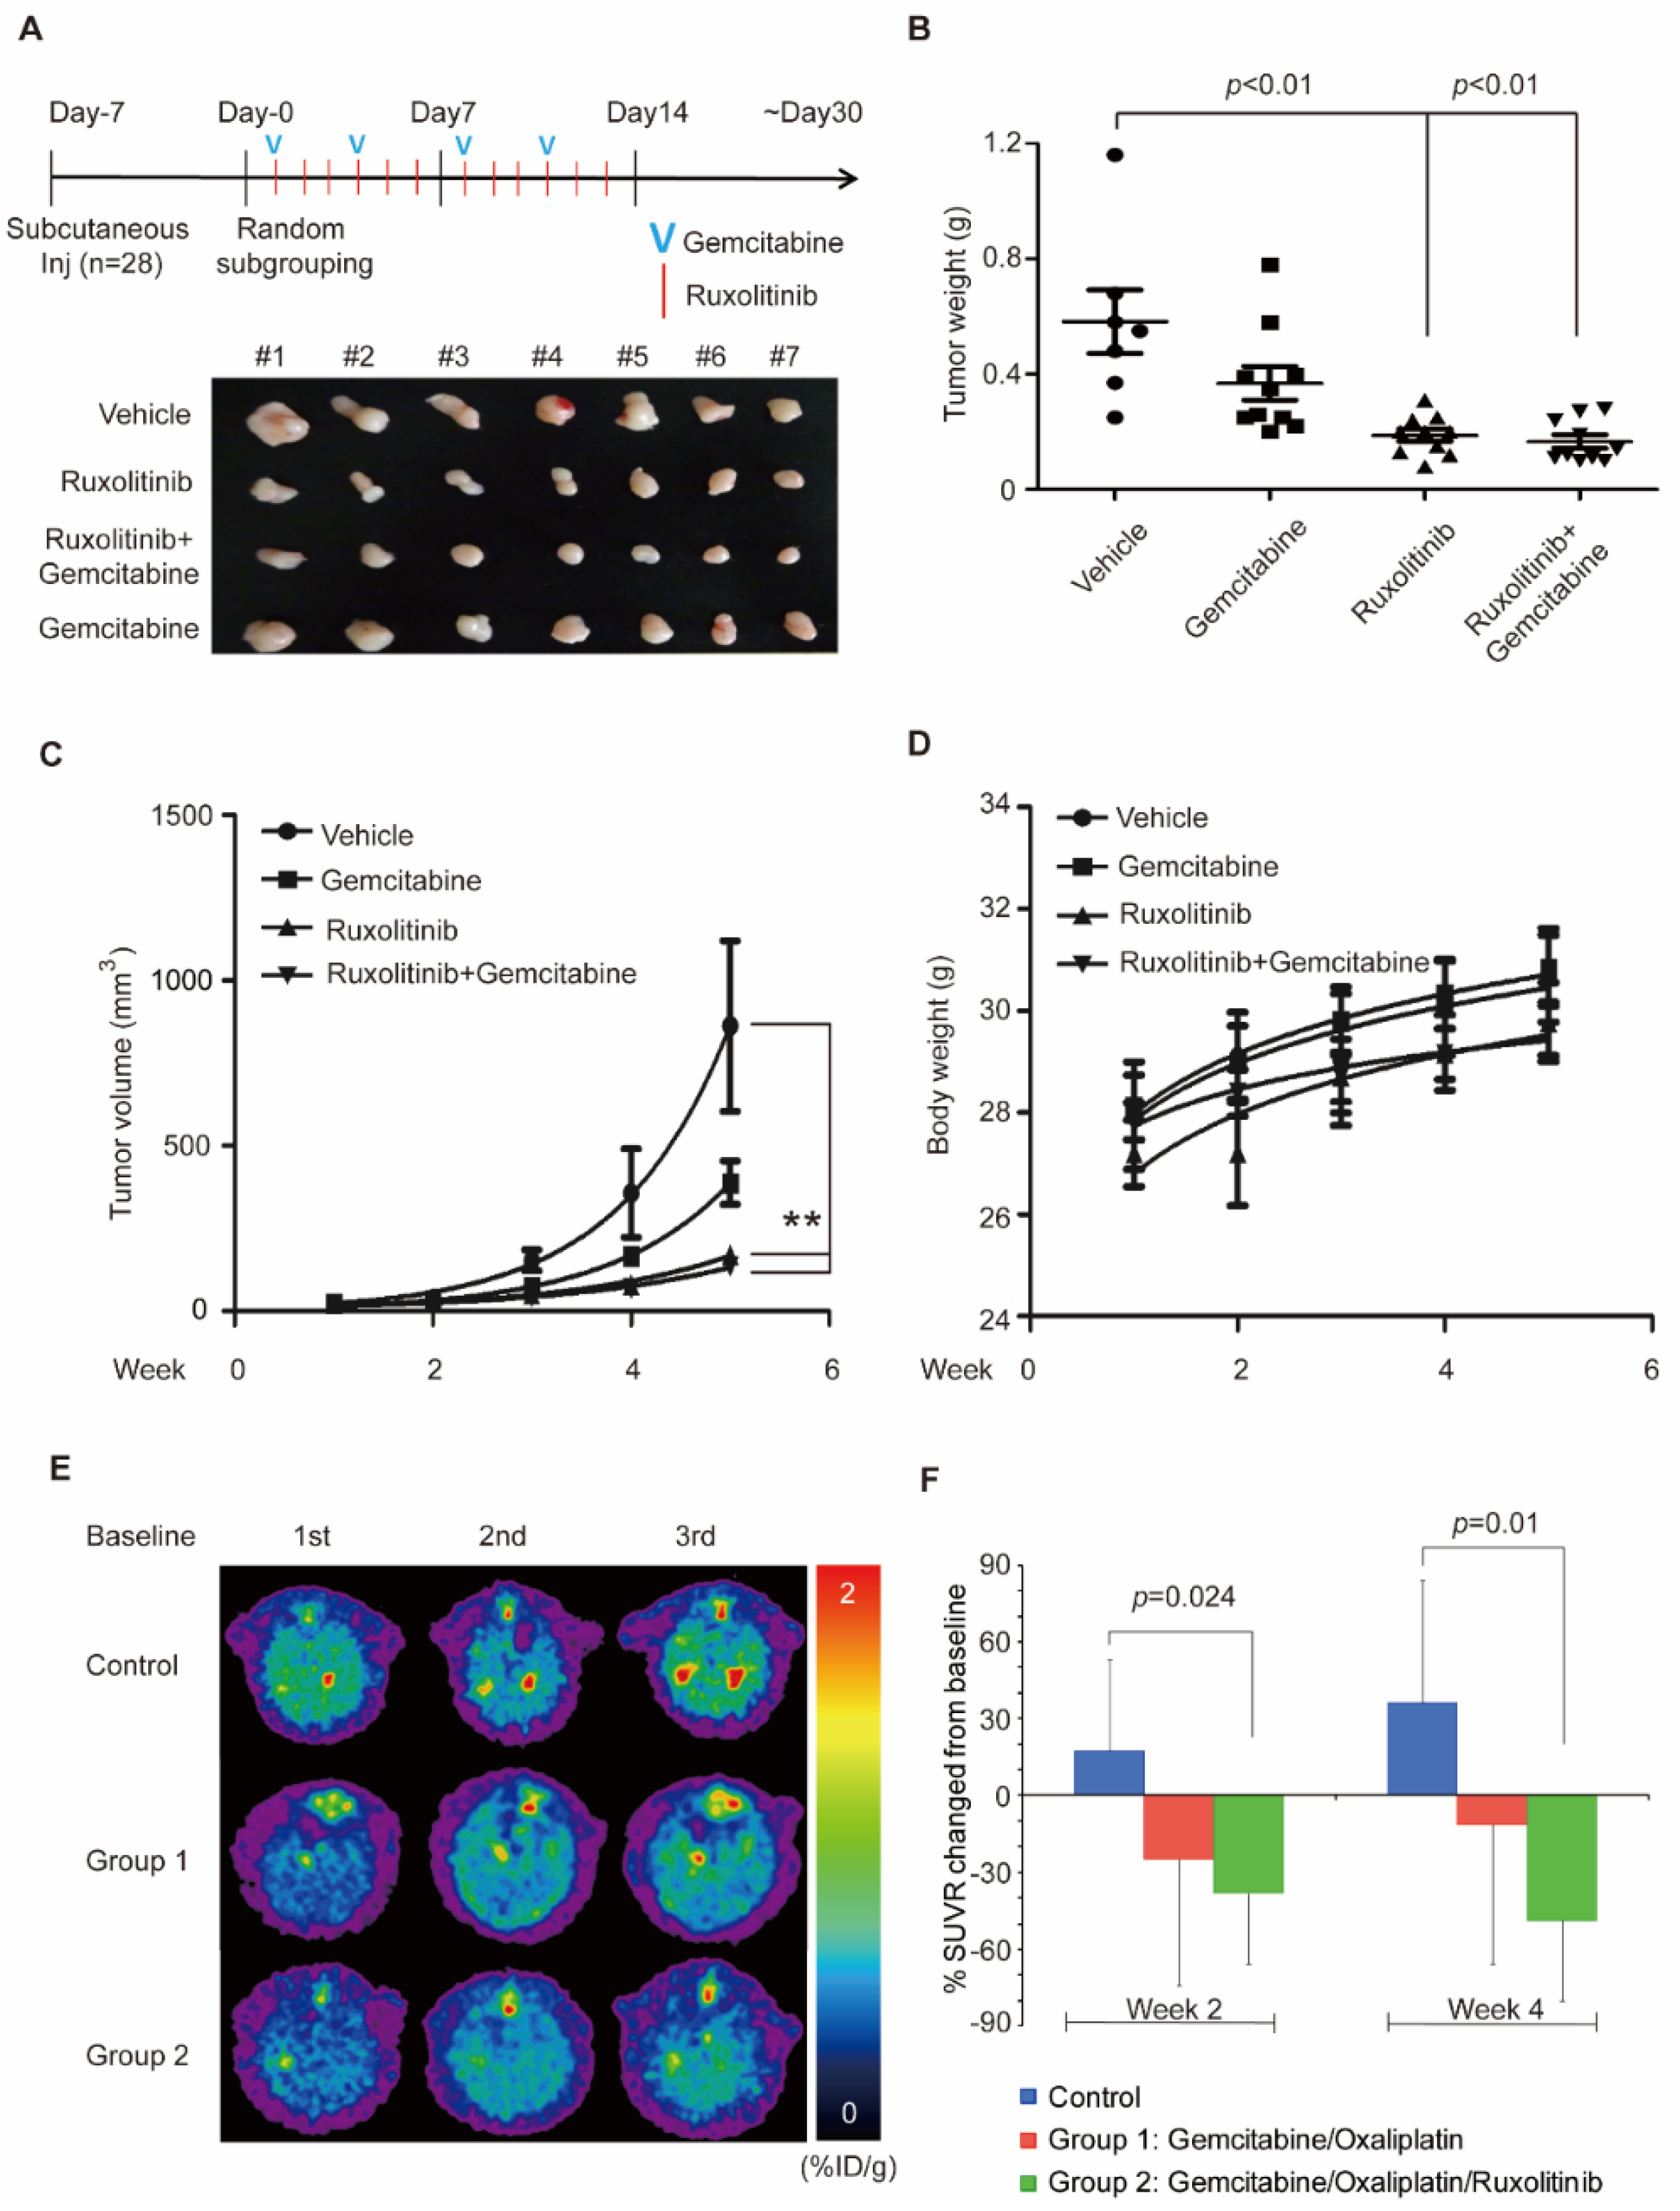
3.4. Combination of Ruxolitinib and Gemcitabine Conduces to Cholangiocarcinoma Tumor Shrinkage
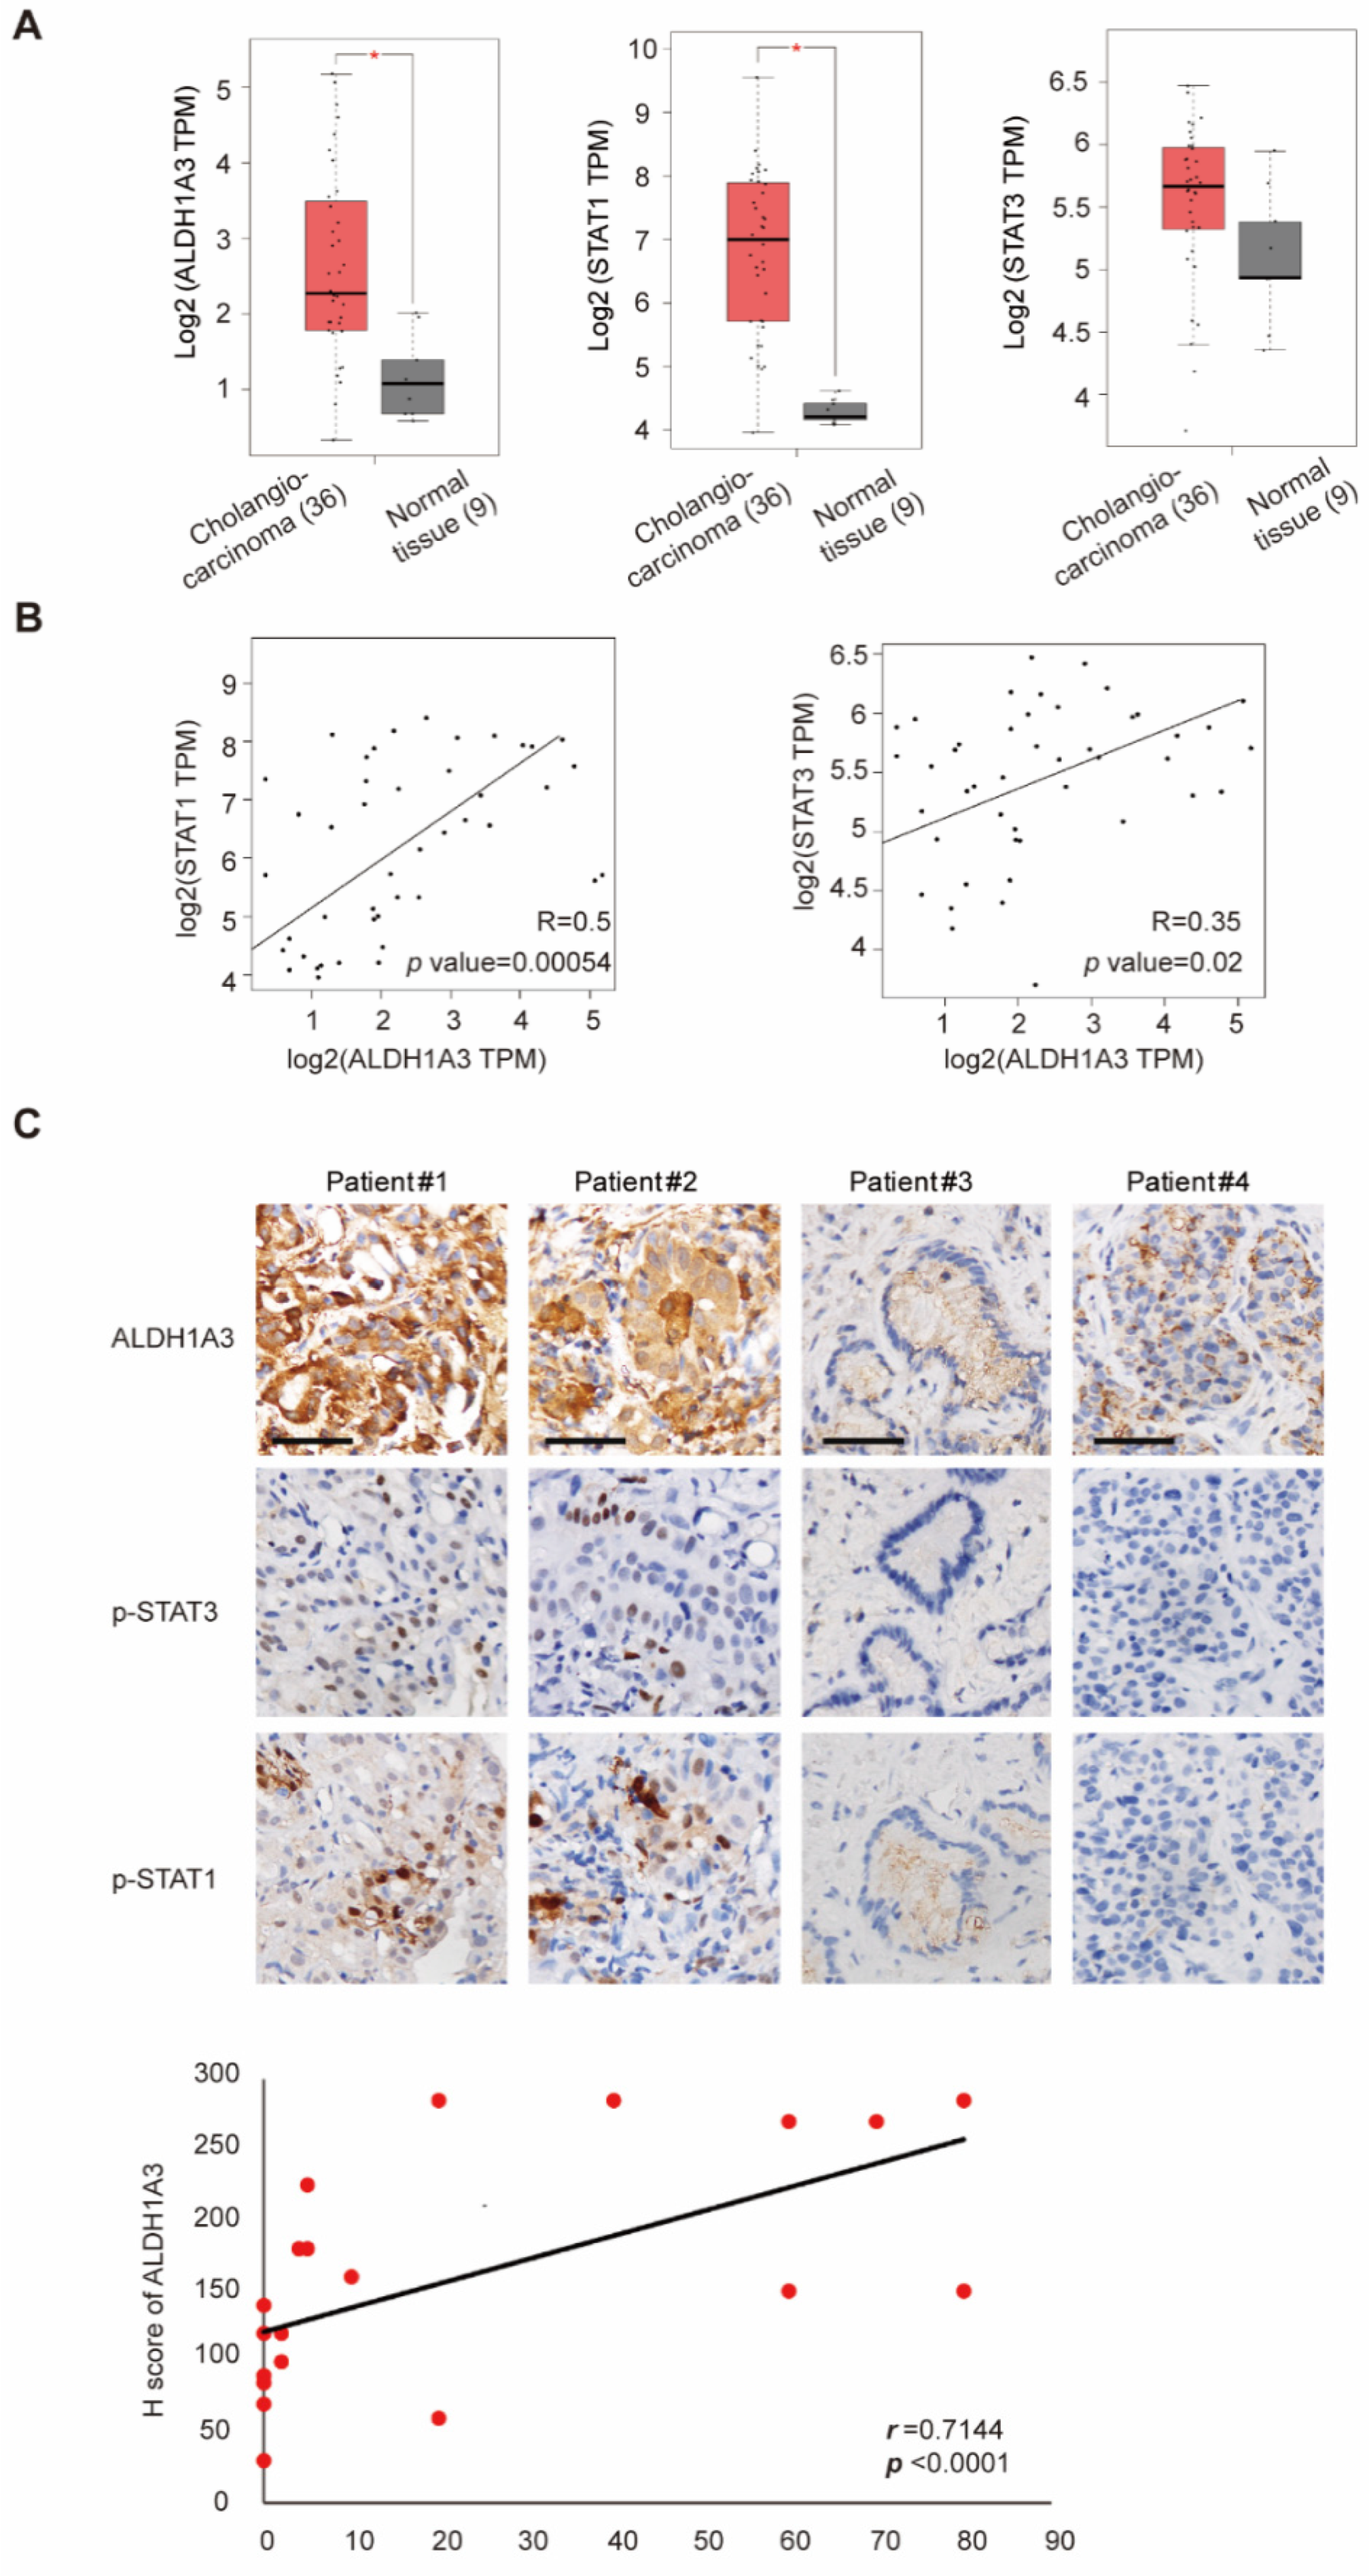
3.5. Correlation of STAT1, STAT3, and ALDH1A3 in Patients with Cholangiocarcinoma
4. Discussion
Supplementary Materials
Author Contributions
Funding
Data Availability Statement
Conflicts of Interest
References
- Ustundag, Y.B.Y.; Bayraktar, Y.; Poon, R.T. Cholangiocarcinoma: A compact review of the literature. World J. Gastroenterol. 2008, 14, 6458–6466. [Google Scholar] [CrossRef] [PubMed]
- Khan, S.A.; Thomas, H.C.; Davidson, B.R.; Taylor-Robinson, S.D. Cholangiocarcinoma. Lancet 2005, 366, 1303–1314. [Google Scholar] [CrossRef]
- Patel, T. Increasing incidence and mortality of primary intrahepatic cholangiocarcinoma in the United States. Hepatology 2001, 33, 1353–1357. [Google Scholar] [CrossRef] [PubMed]
- Shaib, Y.; El-Serag, H.B. The epidemiology of cholangiocarcinoma. Semin. Liver Dis. 2004, 24, 115–125. [Google Scholar] [CrossRef] [PubMed]
- Hezel, A.F.; Deshpande, V.; Zhu, A.X. Genetics of biliary tract cancers and emerging targeted therapies. J. Clin. Oncol. 2010, 28, 3531–3540. [Google Scholar] [CrossRef] [Green Version]
- Zhu, A.X.; Hezel, A.F. Development of molecularly targeted therapies in biliary tract cancers: Reassessing the challenges and opportunities. Hepatology 2011, 53, 695–704. [Google Scholar] [CrossRef] [PubMed]
- Akamatsu, N.; Sugawara, Y.; Hashimoto, D. Surgical strategy for bile duct cancer: Advances and current limitations. World J. Clin. Oncol. 2011, 2, 94–107. [Google Scholar] [CrossRef] [PubMed]
- Nagino, M.; Ebata, T.; Yokoyama, Y.; Igami, T.; Sugawara, G.; Takahashi, Y.; Nimura, Y. Evolution of surgical treatment for perihilar cholangiocarcinoma: A single-center 34-year review of 574 consecutive resections. Ann. Surg. 2013, 258, 129–140. [Google Scholar] [CrossRef] [PubMed]
- Ribero, D.; Pinna, A.D.; Guglielmi, A.; Ponti, A.; Nuzzo, G.; Giulini, S.M.; Aldrighetti, L.; Calise, F.; Gerunda, G.E.; Tomatis, M.; et al. Surgical approach for long-term survival of patients with intrahepatic cholangiocarcinoma: A multi-institutional analysis of 434 patients. Arch. Surg. 2012, 147, 1107–1113. [Google Scholar] [CrossRef] [Green Version]
- Ducreux, M.; Van Cutsem, E.; Van Laethem, J.; Gress, T.; Jeziorski, K.; Rougier, P.; Wagener, T.; Anak, O.; Baron, B.; Nordlinger, B. A randomised phase II trial of weekly high-dose 5-fluorouracil with and without folinic acid and cisplatin in patients with advanced biliary tract carcinoma: Results of the 40955 EORTC trial. Eur. J. Cancer 2005, 41, 398–403. [Google Scholar] [CrossRef]
- Kornek, G.V.; Schuell, B.; Laengle, F.; Gruenberger, T.; Penz, M.; Karall, K.; Depisch, D.; Lang, F.; Scheithauer, W. Mitomycin C in combination with capecitabine or biweekly high-dose gemcitabine in patients with advanced biliary tract cancer: A randomised phase II trial. Ann. Oncol. 2004, 15, 478–483. [Google Scholar] [CrossRef]
- Okusaka, T.; Nakachi, K.; Fukutomi, A.; Mizuno, N.; Ohkawa, S.; Funakoshi, A.; Nagino, M.; Kondo, S.; Nagaoka, S.; Funai, J.; et al. Gemcitabine alone or in combination with cisplatin in patients with biliary tract cancer: A comparative multicentre study in Japan. Br. J. Cancer 2010, 103, 469–474. [Google Scholar] [CrossRef] [PubMed] [Green Version]
- Valle, J.; Wasan, H.; Palmer, D.H.; Cunningham, D.; Anthoney, A.; Maraveyas, A.; Madhusudan, S.; Iveson, T.; Hughes, S.; Pereira, S.; et al. Cisplatin plus gemcitabine versus gemcitabine for biliary tract cancer. N. Engl. J. Med. 2010, 362, 1273–1281. [Google Scholar] [CrossRef] [Green Version]
- Lowery, M.; Ptashkin, R.N.; Jordan, E.J.; Berger, M.F.; Zehir, A.; Capanu, M.; Kemeny, N.E.; O’Reilly, E.M.; El-Dika, I.; Jarnagin, W.R.; et al. Comprehensive molecular profiling of intrahepatic and extrahepatic cholangiocarcinomas: Potential targets for intervention. Clin. Cancer Res. 2018, 24, 4154–4161. [Google Scholar] [CrossRef] [Green Version]
- Abou-Alfa, G.K.; Sahai, V.; Hollebecque, A.; Vaccaro, G.; Melisi, D.; Al-Rajabi, R.; Paulson, A.S.; Borad, M.J.; Gallinson, D.; Murphy, A.G.; et al. Pemigatinib for previously treated, locally advanced or metastatic cholangiocarcinoma: A multicentre, open-label, phase 2 study. Lancet Oncol. 2020, 21, 671–684. [Google Scholar] [CrossRef]
- Chen, M.-H.; Weng, J.-J.; Cheng, C.-T.; Wu, R.-C.; Huang, S.-C.; Wu, C.-E.; Chung, Y.-H.; Liu, C.-Y.; Chang, M.-H.; Chen, M.-H.; et al. ALDH1A3, the major aldehyde dehydrogenase isoform in human cholangiocarcinoma cells, affects prognosis and gemcitabine resistance in cholangiocarcinoma patients. Clin. Cancer Res. 2016, 22, 4225–4235. [Google Scholar] [CrossRef] [Green Version]
- Yip-Schneider, M.T.; Wu, H.; Stantz, K.; Agaram, N.; A Crooks, P.; Schmidt, C.M. Dimethylaminoparthenolide and gemcitabine: A survival study using a genetically engineered mouse model of pancreatic cancer. BMC Cancer 2013, 13, 194. [Google Scholar] [CrossRef] [PubMed] [Green Version]
- Evrot, E.; Ebel, N.; Romanet, V.; Roelli, C.; Andraos, R.; Qian, Z.; Dölemeyer, A.; Dammassa, E.; Sterker, D.; Cozens, R.; et al. JAK1/2 and Pan-deacetylase inhibitor combination therapy yields improved efficacy in preclinical mouse models of JAK2V617F-driven disease. Clin. Cancer Res. 2013, 19, 6230–6241. [Google Scholar] [CrossRef] [Green Version]
- Chang, P.M.; Cheng, C.-T.; Wu, R.-C.; Chung, Y.; Chiang, K.; Yeh, T.; Liu, C.; Chen, M.-H.; Yeh, C. Nab-paclitaxel is effective against intrahepatic cholangiocarcinoma via disruption of desmoplastic stroma. Oncol. Lett. 2018, 16, 566–572. [Google Scholar] [CrossRef]
- Nivarthi, H.; Gordziel, C.; Themanns, M.; Kramer, N.; Eberl, M.; Rabe, B.; Schlederer, M.; Rose-John, S.; Knösel, T.; Kenner, L.; et al. Correction: The ratio of STAT1 to STAT3 expression is a determinant of colorectal cancer growth. Oncotarget 2018, 9, 33865. [Google Scholar] [CrossRef]
- Croker, A.K.; Rodriguez-Torres, M.; Xia, Y.; Pardhan, S.; Leong, H.S.; Lewis, J.D.; Allan, A.L. Differential functional roles of ALDH1A1 and ALDH1A3 in mediating metastatic behavior and therapy resistance of human breast cancer cells. Int. J. Mol. Sci. 2017, 18, 2039. [Google Scholar] [CrossRef]
- Kim, R.-J.; Park, J.-R.; Roh, K.-J.; Choi, A.-R.; Kim, S.-R.; Kim, P.-H.; Yu, J.H.; Lee, J.W.; Ahn, S.-H.; Gong, G.; et al. High aldehyde dehydrogenase activity enhances stem cell features in breast cancer cells by activating hypoxia-inducible factor-2α. Cancer Lett. 2013, 333, 18–31. [Google Scholar] [CrossRef] [PubMed]
- Pan, M.; Li, M.; You, C.; Zhao, F.; Guo, M.; Xu, H.; Li, L.; Wang, L.; Dou, J. Inhibition of breast cancer growth via miR-7 suppressing ALDH1A3 activity concomitant with decreasing breast cancer stem cell subpopulation. J. Cell. Physiol. 2019, 235, 1405–1416. [Google Scholar] [CrossRef] [PubMed] [Green Version]
- Zinovieva, O.L.; Grineva, E.N.; Krasnov, G.S.; Karpov, D.; Zheltukhin, A.O.; Snezhkina, A.V.; Kudryavtseva, A.V.; Mashkova, T.D.; Lisitsyn, N.A. Treatment of cancer cells with chemotherapeutic drugs results in profound changes in expression of genes encoding aldehyde-metabolizing enzymes. J. Cancer 2019, 10, 4256–4263. [Google Scholar] [CrossRef]
- Li, G.; Li, Y.; Liu, X.; Wang, Z.; Zhang, C.; Wu, F.; Jiang, H.; Zhang, W.; Bao, Z.; Wang, Y.; et al. ALDH1A3 induces mesenchymal differentiation and serves as a predictor for survival in glioblastoma. Cell Death Dis. 2018, 9, 1190. [Google Scholar] [CrossRef] [PubMed]
- Moreb, J.S.; Baker, H.V.; Chang, L.-J.; Amaya, M.; Lopez, M.C.; Ostmark, B.; Chou, W. ALDH isozymes downregulation affects cell growth, cell motility and gene expression in lung cancer cells. Mol. Cancer 2008, 7, 87. [Google Scholar] [CrossRef] [PubMed] [Green Version]
- Marcato, P.; Dean, C.A.; Liu, R.-Z.; Coyle, K.; Bydoun, M.; Wallace, M.; Clements, D.; Turner, C.; Mathenge, E.G.; Gujar, S.A.; et al. Aldehyde dehydrogenase 1A3 influences breast cancer progression via differential retinoic acid signaling. Mol. Oncol. 2014, 9, 17–31. [Google Scholar] [CrossRef]
- Xie, X.; Urabe, G.; Marcho, L.; Stratton, M.; Guo, L.-W.; Kent, C.K. ALDH1A3 regulations of matricellular proteins promote vascular smooth muscle cell proliferation. iScience 2019, 19, 872–882. [Google Scholar] [CrossRef] [Green Version]
- Kurth, I.; Hein, L.; Mäbert, K.; Peitzsch, C.; Koi, L.; Cojoc, M.; Kunz-Schughart, L.; Baumann, M.; Dubrovska, A. Cancer stem cell related markers of radioresistance in head and neck squamous cell carcinoma. Oncotarget 2015, 6, 34494–34509. [Google Scholar] [CrossRef] [Green Version]
- Shao, C.; Sullivan, J.P.; Girard, L.; Augustyn, A.; Yenerall, P.; Rodriguez-Canales, J.; Liu, H.; Behrens, C.; Shay, J.W.; Wistuba, I.I.; et al. Essential role of aldehyde dehydrogenase 1A3 for the maintenance of non–small cell lung cancer stem cells is associated with the STAT3 pathway. Clin. Cancer Res. 2014, 20, 4154–4166. [Google Scholar] [CrossRef] [Green Version]
- Duan, J.-J.; Cai, J.; Guo, Y.-F.; Bian, X.-W.; Yu, S.-C. ALDH1A3, a metabolic target for cancer diagnosis and therapy. Int. J. Cancer 2016, 139, 965–975. [Google Scholar] [CrossRef] [PubMed] [Green Version]


Publisher’s Note: MDPI stays neutral with regard to jurisdictional claims in published maps and institutional affiliations. |
© 2021 by the authors. Licensee MDPI, Basel, Switzerland. This article is an open access article distributed under the terms and conditions of the Creative Commons Attribution (CC BY) license (https://creativecommons.org/licenses/by/4.0/).
Share and Cite
Chung, S.-Y.; Hung, Y.-P.; Pan, Y.-R.; Chang, Y.-C.; Wu, C.-E.; Hsu, D.S.-S.; Chang, P.M.-H.; Lu, M.-L.; Huang, C.-Y.F.; Su, Y.; et al. Ruxolitinib Combined with Gemcitabine against Cholangiocarcinoma Growth via the JAK2/STAT1/3/ALDH1A3 Pathway. Biomedicines 2021, 9, 885. https://doi.org/10.3390/biomedicines9080885
Chung S-Y, Hung Y-P, Pan Y-R, Chang Y-C, Wu C-E, Hsu DS-S, Chang PM-H, Lu M-L, Huang C-YF, Su Y, et al. Ruxolitinib Combined with Gemcitabine against Cholangiocarcinoma Growth via the JAK2/STAT1/3/ALDH1A3 Pathway. Biomedicines. 2021; 9(8):885. https://doi.org/10.3390/biomedicines9080885
Chicago/Turabian StyleChung, Shin-Yi, Yi-Ping Hung, Yi-Ru Pan, Yu-Chan Chang, Chiao-En Wu, Dennis Shin-Shian Hsu, Peter Mu-Hsin Chang, Meng-Lun Lu, Chi-Ying F. Huang, Yeu Su, and et al. 2021. "Ruxolitinib Combined with Gemcitabine against Cholangiocarcinoma Growth via the JAK2/STAT1/3/ALDH1A3 Pathway" Biomedicines 9, no. 8: 885. https://doi.org/10.3390/biomedicines9080885