Profiling 25 Bone Marrow microRNAs in Acute Leukemias and Secondary Nonleukemic Hematopoietic Conditions

 ,
,  , ,
, ,
Abstract
:1. Introduction
2. Experimental Section
3. Results
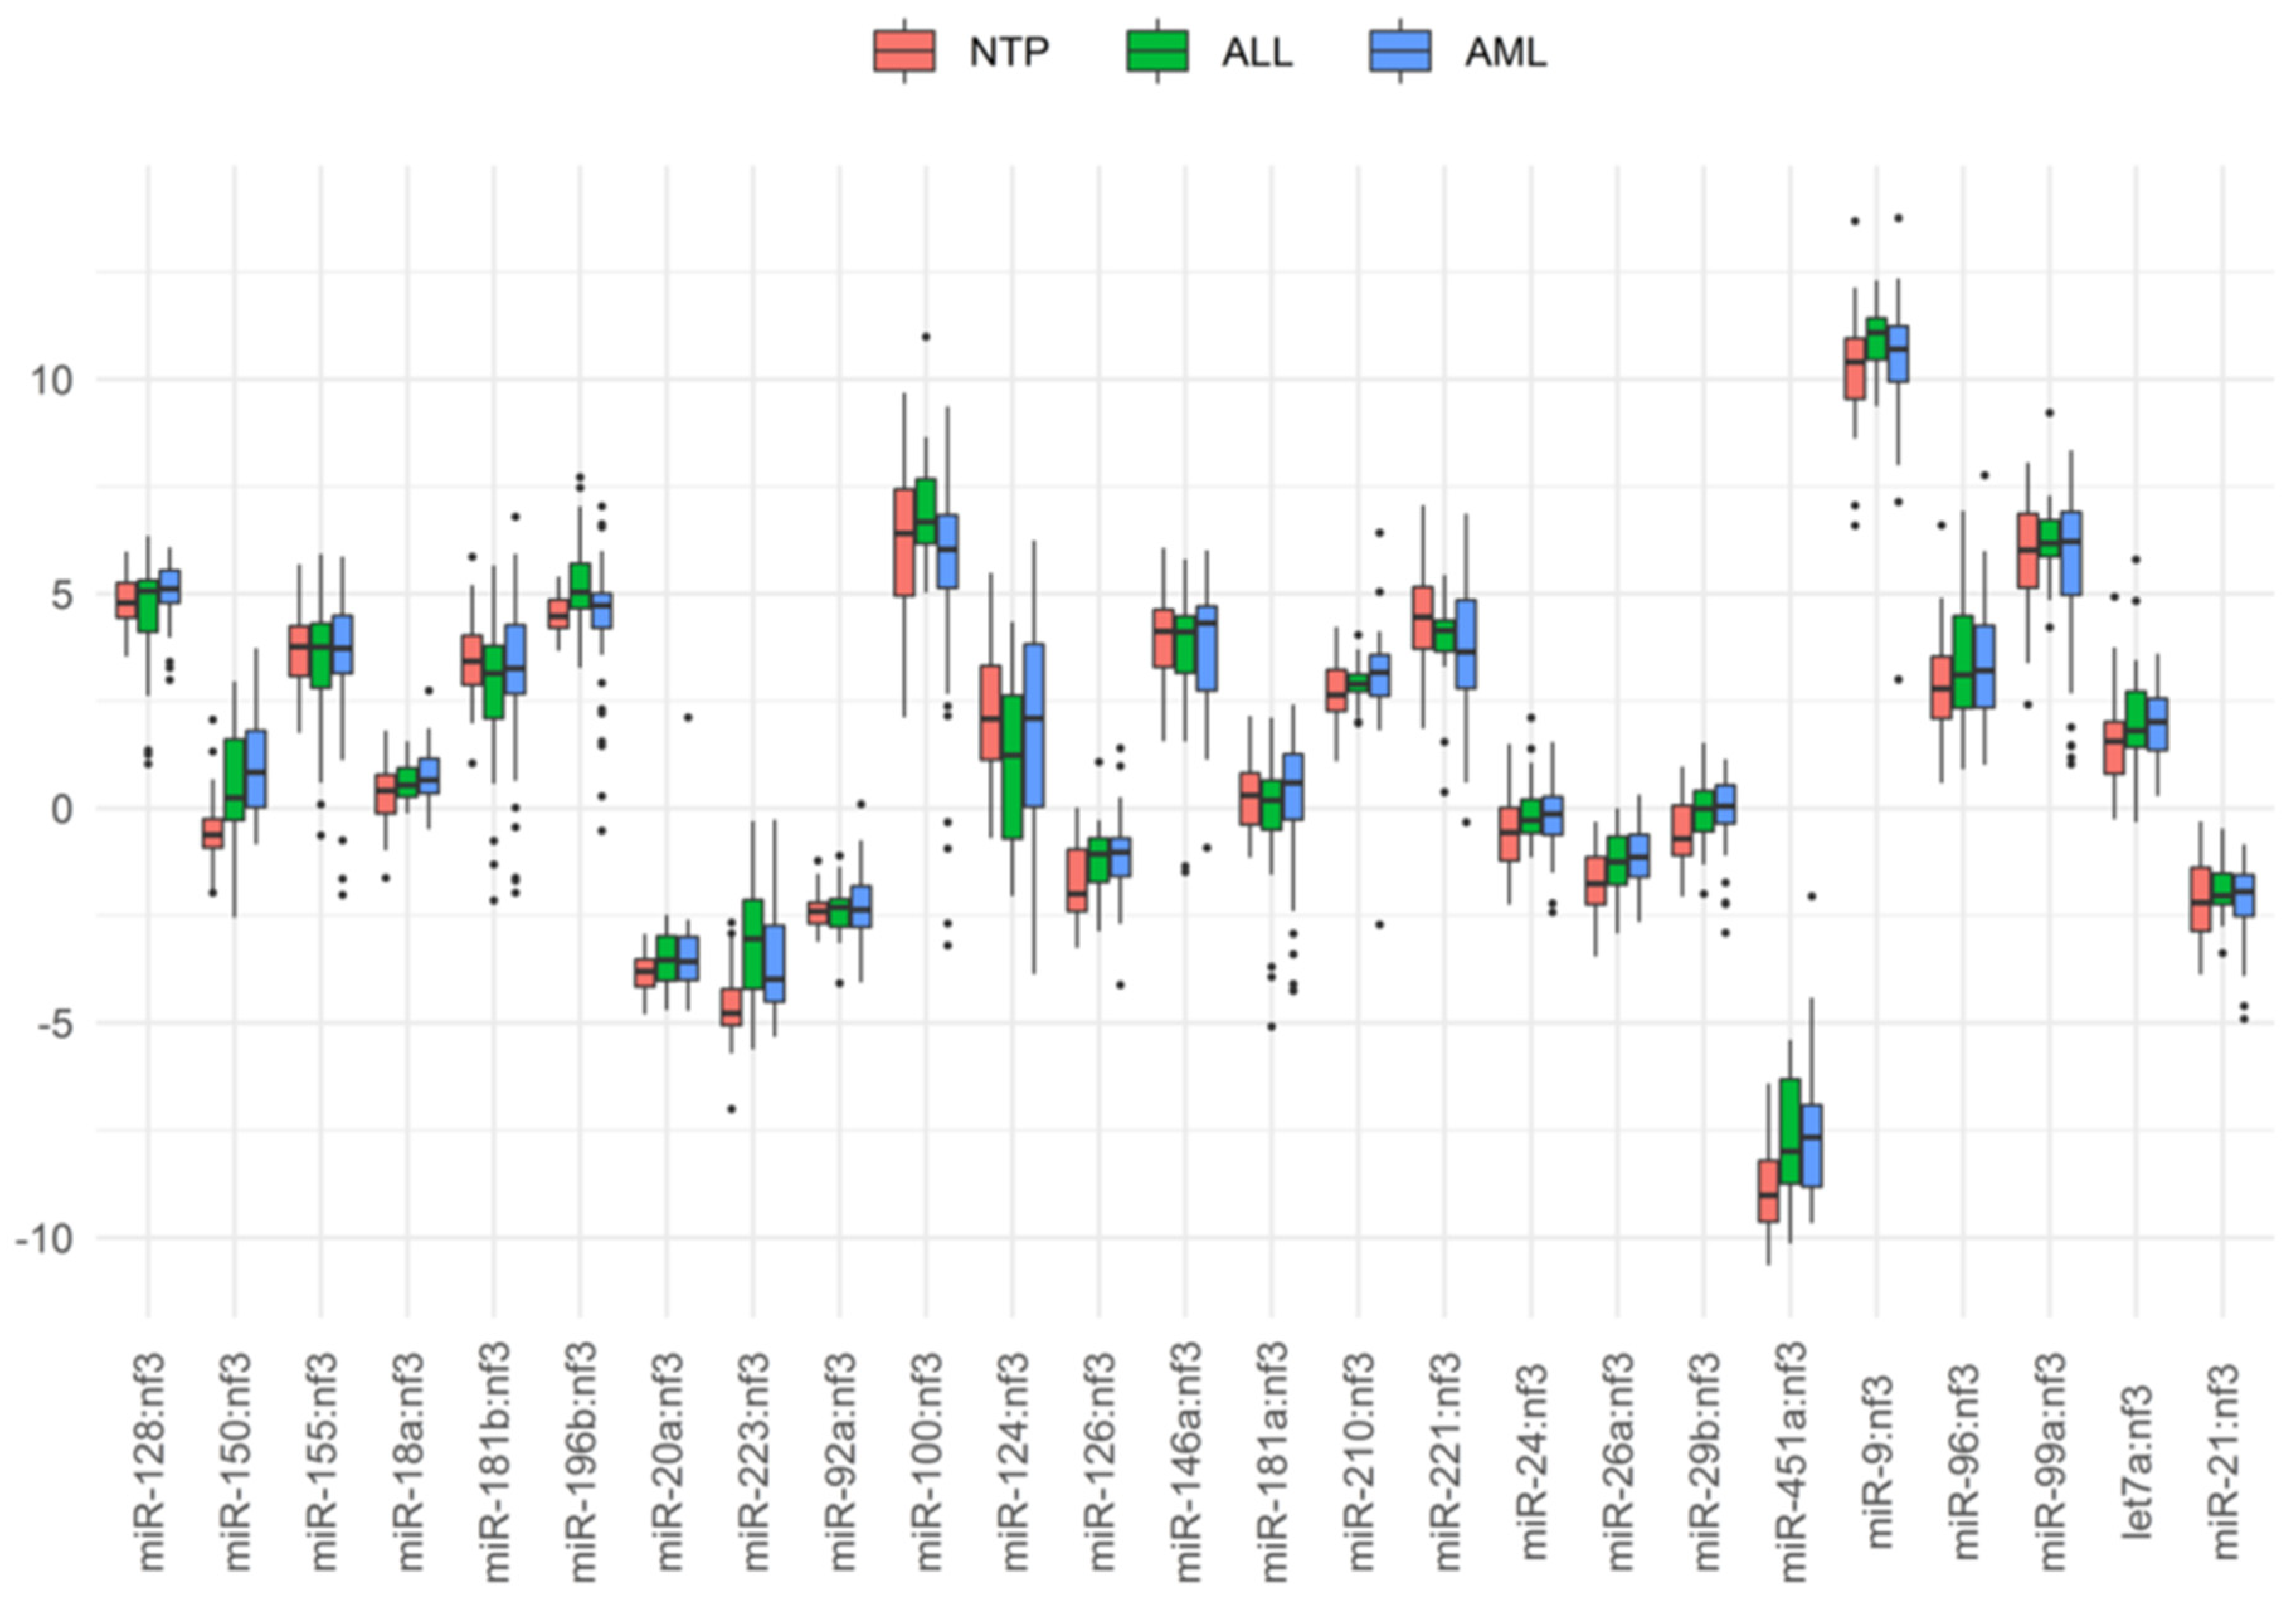
3.1. Comparing miRNA Concentrations among ALL, AML, and NTP Samples
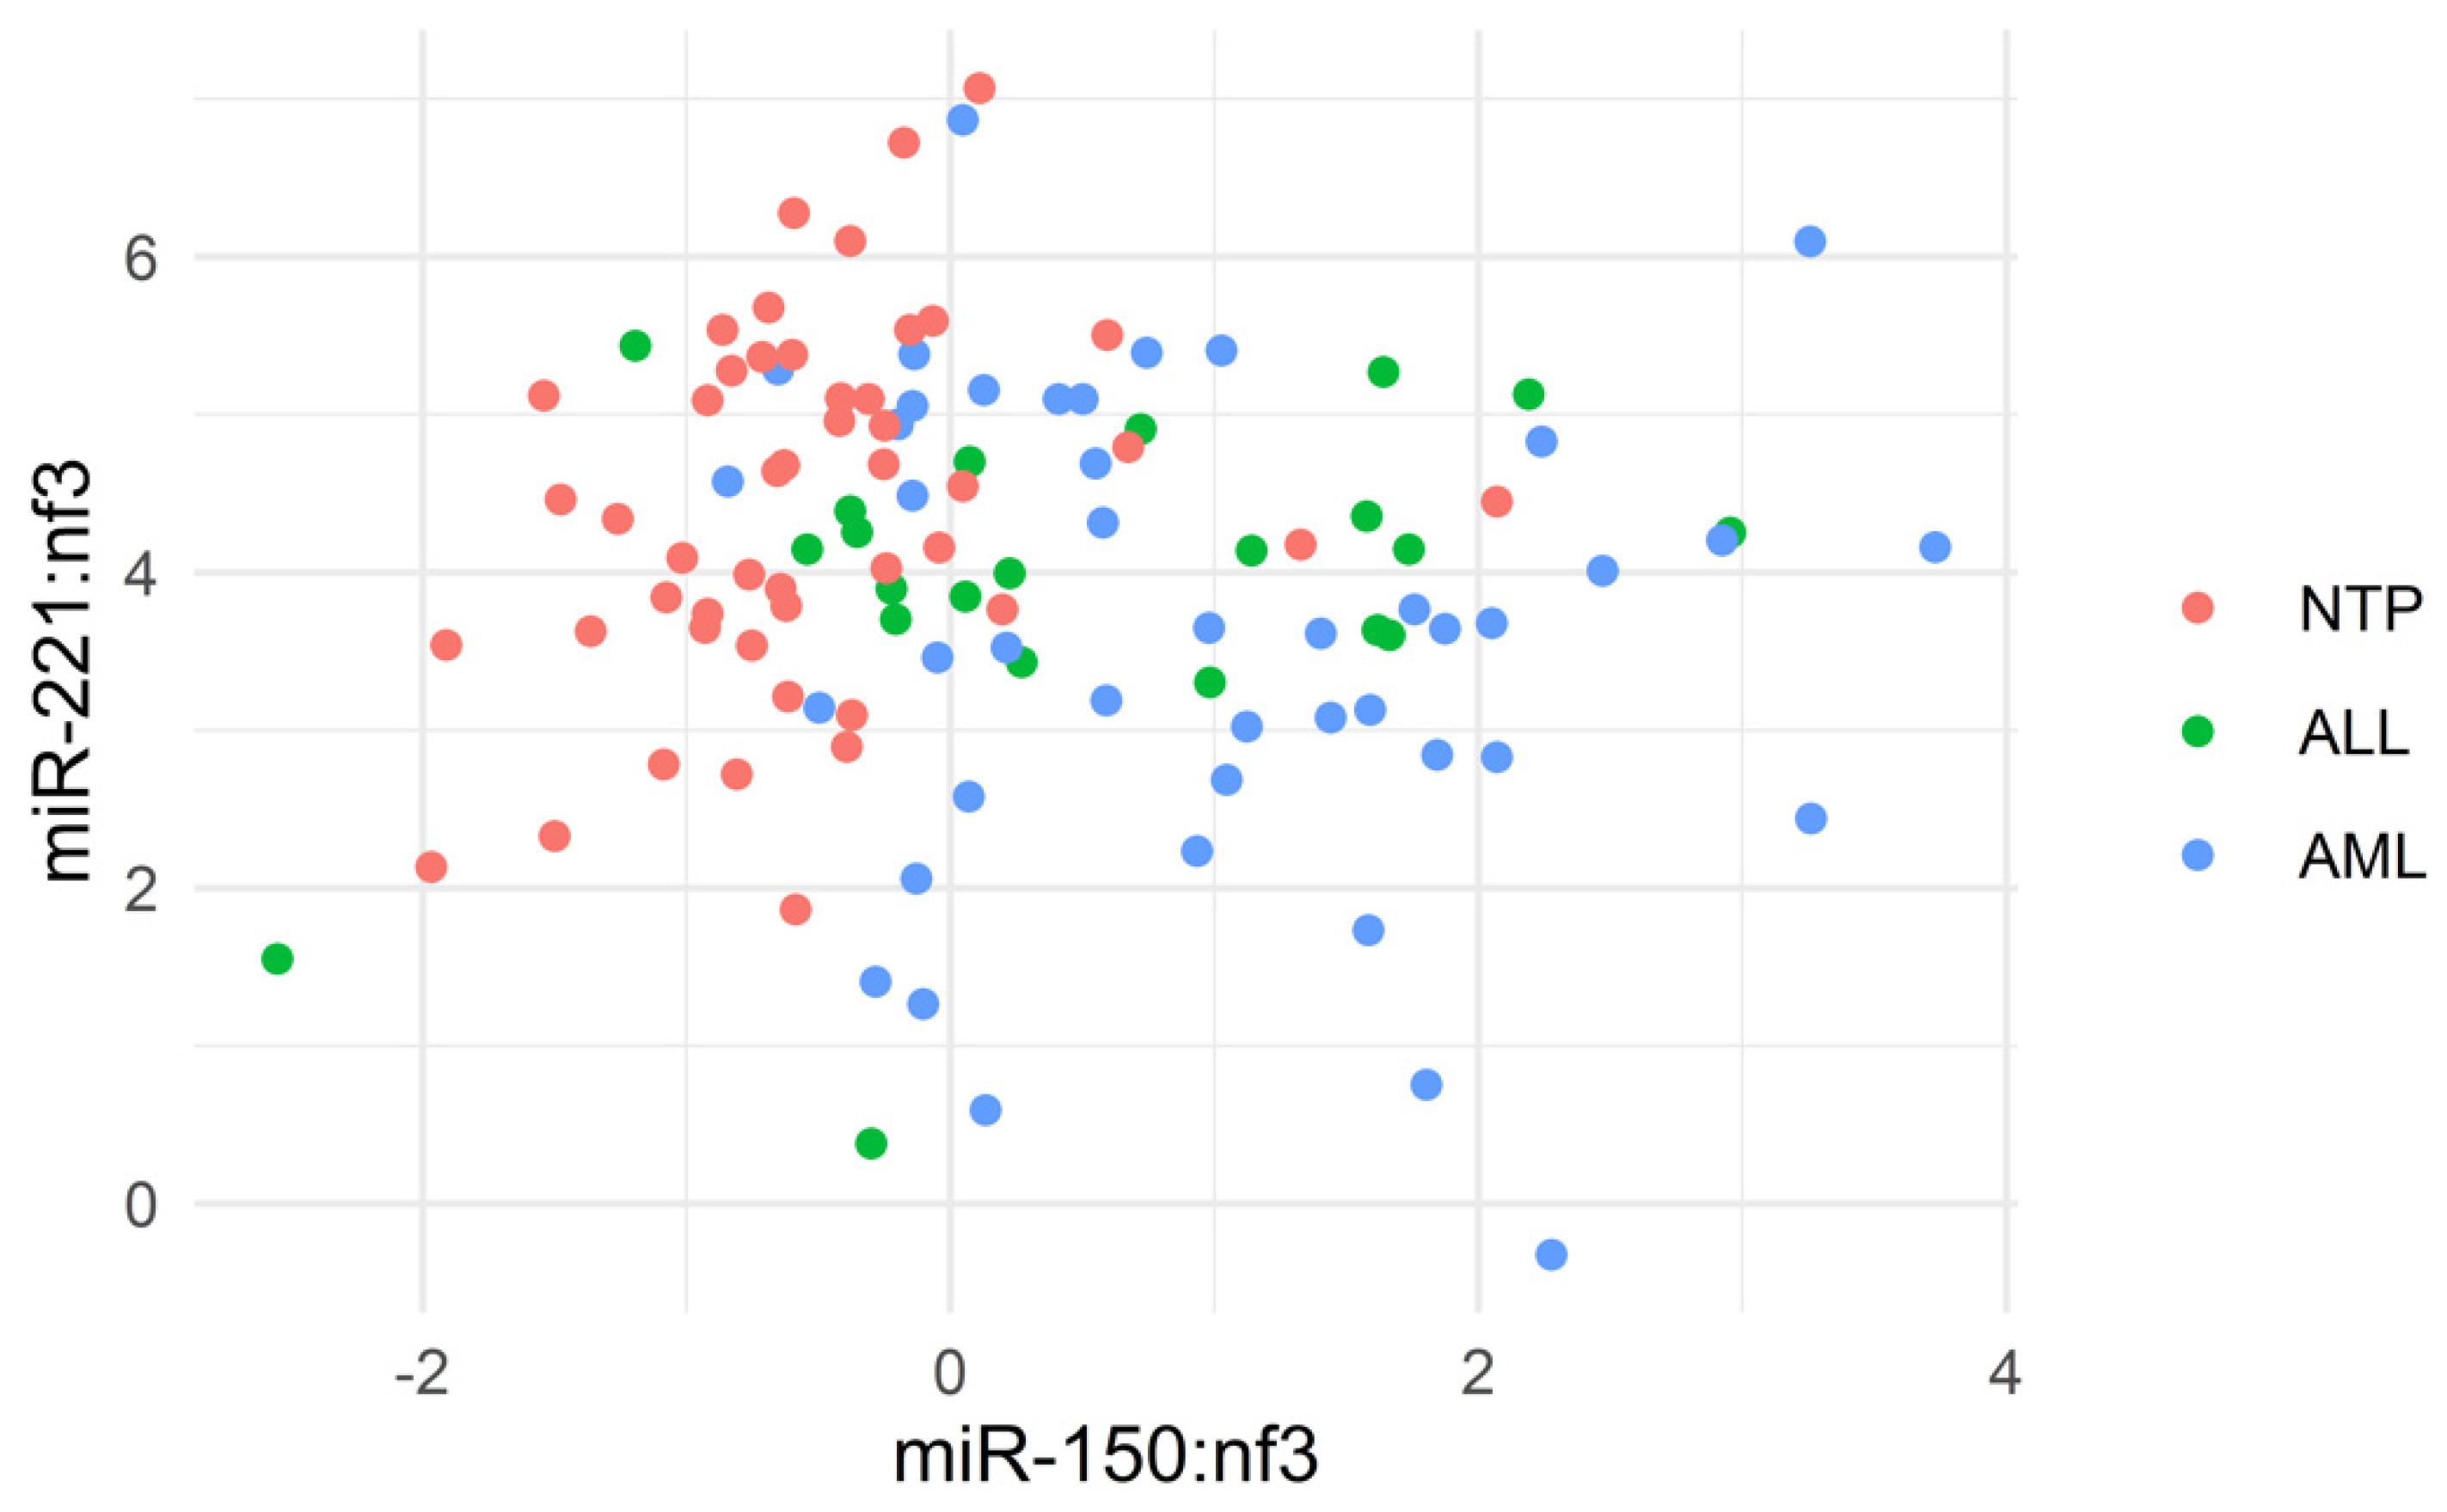
3.2. Sample Classification
4. Discussion
Supplementary Materials
Author Contributions
Funding
Acknowledgments
Conflicts of Interest
References
- Kovynev, I.B.; Agakishiev, M.M.; Kolesnikova, M.A.; Zalavina, S.V.; Tarnovsky, R.V.; Soldatova, G.S.; Tairova, S.A.; Nechunaeva, I.N.; Pospelova, T.I. Epidemiology and Molecular Genetics of Acute Leukemia in a Major Industrial Center of Western Siberia. Int. J. Adv. Biotechnol. Res. 2019, 2, 260–266. [Google Scholar]
- Cruz, N.M.; Mencia-Trinchant, N.; Hassane, D.C.; Guzman, M.L. Minimal residual disease in acute myelogenous leukemia. Int. J. Lab. Hematol. 2017, 39 (Suppl. 1), 53–60. [Google Scholar] [CrossRef] [PubMed] [Green Version]
- Brooimans, R.A.; van der Velden, V.H.J.; Boeckx, N.; Slomp, J.; Preijers, F.; Te Marvelde, J.G.; Van, N.M.; Heijs, A.; Huys, E.; van der Holt, B.; et al. Immunophenotypic measurable residual disease (MRD) in acute myeloid leukemia: Is multicentric MRD assessment feasible? Leuk. Res. 2019, 76, 39–47. [Google Scholar] [CrossRef] [PubMed]
- Eckert, C.; Flohr, T.; Koehler, R.; Hagedorn, N.; Moericke, A.; Stanulla, M.; Kirschner-Schwabe, R.; Cario, G.; Stackelberg, A.; Bartram, C.R.; et al. Very early/early relapses of acute lymphoblastic leukemia show unexpected changes of clonal markers and high heterogeneity in response to initial and relapse treatment. Leukemia 2011, 25, 1305–1313. [Google Scholar] [CrossRef] [Green Version]
- Cammarata, G.; Augugliaro, L.; Salemi, D.; La Rosa, C.A.M.; Dagnino, L.; Civiletto, G.; Messana, F.; Marfia, A.; Bica, M.G.; Cascio, L.; et al. Differential expression of specific microRNA and their targets in acute myeloid leukemia. Am. J. Hematol. 2010, 85, 331–339. [Google Scholar] [CrossRef]
- Li, Z.; Lu, J.; Sun, M.; Mi, S.; Zhang, H.; Luo, R.T.; Chen, P.; Wang, Y.; Yan, M.; Qian, Z.; et al. Distinct microRNA expression profiles in acute myeloid leukemia with common translocations. Proc. Natl. Acad. Sci. USA 2008, 105, 15535–15540. [Google Scholar] [CrossRef] [Green Version]
- Kluiver, J.; Kroesen, B.J.; Poppema, S.; van den Berg, A. The role of microRNAs in normal hematopoiesis and hematopoietic malignancies. Leukemia 2006, 20, 1931–1936. [Google Scholar] [CrossRef]
- Fabbri, M.; Garzon, R.; Andreeff, M.; Kantarjian, H.M.; Garcia-Manero, G.; Calin, G.A. MicroRNAs and noncoding RNAs in hematological malignancies: Molecular, clinical and therapeutic implications. Leukemia 2008, 22, 1095–1105. [Google Scholar] [CrossRef]
- Garzon, R.; Croce, C.M. MicroRNAs in normal and malignant hematopoiesis. Curr. Opin. Hematol. 2008, 15, 352–358. [Google Scholar] [CrossRef]
- Trino, S.; Lamorte, D.; Caivano, A.; Laurenzana, I.; Tagliaferri, D.; Falco, G.; Del Vecchio, L.; Musto, P.; De Luca, L. MicroRNAs as New Biomarkers for Diagnosis and Prognosis, and as Potential Therapeutic Targets in Acute Myeloid Leukemia. Int. J. Mol. Sci. 2018, 19, 460. [Google Scholar] [CrossRef] [Green Version]
- Wang, Y.; Li, Z.; He, C.; Wang, D.; Yuan, X.; Chen, J.; Jin, J. MicroRNAs expression signatures are associated with lineage and survival in acute leukemias. Blood Cells Mol. Dis. 2010, 44, 191–197. [Google Scholar] [CrossRef] [Green Version]
- Luan, C.; Yang, Z.; Chen, B. The functional role of microRNA in acute lymphoblastic leukemia: Relevance for diagnosis, differential diagnosis, prognosis, and therapy. OncoTargets Ther. 2015, 8, 2903–2914. [Google Scholar]
- Liao, Q.; Wang, B.; Li, X.; Jiang, G. miRNAs in acute myeloid leukemia. Oncotarget 2016, 8, 3666–3682. [Google Scholar] [CrossRef] [PubMed] [Green Version]
- Yeh, C.; Moles, R.; Nicot, C. Clinical significance of microRNAs in chronic and acute human leukemia. Mol. Cancer 2016, 15, 37. [Google Scholar] [CrossRef] [Green Version]
- Ultimo, S.; Martelli, A.M.; Zauli, G.; Vitale, M.; Calin, G.A.; Neri, L.M. Roles and clinical implications of microRNAs in acute lymphoblastic leukemia. J. Cell. Physiol. 2018, 233, 5642–5654. [Google Scholar] [CrossRef] [PubMed]
- de Leeuw, D.C.; van den Ancker, W.; Denkers, F.; de Menezes, R.X.; Westers, T.M.; Ossenkoppele, G.J.; van de Loosdrecht, A.A.; Smit, L. MicroRNA profiling can classify acute leukemias of ambiguous lineage as either acute myeloid leukemia or acute lymphoid leukemia. Clin. Cancer Res. 2013, 19, 2187–2196. [Google Scholar] [CrossRef] [PubMed] [Green Version]
- Vandesompele, J.; De Preter, K.; Pattyn, F.; Poppe, B.; Van Roy, N.; De Paepe, A.; Speleman, F. Accurate normalization of real-time quantitative RT-PCR data by geometric averaging of multiple internal control genes. Genome Biol. 2002, 3, 34. [Google Scholar] [CrossRef] [Green Version]
- Titov, S.E.; Ivanov, M.K.; Karpinskaya, E.V.; Tsivlikova, E.V.; Shevchenko, S.P.; Veryaskina, Y.A.; Akhmerova, L.G.; Poloz, T.L.; Klimova, O.A.; Gulyaeva, L.F.; et al. miRNA profiling, detection of BRAF V600E mutation and RET-PTC1 translocation in patients from Novosibirsk oblast (Russia) with different types of thyroid tumors. BMC Cancer 2016, 16, 201. [Google Scholar] [CrossRef] [Green Version]
- Chen, C.; Ridzon, D.A.; Broomer, A.J.; Zhou, Z.; Lee, D.H.; Nguyen, J.T.; Barbisin, M.; Xu, N.L.; Mahuvakar, V.R.; Andersen, M.R.; et al. Real-time quantification of microRNAs by stem–loop RT–PCR. Nucleic Acids Res. 2005, 33, 1–9. [Google Scholar] [CrossRef]
- Livak, K.J.; Schmittgen, T.D. Analysis of relative gene expression data using real-time quantitative PCR and the 2-ΔΔCt method. Methods 2001, 25, 402–408. [Google Scholar] [CrossRef]
- Ivanov, M.K.; Titov, S.E.; Glushkov, S.A.; Dzyubenko, V.V.; Malek, A.V.; Arkhangelskaya, P.A.; Samsonov, R.B.; Mikhetko, A.A.; Bakhidze, E.V.; Berlev, I.V.; et al. Detection of high-grade neoplasia in air-dried cervical PAP smears by a microRNA-based classifier. Oncol. Rep. 2018, 39, 1099–1111. [Google Scholar] [CrossRef] [PubMed]
- Veryaskina, Y.A.; Titov, S.E.; Kometova, V.V.; Rodionov, V.V.; Zhimulev, I.F. Intratumoral Heterogeneity of Expression of 16 miRNA in Luminal Cancer of the Mammary Gland. Non-Coding RNA 2020, 6, 16. [Google Scholar] [CrossRef] [PubMed]
- Veryaskina, Y.A.; Titov, S.E.; Kovynev, I.B.; Pospelova, T.I.; Zhimulev, I.F. The miRNA Profile in Non-Hodgkin’s Lymphoma Patients with Secondary Myelodysplasia. Cells 2020, 9, 2318. [Google Scholar] [CrossRef] [PubMed]
- Gong, J.N.; Yu, J.; Lin, H.S.; Zhang, X.H.; Yin, X.L.; Xiao, Z.; Wang, F.; Wang, X.S.; Su, R.; Shen, C.; et al. The role, mechanism and potentially therapeutic application of microRNA-29 family in acute myeloid leukemia. Cell Death Differ. 2014, 21, 100–112. [Google Scholar] [CrossRef] [Green Version]
- Jongen-Lavrencic, M.; Sun, S.M.; Dijkstra, M.K.; Valk, P.J.; Lowenberg, B. MicroRNA expression profiling in relation to the genetic heterogeneity of acute myeloid leukemia. Blood 2008, 111, 5078–5085. [Google Scholar] [CrossRef] [Green Version]
- Wang, S.; Aurora, A.B.; Johnson, B.A.; Qi, X.; McAnally, J.; Hill, J.A.; Richardson, J.A.; Bassel-Duby, R.; Olson, E.N. The endothelial-specific microRNA miR-126 governs vascular integrity and angiogenesis. Dev. Cell 2008, 15, 261–271. [Google Scholar] [CrossRef] [Green Version]
- Cattaneo, M.; Pelosi, E.; Castelli, G.; Cerio, A.M.; D′angiò, A.; Porretti, L.; Rebulla, P.; Pavesi, L.; Russo, G.; Giordano, A.; et al. A miRNA Signature in Human Cord Blood Stem and Progenitor Cells as Potential Biomarker of Specific Acute Myeloid Leukemia Subtypes. J. Cell. Physiol. 2015, 230, 1770–1780. [Google Scholar] [CrossRef]
- Havelange, V.; Garzon, R. MicroRNAs: Emerging Key Regulators of Hematopoiesis. Am. J. Hematol. 2010, 85, 935–942. [Google Scholar] [CrossRef]
- Slavov, S.N.; Teixeira, H.L.G.; Rego, E.M. The role of micro-ribonucleic acids in normal hematopoiesis and leukemic T-lymphogenesis. Braz. J. Med. Biol. Res. 2010, 43, 619–626. [Google Scholar] [CrossRef] [Green Version]
- Ghisi, M.; Corradin, A.; Basso, K.; Frasson, C.; Serafin, V.; Mukherjee, S.; Mussolin, L.; Ruggero, K.; Bonanno, L.; Guffanti, A.; et al. Margherita Ghisi, Alberto Corradin, Katia Basso, Chiara Frasson, Valentina Serafin, Subhamoy Mukherjee, Lara Mussolin, Katia Ruggero, Laura Bonanno, Alessandro Guffanti et al. Modulation of microRNA expression in human T-cell development: Targeting of NOTCH3 by miR-150. Blood 2011, 117, 7053–7062. [Google Scholar]
- Seddiki, N.; Brezar, V.; Ruffin, N.; Levy, Y.; Swaminathan, S. Role of miR-155 in the regulation of lymphocyte immune function and disease. Immunology. 2014, 142, 32–38. [Google Scholar] [CrossRef] [PubMed]
- He, Y.; Chevillet, J.R.; Liu, G.; Kim, T.K.; Wang, K. The effects of microRNA on the absorption, distribution, metabolism and excretion of drugs. Br. J. Pharmacol. 2015, 172, 2733–2747. [Google Scholar] [CrossRef] [PubMed] [Green Version]


| Characteristic | n (%) |
|---|---|
| Gender | |
| Male | 23 (48) |
| Female | 25 (52) |
| Age | |
| >60 years | 11 (23) |
| <60 years | 37 (77) |
| Median hemoglobin, g/L | 90 |
| Median WBC count, ×109/L | 6.7 |
| Median ANC, /dL | 5 |
| Median platelet count, ×109/L | 200.5 |
| Sybtype | |
| Iron-deficiency anemia | 28 (58) |
| hemolytic anemia | 3 (6) |
| B12 deficiency anemia | 5 (10) |
| chronic disease anemia | 6 (13) |
| immune thrombocytopenia | 5 (10) |
| aplastic anemia | 1 (2) |
| p-Value × 4 × 406 | CV Accuracy | CV Sensitivity | CV Specificity | CV AUC | |
|---|---|---|---|---|---|
| miR-150:miR-21 + miR-20a:miR-221 + miR-24:nf3 | 0.930 | 0.938 | 0.924 | 0.949 (0.910, 0.989) | |
| miR-150:miR-223 + miR-150:miR-221 + miR-126:miR-191 | 0.921 | 0.917 | 0.924 | 0.950 (0.910, 0.991) | |
| miR-150:miR-223 + miR-150:nf3 + miR-126:miR-221 | 0.921 | 0.917 | 0.924 | 0.959 (0.926, 0.993) | |
| miR-150:miR-223 + miR-223:miR-221 + miR-126:miR-191 | 0.921 | 0.917 | 0.924 | 0.950 (0.910, 0.991) | |
| miR-150:miR-223 + miR-223:nf3 + miR-126:miR-221 | 0.921 | 0.917 | 0.924 | 0.959 (0.926, 0.993) | |
| miR-150:miR-221 + miR-223:miR-221 + miR-126:miR-191 | 0.921 | 0.917 | 0.924 | 0.950 (0.910, 0.991) | |
| miR-150:nf3 + miR-20a:miR-221 + miR-24:miR-103a | 0.921 | 0.917 | 0.924 | 0.946 (0.900, 0.991) | |
| miR-150:nf3 + miR-223:nf3 + miR-126:miR-221 | 0.921 | 0.917 | 0.924 | 0.959 (0.926, 0.993) | |
| miR-150:miR-146a + miR-155:miR-221 + miR-24:miR-378 | 0.921 | 0.938 | 0.909 | 0.951 (0.910, 0.993) | |
| miR-150:miR-221 + miR-196b:miR-99a + miR-24:nf3 | 0.921 | 0.958 | 0.894 | 0.950 (0.909, 0.992) | |
| miR-223:miR-378 + miR-221:miR-24 + miR-29b:nf3 | 0.921 | 0.958 | 0.894 | 0.943 (0.895, 0.990) | |
| miR-223:nf3 + miR-221:miR-24 | 0.886 | 0.917 | 0.864 | 0.919 (0.865, 0.972) | |
| miR-150:miR-221 + miR-24:miR-378 | 0.877 | 0.917 | 0.848 | 0.931 (0.886, 0.976) | |
| miR-223:miR-221 + miR-126:miR-103a | 0.877 | 0.875 | 0.879 | 0.929 (0.881, 0.977) | |
| miR-223:miR-221 + miR-126:miR-191 | 0.877 | 0.896 | 0.864 | 0.932 (0.888, 0.975) | |
| miR-223:miR-221 + miR-29b:nf3 | 0.877 | 0.875 | 0.879 | 0.930 (0.880, 0.980) | |
| miR-150:miR-378 | 0.00000000071 | 0.789 | 0.875 | 0.727 | 0.863 (0.794, 0.932) |
| miR-150:nf3 | 0.0000000024 | 0.772 | 0.854 | 0.712 | 0.857 (0.785, 0.929) |
| miR-221:miR-24 | 0.000000044 | 0.746 | 0.792 | 0.712 | 0.836 (0.764, 0.908) |
| miR-223:miR-221 | 0.00000056 | 0.719 | 0.792 | 0.667 | 0.820 (0.744, 0.895) |
| miR-150:miR-221 | 0.00000099 | 0.728 | 0.792 | 0.682 | 0.817 (0.741, 0.893) |
| miR-150:miR-191 | 0.0000021 | 0.746 | 0.812 | 0.697 | 0.811 (0.730, 0.892) |
| miR-223:miR-378 | 0.0000045 | 0.693 | 0.792 | 0.621 | 0.806 (0.726, 0.886) |
| miR-150:miR-92a | 0.000043 | 0.746 | 0.792 | 0.712 | 0.788 (0.703, 0.873) |
| miR-150:miR-103a | 0.000045 | 0.719 | 0.771 | 0.682 | 0.785 (0.699, 0.871) |
| miR-128:miR-150 | 0.000068 | 0.693 | 0.729 | 0.667 | 0.782 (0.698, 0.867) |
| miR-150:miR-146a | 0.00011 | 0.719 | 0.792 | 0.667 | 0.779 (0.695, 0.863) |
| miR-150:miR-181a | 0.00011 | 0.711 | 0.792 | 0.652 | 0.778 (0.695, 0.861) |
| miR-451a:miR-103a | 0.00015 | 0.684 | 0.667 | 0.697 | 0.775 (0.690, 0.860) |
| miR-150:miR-181b | 0.00017 | 0.711 | 0.812 | 0.636 | 0.773 (0.687, 0.860) |
| miR-92a:miR-451a | 0.00032 | 0.667 | 0.688 | 0.652 | 0.769 (0.682, 0.855) |
| miR-221:miR-26a | 0.00045 | 0.728 | 0.771 | 0.697 | 0.764 (0.675, 0.853) |
| miR-126:miR-221 | 0.00059 | 0.728 | 0.750 | 0.712 | 0.764 (0.676, 0.852) |
| miR-150:miR-21 | 0.00099 | 0.719 | 0.729 | 0.712 | 0.759 (0.668, 0.849) |
| miR-451a:nf3 | 0.0015 | 0.649 | 0.667 | 0.636 | 0.753 (0.665, 0.842) |
| miR-451a:miR-21 | 0.0016 | 0.667 | 0.792 | 0.576 | 0.753 (0.662, 0.844) |
| miR-181b:miR-223 | 0.0019 | 0.640 | 0.833 | 0.500 | 0.751 (0.662, 0.841) |
| miR-221:miR-451a | 0.0020 | 0.693 | 0.750 | 0.652 | 0.751 (0.663, 0.840) |
| miR-451a:miR-378 | 0.0032 | 0.667 | 0.750 | 0.606 | 0.745 (0.656, 0.834) |
| miR-221:miR-9 | 0.0034 | 0.702 | 0.771 | 0.652 | 0.747 (0.656, 0.837) |
| miR-221:miR-29b | 0.0042 | 0.711 | 0.729 | 0.697 | 0.747 (0.656, 0.838) |
| miR-26a:miR-378 | 0.0050 | 0.675 | 0.646 | 0.697 | 0.741 (0.649, 0.833) |
| miR-150:miR-20a | 0.0054 | 0.693 | 0.688 | 0.697 | 0.744 (0.653, 0.835) |
| miR-29b:miR-378 | 0.0069 | 0.711 | 0.708 | 0.712 | 0.740 (0.647, 0.832) |
| miR-150:miR-18a | 0.0074 | 0.693 | 0.729 | 0.667 | 0.739 (0.647, 0.831) |
| miR-24:miR-378 | 0.0091 | 0.667 | 0.625 | 0.697 | 0.735 (0.638, 0.833) |
| miR-150:miR-99a | 0.011 | 0.702 | 0.750 | 0.667 | 0.732 (0.639, 0.825) |
| miR-451a:let7a | 0.016 | 0.684 | 0.771 | 0.621 | 0.729 (0.637, 0.822) |
| miR-223:nf3 | 0.017 | 0.675 | 0.792 | 0.591 | 0.725 (0.633, 0.818) |
| miR-150:miR-196b | 0.017 | 0.667 | 0.792 | 0.576 | 0.732 (0.638, 0.827) |
| miR-126:miR-378 | 0.019 | 0.675 | 0.667 | 0.682 | 0.729 (0.633, 0.825) |
| miR-150:miR-155 | 0.026 | 0.684 | 0.792 | 0.606 | 0.727 (0.633, 0.821) |
| miR-20a:miR-451a | 0.026 | 0.632 | 0.646 | 0.621 | 0.724 (0.629, 0.820) |
| miR-451a:miR-191 | 0.032 | 0.649 | 0.667 | 0.636 | 0.722 (0.628, 0.815) |
| miR-29b:nf3 | 0.18 | 0.684 | 0.646 | 0.712 | 0.698 (0.597, 0.799) |
| miR-126:nf3 | 0.41 | 0.649 | 0.646 | 0.652 | 0.686 (0.581, 0.791) |
| miR-26a:nf3 | 0.70 | 0.623 | 0.604 | 0.636 | 0.681 (0.581, 0.781) |
| miR-20a:nf3 | >1 | 0.588 | 0.604 | 0.576 | 0.636 (0.535, 0.737) |
| miR-210:nf3 | >1 | 0.632 | 0.583 | 0.667 | 0.628 (0.521, 0.735) |
| let7a:nf3 | >1 | 0.570 | 0.625 | 0.530 | 0.627 (0.519, 0.735) |
| miR-221:nf3 | >1 | 0.570 | 0.604 | 0.545 | 0.624 (0.520, 0.728) |
| miR-24:nf3 | >1 | 0.579 | 0.542 | 0.606 | 0.628 (0.520, 0.735) |
| miR-196b:nf3 | >1 | 0.614 | 0.562 | 0.652 | 0.621 (0.517, 0.724) |
| miR-18a:nf3 | >1 | 0.570 | 0.542 | 0.591 | 0.614 (0.508, 0.720) |
| miR-96:nf3 | >1 | 0.561 | 0.646 | 0.500 | 0.608 (0.504, 0.713) |
| miR-9:nf3 | >1 | 0.614 | 0.500 | 0.697 | 0.597 (0.489, 0.705) |
| miR-128:nf3 | >1 | 0.596 | 0.521 | 0.652 | 0.543 (0.433, 0.652) |
| miR-124:nf3 | >1 | 0.553 | 0.583 | 0.530 | 0.553 (0.448, 0.659) |
| miR-21:nf3 | >1 | 0.553 | 0.542 | 0.561 | 0.534 (0.420, 0.648) |
| miR-181b:nf3 | >1 | 0.579 | 0.667 | 0.515 | 0.553 (0.447, 0.659) |
| miR-92a:nf3 | >1 | 0.544 | 0.562 | 0.530 | 0.490 (0.383, 0.597) |
| miR-155:nf3 | >1 | 0.491 | 0.583 | 0.424 | 0.462 (0.356, 0.569) |
| miR-100:nf3 | >1 | 0.456 | 0.521 | 0.409 | 0.500 (0.389, 0.611) |
| miR-181a:nf3 | >1 | 0.465 | 0.562 | 0.394 | 0.523 (0.416, 0.630) |
| miR-99a:nf3 | >1 | 0.439 | 0.521 | 0.379 | 0.591 (0.486, 0.696) |
| miR-146a:nf3 | >1 | 0.465 | 0.604 | 0.364 | 0.511 (0.404, 0.618) |
| p-Value × 4 × 406 | CV Accuracy | CV Sensitivity | CV Specificity | CV AUC | |
|---|---|---|---|---|---|
| miR-181b:miR-100 + miR-223:miR-124 + miR-24:nf3 | 0.816 | 0.818 | 0.815 | 0.796 (0.679, 0.914) | |
| miR-155:miR-124 + miR-181b:miR-100 + miR-223:miR-103a | 0.807 | 0.818 | 0.804 | 0.839 (0.736, 0.941) | |
| miR-155:miR-378 + miR-181b:miR-223 + miR-100:miR-210 | 0.807 | 0.818 | 0.804 | 0.829 (0.732, 0.926) | |
| miR-196b:miR-124 + miR-92a:miR-24 + miR-100:miR-181a | 0.807 | 0.818 | 0.804 | 0.850 (0.763, 0.936) | |
| miR-155:miR-378 + miR-181b:miR-196b + miR-223:miR-146a | 0.807 | 0.773 | 0.815 | 0.768 (0.646, 0.890) | |
| miR-155:miR-378 + miR-181b:miR-223 + miR-196b:miR-24 | 0.807 | 0.773 | 0.815 | 0.772 (0.663, 0.882) | |
| miR-155:miR-100 + miR-196b:miR-124 + miR-223:miR-92a | 0.807 | 0.727 | 0.826 | 0.801 (0.689, 0.914) | |
| miR-181b:miR-223 + miR-196b:miR-103a + miR-100:miR-124 | 0.807 | 0.727 | 0.826 | 0.796 (0.674, 0.918) | |
| miR-196b:miR-124 + miR-223:miR-26a + miR-99a:miR-378 | 0.807 | 0.727 | 0.826 | 0.792 (0.673, 0.911) | |
| miR-196b:nf3 + miR-223:miR-181a + miR-126:miR-210 | 0.807 | 0.727 | 0.826 | 0.726 (0.590, 0.862) | |
| miR-223:miR-26a + miR-100:miR-181a + miR-451a:miR-103a | 0.807 | 0.727 | 0.826 | 0.777 (0.658, 0.896) | |
| miR-196b:miR-181a + miR-92a:miR-24 + miR-221:miR-21 | 0.807 | 0.682 | 0.837 | 0.719 (0.584, 0.855) | |
| miR-155:miR-92a + miR-181b:miR-196b + miR-221:miR-451a | 0.807 | 0.545 | 0.870 | 0.698 (0.567, 0.829) | |
| miR-196b:miR-181a + miR-20a:miR-451a + let7a:miR-21 | 0.807 | 0.545 | 0.870 | 0.643 (0.488, 0.798) | |
| miR-155:miR-92a + miR-181b:miR-126 + miR-196b:miR-181a | 0.807 | 0.500 | 0.880 | 0.650 (0.496, 0.803) | |
| miR-181b:miR-223 + miR-196b:miR-103a | 0.789 | 0.682 | 0.815 | 0.727 (0.596, 0.858) | |
| miR-18a:miR-451a + miR-181a:miR-24 | 0.789 | 0.545 | 0.848 | 0.647 (0.502, 0.793) | |
| miR-181b:miR-223 + miR-221:miR-9 | 0.789 | 0.545 | 0.848 | 0.727 (0.616, 0.838) | |
| miR-128:miR-21 + miR-223:miR-181a | 0.789 | 0.500 | 0.859 | 0.617 (0.452, 0.781) | |
| miR-196b:nf3 | >1 | 0.649 | 0.591 | 0.663 | 0.703 (0.570, 0.836) |
| miR-223:nf3 | >1 | 0.684 | 0.591 | 0.707 | 0.686 (0.548, 0.824) |
| miR-100:nf3 | >1 | 0.596 | 0.591 | 0.598 | 0.643 (0.527, 0.759) |
| miR-9:nf3 | >1 | 0.570 | 0.682 | 0.543 | 0.625 (0.502, 0.748) |
| miR-451a:nf3 | >1 | 0.596 | 0.500 | 0.620 | 0.595 (0.453, 0.737) |
| miR-124:nf3 | >1 | 0.588 | 0.545 | 0.598 | 0.595 (0.459, 0.732) |
| miR-150:nf3 | >1 | 0.614 | 0.455 | 0.652 | 0.570 (0.439, 0.700) |
| miR-29b:nf3 | >1 | 0.526 | 0.591 | 0.511 | 0.583 (0.450, 0.715) |
| miR-126:nf3 | >1 | 0.570 | 0.636 | 0.554 | 0.564 (0.436, 0.691) |
| miR-24:nf3 | >1 | 0.535 | 0.455 | 0.554 | 0.574 (0.449, 0.699) |
| miR-21:nf3 | >1 | 0.518 | 0.500 | 0.522 | 0.564 (0.439, 0.689) |
| miR-181a:nf3 | >1 | 0.588 | 0.364 | 0.641 | 0.558 (0.428, 0.688) |
| miR-181b:nf3 | >1 | 0.623 | 0.409 | 0.674 | 0.558 (0.409, 0.707) |
| miR-20a:nf3 | >1 | 0.596 | 0.545 | 0.609 | 0.509 (0.361, 0.658) |
| let7a:nf3 | >1 | 0.570 | 0.455 | 0.598 | 0.549 (0.409, 0.689) |
| miR-96:nf3 | >1 | 0.579 | 0.455 | 0.609 | 0.535 (0.384, 0.686) |
| miR-26a:nf3 | >1 | 0.518 | 0.545 | 0.511 | 0.506 (0.372, 0.641) |
| miR-146a:nf3 | >1 | 0.596 | 0.364 | 0.652 | 0.502 (0.366, 0.637) |
| miR-99a:nf3 | >1 | 0.500 | 0.636 | 0.467 | 0.523 (0.408, 0.637) |
| miR-18a:nf3 | >1 | 0.491 | 0.455 | 0.500 | 0.502 (0.379, 0.625) |
| miR-155:nf3 | >1 | 0.561 | 0.364 | 0.609 | 0.499 (0.348, 0.650) |
| miR-128:nf3 | >1 | 0.588 | 0.364 | 0.641 | 0.489 (0.334, 0.644) |
| miR-221:nf3 | >1 | 0.500 | 0.318 | 0.543 | 0.602 (0.482, 0.722) |
| miR-210:nf3 | >1 | 0.482 | 0.500 | 0.478 | 0.650 (0.536, 0.763) |
| miR-92a:nf3 | >1 | 0.447 | 0.364 | 0.467 | 0.629 (0.507, 0.752) |
| p-Value × 4 × 406 | CV Accuracy | CV Sensitivity | CV Specificity | CV AUC | |
|---|---|---|---|---|---|
| miR-150:miR-221 + miR-100:miR-24 + miR-181a:miR-191 | 0.833 | 0.818 | 0.843 | 0.868 (0.803, 0.934) | |
| miR-150:miR-221 + miR-100:miR-124 + miR-26a:nf3 | 0.825 | 0.841 | 0.814 | 0.882 (0.821, 0.944) | |
| miR-150:miR-100 + miR-181a:miR-221 + miR-24:nf3 | 0.825 | 0.818 | 0.829 | 0.872 (0.807, 0.937) | |
| miR-150:miR-100 + miR-181a:nf3 + miR-221:miR-24 | 0.825 | 0.818 | 0.829 | 0.882 (0.819, 0.944) | |
| miR-150:miR-21 + miR-18a:miR-92a + miR-26a:miR-191 | 0.825 | 0.795 | 0.843 | 0.831 (0.754, 0.908) | |
| miR-150:nf3 + miR-20a:miR-92a + miR-100:miR-124 | 0.825 | 0.795 | 0.843 | 0.843 (0.765, 0.921) | |
| miR-223:miR-100 + miR-146a:miR-103a + miR-221:miR-451a | 0.825 | 0.795 | 0.843 | 0.836 (0.755, 0.917) | |
| miR-223:miR-103a + miR-100:miR-451a + miR-146a:miR-221 | 0.825 | 0.795 | 0.843 | 0.823 (0.741, 0.905) | |
| miR-100:miR-126 + miR-146a:miR-221 + miR-26a:miR-21 | 0.825 | 0.773 | 0.857 | 0.822 (0.736, 0.908) | |
| miR-128:miR-221 + miR-20a:miR-100 + miR-24:nf3 | 0.825 | 0.773 | 0.857 | 0.812 (0.726, 0.898) | |
| miR-150:miR-221 + miR-196b:miR-24 + miR-100:miR-99a | 0.825 | 0.773 | 0.857 | 0.819 (0.730, 0.907) | |
| miR-181b:miR-100 + miR-146a:miR-103a + miR-221:miR-451a | 0.825 | 0.773 | 0.857 | 0.834 (0.752, 0.915) | |
| miR-150:miR-221 + miR-26a:miR-103a | 0.798 | 0.795 | 0.800 | 0.837 (0.763, 0.911) | |
| miR-150:miR-191 + miR-124:miR-221 | 0.781 | 0.773 | 0.786 | 0.789 (0.700, 0.878) | |
| miR-150:miR-21 + miR-26a:miR-191 | 0.781 | 0.750 | 0.800 | 0.823 (0.745, 0.901) | |
| miR-150:miR-191 + miR-210:miR-21 | 0.781 | 0.727 | 0.814 | 0.803 (0.719, 0.887) | |
| miR-150:miR-191 + miR-181b:miR-124 | 0.781 | 0.705 | 0.829 | 0.780 (0.689, 0.872) | |
| miR-150:miR-100 + miR-26a:miR-378 | 0.781 | 0.682 | 0.843 | 0.808 (0.728, 0.889) | |
| miR-150:nf3 | 0.000022 | 0.737 | 0.636 | 0.800 | 0.794 (0.712, 0.876) |
| miR-150:miR-191 | 0.000057 | 0.746 | 0.682 | 0.786 | 0.786 (0.699, 0.874) |
| miR-150:miR-378 | 0.00016 | 0.711 | 0.614 | 0.771 | 0.775 (0.690, 0.860) |
| miR-150:miR-100 | 0.0011 | 0.702 | 0.659 | 0.729 | 0.757 (0.665, 0.849) |
| miR-150:miR-221 | 0.0015 | 0.719 | 0.659 | 0.757 | 0.756 (0.659, 0.854) |
| miR-150:miR-103a | 0.0072 | 0.719 | 0.682 | 0.743 | 0.741 (0.646, 0.837) |
| miR-150:miR-196b | 0.0072 | 0.684 | 0.568 | 0.757 | 0.741 (0.645, 0.838) |
| miR-150:miR-21 | 0.0076 | 0.684 | 0.682 | 0.686 | 0.739 (0.645, 0.833) |
| miR-150:miR-92a | 0.020 | 0.711 | 0.636 | 0.757 | 0.729 (0.631, 0.828) |
| miR-221:miR-24 | 0.022 | 0.711 | 0.636 | 0.757 | 0.728 (0.630, 0.825) |
| miR-26a:miR-21 | 0.028 | 0.711 | 0.636 | 0.757 | 0.726 (0.624, 0.829) |
| miR-221:miR-26a | 0.042 | 0.693 | 0.636 | 0.729 | 0.718 (0.613, 0.822) |
| miR-100:miR-26a | 0.043 | 0.667 | 0.659 | 0.671 | 0.721 (0.624, 0.819) |
| miR-451a:nf3 | > 1 | 0.649 | 0.614 | 0.671 | 0.675 (0.575, 0.775) |
| miR-26a:nf3 | > 1 | 0.596 | 0.614 | 0.586 | 0.649 (0.547, 0.751) |
| miR-29b:nf3 | > 1 | 0.623 | 0.705 | 0.571 | 0.634 (0.527, 0.740) |
| miR-126:nf3 | > 1 | 0.570 | 0.568 | 0.571 | 0.630 (0.526, 0.734) |
| miR-210:nf3 | > 1 | 0.623 | 0.636 | 0.614 | 0.629 (0.520, 0.737) |
| miR-221:nf3 | > 1 | 0.605 | 0.568 | 0.629 | 0.613 (0.500, 0.725) |
| miR-128:nf3 | > 1 | 0.544 | 0.636 | 0.486 | 0.604 (0.497, 0.712) |
| miR-100:nf3 | > 1 | 0.588 | 0.477 | 0.657 | 0.608 (0.501, 0.715) |
| miR-223:nf3 | > 1 | 0.596 | 0.477 | 0.671 | 0.591 (0.483, 0.699) |
| miR-18a:nf3 | > 1 | 0.570 | 0.591 | 0.557 | 0.592 (0.483, 0.700) |
| miR-20a:nf3 | > 1 | 0.570 | 0.500 | 0.614 | 0.584 (0.474, 0.694) |
| let7a:nf3 | > 1 | 0.570 | 0.523 | 0.600 | 0.573 (0.467, 0.679) |
| miR-24:nf3 | > 1 | 0.579 | 0.591 | 0.571 | 0.564 (0.456, 0.673) |
| miR-96:nf3 | > 1 | 0.561 | 0.477 | 0.614 | 0.558 (0.449, 0.666) |
| miR-181a:nf3 | > 1 | 0.421 | 0.182 | 0.571 | 0.777 (0.685, 0.869) |
| miR-155:nf3 | > 1 | 0.342 | 0.227 | 0.414 | 0.867 (0.797, 0.936) |
| miR-9:nf3 | > 1 | 0.500 | 0.341 | 0.600 | 0.572 (0.463, 0.682) |
| miR-92a:nf3 | > 1 | 0.509 | 0.477 | 0.529 | 0.498 (0.380, 0.616) |
| miR-146a:nf3 | > 1 | 0.491 | 0.318 | 0.600 | 0.629 (0.518, 0.740) |
| miR-99a:nf3 | > 1 | 0.544 | 0.432 | 0.614 | 0.505 (0.388, 0.622) |
| miR-181b:nf3 | > 1 | 0.570 | 0.455 | 0.643 | 0.486 (0.371, 0.602) |
| miR-21:nf3 | > 1 | 0.465 | 0.432 | 0.486 | 0.586 (0.480, 0.693) |
| miR-196b:nf3 | > 1 | 0.491 | 0.386 | 0.557 | 0.507 (0.393, 0.621) |
| miR-124:nf3 | > 1 | 0.377 | 0.227 | 0.471 | 0.827 (0.745, 0.910) |
| p-Value × 4 × 406 | CV Accuracy | CV Sensitivity | CV Specificity | CV AUC | |
|---|---|---|---|---|---|
| miR-100:miR-124 + miR-24:miR-26a + miR-24:miR-9 | 0.848 | 0.864 | 0.841 | 0.893 (0.809, 0.976) | |
| miR-100:miR-124 + miR-24:miR-26a + miR-26a:miR-9 | 0.848 | 0.864 | 0.841 | 0.893 (0.809, 0.976) | |
| miR-100:miR-124 + miR-24:miR-9 + miR-26a:miR-9 | 0.848 | 0.864 | 0.841 | 0.893 (0.809, 0.976) | |
| miR-155:miR-181b + miR-100:miR-124 + miR-24:miR-26a | 0.848 | 0.818 | 0.864 | 0.897 (0.810, 0.984) | |
| miR-155:miR-124 + miR-181b:miR-100 + miR-24:miR-26a | 0.848 | 0.818 | 0.864 | 0.893 (0.802, 0.983) | |
| miR-20a:miR-9 + miR-100:miR-124 + miR-24:miR-26a | 0.848 | 0.818 | 0.864 | 0.871 (0.781, 0.961) | |
| miR-223:miR-124 + miR-92a:miR-100 | 0.773 | 0.773 | 0.773 | 0.794 (0.682, 0.907) | |
| miR-100:miR-124 + miR-24:miR-26a | 0.773 | 0.727 | 0.795 | 0.851 (0.756, 0.946) | |
| miR-223:miR-124 + miR-100:miR-26a | 0.773 | 0.682 | 0.818 | 0.818 (0.715, 0.921) | |
| miR-100:nf3 | >1 | 0.652 | 0.636 | 0.659 | 0.692 (0.561, 0.824) |
| miR-196b:nf3 | >1 | 0.591 | 0.591 | 0.591 | 0.657 (0.514, 0.800) |
| miR-181a:nf3 | >1 | 0.576 | 0.318 | 0.705 | 0.560 (0.416, 0.703) |
| miR-210:nf3 | >1 | 0.621 | 0.727 | 0.568 | 0.572 (0.428, 0.716) |
| miR-150:nf3 | >1 | 0.530 | 0.591 | 0.500 | 0.568 (0.416, 0.721) |
| miR-223:nf3 | >1 | 0.652 | 0.591 | 0.682 | 0.565 (0.408, 0.722) |
| miR-124:nf3 | >1 | 0.530 | 0.545 | 0.523 | 0.544 (0.399, 0.690) |
| miR-9:nf3 | >1 | 0.530 | 0.682 | 0.455 | 0.569 (0.426, 0.712) |
| miR-128:nf3 | >1 | 0.606 | 0.409 | 0.705 | 0.568 (0.409, 0.727) |
| miR-221:nf3 | >1 | 0.606 | 0.682 | 0.568 | 0.544 (0.401, 0.688) |
| miR-26a:nf3 | >1 | 0.561 | 0.545 | 0.568 | 0.507 (0.351, 0.664) |
| miR-21:nf3 | >1 | 0.485 | 0.500 | 0.477 | 0.472 (0.325, 0.619) |
| miR-146a:nf3 | >1 | 0.515 | 0.227 | 0.659 | 0.438 (0.292, 0.584) |
| miR-181b:nf3 | >1 | 0.606 | 0.409 | 0.705 | 0.496 (0.341, 0.650) |
| miR-155:nf3 | >1 | 0.545 | 0.364 | 0.636 | 0.505 (0.349, 0.661) |
| miR-18a:nf3 | >1 | 0.530 | 0.636 | 0.477 | 0.485 (0.333, 0.636) |
| miR-99a:nf3 | >1 | 0.500 | 0.636 | 0.432 | 0.485 (0.345, 0.624) |
| miR-92a:nf3 | >1 | 0.470 | 0.455 | 0.477 | 0.548 (0.404, 0.691) |
| miR-24:nf3 | >1 | 0.455 | 0.364 | 0.500 | 0.518 (0.367, 0.668) |
| let7a:nf3 | >1 | 0.485 | 0.409 | 0.523 | 0.586 (0.434, 0.738) |
| miR-29b:nf3 | >1 | 0.424 | 0.455 | 0.409 | 0.689 (0.555, 0.823) |
| miR-126:nf3 | >1 | 0.455 | 0.409 | 0.477 | 0.753 (0.625, 0.881) |
| miR-96:nf3 | >1 | 0.515 | 0.364 | 0.591 | 0.644 (0.500, 0.787) |
| miR-451a:nf3 | >1 | 0.470 | 0.500 | 0.455 | 0.679 (0.540, 0.818) |
| miR-20a:nf3 | >1 | 0.485 | 0.591 | 0.432 | 0.595 (0.448, 0.742) |
Publisher’s Note: MDPI stays neutral with regard to jurisdictional claims in published maps and institutional affiliations. |
© 2020 by the authors. Licensee MDPI, Basel, Switzerland. This article is an open access article distributed under the terms and conditions of the Creative Commons Attribution (CC BY) license (http://creativecommons.org/licenses/by/4.0/).
Share and Cite
Kovynev, I.B.; Titov, S.E.; Ruzankin, P.S.; Agakishiev, M.M.; Veryaskina, Y.A.; Nedel’ko, V.M.; Pospelova, T.I.; Zhimulev, I.F. Profiling 25 Bone Marrow microRNAs in Acute Leukemias and Secondary Nonleukemic Hematopoietic Conditions. Biomedicines 2020, 8, 607. https://doi.org/10.3390/biomedicines8120607
Kovynev IB, Titov SE, Ruzankin PS, Agakishiev MM, Veryaskina YA, Nedel’ko VM, Pospelova TI, Zhimulev IF. Profiling 25 Bone Marrow microRNAs in Acute Leukemias and Secondary Nonleukemic Hematopoietic Conditions. Biomedicines. 2020; 8(12):607. https://doi.org/10.3390/biomedicines8120607
Chicago/Turabian StyleKovynev, Igor B., Sergei E. Titov, Pavel S. Ruzankin, Mechti M. Agakishiev, Yuliya A. Veryaskina, Viktor M. Nedel’ko, Tatiana I. Pospelova, and Igor F. Zhimulev. 2020. "Profiling 25 Bone Marrow microRNAs in Acute Leukemias and Secondary Nonleukemic Hematopoietic Conditions" Biomedicines 8, no. 12: 607. https://doi.org/10.3390/biomedicines8120607