Membrane Permeabilization by Bordetella Adenylate Cyclase Toxin Involves Pores of Tunable Size

 , , and
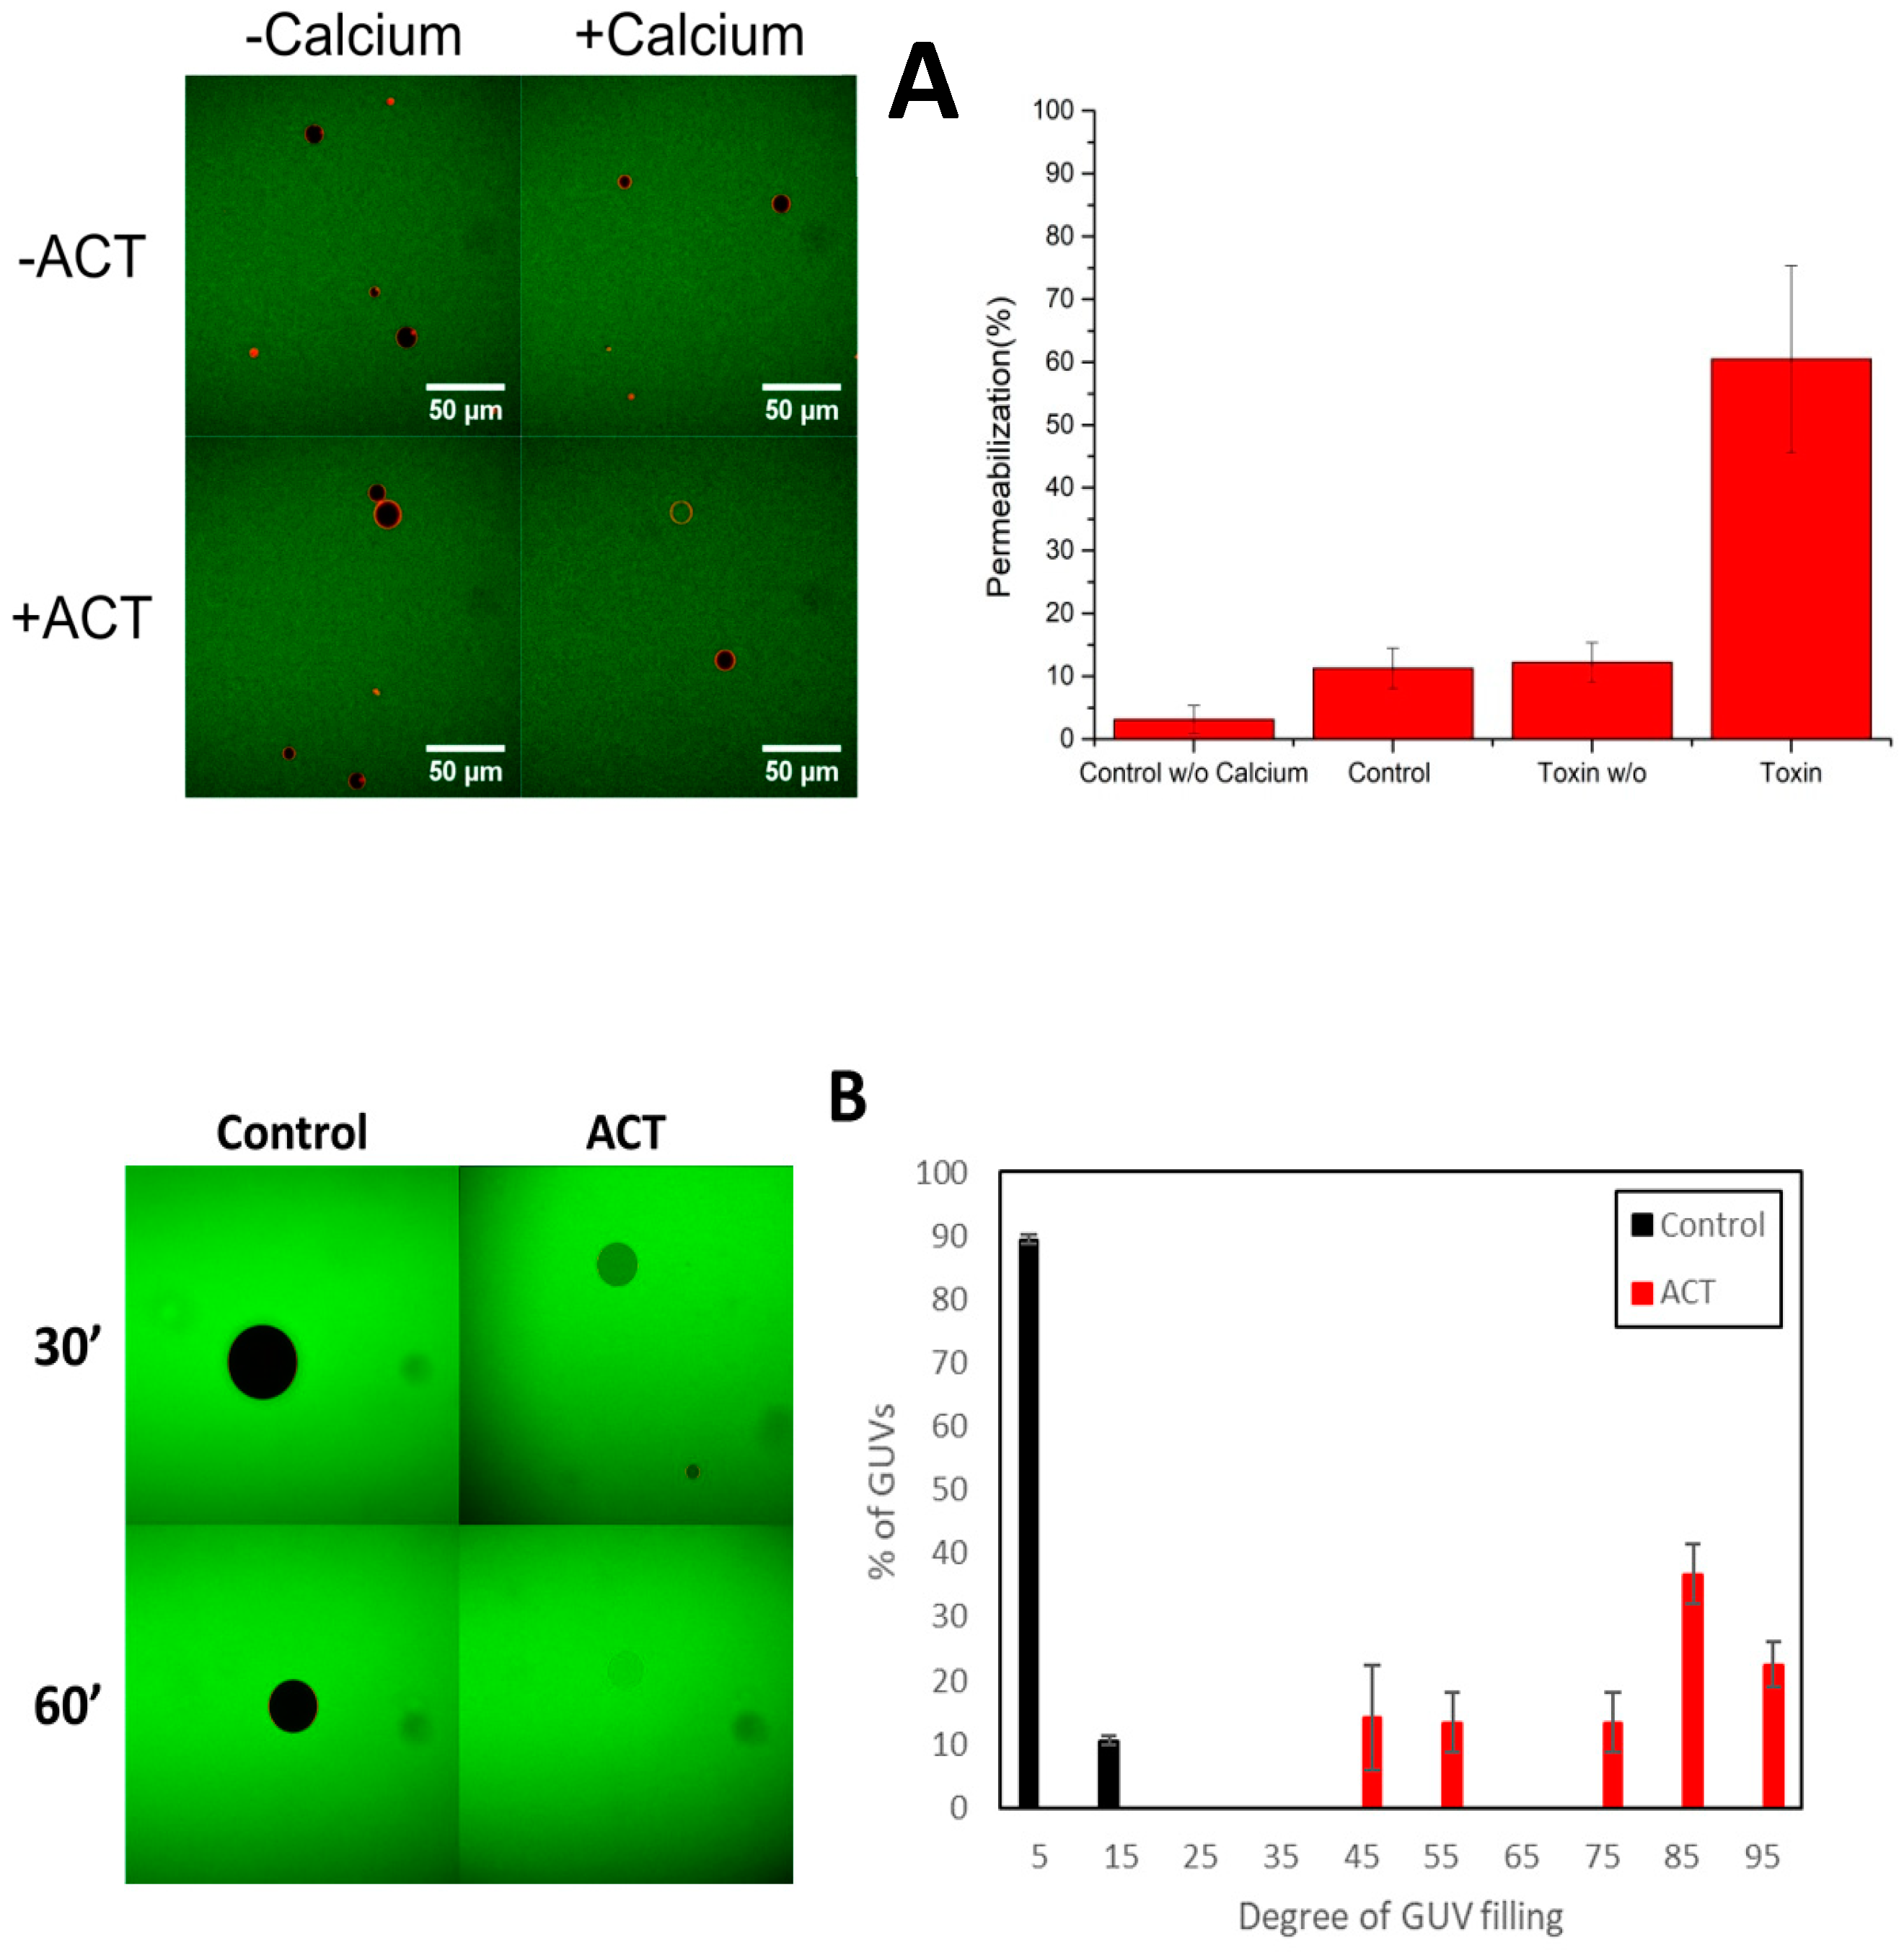
Abstract
:1. Introduction
2. Materials and Methods
2.1. Antibodies and Reagents
2.2. ACT Purification
2.3. Cell Culture
2.4. Permeabilization Measured as Influx of Fluorescent Solutes to the Interior of Giant Unilamellar Vesicles (GUVs)
2.5. Atomic Force Microscopy (AFM): Sample Preparation, Measurements and Topographic Analysis
2.6. Preparation of Large Unilamellar Vesicles (LUVs)
2.7. Blue-Native (BN-PAGE) Electrophoresis and Western Blotting
2.8. Statistical Analysis
3. Results
3.1. Permeabilization of Giant Unilamellar Vesicles by ACT
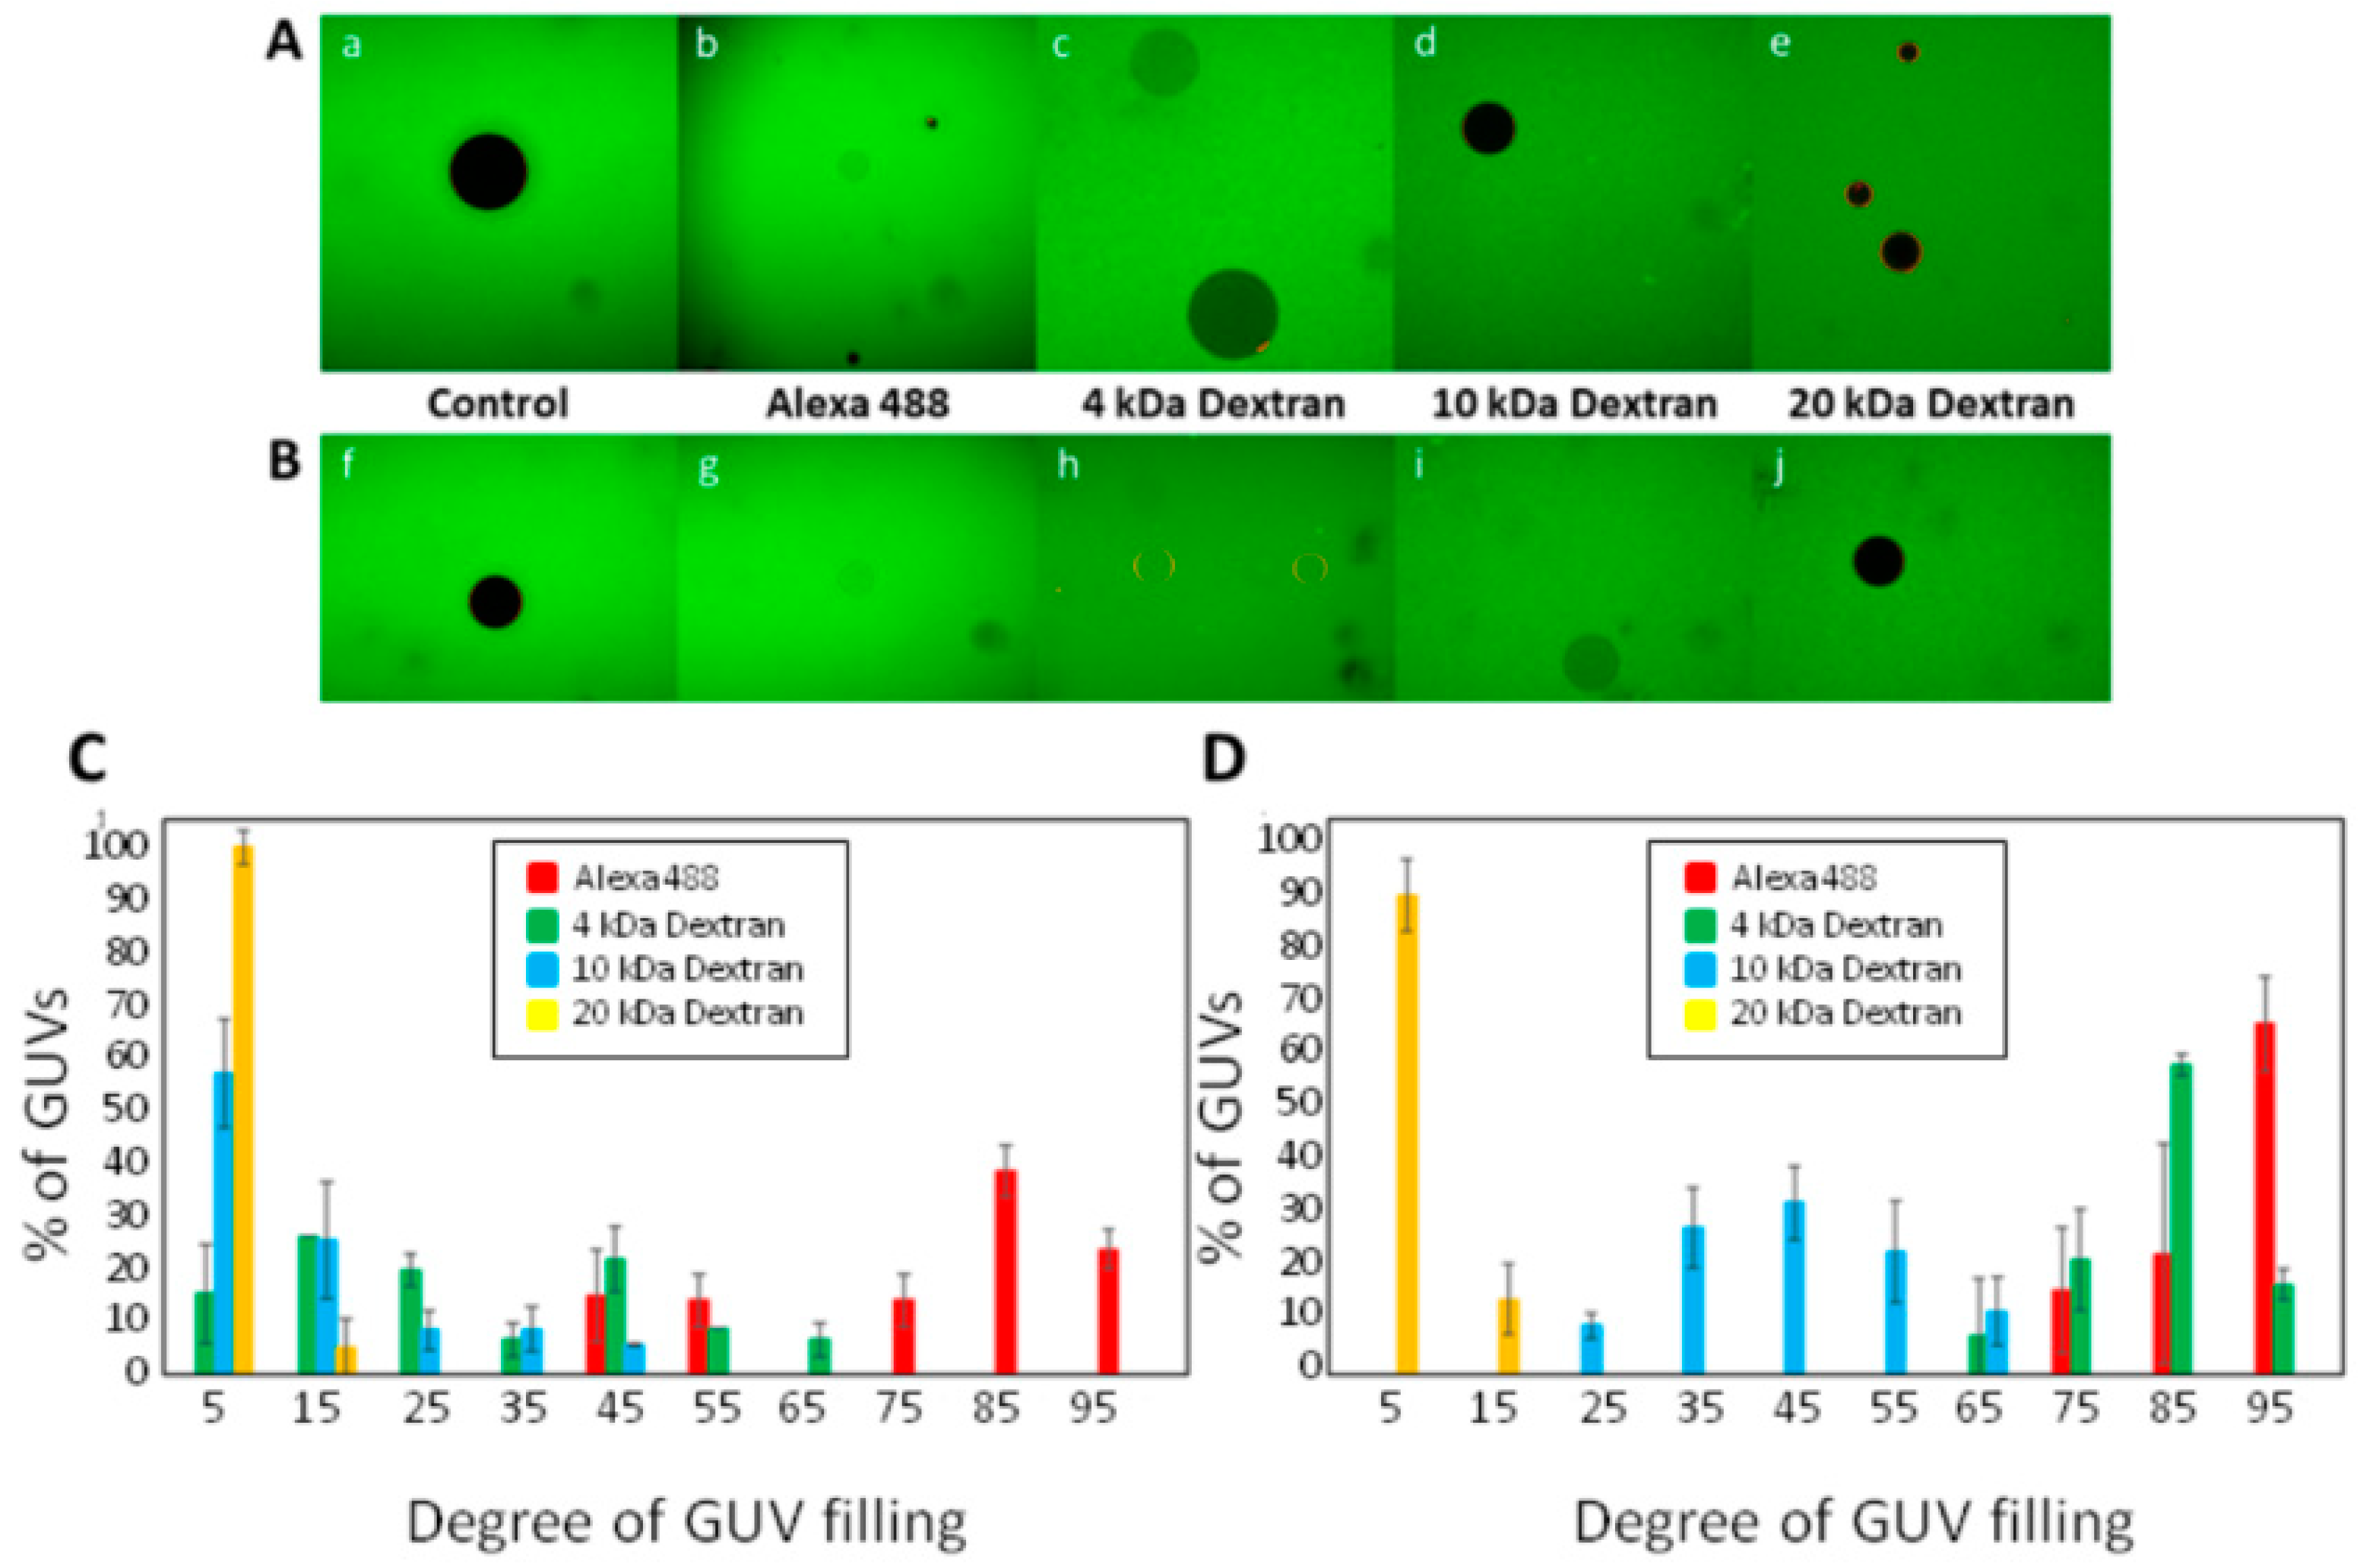
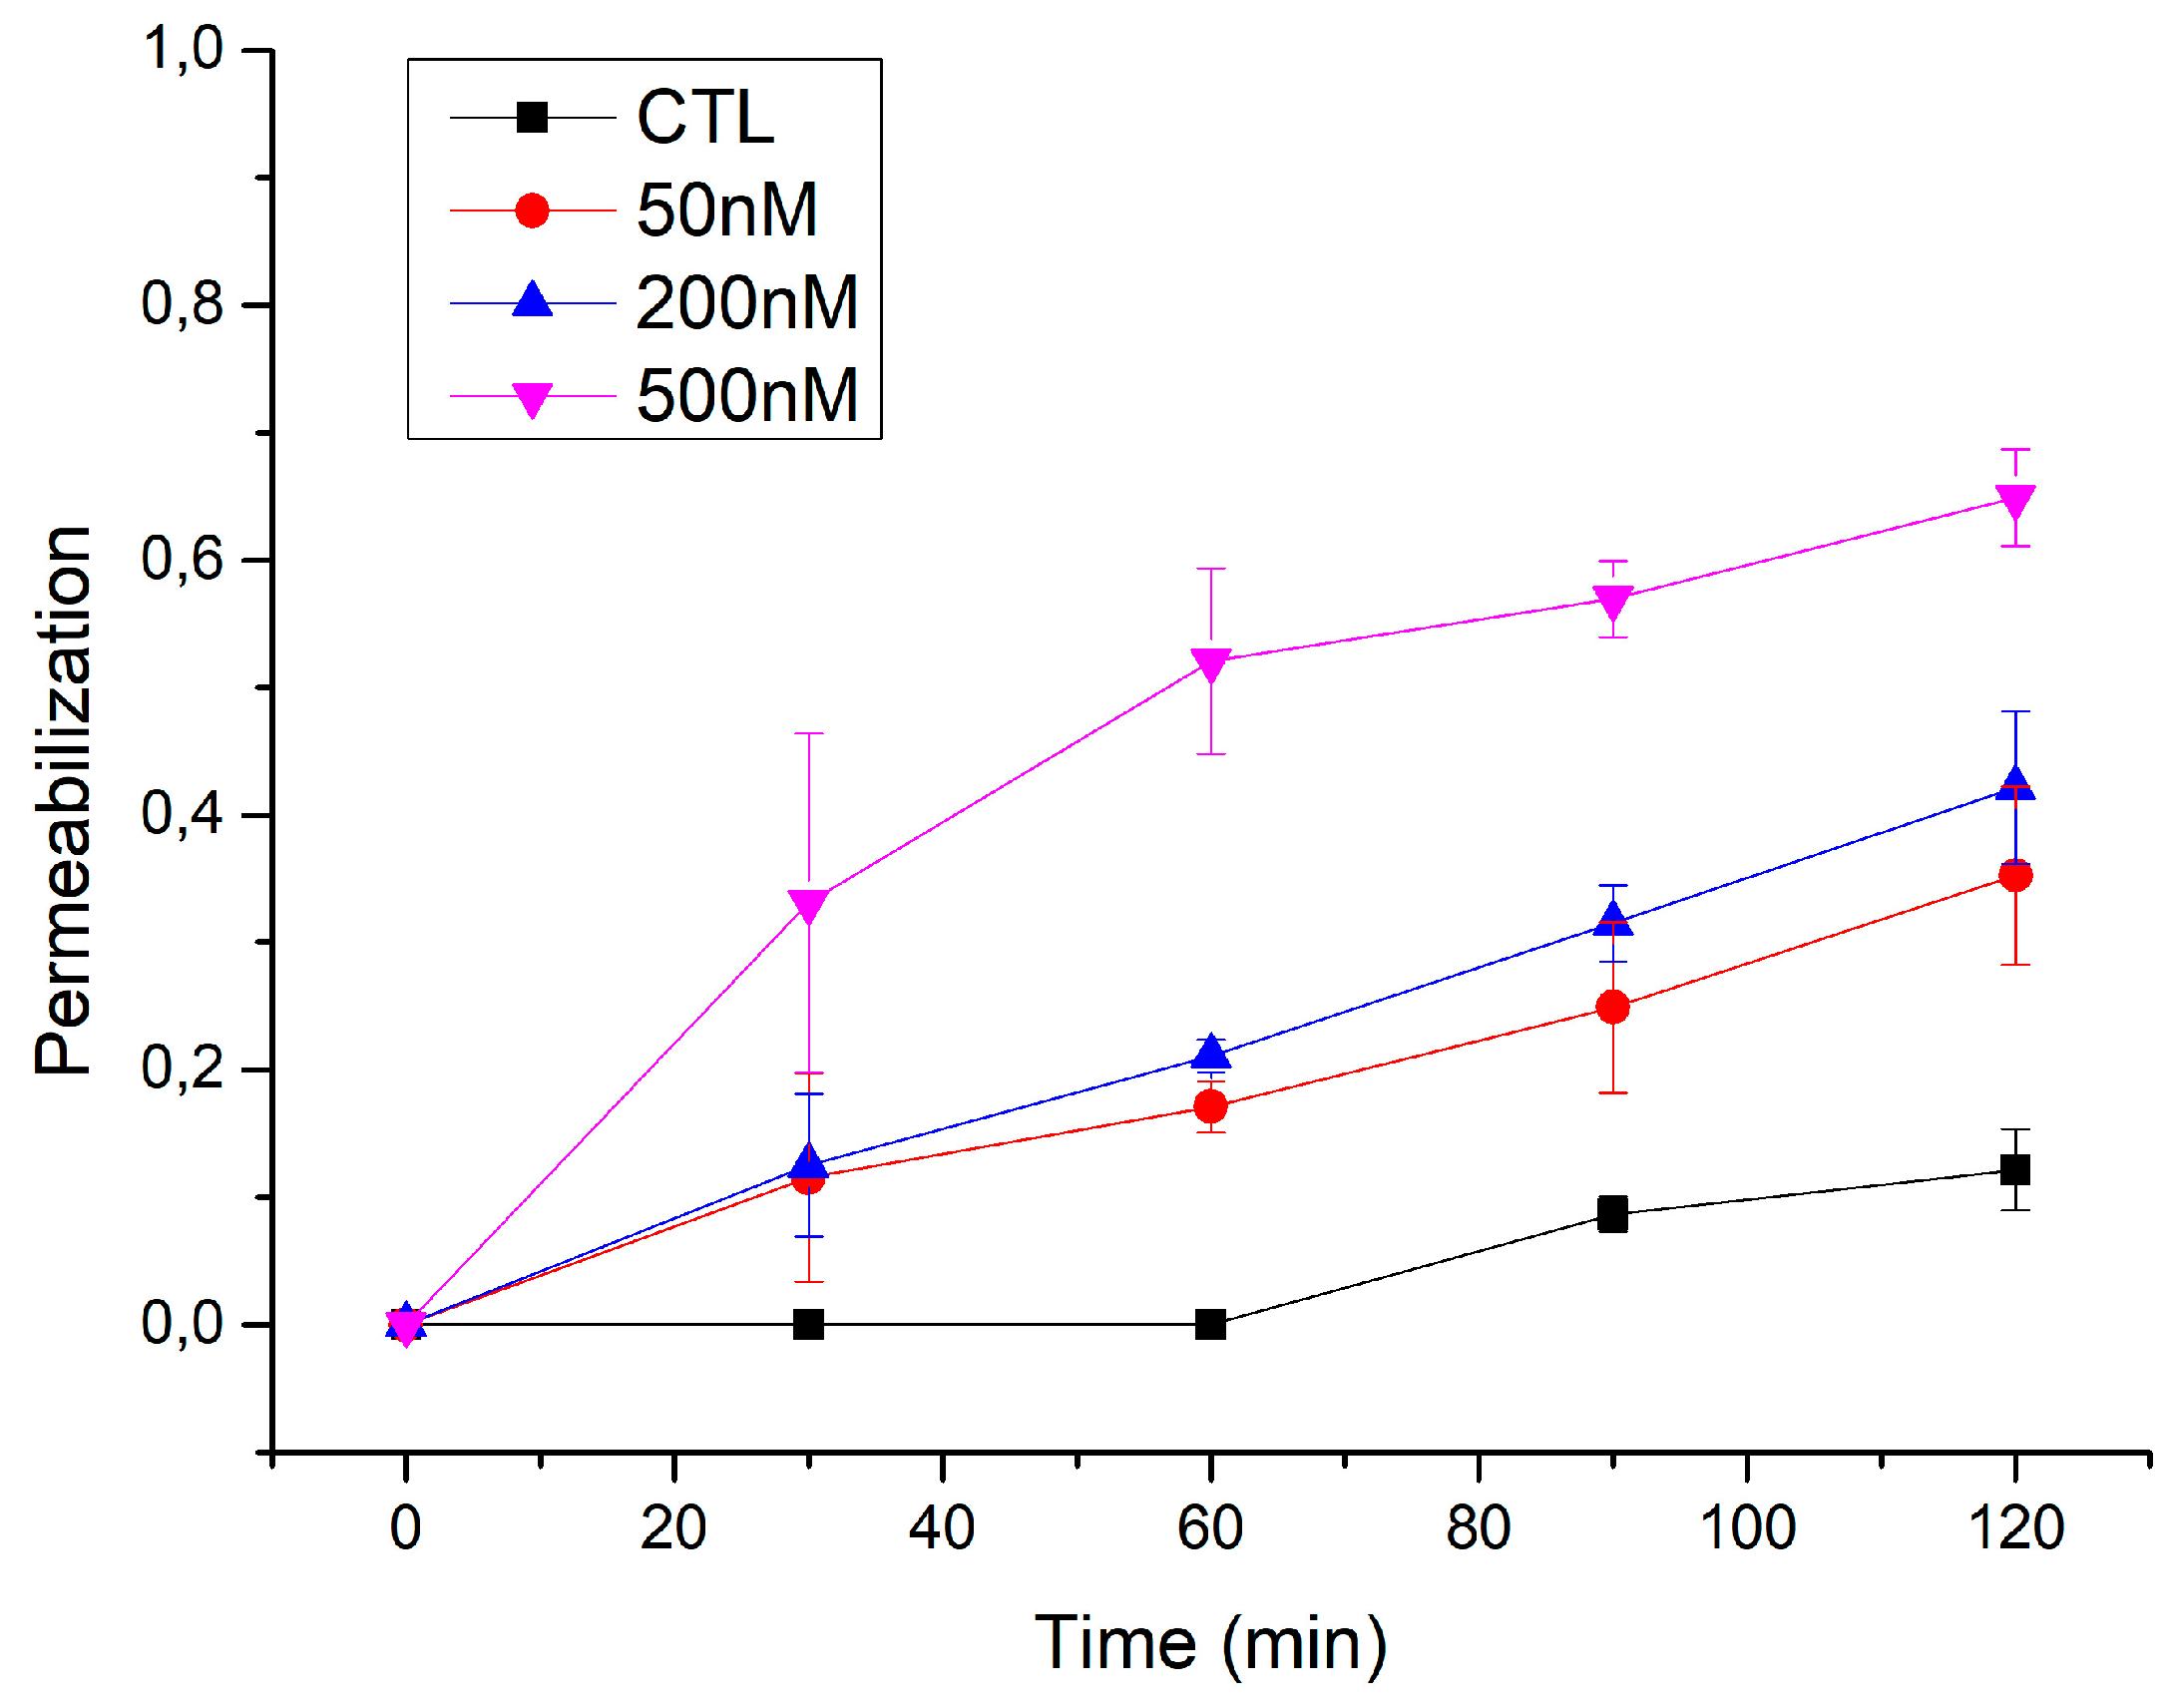
3.2. ACT Forms Growing-Size Pores, Which Depend on Toxin Concentration and Incubation Time
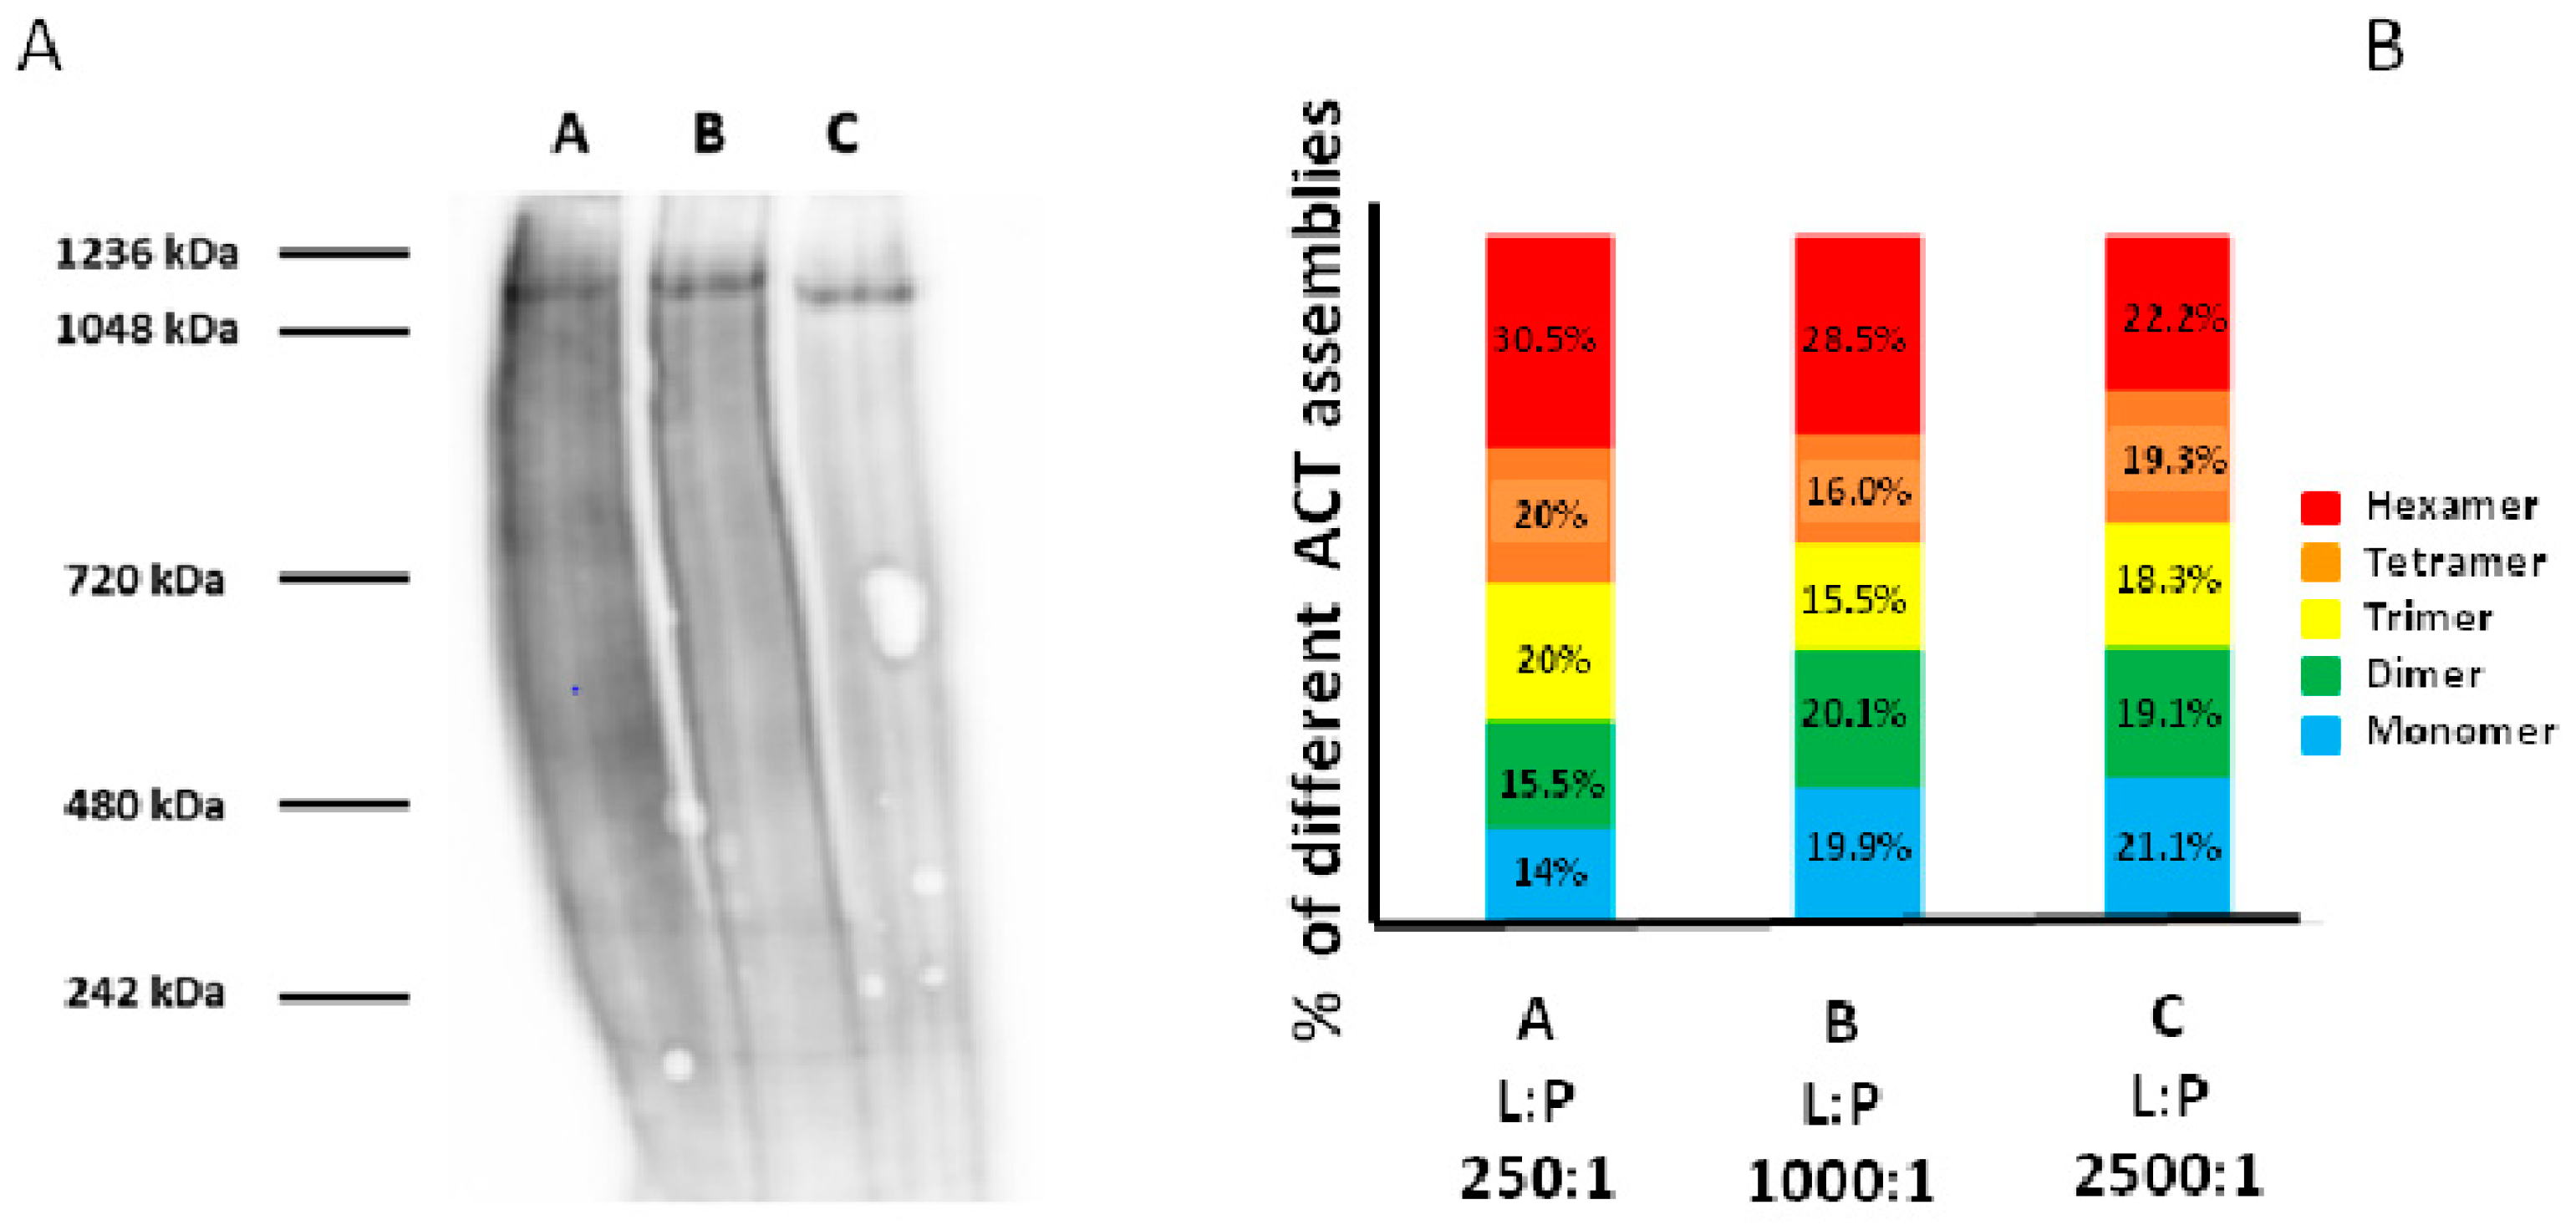
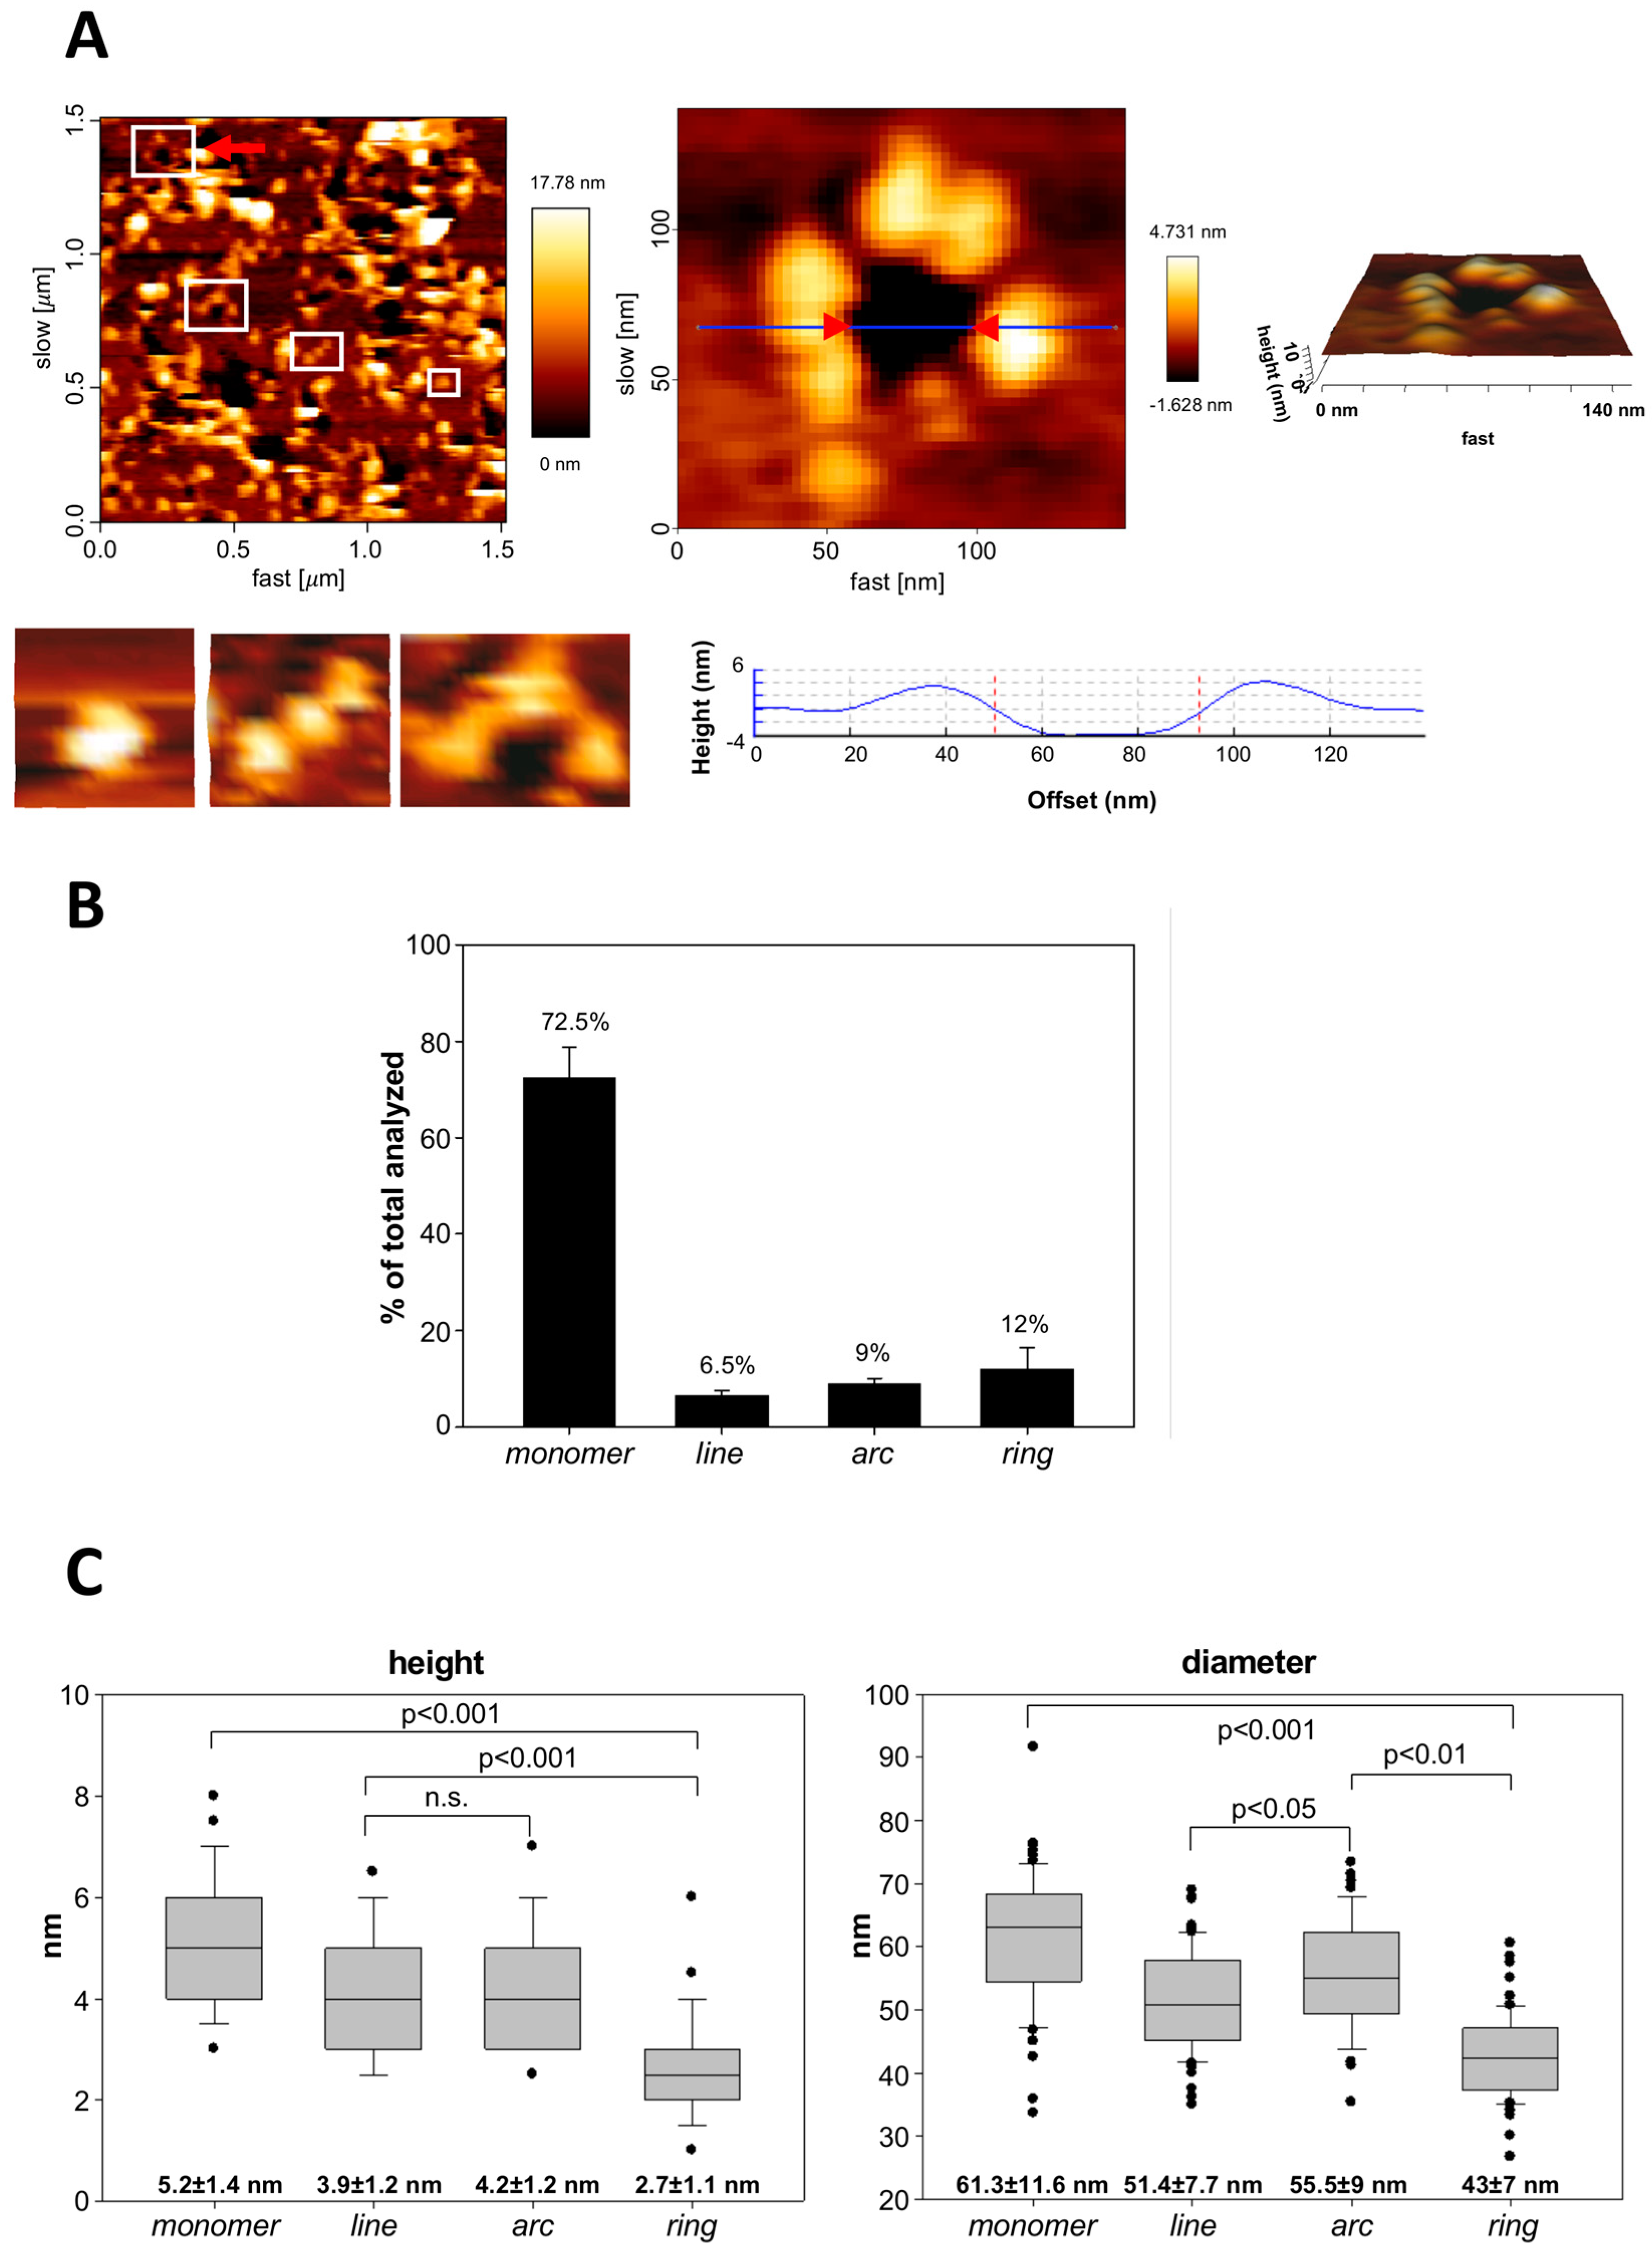
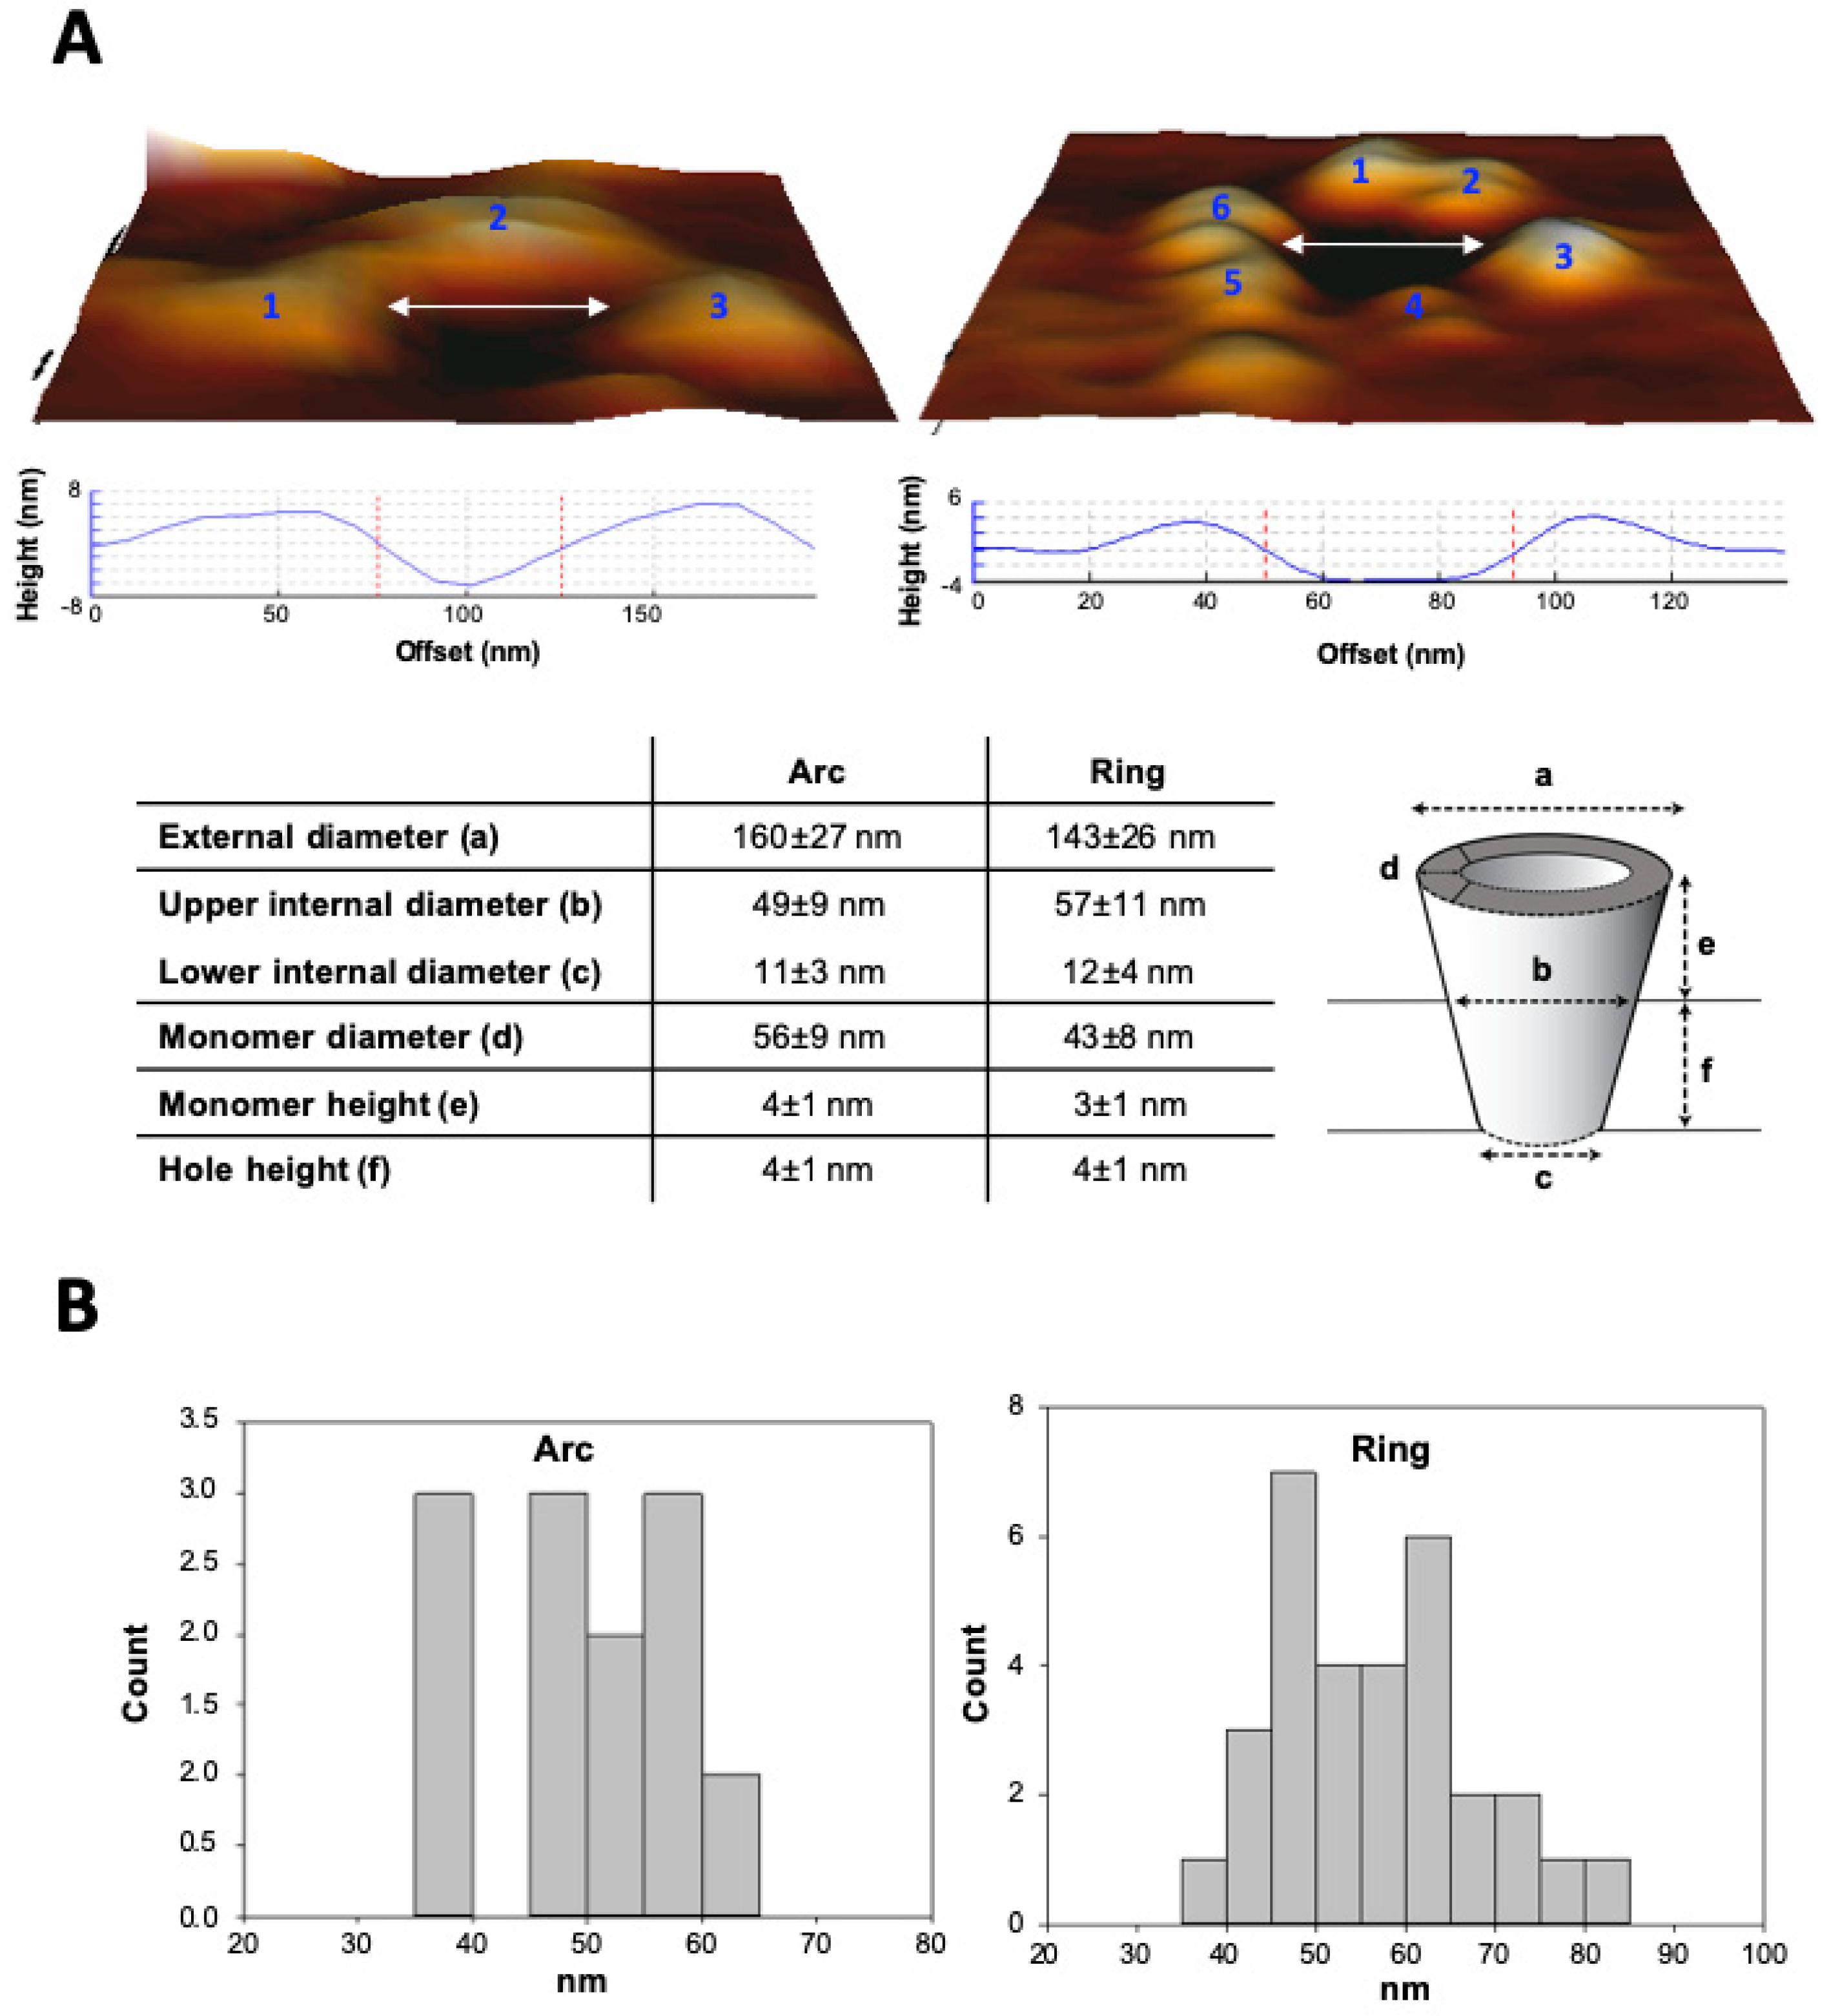
3.3. Analysis by BN-PAGE and AFM of ACT Assemblies in Phosphatidylcholine Membranes
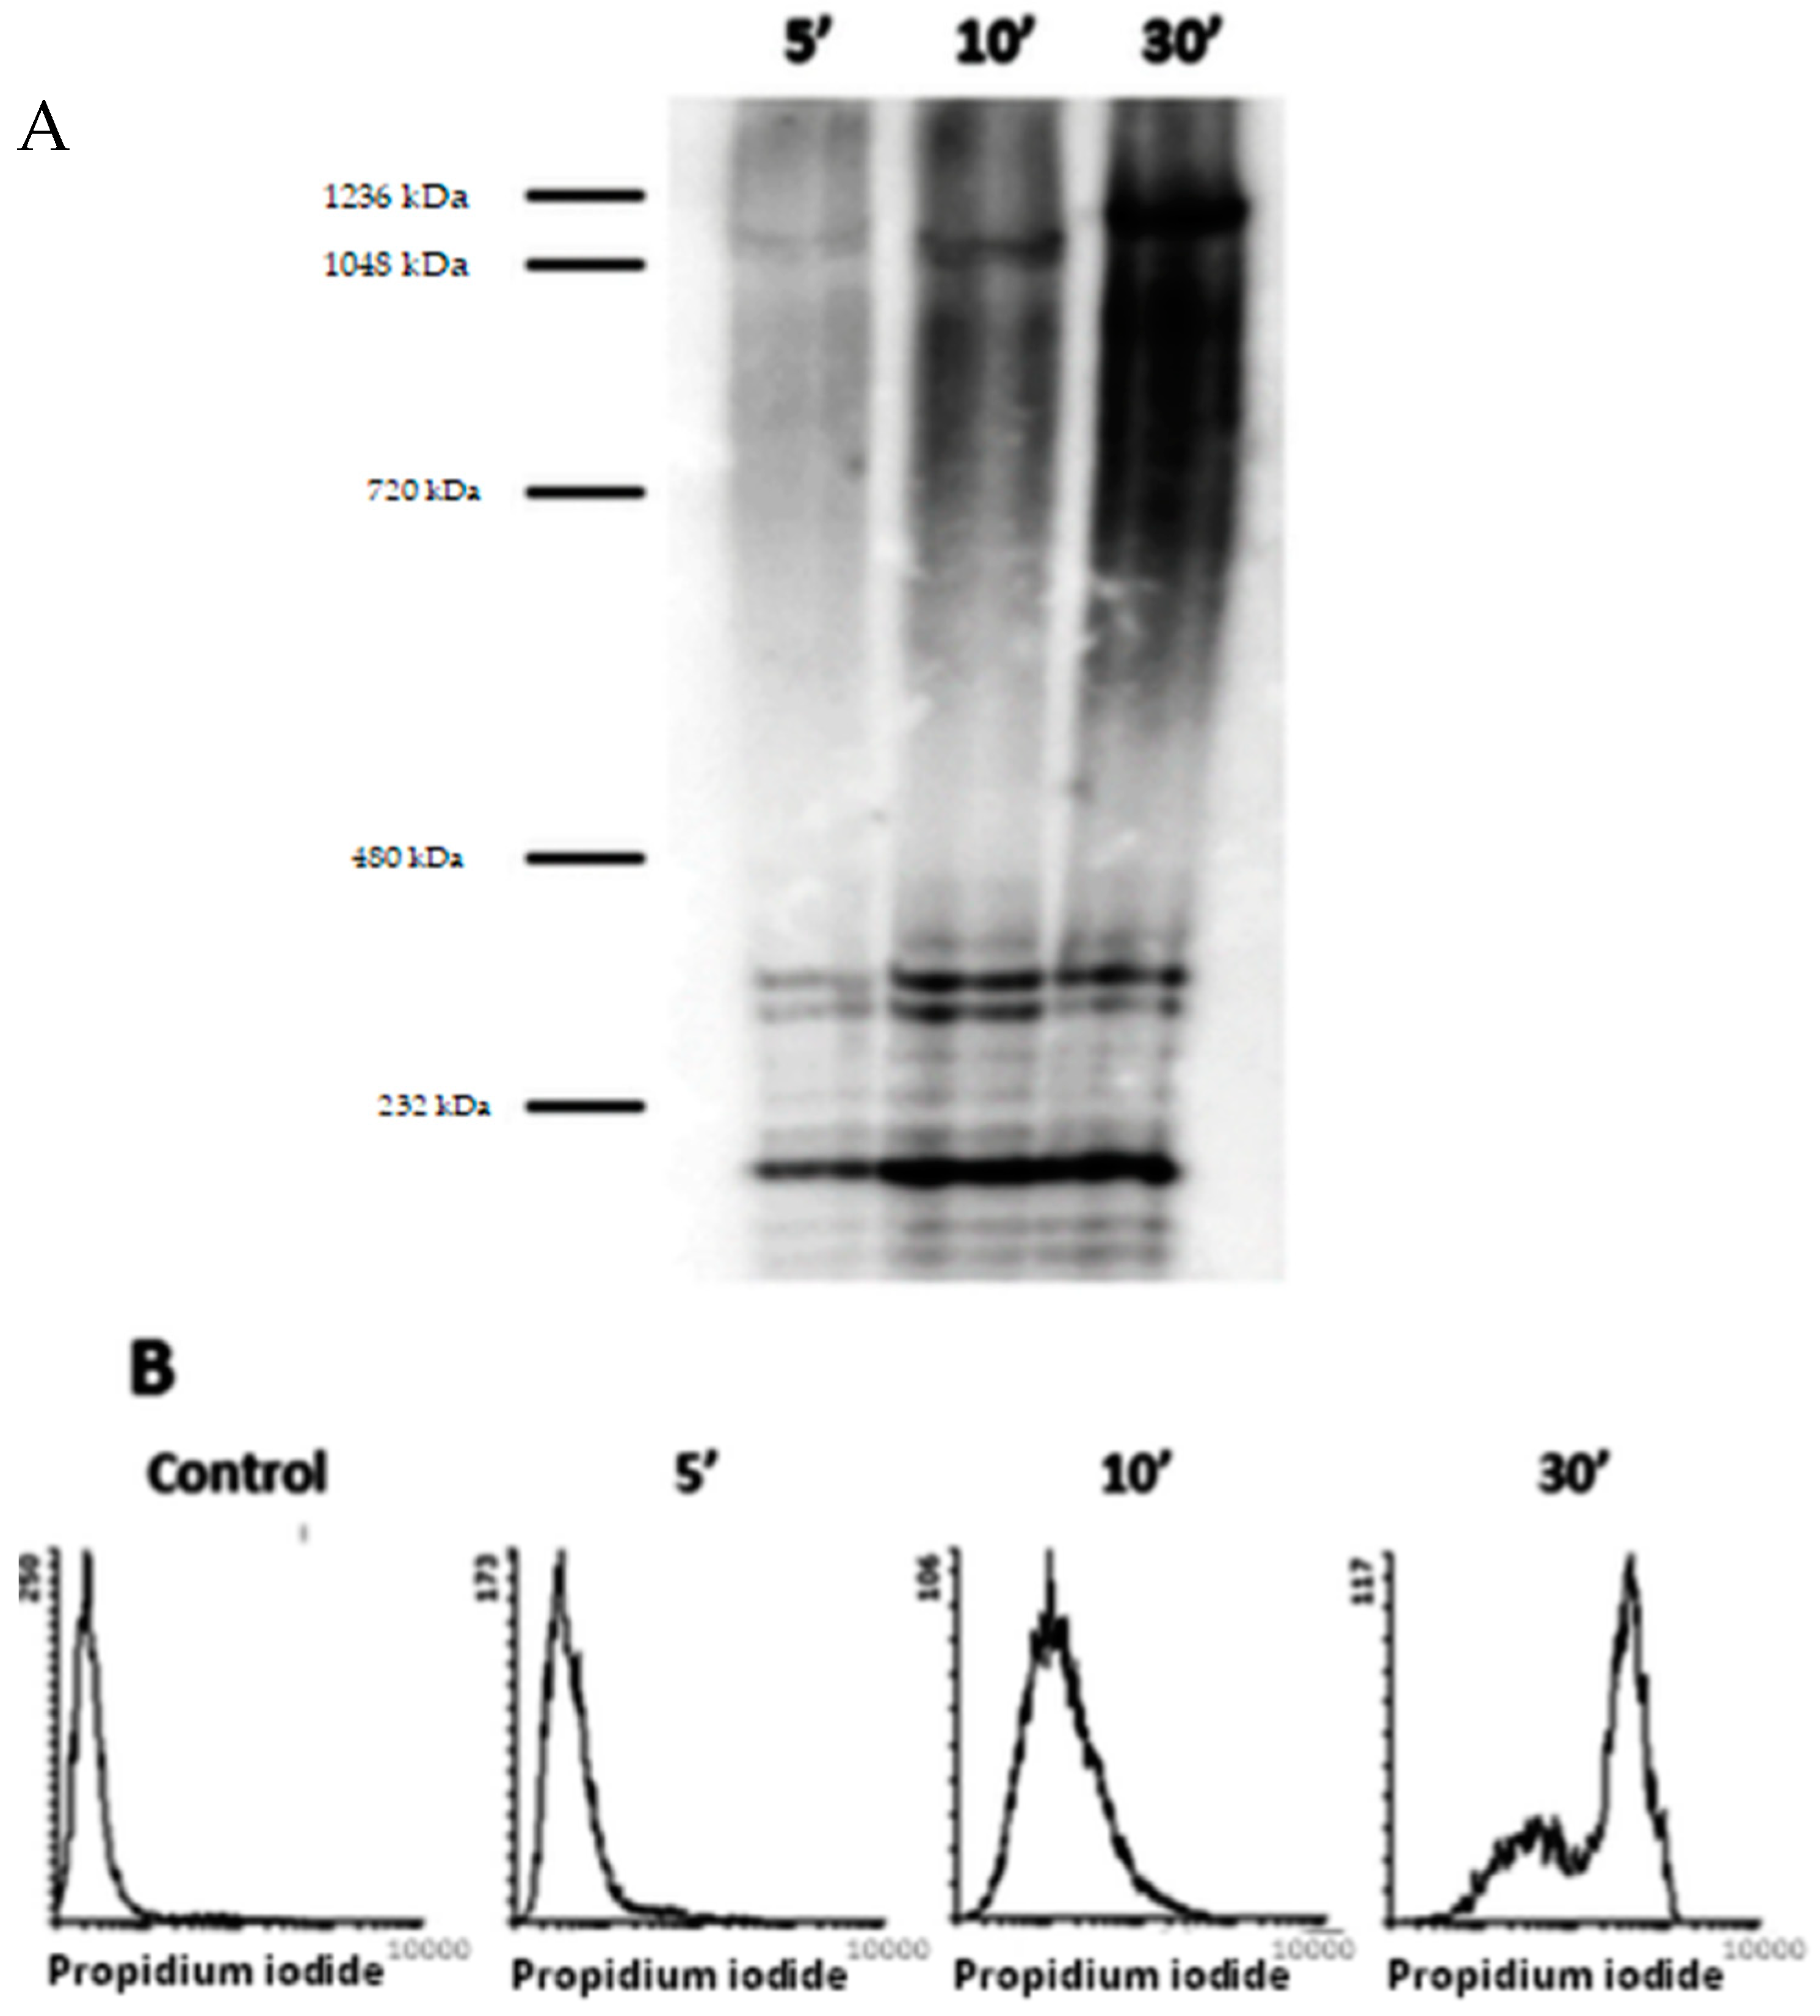
3.4. Permeabilization of Target Macrophages by ACT Directly Correlates with the Toxin Assembly into Oligomers of Variable Stoichiometry
4. Discussion
Supplementary Materials
Author Contributions
Funding
Acknowledgments
Conflicts of Interest
References
- Carbonetti, N.H. Pertussis toxin and adenylate cyclase toxin: Key virulence factors of Bordetella pertussis and cell biology tools. Future Microbiol. 2010, 5, 455–469. [Google Scholar] [CrossRef] [PubMed]
- Mattoo, S.; Cherry, J.D. Molecular pathogenesis, epidemiology, and clinical manifestations of respiratory infections due to Bordetella pertussis and other Bordetella subspecies. Clin. Microbiol. Rev. 2005, 18, 326–382. [Google Scholar] [CrossRef]
- Welch, R.A. Pore-forming cytolysins of gram-negative bacteria. Mol. Microbiol. 1991, 5, 521–528. [Google Scholar] [CrossRef]
- Welch, R.A. RTX toxin structure and function: A story of numerous anomalies and few analogies in toxin biology. Curr. Top Microbiol. Immunol. 2000, 257, 85–111. [Google Scholar]
- Ladant, D.; Ullmann, A. Bordetella pertussis adenylate cyclase: A toxin with multiple talents. Trends Microbiol. 1999, 7, 172–176. [Google Scholar] [CrossRef]
- Hackett, M.; Guo, L.; Shabanowitz, J.; Hunt, D.F.; Hewlett, E.L. Internal lysine palmitoylation in adenylate cyclase toxin from Bordetella pertussis. Science 1994, 266, 433–435. [Google Scholar] [CrossRef] [PubMed]
- Berkowitz, S.A.; Goldhammer, A.R.; Hewlett, E.L.; Wolff, J. Activation of prokaryotic adenylate cyclase by calmodulin. Ann. N Y Acad. Sci. 1980, 356, 360. [Google Scholar] [CrossRef] [PubMed]
- Vojtova, J.; Kamanova, J.; Sebo, P. Bordetella adenylate cyclase toxin: A swift saboteur of host defense. Curr. Opin. Microbiol. 2006, 9, 69–75. [Google Scholar] [CrossRef]
- Rose, T.; Sebo, P.; Bellalou, J.; Ladant, D. Interaction of calcium with Bordetella pertussis adenylate cyclase toxin. Characterization of multiple calcium-binding sites and calcium-induced conformational changes. J. Biol. Chem. 1995, 270, 26370–26376. [Google Scholar] [CrossRef] [PubMed]
- Hewlett, E.L.; Gray, L.; Allietta, M.; Ehrmann, I.; Gordon, V.M.; Gray, M.C. Adenylate cyclase toxin from Bordetella pertussis. Conformational change associated with toxin activity. J. Biol. Chem. 1991, 266, 17503–17508. [Google Scholar] [PubMed]
- Hanski, E.; Farfel, Z. Bordetella pertussis invasive adenylate cyclase. Partial resolution and properties of its cellular penetration. J. Biol. Chem. 1985, 260, 5526–5532. [Google Scholar] [PubMed]
- Guermonprez, P.; Khelef, N.; Blouin, E.; Rieu, P.; Ricciardi-Castagnoli, P.; Guiso, N.; Ladant, D.; Leclerc, C. The adenylate cyclase toxin of Bordetella pertussis binds to target cells via the alpha(M)beta(2) integrin (CD11b/CD18). J. Exp. Med. 2001, 193, 1035–1044. [Google Scholar] [CrossRef] [PubMed]
- González-Bullón, D.; Uribe, K.B.; Martín, C.; Ostolaza, H. Phospholipase A activity of adenylate cyclase toxin mediates translocation of its adenylate cyclase domain. Proc. Natl. Acad. Sci. USA 2017, 114, E6784–E6793. [Google Scholar] [CrossRef]
- Ostolaza, H.; Martín, C.; González-Bullón, D.; Uribe, K.B.; Etxaniz, A. Understanding the mechanism of translocation of adenylate cyclase toxin across biological membranes. Toxins 2017, 9, 295. [Google Scholar] [CrossRef] [PubMed]
- Ehrmann, I.E.; Gray, M.C.; Gordon, V.M.; Gray, L.S.; Hewlett, E.L. Hemolytic activity of adenylate cyclase toxin from Bordetella pertussis. FEBS Lett. 1991, 278, 79–83. [Google Scholar] [PubMed]
- Szabo, G.; Gray, M.C.; Hewlett, E.L. Adenylate cyclase toxin from Bordetella pertussis produces ion conductance across artificial lipid bilayers in a calcium- and polarity-dependent manner. J. Biol. Chem. 1994, 269, 22496–22499. [Google Scholar] [PubMed]
- Benz, R.; Maier, E.; Ladant, D.; Ullmann, A.; Sebo, P. Adenylate cyclase toxin (CyaA) of Bordetella pertussis. Evidence for the formation of small ion-permeable channels and comparison with HlyA of Escherichia coli. J. Biol. Chem. 1994, 269, 27231–27239. [Google Scholar] [PubMed]
- Gray, M.; Szabo, G.; Otero, A.S.; Gray, L.; Hewlett, E. Distinct mechanisms for K+ efflux, intoxication, and hemolysis by Bordetella pertussis AC toxin. J. Biol. Chem. 1998, 273, 18260–18267. [Google Scholar] [CrossRef]
- Vojtova-Vodolanova, J.; Basler, M.; Osicka, R.; Knapp, O.; Maier, E.; Cerny, J.; Benada, O.; Benz, R.; Sebo, P. Oligomerization is involved in pore formation by Bordetella adenylate cyclase toxin. FASEB J. 2009, 23, 2831–2843. [Google Scholar] [CrossRef]
- Martín, C.; Requero, M.; Masin, J.; Konopasek, I.; Goñi, F.M.; Sebo, P.; Ostolaza, H. Membrane restructuring by Bordetella pertussis adenylate cyclase toxin, a member of the RTX toxin family. J. Bacteriol. 2004, 186, 3760–3765. [Google Scholar] [CrossRef]
- Moayeri, M.; Welch, R.A. Effects of temperature, time, and toxin concentration on lesion formation by the Escherichia coli hemolysin. Infect. Immun. 1994, 62, 4124–4134. [Google Scholar]
- Brown, A.C.; Boesze-Battaglia, K.; Du, Y.; Stefano, F.P.; Kieba, I.R.; Epand, R.F.; Kakalis, L.; Yeagle, P.L.; Epand, R.M.; Lally, E.T. Aggregatibacter actinomycetemcomitans leukotoxin cytotoxicity occurs through bilayer destabilization. Cell Microbiol. 2012, 14, 869–881. [Google Scholar] [CrossRef]
- Bakás, L.; Chanturiya, A.; Herlax, V.; Zimmerberg, J. Paradoxical lipid dependence of pores formed by the Escherichia coli a-hemolysin in planar phospholipid bilayer membranes. Biophys. J. 2006, 91, 3748–3755. [Google Scholar] [CrossRef]
- Karst, J.C.; Ntsogo Enguene, V.Y.; Cannella, S.E.; Subrini, O.; Hessel, A.; Debard, S.; Ladant, D.; Chenal, A. Calcium, acylation, and molecular confinement favor folding of Bordetella pertussis adenylate cyclase CyaA toxin into a monomeric and cytotoxic form. J. Biol. Chem. 2014, 289, 30702–30716. [Google Scholar] [CrossRef]
- Angelova, M.I.; Dimitrov, D.S. Liposome electroformation. Faraday Discuss Chem. Soc. 1986, 81, 303–311. [Google Scholar] [CrossRef]
- Bagatolli, L.A.; Gratton, E. Two-photon fluorescence microscopy observation of shape changes at the phase transition in phospholipid giant unilamellar vesicles. Biophys. J. 1999, 77, 2090–2101. [Google Scholar] [CrossRef]
- Montes, L.; Alonso, A.; Goñi, F.M.; Bagatolli, L.A. Giant unilamellar vesicles electroformed from native membranes and organic lipid mixtures under physiological conditions. Biophys. J. 2007, 93, 3548–3554. [Google Scholar] [CrossRef]
- Schindelin, J.; Arganda-Carreras, I.; Frise, E.; Kaynig, V.; Longair, M.; Pietzsch, T.; Preibisch, S.; Rueden, C.; Saalfeld, S.; Schmid, B.; et al. Fiji: An open-source platform for biological-image analysis. Nat. Methods 2012, 9, 676–682. [Google Scholar] [CrossRef]
- McConnell, H.M.; Watts, T.H.; Weis, R.M.; Brian, A.A. Supported planar membranes in studies of cell-cell recognition in the immune system. Biochim. Biophys. Acta Rev. Biomembr. 1986, 864, 95–106. [Google Scholar] [CrossRef]
- Hope, M.J.; Bally, M.B.; Webb, G.; Cullis, P.R. Production of large unilamellar vesicles by a rapid extrusion procedure. Characterization of size distribution, trapped volume and ability to maintain a membrane potential. Biochim. Biophys. Acta Biomembr. 1985, 812, 55–65. [Google Scholar] [CrossRef]
- Spearman, P.; Horton, R.; Ratner, L.; Kuli-Zade, I. Membrane binding of human immunodeficiency virus type 1 matrix protein in vivo supports a conformational myristyl switch mechanism. J. Virol. 1997, 71, 6582–6592. [Google Scholar]
- Wittig, I.; Braun, H.; Schägger, H. Blue native PAGE. Nat. Protoc. 2006, 1, 418–428. [Google Scholar] [CrossRef]
- Mukaka, M.M. Statistics corner: A guide to appropriate use of correlation coefficient in medical research. Malawi Med. J. 2012, 24, 69–71. [Google Scholar]
- Bleicken, S.; Landeta, O.; Landajuela, A.; Basañez, G.; García-Sáez, A.J. Proapoptotic Bax and Bak proteins form stable protein-permeable pores of tunable size. J. Biol. Chem. 2013, 288, 33241–33252. [Google Scholar] [CrossRef] [PubMed]
- Apellániz, B.; Nieva, J.L.; Schwille, P.; García-Sáez, A.J. All-or-none versus graded: Single-vesicle analysis reveals lipid composition effects on membrane permeabilization. Biophys. J. 2010, 99, 3619–3628. [Google Scholar] [CrossRef] [PubMed]
- Schön, P.; García-Sáez, A.J.; Malovrh, P.; Bacia, K.; Anderluh, G.; Schwille, P. Equinatoxin II permeabilizing activity depends on the presence of sphingomyelin and lipid phase coexistence. Biophys. J. 2008, 95, 691–698. [Google Scholar] [CrossRef] [PubMed]
- Ruan, Y.; Rezelj, S.; Bedina Zavec, A.; Anderluh, G.; Scheuring, S. Listeriolysin O Membrane Damaging Activity Involves Arc Formation and Lineaction–Implication for Listeria monocytogenes Escape from Phagocytic Vacuole. PLoS Pathog. 2016, 12. [Google Scholar] [CrossRef] [PubMed]
- Heyman, N.S.; Burt, J.M. Hindered diffusion through an aqueous pore describes invariant dye selectivity of Cx43 junctions. Biophys. J. 2008, 94, 840–854. [Google Scholar] [CrossRef] [PubMed]
- Masin, J.; Fiser, R.; Linhartova, I.; Osicka, R.; Bumba, L.; Hewlett, E.L.; Benz, R.; Sebo, P. Differences in purinergic amplification of osmotic cell lysis by the pore-forming RTX toxins Bordetella pertussis CyaA and Actinobacillus pleuropneumoniae ApxIA: The role of pore size. Infect. Immun. 2013, 81, 4571–4582. [Google Scholar] [CrossRef] [PubMed]
- Fuertes, G.; Giménez, D.; Esteban-Martín, S.; Sánchez-Muñoz, O.L.; Salgado, J. A lipocentric view of peptide-induced pores. Eur. Biophys. J. 2011, 40, 399–415. [Google Scholar] [CrossRef]
- Cannella, S.E.; Ntsogo Enguéné, V.Y.; Davi, M.; Malosse, C.; Sotomayor Pérez, A.C.; Chamot-Rooke, J.; Vachette, P.; Durand, D.; Ladant, D.; Chenal, A. Stability, structural and functional properties of a monomeric, calcium-loaded adenylate cyclase toxin, CyaA, from Bordetella pertussis. Sci. Rep. 2017, 7, 42065. [Google Scholar] [CrossRef] [PubMed]
- Van Meer, G.; Voelker, D.R.; Feigenson, G.W. Membrane lipids: Where they are and how they behave. Nat. Rev. Mol. Cell Biol. 2008, 9, 112–124. [Google Scholar] [CrossRef] [PubMed]
- Lomize, A.L.; Pogozheva, I.D.; Mosberg, H.I. Anisotropic solvent model of the lipid bilayer. 2. Energetics of insertion of small molecules, peptides, and proteins in membranes. J. Chem. Inf. Model 2011, 51, 930–946. [Google Scholar] [CrossRef] [PubMed]
- Hewlett, E.L.; Donato, G.M.; Gray, M.C. Macrophage cytotoxicity produced by adenylate cyclase toxin from Bordetella pertussis: More than just making cyclic AMP! Mol. Microbiol. 2006, 59, 447–459. [Google Scholar] [CrossRef] [PubMed]
- Terrones, O.; Antonsson, B.; Yamaguchi, H.; Wang, H.; Liu, J.; Lee, R.M.; Herrmann, A.; Basañez, G. Lipidic pore formation by the concerted action of proapoptotic BAX and tBID. J. Biol. Chem. 2004, 279, 30081–30091. [Google Scholar] [CrossRef] [PubMed]
- Fišer, R.; Konopásek, I. Different modes of membrane permeabilization by two RTX toxins: HlyA from Escherichia coli and CyaA from Bordetella pertussis. Biochim. Biophys. Acta Biomembr. 2009, 1788, 1249–1254. [Google Scholar] [CrossRef] [PubMed]
- Benz, R.; Hardie, K.R.; Hughes, C. Pore formation in artificial membranes by the secreted hemolysins of Proteus vulgaris and Morganella morganii. Eur. J. Biochem. 1994, 220, 339–347. [Google Scholar] [CrossRef] [PubMed]
- Tweten, R.K. Cholesterol-dependent cytolysins, a family of versatile pore-forming toxins. Infect. Immun. 2005, 73, 6199–6209. [Google Scholar] [CrossRef] [PubMed]
- Tweten, R.K.; Hotze, E.M.; Wade, K.R. The Unique Molecular Choreography of Giant Pore Formation by the Cholesterol-Dependent Cytolysins of Gram-Positive Bacteria. Annu. Rev. Microbiol. 2015, 69, 323–340. [Google Scholar] [CrossRef]
- Salvador-Gallego, R.; Mund, M.; Cosentino, K.; Schneider, J.; Unsay, J.; Schraermeyer, U.; Engelhardt, J.; Ries, J.; García-Sáez, A.J. Bax assembly into rings and arcs in apoptotic mitochondria is linked to membrane pores. EMBO J. 2016, 35, 389–401. [Google Scholar] [CrossRef]
- Cosentino, K.; Ros, U.; García-Sáez, A.J. Assembling the puzzle: Oligomerization of α-pore forming proteins in membranes. Biochim. Biophys. Acta (BBA) Biomembr. 2016, 1858, 457–466. [Google Scholar] [CrossRef]


© 2019 by the authors. Licensee MDPI, Basel, Switzerland. This article is an open access article distributed under the terms and conditions of the Creative Commons Attribution (CC BY) license (http://creativecommons.org/licenses/by/4.0/).
Share and Cite
González-Bullón, D.; B. Uribe, K.; Largo, E.; Guembelzu, G.; García-Arribas, A.B.; Martín, C.; Ostolaza, H. Membrane Permeabilization by Bordetella Adenylate Cyclase Toxin Involves Pores of Tunable Size. Biomolecules 2019, 9, 183. https://doi.org/10.3390/biom9050183
González-Bullón D, B. Uribe K, Largo E, Guembelzu G, García-Arribas AB, Martín C, Ostolaza H. Membrane Permeabilization by Bordetella Adenylate Cyclase Toxin Involves Pores of Tunable Size. Biomolecules. 2019; 9(5):183. https://doi.org/10.3390/biom9050183
Chicago/Turabian StyleGonzález-Bullón, David, Kepa B. Uribe, Eneko Largo, Garazi Guembelzu, Aritz B. García-Arribas, César Martín, and Helena Ostolaza. 2019. "Membrane Permeabilization by Bordetella Adenylate Cyclase Toxin Involves Pores of Tunable Size" Biomolecules 9, no. 5: 183. https://doi.org/10.3390/biom9050183