Article

A Theoretical Study of Scattering of e± by Tl Atom

1
Atomic and Molecular Physics Laboratory, Department of Physics, University of Rajshahi, Rajshahi 6205, Bangladesh
2
Division of Radiation Protection and Safety Control, Cyclotron and Radioisotope Center, Tohoku University, 6-3 Aoba, Aramaki, Aoba, Sendai 980-8578, Japan
*
Authors to whom correspondence should be addressed.
Atoms 2023, 11(2), 37; https://doi.org/10.3390/atoms11020037
Submission received: 3 January 2023 / Revised: 3 February 2023 / Accepted: 5 February 2023 / Published: 10 February 2023
(This article belongs to the Section Atomic, Molecular and Nuclear Spectroscopy and Collisions)

Abstract

:
This article incorporates details of our calculations of the observable quantities for the scattering of electrons and positrons from a post transition metal Thallium (Tl), in the energy range of 1 eV ≤ E i ≤ 1 MeV, using the relativistic Dirac partial wave (phase-shift) analysis employing a complex optical-potential. Absolute differential, integrated elastic and inelastic, transport, total ionization, and total cross sections and a thorough study of the critical minima in the elastic differential cross sections along with the associated angular positions of the maximum polarization points in the Sherman function are provided to study the collision dynamics. The optical potential model incorporates the interactions of the incident electron and/or positron with both the nucleus and the bound electrons of the target atom. In-depth analyses of the spin asymmetry, which are sensitive to phases related interference effect, brought on by the various ingredients of the lepton-atom interaction, are also presented. The performance of the current approach to explain the observations, with the exception of the extremely low energy domain, is shown by a comparison of the previous experimental and theoretical results on this target atom.

1. Introduction

The projectile–atom scattering has both fundamental as well as practical importance. Almost the entire knowledge about the interactions between the elementary particles composing the universe and the structure of matter in bulk is gathered from the scattering studies using both theoretical and experimental methods which complement each other for the improvement of scientific cognizance. The scattering data of e±–atom collision has drawn interest in many areas of science and technology. These cross sections are essential in many practical fields, including plasma physics, astrophysics, materials science, radiation dosimetry, atmospheric physics, and surface electron spectroscopy, in addition to their basic significance [1,2,3,4,5,6,7,8]. The accurate e-atom cross section data are required in plasma physics for the parameters used in the plasma diagnostic and modeling techniques [9,10]. Scattering cross sections assist to explore the spectrum and chemical composition as well as to determine various astrophysical objects and their abundances [11,12,13]. On the other hand, positron scattering is an important tool in medical and materials science. The positron emission tomography (PET) [14] is used to diagnose cancer and the disorderedness of certain brain functions. To study and characterize the defects in material systems, positron annihilation spectroscopy is used [15,16]. Positron scattering also have applications in astrophysics [17], nanoscience [18] and plasma physics [19]. Positron scattering data are extremely important for understanding the theoretical correlation of electrons in solids, in addition to its practical applications. In order to comprehend the electron–atom scattering and to offer accurate computations of the reported positron measurements, the theory of positron scattering is also under new demands. To understand the internal atomic structure and to explain the e ± –atom collision, accurate knowledge about various scattering observables is required. The data about the various scattering observables are also in great demand in many areas of science, technology and industry [20,21,22,23,24,25,26,27,28] such as Auger electron spectroscopy, electron microscopy, electron probe microanalysis, etc. The study of critical minima (CM) [7,29] is beneficial as the degree of polarization of the scattered projectile attains its maximum in the vicinity of these CMs. The knowledge of CM is also important to investigate the parity violation in high-energy physics and thin-film research [30].
Thallium (Tl) is a soft, malleable, bluish-white metal. It has high demand in nuclear medicine for various applications such as radiation dosimetry, cardiac imaging, kidney studies, tumor diagnosis and others. Additionally, thallium is used in the production of electrons, low-temperature thermometers, optical lenses, and other items [31,32]. Moreover, the discovery of high-temperature superconductor ceramic compound increases the demand of thallium [33].
Although Tl has a significant demand in various fields, there is no sufficient work on the scattering of e±–Tl that can provide enough information. In 1987, Kaussen et al. [34] carried out an experiment on spin polarization in elastic scattering of electron from Tl atoms over an energy range of 6 eV to 180 eV. In 1986, Haberland and Fritsche [35] performed first-principle calculations on the elastic scattering of low-energy electrons by TI atoms. Tawara and Kato [36] compiled the total and partial ionization cross sections (ICS) for the e–Tl system. Mayol and Salvat [37] reported electron impact integrated elastic cross sections (IECSs), momentum transfer cross sections (MTCSs), and viscosity cross sections (VCSs) for the elements of atomic number z = 1–92 at incident energies from 100 eV to 1 GeV using the Dirac–Hartree–Fock (DHF) electron density. Dapor and Miotello [38] presented differential cross sections (DCSs), IECSs, MTCSs, and VCSs at incident energies ranging from 500 eV to 4000 eV for the elements of atomic number Z = 1–92 for positron scattering using Dirac–Hatree–Fock–Slater atomic potential.
The review of the earlier works reveals that the literature lacks works in eV to MeV order of energies and not a single article covers all the features of the e±–Tl scattering over a broad energy domain up to the MeV order. Moreover, neither any experimental nor theoretical study is concerned with the investigation of critical minima (CM) in DCS distributions of this target of interest. Therefore, the scope and interest effectiveness of the study of this scattering covering the all-out features up to MeV order still remain. Moreover, testing this easy procedure for the production of data for this system might be another interesting point of investigation.
In this study, we investigate the DCS, IECS, MTCS, VCS, inelastic cross section (INCS), total ionization cross section (TICS), total cross section (TCS) along with the spin asymmetry parameters S, U and T for both electron and positron scattering from Tl in the energy region from 1 eV to 1 MeV. In addition, we present here systematically the comprehensive analysis of CMs in the elastic DCSs. This work employs a theoretical approach based on the relativistic Dirac partial wave (phase-shift) analysis with different collision dynamics using a complex optical model potential (OPM) [4,7,29]. The OPM incorporates the interactions of the incident lepton with both the nucleus and the bound electrons of the target atom. Static, exchange, polarization, and absorption potentials are all included in the optical potential (OP), which is used in our OPM theory. The outcome of the present OPM theory for various scattering observables are compared to the results of available experimental and theoretical research.

2. Outline of the Theory

2.1. The Relativistic Dirac Equation

A projectile moving with the velocity v in a central field V ( r ) can be expressed by using the relativistic Dirac equation as
[ c α . p + β m 0 c 2 + V ( r ) ] ψ ( r ) = E ψ ( r ) .
Here, E = m 0 γ c 2 = E i + m 0 c 2 and m 0 are, respectively, the total energy and rest mass of the projectile, and γ = ( 1 v 2 / c 2 ) 1 / 2 . E i and c are, respectively, the kinetic energy of the projectile and velocity of light in vacuum. α and β represent the usual 4 × 4 Dirac matrices. The relativistic wave function ψ ( r ) , which is a four-component spinor with quantum numbers ( κ m ), represents the motion of scattered projectile and is given by
ψ E κ m ( r ) = 1 r P E κ ( r ) Ω κ , m ( r ^ ) i Q E κ ( r ) Ω κ , m ( r ^ ) .
Here, P E κ ( r ) and Q E κ ( r ) represent, respectively, the radial parts of the large and small components of the scattering wave function and Ω κ , m ( r ^ ) are the spherical spinors. The relativistic quantum number κ is defined as κ = ( l j ) ( 2 j + 1 ) , where l and j are the orbital and total angular momentum quantum number, respectively.
The large and small components, P E κ ( r ) and Q E κ ( r ) , respectively, satisfy the following set of coupled differential equations [39]:
d P E κ d r = κ r P E κ + E i V + 2 m 0 c 2 c Q E κ ,
d Q E κ d r = E i V c P E κ + κ r Q E κ .
The information about the scattering process that may be described in terms of the complex phase shift δ κ can be obtained from the asymptotic form of the large component P E κ ( r ) of the scattered wave function as
P E κ ( r ) sin k r l π 2 + δ κ .
Here, k is the relativistic wave-number of the projectile. Its relation with the kinetic energy E i is given as
k = p , ( c k ) 2 = E i ( E i + 2 m 0 c 2 ) .
Using the subroutine package RADIAL [40], the numerical solutions of the Equations (3) and (4) can be achieved.

2.2. Interaction Potential: The OPM Approach

To calculate various cross sections and other scattering observables for e±–Tl scattering, the Dirac relativistic equation is used in this study in the framework of OPM. Although the details of the theory are given in the past [41,42,43], these are given in the following for the convenience of readership.
The following form represents the optical potential of the projectile-atom interaction as reported by Salvat [41]
V ( r ) = V O P M ( r ) = V s t ( r ) + V e x ( r ) + V c p ( r ) i W a b s ( r ) .
Here, V s t ( r ) , V e x ( r ) and V c p ( r ) represent, respectively, the static, the exchange and the correlation polarization potential. The remaining term W a b s ( r ) is the modulus of the imaginary absorption potential. Since the incident positron is different from the bound target electrons, we employ the same optical potential as in (7) for positron scattering while leaving out the exchange component.
The static potential arises due to the Coulomb interaction between the projectile and target V s t ( r ) for the e±–Tl collision, which is given [44] by
V s t ( r ) = Z 0 e ϕ ( r ) = Z 0 e [ ϕ n ( r ) + ϕ e ( r ) ] ,
where Z 0 e is the charge of the projectile with Z 0 (−1 for electron and +1 for positron), and e represents the magnitude of the electronic charge.
As in [41], the electrostatic potential ϕ ( r ) is the sum of the electrostatic interactions due to the nucleus ϕ n ( r ) and the electron cloud ϕ e ( r ) . We have
ϕ n ( r ) = e 1 r 0 r ρ n ( r ) 4 π r 2 d r + r ρ n ( r ) 4 π r d r ,
and
ϕ e ( r ) = e 1 r 0 r ρ e ( r ) 4 π r 2 d r + r ρ e ( r ) 4 π r d r ,
where ρ n ( r ) and ρ e ( r ) , respectively, are the nuclear and electron charge densities.
For the bare nucleus, the pure Coulomb potential is V c ( r ) = Z 0 ϕ n ( r ) .
The semi-classical exchange potential V e x ( r ) for the e–Tl collision is taken from Furness and McCarthy [45], which is derived directly from the non-local exchange interaction by using a WKB-like approximation for the wave functions. This is
V e x ( r ) = 1 2 E i V s t ( r ) 1 2 { E i V s t ( r ) 2 + 4 π a 0 e 4 ρ e ( r ) } 1 / 2 .
Here, a 0 is the Bohr radius. The electronic density function ρ e ( r ) is calculated from the numerical Dirac–Fock (DF) wavefunctions given by Desclaux [46]. The function ρ e ( r ) satisfies the following normalization integral:
ρ e ( r ) 4 π r 2 d r = Z .
Here, Z is the atomic number of the target atom. In this study, we have chosen a global correlation polarization potential V c p ( r ) which is a combination of the parameter-free long-range polarization potential V c p s ( r ) of Sun et al. [47] and the local-density approximation (LDA) correlation potential V c o ( r ) . Accordingly, following [41], V c p ( r ) is given by
V c p ( r ) max { V c o ( r ) , V c p s ( r ) } if r < r c V c p s ( r ) if r r c .
where r c is the outer radius at which the short-range potential V c o ( r ) and the long-range potential V c p s ( r ) intersect first. The short-range potential V c o ( r ) , for electron and positron, are adopted from Perdew and Zunger [48] and Jain [49], respectively.
An imaginary component must be introduced to the OPM to account for the loss of flux from the incident channel to the inelastic channels. The semi-relativistic imaginary potential, developed by Salvat et al. [44], has been applied in the current investigation:
W a b s ( r ) = A a b s 2 v L ρ ( r ) σ b c ( E L , ρ , Δ ) 2 ( E L + m 0 c 2 ) 2 m 0 c 2 ( E L + m 0 c 2 ) 1 2 .
Here, v L = ( 2 E L / m o ) 1 / 2 is the velocity with which the projectile of rest mass m 0 interacts as if it were moving within a homogeneous gas of density ρ ( r ) with E L ( r ) = E i V s t ( r ) being the local kinetic energy of the electron. For both e–Tl and e+–Tl scattering, the value of the adjustable empirical parameter A a b s has been chosen as 2.0 . The energy gap Δ accounts for the fact that excitations of the target atom are possible only when the energy lost by the projectile is larger than the first inelastic threshold. For electron scattering, Δ is set equal to the first excitation energy ε 1 of the target atom. In the case of positron scattering, positronium formation is frequently the first inelastic channel to open. For atoms whose ionization potential I is larger than the positronium binding energy | E 1 s | 6.8 eV (such as the noble gases), the threshold energy for positronium formation is ϵ P s = I E 1 s . For atoms with I < 6.8 eV, positronium formation is possible at all energies, i.e., ϵ P s = 0 . Consequently, the default energy gap adopted in ELSEPA [44] is
Δ = ε 1 for electrons max ( I 6.8 e V , 0 ) for positrons .
Following [50], these values are taken as ε 1 = 0.97 eV and I = 6.1083 eV, respectively.
The direct part f ( θ ) and the spin–flip part g ( θ ) , of the scattering amplitude for electrons and positrons, respectively, employed in the OPM, are given [51], by
f ( θ ) = 1 2 i k l = 0 { ( l + 1 ) e ( 2 i δ ( l + 1 ) 1 + l e 2 i δ l 1 } P l ( cos θ ) ,
and
g ( θ ) = 1 2 i k l = 0 e 2 i δ l e 2 i δ ( l + 1 ) P l 1 ( cos θ ) .
Here, P l ( c o s θ ) and P l 1 ( c o s θ ) represent, respectively, the Legendre polynomials and associated Legendre functions. The elastic DCS for unpolarized particles in terms of f ( θ ) and g ( θ ) can be obtained as
d σ d Ω = | f ( θ ) | 2 + | g ( θ ) | 2 .
The integrated elastic, momentum transfer, viscosity and total cross sections are, respectively, expressed as
σ e l = d σ d Ω d Ω = 2 π 0 π d σ d Ω sin θ d θ ,
σ m = 2 π 0 π ( 1 cos θ ) d σ d Ω sin θ d θ ,
σ v = 3 π 0 π 1 cos θ 2 d σ d Ω sin θ d θ ,
and
σ t o t = 4 π k Im f ( 0 ) .
Here, Im f ( 0 ) denotes the imaginary part of the direct scattering amplitude in the forward direction at θ = 0 . Due to the presence of the imaginary portion of the optical potential, not only elastic but also inelastic (absorption) scattering happens throughout the scattering process. Consequently, the total cross section σ t o t for a given objective can be expressed as
σ i n e l = σ t o t σ e l .
Here, σ e l and σ i n e l represent, respectively, the elastic and inelastic cross-sections. The spin-polarization or Sherman function S ( θ ) and the spin asymmetry parameters T ( θ ) and U ( θ ) [52,53] in terms of f ( θ ) and g ( θ ) can be given as
S ( θ ) = i f ( θ ) g * ( θ ) f * ( θ ) g ( θ ) | f ( θ ) | 2 + | g ( θ ) | 2 ,
T ( θ ) = | f ( θ ) | 2 | g ( θ ) | 2 | f ( θ ) | 2 + | g ( θ ) | 2 ,
and
U ( θ ) = 2 I m [ f ( θ ) g * ( θ ) ] | f ( θ ) | 2 + | g ( θ ) | 2 .
The following conservation relation is satisfied by the three spin asymmetry parameters S ( θ ) , T ( θ ) and U ( θ ) as:
S 2 + T 2 + U 2 = 1 .
The excitation cross section σ e x and the ionization cross section σ i o n are added to create the inelastic cross section σ i n e l . This indicates that the σ i n e l is divided, and the relationship between σ i n e l and σ i o n can be expressed as
σ i n e l σ i o n .
The σ i o n can be obtained [54] using the ratio as
R ( E i ) = σ i o n ( E i ) σ i n e l ( E i )
where 0 R ( E i ) 1 . The ratio R ( E i ) for incident energy above the ionization potential can be calculated by fitting the equation:
R ( E i ) = 1 A B U + C + l n U U ,
where U = E i / I is the reduced energy. The following expression can be used to adjust the values of the parameters A, B, and C:
R ( E i ) = 0 for E i I R P for E i = E P R F for E i E F > E P ,
where E p is the incident projectile energy at which σ i n attains its maximum. It is obvious from Equation (31) that, for incident energies below the ionization threshold of the target atom, no ionization takes place. At the peak point, the ionization cross section reaches its maximum while the contribution from the excitation cross section declines. This suggests that the range of values for R p is 0.5 to 1.0 . We choose R p = 0.85 corresponding to E P = 100.0 as an approximation that fits the experimental data because there are still some excitation cross section contributions to the inelastic cross sections. It can be shown that the ratio R ( E i ) increases gradually with energy past its peak, and reaches nearly unity at high energies. The relatively modest contribution from excitation in the high energy area results in R F = 0.99 at E F = 1100 eV. The parameters A, B, and C were calculated to have values of 0.539 , 7.987 and = 3.309 , respectively.

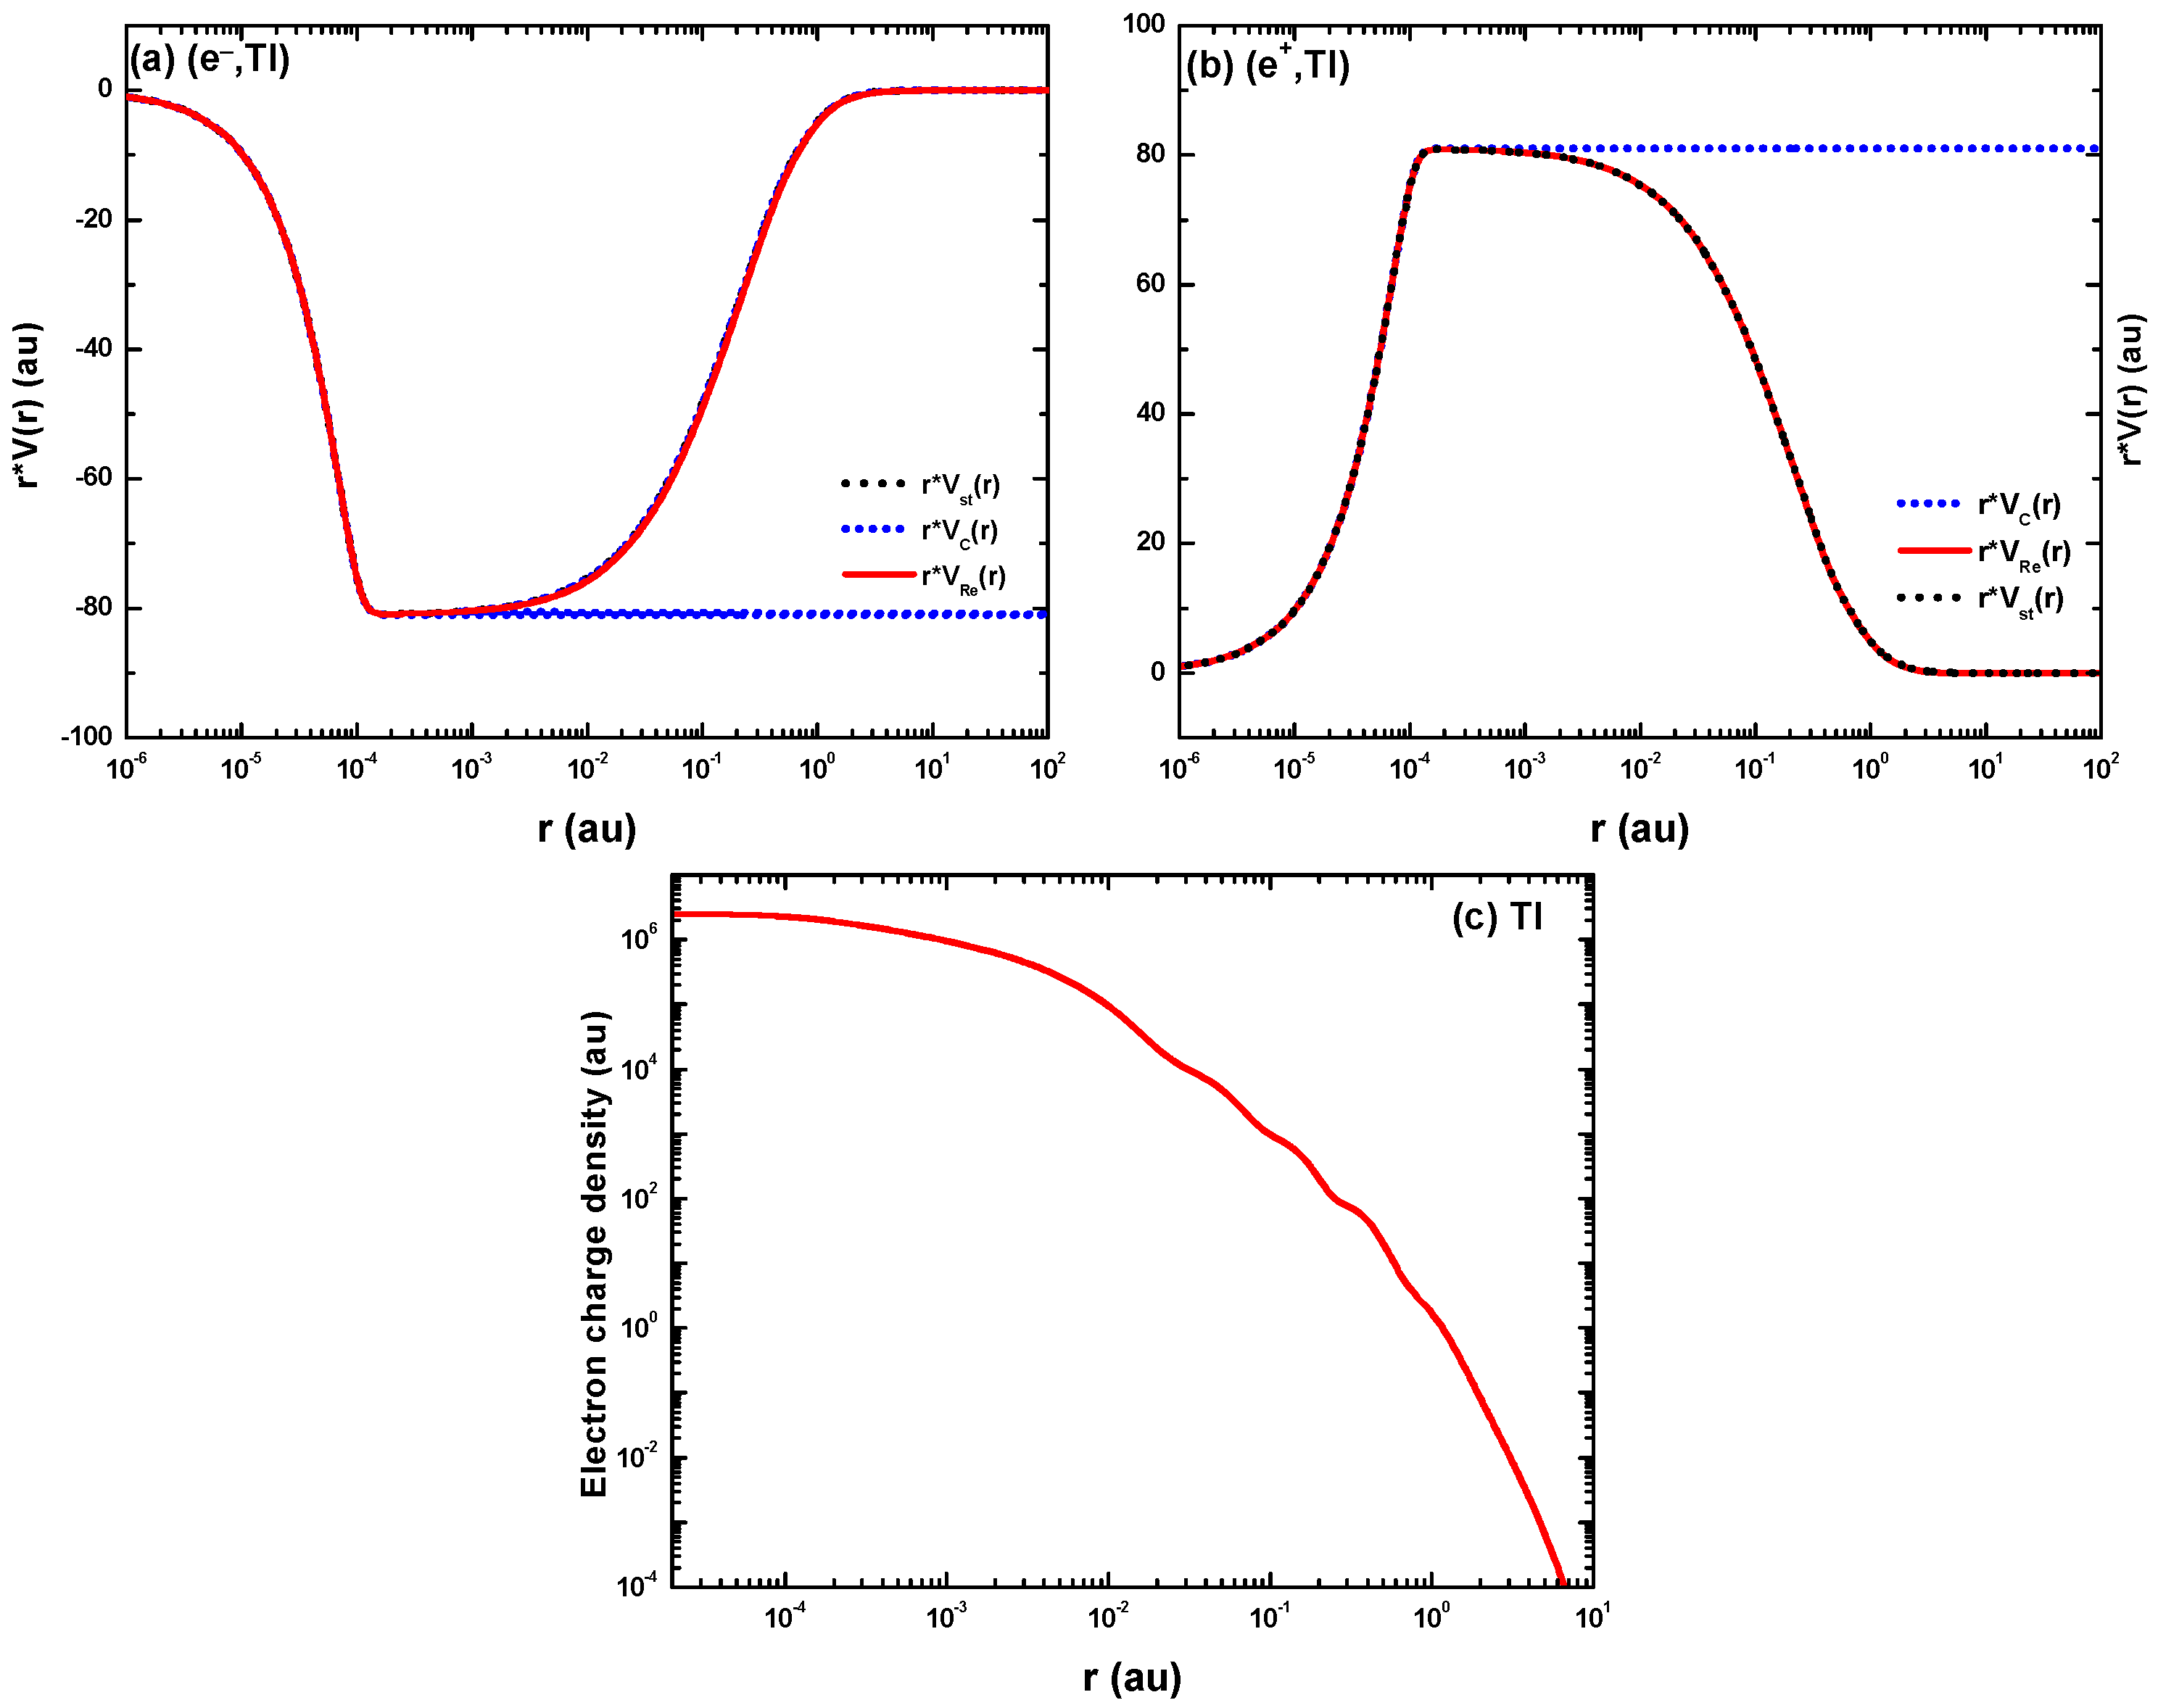
3. Potentials and Numerics

The various scattering observables have been calculated using ELSEPA code [44], like in our previous works [4,5,6,29,55]. At first, the program calculates phase shifts δ κ that are essential for the calculations of scattering amplitudes. These calculations are carried out from the solutions of the Dirac equations up to a matching distance and then matching with the exterior known solution. Based on these scattering amplitudes, the program then calculates various scattering cross sections and Sherman function for spin-unpolarized electrons or positrons.
In Figure 1, we have displayed the potential times radial distance as a function of r, showing the radial dependence of the real part of the optical potential V R e ( r ) , the static potential V s t ( r ) and the pure Coulomb potential V C ( r ) determined from the Fermi charge distribution. Within the nucleus i.e, at r < R , the potential is obtained from the Fermi charge distribution of the bare nucleus because the radius of the Tl nucleus is R 10 5 a.u. For both e±–Tl scattering, the real optical potential V R e ( r ) and the static potential V s t ( r ) coincide at r > 10 4 a.u., as observed from Figure 1a,b, suggesting that the impact of other components is minimal beyond this distance. The optical potential is found to be mostly contributed by the static potential, which is the sum of the contributions from electronic and nuclear charge distributions. Figures show that it is true. Refer to Figure 1a,b to see how the nucleus behaves for both projectiles at distances greater than 10 4 a.u. The nucleus behaves as a point charge at distances r > 10 4 a.u. for both of the projectiles, which are shown in Figure 1a,b.
The electron charge density is a crucial component of the OP, which is generated from the quantum mechanical Dirac–Fock (DF) calculation, and the radial distribution of the electron charge density for Tl atom is plotted in Figure 1c. The humps on the curve indicate where the targets’ electronic shells are located. The position of the n t h electronic shell can be found near r = a 0 n 2 Z T [56], and the radius of the outermost electronic shell can be calculated by the Bohr radius, a 0 = 2 m e 2 = 1 a.u.
Figure 2 and Figure 3 displays the effect of the potential gradients on the differential cross section and Sherman function for both e±–Tl scattering at 90° as a function of incident energy obtained from by adding different components of the OP. For electron scattering, as observed from Figure 2a,b and Figure 3a,b, although the static potential V s t ( r ) is the crucial contributor to the DCS and S ( θ ) , the inclusion of the exchange potential leads to a considerable modification of the structures, particularly below 100 eV. The correlation polarization potential counteracts V e x by lowering the excursions in the DCS and in S ( θ ) , with its strongest influence being below 10 eV. The imaginary potential i W a b s has a significant impact on the structure of the DCS and S at energies below 100 eV.
On the other hand, for positron scattering shown in Figure 2c and Figure 3c, in which V e x is not present, a considerable impact of the imaginary potential is observed for the DCS at collision energies below 10 4 eV. However, as can be shown from Figure 2d and Figure 3d, the contribution of V s t ( r ) is the only source of the S ( θ ) . This study shows that at low energies the S ( θ ) is sensitive to the projectile’s charge sign.
Figure 3 depicts the variation of DCS and S ( θ ) on the choice of potentials in the projectile energy range from 1 eV to 1 MeV. The pure Coulomb field V c overestimates V O P M below 10 keV for electron scattering and below 100 keV for positron scattering. The V O P M is well approximated by V c above these energies for both of the projectiles, respectively. In Figure 3d, for the e+–Tl scattering, V O P M approaches V c over the entire energy region except 1 keV to 500 keV. In this energy region, V c underestimates V O P M .
Figure 4 shows the effect of the V s t , V O P M and V c on the angular dependence of the DCS and of the Sherman function for electron impact on Tl at incident energies from 50 eV to 10 keV. At 50 eV, both the DCS and S ( θ ) results reveal a significant difference for all these three potentials. The static potential among the potential constituents has an exceptional large impact on the DCS and the S as the energy increases. The outcome for a pure Coulomb field is also compared, for which the DCS diverges at a zero-degree angle. At low energies, there is a significant discrepancy between the DCS produced by V O P M and V c . This demonstrates the substantial screening effect of the electron cloud on the nuclear charge [29]. It is seen that the OPM results gradually approach the Coulombic behavior with increasing energy.
The corresponding results for the positron impact are displayed in Figure 5. The optical potential induces oscillations both in the DCS and in S at low energies. The influence of the absorption potential is even stronger than that of electrons, particularly for the spin asymmetry. In addition, the Coulombic behavior has not yet approached at 10 keV.

4. Results and Discussion

4.1. Electron Scattering

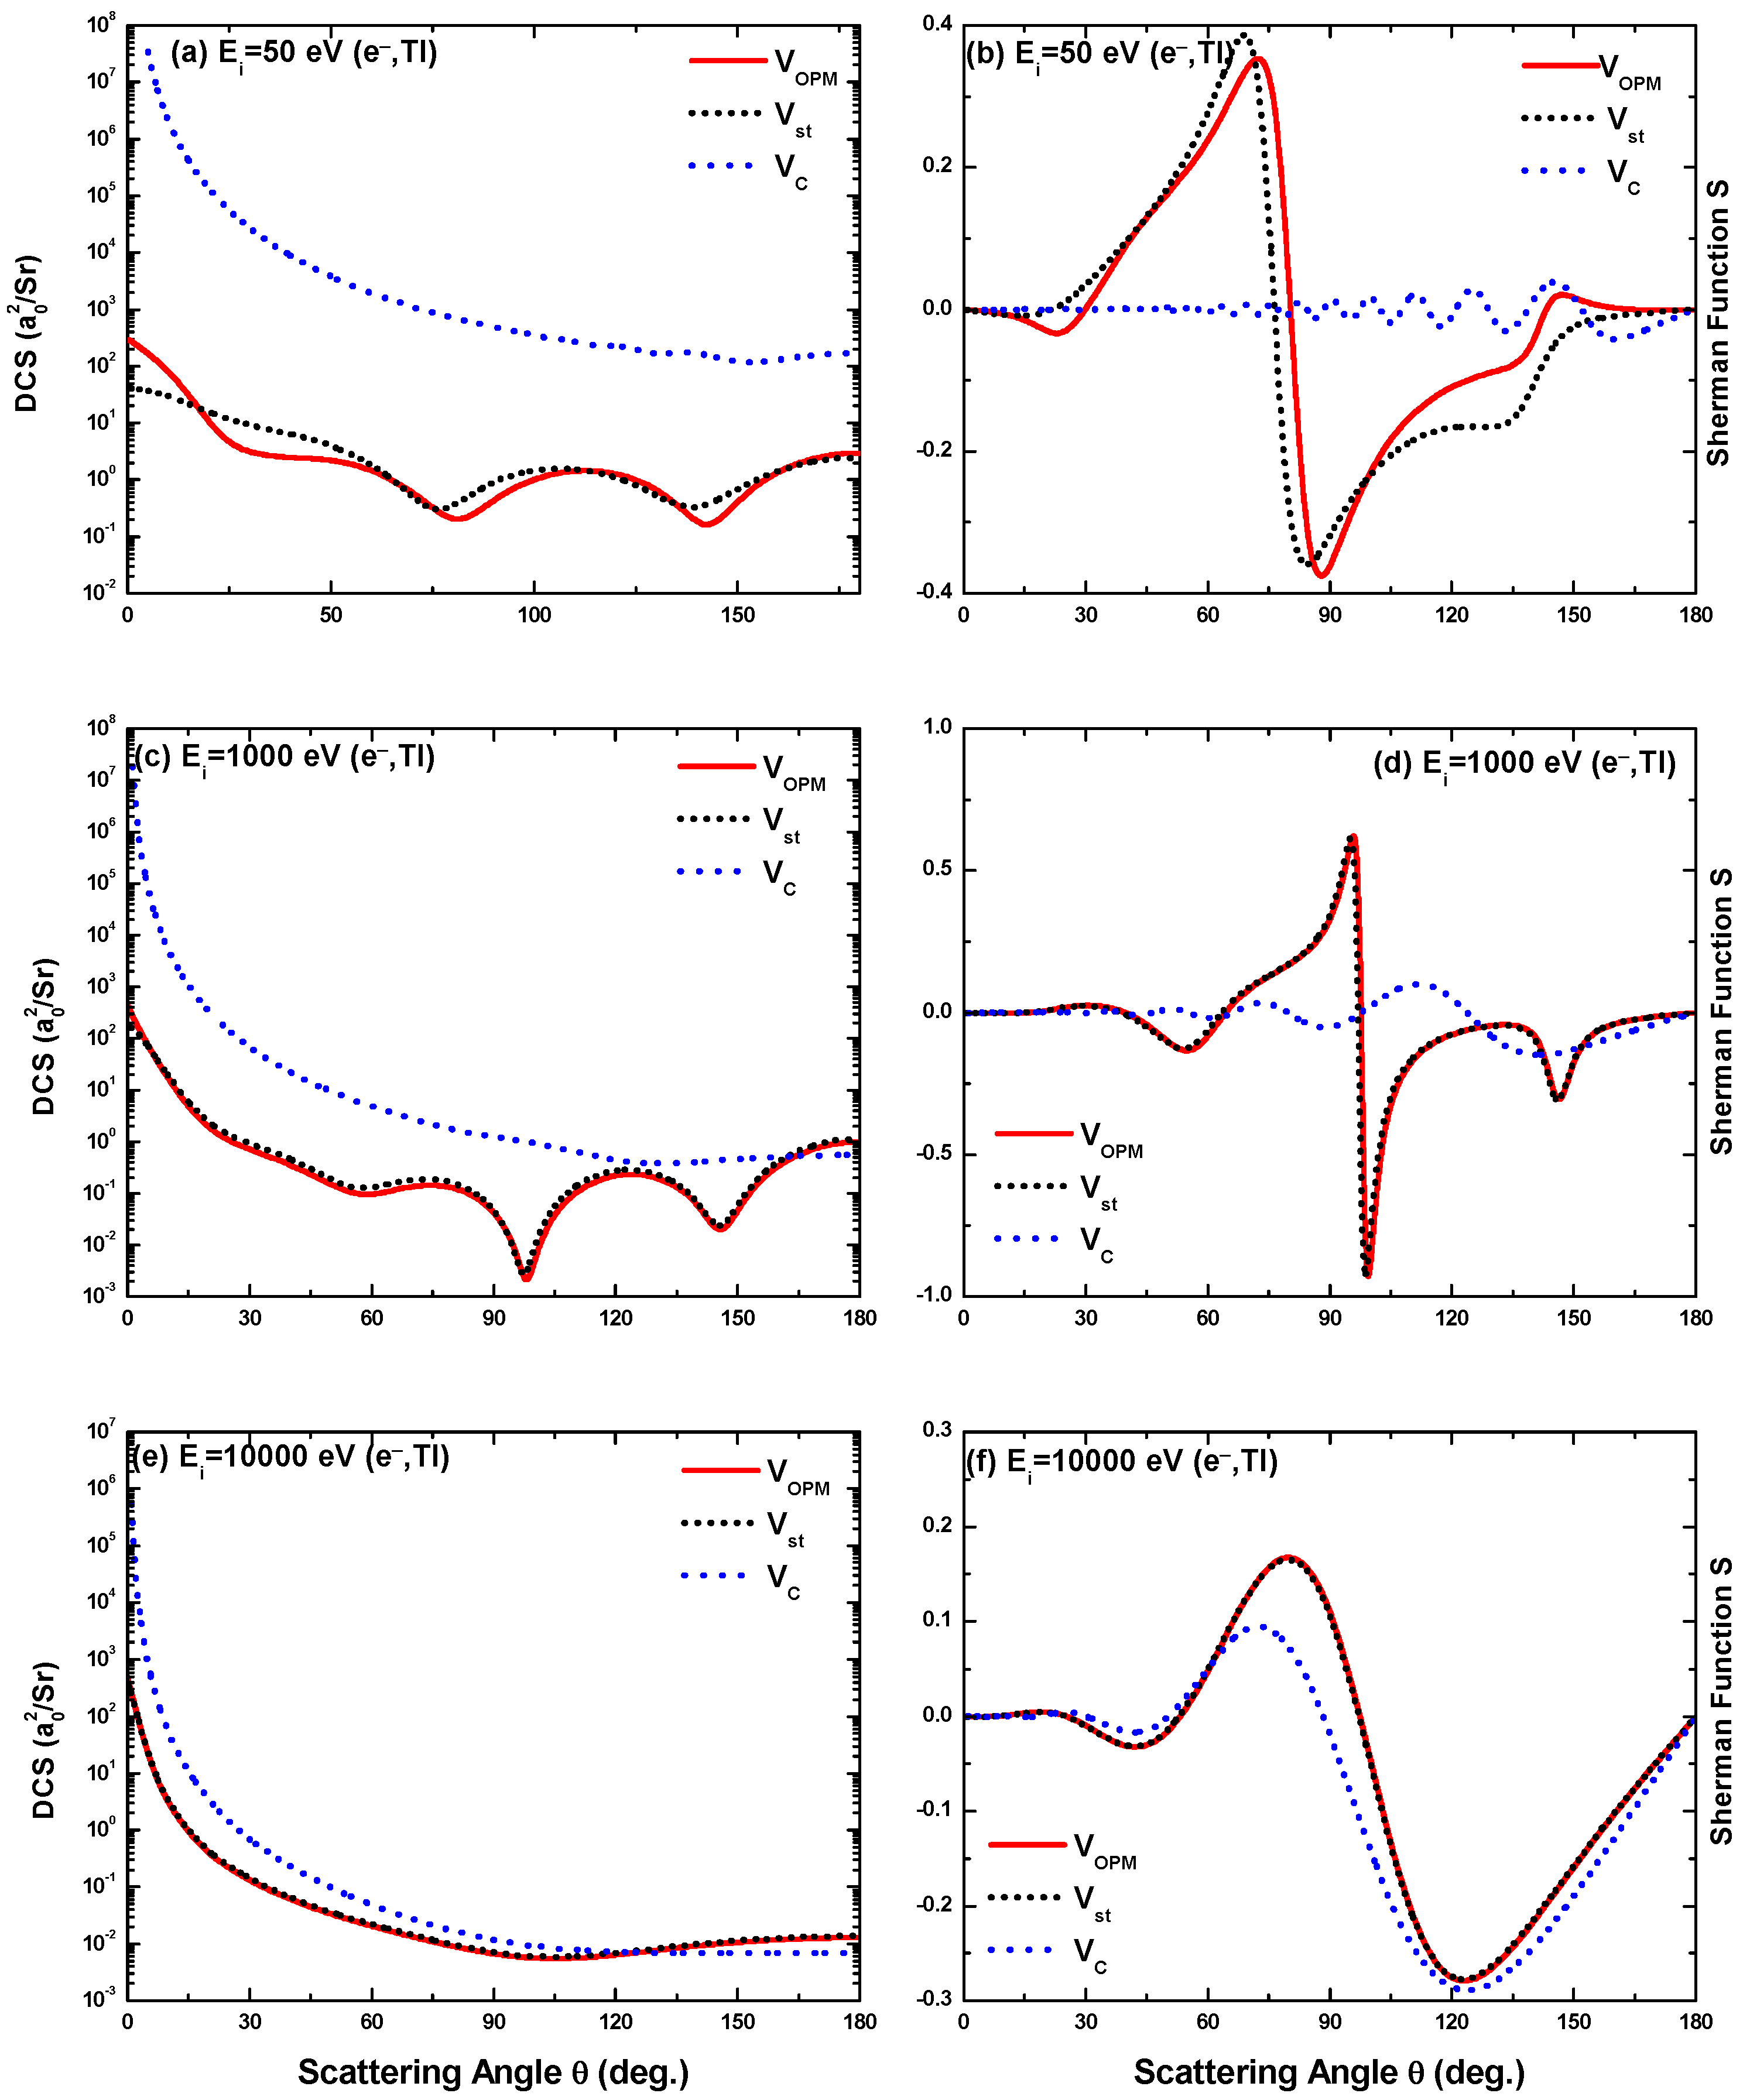
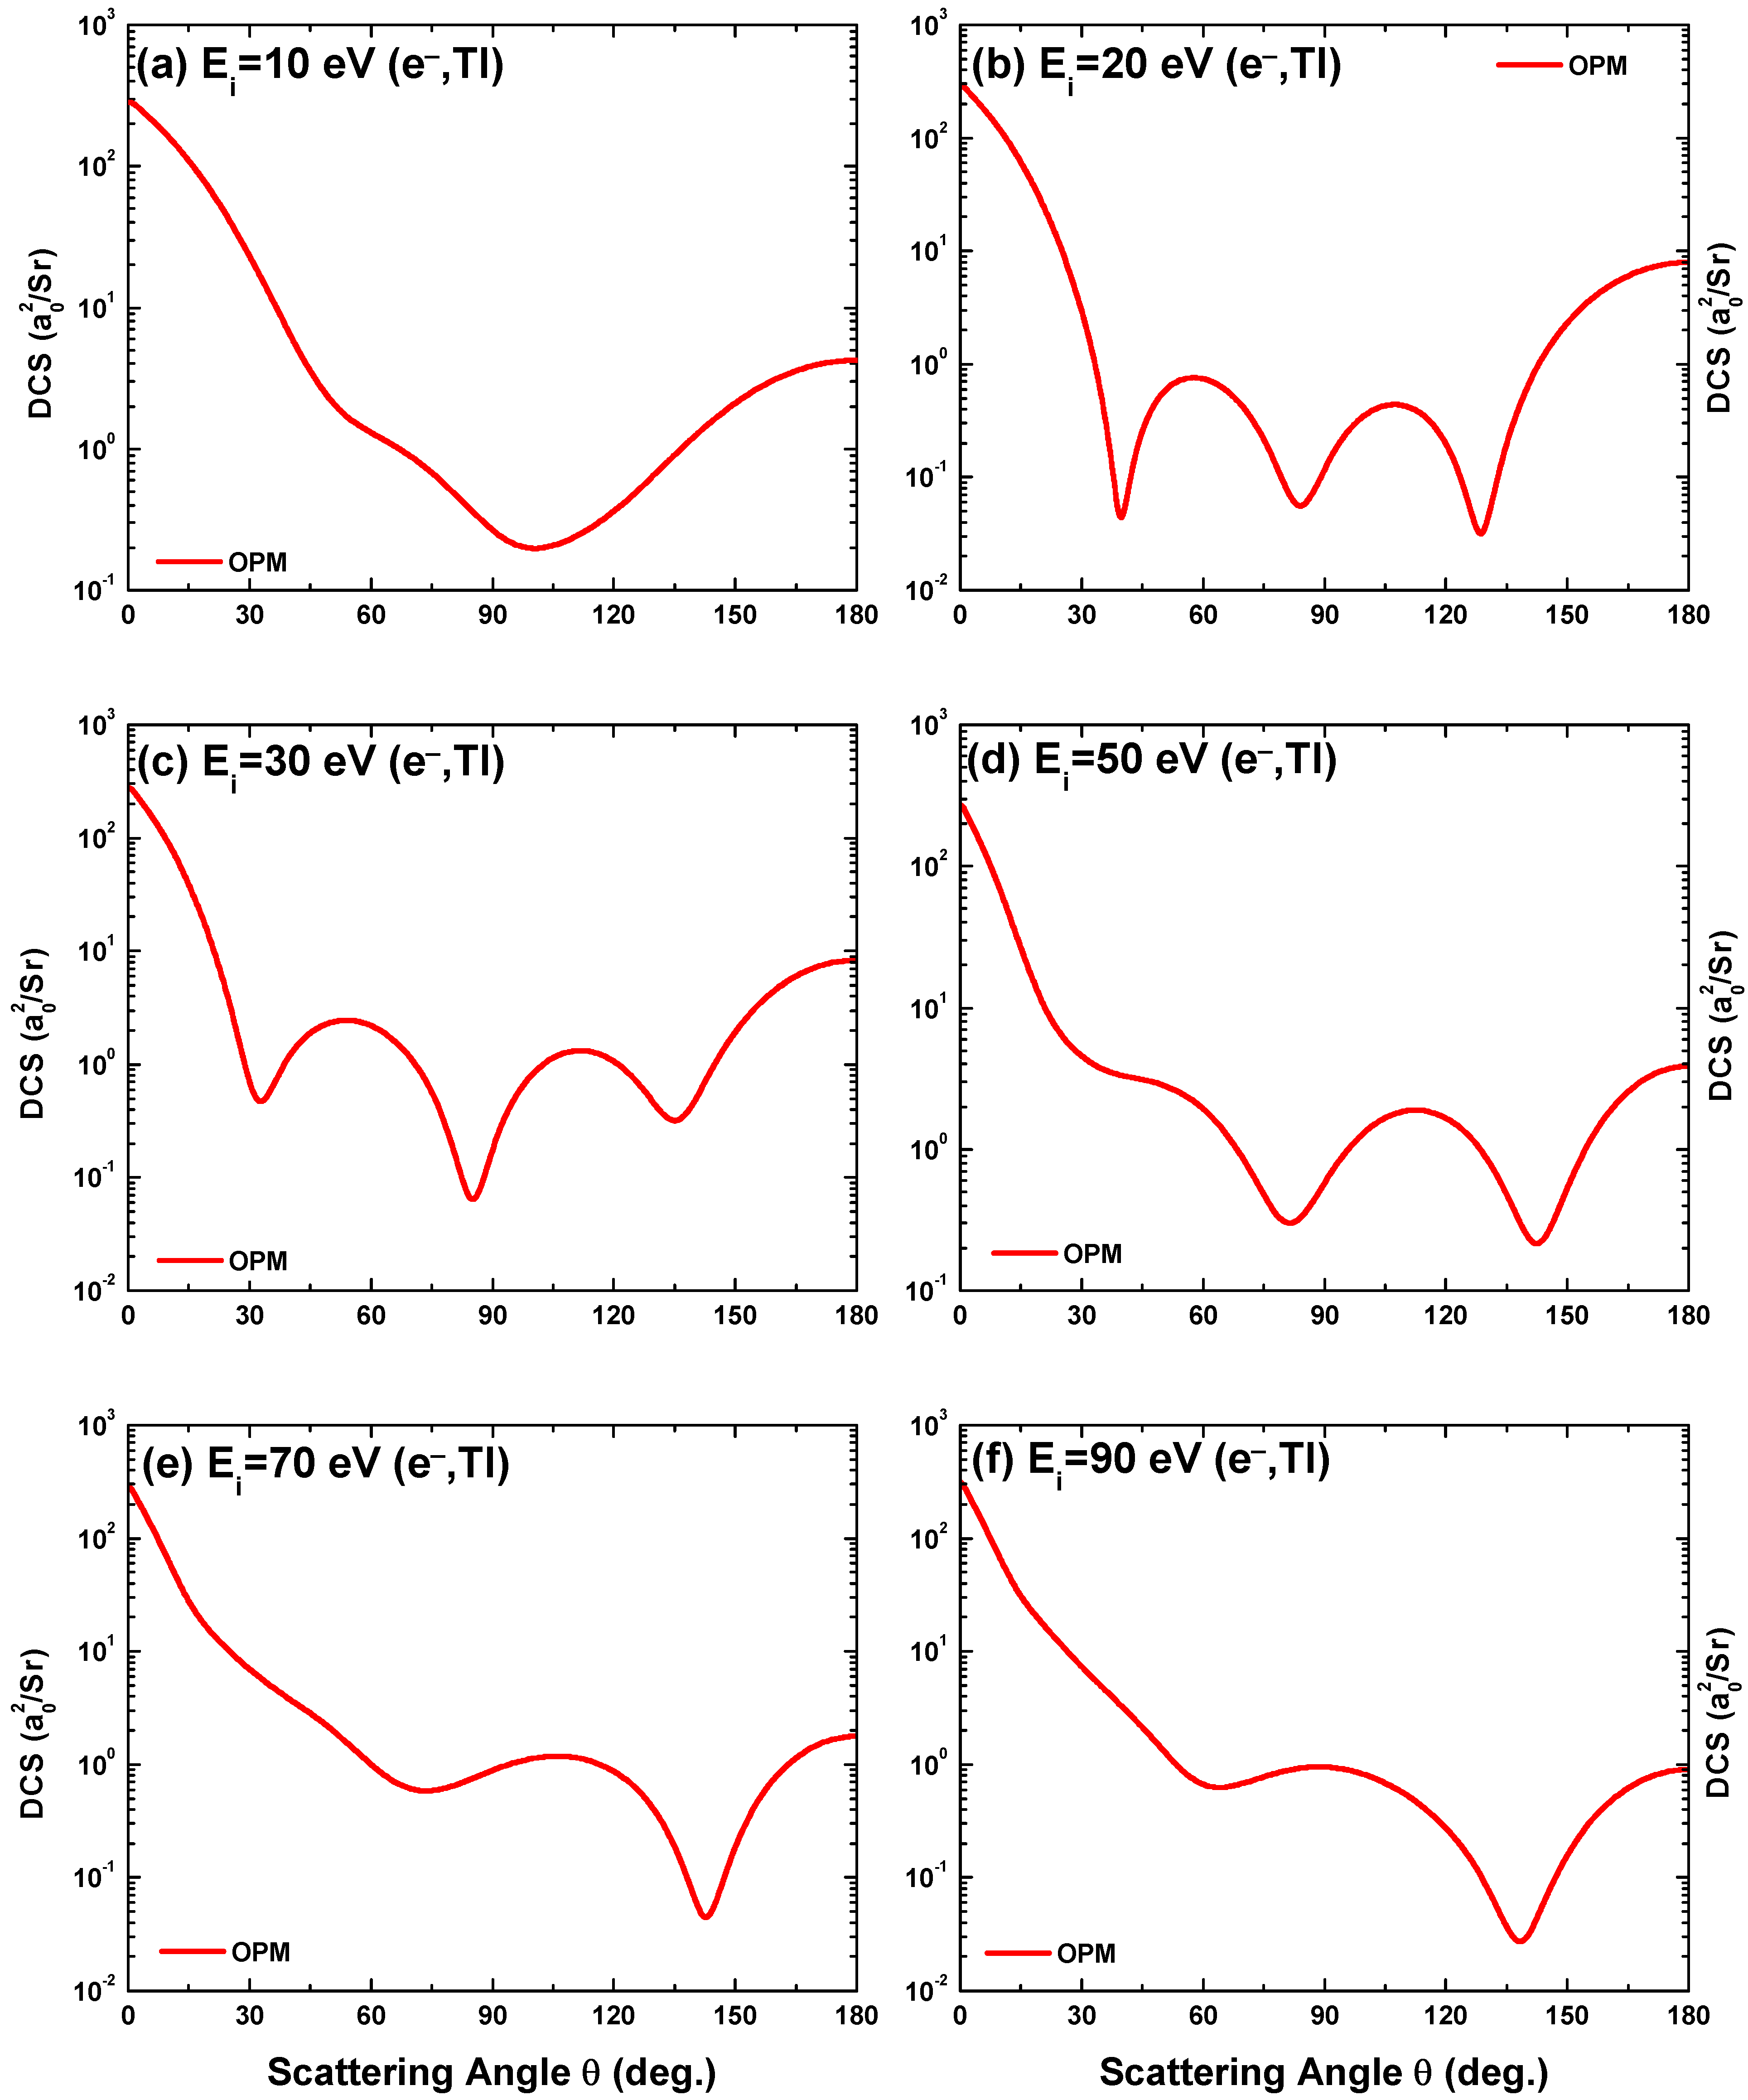
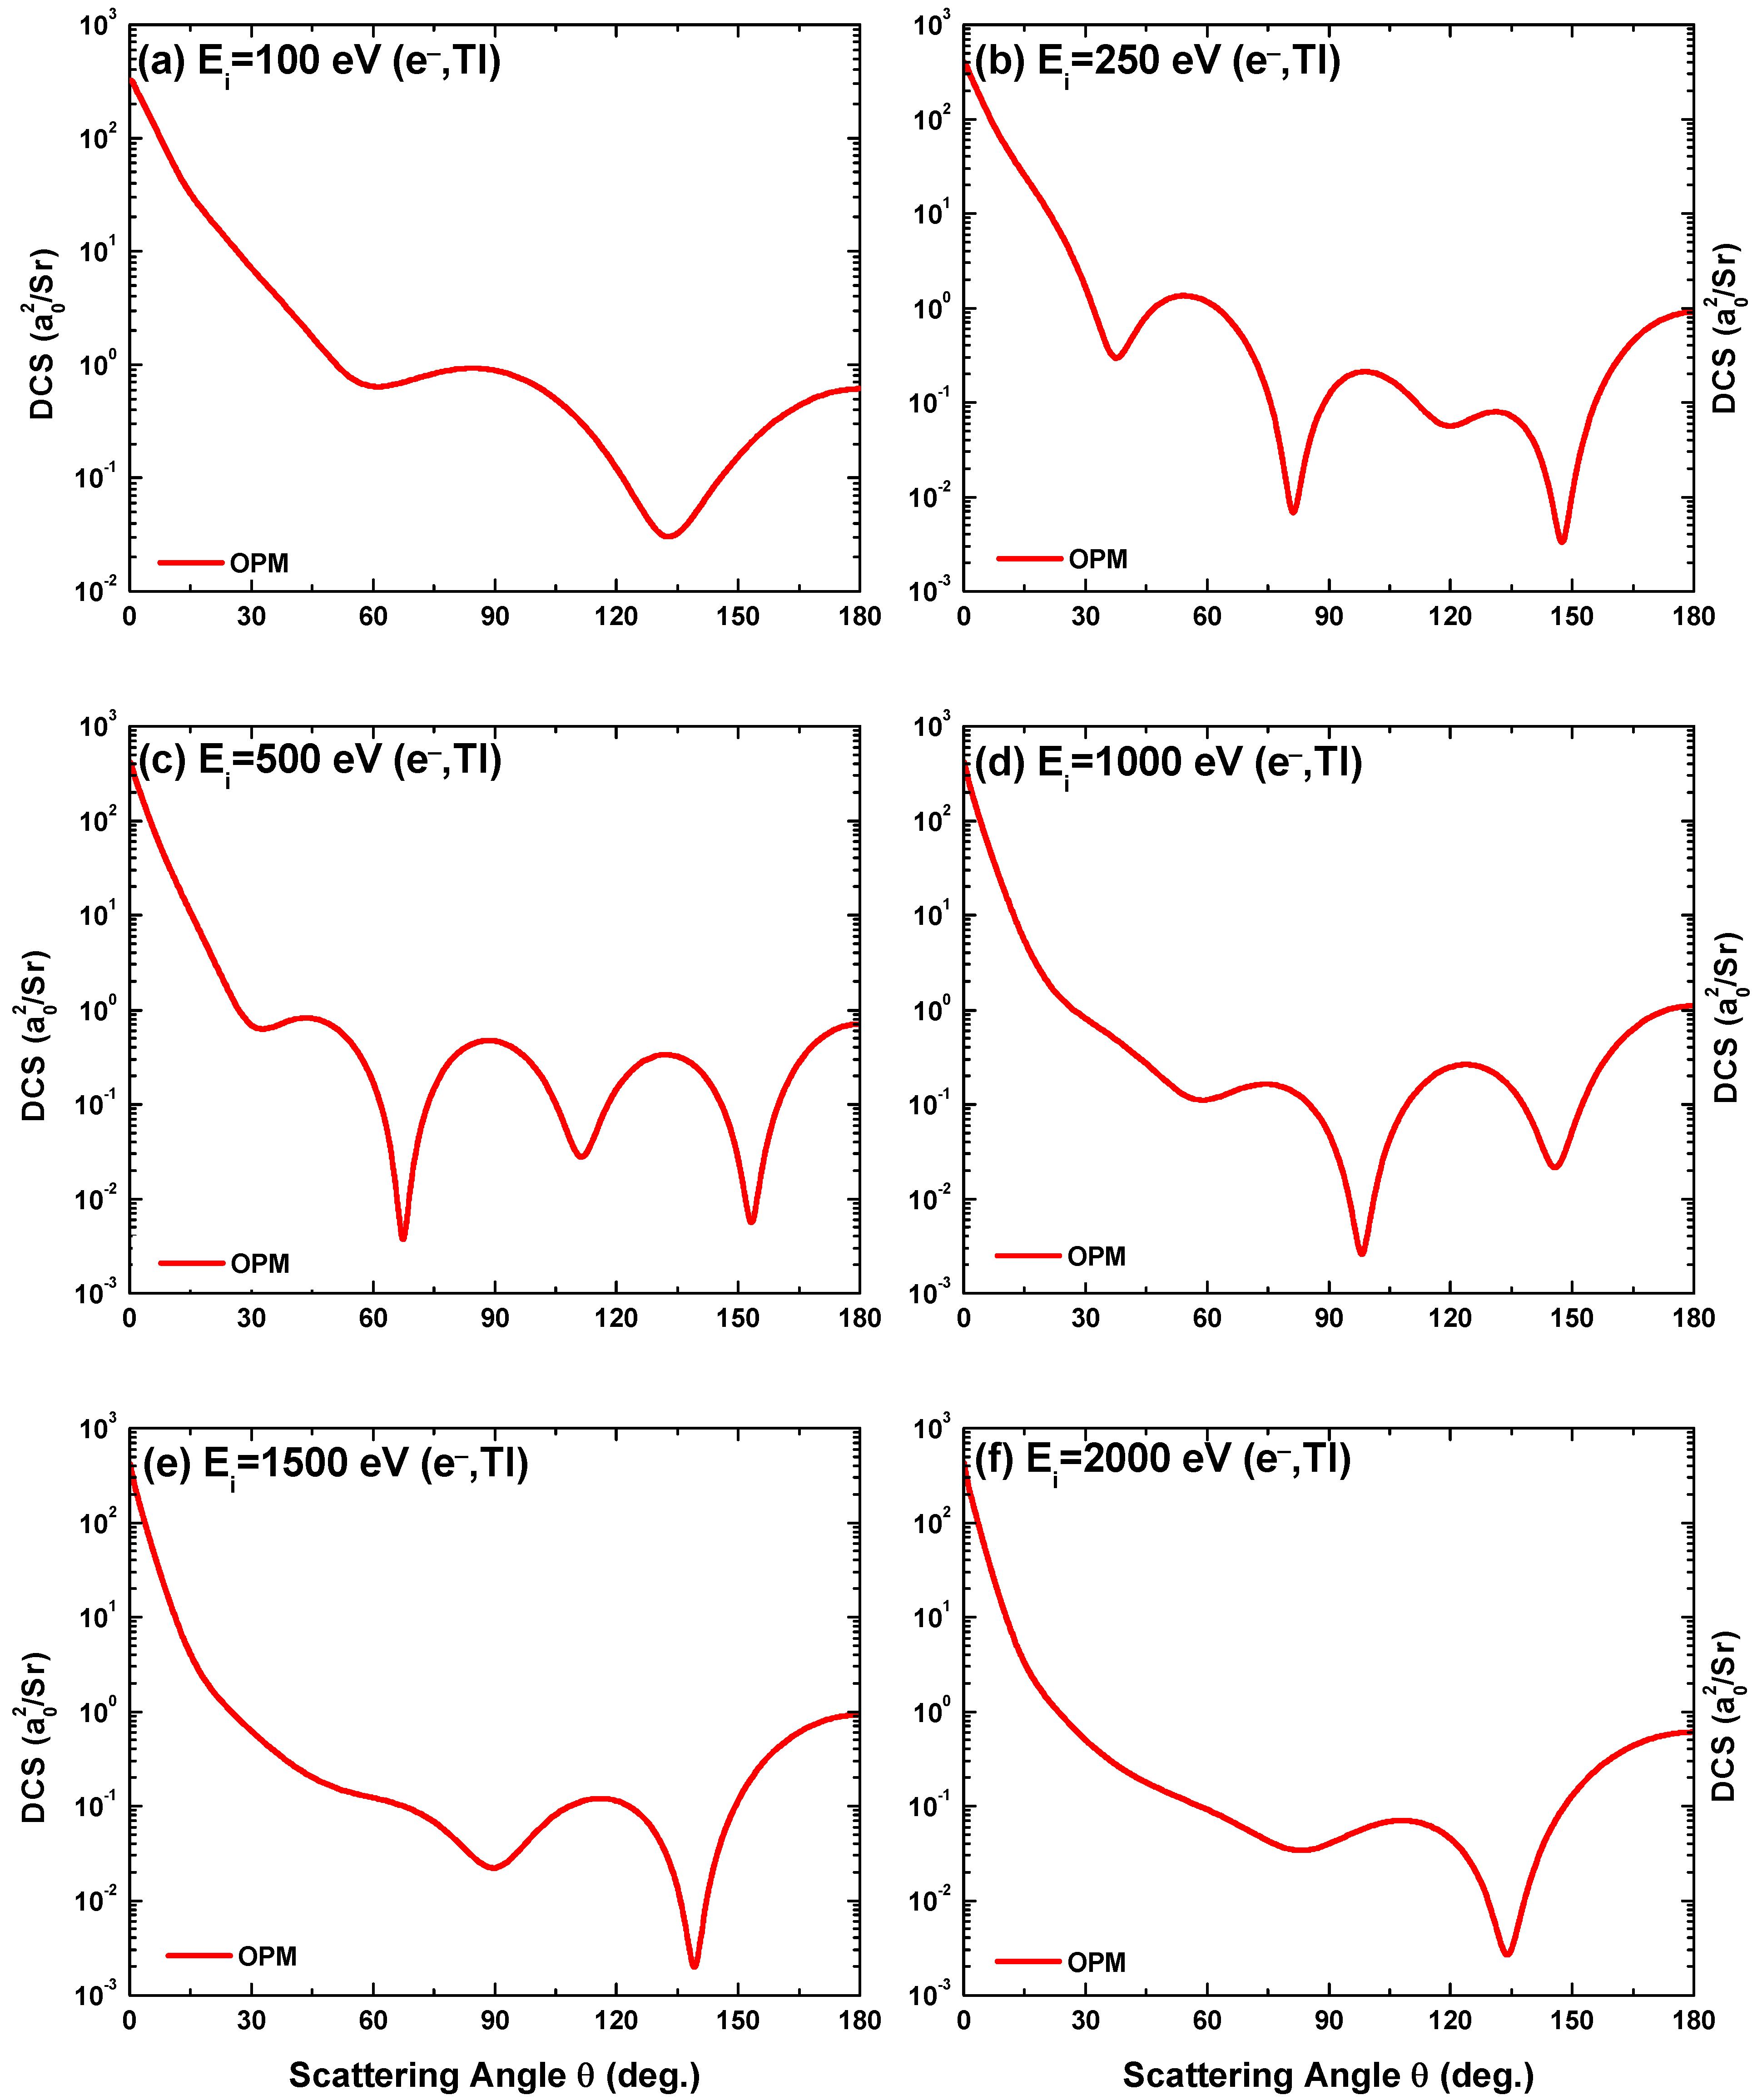
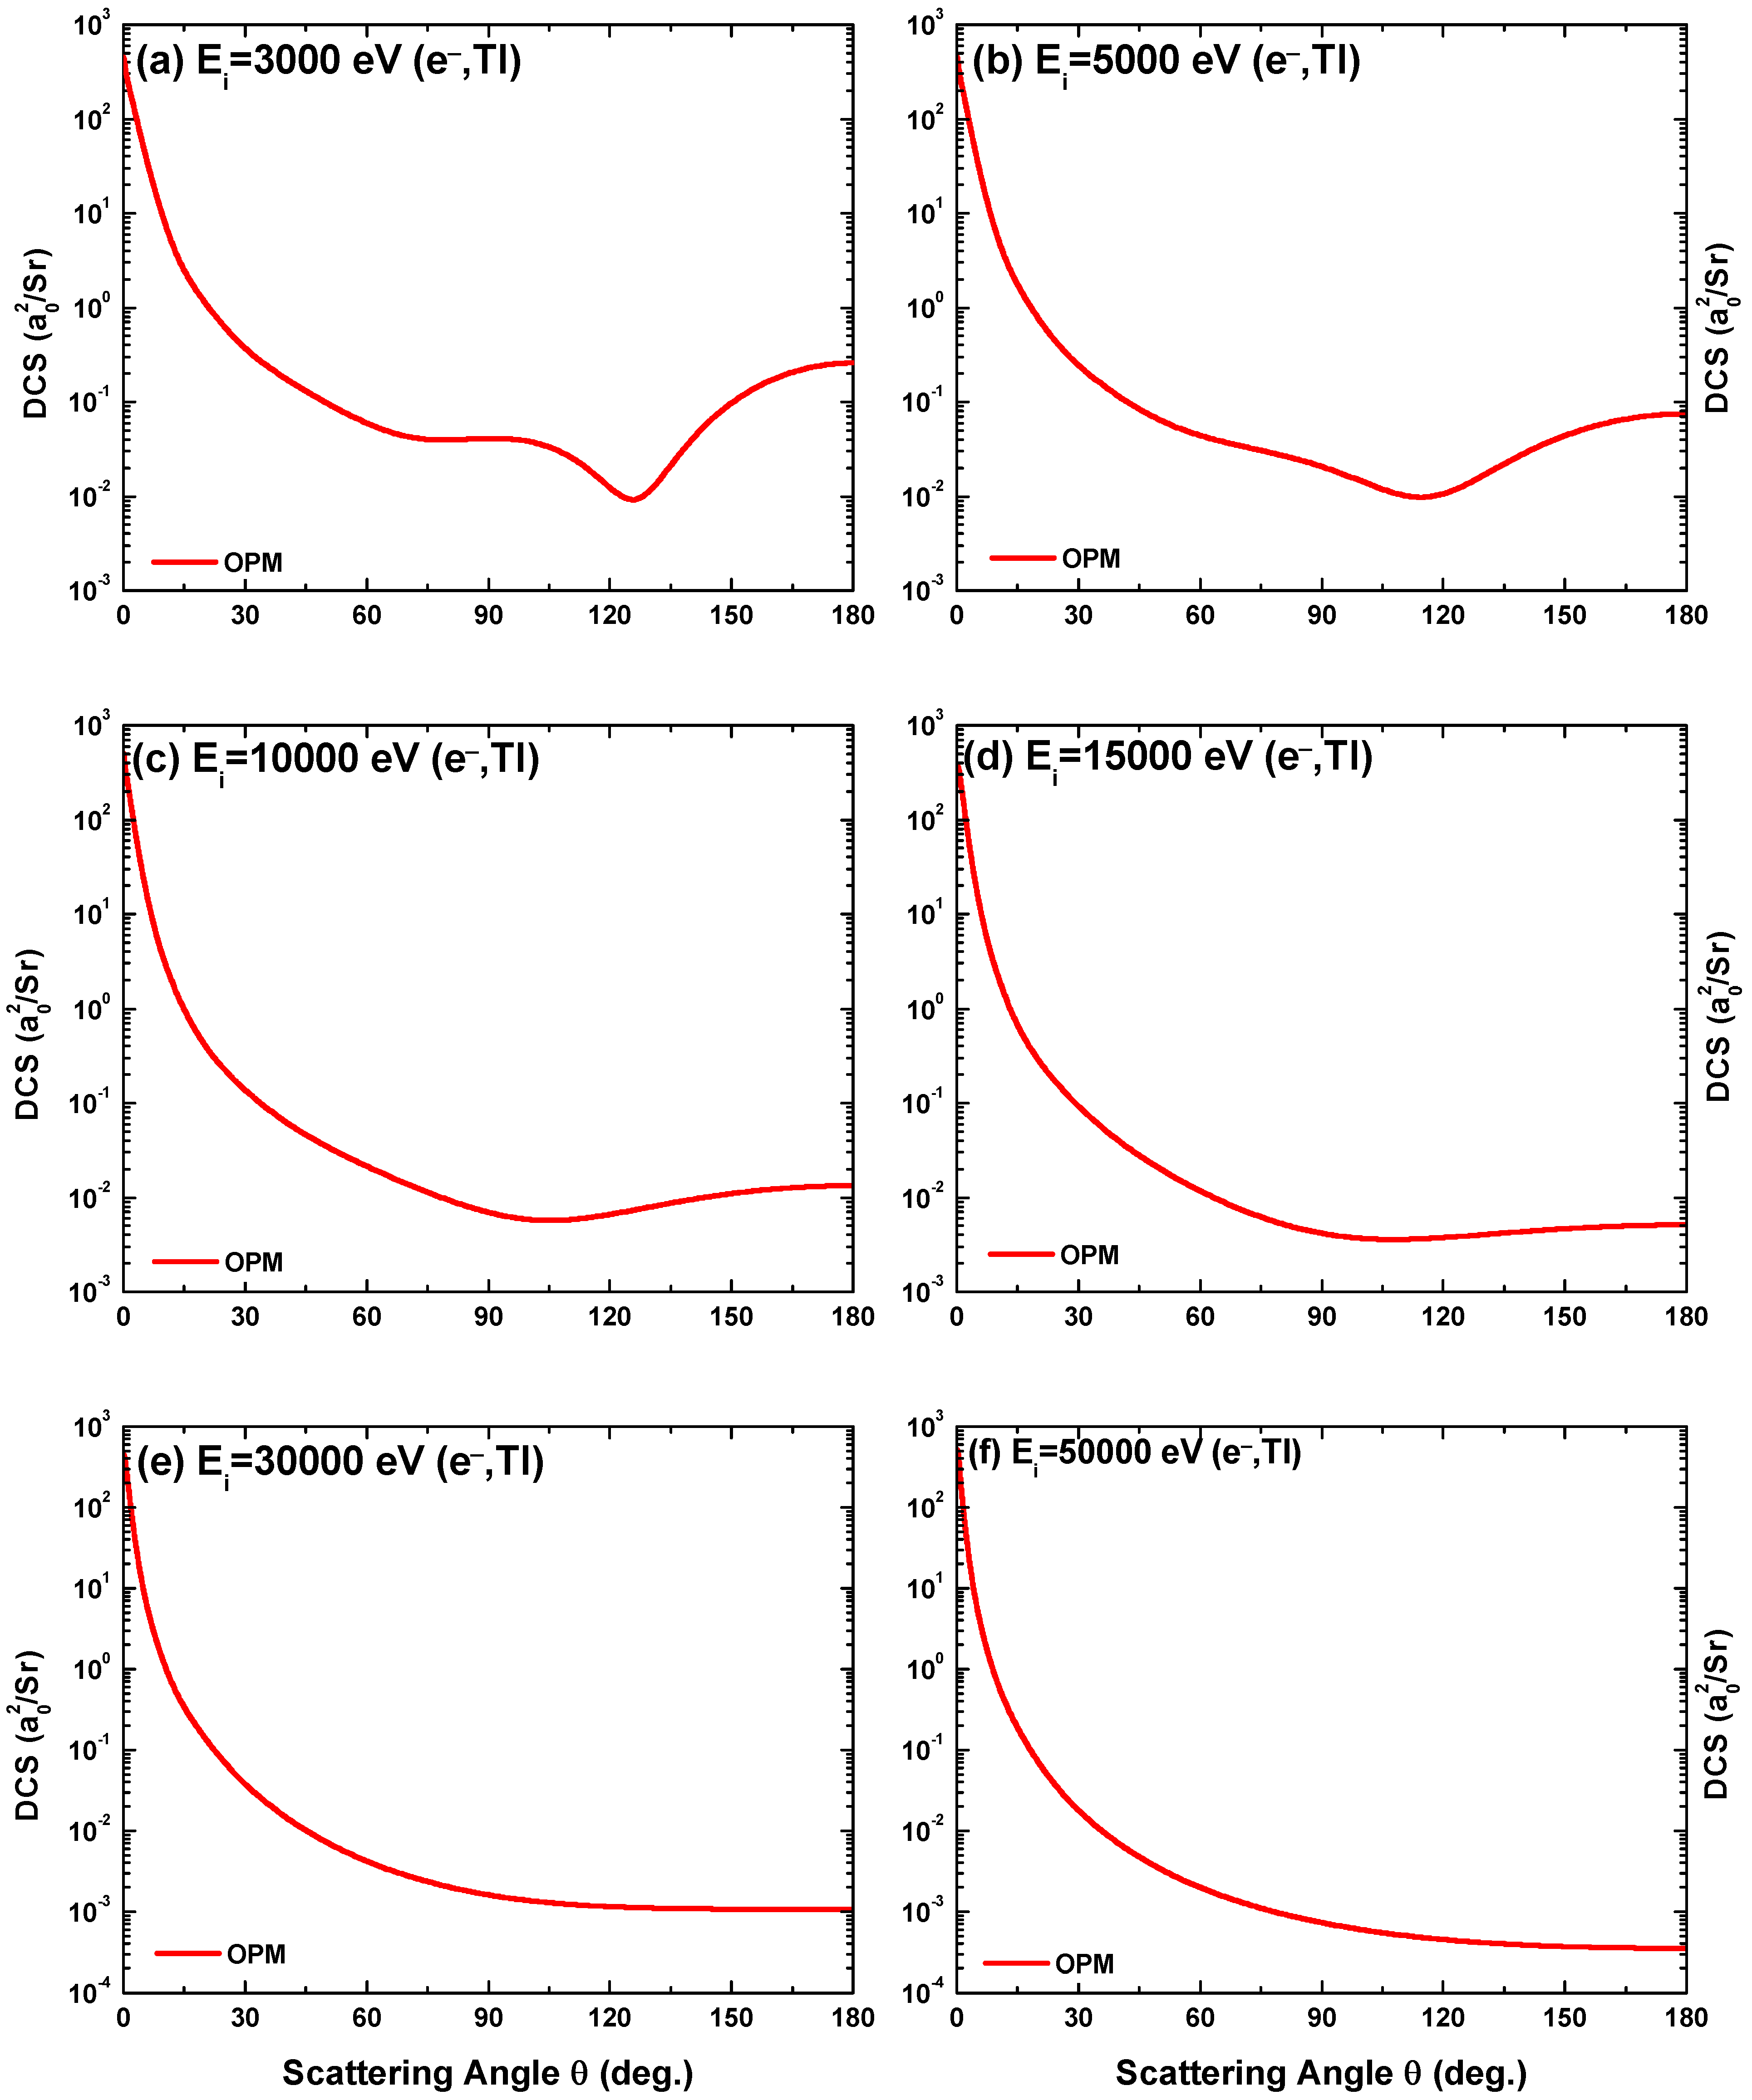
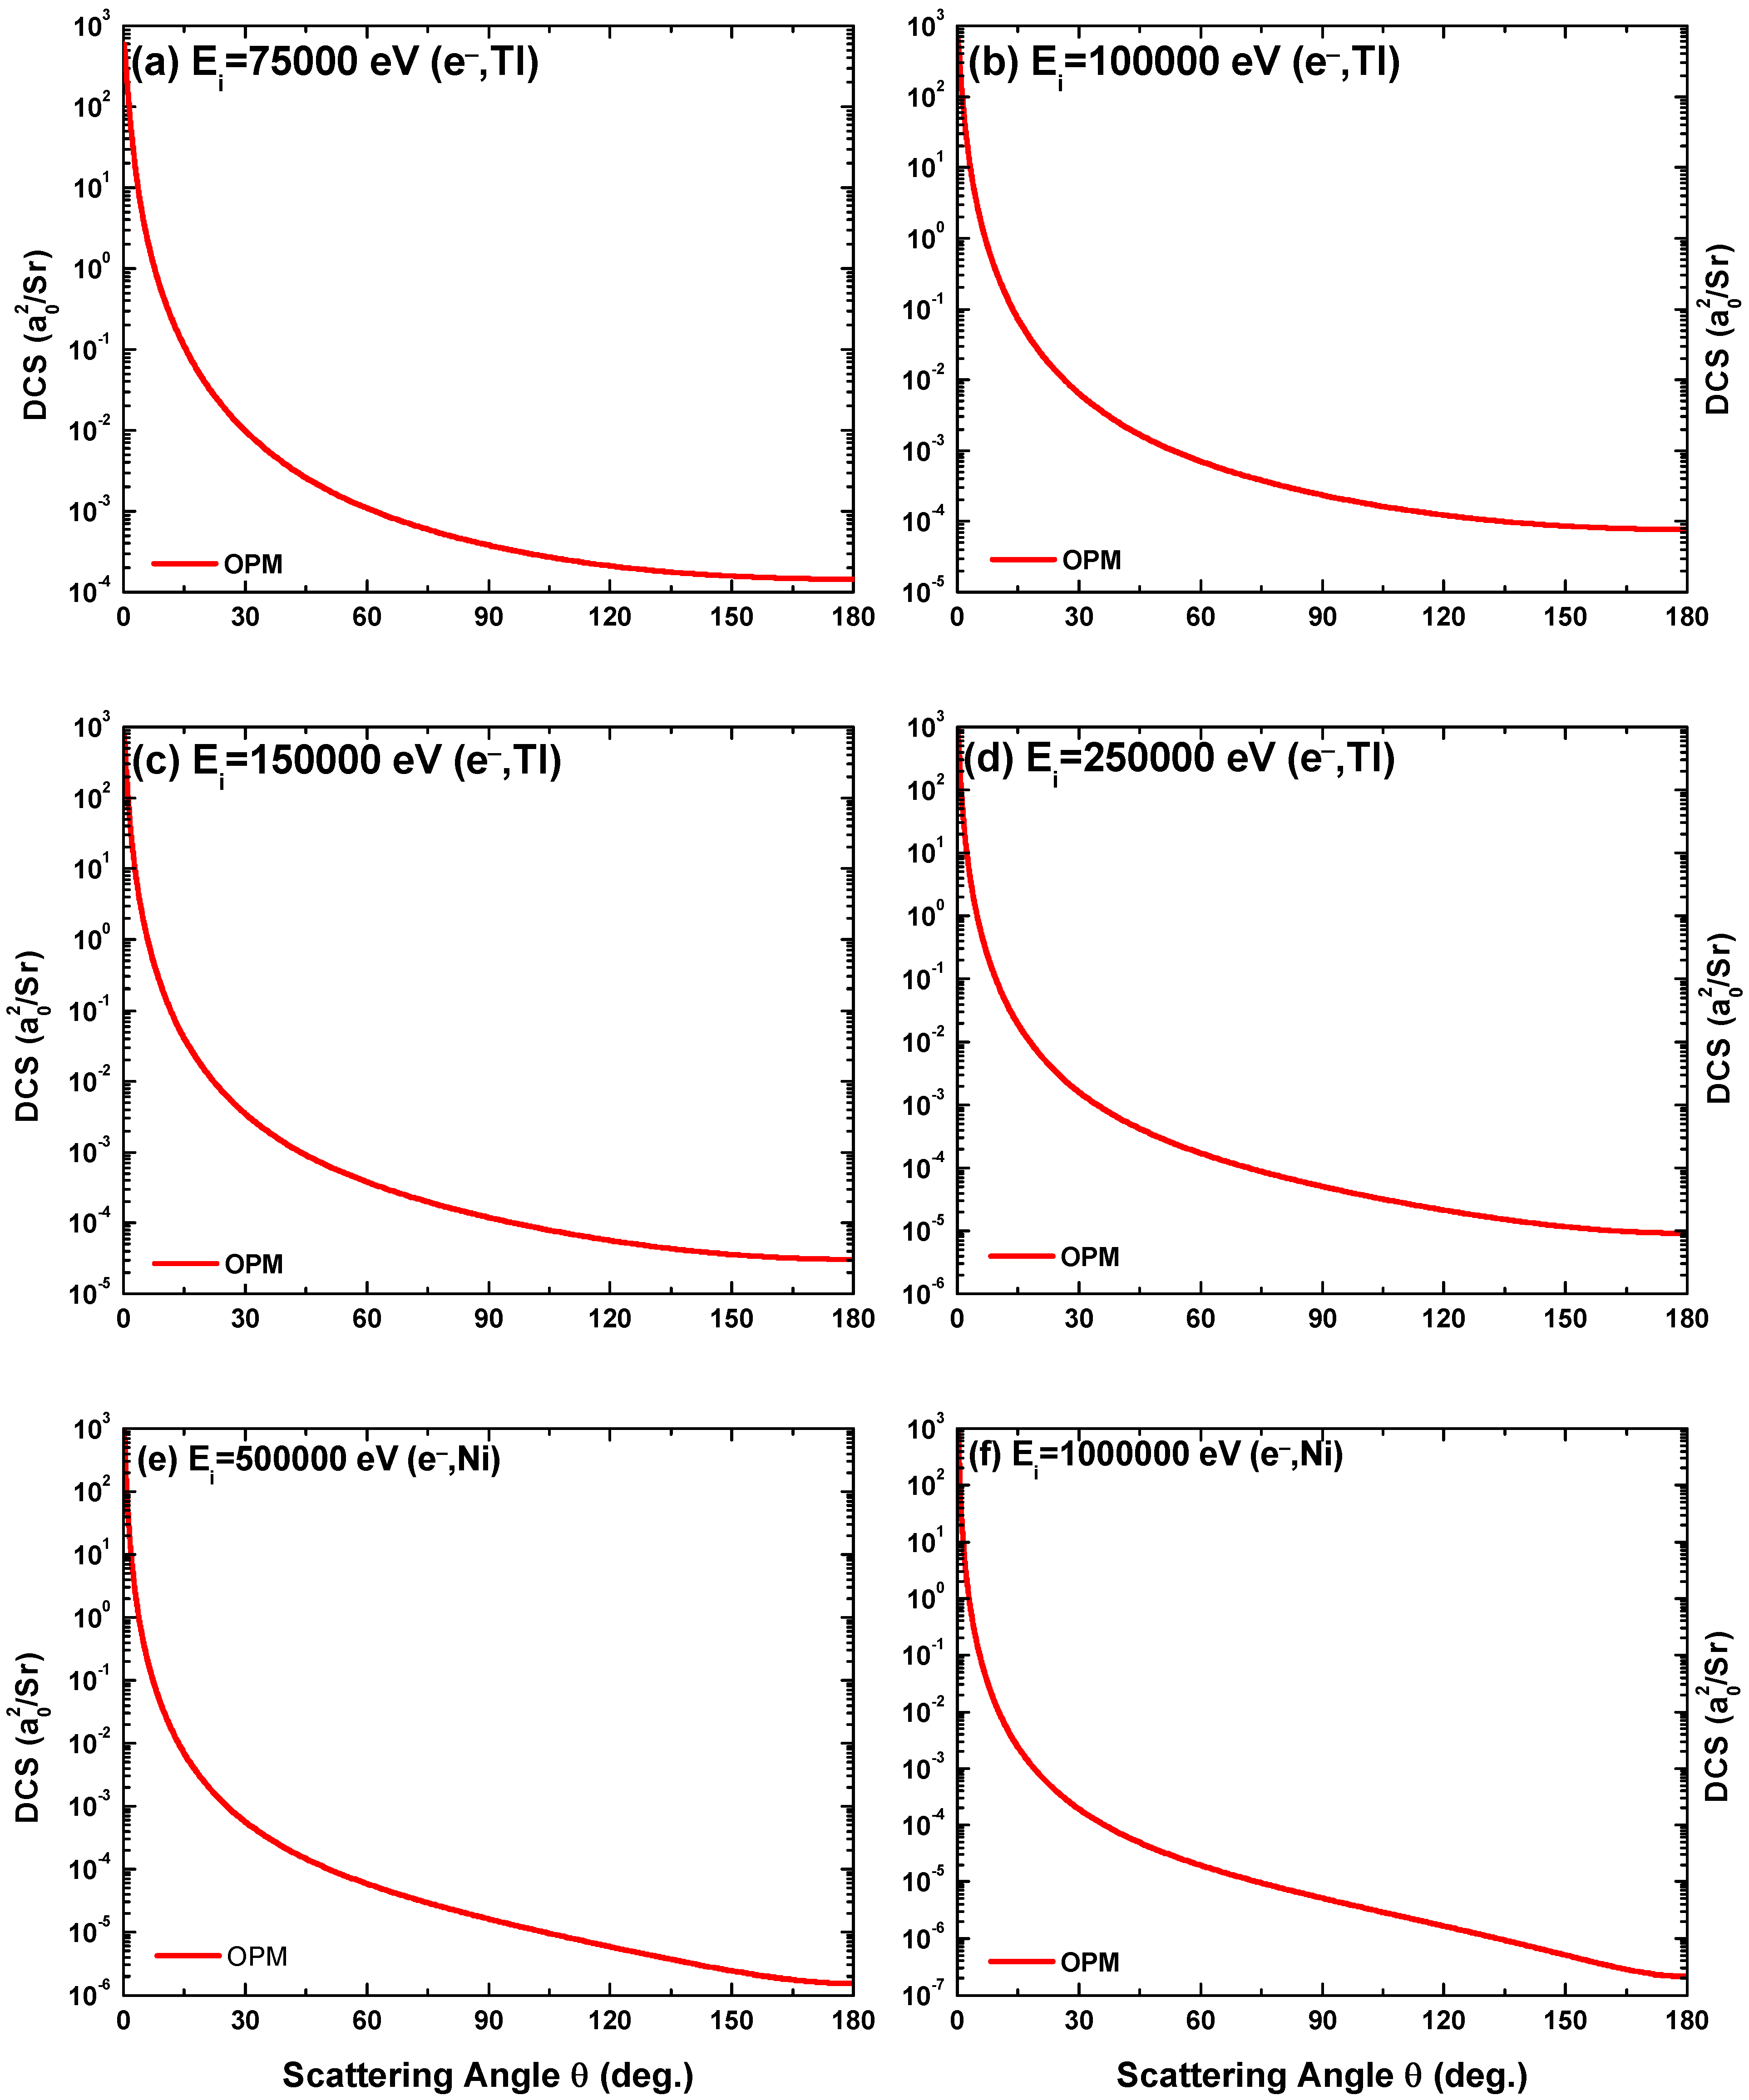
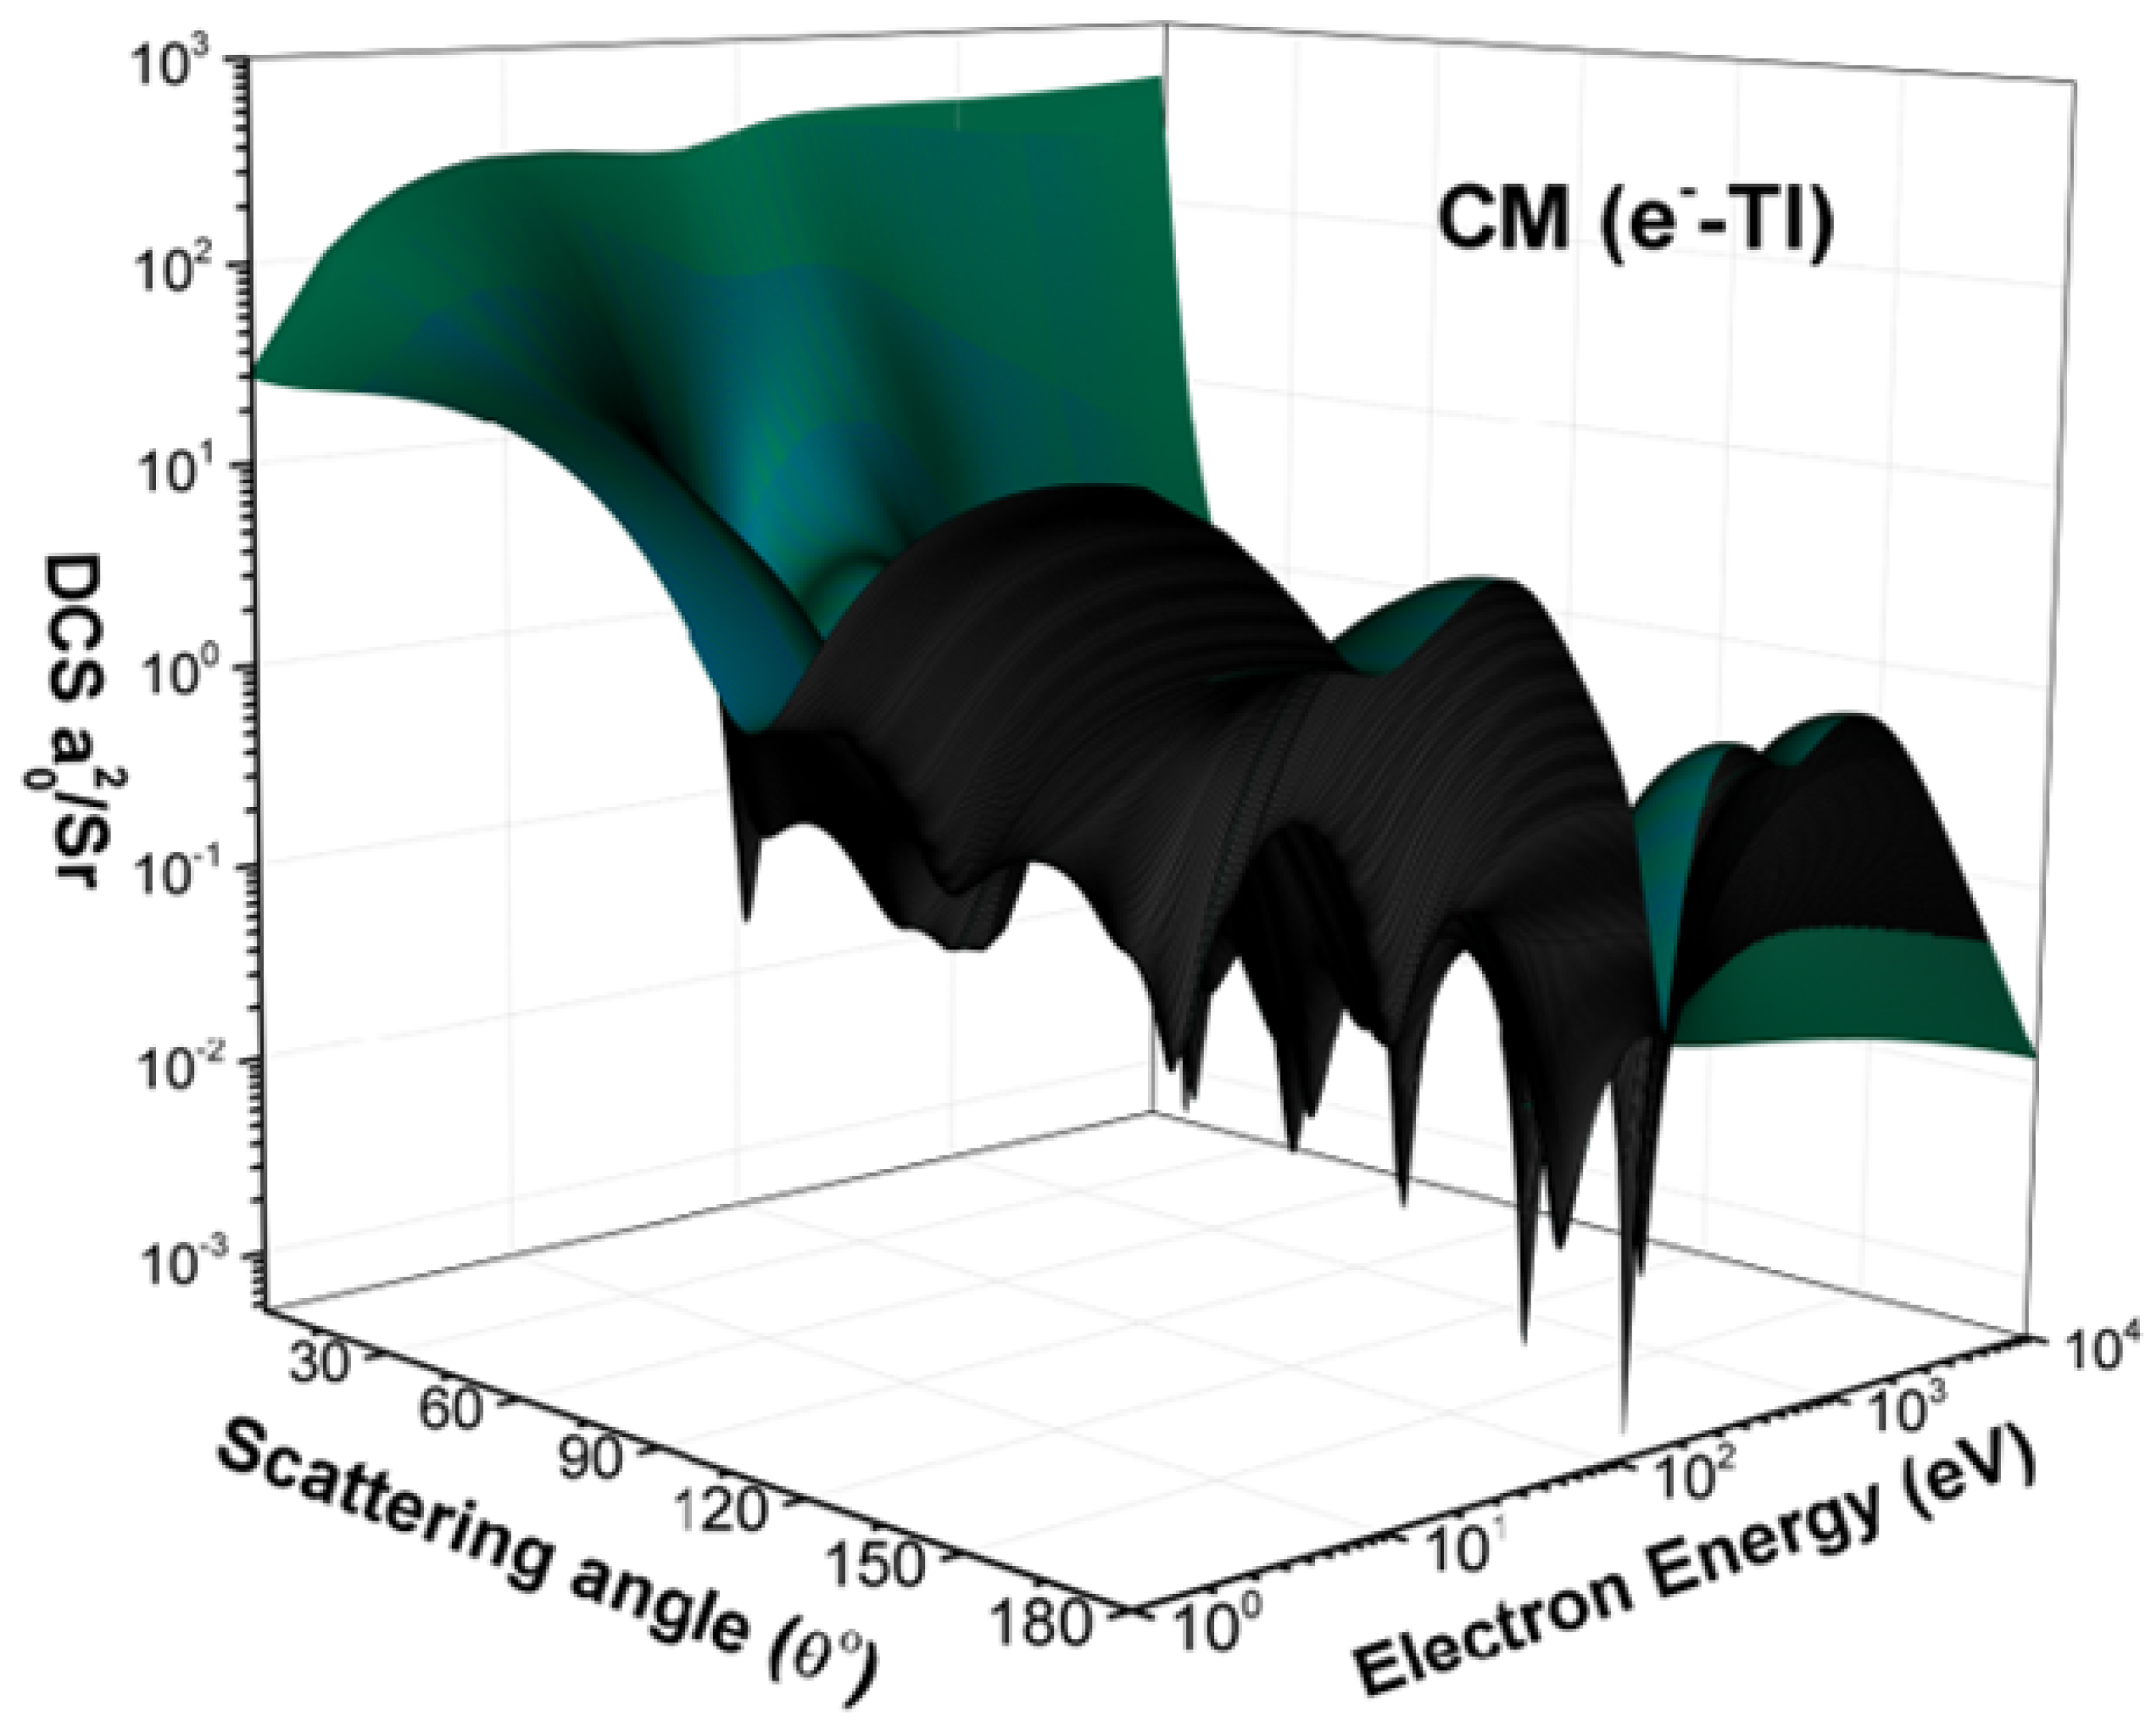
4.1.1. Angle Dependent DCS

Figure 6, Figure 7, Figure 8 and Figure 9 display our OPM predictions of the DCS for electron scattering from the studied Tl target atom at impact energies E i = 10 eV–10 MeV. The figures clearly show that Ramsauer–Townsend structures [57,58], which are produced by the interference effects of projectile electrons scattering from individual electrons of the atom, appear in the DCS data. The interference patterns vanishes at greater impact energies (far beyond 10 keV), when the projectile–atom interaction takes place inside the K-shell. No experimental data for the DCS results of e–Tl scattering have been found to compare with this OPM predictions. However, the similar trends of angular dependent DCS results for the elastic scattering of electron have been found in our previous works for other atoms [7,29,55].

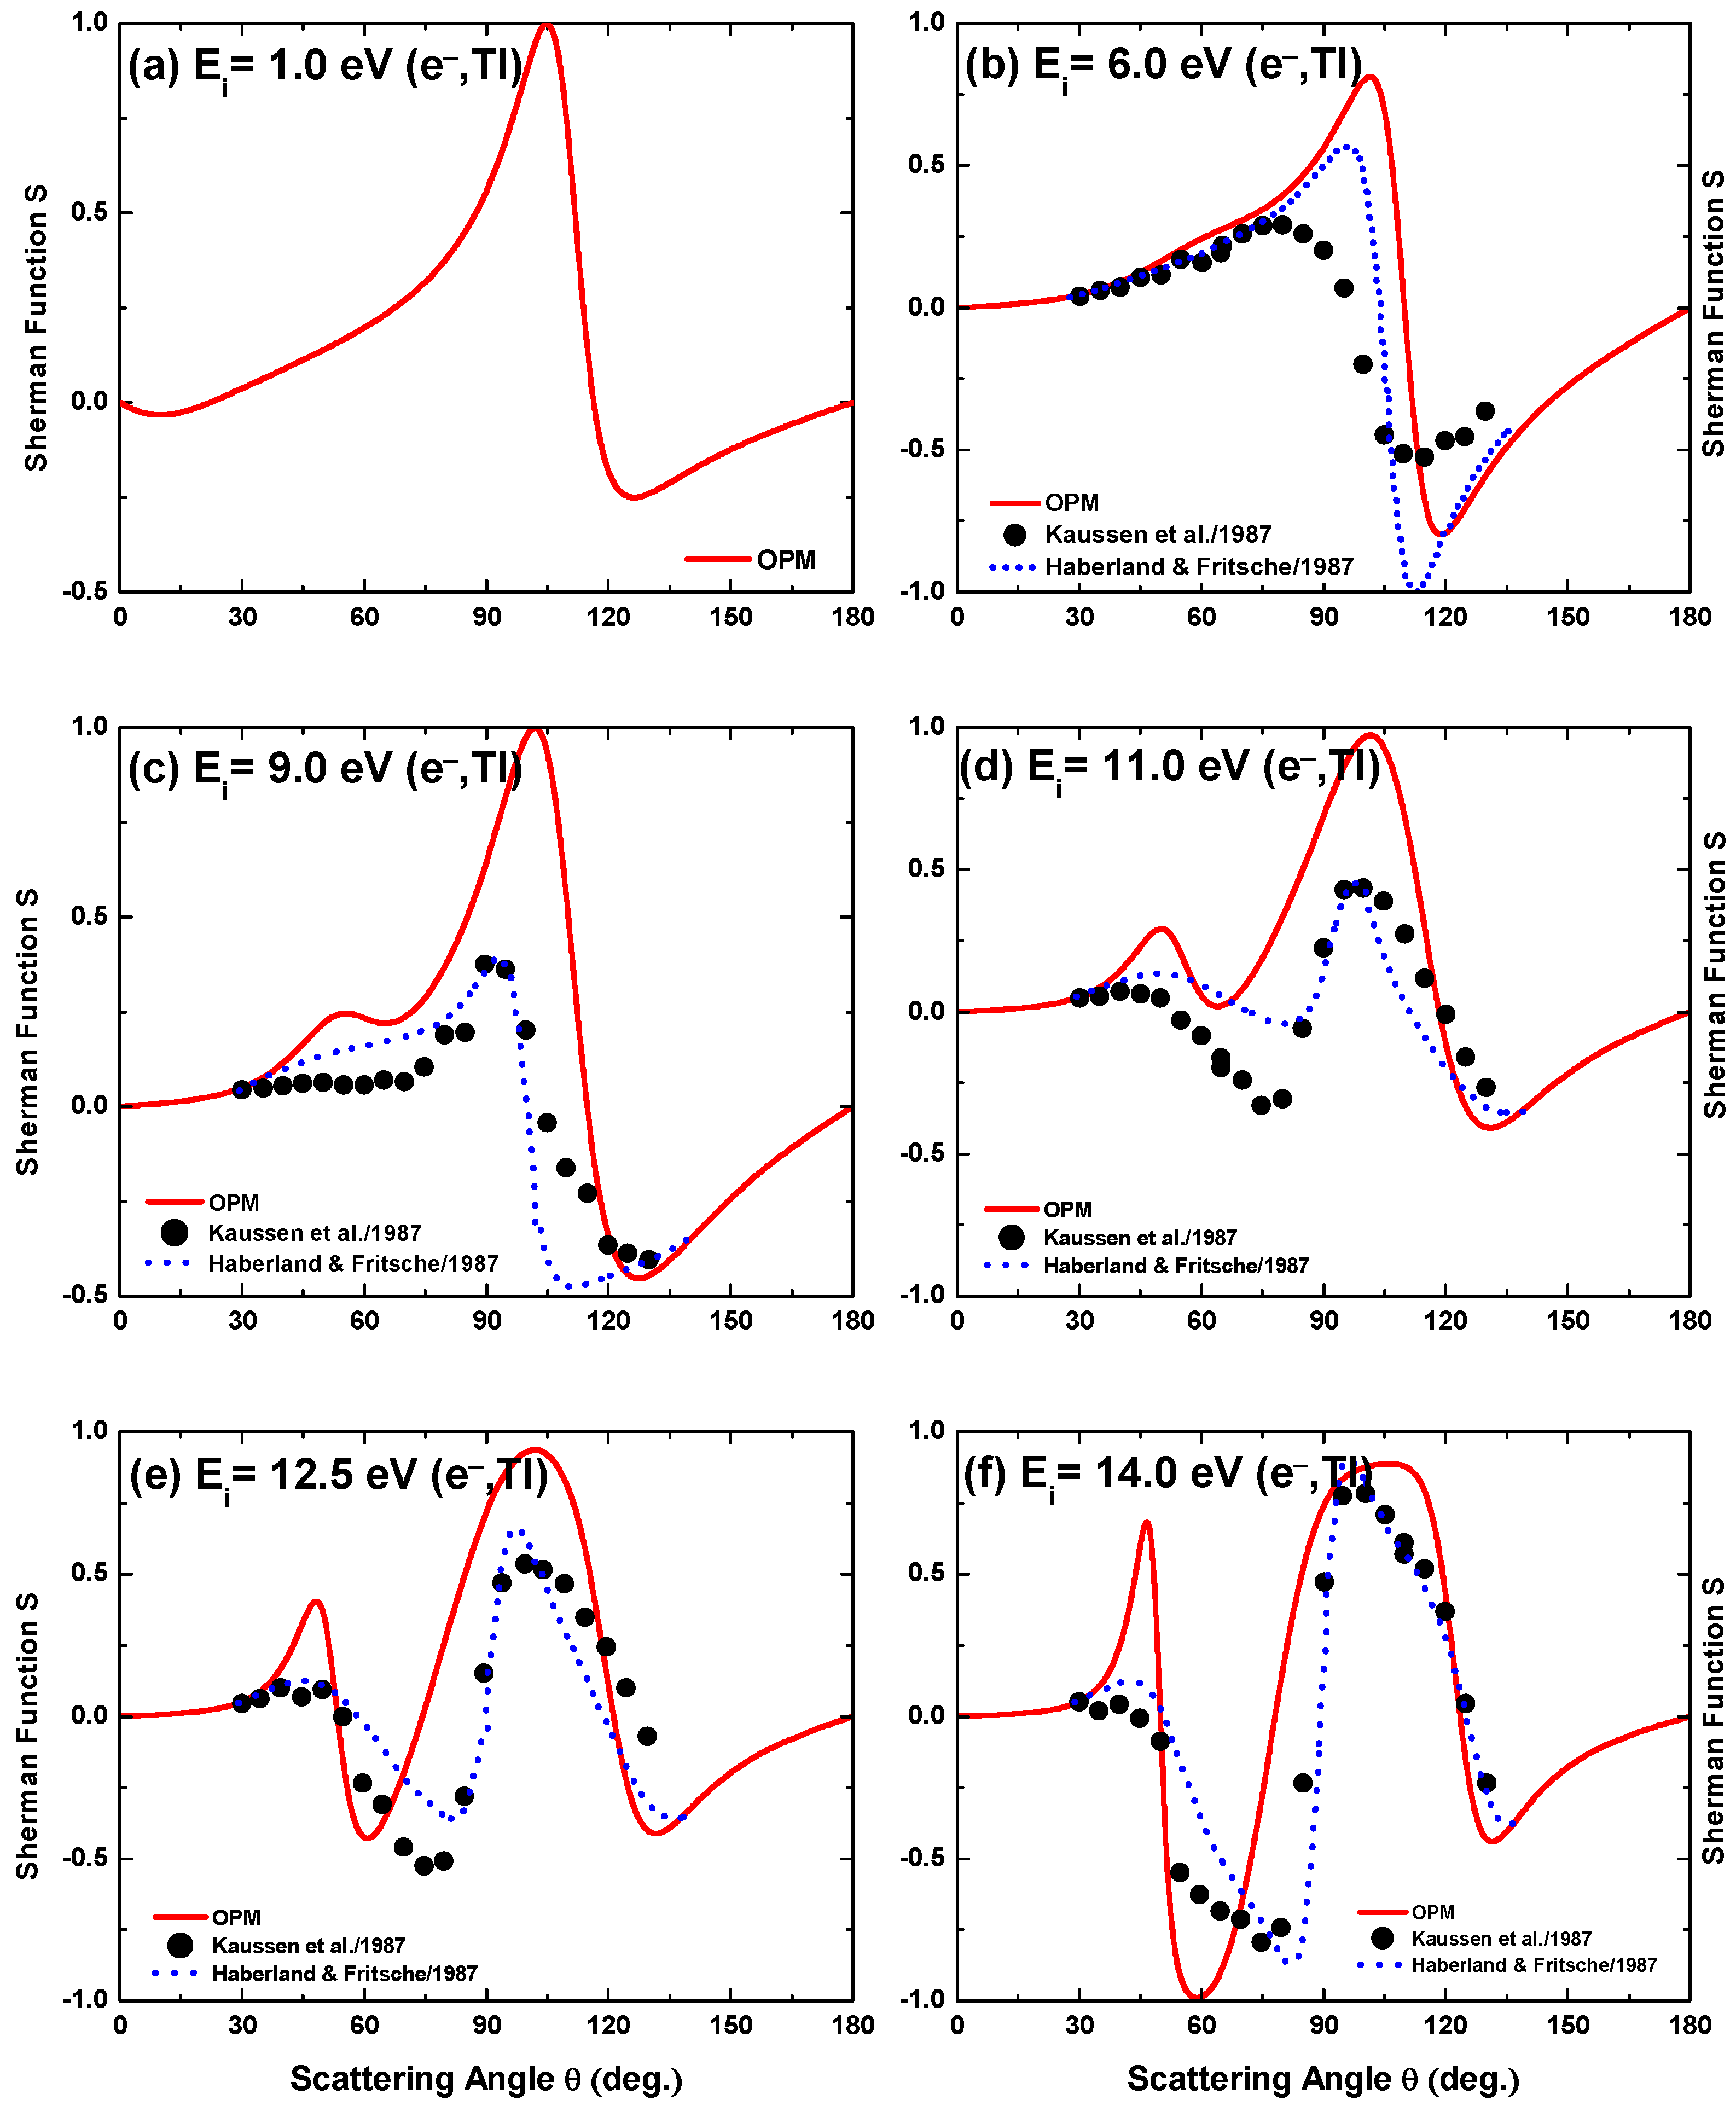
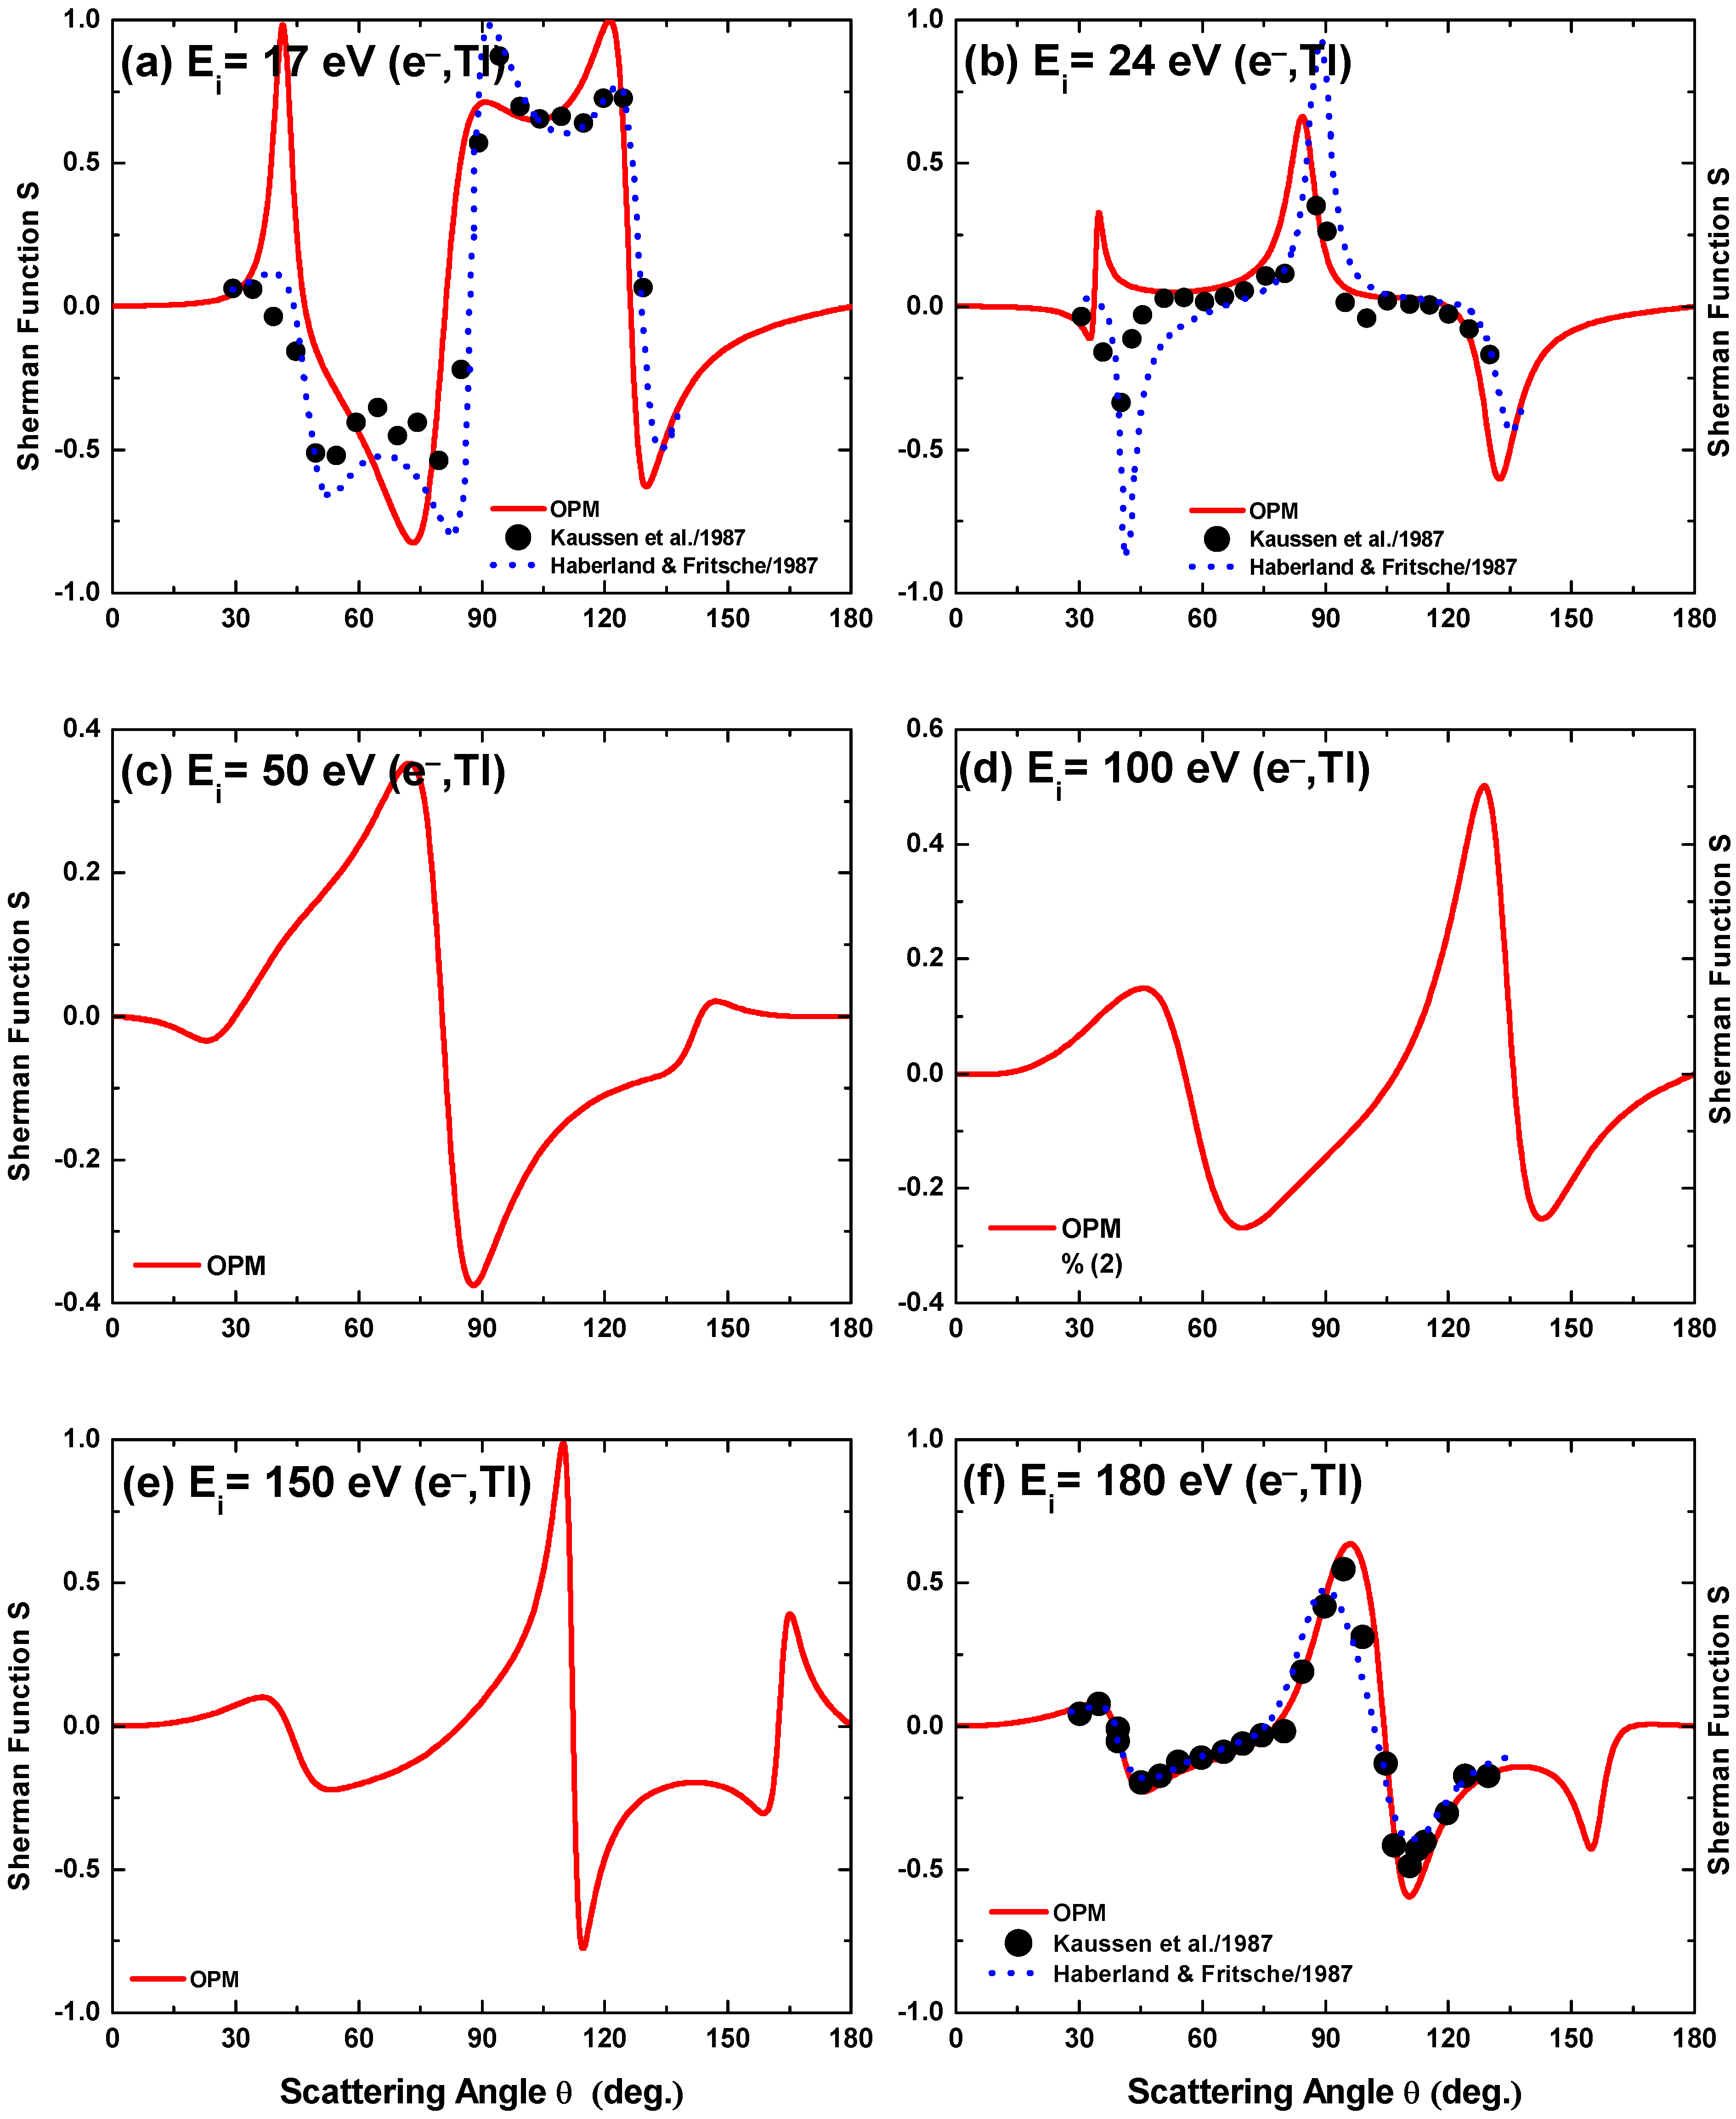
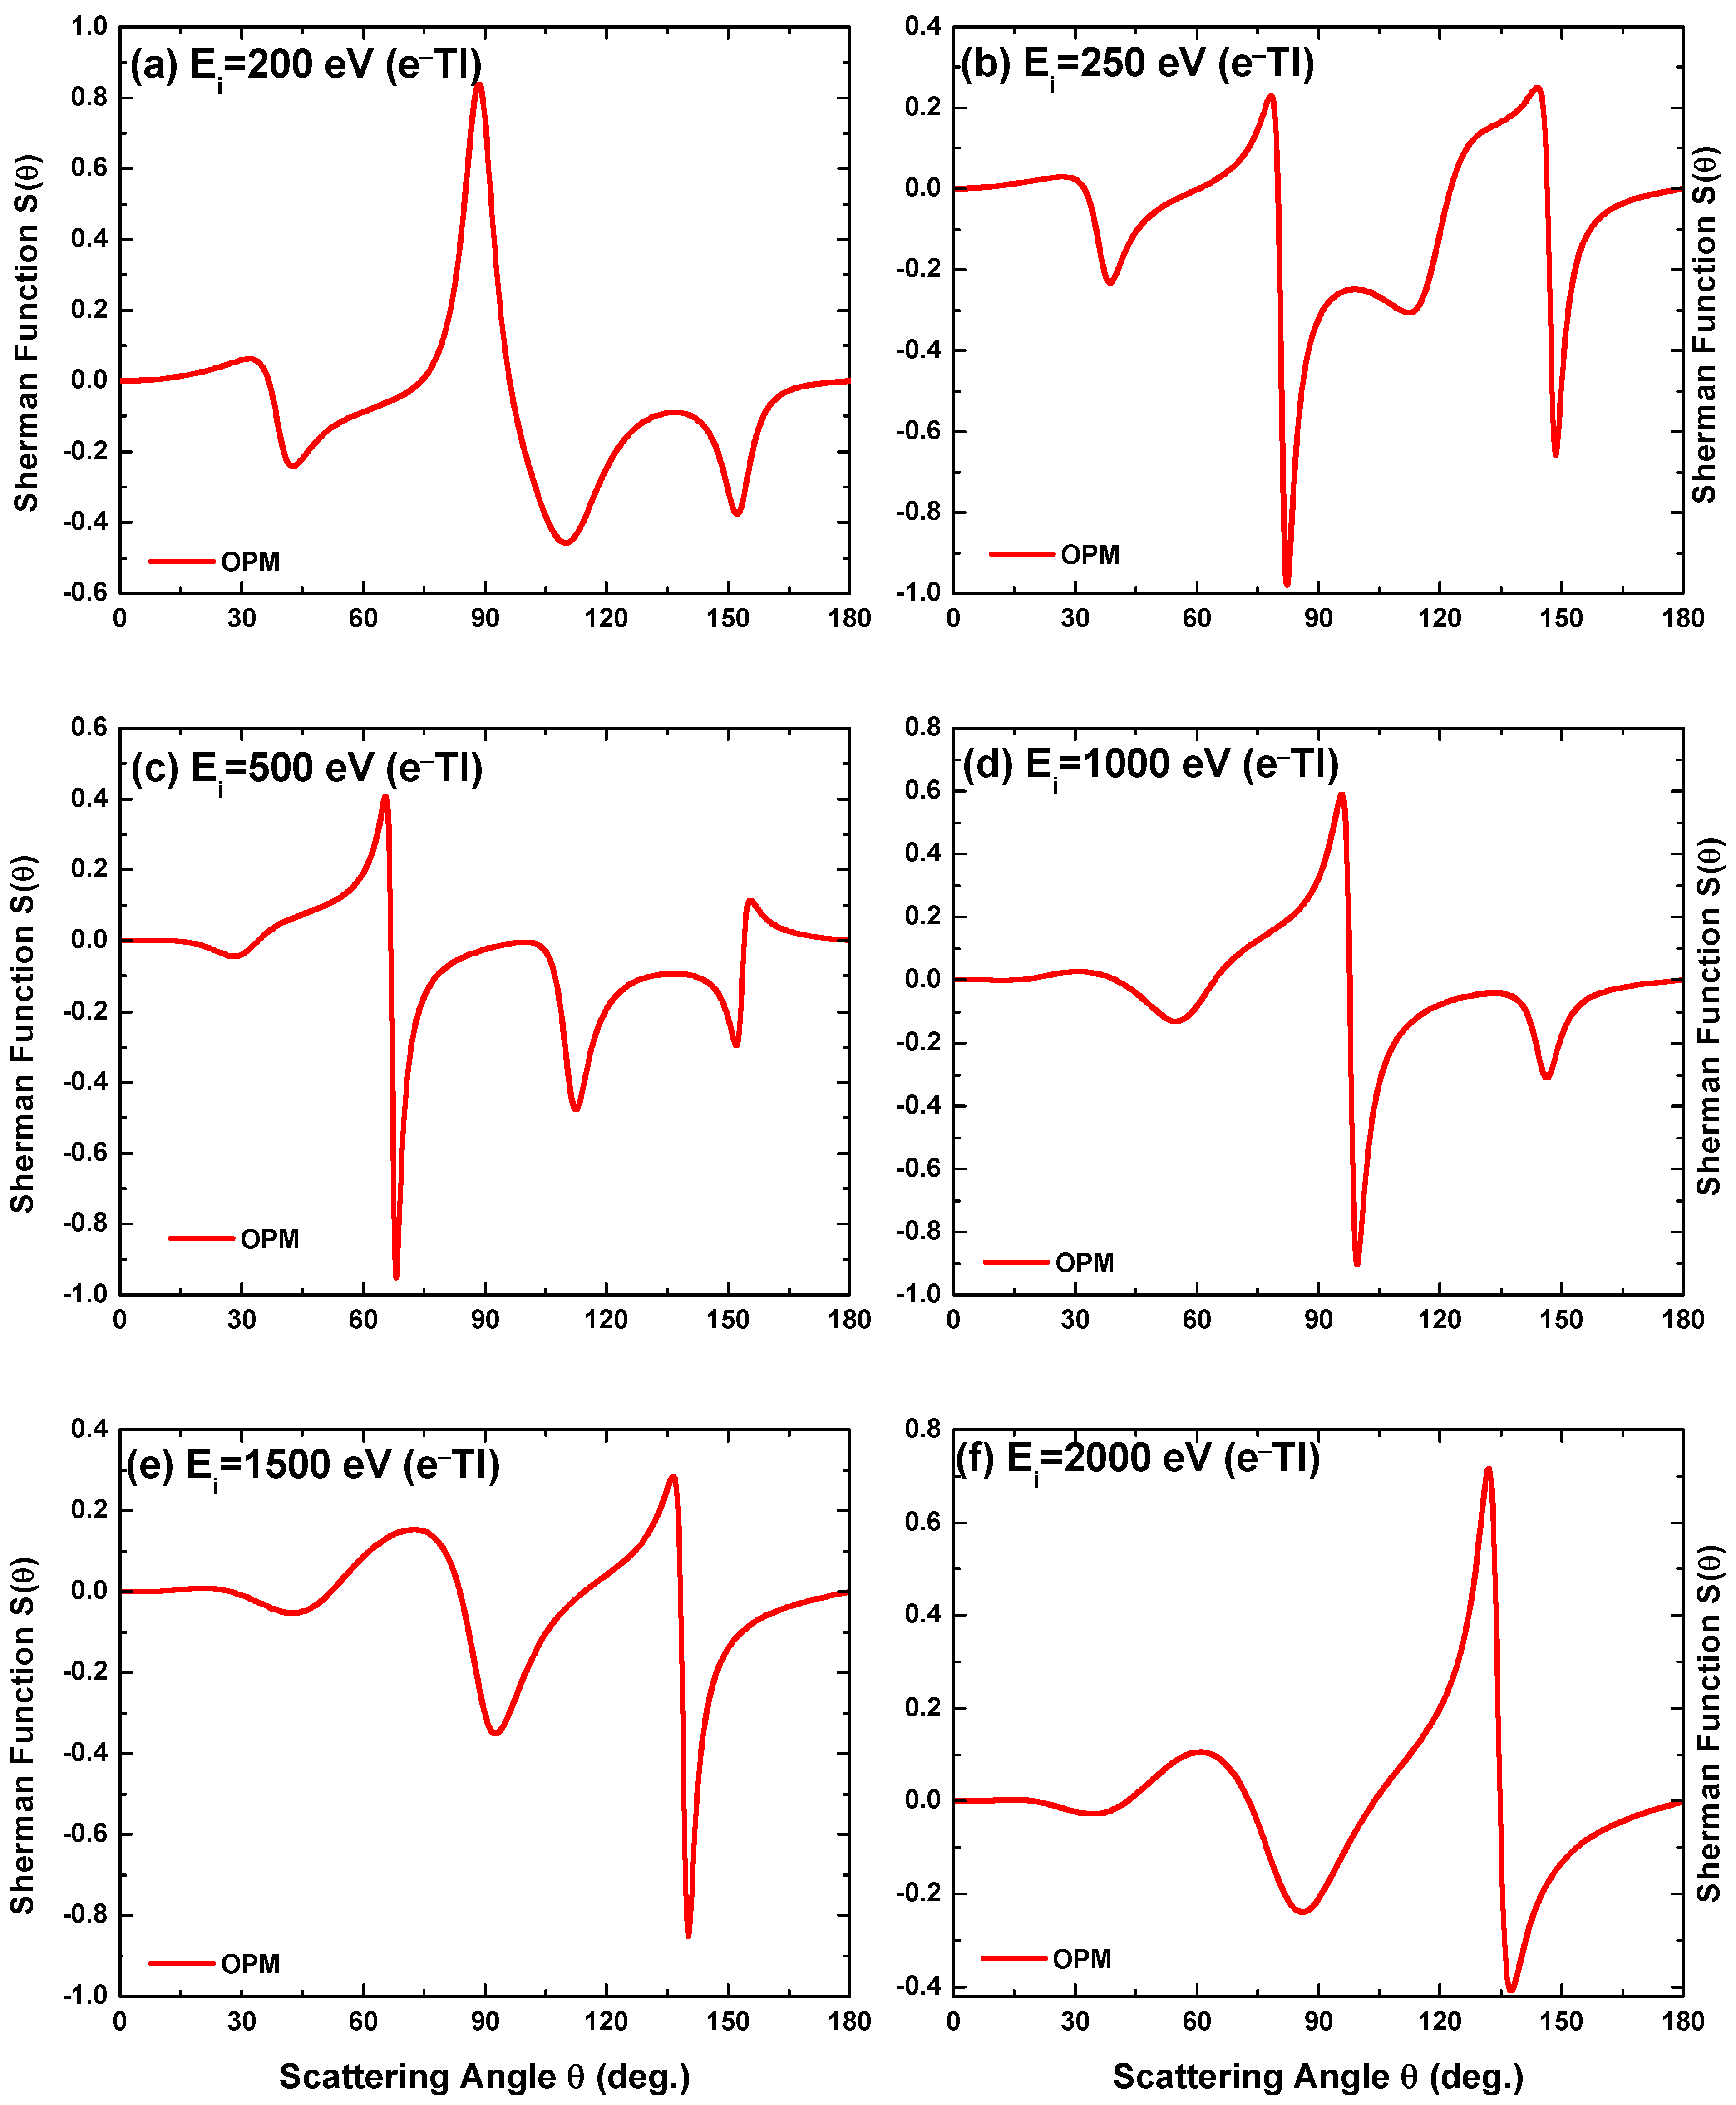
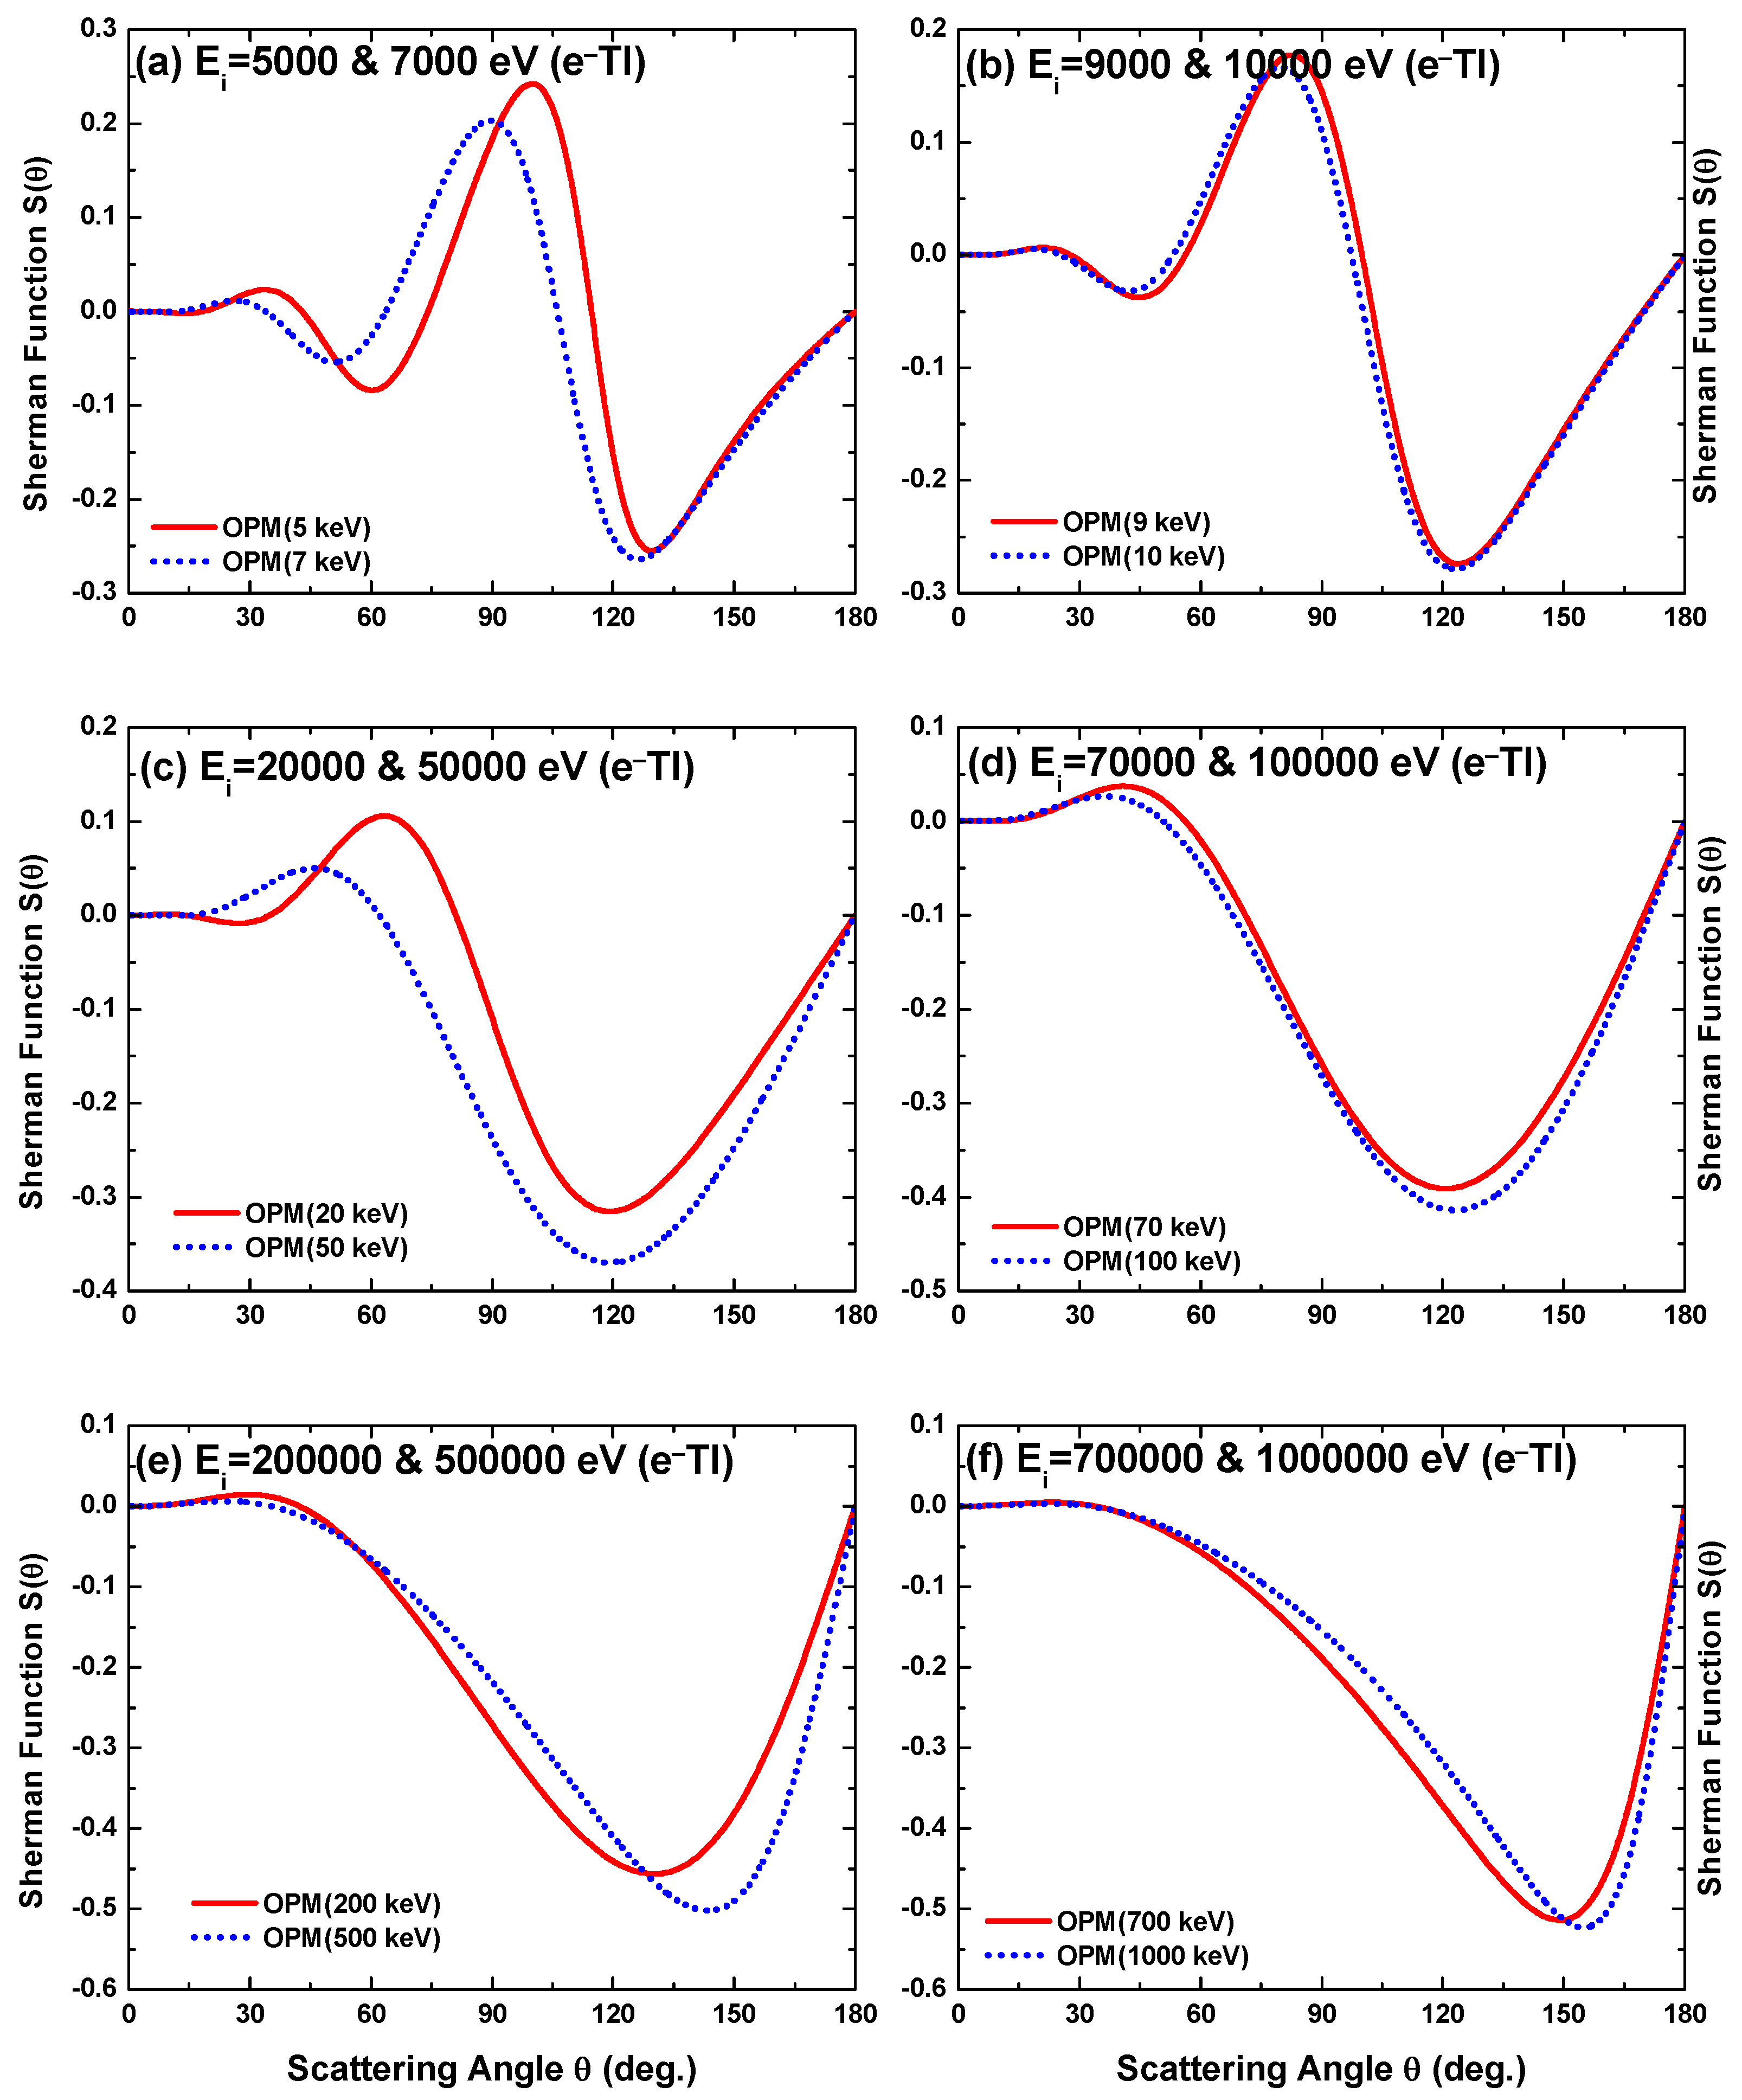
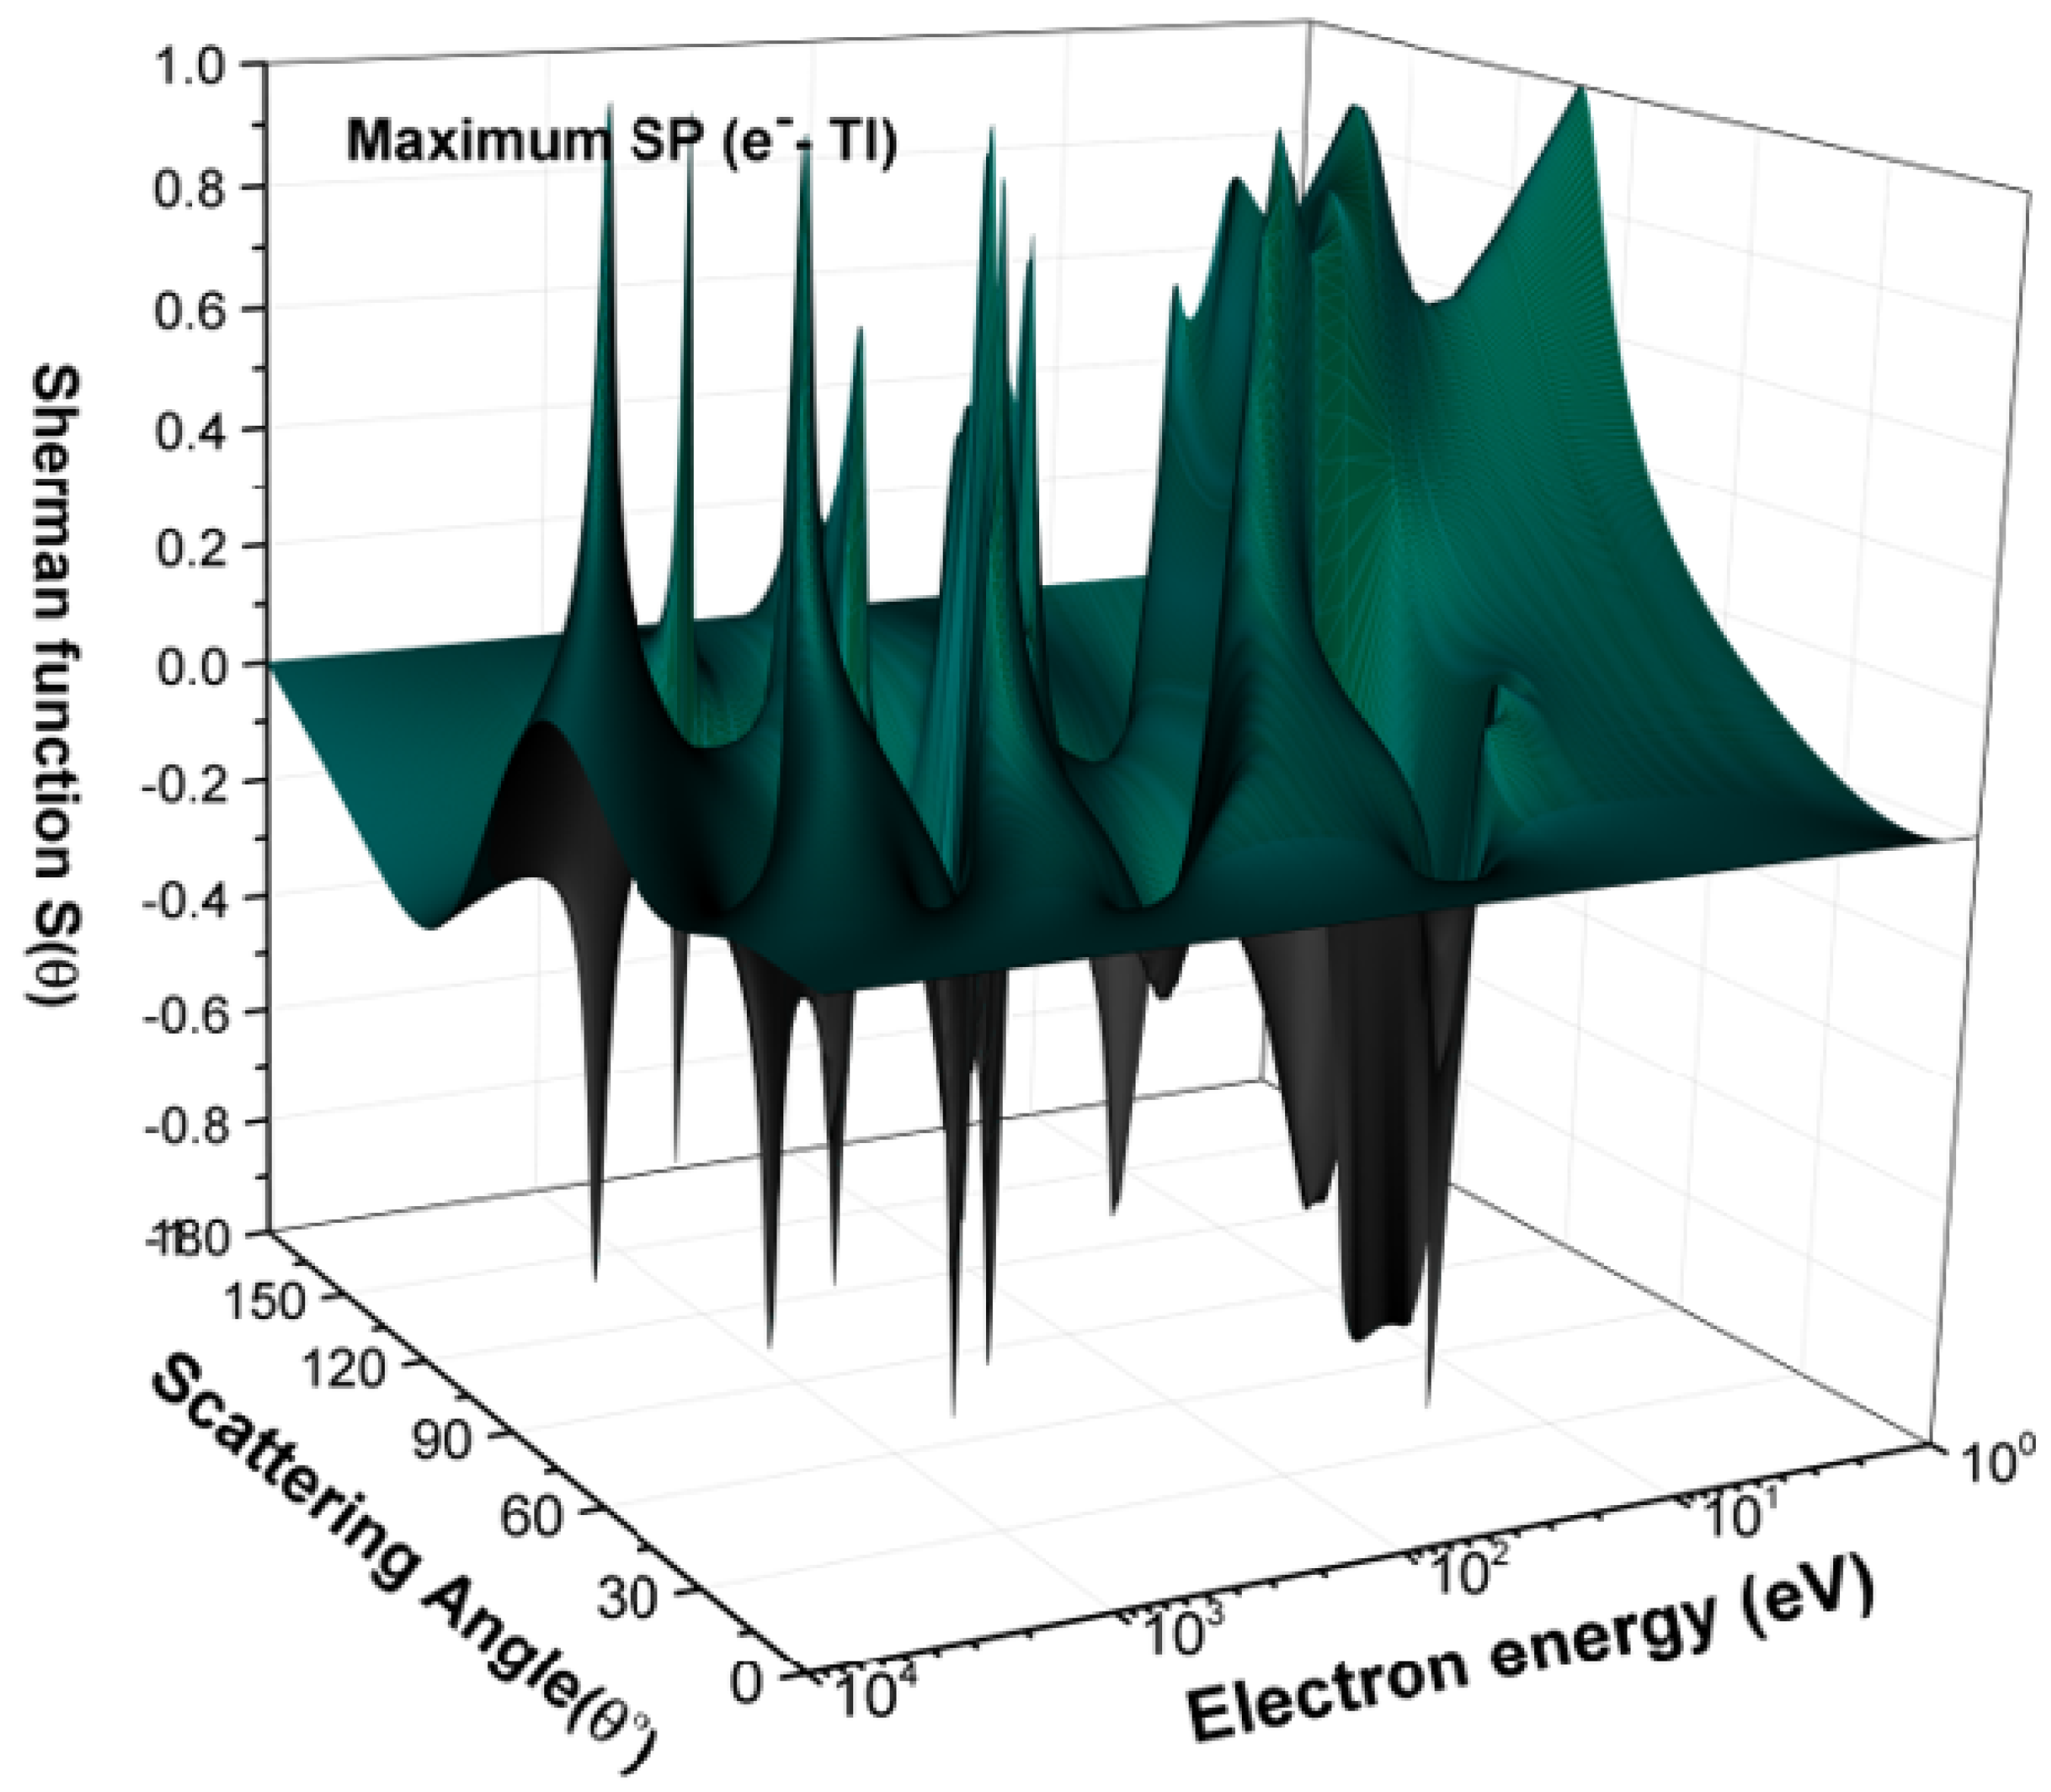
4.1.2. Angle Dependent Sherman Function S ( θ )

The angular dependent Sherman function S ( θ ) for the e–Tl scattering predicted by OPM over the impact energies of 1 eV to 10 MeV is depicted in Figure 10, Figure 11, Figure 12 and Figure 13. Our OPM results for S ( θ ) are compared with the experimental data of Kaussen et al. [34] and the fully relativistic calculations of Haberland and Fritsche [35] for the electron impact energies of 6 eV, 9 eV, 11 eV, 12.5 eV, 14 eV, 17 eV, 24 eV and 180 eV which are shown, respectively, in Figure 10b–f and Figure 11a,b,f. The figures show that, at lower energies, our OPM results exhibit poor agreement with the experimental data as compared to that of Haberland and Fritsche [35]. As the energy increases, the discrepancy between OPM results and the experimental data decreases. At 180 eV, the OPM results show good agreement with the experimental data of [34] and better than that of [35]. With increasing electron energy, the height of the positive peak of S diminishes and, after 0.2 MeV, it vanishes. With a further increasing of electron energy, the height of the negative peak of S increases, and, at 1 MeV, the value of the negative peak is the highest. We found no experimental and/or theoretical data in the literature for angular dependent S in the other energies to compare with. We perform these calculations in anticipation that these will stimulate upcoming theoretical and experimental research.

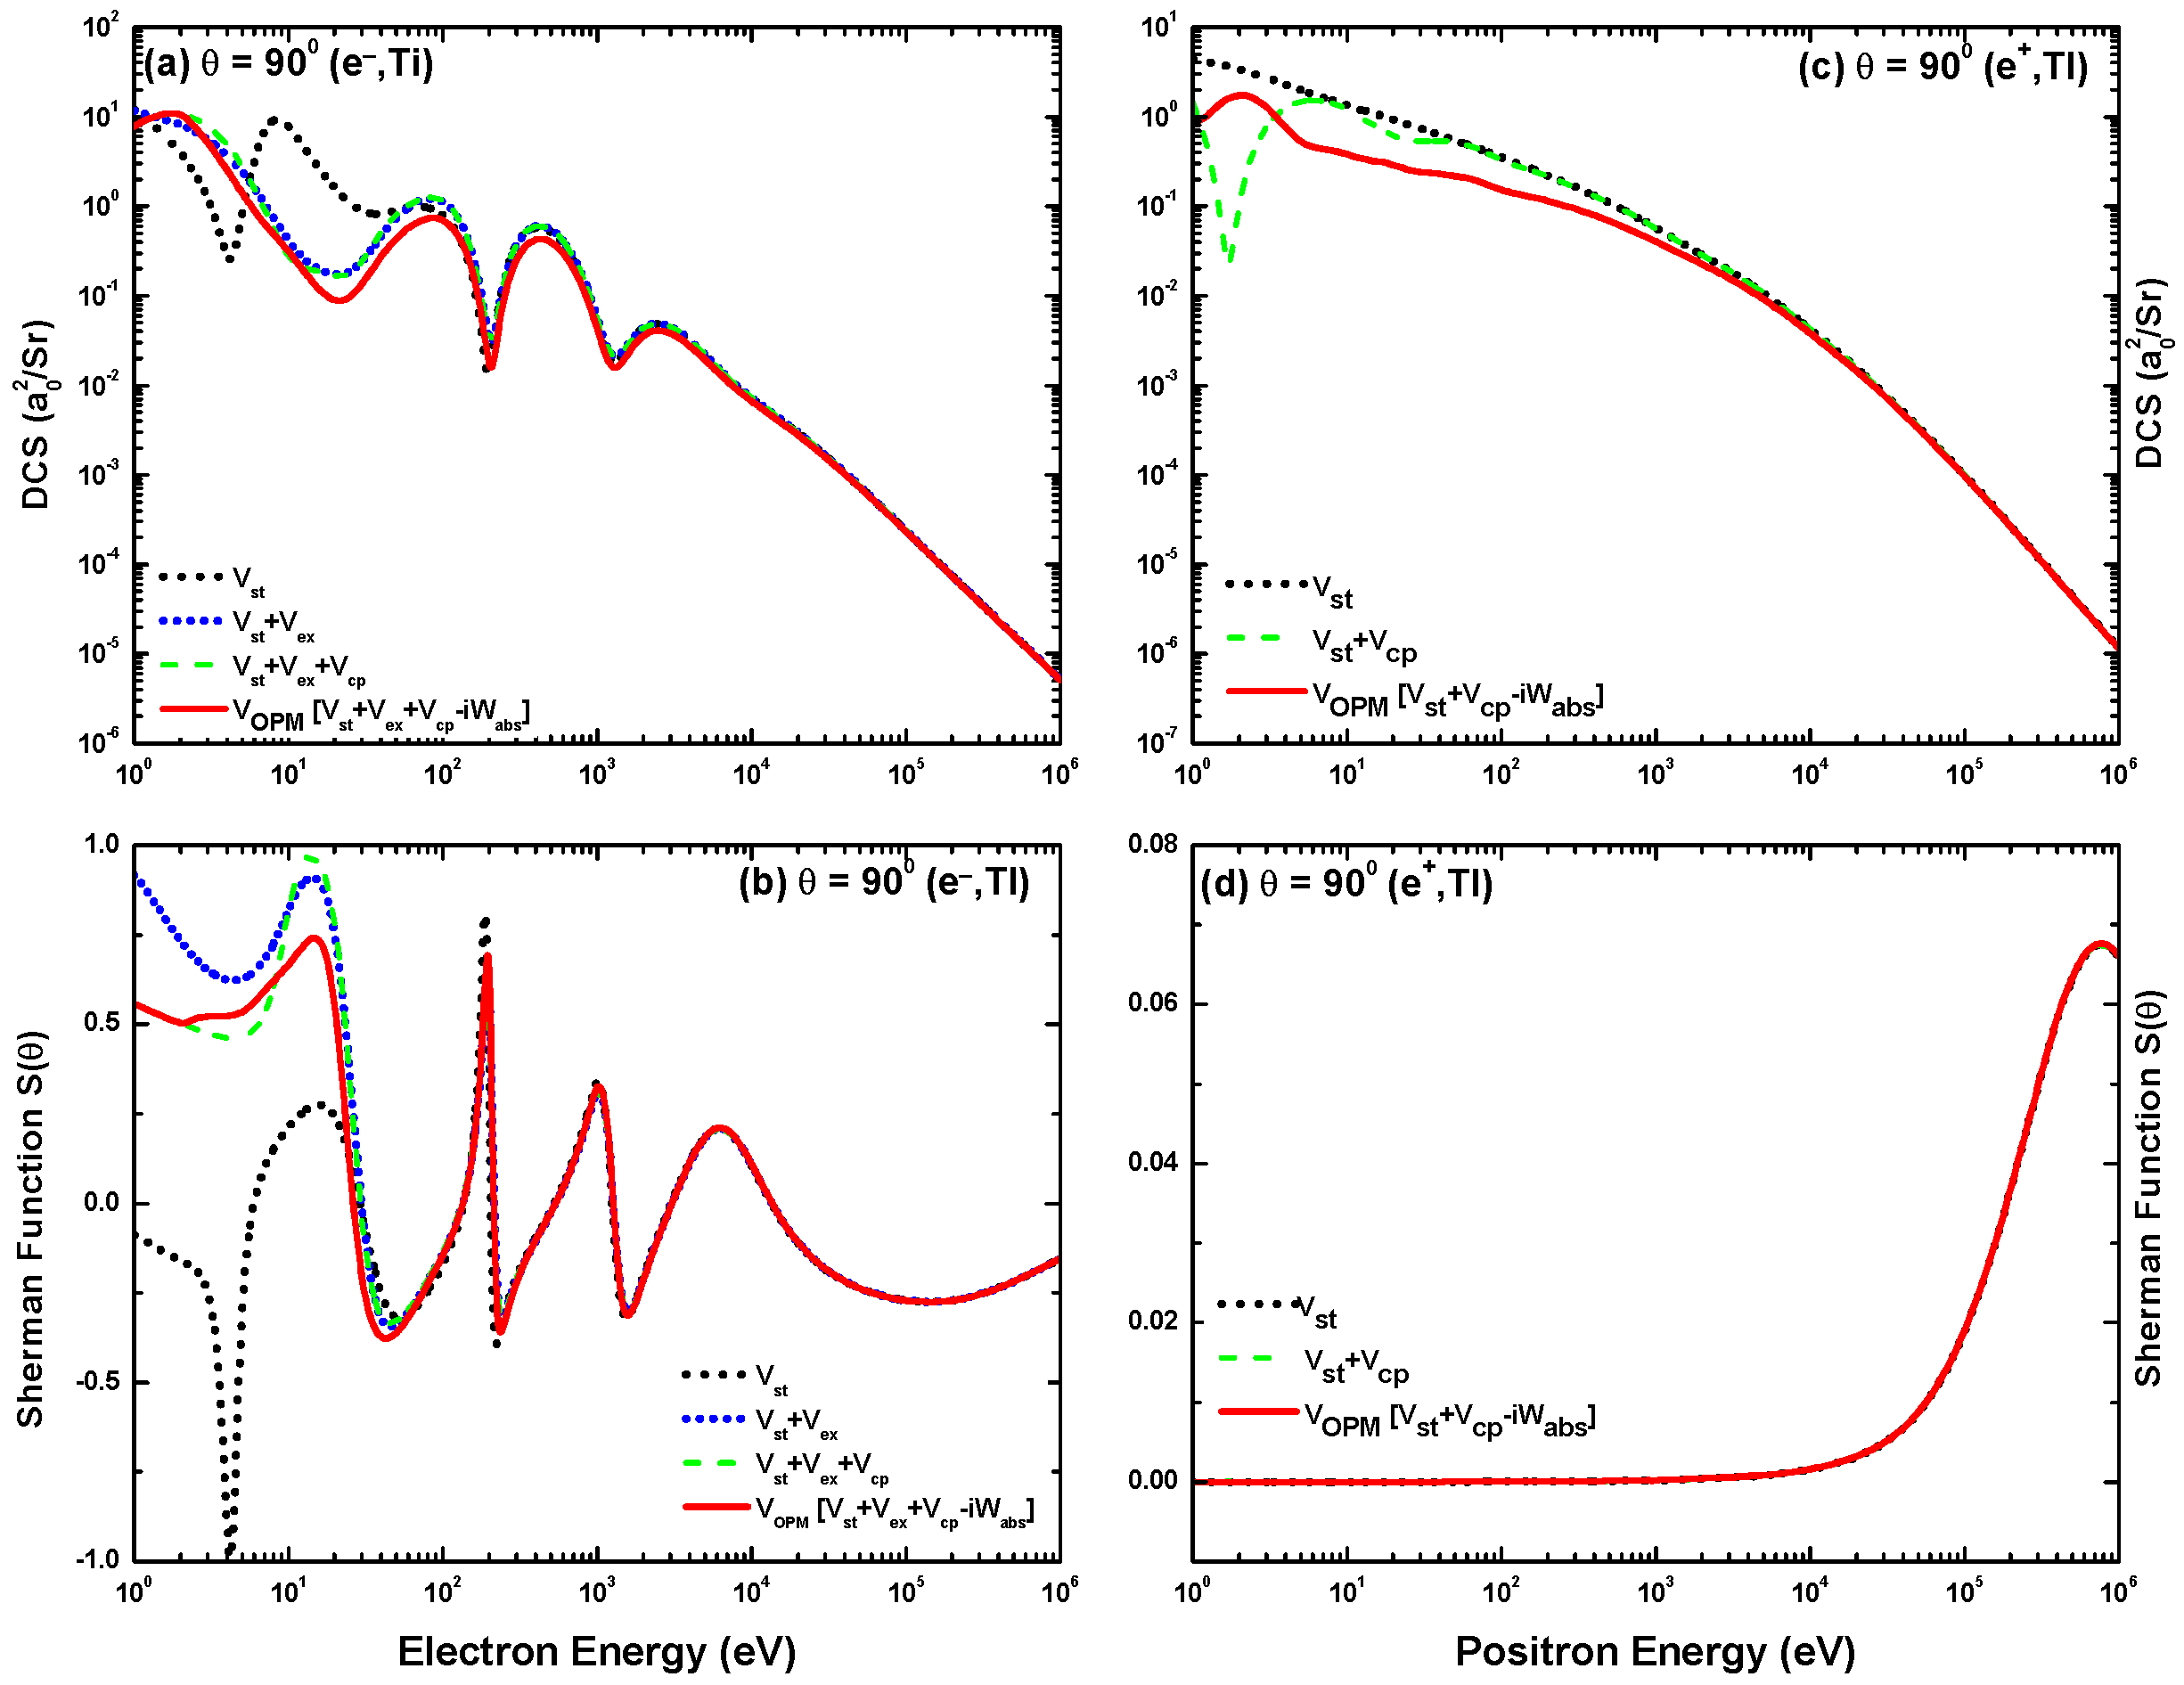
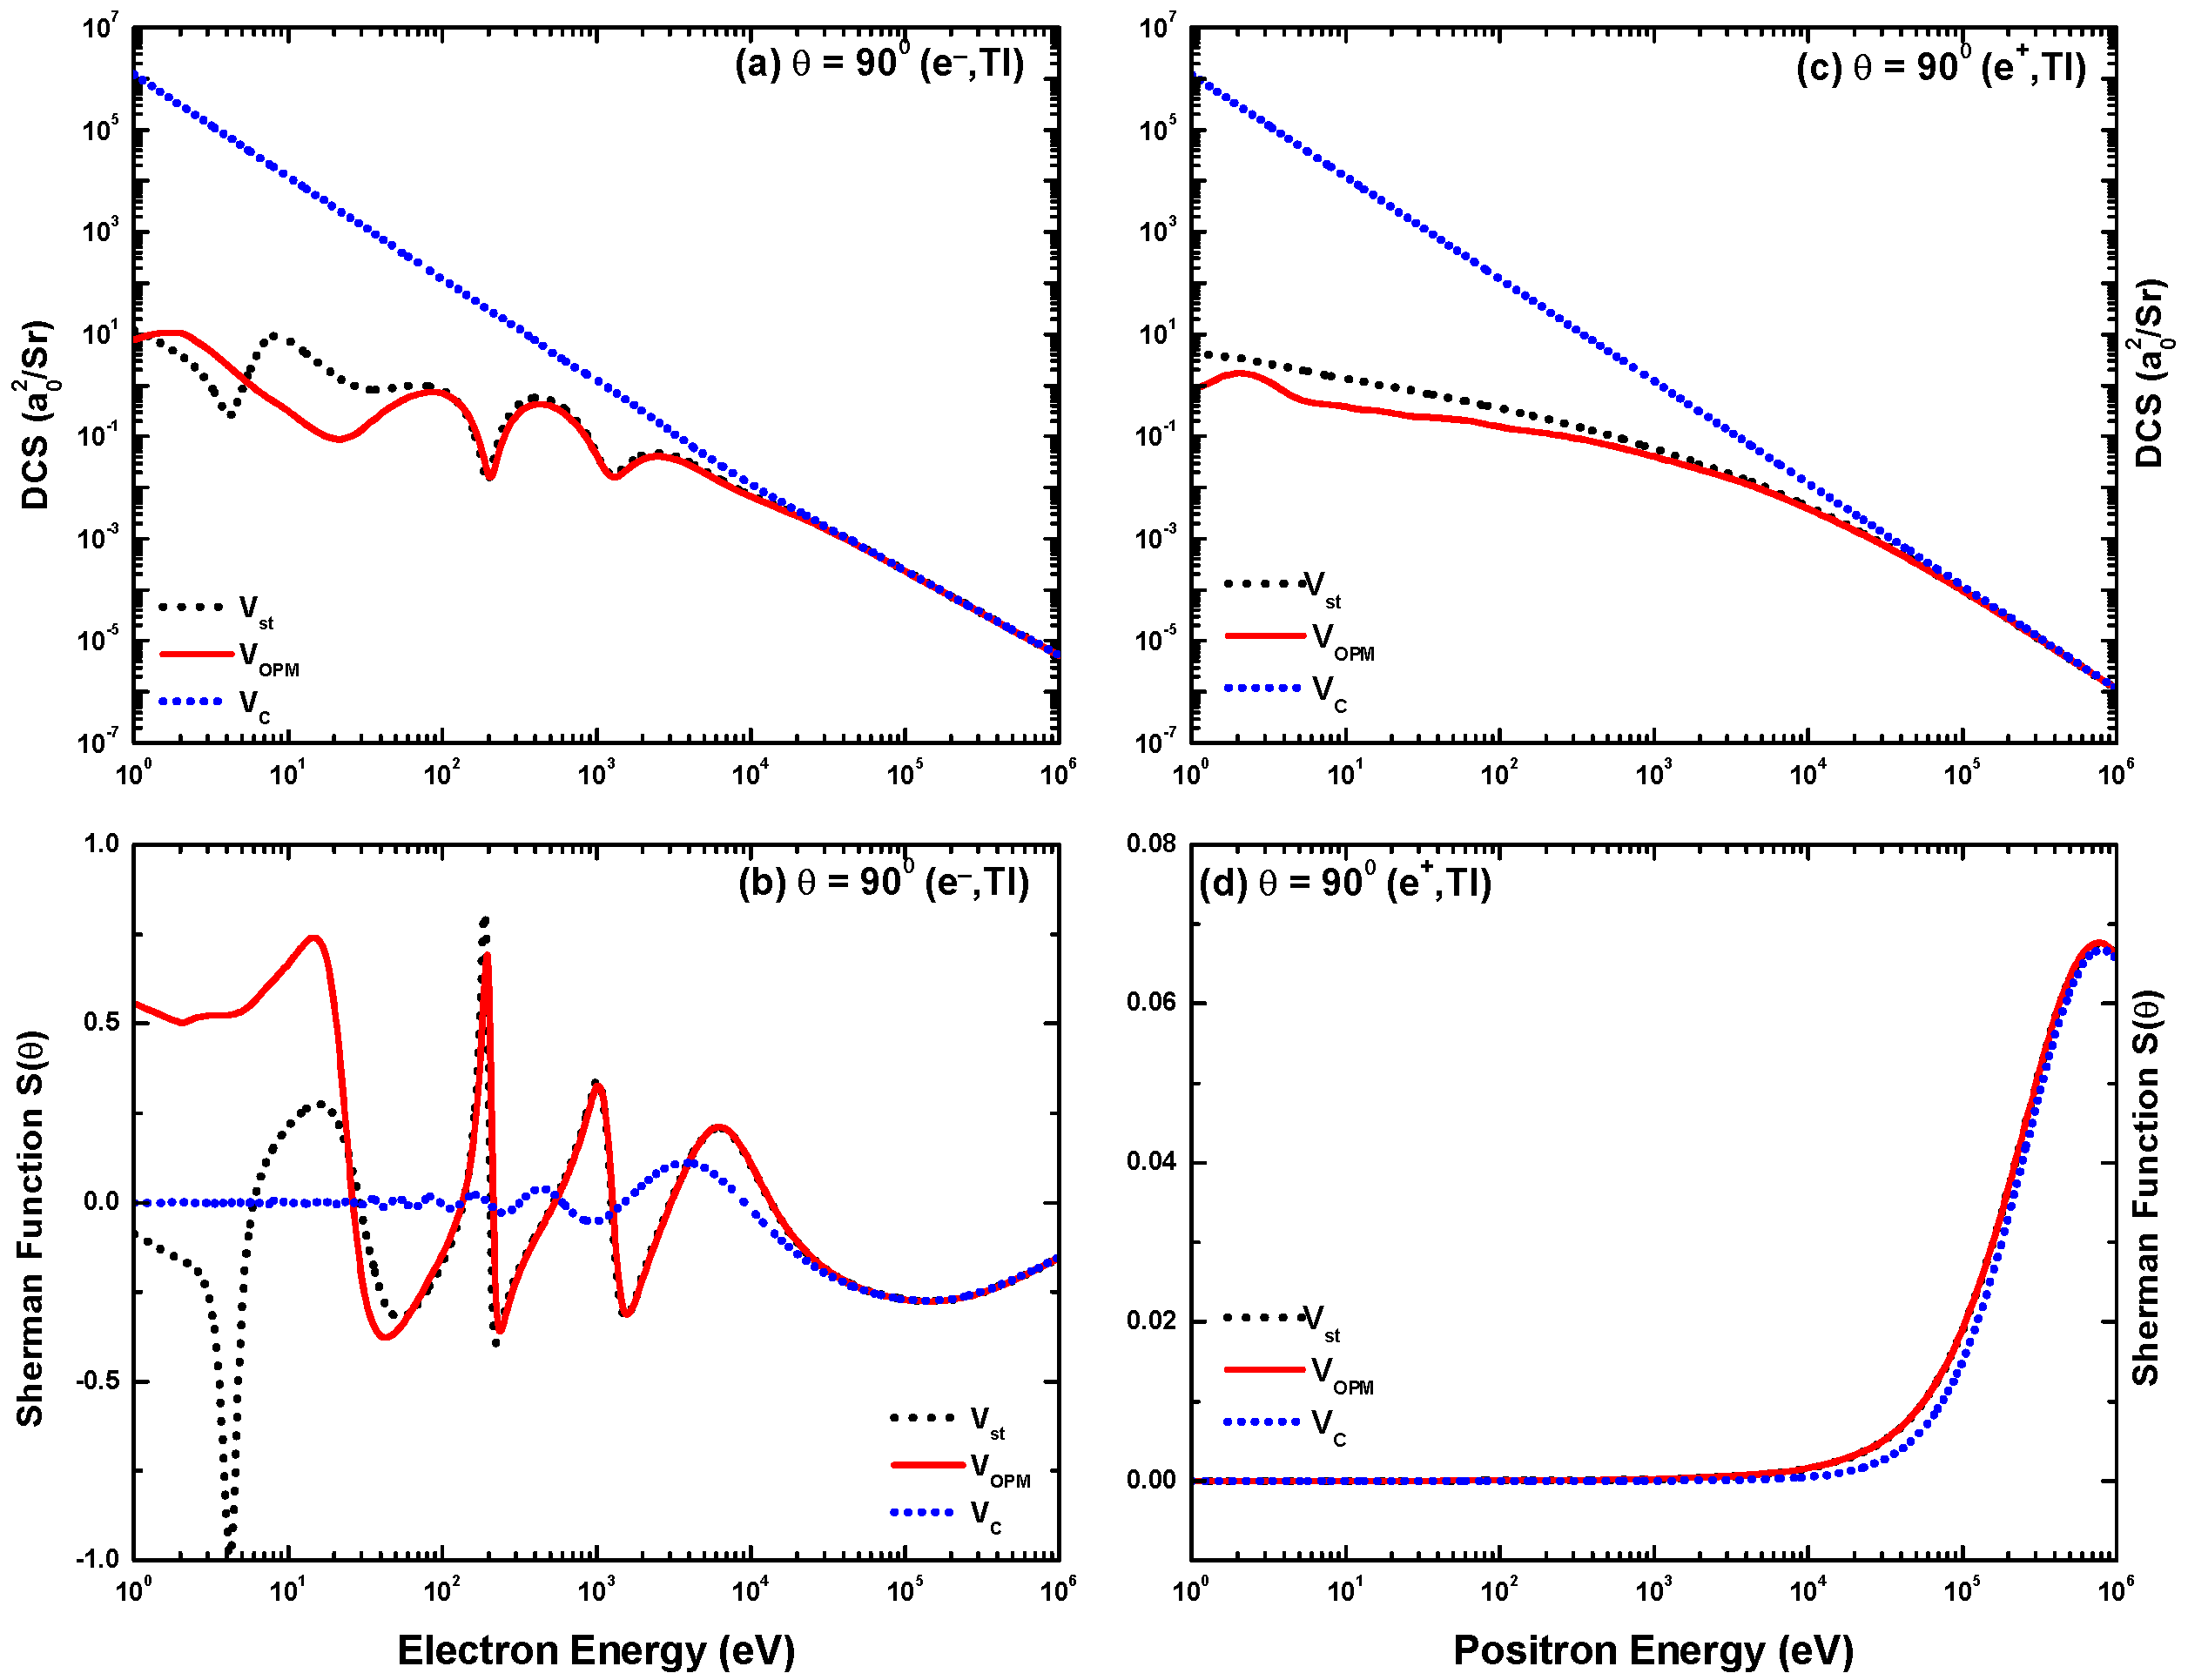
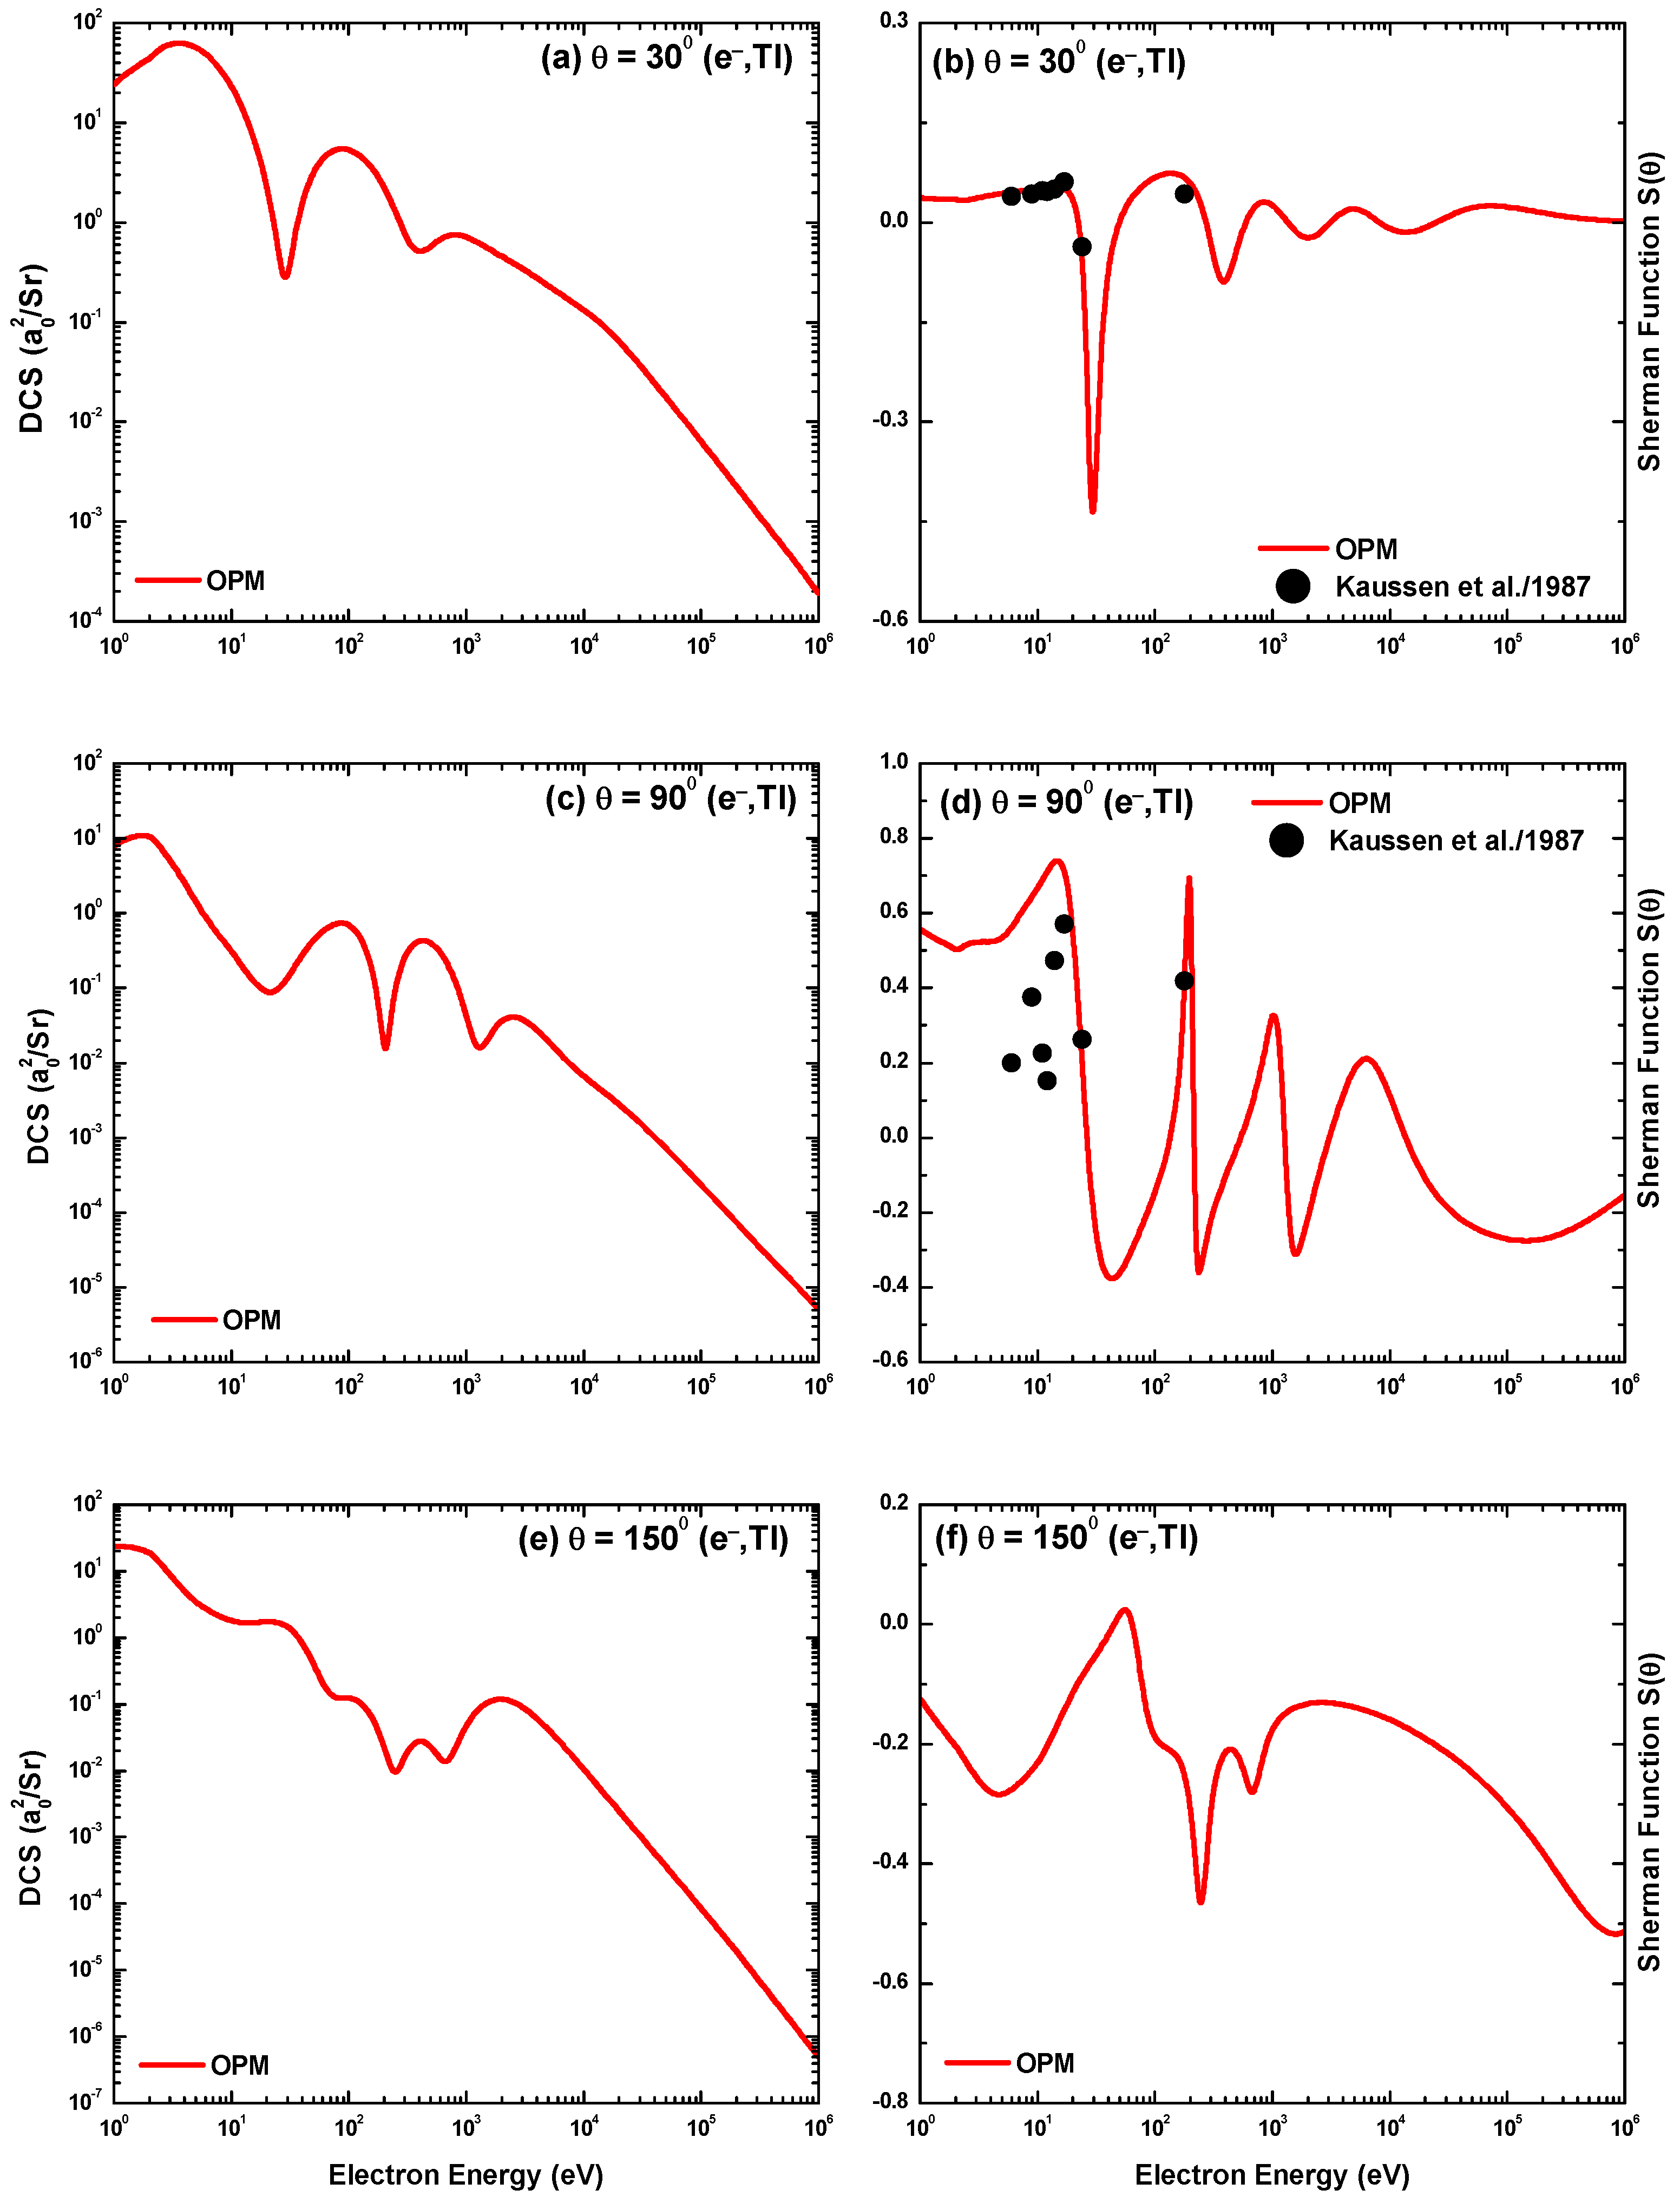
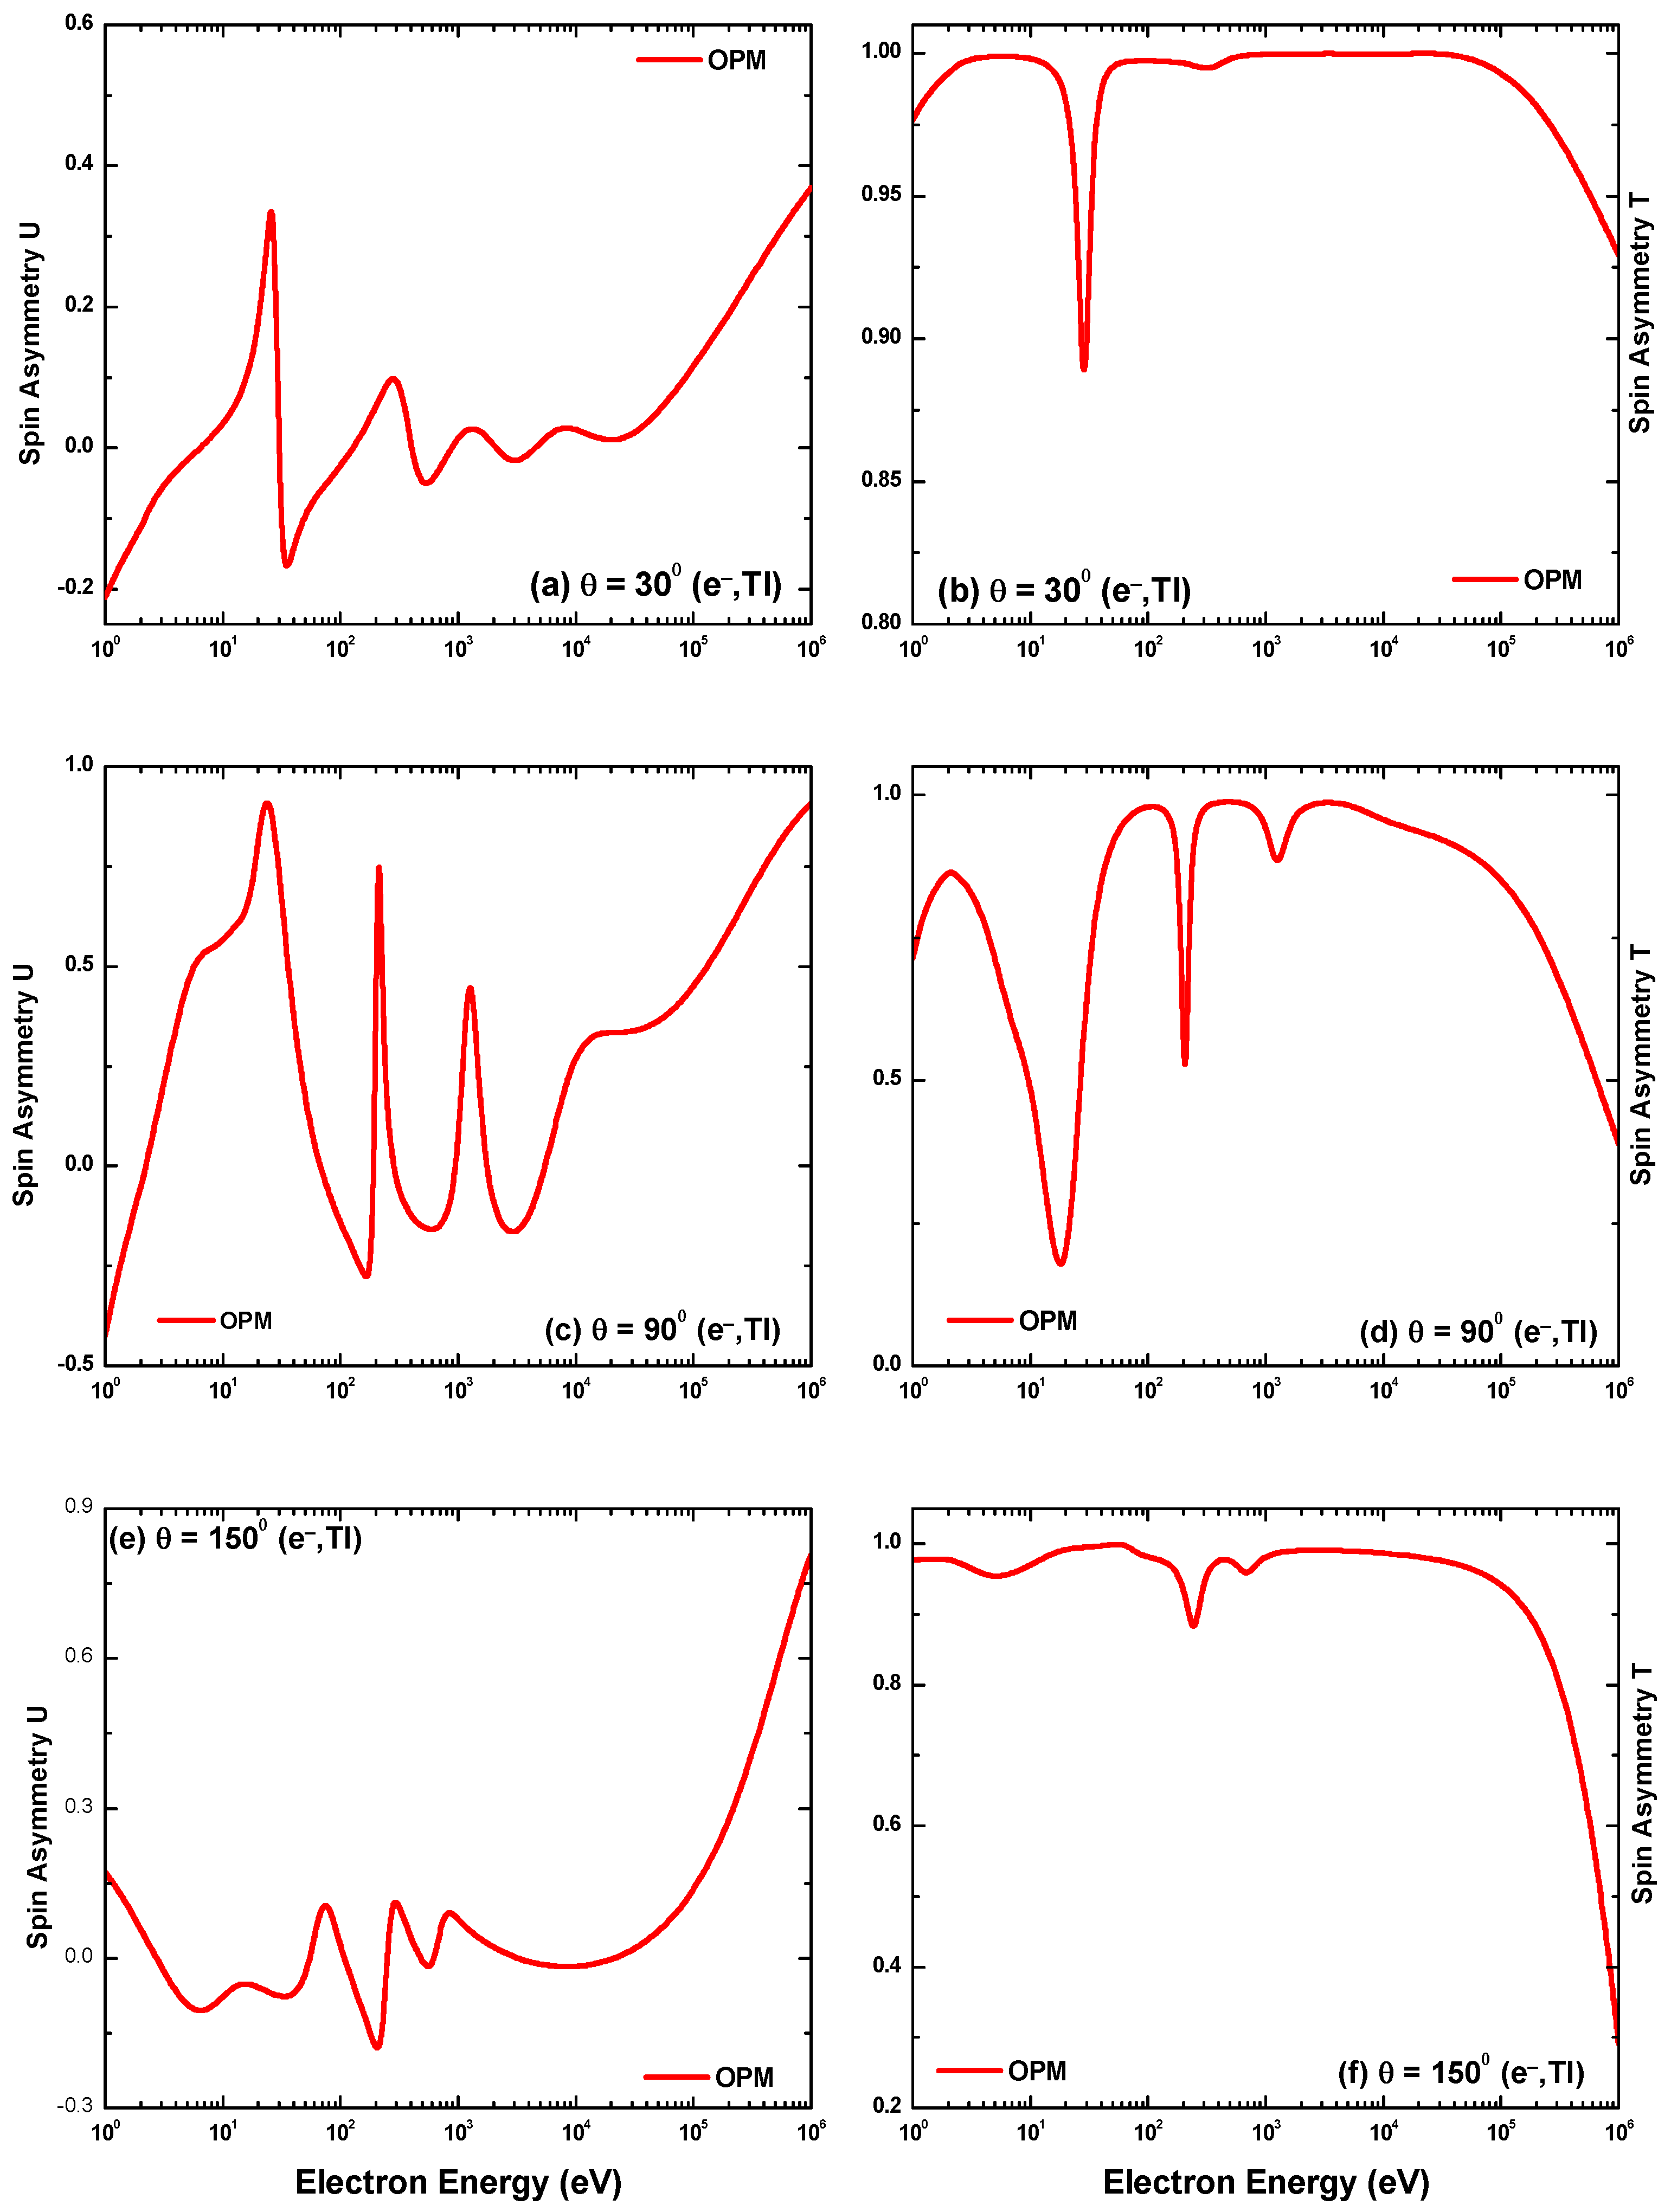
4.1.3. Energy Dependent DCS and Spin Polarization Parameters

DCS and Spin polarization parameters S ( θ ) , U and T as a function of electron energy for e–Tl scattering over the energy region, from 1 eV to 1 MeV at scattering angles 30°, 90° and 150°, are shown in Figure 14 and Figure 15. It is evident from Figure 14a,c,e that the overall magnitude of DCS decreased as the projectile energy increased. Thus, as projectile energies increase, scattering becomes less effective. At all scattering angles, strong Ramsauer–Townsend (R–T) structures can be seen up to incident energy of 3 keV. As electron energy increases, the R–T structures start to diminish.
Energy-dependent Sherman function S ( θ ) , predicted by our OPM results, are shown in Figure 14b,d,f at scattering angles 30°, 90° and 150°, respectively, and compared with the available data [34]. It is seen that oscillations in the S ( θ ) are more markable in our OPM calculations because S ( θ ) is most sensitive to the potentials and methods of calculations used. Additionally, it is clear from figures that the magnitude of S ( θ ) rises with the scattering angle, falls with collision energy, and eventually disappears at energy above 1 MeV. One possible reason is that, for a particular scattering process, the stronger nuclear field significantly affects S ( θ ) at smaller projectile–nuclear distances. The highest magnitude of oscillation in S ( θ ) is at 90°.
Figure 15 presents the OPM-calculated U and T results. These symmetry parameters are produced by the interference effect of the spin–flip and direct scattering amplitudes. Our OPM shows remarkable oscillations in U and T. The magnitude of the parameter U increases with increasing energy and scattering angle and has reached nearly unity at θ = 90° and E i = 24 eV. On the other hand, the magnitude of T decreases with increasing energy and reached nearly zero at θ = 90° and E i = 24 eV. It is obvious from Figure 15 that the behavior of U is opposite to that of T. With increased projectile energy, T decreases while U grows. In terms of asymptotics, U tends to 1 and T tends to 0. The same behaviour of the spin asymmetry parameters is found in our previous studies of other atoms [29].

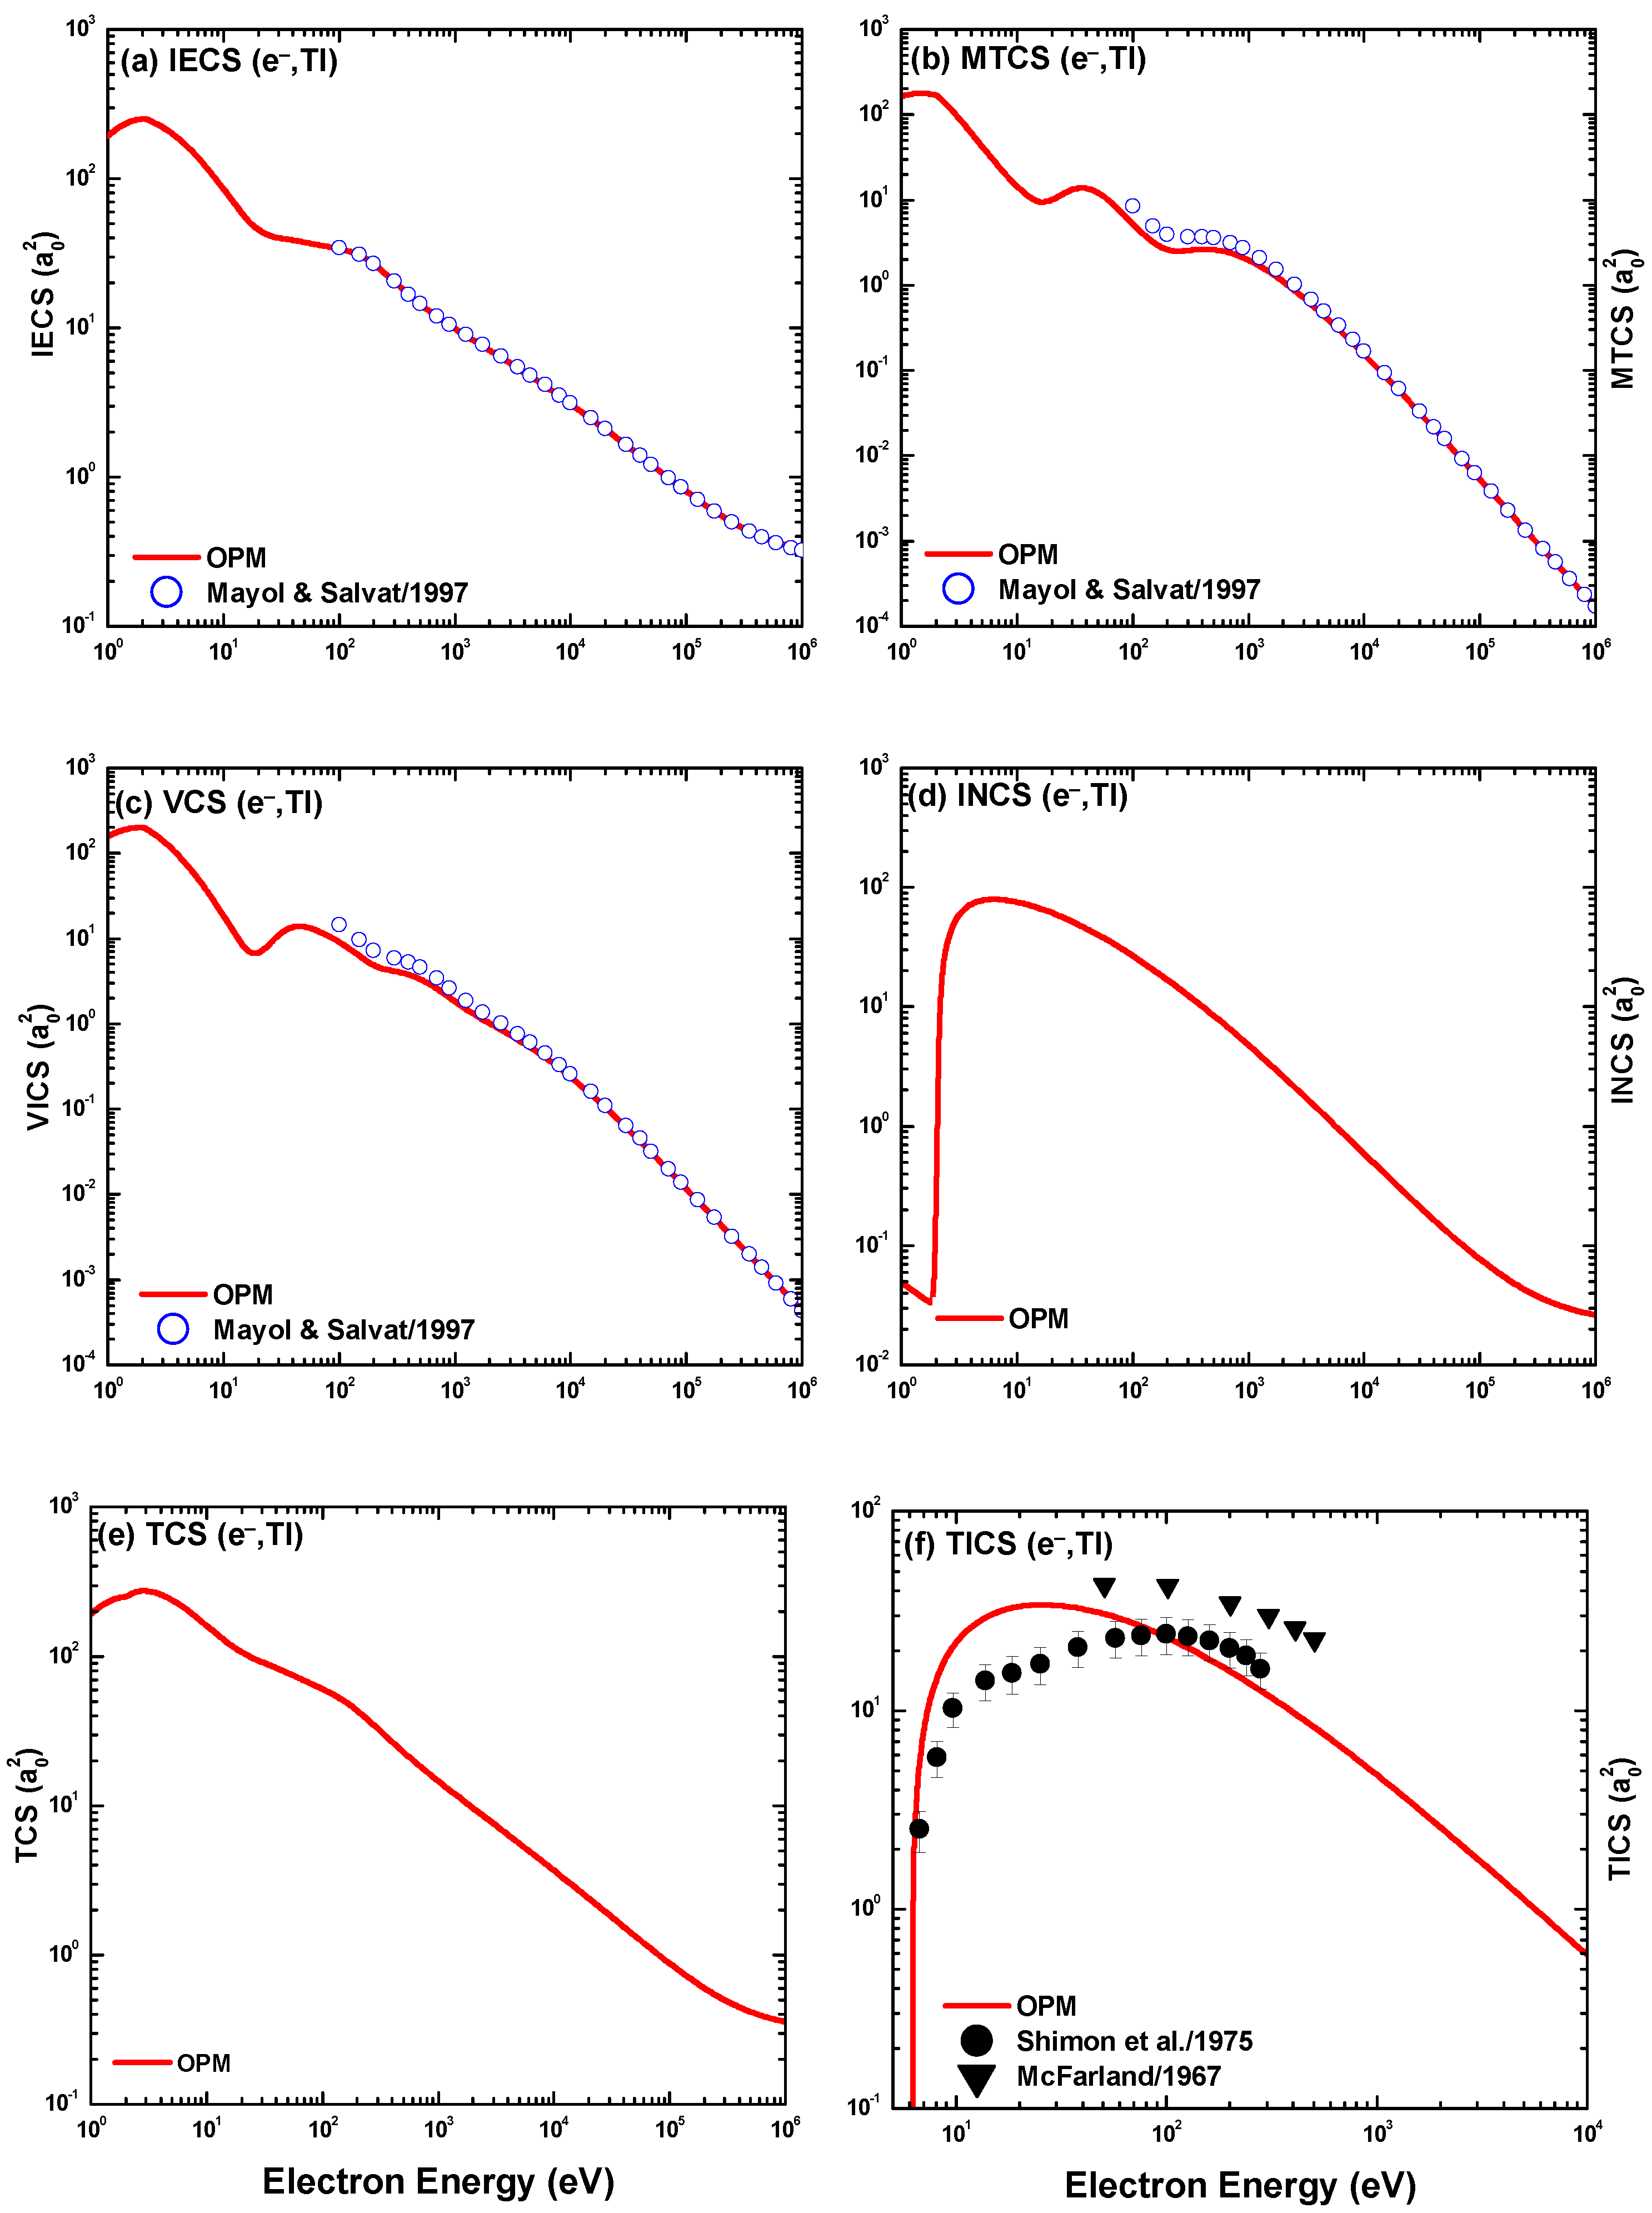
4.1.4. Energy Dependent IECS, MTCS, VCS, INCS, TCS and TICS

Figure 16 presents our results of IECS, MTCS, VCS, INCS, TCS and TICS for e–Tl scattering by applying OPM over the energy range 1 eV to 1 MeV. The findings of IECS, MTCS and VCS are compared with the Dirac–Hartree–Fock calculations of Mayol and Salvat [37]. As can be seen from these figures, at energies close to and over 1 keV for MTCS and VCS, the current estimates produce overall good agreement with the calculations of [37]. For IECS, it shows an excellent agreement with [37] throughout the compared energy region. Our TICS results are compared with the experimental data of McFarland [59] and Shimon et al. [60], and a reasonable agreement is observed. We found no experimental data as well as theoretical calculations of e–Tl scattering for INCS and TCS to compare with our OPM predictions.

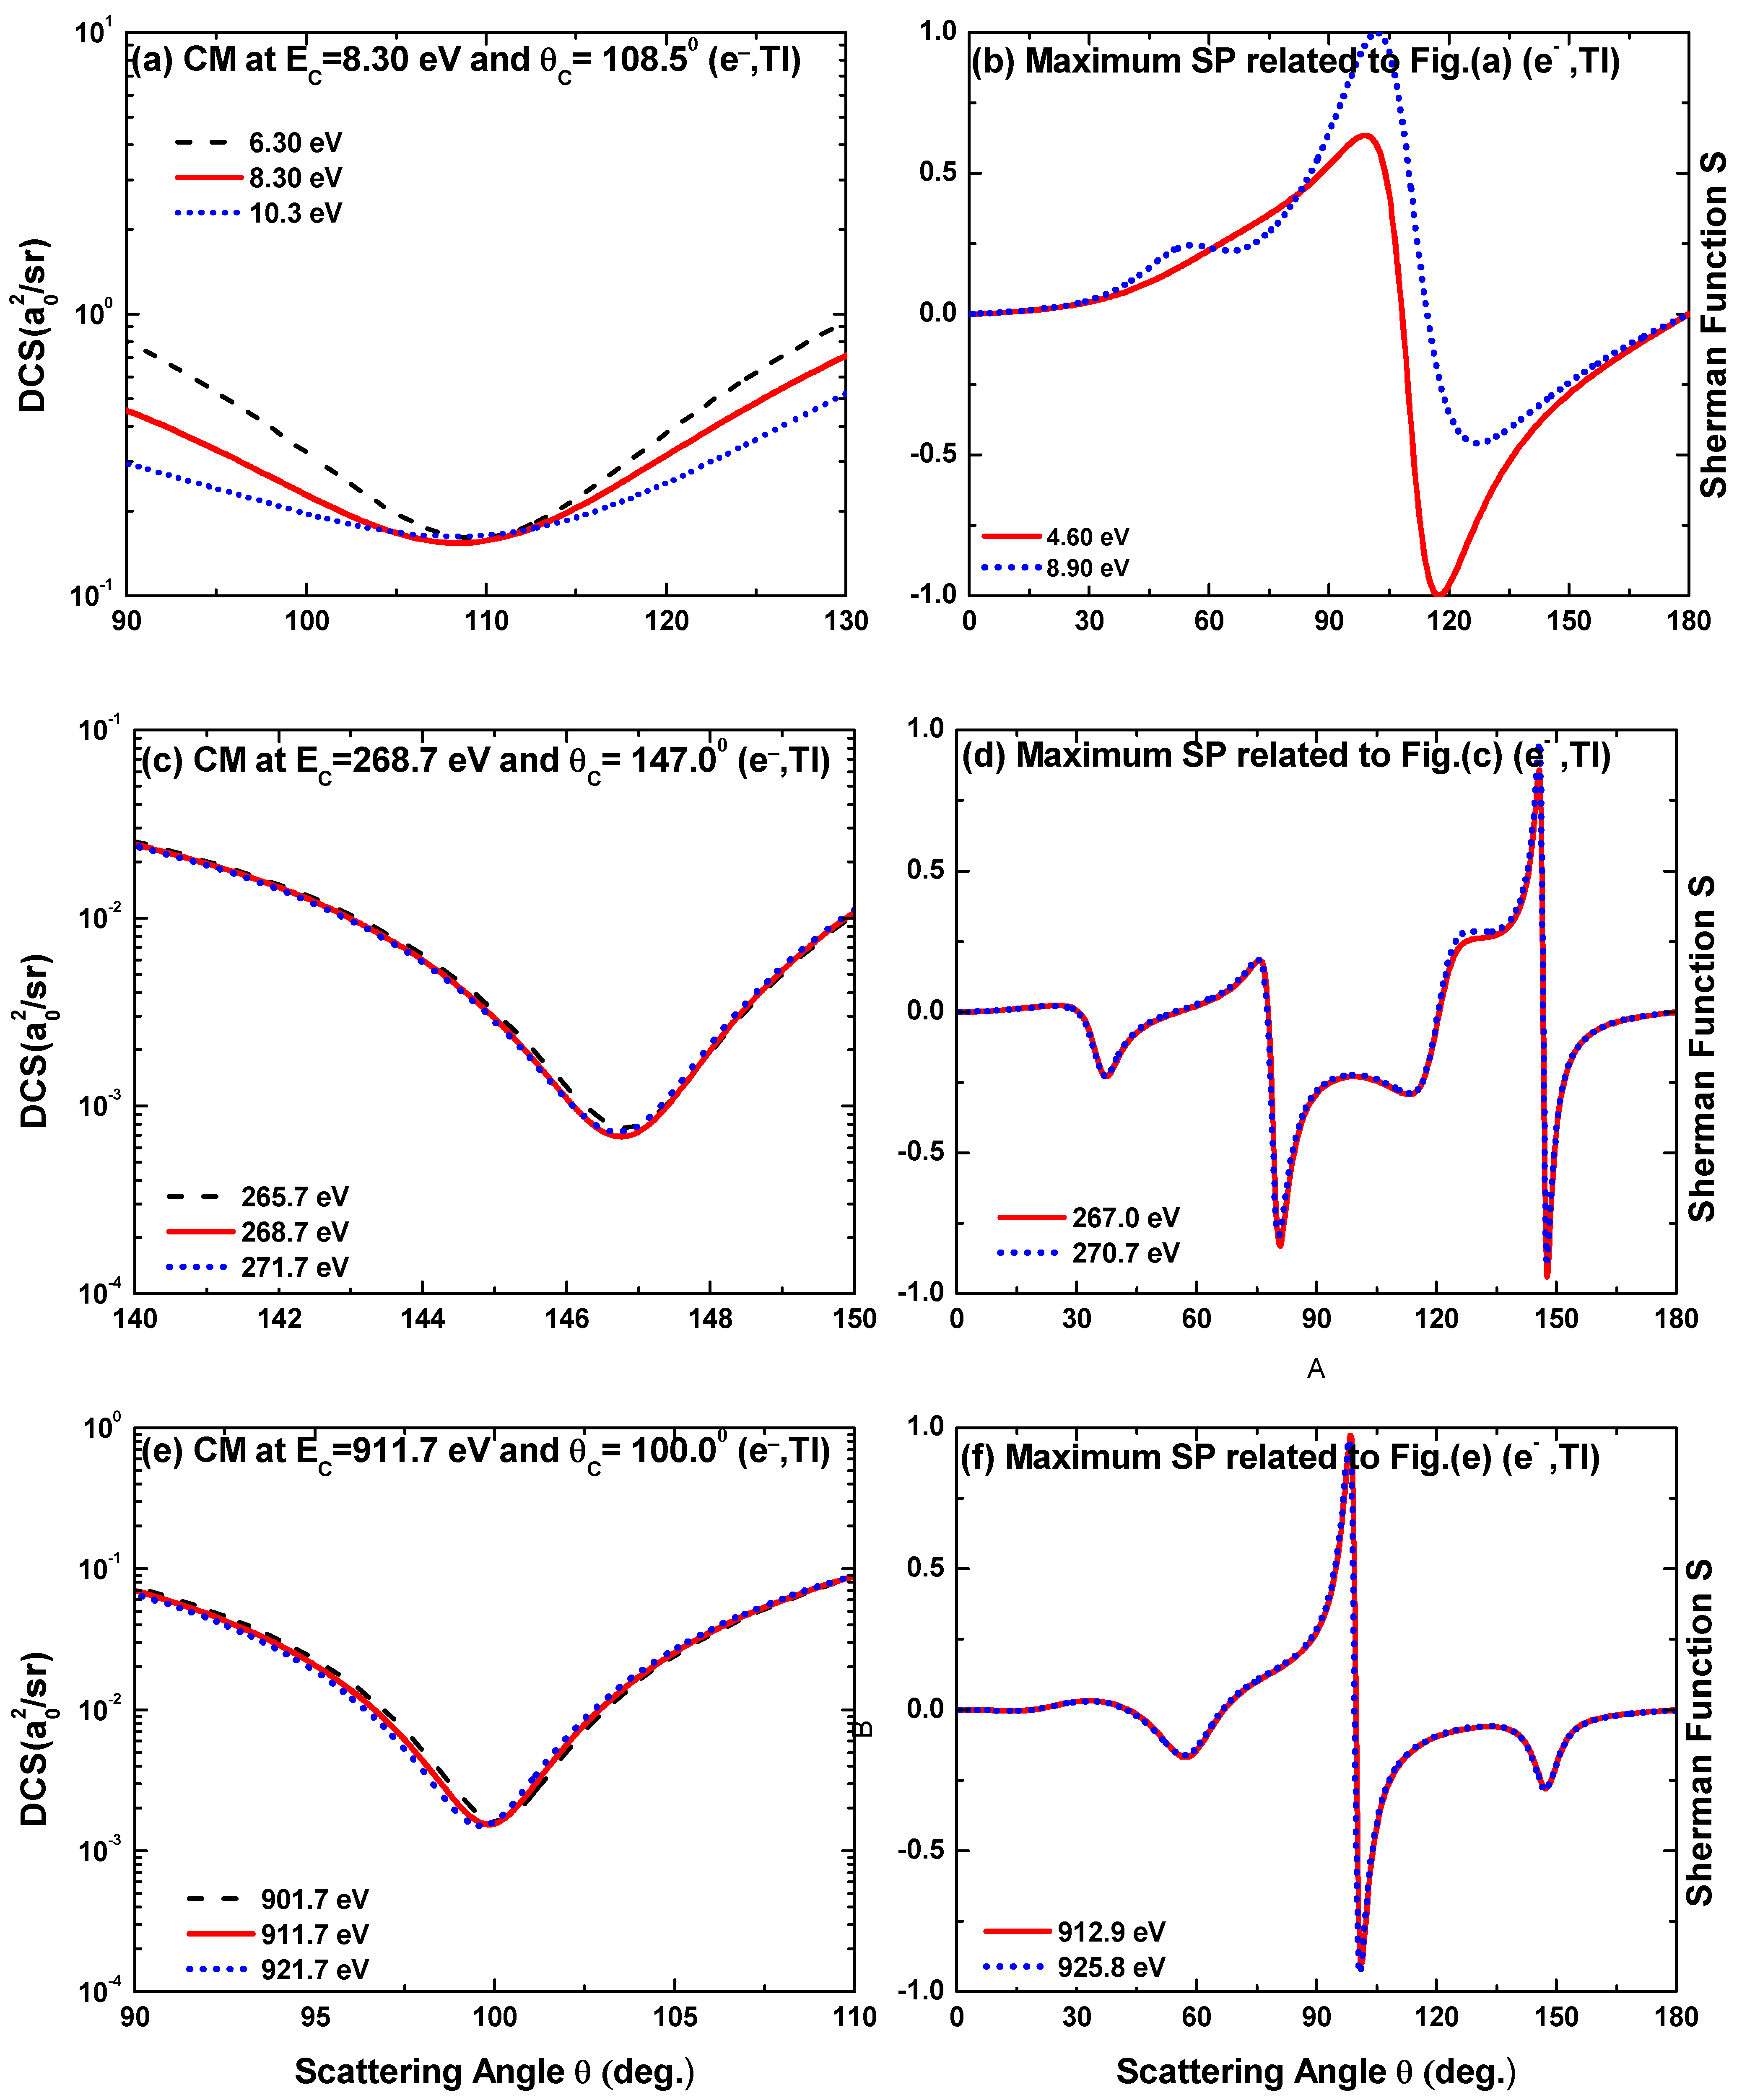
4.1.5. Critical Minima and Maximum Spin Polarization

In this section, we provide a thorough analysis of the CM positions suggested by the current OPM technique for e–Tl scattering. Additionally, the maximum spin–polarization (MSP) locations associated with these CM are identified. The thorough process of determining the CM is interesting for the examination of the polarization of the scattered electrons. Additionally, the CM has an advantage over the DCS for judging theories because the former only needs cross sections at a limited number of energies and angles. However, to our knowledge, no theoretical or experimental research has been carried out on the CM for e–Tl scattering.
Among the minimal DCS values, there are a few deep minima that are discernible. Such a deep minima is qualified as a CM when it fulfills two crucial requirements [6,61]: (i) the magnitude of the spin–flip amplitude must be larger than that of the direct amplitude, i.e., | g ( θ ) | > | f ( θ ) | and (ii) the DCS approaches its local minima that are several orders of magnitude less than those at neighboring energies and angles. Moreover, in the vicinity of a CM, the scattered electrons acquire total polarization ( S = ± 1 ) . Plotting the energy dependence of the DCS minima allows one to trace the positions of the absolute CM with respect to both angle and energy [62]. However, special attention is needed to pay for locating such CM points. It is important to note that numerous meticulous reruns of the computations, used in this work, have confirmed the existence of the CM locations.
In the DCS distributions of e–Tl scattering, the current analysis predicts a total of 13 deep minima. Table 1 lists the critical energy E c , critical angle θ c , direct amplitude f ( θ ) , and spin–flip amplitude g ( θ ) for these 13 deep minima. This table shows that only one minimum, at ( E c = 18.3 eV, θ c = 40.0°), does not meet the requirement (i) for a CM. The remaining 12 deep minima satisfy the requirements of CM. In Figure 17, the three-dimensional (3D) plot of the DCS clearly depicts the placements of these CM in terms of impact energy and scattering angle. The maximum critical energy is found at ( E c = 1696.0 eV, θ c = 137.0°), while the highest critical angle is found at ( E c = 156.9 eV, θ c = 161.5°).
As mentioned earlier, finding a CM location is important due to the scattered electrons in its vicinity gaining total polarization ( S = ± 1). We have determined the energy, E m and angle, θ m at which the polarization reaches extreme values, S m of both signs near each CM obtained in the current investigation. A total of 25 such MSP points are discovered, and they are given in Table 2. It is evident from this Table that 23 out of 25 MSP points achieve substantial polarization ( S 90 % ), and thus can be regarded as total polarization points. The polarization for the two remaining MSP points are 78% and 80%. Walker [63] asserts that the locations with S 50 % may likewise be thought of as having entire polarization. We might therefore refer the 25 MSP points, predicted in our model, as the total polarization points. Figure 18 shows a 3D depiction of all 25 MSP points listed in Table 2 as a whole. In the figure, the positions of these points in terms of impact electron energy and scattering angle are clearly visible.
For each MSP point, we have also calculated the energy widths Δ E referring the energy difference between E c and E m and the angular widths Δ θ referring the angle difference between θ c and θ m . The evaluation of these energy and angle widths is important because their sum in the positive excursion and negative excursion define the width of the DCS valley, respectively, along the energy and angular axes. For instance, in the case of CM at ( E c = 268.7 eV; θ c = 147.0°), the value of S = +0.98 at ( E m = 270.7 eV; θ m = 146.0°) with Δ E = 268.7 270.7 = 2 eV and Δ θ = 147.0 146.0 = 1°. Similarly, for negative excursion, S = −0.99 at ( E m = 267.0 eV; θ m = 147.5°) with Δ E = 268.7 267.0 = 1.7 eV and Δ θ = 147.0 147.5 = 0.5°. These result in the width of the DCS valley being Δ E w = 2 + 1.7 = 3.7 eV along the energy axis and Δ θ w = 1 + 0.5 = 1.5° along the angular axis.
Figure 19 demonstrates the behavior of our DCS and S results at some incident energies in the neighborhood of three CM (each from the low-, intermediate- and high-energy domains) to support the obtained CM positions for the second criterion (i.e., at a CM, the DCS attains a local minimum). At low-energy CM ( E c = 8.3 eV; θ c = 108.5°), as evident in Figure 19a, the DCS precisely reaches its lowest at 8.3 eV. If the energy is slightly increased to 10.3 eV or little dropped to 6.3 eV, the DCS rises. A similar situation is seen also for the other two CM positions. At ( E c = 268.7 eV; θ c = 147.0°), in Figure 19c, the DCS value is minimum at 268.7 eV comparing to those at 265.7 and 271.7 eV. Similarly, in Figure 19e for the CM ( E c = 911.7 eV; θ c = 100.0°), the lowest DCS value is at 911.7 eV then at 901.7 and 921.7 eV.
As mentioned earlier, a crucial characteristic of a CM point is that the maximum values of the Sherman function for both signs can only be found in the proximity of it. As seen in Figure 19b corresponding to the CM ( E c = 8.3 eV; θ c = 108.5°), the values of S m in the current study range from +100% at (8.9 eV; 102.0°) to −100% at (4.6 eV; 117.5°). The Sherman function behaves similarly for the CM at ( E c = 268.7 eV; θ c = 147.0°) in Figure 19d and ( E c = 911.7 eV; θ c = 100.0°) in Figure 19f. All of these findings show that our current electron–atom optical potential may reasonably predict CM positions within the context of relativistic collision dynamics.

4.2. Positron Scattering

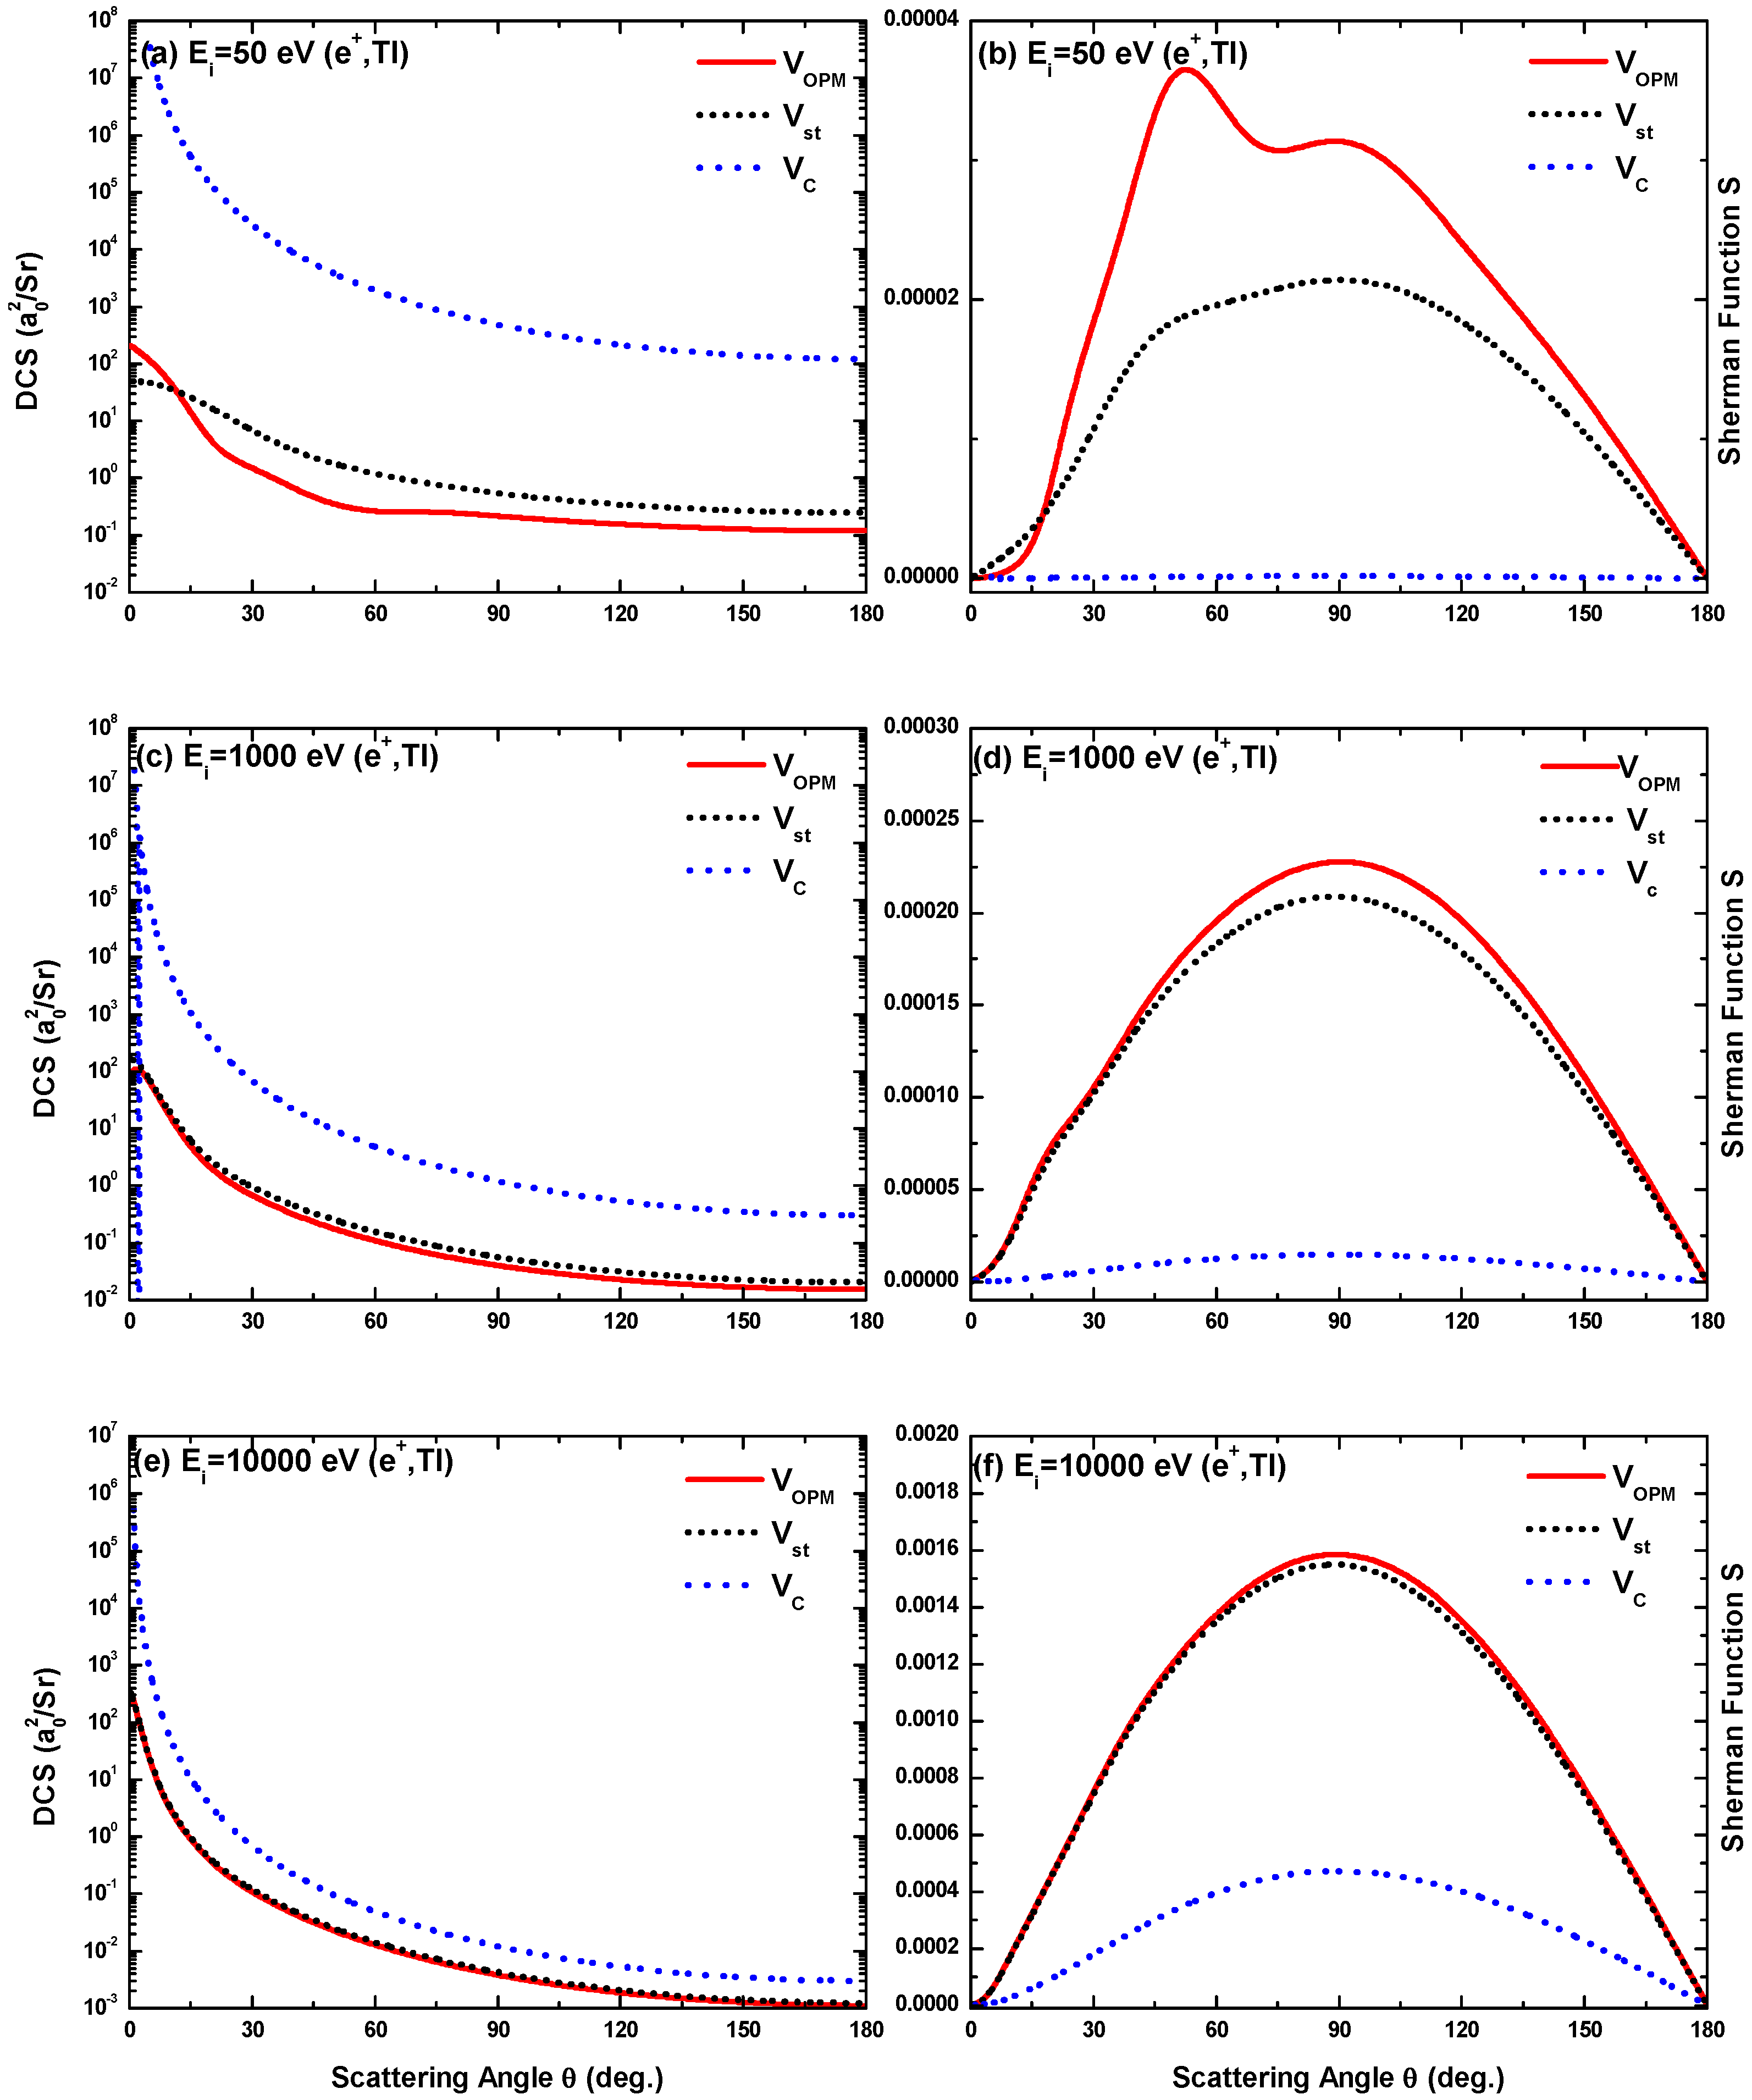
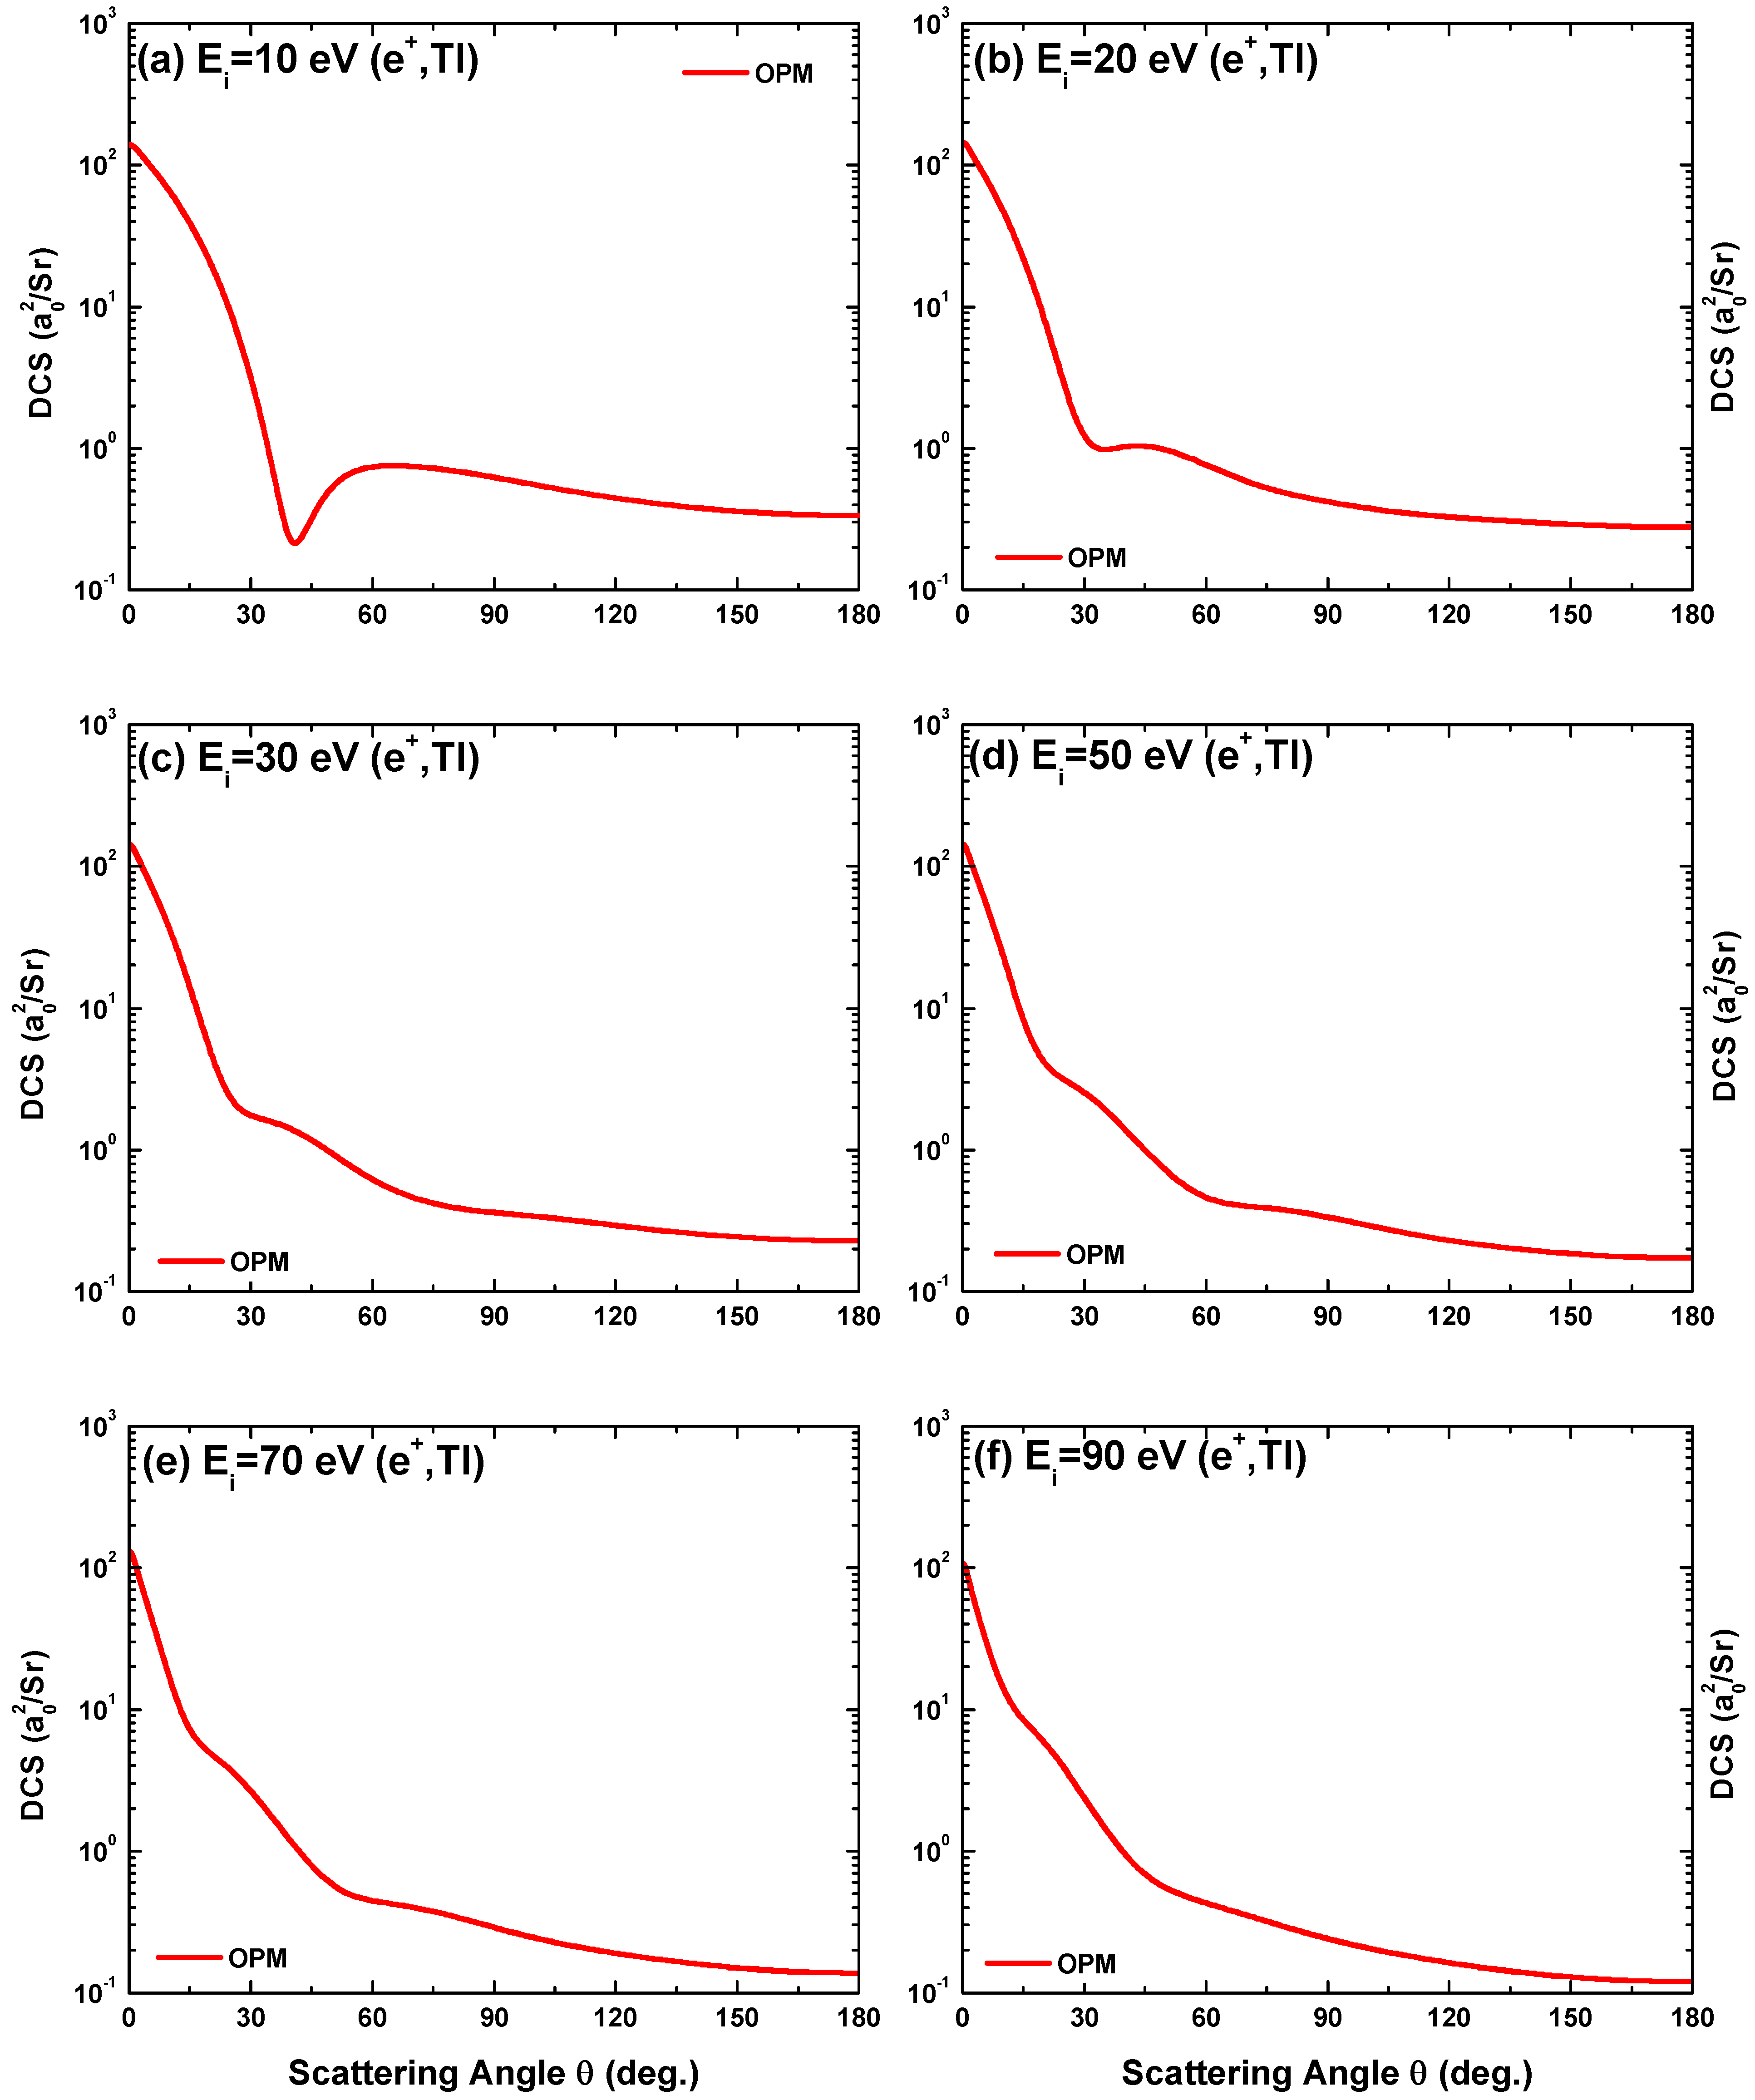
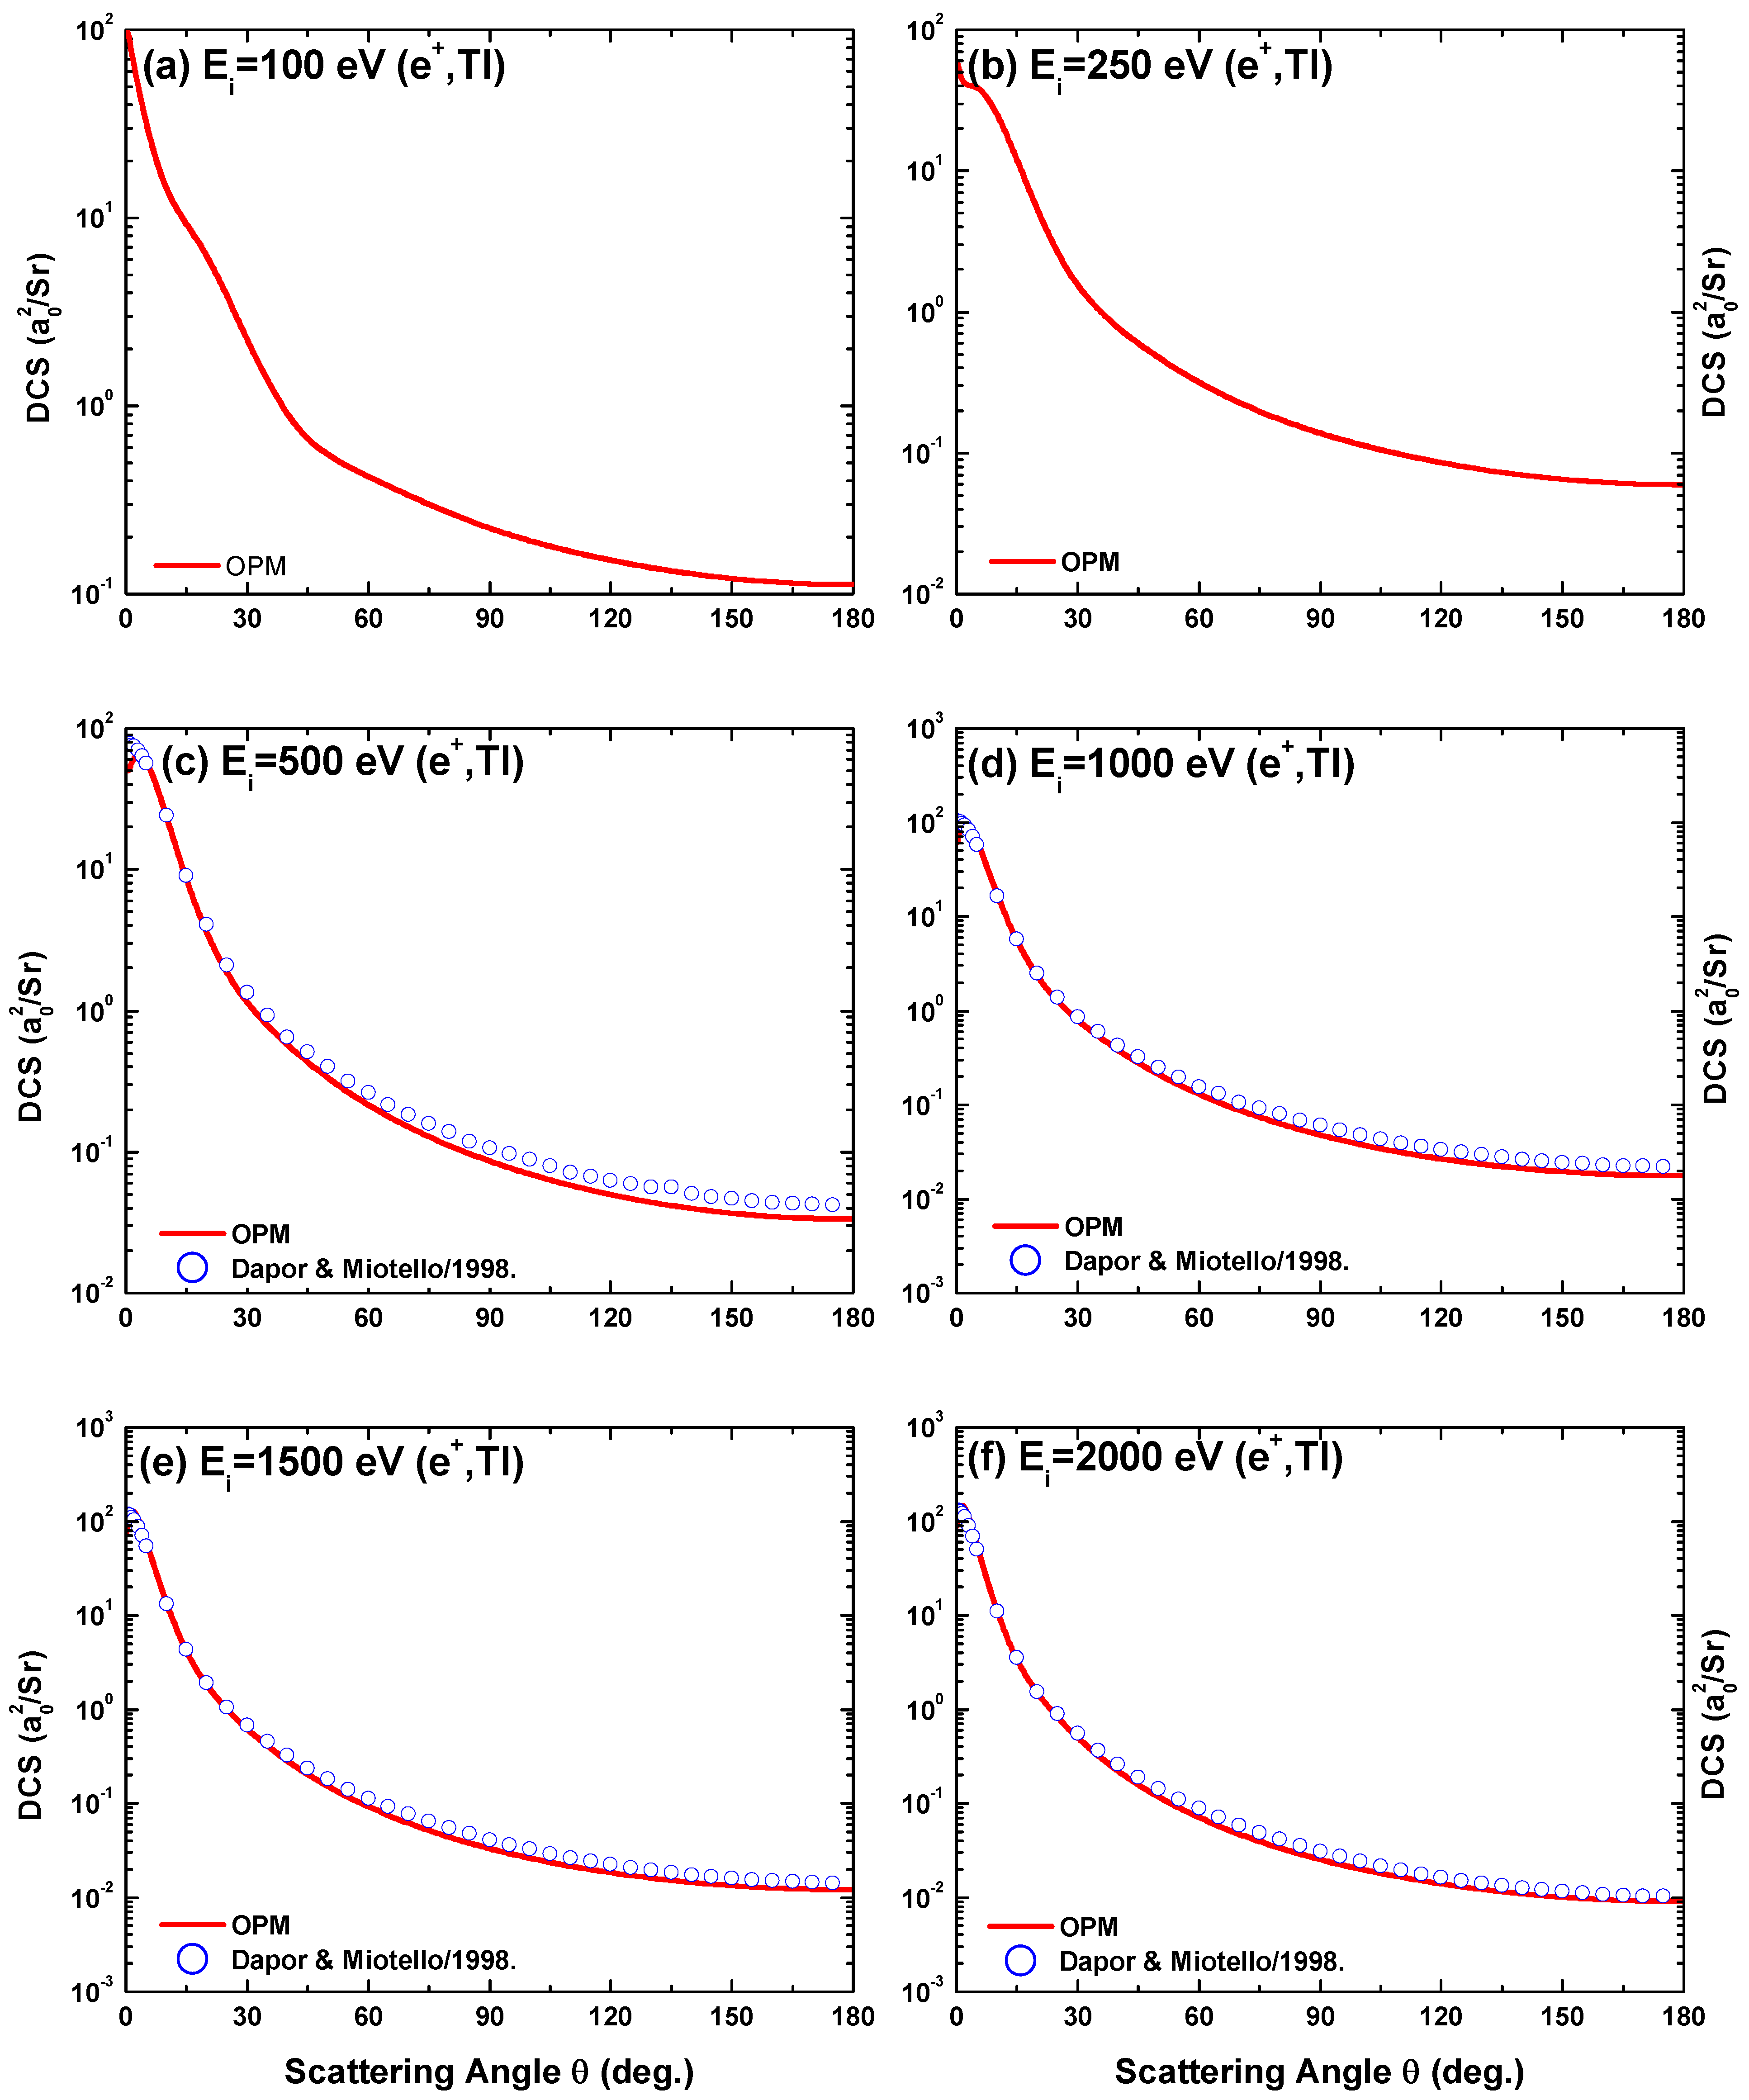
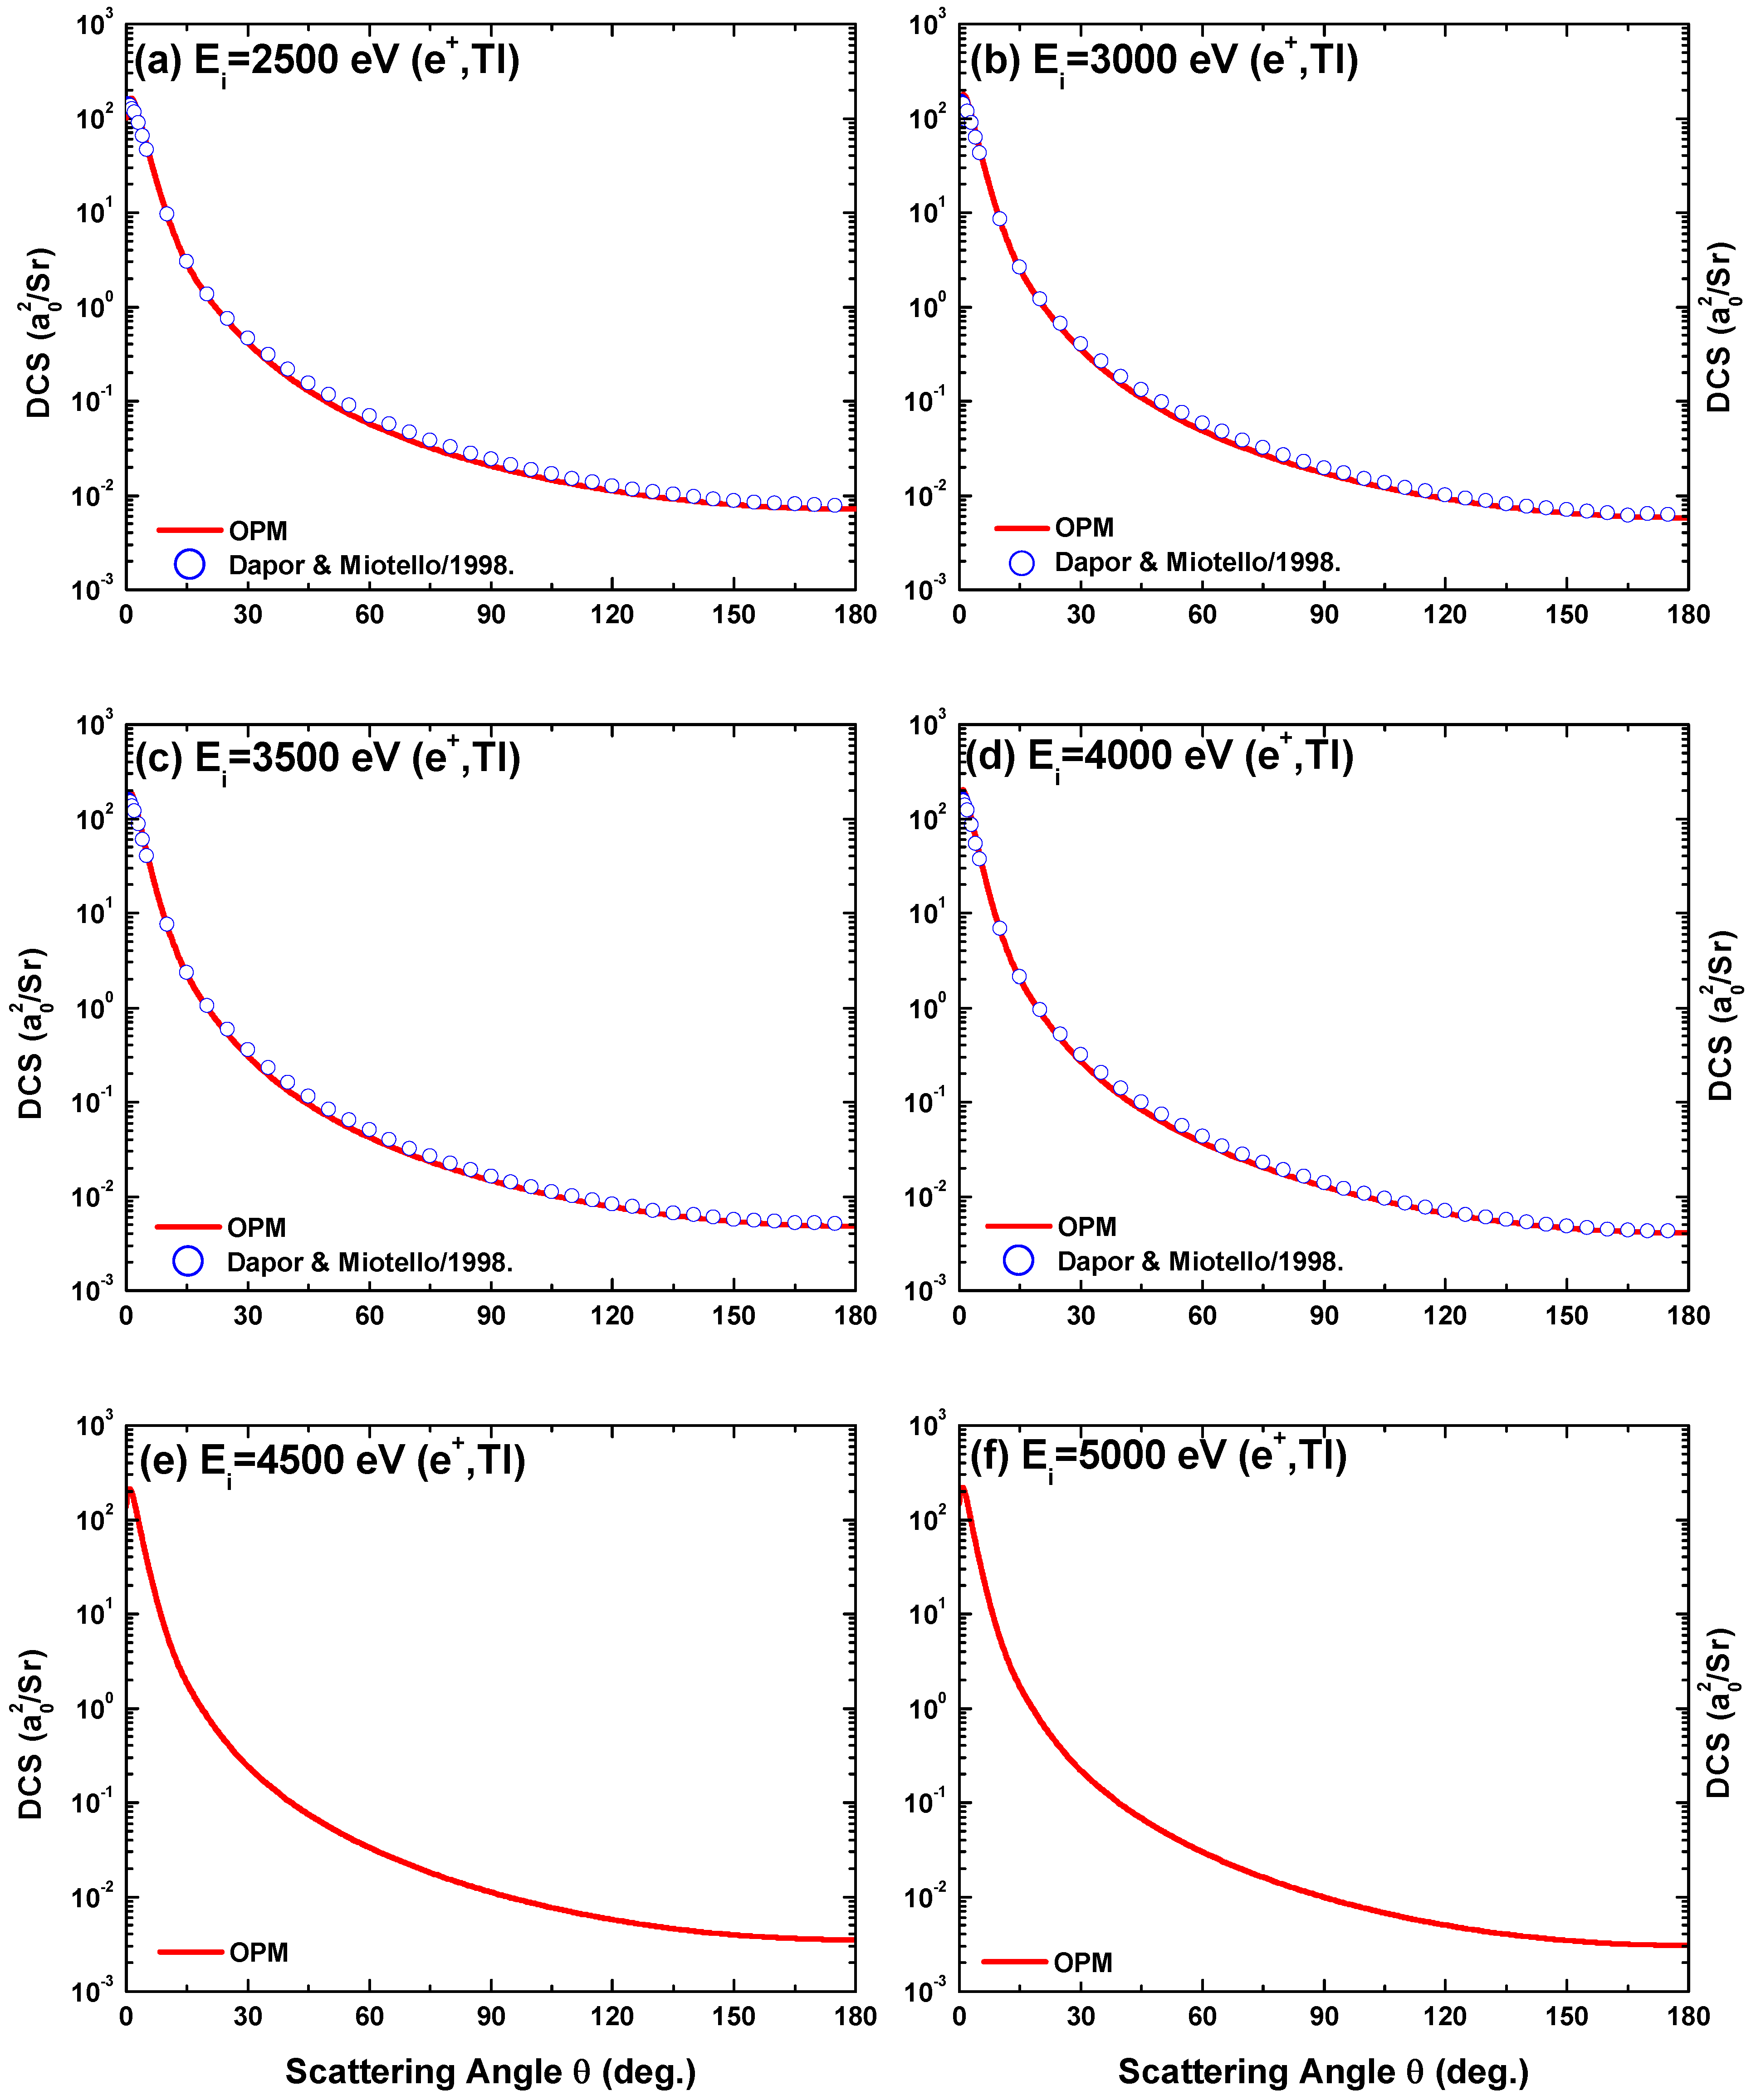
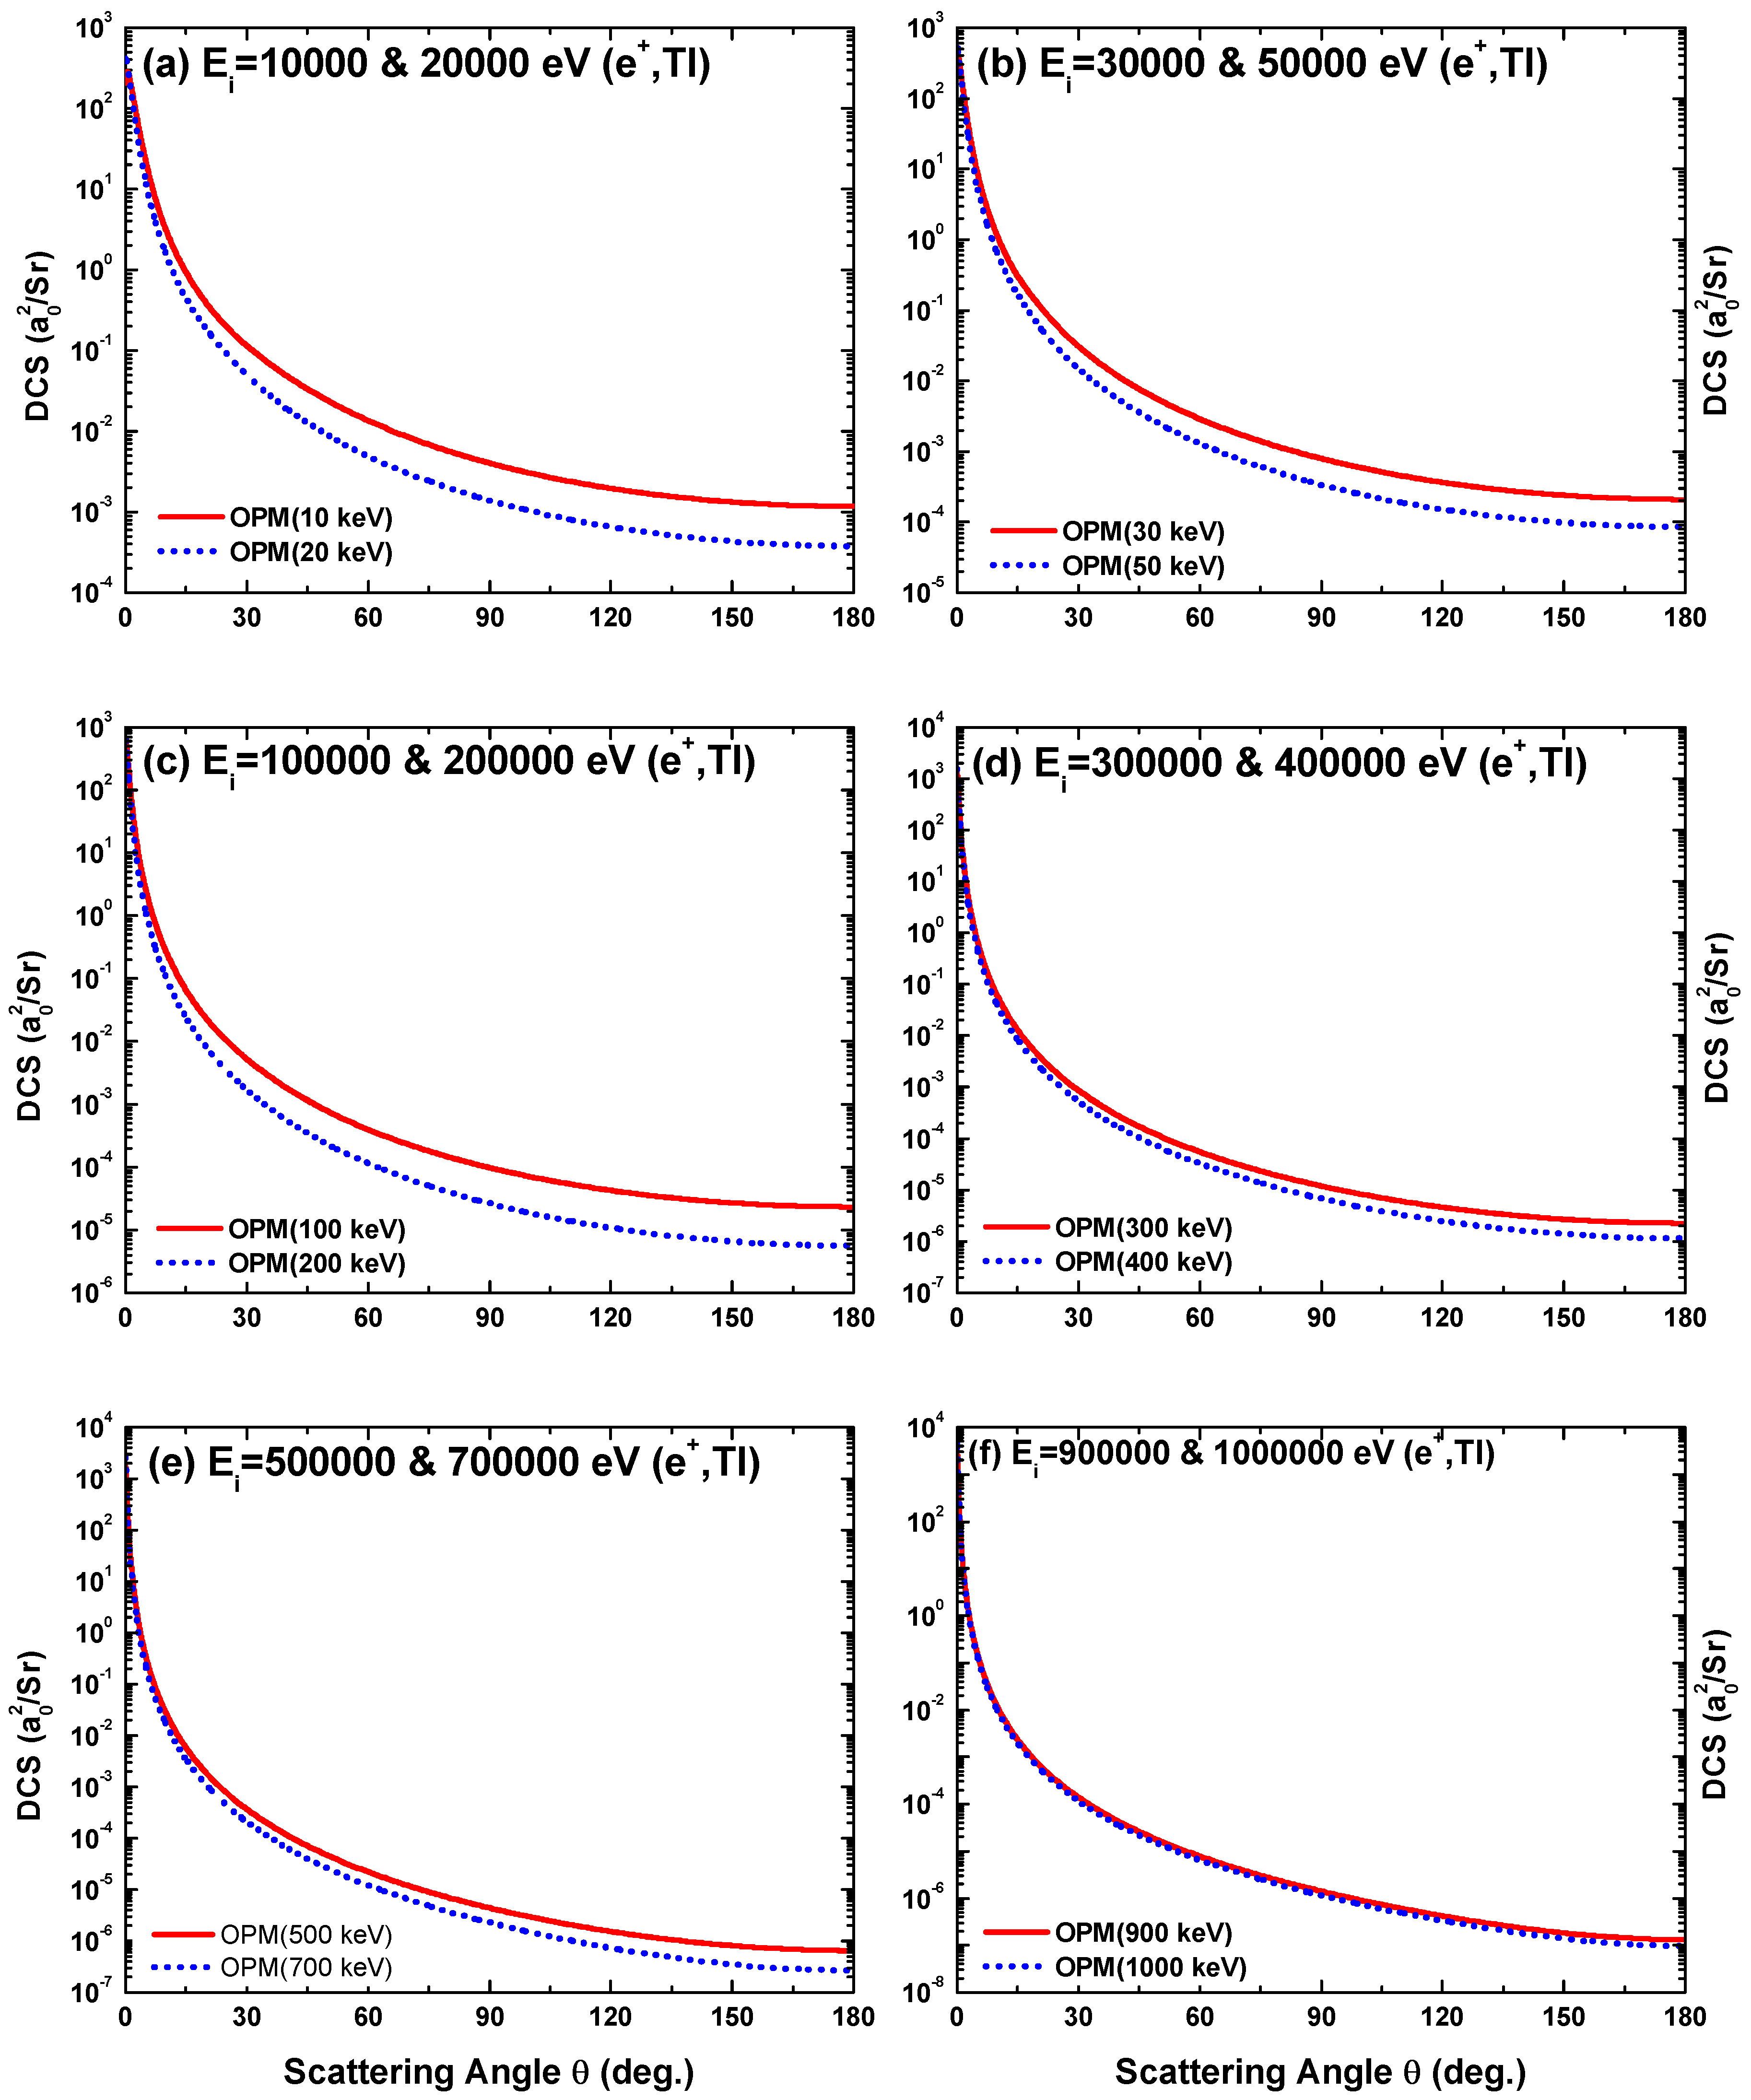
4.2.1. Angle Dependent DCS

The angular dependence DCSs for e+–Tl scattering predicted by our OPM theory are depicted in Figure 20, Figure 21, Figure 22 and Figure 23 over the energy from 10 eV to 1 MeV at angular region 0° to 180°. As can be observed, the DCS results for the positron scattering drops monotonically with increasing scattering angle, in contrast to electron scattering. Particularly, for positron scattering, the features in the DCS observed for electron impacts are either nonexistent or substantially weaker. This is caused by the lack of exchange between the positron and the target electrons as well as the different polarization interactions between electrons and positrons (see Figure 4 and Figure 5). Additionally, positrons can enter the electronic shells without being considerably deflected by the target electrons, whereas primary electrons are repulsed. The basic origin of the structures, namely, diffraction, is thus suppressed [29,64]. Our OPM results agree well with the theoretical results of Dapor and Miotello [38]. This outcome demonstrates the considerable role played by the exchange component of the OPM in the development of interference structures in the DCS.

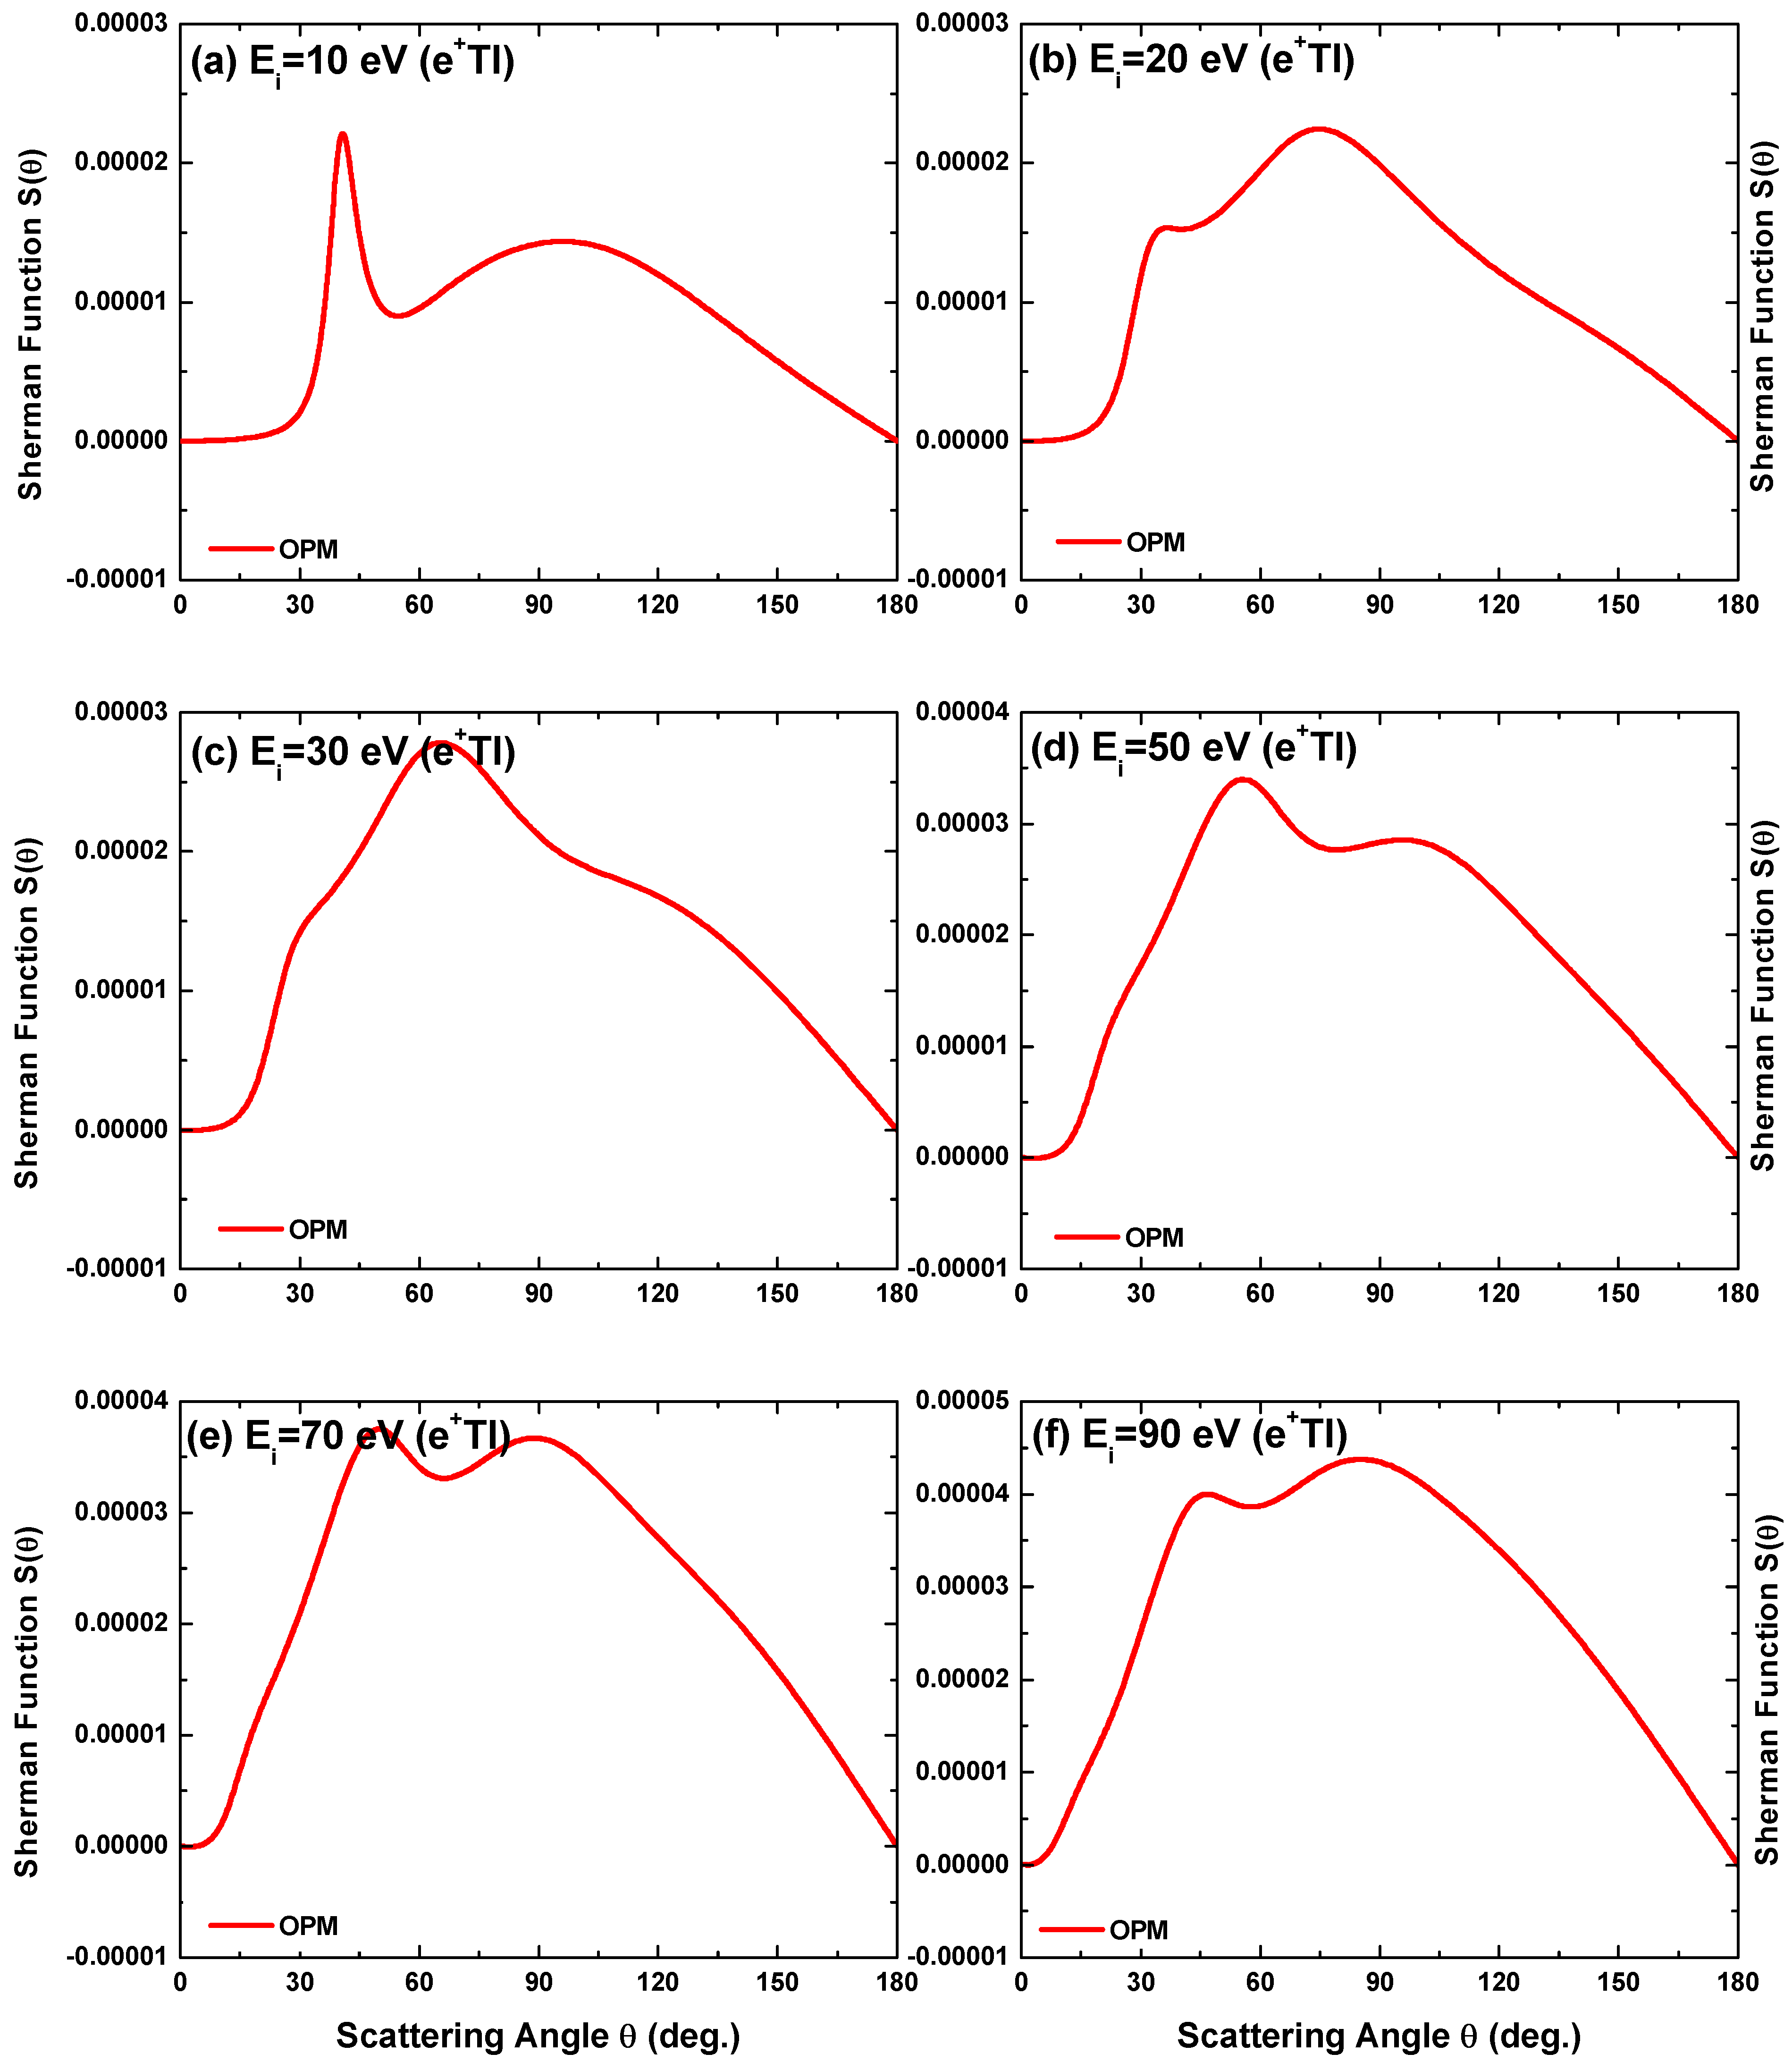
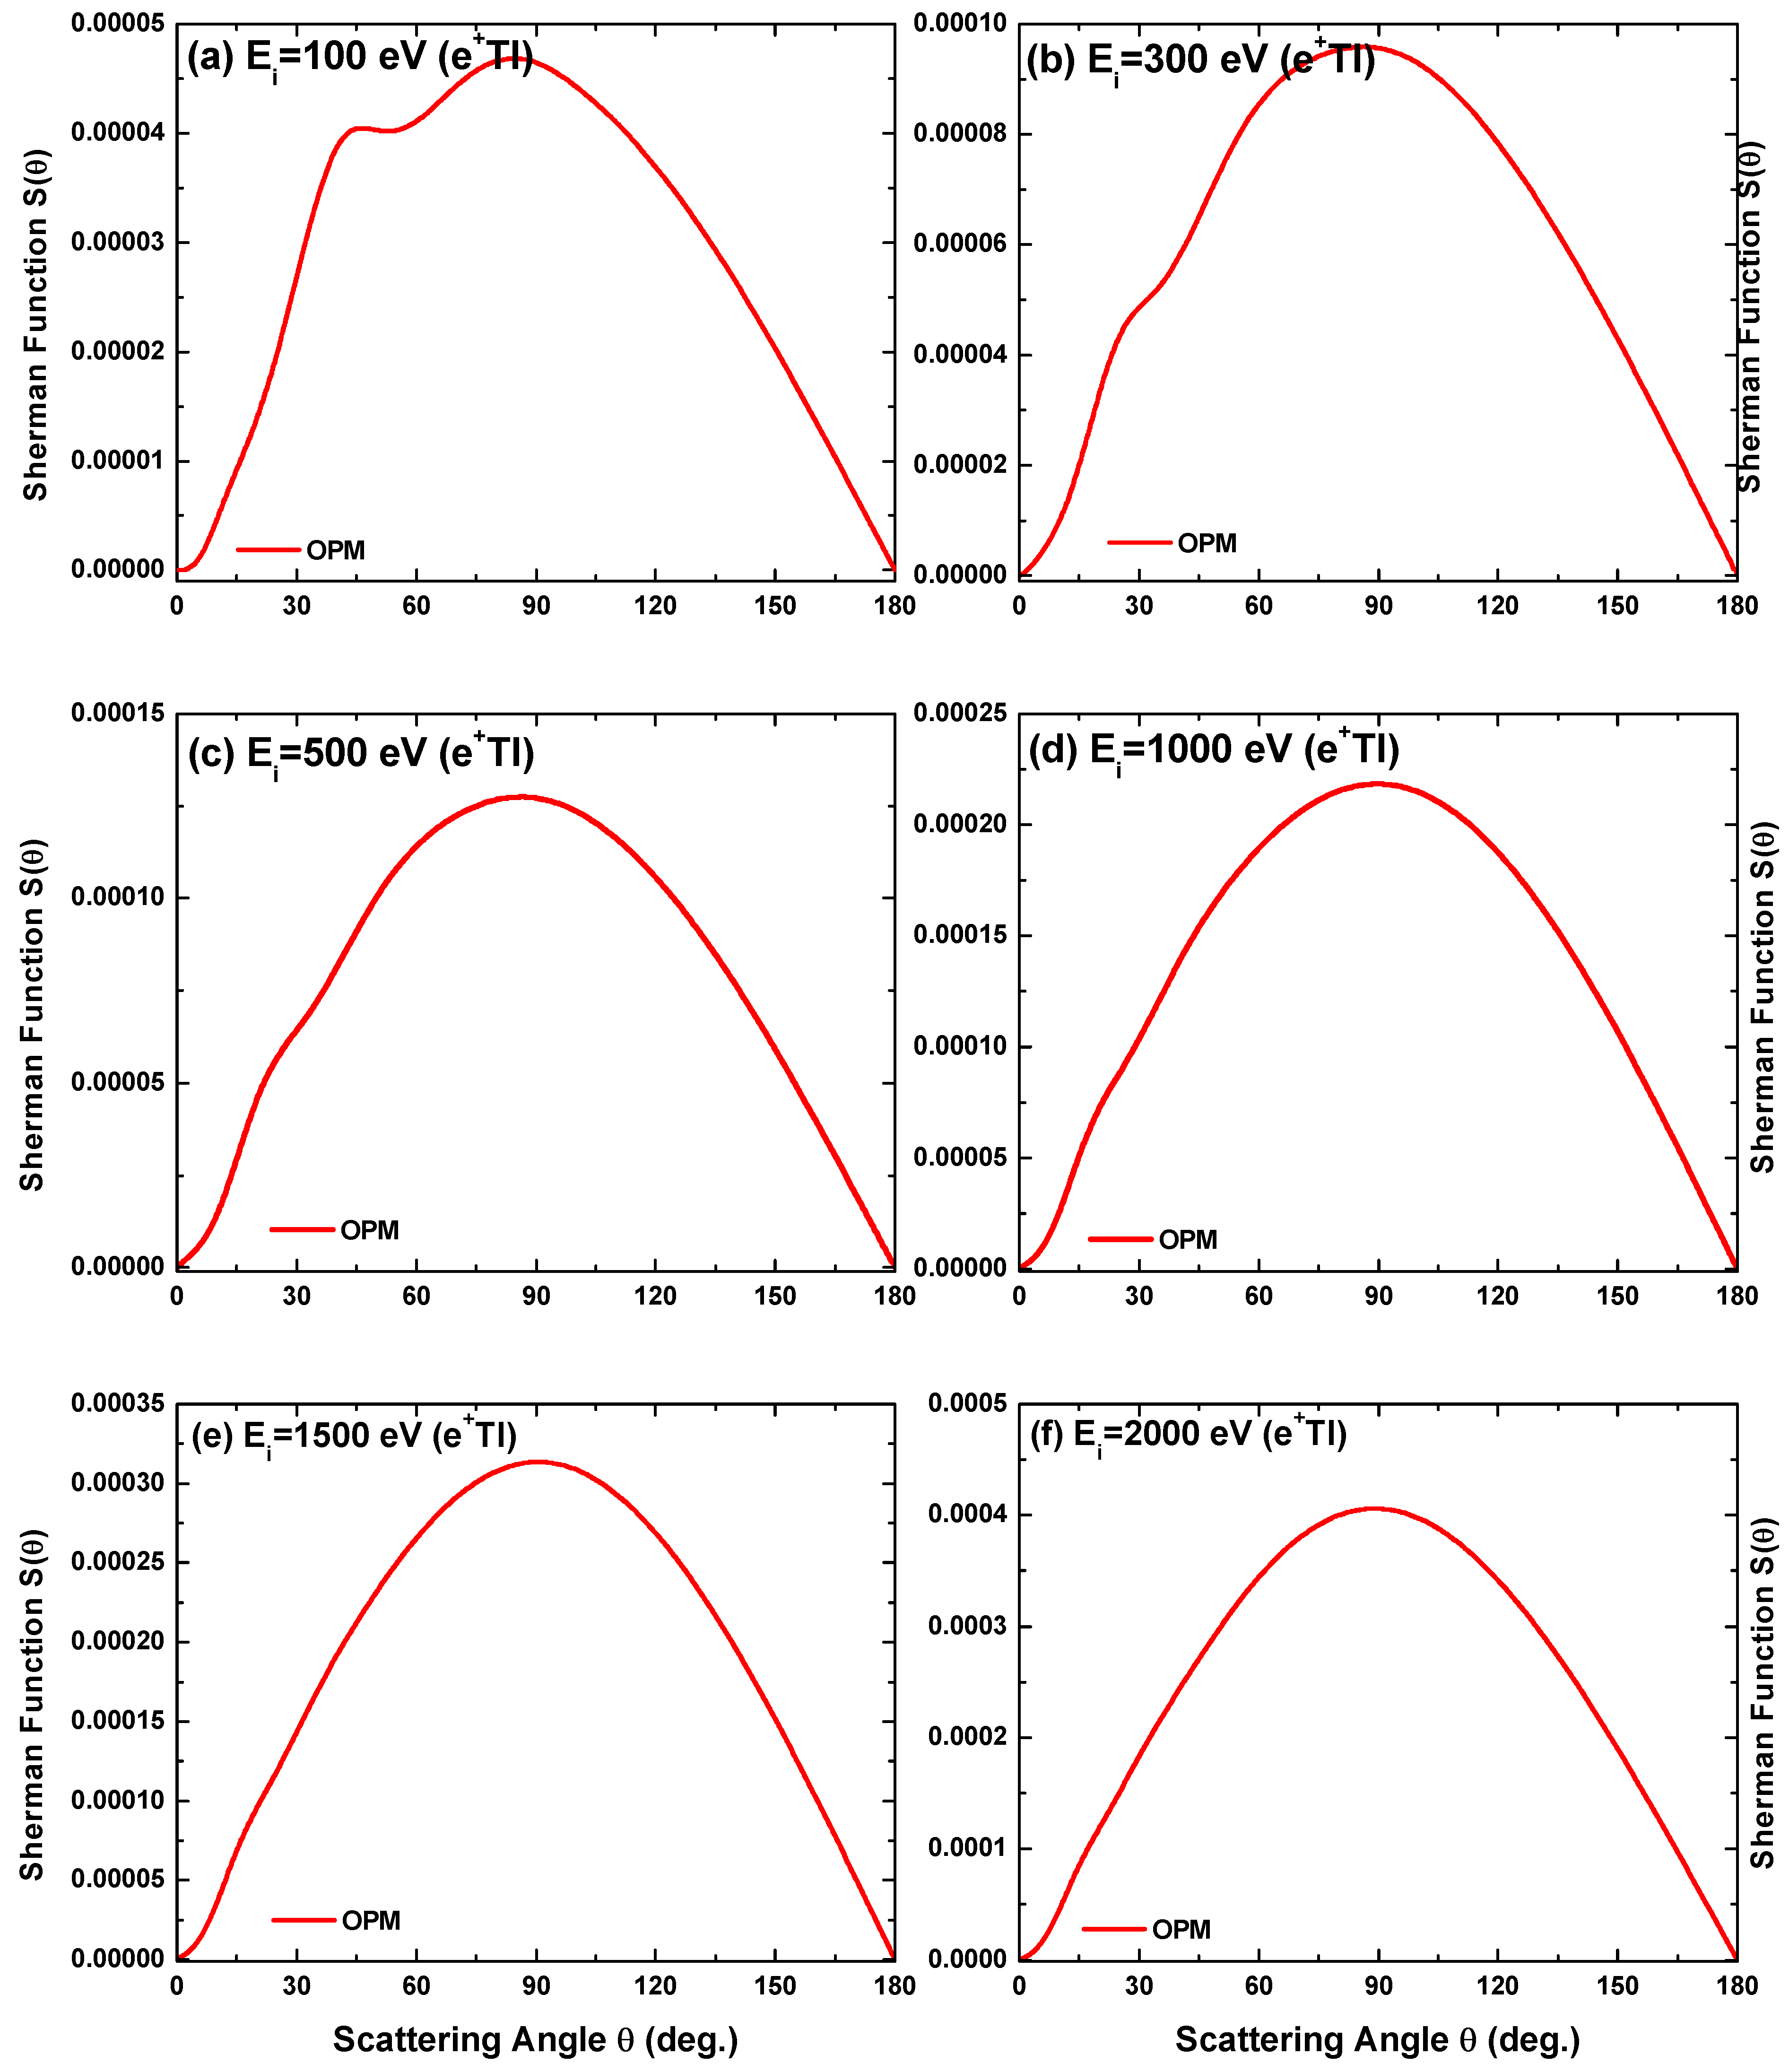
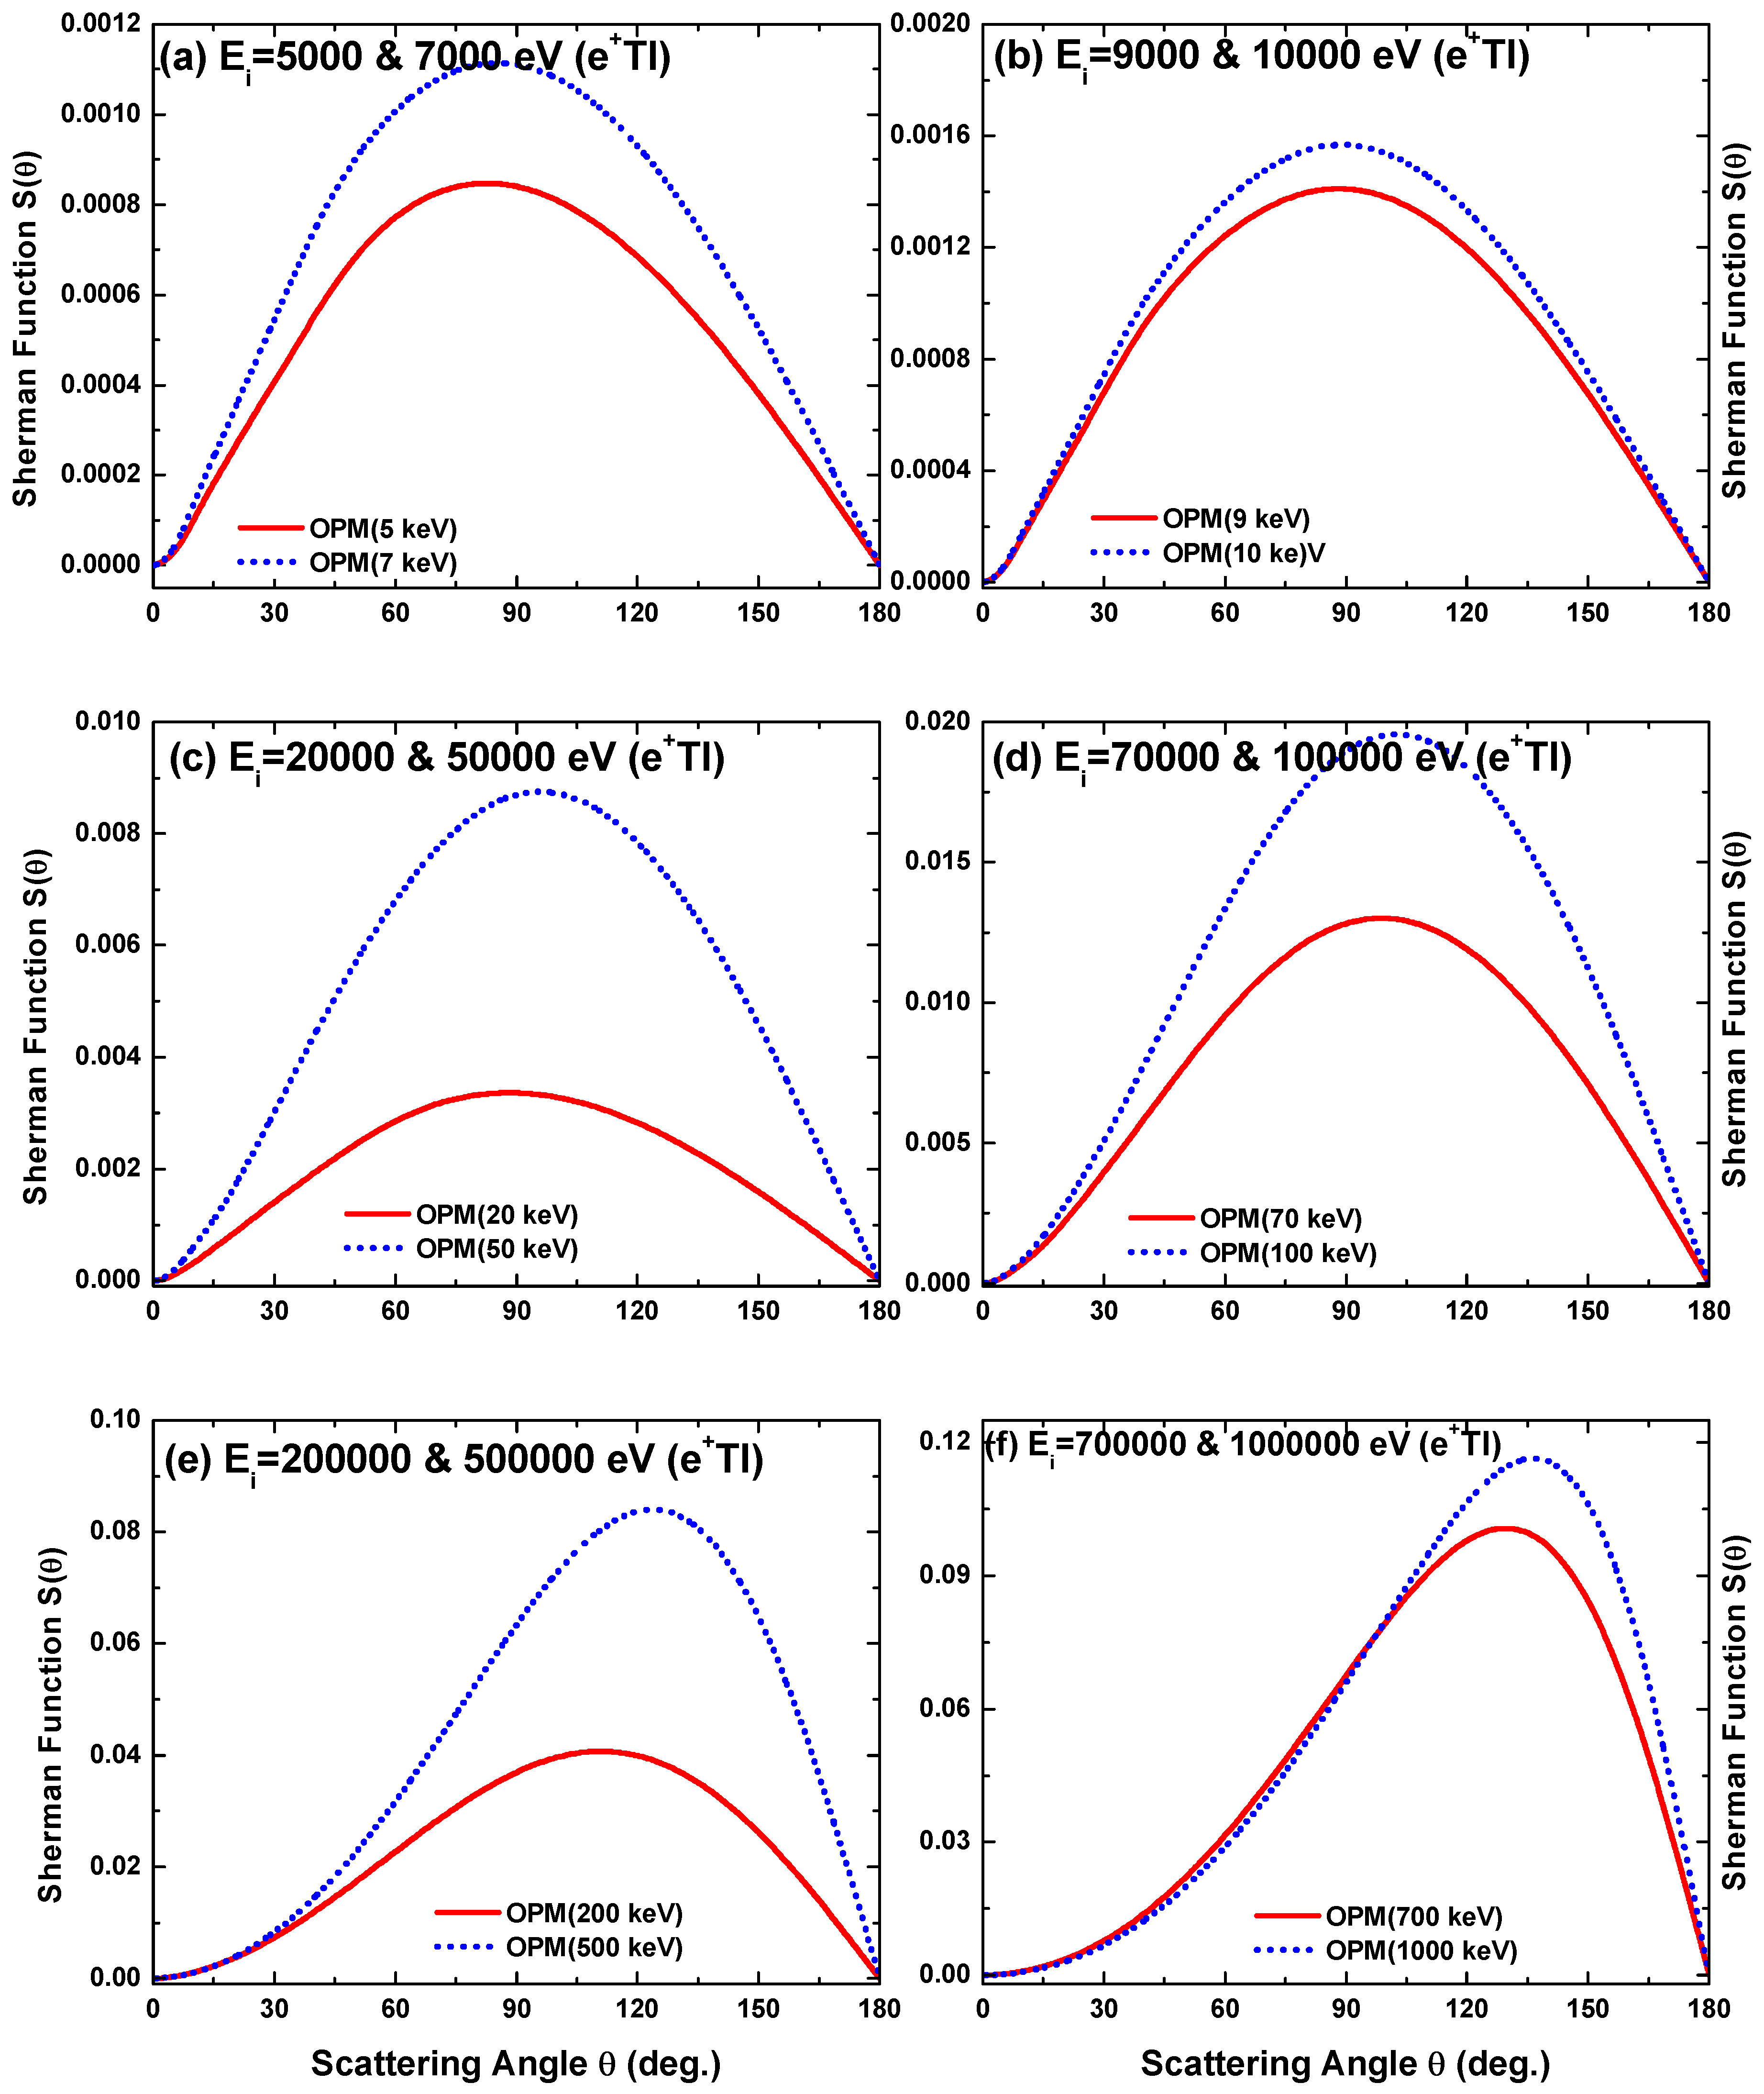
4.2.2. Angle Dependent Sherman Function S ( θ )

Angular dependent OPM results of the Sherman function for positron impact on Tl are presented in Figure 24, Figure 25 and Figure 26 at E i = 10 eV−1 MeV. As evident in these figures, our OPM calculations display fluctuations with minima and maxima, and, at higher energies, it shows stronger amplitude. Unlike in the case of electron scattering from thallium, e+–Tl shows a negligible amount of polarization in the scattered beam. As the spin polarization depends on the spin–orbit interaction as well as on the spatial interaction potential, these tiny values of spin polarization indicate that the interaction between the positrons and the Tl atoms is much weaker than that of e+–Tl. The lack of experimental and any other theoretical results impedes any comparison.

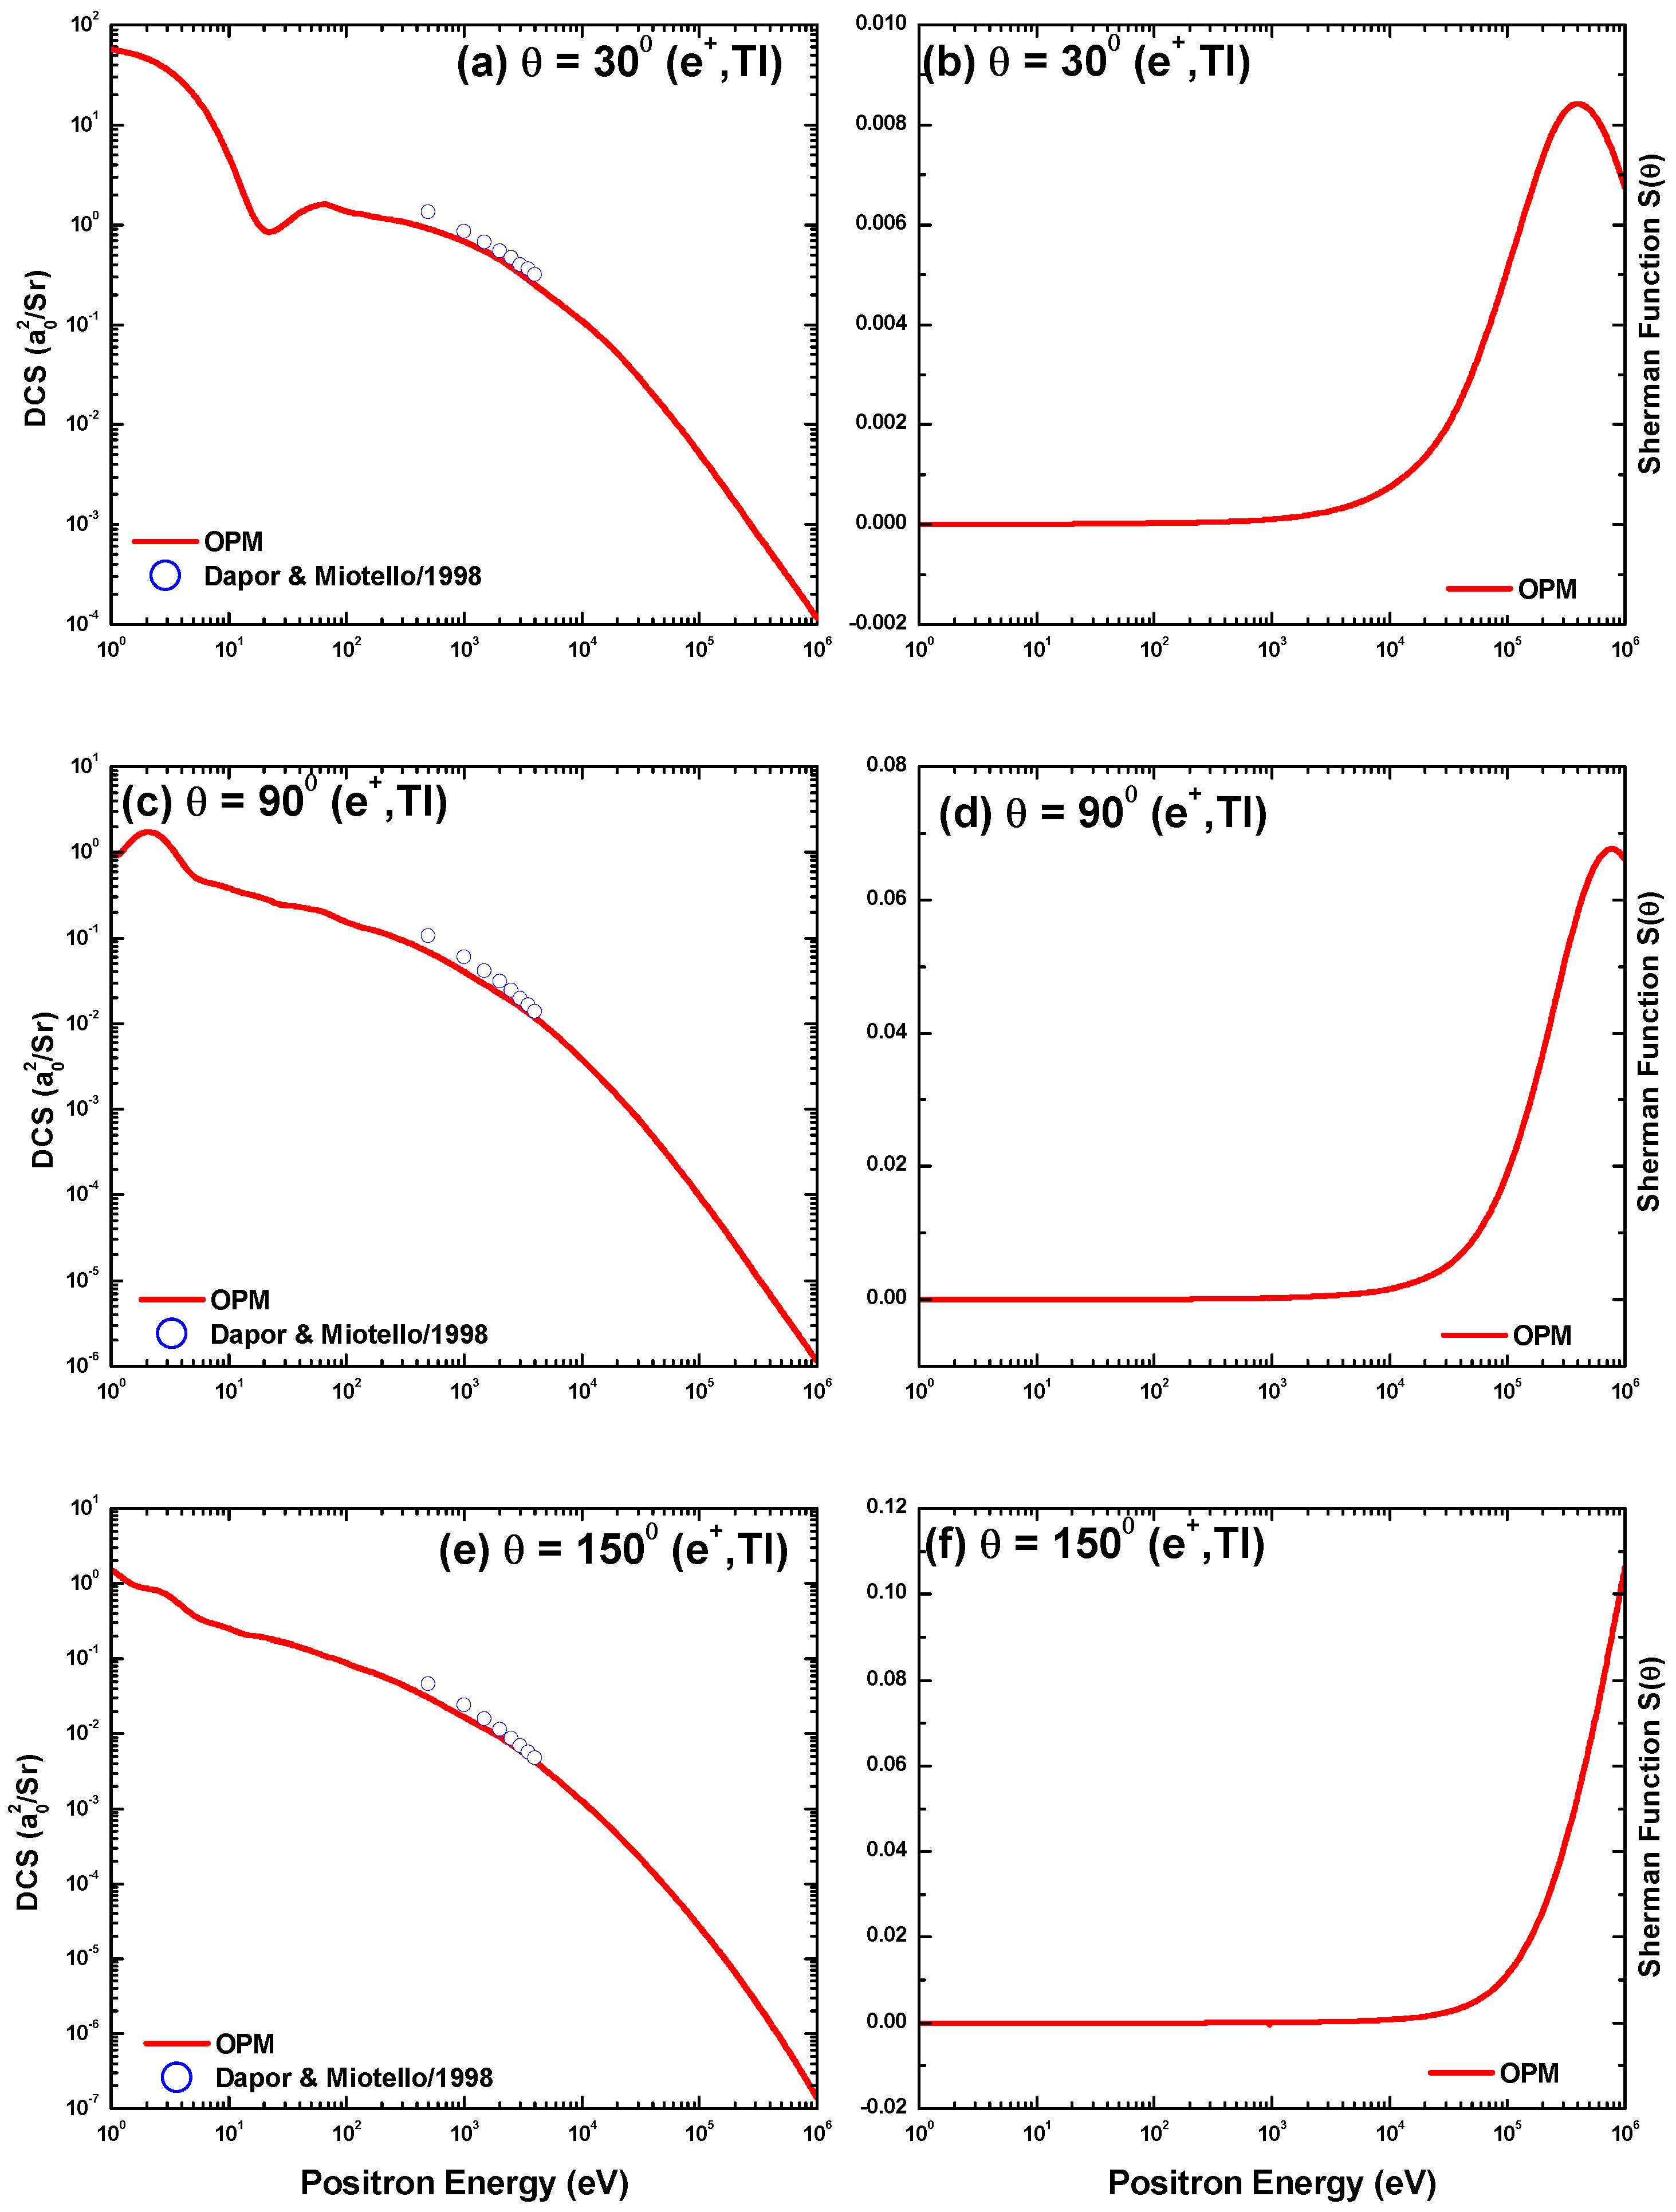
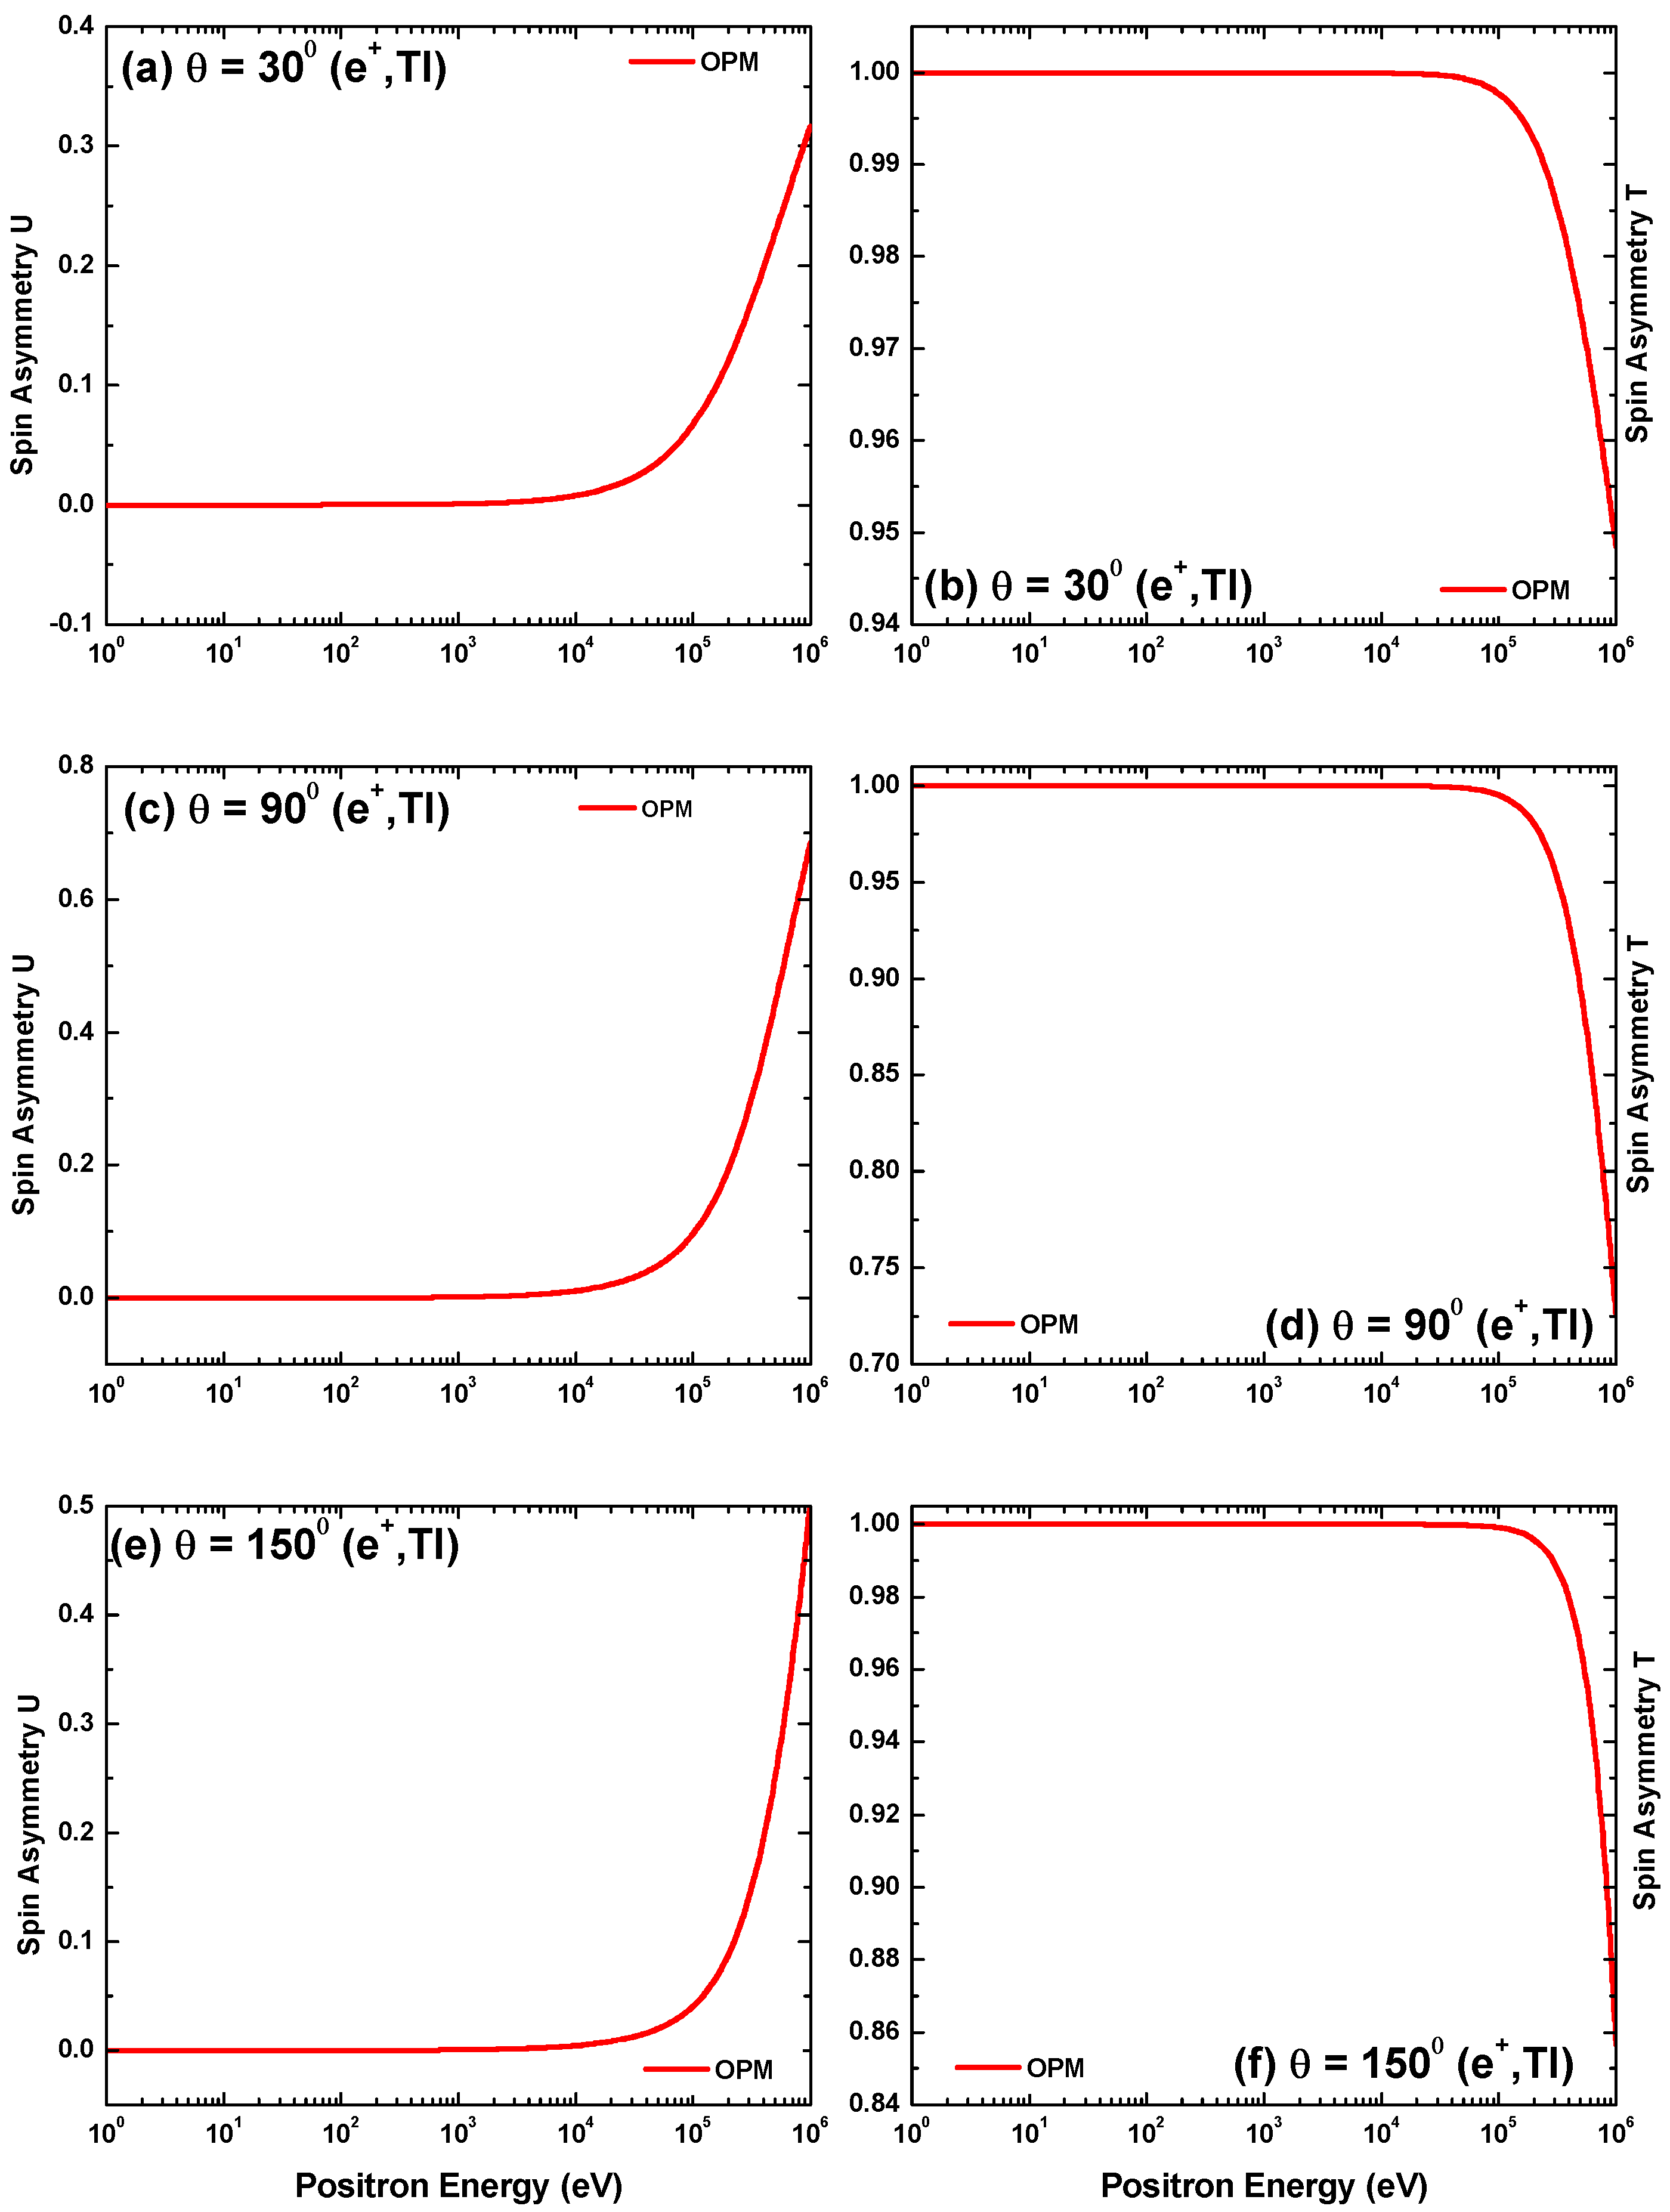
4.2.3. Energy-Dependent DCS and Spin Polarization Parameters

The energy-dependent DCS and the corresponding values of Sherman function S ( θ ) computed in the 1 eV to 1 MeV energy range for e+–Tl scattering at 30°, 90°, and 150° are displayed in Figure 27. The available theoretical results for DCS from Dapor and Miotello [38] in the energy region from 500 eV to 4000 eV are included. From Figure 27a,c,e, it is clear that just one DCS minimum and (or) maximum can be found in the low-energy (≤30 eV) zone. The influence of the correlation–polarization potential [29,55] can be found as the cause of this minimum and/or maximum DCS. When compared to the results of the electron impact, it is evident that the diffraction structures brought on by the interference of projectile electrons, scattered from the individual target electrons, are suppressed in the low-energy zone [29]. The DCS for both lepton species monotonically drops in the Coulombic zone between 10 keV and 1 MeV, with slightly smaller positron cross sections due to nuclear repulsion. Similar structures in the DCS are seen for both leptons at ultra-relativistic energies, albeit positrons start at a somewhat higher energy because of their greater distance from the nucleus at constant collision energies. As evident from Figure 27a,c,e, our DCS calculations show good agreement with the pattern of Dapor and Miotello [38] at comparable higher energies but a slight disagreement in magnitude at low energy.
The Sherman function for positron scattering is constant up to some energy before peaking, as demonstrated in Figure 27b,d,f. Furthermore, as the scattering angle increases, the maximum values move toward higher energy and, at around 1 MeV, it appears with an opposite sign. This graphic shows that the S ( θ ) for positron scattering is much small than that for electron scattering. Up to a few keV, this robust suppression of the spin asymmetry occurs without revealing any discernible structure. The positrons interact with the target nucleus in a repellent manner at a given energy and angle. Hence, a degree of reduction is to be anticipated that prevents them from getting as close to the nucleus as the electrons [29,55]. More theoretical and experimental research is required to assess our OPM predictions.
Figure 28 depicts the energy variation of the spin asymmetry U and spin asymmetry T for e+–Tl scattering at 30°, 90°, and 150°. Due to the sum rule as given in Equation (27), T is mostly close to unity in the low-energy regime, whereas S and U are small. As is the case for electron scattering, structures appear for both in U and T (see in Figure 15), in contrast to the positron scattering. Regardless of angle, the energy behavior of T for both projectiles is different from that of U. With increased projectile energy, T decreases while U grows. In terms of asymptotics, U tends to 1 and T tends to 0.

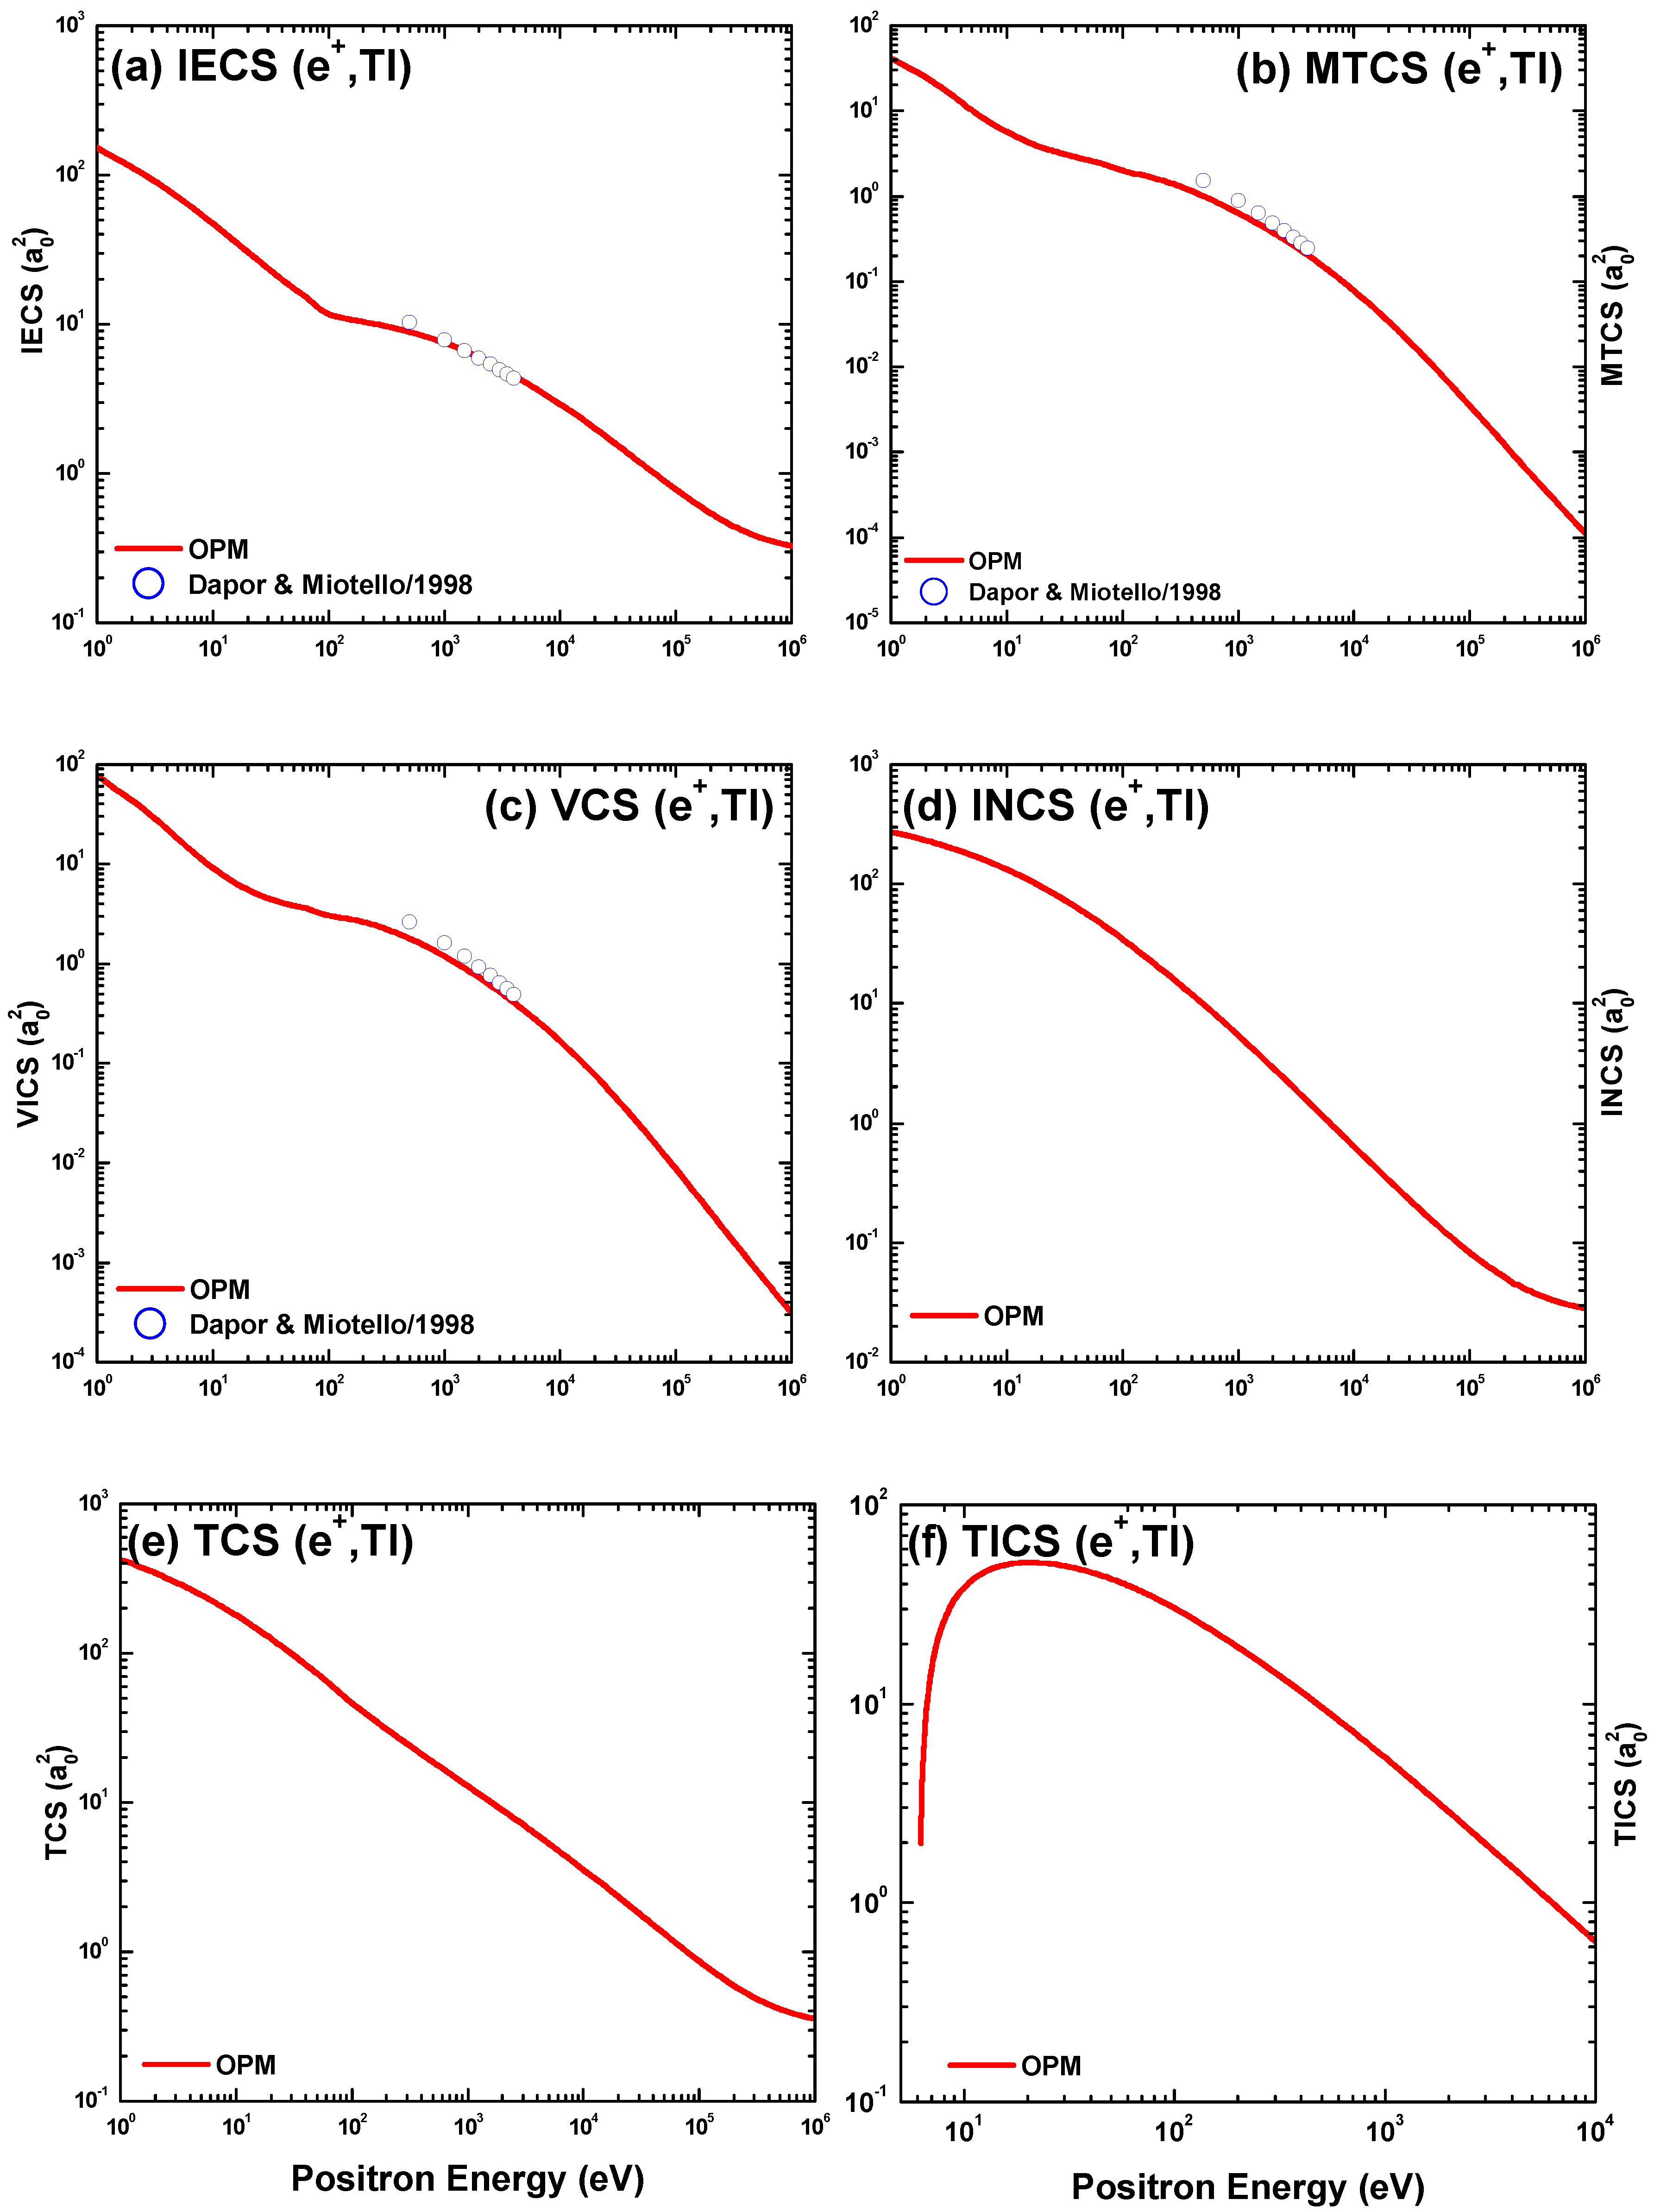
4.2.4. Energy Dependent IECS, MTCS, VCS, INCS, TCS and TICS

This section furnishes the energy dependent scattering observables, namely, IECS σ e l , MTCS σ m , VCS σ v , INCS σ i n e l , TCS σ t o t , and TICS σ i o n , as defined in Equations (19)–(23) and (29), respectively, for the scattering of positron from Tl, which is depicted in Figure 29. The positron scattering, in contrast to the electron scattering, has a repulsive static potential ( V s t ), and there is no exchange potential ( V e x ). In addition, the correlation polarizations of both electron and positron may vary in the restricted range sections. These figures show that, at energies ranging from roughly 500 eV to 5000 eV, the current computations produce strong general agreement with the known calculations of [38]. However, our OPM predictions show a little discrepancies with the results from [38]. In particular, the theory of [38] does not yield the structures which appear in our IECS, MTCS, and VCS shown in Figure 29a–c. The small deviation of our results at lower energies from that of [38] is ascribed to the difference of solving the Dirac equation. However, the outcomes of [38] closely reflect our estimation of IECS, MTCS, and VCS. Our TCS results, shown in Figure 29e, appear to exceed our IECS results after the first excitation energy, as we see for electron projectiles. The INCS result, shown in Figure 29d, decreases as energy increases. The TICS value, displayed in Figure 29f, first increases with increasing positron energy and then shows smooth decreasing tendency with the further increasing of projectile energy. We found no experimental or theoretical findings to compare our INCS, TCS, and TICS.

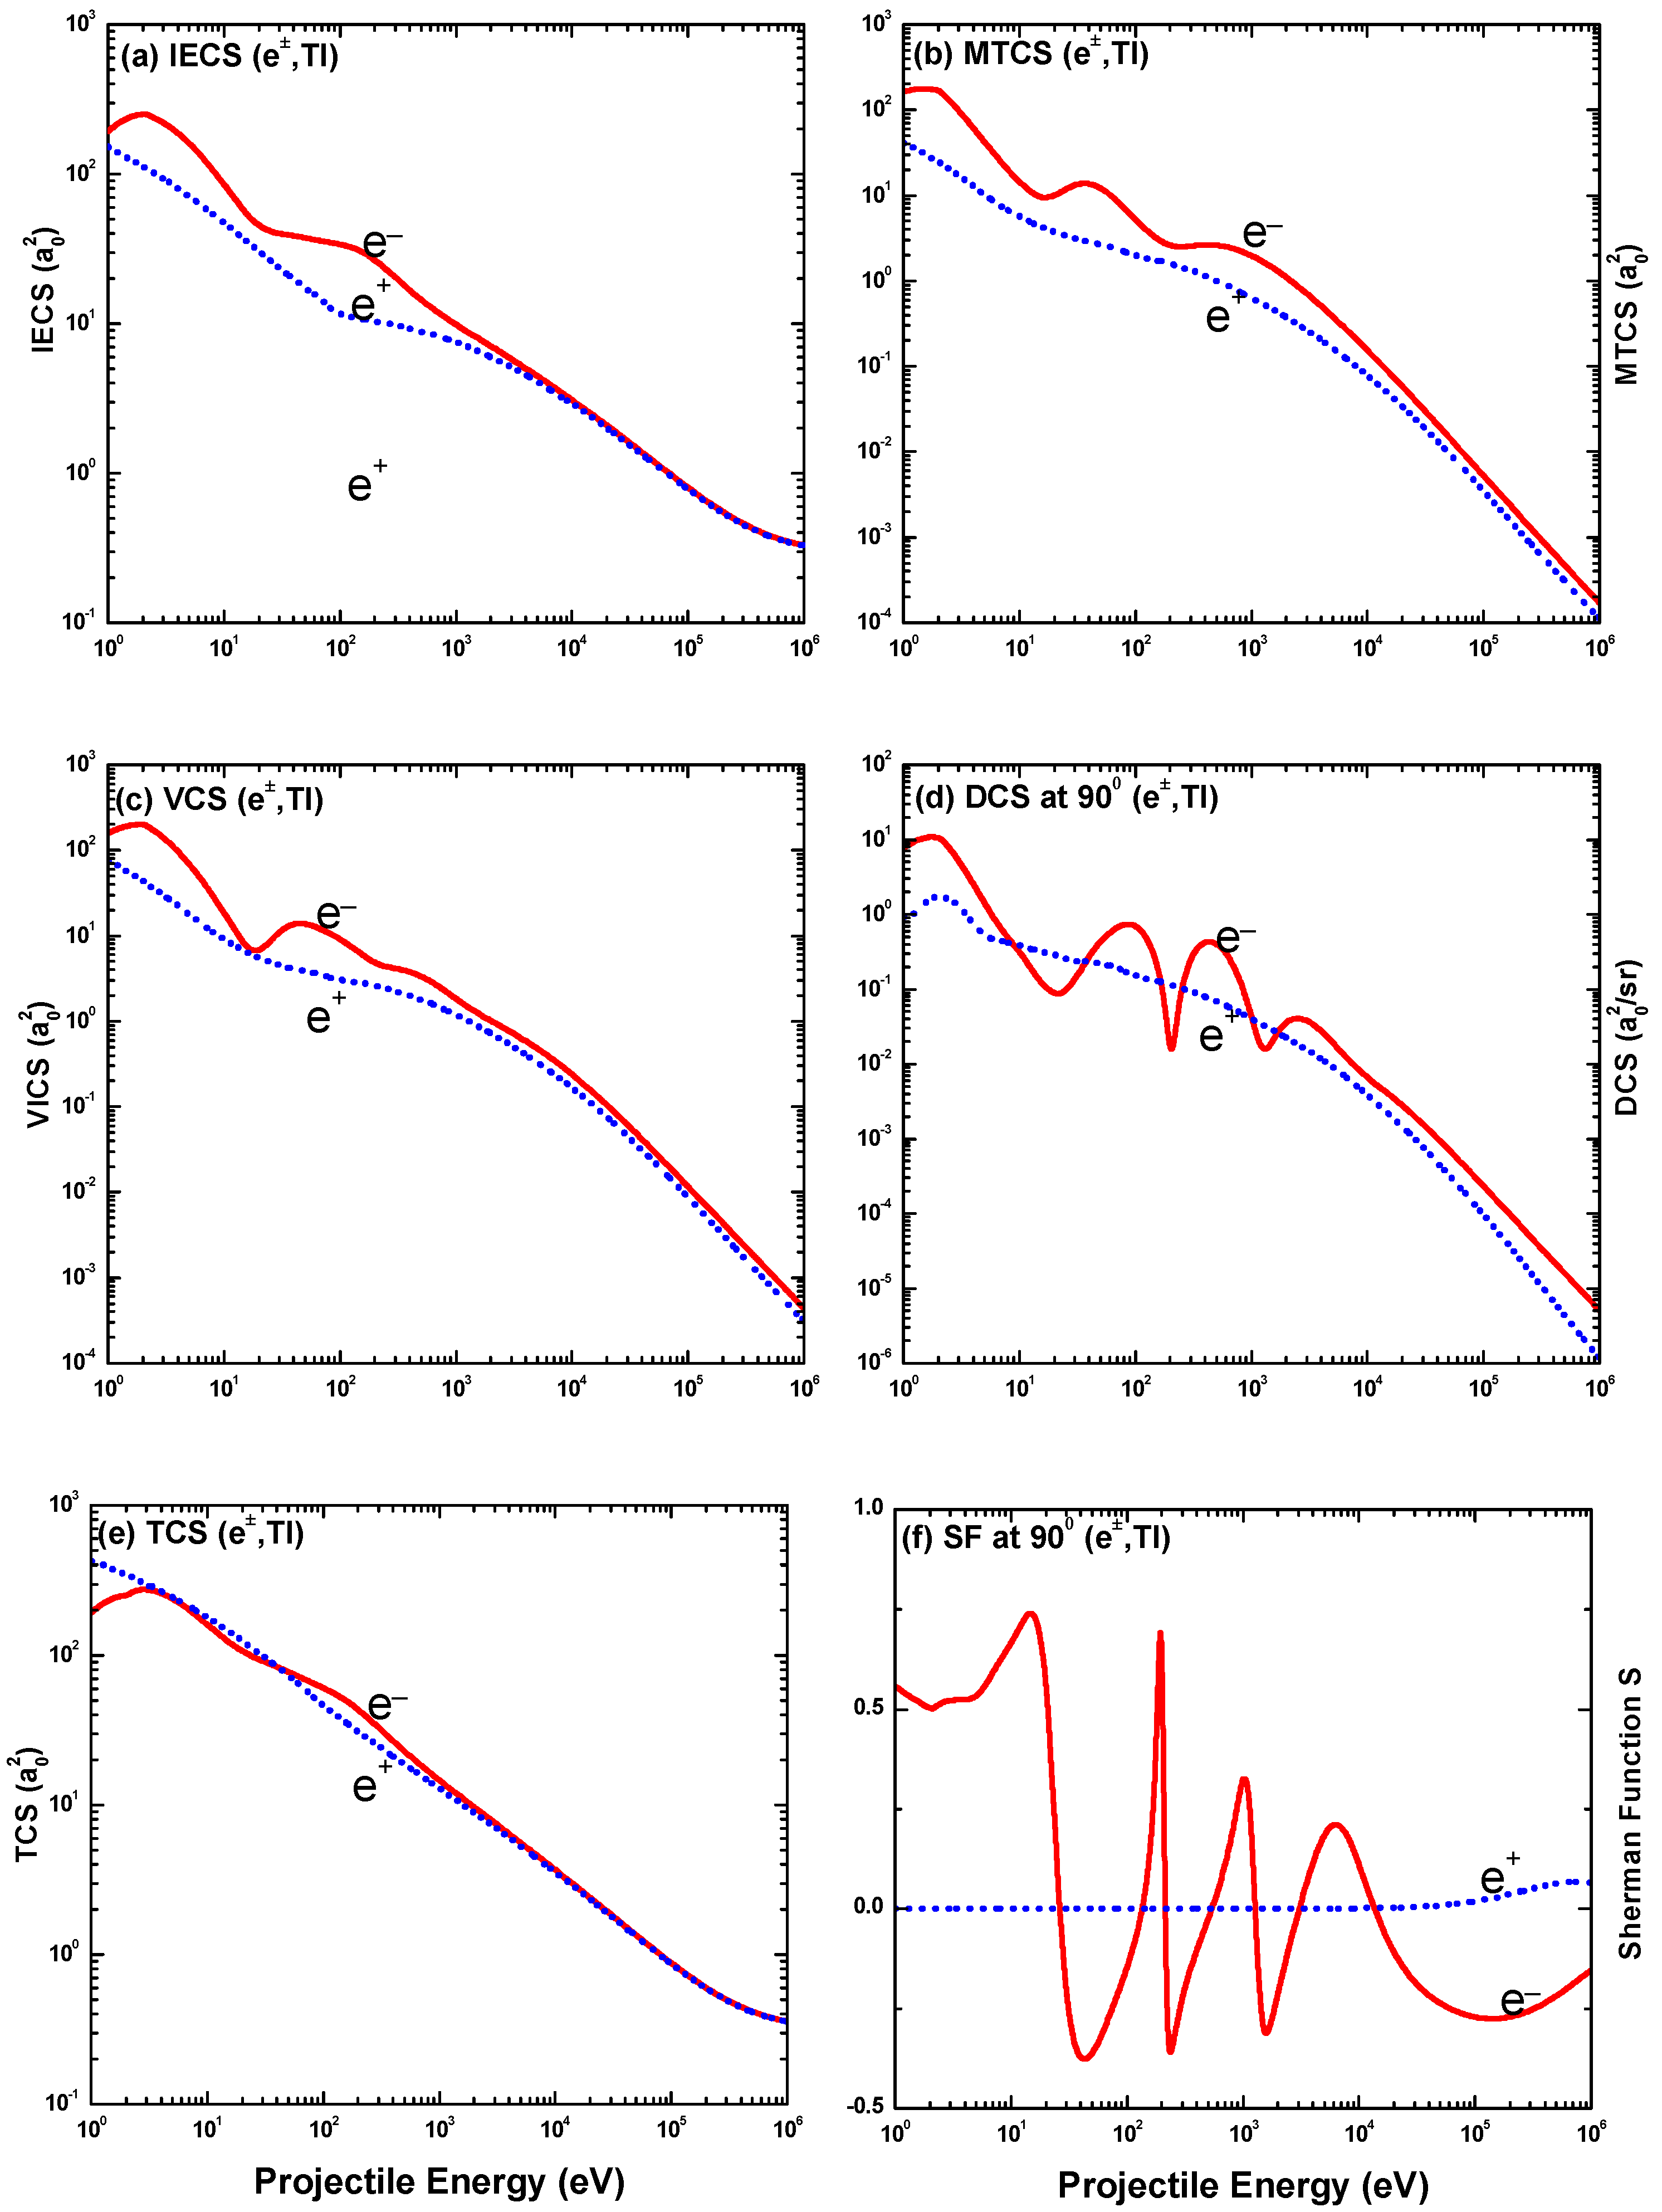
4.2.5. Comparison of Electron and Positron Impact Results

Figure 30 depicts a comparison of our results of the energy variations of the IECS, MTCS, VCS, and DCS at 90°, TCS, and Sherman function S ( θ ) at 90° for the scattering of electrons and positrons from thallium atoms. For electron scattering, we found some R–T structures at lower energies, shown in Figure 30, but as the energy increases, the structure gradually diminishes. In Figure 30, the IECS, MTCS, VCS, and TCS results both for the electron and positron scattering are distinguishable at lower energy, but the results become similar at higher energies. Figure 30a,e demonstrate that the two curves for both electron and positron scattering become identical after 10 keV for IECS and 5 keV for TCS. However, according Figure 30b,c, the MTCS and VCS results for both electron and positron scattering are identical at ultimate high energy. This analysis reveals that the exchange, correlation, polarization, and absorption potentials basically decline at high energies. At high projectile energies, the static potential takes over as the main factor and contributes equally to both scatterings.
We compare our observations for the energy-dependent DCS and the associated Sherman function at 90° for the scattering of electrons and positrons from thallium in Figure 30d,f. At low energy, DCSs of electron scattering are impressively distinct from those of positron scattering, as illustrated in Figure 30d. We see that the R–T structures diminish as the energy increases, eventually disappearing after 10 keV. This happens due to the dominance of the static potential predominates in the high energy region. However, there is only one DCS minimum in positron scattering at low energies. The absence of exchange potential for positron scattering might be responsible for the lower number of DCS minima, and perhaps these low energy minima are caused by the influence of the correlation polarization potential. Furthermore, throughout all energies, the values of positron DCS are less than those of electron DCS.
Figure 30f presents our OPM results of Sherman function for e±–Tl scattering. For electron scattering, the Sherman function oscillates with larger magnitudes, and the highest oscillation occurs at 15 eV. However, no structure is observed for positron scattering up to 1 MeV. We can conclude that the Sherman function S for electron and positron scattering will concede at high energy.

5. Conclusions

In the current work, we report theoretical investigations of elastic differential, integral elastic, momentum transfer, viscosity, inelastic and total cross sections, and spin asymmetry parameters for electron and positron scattering in the post-transition metal thallium. The calculations are performed within the framework of Dirac relativistic partial wave analysis using a complex optical potential model (OPM) over the range of projectile kinetic energies of 1 eV ≤ Ei ≤ 1 MeV. OPM involves the interaction of incident leptons with both the nuclei and bound electrons of the target atom. All the above results agree reasonably well with the sparsely available experimental data, and other theoretical predictions using different interaction potentials and methods. This means that OPM can be used to generate cross-sectional data on scattering of electrons and positrons from atoms, covering both the atomic and nuclear energy range. However, at low energies below 24 eV, the predictions contradict experimental data and other calculations related to the Sherman function S ( θ ). Nevertheless, the current method is suitable for generating data over a wide range of incident energies, making it more advantageous for modeling phenomena in applied science and technologies.
Critical minima of DCS distributions and total spin polarization in the elastic scattering of electrons in the Tl atom have been systematically studied. The energies and angular positions of 13 CMs of DCSs are revealed and discussed. Twenty-five maximum polarization points are determined near the CM positions. At these points, the spin polarization is over or equal to 90%. Large differences are seen in the spin asymmetries S, U and T at low collision energies associated with electron and positron scatterings. For electron impact collisions, their diffraction structures correspond to those of the DCSs, leading to large polarizations. On the other hand, for the positron, the spin asymmetry approaches closely to zero asymptotically (S and U or T). This finding testifies to the oversensitivity of the aforesaid spin parameters to the choice of potential and the collision dynamics. The presence and absence of the exchange potential in electron and positron interactions with the atom respectively and the difference in the short range correlation polarization potential used for the above two projectiles are responsible for the observed differences mentioned above.
The present work includes DCS, IECS, MTCS, VCS, INCS, and TCS of e+−Tl scattering in the energy range 1 eV–1 MeV. Our DCS results show a good agreement with other theoretical calculations. The integrated cross-sections IECS, MTCS, VCS, INCS, and TCS could not be compared with other sources of data, experimental, or theoretical. However, the energy variation of these scattering observables follow the patterns of lepton–atom scattering. Thus, the OPM method, easy to implement, stands out to be a suitable method for generating atomic data for e±–Tl scattering. However, future experiments and theoretical calculations are needed to confirm the exact locations of CMs in e–Tl collisions. Our results may guide future research. This realm of raw data are required for computer simulations of various processes involved in many areas of science and technology.

Author Contributions

S.P.: Investigation, analysis, and artwork; M.M.B.: validation and supervision; M.H.K.: editing and review; M.I.H.: writing—original draft and review; M.M.H.: writing—draft and editing; M.S.B.: review and editing; H.W.: review, resource and funding acquisition; A.K.F.H.: supervision and conceptualization; M.A.U.: software, review, and conceptualization. All authors have read and agreed to the submitted version of the manuscript.

Funding

This work was supported by the JSPS KAKENHI Grant No. 19H04296 and University of Rajshahi Grant No. 926/5/52/RU/Science-04/20-21. The authors thankfully acknowledge the grants.

Data Availability Statement

Not applicable.

Conflicts of Interest

The authors declare no conflict of interest.

References

  1. Christophorou, L.; Hunter, S. From basic research to application. Electron-Mol. Interact. Their Appl. 1984, 2, 318. [Google Scholar]
  2. Gargioni, E.; Grosswendt, B. Electron scattering from argon: Data evaluation and consistency. Rev. Mod. Phys. 2008, 80, 451. [Google Scholar] [CrossRef]
  3. Hosain, M.E.; Patoary, M.A.R.; Haque, M.; Haque, A.F.; Hossain, M.I.; Uddin, M.A.; Basak, A.K.; Maaza, M.; Saha, B.C. Elastic scattering of e± by Na atoms. Mol. Phys. 2018, 116, 631–648. [Google Scholar] [CrossRef]
  4. Ismail Hossain, M.; Haque, A.; Atiqur, M.; Patoary, R.; Uddin, M.; Basak, A. Elastic scattering of electrons and positrons by atomic magnesium. Eur. Phys. J. D 2016, 70, 1–9. [Google Scholar] [CrossRef]
  5. Khandker, M.H.; Haque, A.; Maaza, M.; Uddin, M.A. Scattering of e±from the neon isonuclear series over the energy range 1 eV–0.5 GeV. Jpn. J. Appl. Phys. 2020, 59, SHHA05. [Google Scholar] [CrossRef]
  6. Afroz, S.; Haque, M.; Haque, A.F.; Jakubassa-Amundsen, D.; Patoary, M.A.R.; Shorifuddoza, M.; Khandker, M.H.; Uddin, M.A. Elastic scattering of electrons and positrons from 115In atoms over the energy range 1 eV–0.5 GeV. Results Phys. 2020, 18, 103179. [Google Scholar] [CrossRef]
  7. Khatun, M.M.; Haque, M.; Patoary, M.A.R.; Shorifuddoza, M.; Khandker, M.H.; Haque, A.F.; Watabe, H.; Uddin, M.A. Theoretical study of e±scattering by the Au atom. Results Phys. 2021, 29, 104742. [Google Scholar] [CrossRef]
  8. Shorifuddoza, M.; Patoary, M.A.R.; Jakubassa-Amundsen, D.; Haque, A.; Uddin, M.A. Scattering of e± from ytterbium atoms. Eur. Phys. J. D 2019, 73, 1–23. [Google Scholar] [CrossRef]
  9. Marinković, B.; Pejčev, V.; Filipović, D.; Šević, D.; Milosavljević, A.; Milisavljević, S.; Rabasović, M.; Pavlović, D.; Maljković, J. Cross section data for electron collisions in plasma physics. In Proceedings of the Journal of Physics: Conference Series; IOP Publishing: Bristol, UK, 2007; Volume 86, p. 012006. [Google Scholar]
  10. Fortov, V.; Iakubov, I.; Khrapak, A. Physics of Strongly Coupled Plasma; OUP: Oxford, UK, 2006; Volume 135. [Google Scholar]
  11. Dimitrijević, M.S.; Sahal-Bréchot, S. Stark broadening of neutral zinc spectral lines. Astron. Astrophys. Suppl. Ser. 1999, 140, 193–196. [Google Scholar] [CrossRef]
  12. dos Santos, R.M.; da Cunha, W.F.; Giozza, W.F.; de Sousa Júnior, R.T.; Roncaratti, L.F.; Júnior, L.A.R. Electronic and structural properties of Janus MoSSe/MoX2 (X= S, Se) in-plane heterojunctions: A DFT study. Chem. Phys. Lett. 2021, 771, 138495. [Google Scholar] [CrossRef]
  13. Thorén, P. Removal of the calcium underabundance in cool metal rich Galactic disk dwarfs. arXiv 2000, arXiv:astro-ph/0005404. [Google Scholar]
  14. Hulett Jr, L.; Donohue, D.; Xu, J.; Lewis, T.; McLuckey, S.; Glish, G. Mass spectrometry studies of the ionization of organic molecules by low-energy positrons. Chem. Phys. Lett. 1993, 216, 236–240. [Google Scholar] [CrossRef]
  15. Somieski, B.; Hulett, L.D.; Xu, J.; Pint, B.A.; Tortorelli, P.F.; Nielsen, B.; Asoka-Kumar, P.; Suzuki, R.; Ohdaira, T. Microstructure of thermally grown and deposited alumina films probed with positrons. Phys. Rev. B 1999, 59, 6675. [Google Scholar] [CrossRef]
  16. Schultz, P.J.; Lynn, K.G. Interaction of positron beams with surfaces, thin films, and interfaces. Rev. Mod. Phys. 1988, 60, 701. [Google Scholar] [CrossRef]
  17. Guessoum, N. Positron astrophysics and areas of relation to low-energy positron physics. Eur. Phys. J. D 2014, 68, 1–6. [Google Scholar] [CrossRef]
  18. Surko, C.; Leventhal, M.; Crane, W.; Passner, A.; Wysocki, F.; Murphy, T.; Strachan, J.; Rowan, W. Use of positrons to study transport in tokamak plasmas. Rev. Sci. Instrum. 1986, 57, 1862–1867. [Google Scholar] [CrossRef]
  19. Surko, C.; Greaves, R. Emerging science and technology of antimatter plasmas and trap-based beams. Phys. Plasmas 2004, 11, 2333–2348. [Google Scholar] [CrossRef]
  20. Bartschat, K.; Tennyson, J.; Zatsarinny, O. Quantum-Mechanical Calculations of Cross Sections for Electron Collisions With Atoms and Molecules. Plasma Process. Polym. 2017, 14, 1600093. [Google Scholar] [CrossRef]
  21. Sinha, N.; Singh, S.; Antony, B. Positron total scattering cross-sections for alkali atoms. J. Phys. B At. Mol. Opt. Phys. 2017, 51, 015204. [Google Scholar] [CrossRef]
  22. Ratnavelu, K.; Brunger, M.J.; Buckman, S.J. Recommended positron scattering cross sections for atomic systems. J. Phys. Chem. Ref. Data 2019, 48, 023102. [Google Scholar] [CrossRef]
  23. Haque, A.F.; Uddin, M.A.; Jakubassa-Amundsen, D.; Saha, B.C. Comparative study of eV to GeV electrons and positrons scattering elastically from neutral atoms. J. Phys. B At. Mol. Opt. Phys. 2018, 51, 175202. [Google Scholar] [CrossRef]
  24. Jakubassa-Amundsen, D.; Ponomarev, V.Y. Electric dipole excitation of 208Pb by polarized electron impact. Eur. Phys. J. A 2016, 52, 1–10. [Google Scholar] [CrossRef]
  25. Jakubassa-Amundsen, D.; Ponomarev, V.Y. Coincident excitation and radiative decay in electron-nucleus collisions. Phys. Rev. C 2017, 95, 024310. [Google Scholar] [CrossRef]
  26. Dapor, M. Transport of Energetic Electrons in Solids: Computer Simulation with Applications to Materials Analysis and Characterization; Springer: Berlin/Heidelberg, Germany, 2016; Volume 999. [Google Scholar]
  27. Green, D. ANTICOOL: Simulating positron cooling and annihilation in atomic gases. Comput. Phys. Commun. 2018, 224, 362–370. [Google Scholar] [CrossRef]
  28. Arretche, F.; Barp, M.V.; Scheidt, A.; Seidel, E.P.; Tenfen, W. Semiempirical models for low energy positron scattering by Ar, Kr and Xe. J. Phys. B At. Mol. Opt. Phys. 2019, 52, 215201. [Google Scholar] [CrossRef]
  29. Jakubassa-Amundsen, D.H.; Haque, A.K.F.; Haque, M.M.; Billah, M.M.; Basak, A.K.; Saha, B.C.; Uddin, M.A. Electron and Positron Scattering from Precious Metal Atoms in the eV to MeV Energy Range. Atoms 2022, 10, 82. [Google Scholar] [CrossRef]
  30. Schlimme, B.; Achenbach, P.; Aulenbacher, K.; Baunack, S.; Bender, D.; Beričič, J.; Bosnar, D.; Correa, L.; Dehn, M.; Distler, M.; et al. Vertical beam polarization at MAMI. Nucl. Instruments Methods Phys. Res. Sect. A Accel. Spectrometers Detect. Assoc. Equip. 2017, 850, 54–60. [Google Scholar] [CrossRef]
  31. Lebowitz, E.; Greene, M.; Fairchild, R.; Bradley-Moore, P.; Atkins, H.; Ansari, A.; Richards, P.; Belgrave, E. Thallium-201 for medical use. I. J. Nucl. Med. 1975, 16, 151–155. [Google Scholar]
  32. Feller, P.A.; Sodd, V.J. Dosimetry of four heart-imaging radionuclides: 43K, 81Rb, 129Cs, and 201Tl. J. Nucl. Med. 1975, 16, 1070–1075. [Google Scholar]
  33. Viraraghavan, T.; Srinivasan, A. Thallium: Environmental Pollution and Health Effects; Elsevier: Amsterdam, The Netherlands, 2011. [Google Scholar]
  34. Kaussen, F.; Geesmann, H.; Hanne, G.; Kessler, J. Study of spin polarisation in elastic scattering of electrons from Hg, Tl, Pb and Bi atoms. J. Phys. B At. Mol. Phys. (1968–1987) 1987, 20, 151. [Google Scholar] [CrossRef]
  35. Haberland, R.; Fritsche, L. On the elastic scattering of low-energy electrons by Hg, Tl, Pb and Bi atoms. J. Phys. B At. Mol. Phys. (1968–1987) 1987, 20, 121. [Google Scholar] [CrossRef]
  36. Tawara, H.; Kato, T. Total and partial ionization cross sections of atoms and ions by electron impact. At. Data Nucl. Data Tables 1987, 36, 167–353. [Google Scholar] [CrossRef]
  37. Mayol, R.; Salvat, F. Total and transport cross sections for elastic scattering of electrons by atoms. At. Data Nucl. Data Tables 1997, 65, 55–154. [Google Scholar] [CrossRef]
  38. Dapor, M.; Miotello, A. Differential, total, and transport cross sections for elastic scattering of low energy positrons by neutral atoms (Z = 1–92, E = 500–4000 eV). At. Data Nucl. Data Tables 1998, 69, 1–100. [Google Scholar] [CrossRef]
  39. Rose, M.E. Relativistic Electron Theory; Wiley: New York, NY, USA, 1961. [Google Scholar]
  40. Salvat, F.; Fernández-Varea, J.; Williamson, W., Jr. Accurate numerical solution of the radial Schrödinger and Dirac wave equations. Comput. Phys. Commun. 1995, 90, 151–168. [Google Scholar] [CrossRef]
  41. Salvat, F. Optical-model potential for electron and positron elastic scattering by atoms. Phys. Rev. A 2003, 68, 012708. [Google Scholar] [CrossRef]
  42. Haque, A.; Hossain, M.I.; Uddin, M.A.; Patoary, M.A.R.; Basak, A.; Maaza, M.; Saha, B. Elastic scattering of electrons and positrons by cadmium atoms. Mol. Phys. 2017, 115, 566–578. [Google Scholar] [CrossRef]
  43. Abdullah, M.; Alam, N.; Kumar, A.; Haque, A.K.F.; Alfaz Uddin, M. A study of critical minima and spin polarization in the e±–Ba elastic scattering. Eur. Phys. J. D 2020, 74, 1–25. [Google Scholar] [CrossRef]
  44. Salvat, F.; Jablonski, A.; Powell, C.J. ELSEPA—Dirac partial-wave calculation of elastic scattering of electrons and positrons by atoms, positive ions and molecules. Comput. Phys. Commun. 2005, 165, 157–190. [Google Scholar] [CrossRef]
  45. Furness, J.; McCarthy, I. Semiphenomenological optical model for electron scattering on atoms. J. Phys. B At. Mol. Phys. (1968–1987) 1973, 6, 2280. [Google Scholar] [CrossRef]
  46. Desclaux, J. A multiconfiguration relativistic Dirac–Fock program. Comput. Phys. Commun. 1975, 9, 31–45. [Google Scholar] [CrossRef]
  47. Sun, J.; Yu, G.; Jiang, Y.; Zhang, S. Total cross-sections for positron scattering by a series of molecules. Eur. Phys. J. D-At. Mol. Opt. Plasma Phys. 1998, 4, 83–88. [Google Scholar] [CrossRef]
  48. Perdew, J.P.; Zunger, A. Self-interaction correction to density-functional approximations for many-electron systems. Phys. Rev. B 1981, 23, 5048. [Google Scholar] [CrossRef]
  49. Jain, A. Low-energy positron-argon collisions by using parameter-free positron correlation polarization potentials. Phys. Rev. A 1990, 41, 2437. [Google Scholar] [CrossRef]
  50. Radzig, A.A.; Smirnov, B.M. Interaction potentials between atomic and molecular species. In Reference Data on Atoms, Molecules, and Ions; Springer: Berlin/Heidelberg, Germany, 1985; pp. 307–315. [Google Scholar]
  51. Mott, N.F.; Massey, H.S.W.; of Monographs on Physics, T.I.S. The Theory of Atomic Collisions; Clarendon Press: Oxford, UK, 1965; Volume 35. [Google Scholar]
  52. Kessler, J. Relativistic calculations for spin-polarization of elastic electron-mercury scattering. Adv. At. Mol. Opt. Phys. 1990, 27, 81–163. [Google Scholar]
  53. Haque, A.; Haque, M.; Bhattacharjee, P.P.; Uddin, M.A.; Patoary, M.A.R.; Hossain, M.I.; Basak, A.; Mahbub, M.S.; Maaza, M.; Saha, B. Relativistic calculations for spin-polarization of elastic electron—Mercury scattering. J. Phys. Commun. 2017, 1, 035014. [Google Scholar] [CrossRef]
  54. Joshipura, K.; Antony, B. Total (including ionization) cross sections of electron impact on ground state and metastable Ne atoms. Phys. Lett. A 2001, 289, 323–328. [Google Scholar] [CrossRef]
  55. Saha, B.C.; Jakubassa-Amundsen, D.; Basak, A.; Haque, A.; Haque, M.; Khandker, M.H.; Uddin, M.A. Chapter One -Elastic scattering of electrons and positrons from alkali atoms. Adv. Quantum Chem. 2022, 86, 1–149. [Google Scholar] [CrossRef]
  56. Beiser, A. Concepts of Modern Physics, 2nd ed.; McGraw-Hill Co.: New York, NY, USA, 1973. [Google Scholar]
  57. Ramsauer, C. Uber den wirkungsquerschnitt der gasmolekule Gegenuber Langsamen electronen. I. Fortsetzung. Ann. Phys. 1921, 66, 546. [Google Scholar]
  58. Townsend, J.; Bailey, V. LXX. The motion of electrons in argon. London, Edinb. Dublin Philos. Mag. J. Sci. 1922, 43, 593–600. [Google Scholar] [CrossRef]
  59. McFarland, R.H. Electron-impact ionization measurements of surface-ionizable atoms. Phys. Rev. 1967, 159, 20. [Google Scholar] [CrossRef]
  60. Shimon, L.; Nepiipov, E.; Zapesochnyi, I. Effective total electron-impact ionization cross sections for aluminum gallium, indium, and thallium. Sov. Phys. Tech. Phys. 1975, 20, 434. [Google Scholar]
  61. Haque, A.; Haque, M.; Hossain, M.S.; Hossain, M.I.; Patoary, M.A.R.; Maaza, M.; Basak, A.; Saha, B.; Uddin, M.A. A study of the critical minima and spin polarization in the elastic electron scattering by the lead atom. J. Phys. Commun. 2018, 2, 125013. [Google Scholar] [CrossRef]
  62. Haque, M.; Haque, A.; Jakubassa-Amundsen, D.; Patoary, M.A.R.; Basak, A.; Maaza, M.; Saha, B.; Uddin, M.A. e±-Ar scattering in the energy range 1 eV ≤ Ei ≤ 0.5 GeV. J. Phys. Commun. 2019, 3, 045011. [Google Scholar] [CrossRef]
  63. Walker, D. Relativistic effects in low energy electron scattering from atoms. Adv. Phys. 1971, 20, 257–323. [Google Scholar] [CrossRef]
  64. Lucas, M.; Jakubassa-Amundsen, D.; Kuzel, M.; Groeneveld, K. Quasifree electron scattering in atomic collisions: The Ramsauer–Townsend effect revisited. Int. J. Mod. Phys. A 1997, 12, 305–378. [Google Scholar] [CrossRef]
Figure 1. Radial distance r times the radial distribution of the potential V ( r ) for (a) e–Tl and (b) e+–Tl scattering. The red solid line represents the real potential, and the dotted (black) and dotted (blue) lines are, respectively, the static and Coulomb potentials. (c) shows the electronic charge density of Tl VS radial distance from the nucleus.
Atoms 11 00037 g001
Figure 2. DCS and S ( θ ) for e±–Tl scattering at 90° as a function of incident energy. The (red) solid, (green) dashed, (blue) dotted and (black) dotted lines are, respectively, the contributions from V O P M [ V s t + V e x + V c p i W a b s ] , V s t + V e x + V c p , V s t + V e x and V s t .
Atoms 11 00037 g002
Figure 3. DCS and S ( θ ) for e±–Tl scattering at 90° as a function of incident energy. The effect of Coulomb potential is shown in (blue) dotted lines.
Atoms 11 00037 g003
Figure 4. DCS ( a 0 2 / s r ) and the Sherman function for the elastic scattering of electron from Tl at incident energies of 50, 1000 and 10,000 eV.
Atoms 11 00037 g004
Figure 5. Angular dependence of the DCS ( a 0 2 / s r ) and the Sherman function for the elastic scattering of positron from Tl at incident energies of 50, 1000 and 10,000 eV.
Atoms 11 00037 g005
Figure 6. DCS ( a 0 2 / s r ) for the elastic scattering of electrons from Tl at incident energies (a) 10 eV, (b) 20 eV, (c) 30 eV, (d) 50 eV, (e) 70 eV, and (f) 90 eV.
Atoms 11 00037 g006
Figure 7. DCS ( a 0 2 / s r ) for the elastic scattering of electrons from Tl at incident energies (a) 100 eV, (b) 250 eV, (c) 500 eV, (d) 1000 eV, (e) 1500 eV, and (f) 2000 eV.
Atoms 11 00037 g007
Figure 8. DCS ( a 0 2 / s r ) for the elastic scattering of electrons from Tl at incident energies (a) 3 keV, (b) 5 keV, (c) 10 keV, (d) 15 keV, (e) 30 keV, and (f) 50 keV.
Atoms 11 00037 g008
Figure 9. DCS ( a 0 2 / s r ) for the elastic scattering of electrons from Tl at incident energies (a) 75 keV, (b) 100 keV, (c) 150 keV, (d) 250 keV, (e) 500 keV, and (f) 1 MeV.
Atoms 11 00037 g009
Figure 10. Sherman function for the elastic scattering of electron from Tl at incident energies of (a) 1.0 eV, (b) 6.0 eV, (c) 9.0 eV, (d) 11.0 eV, (e) 12.5 eV, and (f) 14.0 eV. Theoretical works: Haberland and Fritsche [35]. Experimental works: Kaussen et al. [34].
Atoms 11 00037 g010
Figure 11. Sherman function for the elastic scattering of electron from Tl at incident energies of (a) 17 eV, (b) 24 eV, (c) 50 eV, (d) 100 eV, (e) 150 eV, and (f) 180 eV. Theoretical works: Haberland and Fritsche [35]. Experimental works: Kaussen et al. [34].
Atoms 11 00037 g011
Figure 12. Sherman function for the elastic scattering of electron from Tl at incident energies of (a) 200 eV, (b) 250 eV, (c) 500 eV, (d) 1000 eV, (e) 1500 eV, and (f) 2000 eV.
Atoms 11 00037 g012
Figure 13. Sherman function for the elastic scattering of electron from Tl at incident energies of (a) 5 and 7 keV, (b) 9 and 10 keV, (c) 20 and 50 keV, (d) 70 and 100 keV, (e) 200 and 500 keV, and (f) 700 keV and 1 MeV.
Atoms 11 00037 g013
Figure 14. Incident electron energy dependency of DCS ( a 0 2 / s r ) and Sherman function for the elastic scattering from Tl at scattering angles 30°, 90°, and 150°. Theoretical Works: OPM. Experimental works: Kaussen et al. [34].
Atoms 11 00037 g014
Figure 15. Incident electron energy dependency of spin asymmetry functions U and T for the elastic scattering from Tl at scattering angles 30°, 90°, and 150°.
Atoms 11 00037 g015
Figure 16. Energy dependence of the (a) IECS, (b) MTCS, (c) VCS, (d) INCS, (e) TCS, and (f) TICS for e–Tl scattering. Theoretical works: OPM, Mayol and Salvat [37]. Experimental works: McFarland [59] and Shimon et al. [60].
Atoms 11 00037 g016
Figure 17. A 3D view of the behavior of DCS for e–Tl scattering for energies from 1 eV to 10 keV. The sharp peaks are the critical minima.
Atoms 11 00037 g017
Figure 18. A 3D view of the behavior of of Sherman function S for e–Tl scattering for energies from 1 eV to 10 keV. The sharp peaks show the position of total-polarization points.
Atoms 11 00037 g018
Figure 19. Angular dependence of the DCS and S for some incident energies in the vicinity of the CM at ( E c = 8.3 eV; θ c = 108.5°) (a,b); ( E c = 268.7 eV; θ c = 147.0°) (c,d); and ( E c = 911.7 eV; θ c = 100.0°) (e,f).
Atoms 11 00037 g019
Figure 20. Angle dependence of the differential cross section (DCS) for e+–Tl scattering at (a) 10 eV, (b) 20 eV, (c) 30 eV, (d) 50 eV, (e) 70 eV, and (f) 90 eV.
Atoms 11 00037 g020
Figure 21. Angle dependence of the differential cross section (DCS) for e+–Tl scattering at (a) 100 eV, (b) 250 eV, (c) 500 eV, (d) 1000 eV, (e) 1500 eV, (f) 2000 eV.
Atoms 11 00037 g021
Figure 22. Angle dependence of the differential cross section (DCS) for e+–Tl scattering at (a) 2500 eV, (b) 3000 eV, (c) 3500 eV, (d) 4000 eV, (e) 4500 eV, (f) 5000 eV.
Atoms 11 00037 g022
Figure 23. Angle dependence of the differential cross section (DCS) for e+–Tl scattering at (a) 10 keV and 20 keV, (b) 30 keV and 50 keV, (c) 100 keV and 200 keV, (d) 300 keV and 400 keV, (e) 500 keV and 700 keV, and (f) 900 keV and 1 MeV.
Atoms 11 00037 g023
Figure 24. Angular dependent Sherman function S ( θ ) for e+–Tl scattering at (a) 10 eV, (b) 20 eV, (c) 30 eV, (d) 50 eV, (e) 70 eV, and (f) 90 eV.
Atoms 11 00037 g024
Figure 25. Angular dependent Sherman function S ( θ ) for e+–Tl scattering at (a) 100 eV, (b) 300 eV, (c) 500 eV, (d) 1000 eV, (e) 1500 eV, (f) 2000 eV.
Atoms 11 00037 g025
Figure 26. Angular dependent Sherman function S ( θ ) for e+–Tl scattering at (a) 5 keV and 7 keV, (b) 9 keV and 10 keV, (c) 20 keV and 50 keV, (d) 70 keV and 100 keV, (e) 200 keV and 500 keV, and (f) 700 keV and 1 MeV.
Atoms 11 00037 g026
Figure 27. Energy variation of DCS and corresponding Sherman function S ( θ ) for e+–Tl scattering at 30°, 90°, and 150°. The solid red line represents our OPM prediction. The open solid circles (blue) are the theoretical calculations of of Dapor and Miotello [38].
Atoms 11 00037 g027
Figure 28. Energy variation of the spin asymmetry parameters U and T for e+–Tl scattering at 30°, 90°, and 150°.
Atoms 11 00037 g028
Figure 29. Energy dependence of (a) IECS, (b) MTCS, (c) VCS, (d) INCS, (e) TCS, and (f) TICS for e+–Tl scattering. Shown are results from the OPM approach (solid line red) in comparison with Dapor and Miotello [38] (open circles blue).
Atoms 11 00037 g029
Figure 30. A comparison of the energy dependence of our OPM results for both e±–Tl scattering. (a) IECS, (b) MTCS, (c) VCS, (d) DCS at 90°, (e) TCS, and (f) Sherman function S ( θ ) at 90°. Solid red lines represent for electron scattering and blue dotted lines represent for positron scattering.
Atoms 11 00037 g030
Table 1. The critical minima (CM) in the DCS for elastic e–Tl scattering values, including their energy and angular positions, for direct and spin–flip scattering amplitudes, and positions.
E c θ c f ( θ ) g ( θ )
(eV)(deg)(cm)(cm)
8.3108.51.64 × 10−91.95 × 10⁻⁹
18.340.01.52 × 10−91.16 × 10⁻⁹
19.1127.52.43 × 10−109.52 × 10⁻¹⁰
25.785.05.06 × 10−101.28 × 10⁻⁹
149.1112.01.59 × 10−103.40 × 10⁻¹⁰
156.9161.59.39 × 10−121.14 × 10⁻¹⁰
226.684.51.05 × 10−105.28 × 10⁻¹⁰
268.7147.04.48 × 10−111.56 × 10⁻¹⁰
334.3119.01.09 × 10−112.80 × 10⁻¹⁰
457.569.01.76 × 10−103.60 × 10⁻¹⁰
564.0153.04.27 × 10−111.03 × 10⁻¹⁰
911.7100.04.50 × 10−112.52 × 10⁻¹⁰
1696.0137.01.31 × 10−111.81 × 10⁻¹⁰
Table 2. Maximum spin polarization points for e–Tl elastic scattering, along with their locations as well as energy and angle departures from the corresponding critical minima sites.
S m E m θ m ± Δ E ± Δ θ
(eV)(deg)(eV)(deg)
+1.008.9102.00.66.5
−1.004.6117.53.79.0
+0.9917.341.01.01.0
+1.0017.2121.51.96.0
−1.0019.9130.00.82.5
+1.0030.983.05.22.0
−0.9715.970.59.814.5
+1.00149.5110.00.42.0
−0.78151.0114.51.92.5
+1.00155.8162.61.11.1
−0.95158.1160.51.21.0
+0.98216.485.010.20.5
−0.92239.983.513.31.0
+0.98270.7146.02.01.0
−0.99267.0147.51.70.5
+1.00321.4120.512.91.5
−1.00353.4117.519.11.5
+1.00455.968.01.61.0
−0.80480.569.023.00.0
−0.89565.8152.54.00.5
+1.00558.3153.53.50.5
+1.00912.998.51.21.5
−0.95925.8101.014.11.0
+0.991748.0135.552.01.5
−0.971639.0138.557.01.5
Disclaimer/Publisher’s Note: The statements, opinions and data contained in all publications are solely those of the individual author(s) and contributor(s) and not of MDPI and/or the editor(s). MDPI and/or the editor(s) disclaim responsibility for any injury to people or property resulting from any ideas, methods, instructions or products referred to in the content.

