Development of a Distributed Modeling Framework to Estimate Thermal Comfort along 2020 Tokyo Olympic Marathon Course


1
The Davey Institute, The Davey Tree Expert Company, Syracuse, NY 13210, USA
2
Environment Department, Social System Division, Nippon Koei Co., Ltd., Tokyo 102-8539, Japan
3
Natural Environment Group, Research & Development Center, Nippon Koei Co., Ltd., Tokyo 102-8539, Japan
*
Author to whom correspondence should be addressed.
Atmosphere 2018, 9(6), 210; https://doi.org/10.3390/atmos9060210
Submission received: 12 March 2018
/
Revised: 24 May 2018
/
Accepted: 26 May 2018
/
Published: 30 May 2018
(This article belongs to the Special Issue Urban Design and City Microclimates)
Abstract
:Heat stress is an issue for marathon races in the summer, such as the one planned for the 2020 Tokyo Summer Olympic games. The Tokyo Metropolitan Government is planning to grow existing street trees’ canopies to enlarge their shade to reduce air temperature and solar radiation. To formulate a baseline to assess the effect of street trees and buildings on human thermal comfort, Distributed-COMfort FormulA (D-COMFA), a prototype of a distributed computer model using a geographic information system (GIS) was developed. D-COMFA calculates the energy budget of a human body on a 1 m cell basis, using readily available datasets such as weather measurements and polygon data for street structures. D-COMFA was applied to a street segment along the marathon course in Tokyo on an hourly-basis on 9 August 2016, the hottest day in Tokyo in 2016. Our case study showed that the energy budget was positively related to the sky view factor, air temperature, and solar radiation. The energy budget was reduced on average by 26–62% in the shade throughout the day.
1. Introduction
Over the past three decades, due to concerns about deterioration of the environment, such as global warming and urban heat islands, the Olympic Games have become proactively involved in promoting environmental awareness and sustainable development worldwide. In June, 1992 the Earth Summit held in Rio de Janeiro established Agenda 21 as a global action plan to commit to the pursuit of economic development in ways that protect the Earth’s environment [1]. During the Olympic Games held the following month in Barcelona, all International Federations and National Committees signed the Earth Pledge, committing them to contribute towards making the Earth a safe place. Alongside sport and culture, environment is now the third pillar of Olympism in the Olympic Charter amended in 1996. Since the Sydney Olympic Games in 2000, environmental thinking has been incorporated into every aspect of the event [2].
Despite the efforts of the International Olympic Committee (IOC), heat stress is still an issue, especially for outdoor competitions in the summer games. For instance, the monthly average of the highest air temperature was 33.2 °C in Athens in August 2004, 30.6 °C in Atlanta in August 1996, and 28.3 °C in Barcelona in August 1992, and many of the athletes and spectators were subjected to heat stress during the marathon race [3,4,5]. Tokyo, Japan is classified as Cfa (humid subtropical climate) by the Köppen-Geiger climate classification [6], and Summer Olympic Games will be held in Tokyo in 2020 during the mid-summer (July–August). The marathon race is planned to start in the morning on 9 August, which typically is among the hottest days in the Tokyo area; the daily mean and maximum air temperatures (26.7 °C and 31.1 °C, respectively) are both the highest over the past 30 years.
To identify influential factors in determining the thermal sensation of the human body, many studies have been conducted in hot and humid Asian countries and areas such as Hong Kong [7,8], Taiwan [9], Singapore [10,11], and Japan [12,13,14]. Typically, these studies consist of three phases: (1) taking micro-meteorological measurements; (2) conducting a guided user questionnaire survey; and (3) correlating the thermal sensation votes to meteorological measurements. Based on these procedures, air temperature, solar radiation and wind speed were generally identified as crucial in determining the thermal comfort of human bodies.
Measures considered by the Japanese government to address thermal comfort issues directly target these critical factors [15]. To reduce air temperature, approaches utilizing water (misting stations, water retention pavement, and hydrophilization of building covering) as well as wind (sea breeze and wind from rivers) are considered. Also, measures focusing on the reduction of waste heat (regional cooling and heating systems, reduction of building waste heat, and reduction of vehicle exhaust heat) and solar radiation reflection (thermal insulation pavement and roof surfaces with high reflection) are proposed. Utilization of green space (parks, street trees, greening of parking lots, greening of building walls and rooftops) is also included in their measures that targets reducing air temperature and solar radiation. The Tokyo Metropolitan Government (TMG) is planning to implement some of these measures, such as mist stations [16], water retention and thermal insulation pavement [17] as a preparation for 2020 Tokyo Olympic Games. In addition, TMG is planning to grow the existing street trees’ canopies to enlarge their shade to improve the heat environment of the mid-summer marathon course [18].
Effects of street trees and greenery on cooling the urban landscape and improving human thermal comfort were reported by many researchers. Coutts et al. [19] explored the role of street trees in deep and shallow street canyons with high and low tree canopy covers during the summer in Melbourne, Australia. Maximum daytime cooling effects reached −1.5 °C in shallow canyons with high tree canopy cover. Ng et al. [20] reported the varied cooling effect of different tree cover percentages in Hong Kong urban areas; 0.4, 0.8 and 1.8 °C reduction by 16%, 34%, and 56% tree cover, respectively. Sugawara et al. [21] collected meteorological measurements during summer periods and year-round in the large green park and its vicinity in the heart of Tokyo, Japan to estimate the thermal influence of the greenery to the surrounding urban environment. They found that the cooler air from the park advected to the surrounding landscape up to 450 m in extent.
There are also spatially distributed analyses of the greening effect on a microscale using a three-dimensional simulation tool such as ENVI-met [22,23]. Morakinyo et al. [24] examined the effects of trees in a virtual street canyon model based upon different leaf area index (LAI) and placement patterns. Lee et al. [25] simulated how physiologically equivalent temperature (PET) varied depending on the existence of trees and the presence or absence of green spaces in a residential district of Freiburg, Germany. To mitigate urban heat island effects, the effect of using high reflectance pavement and roof material, and expansion of the green area, were analyzed in Rome, Italy [26] and Toronto, Canada [27]. In a study in Taiwan, Yang et al. [28] predicted the effect of trees and the green area on the surface in a high temperature and high humidity environment similar to Tokyo.
Over the years, many field studies as well as modeling efforts have been conducted to estimate outdoor human thermal comfort. COMFA (COMfort FormulA) [29,30] is one such model that takes meteorology and human activity into consideration. COMFA has been validated through substantial field tests in outdoor environments [29,31,32,33,34]. However, when the interest is to spatially estimate human thermal comfort in urban areas the analysis is limited to those areas where spatial meteorological data are readily available. Taking new measurements across the area may be expensive, time-consuming, and cumbersome. In cities such as Tokyo where strategic measures against heat are required, it is an urgent task to establish a method that can easily evaluate influence of heat on the human body, utilizing commonly available data [35]. To overcome these problems, we developed a prototype for a modeling framework that only requires commonly available data, the weather measurements at the nearest weather station and polygon data for street structures. Employing a geographic information system (GIS), we implemented the COMFA model in a spatially distributed manner with a fine horizontal resolution along a street. Using this framework, a case study was performed, in which the spectators’ thermal comfort level was estimated for a street segment along the 2020 Tokyo Olympic Games marathon course.
2. Materials and Methods
2.1. COMFA
COMFA calculates outdoor human thermal comfort level based on the energy budget (EB) (W m−2) of a human body as:
M represents the metabolic energy generated in the body and energy lost by respiration, and is determined by activity of the human body and meteorological conditions.
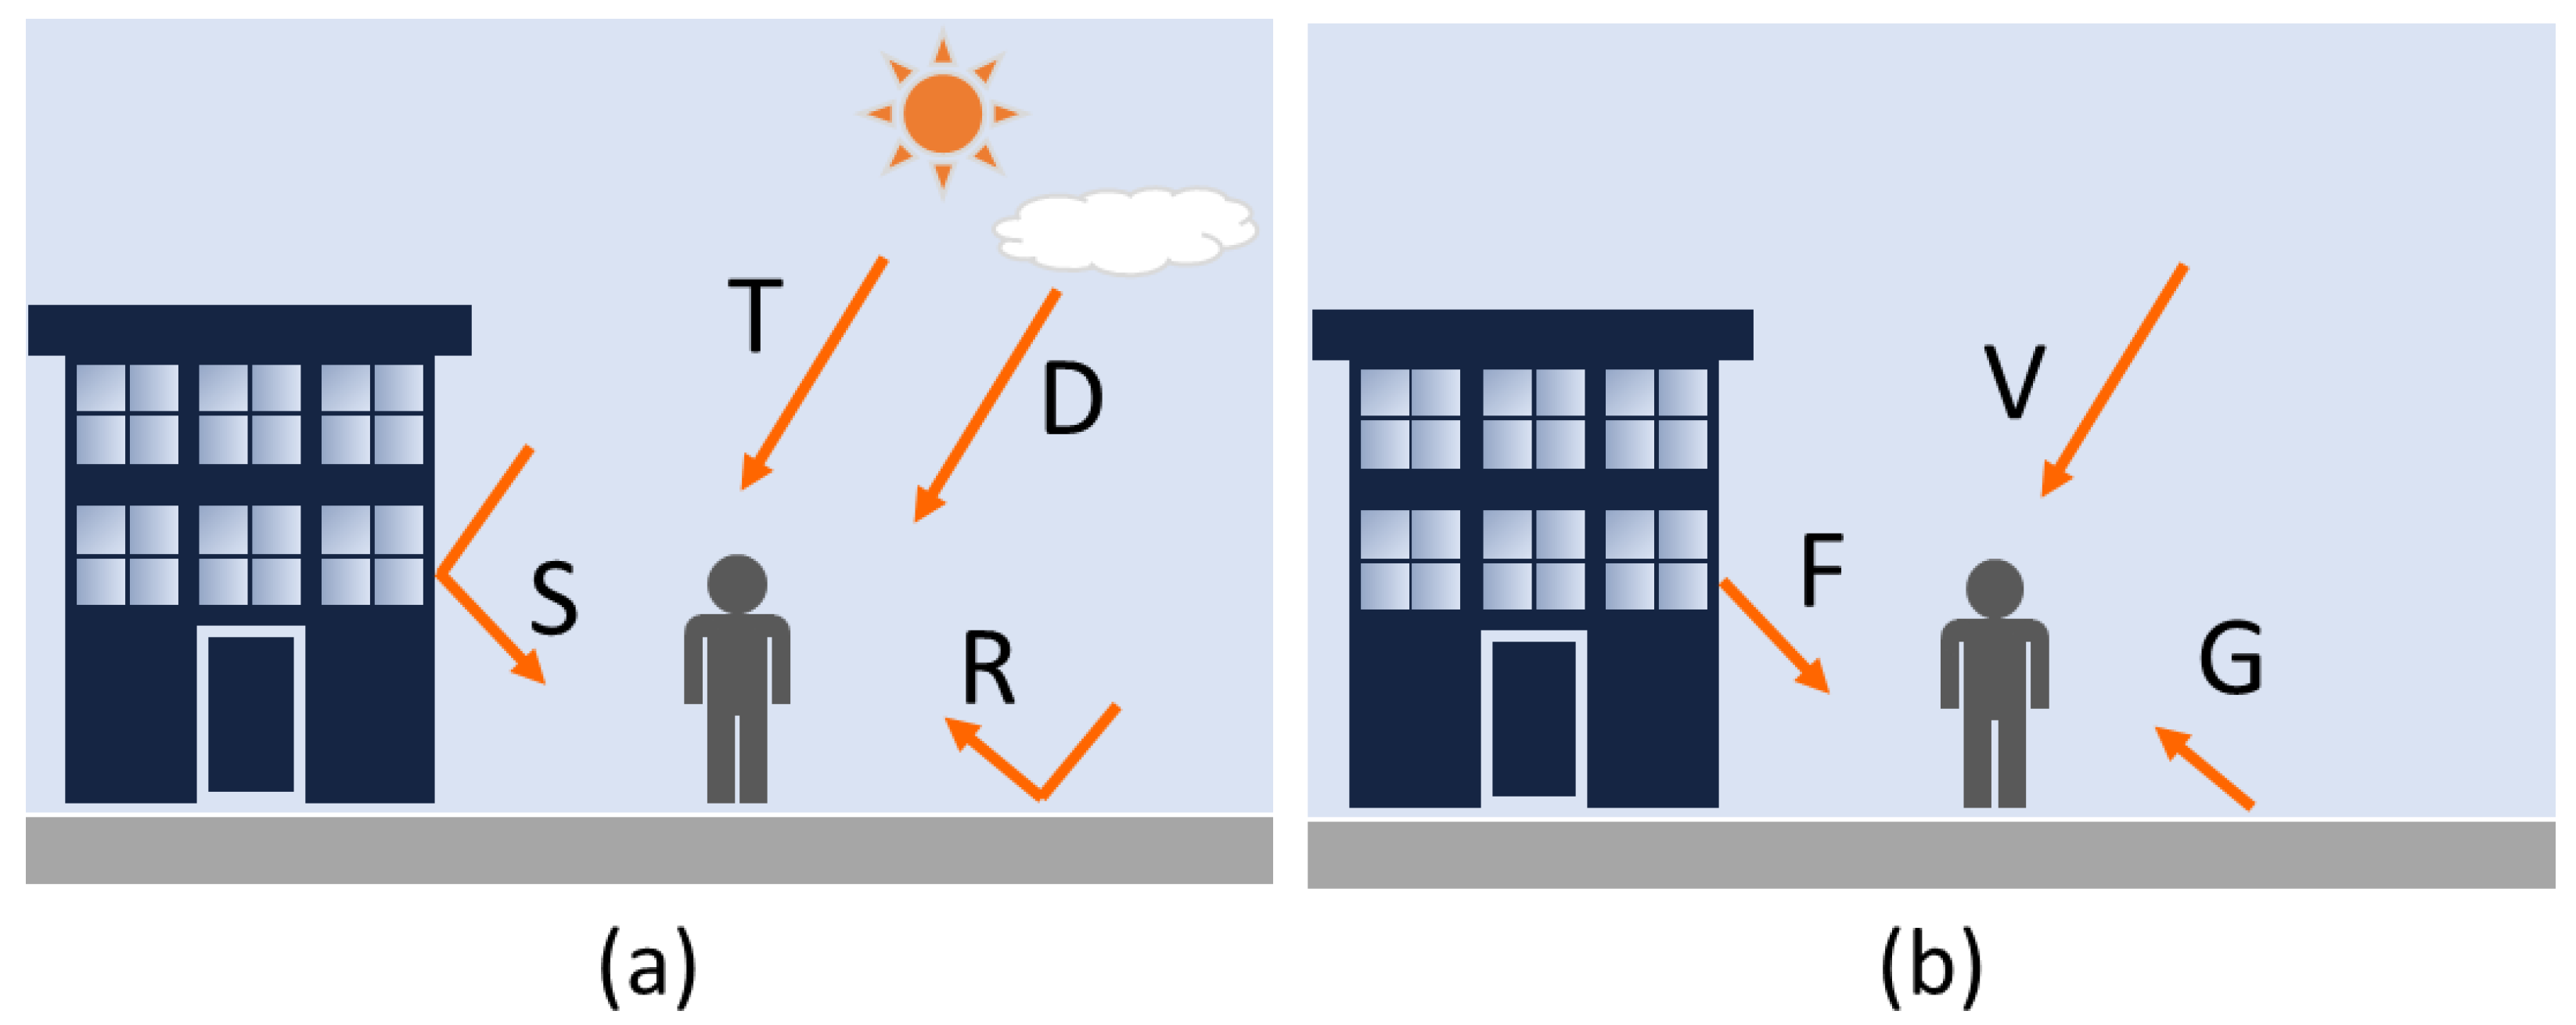
Rabs consists of all radiant energies absorbed by a human body (represented as a vertical cylinder), and is divided into two forms: one caused by solar energy (Figure 1a) and the other by radiant heat (Figure 1b). T is direct solar radiation directly reaching the human body. To calculate T, the horizontal component of direct solar radiation is calculated, and divided by π to convert the energy received by a flat surface to a cylinder surface, and then this is multiplied by the transmissivity of solar light. D, S and R in Figure 1a are diffuse solar radiation; D is directly reaching, and is calculated by diffuse solar radiation multiplied by sky view factor (SVF) that is a measure of the degree to which the sky is obscured by the surroundings for a given point [36], S is reflected from surface objects, calculated by diffuse solar radiation multiplied by wall view factor (1-SVF) and albedo for the surface objects, and R is reflected from the ground, calculated by global solar radiation multiplied by transmissivity and albedo for the ground surface. V, F, and G in Figure 1b are components of radiant heat from the sky, surface objects, and ground surface, respectively, and calculated by the Stefan-Boltzmann law that describes the total energy radiated per unit surface area of an object [37] based on the corresponding temperature. The radiant heat emitted by the sky is calculated based on air temperature, then multiplied by SVF, which results in V. Based on the surface objects’ temperature, the radiant heat emitted from them is calculated. It is then multiplied by 1-SVF for the surface objects to estimate F. G is calculated based on the radiant heat emitted from the ground surface with its temperature.
Conv (Convection) is the movement of thermal energy due to the temperature difference between the body surface and the outside world. It is calculated by the temperature difference between body surface and ambient air divided by the clothing’s and boundary air’s resistance to the flow of energy from one surface to the other. Evap is evaporative heat loss through perspiration and skin diffusion, and TRemit is energy loss due to heat radiation from the human body. Table 1 presents primary input parameters to calculate each of the energy components. More complete model descriptions for COMFA can be found in [30,31,32,34].
2.2. Distributed COMFA (D-COMFA)
The COMFA model was implemented in a spatially-distributed manner with a 1 m horizontal resolution as Distributed-COMFA (D-COMFA) in this study. Table 1 shows which parameters are spatially distributed in the real world at a small scale, such as for the street segments, and which were actually employed in this study in a spatially distributed form. Since Rabs is often the largest contributor to the energy budget in Equation (1) [38], those input parameters that influence the components of Rabs were focused on to implement COMFA in a distributed manner. These input parameters include the surface objects’ temperature, ground temperature, shade, SVF, and albedo for the ground cover and surface object. Other input parameters were assumed to be uniform across the study site.
One of the objectives in developing D-COMFA is to incorporate the analysis results using D-COMFA and/or D-COMFA’s python code into the U.S. Forest Service’s i-Tree tools [39] in the future. i-Tree is a state-of-the-art, peer-reviewed software suite that provides urban forest managers worldwide easy-to-use toolsets to analyze the forest structure and environmental benefits provided by trees. One of the major accomplishments of i-Tree tools is to provide the quantification of trees’ functions and values that otherwise are very hard to understand. Following the same philosophy as i-Tree, D-COMFA was developed to provide users an easy means to estimate human thermal comfort level across an urban area, which allows one to locate relatively comfortable spots in the area.
D-COMFA employed ArcGIS 10.5.1 [40] and Python 2.7.13 [41] to automate the necessary geo-processes such as vector/raster data processing and algebra computations described in the following sections. A human body was represented by a vertical cylinder residing on a cell, and energy components calculated at the ground level of the cell were assumed to be applicable to the entire body of a human. The human body was parameterized with activity that affects M and clothing that affects Conv, Evap, and TRemit. Rabs was determined by adjusting measured direct and diffuse solar radiation by the geographical relationships between each cell and surface objects in the street.
2.2.1. Street Structure
Street polygon data consisting of ground cover of different types (e.g., asphalt roadway, concrete sidewalk, planted median strip, etc.), building footprints with height information, and street trees represented by a vertical cylinder were used.
2.2.2. Sky View Factor (SVF)
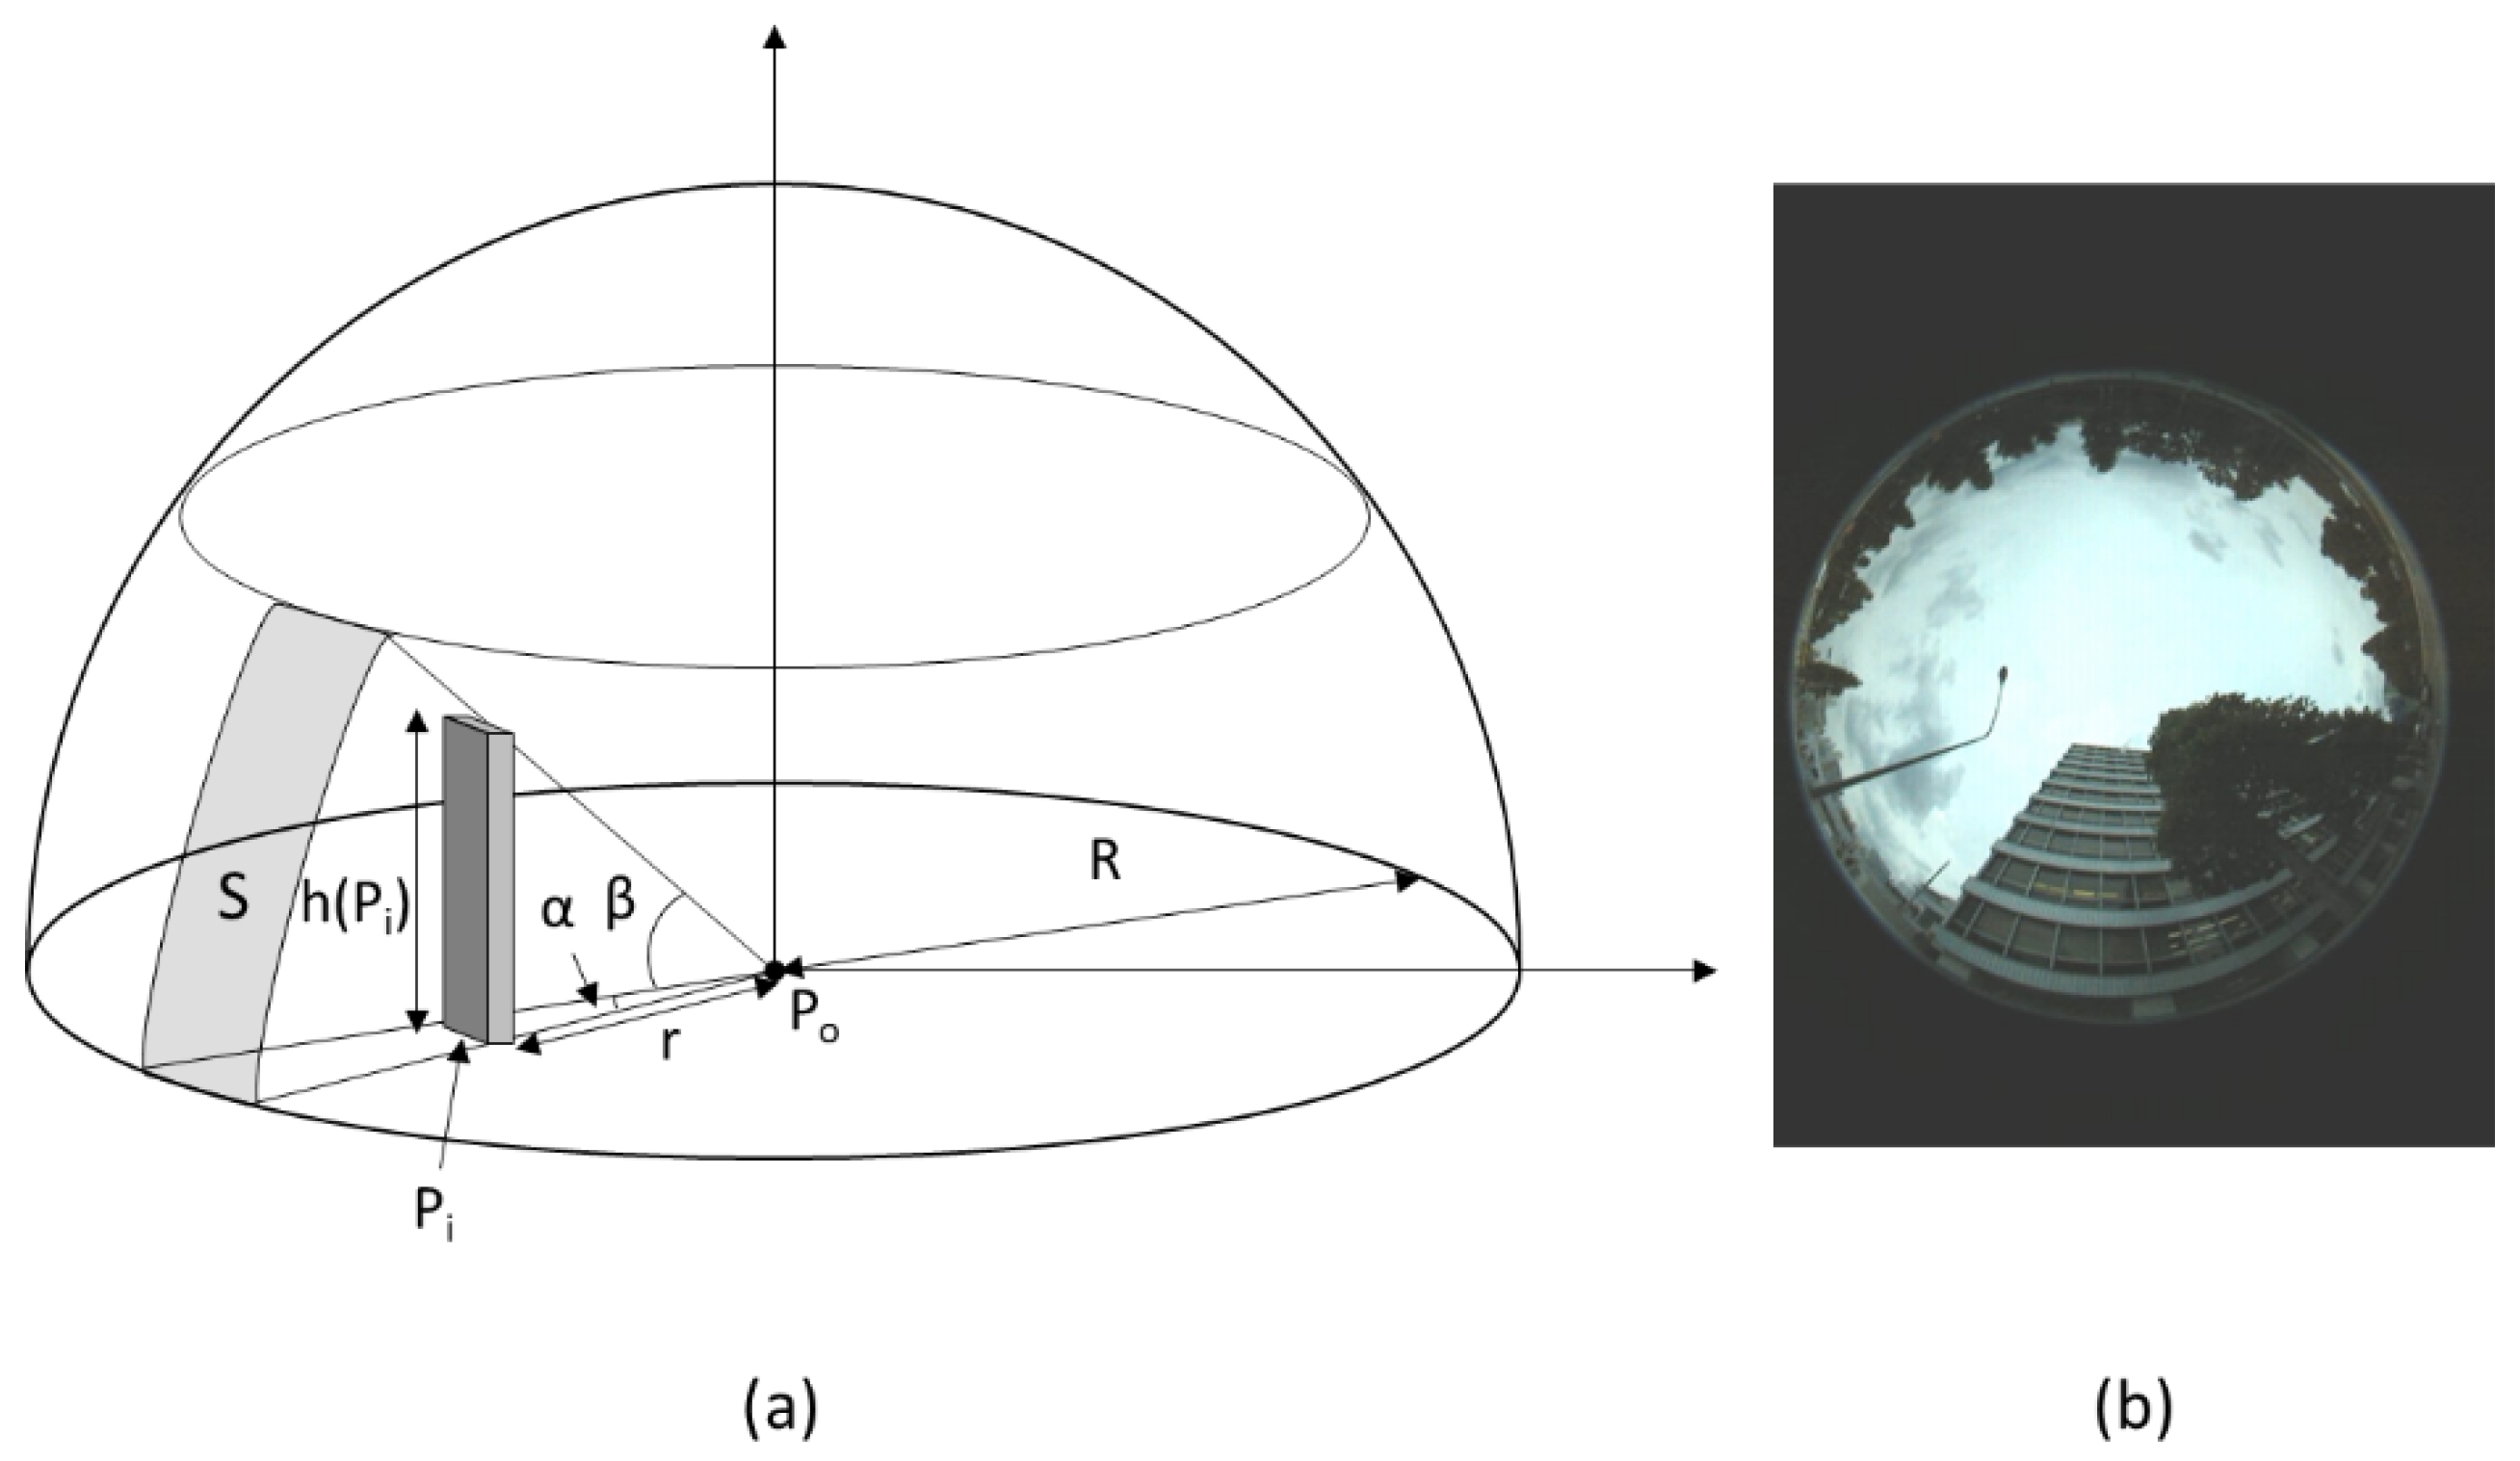
SVF was estimated for one surface object (building or tree) at a time and then merged. For each surface object the algorithm developed by Gál et al. [42] and Chen et al. [43] with a modification to handle overlap by trees and buildings as well as overlap of individual trees and buildings was employed to calculate SVF. The algorithm is illustrated in Figure 2a and involves the following 5 steps: (1) for a cell (Po) a 180° upper hemisphere with radius R centered on Po is virtually constructed; (2) the hemisphere is then divided into equal slices by angle α; (3) when a surface object S is located within a slice, elevation angle, β is determined by tan−1(h(Pi)/r), where Pi is a cell where S is located, h(Pi) is the height of S and r is the distance from Po to Pi; (4) the view factor of S is calculated by VF(S) = (1 − cos2β)·(α/360); and finally (5) SVF can be calculated by summing up the VF(S) for all the slices and subtracting the sum from 1.
VF(S) by trees calculated in step 4 was halved to represent the tree shape. For cells under a tree canopy, r was set to 1 m to avoid division by 0 for the β calculation. This allowed us to calculate SVF and energy components under tree canopies. When overlap of surface objects was found within a slice in step 3, they were handled separately in the steps 4 and 5. An instance of this case is shown in the fisheye photograph in Figure 2b, in which a tree was found in front of a building. In this case, a slice contained a part of the tree and a part of the building. VF(S) calculated for the front tree was subtracted from that calculated for the building behind it in step 4 so that VF(S) values were not double-counted in step 5. The same adjustment was applied when multiple trees and/or buildings were found within a slice.
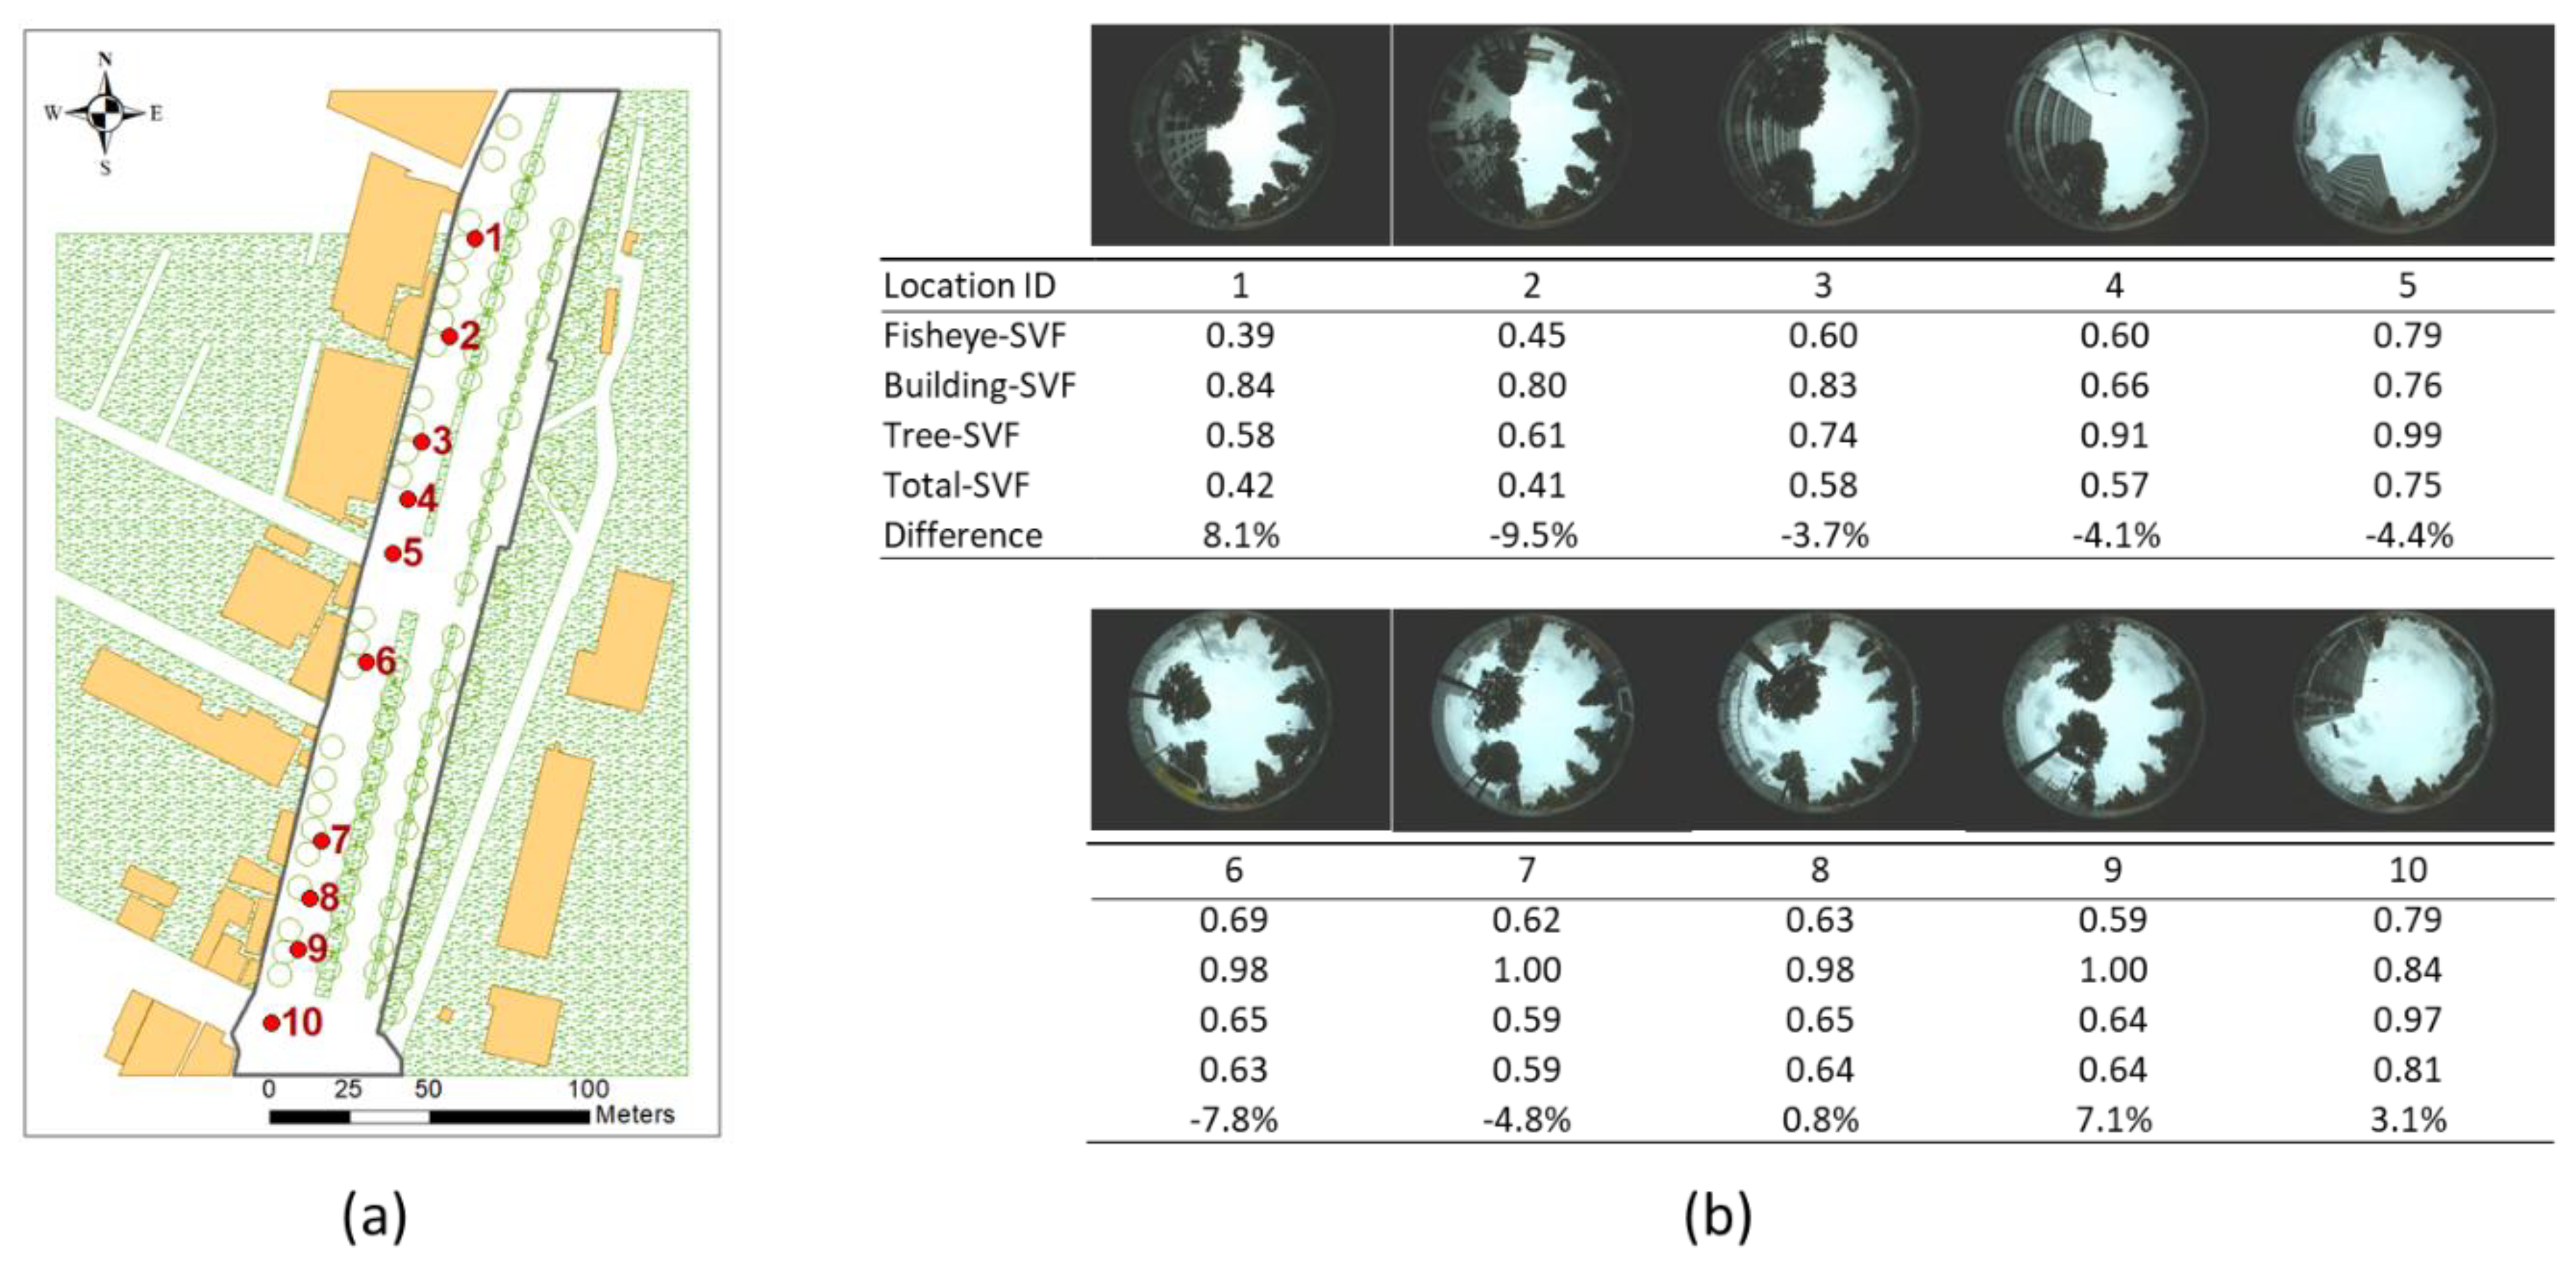
On 2 October 2017, SVF at 10 locations at the study site were measured using a fisheye lens with approximately 183° view angle at a height of 2-m above the ground. These SVFs were used to verify the SVFs estimated by the method mentioned above. The terrain at the study site was assumed to be flat. Based upon visual comparisons of what were captured in fisheye images and the study site’s map, R of 300-m was used for buildings (the same length as the street segment) and R of 20-m was used for trees. An α of 10 degrees was also employed in this study. Similar to the field measurement of SVFs, 2-m of ground height for a Po pixel was employed. For the D-COMFA runs for the energy budget estimation, SVF at 1.1 m above ground level (i.e., the height of Po = 1.1 m), which was recommended to represent the center of gravity for a standing human body [44], was used.
2.2.3. Shade
Shaded areas by buildings and street trees at 1.1 m above ground level, which is a recommended gravimetric center of the human body [44], were determined by ArcMap’s Hillshade function based on solar elevation and azimuth angles at each hour as well as the footprint and height of buildings and trees. Solar elevation and azimuth angles were calculated based on latitude and longitude, time difference between the Coordinated Universal Time (UTC) and local time, and date and time for the study site [45]. For both buildings and trees, shade was estimated for one building or tree at a time and the binary shade raster for each building or tree were then merged. This way, the overlapped shade for surface objects (i.e., under a tree canopy shaded by another tree) could be represented. Theoretically, shade by a tree could be estimated by shade of a vertical cylinder with the canopy diameter, of which the lower half is masked out and replaced by shade from a trunk assumed to be half the height of the tree. However, due to a limitation of the Hillshade function at the 1 m horizontal resolution, trees were represented by a vertical cylinder whose diameter is equal to a canopy width for shade calculations. Transmissivity of direct solar radiation was assumed to be 0 for the buildings, while partial direct solar radiation was assumed to penetrate the trees. A shading factor, the mean of percent light intensity intercepted by foliated deciduous and evergreen tree crowns, of 0.87 [46] was used, which represents a transmissivity of 13% for tree shade.
2.2.4. Albedo
Based on Iqbal [47], albedo for two surface objects was employed: green forest (0.06) and concrete uncolored building (0.35), and albedo for two ground cover types was employed: pavement (0.15) and green grass (0.26).
2.2.5. Temperature Adjustment
Based on hourly air temperature measurements at the nearby weather station, simple adjustments to temperature for the ground and surface structures as well as air temperature under tree canopy was performed, depending on ground cover, sunlit/shaded conditions and albedos. Hourly temperature for the sunlit and shaded paved areas and sunlit grass area were set to 50%, 10%, and 20% higher than hourly air temperature, respectively [48], while for shaded grass areas was assumed to be the same as hourly air temperature. The hourly temperature for the sunlit concreate wall of buildings was set to 20% higher than hourly air temperature based on the three factors: (1) the ratio of albedo between uncolored concreate building wall (0.35) and paved road (0.15); (2) 50% addition to air temperature for sunlit paved area; and (3) solar energy absorption by paved ground vs. buildings, both of which were determined based on the orientation of the objects relative to the sun. Due to evapotranspiration by trees and advection of cooler air, air temperature near the trees may be lower than other areas. Air temperature under tree canopy was assumed to be 6% lower than the weather station air temperature [49], while no adjustment was performed for advection.
2.3. Study Site
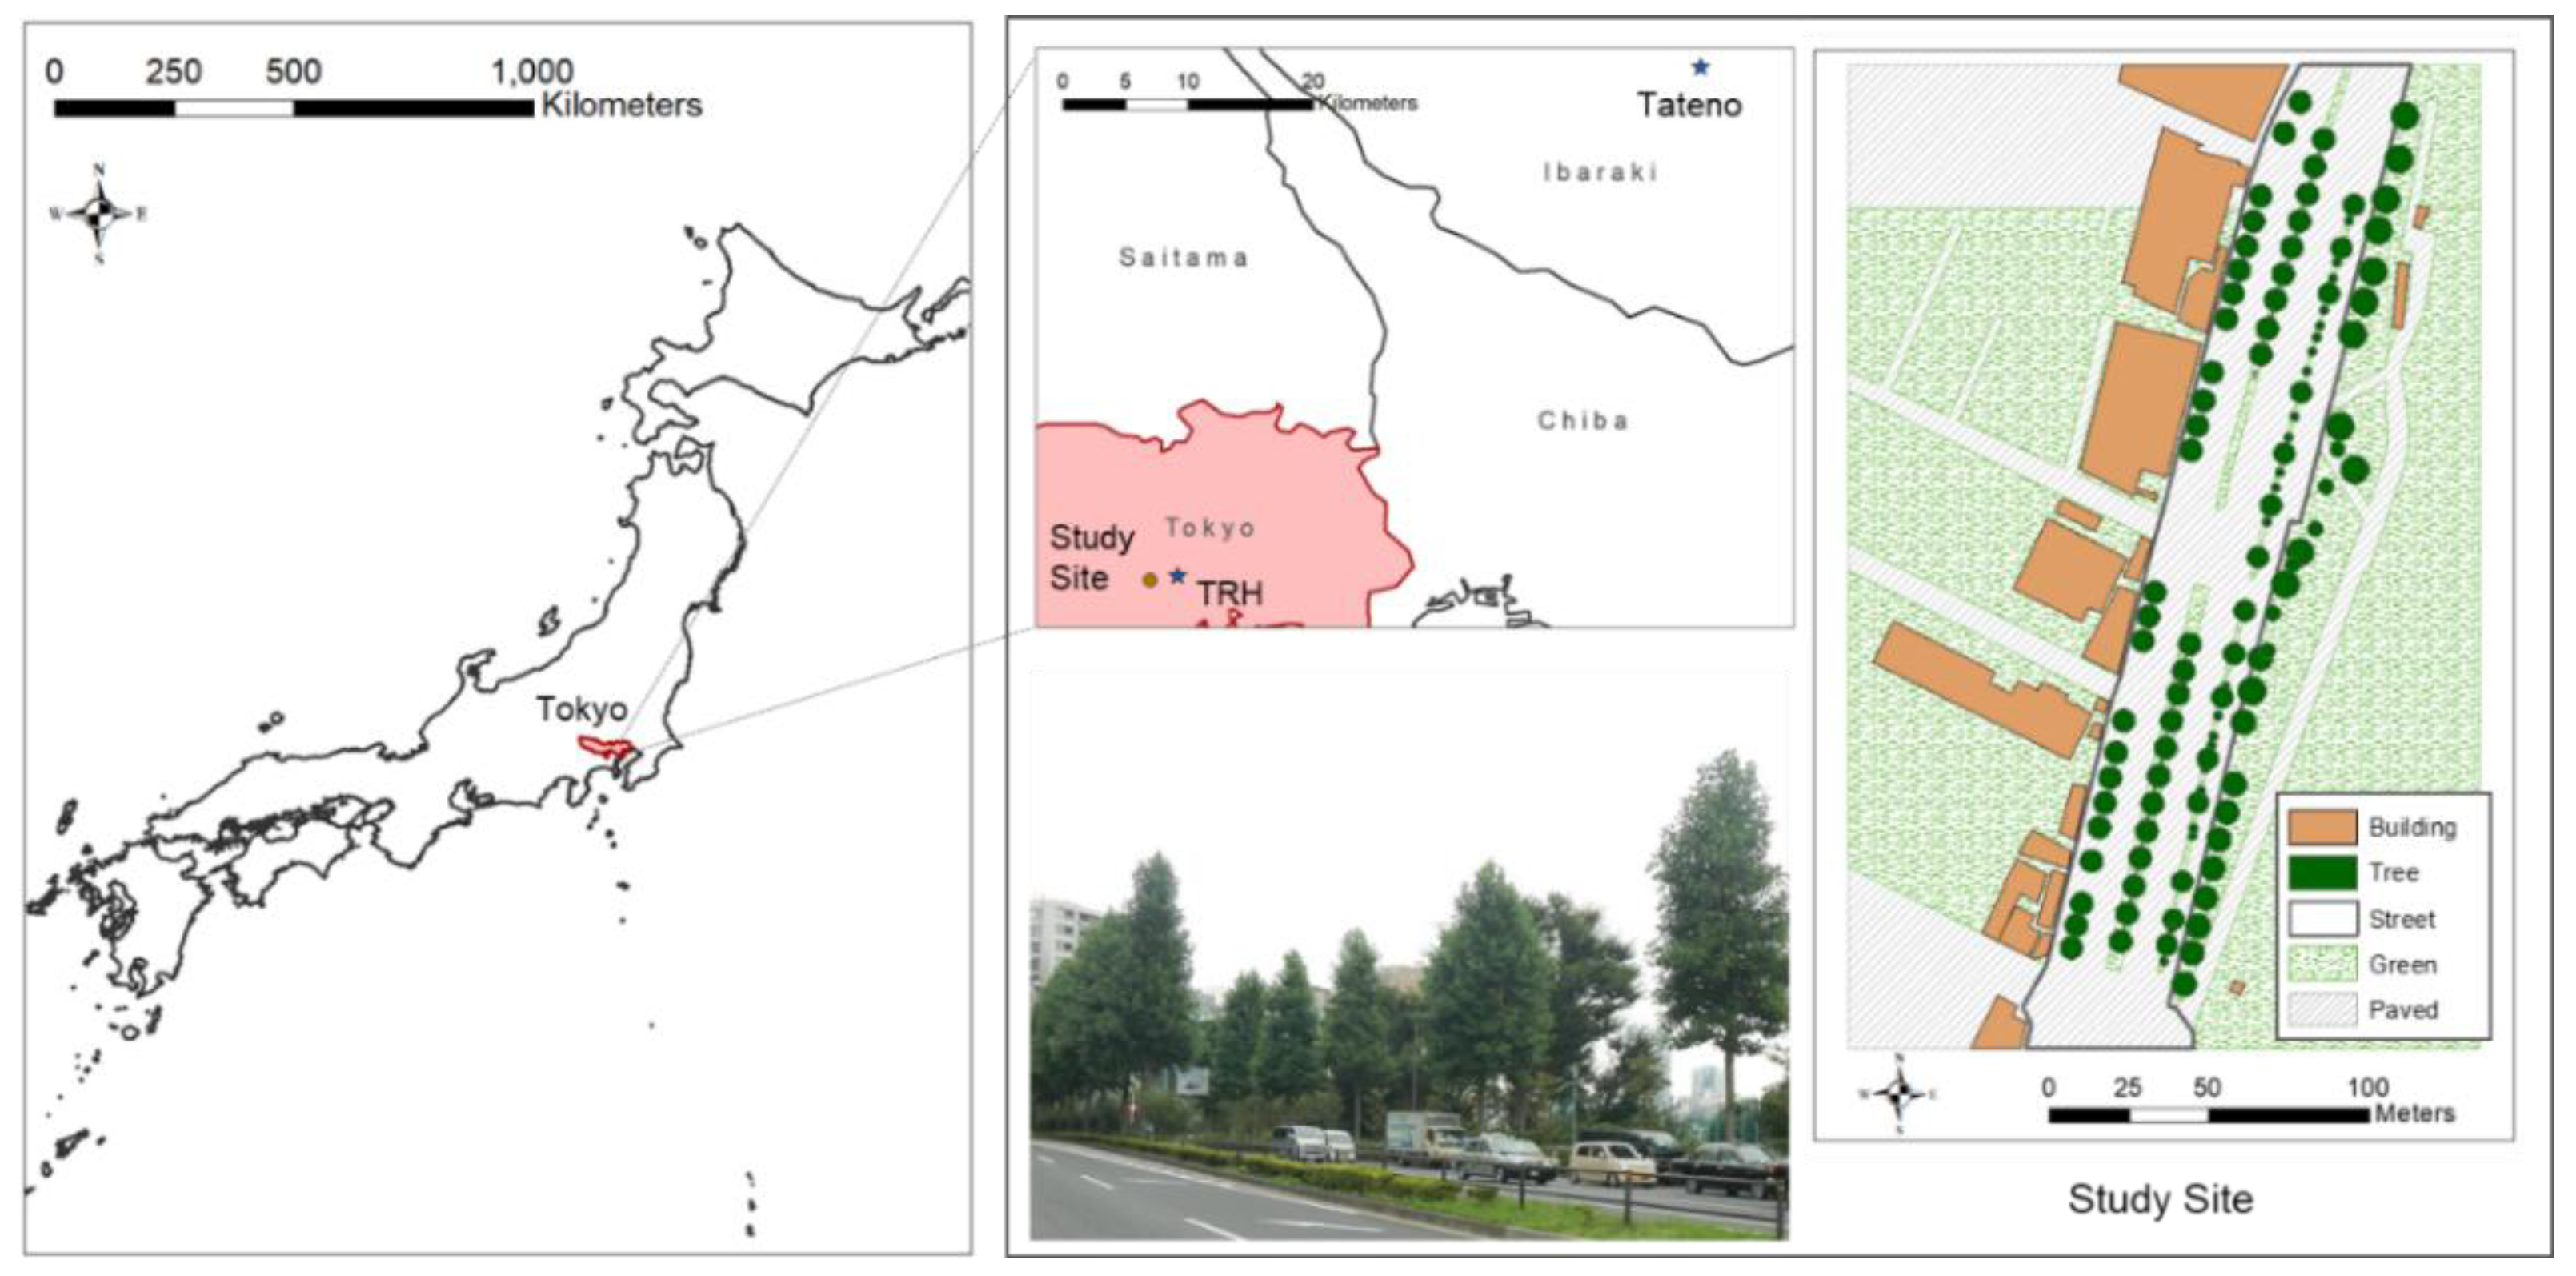
A case study was conducted for a street segment extending ~300 m from North to South along the marathon course in Tokyo (Figure 3). The eastern side of the study site is covered by grass with Keyaki—Japanese zelkova (Zelkova serrata) of 8.0 or 10.0 m height and 8.0 or 9.0 m canopy width and Yamamomo—Japanese bayberry (Myrica rubra) trees of 5.0 m height and 5.0 m width. The site has a total of 60 Yurinoki—tulip tree (Liriodendron tulipifera) with height of 14.5 or 15.0 m and canopy width of 7.0 or 7.4 m on the both sides and on a median strip covered with grass (Figure 3), and 40 Tokiwamansaku—Chinese fringe-flower (Loropetalum chinense) with 2.0 m height and 1.0 m canopy width planted on the median strip, as well as 23 Hanamizuki—flowering dogwood (Cornus florida) with 4.0 m height and 3.0 m canopy width on the eastern side of the street. Large trees also stand on the green area on the eastern side of the street. The tree height and canopy width set to each tree species were determined based on a subset of trees measured and averaged within the site. One- to eleven-story residential and commercial buildings are found on the western side of the street. Assuming one story of the building has 3 m height, the number of the stories was converted to a building height value.
Using D-COMFA, hourly EB including each energy component in Equation (1) were estimated on a 1 m cell basis for 9 August 2016 (the hottest day of the year) from 7 a.m. to 6 p.m. was assumed that the estimated EB is for a spectator wearing a T-shirt, regular walking shorts, socks, and shoes that represent clothing resistance, Rco = 77 (s m−1) [31] that is equal to 0.41 clo (1 clo = 186.6 sm−1) [33] and clothing permeability, P = 175 (l m2 s−1) [30] and standing (metabolic rate = 120 W m−2) [30] on each cell.
Hourly air temperature, pressure, relative humidity, and wind speed measured at a weather station located at the Japan Meteorological Agency (JMA)’s Tokyo Regional Headquarters (TRH) (Figure 3) for 9 August 2016 were employed [50]. In Japan, direct and diffuse solar radiation are measured hourly by JMA at five locations: two at remote islands in the Pacific Ocean and one at each of three major islands, Hokkaido, Kyushu, and Honshu. In Honshu where Tokyo is located, direct and diffuse solar radiation measurements are only available at Tateno weather station [51] that is about 53 km from TRH (Figure 3). The hourly direct and diffuse solar radiation measurements at Tateno were employed for this study, assuming solar radiation measured at Tateno could represent those at TRH when the sky cover at both sites were similar. From 7 a.m. through 6 p.m. on August 9, 2016, sky covers at both sites were almost identical (scattered or broken clouds in the morning and clear sky in the afternoon) except for 11 a.m. and noon (Table 2). As shown in Table 1, these weather data were assumed to be uniform across the study site.
3. Results and Discussions
3.1. SVF Effects
Comparisons between the field measurements and the estimated SVFs by D-COMFA are presented in Figure 4. Figure 4a indicates the 10 locations where the SVF captured by a digital video camera with a fisheye lens, while Figure 4b presents the digital images along with a table containing the measured and estimated SVFs. SVFs estimated with D-COMFA includes building- and tree-SVF, and total-SVF is the final value of SVF due to both buildings and trees. The difference between the fisheye lens values and estimated values were less than ±10%. These differences may be attributed to differences between modeled and actual dimensions of trees and buildings. Trees’ height and canopy width were set based on measurements for a subset of each species in the study area. Number of stories for the buildings were converted assuming that one story is equivalent to 3 m. As these results were generally satisfactory, the energy budget and other energy components estimated by D-COMFA based on these estimated SVF were presented in the following sections.
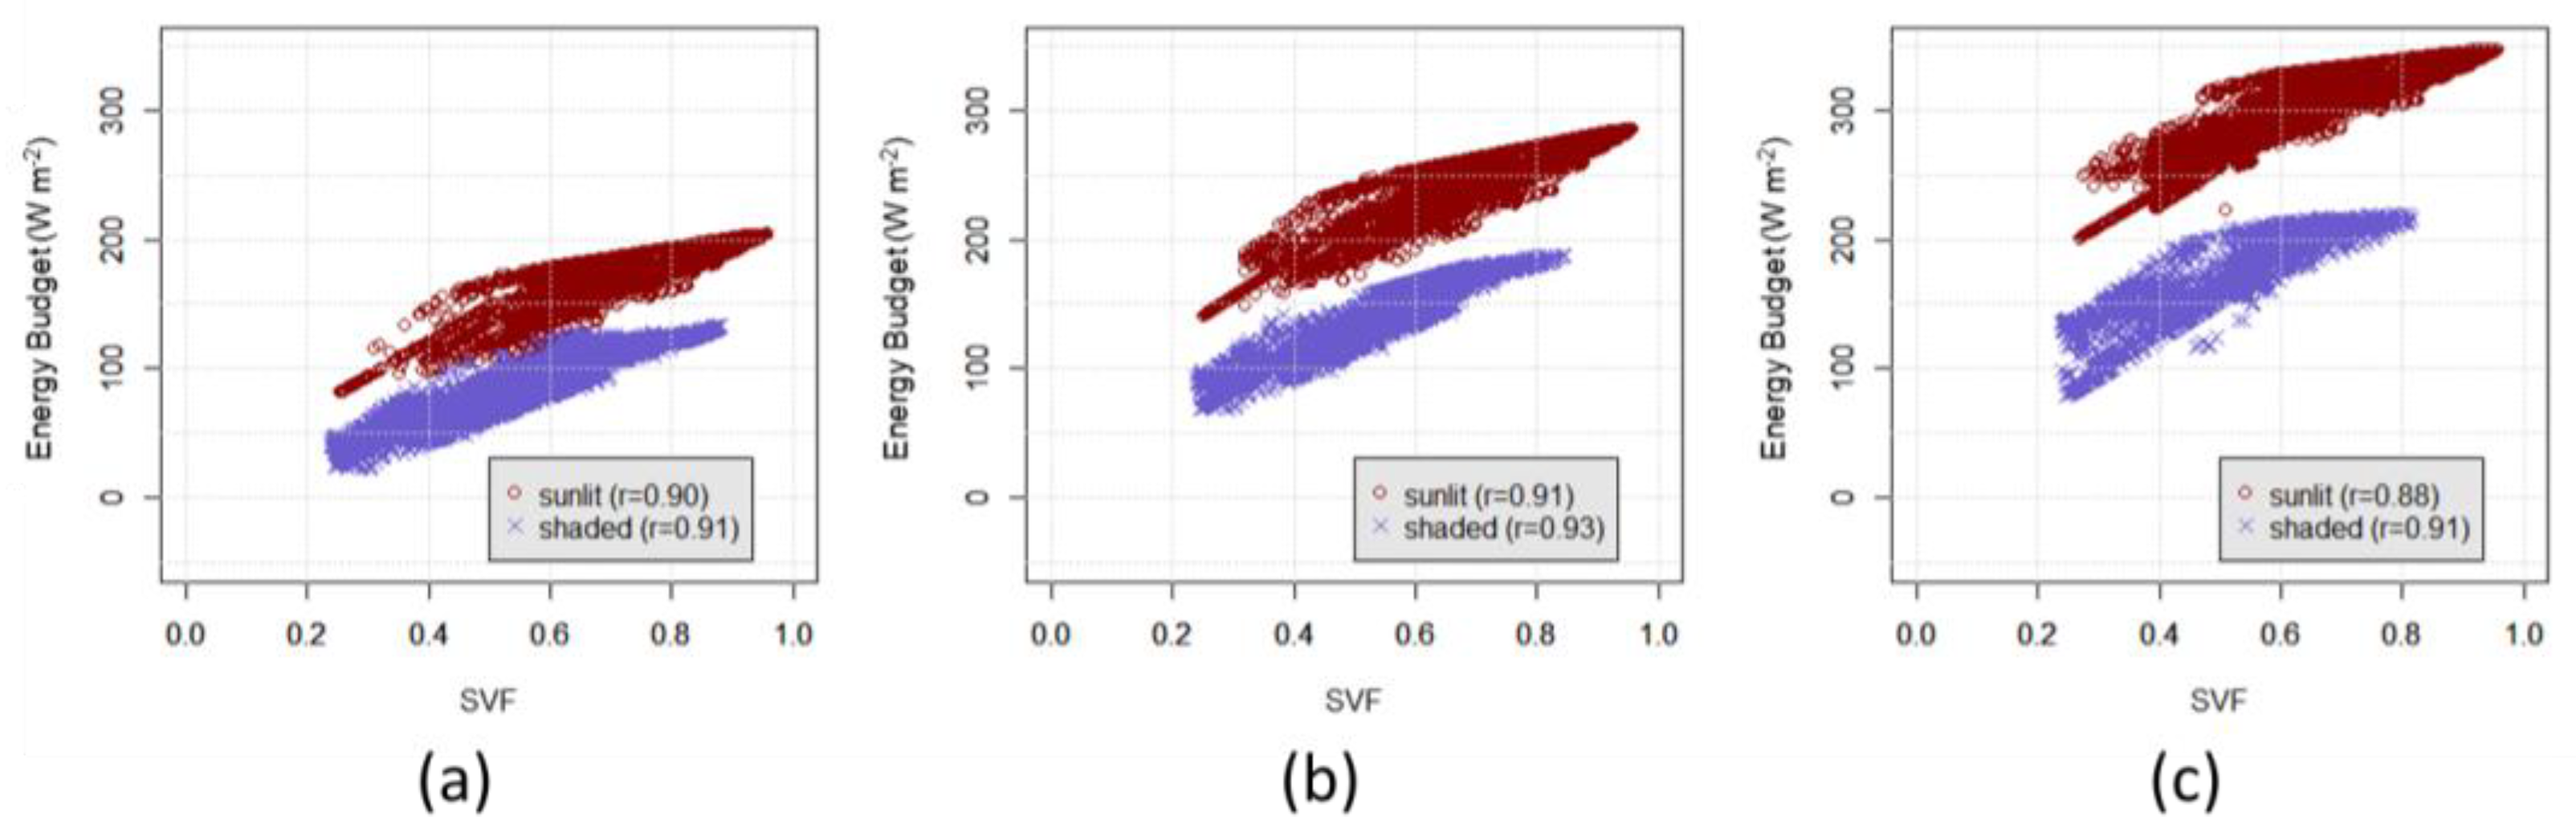
Figure 5 presents EB for each street cell as a function of shade and SVF for three different hours: 7 a.m., 9 a.m. and 1 p.m. EB was positively correlated with SVF for both sunlit and shaded cells (Pearson correlation coefficient r is equal to ~0.9 for all cases). Across these hours air temperature increased from 27.7 to 33.5 to 37.3 °C, while global solar radiation increased from 321 to 459 to 783 W m−2. Again, EB was positively correlated with air temperature and solar radiation. These results agreed well with the literature [8,11].
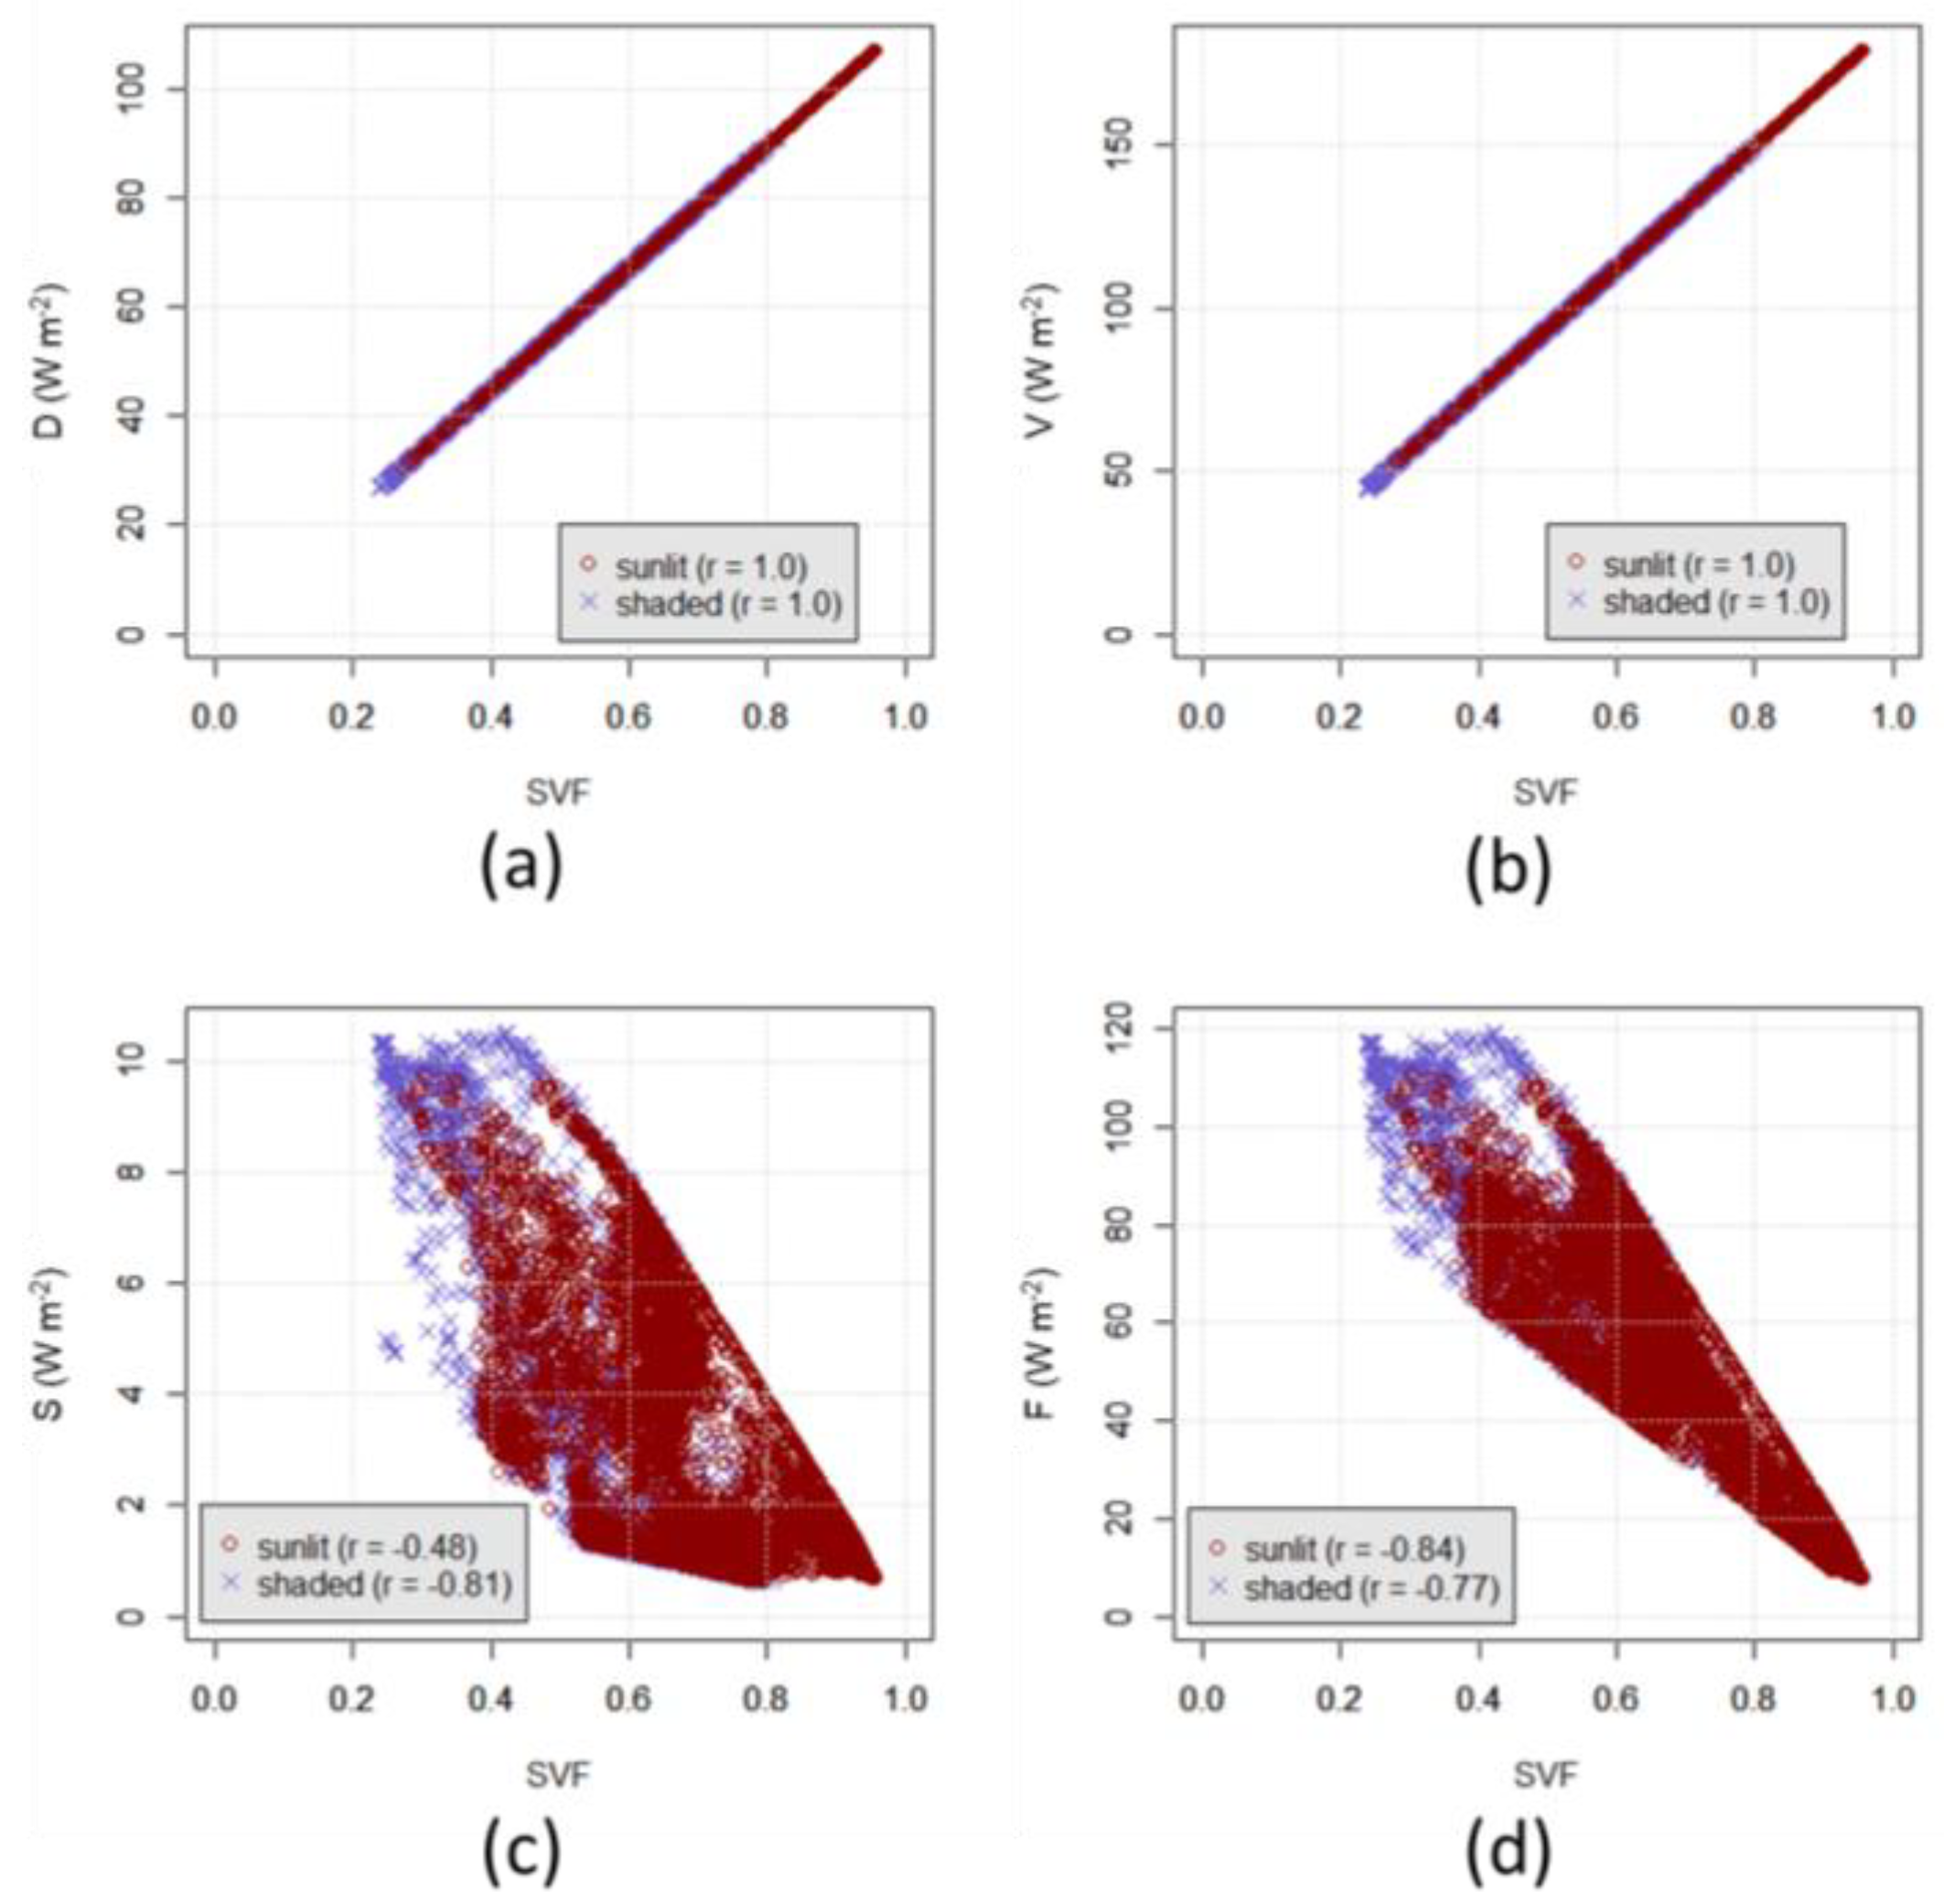
Smaller SVF generally contributed to smaller Rabs, leading to smaller EB; however, there was a trade-off between each radiant energy component. Figure 6 presents D, V, S, and F for each street cell at 1 p.m. as a function of SVF. As can be seen in these figures, D and V, which depend on the openness of the sky, were perfectly positively correlated to SVF (r = 1.0). Conversely, S and F, which depend on the closure of the sky, were negatively correlated with SVF (r = −0.48 to −0.84). Therefore, when SVF decreased, D and V also decreased, whereas S and F increased. When the magnitude of decreasing and increasing effects were compared, the magnitude of decreasing effects was greater (i.e., D decreased from 107 to 27 and V from 180 to 45 as SVF decreased from 1 to 0.2 in Figure 6a,b, while S and F increased from 0.6 to 10 and 8 to 120, respectively in Figure 6c,d). Thus, the smaller SVF is advantageous for a better thermal environment. In urban planning, it is crucial to minimize SVF to realize a better thermal environment by carefully planning building heights and corridor widths [10].
3.2. Shade Effects
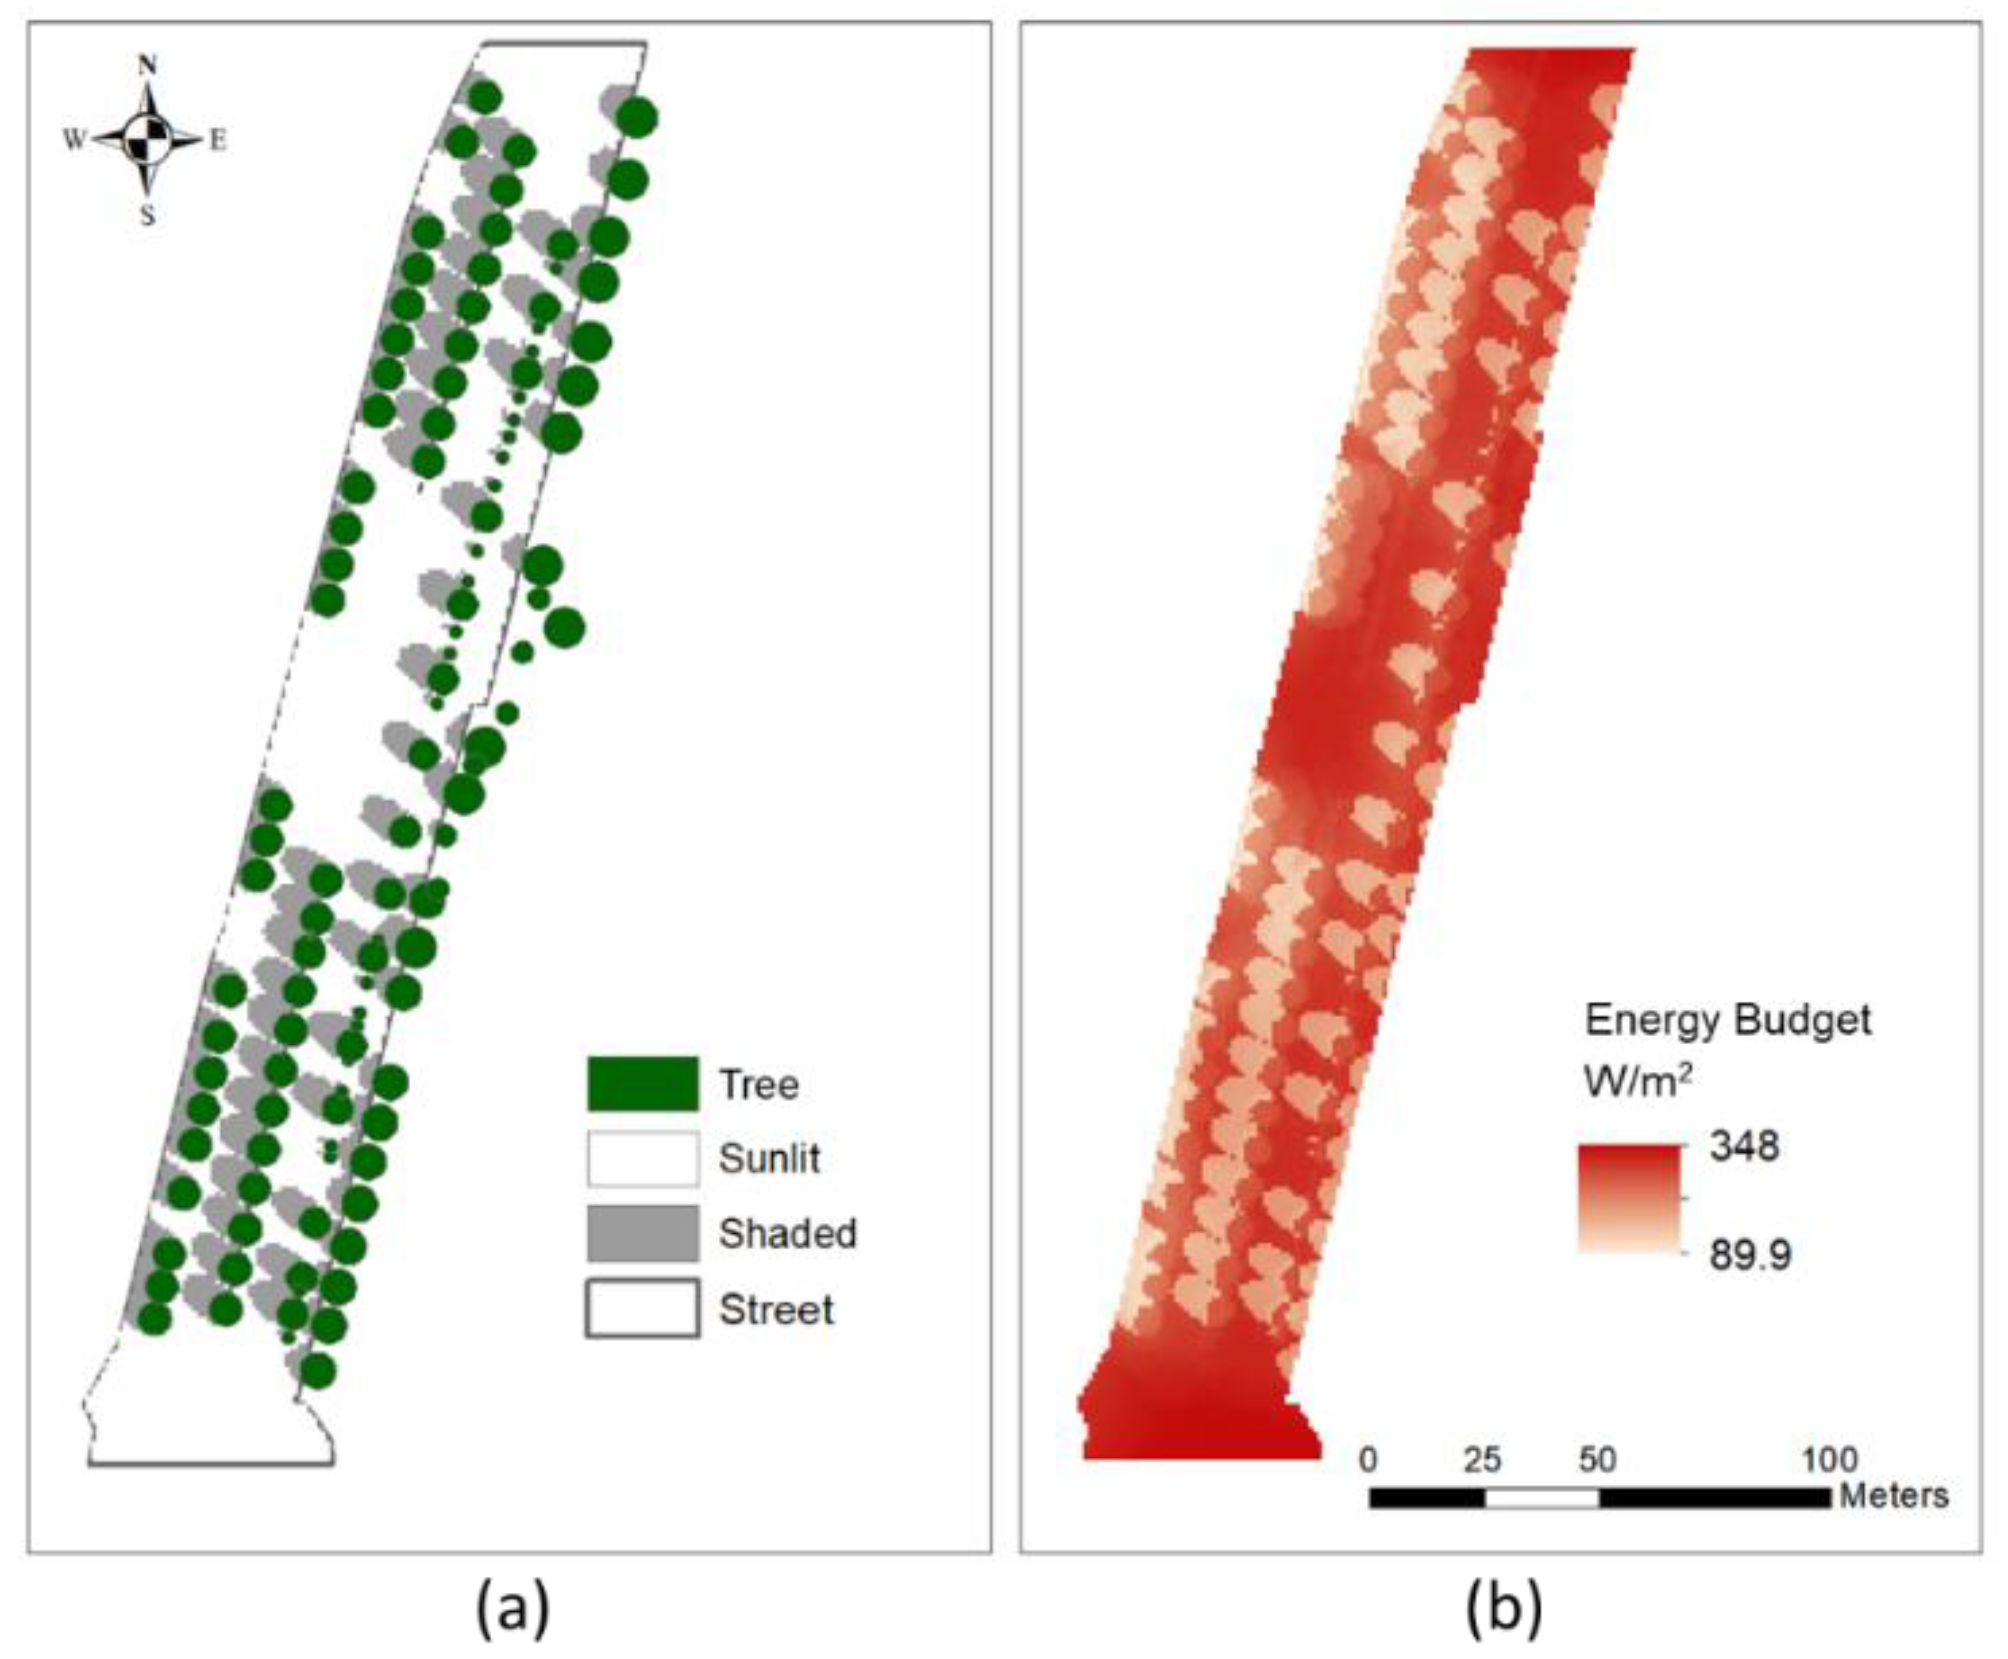
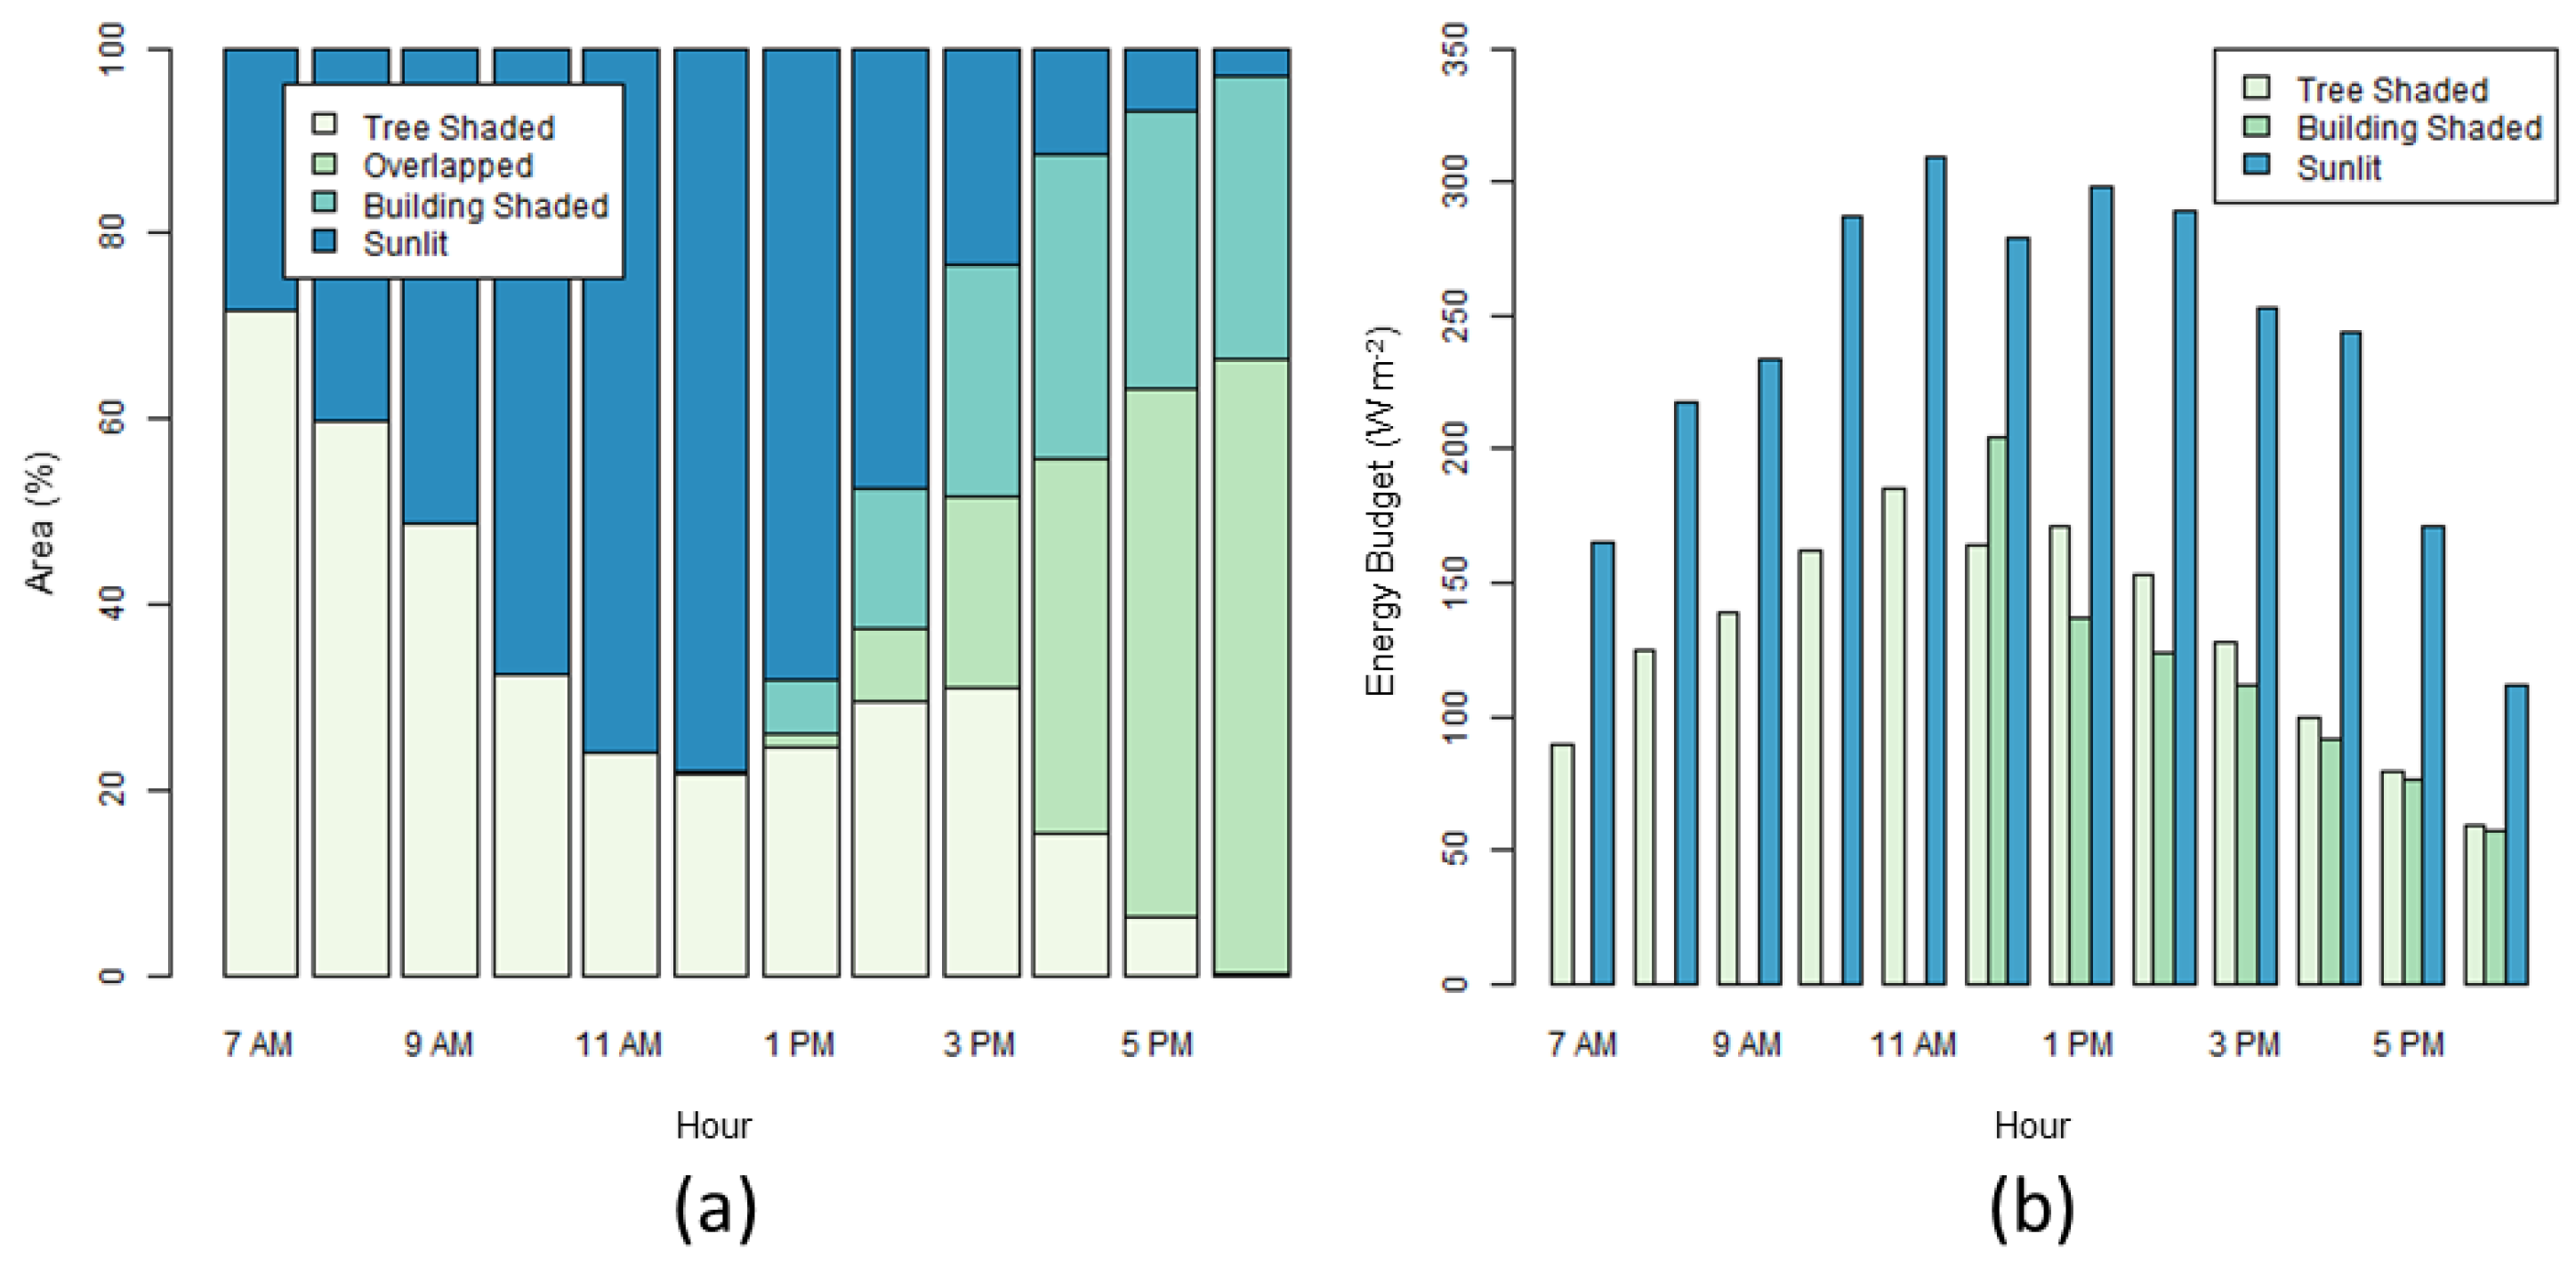
Figure 7 presents the shaded areas and EB estimated for 10 a.m. on the study site. This hour of the day was chosen since a relatively large area was shaded due to solar elevation angle and thus it could better represent the effects of shade on the thermal environment. In addition, it may represent the actual thermal environment for the marathon race starting in the morning, in which the ground and building walls have been exposed to sun light for a couple of hours to accumulate solar heat. Figure 8 presents sunlit-shaded fractions on the street and mean EB for sunlit, building-shaded and tree-shaded areas across the hours. In general, EB tended to be smaller for the areas shaded by buildings or trees across the hours. In Figure 7, because of the solar azimuth angle at 10 a.m. as well as the spatial relationship between structures and the street, shade on the street was created by only trees (Figure 8a), and EB ranged from 89.9 to 348 (W m−2) (Figure 7b).
There are two cases when the area right under a tree can be shaded: (1) shaded by the tree itself when solar elevation angle is close to 90°; and (2) shaded by other trees depending on alignment of street trees relative to solar azimuth angle and proximity of the tree to other trees. In Figure 7b, the solar elevation angle is 59° at 10 a.m., and thus case (1) didn’t apply. As shown in Figure 7a, since the tree alignment and solar azimuth angle were almost perpendicular, the area under trees were mostly not shaded by other trees. Because of these facts, EB was relatively high under the trees even though SVFs tended to be low (i.e., 0.23 to 0.63).
As shown in Figure 8a, 20% (12 p.m.) to 98% (6 p.m.) of the street was shaded on the study site. All shade was created by trees from 7 a.m. through 11 a.m., resulting in 40% (11 a.m.) to 46% (7 a.m.) reduction in average EB for shaded areas compared to sunlit areas (Figure 8b). After 12 p.m., shade was created by both buildings and trees, and there were some overlaps of building-shaded and tree-shaded areas (Figure 8a). During this period, the average EB for building- and tree-shaded areas were 26% (12 p.m. for building-shaded areas) to 62% (4 p.m. for building-shaded areas) smaller than sunlit areas. Please note that solar radiation at 11 a.m. may have been overestimated, since sky cover in Tateno was clearer than that in TRH, resulted in possibly overestimated EB. Similarly, since sky cover in TRH was clearer than that in Tateno solar radiation at 12 p.m. may have been underestimated, which may have led to underestimated EB.
To further investigate the effect of trees and buildings on the average EB and each energy component, mean for each component as well as SVF for sunlit, building-shaded, and tree-shaded areas on the street were extracted. To isolate the effect, cells where building- and tree-shade overlap were excluded here. Table 3 presents the results at 1 p.m. when mean EB peaked in the afternoon. Mean EB for sunlit areas was 299 (W m−2), much greater than building- and tree-shaded areas. This is mostly because absorbed radiation from the sky (T, D, V) and the ground (R, G) were higher for sunlit areas. T was greatest for the sunlit areas. D and V were higher for the sunlit areas as they were generally apart from buildings and trees, and thus SVF tended to be greater. G was greatest for the sunlit paved areas due to heat accumulation, while R was the greatest for sunlit grass-covered areas as it has a higher albedo (0.26) than paved covers (0.15).
At 1 p.m., 5.9% and 22.5% of the street was shaded by buildings and trees, respectively. On average, EB for building-shaded areas was 137 (W m−2), while for tree-shaded areas was 175 (W m−2). Mean SVF was smaller for buildings due to the greater height of buildings than trees, which affected D, V, S, and F components. D and V were greater for tree-shaded areas due to more openness of the sky. On the other hand, S and F were greater for building-shaded areas because of the proximity of the areas to buildings and higher albedo of buildings (0.35) than trees (0.06). Higher wall temperatures of buildings also contributed to higher F for building-shaded areas. To reduce S and F, reducing the albedo and the resulting temperature reduction on the building wall can be considered effective. One solution for this would be to install a green wall on the buildings.
T and R were both 0 throughout the building-shaded areas since these components were calculated based on transmissivity of direct solar radiation that was set 0 for buildings. By contract, transmissivity for trees was set to 0.13, meaning 13% of direct solar radiation can be transmitted through the tree canopy, resulted in non-zero T and R for tree-shaded areas.
3.3. Temperature Effects
Because of ground and air temperature adjustments, some minor differences were observed in some of the energy components. Figure 9 presents some examples at 1 p.m. Slight reduction in air temperature under tree canopy resulted in a very minor difference in M (Figure 9a) and TRemit (Figure 9d). Also, under canopy temperature affected Conv (Figure 9b) and Evap (Figure 9c), in which only under canopy had positive values, reducing EB. Other areas, on the other hand, had negative values because of an air temperature of 37.3 °C that was higher than typical human body temperature, resulting in increased EB. Ground temperature was adjusted based on shade and ground cover, and this produced relatively large differences in G (Figure 9e) between sunlit and shaded cells. Shaded grass cover, shaded paved cover, sunlit grass cover, and sunlit paved cover, in this order, had a smaller G.
3.4. Limitations and Advantages of the Modeling System
In spatially distributed models it is ideal to have all input parameters in a distributed form, though data limitations often exist due to a lack of or difficulty for measurements [52]. In that case, model developers typically focus on input parameters that have greater impacts on the model outputs [53]. As a result, only influential parameters are prepared in a distributed form, and the others remain in a lumped form. This common strategy was applied to the development of D-COMFA. COMFA requires a variety of input parameters to run; among these input parameters shade and SVF were fully distributed in D-COMFA, while the temperature and albedo for ground cover and surface objects were very coarsely distributed. Although air temperature and solar radiation were found to be positively correlated, and wind speed negatively correlated, with the human thermal comfort level in literature [8,11] these parameters employed in D-COMFA were measured at the nearest weather station, which didn’t fully represent their spatial variations at the study site.
One of the future directions for D-COMFA enhancement includes incorporating these influential input parameters in a fully distributed manner, which may improve the accuracy of D-COMFA in predicting thermal environments for humans. For instance, spatial variations in air temperature may be obtained from remotely sensed images [54], citizen science projects [55], and/or relationships between air and surface temperatures [56]. Spatial variations in wind speed may be estimated by addressing density of the surface structures in the upwind direction [57]. Furthermore, incorporating spatial variations in relative humidity into D-COMFA may be advantageous to better address areas where evapotranspiration by trees occur or misting stations are constructed. The SVF estimation may also be improved by employing more sophisticated techniques [58] and/or another approach using readily available street panoramic photographs [59].
Another drawback for this study is that the results were not validated with measurements or ground truth except for SVF. Therefore, analyses in this study should be treated as an approximation rather than an accurate estimation of actual processes. One future research direction is to validate the output from D-COMFA with measurements to improve the modeling ability of D-COMFA. Field measurements of SVF, air and surface temperatures as well as radiation could allow us to compare D-COMFA’s estimates of energy components to field measurements and to calibrate D-COMFA. Such field measurements at several street segments along the 2020 Tokyo Olympic marathon route are planned in the summer of 2018 by our study group.
Despite the limitations, there are various advantages to the D-COMFA modeling framework. As D-COMFA only requires commonly available data such as weather data from the nearest station, it is readily available for urban managers, not only in Tokyo but also other cities. As a modeling framework, the adjustment of some input parameters could be easily implemented based on local studies by just modifying the Python code. It also provides a very useful and easy-to-use tool to quantify and visualize the relative effects of urban structures and trees on mitigating heat stress on humans. Based on the results, one may be able to formulate a baseline for proactive measures against the urban heat island. Future analyses will explore the tradeoffs between model complexity and ease of use, and many simplifications made in this prototype model will be evaluated. The goal is to develop a model that could be used by urban planners and managers with limited computational literacy.
4. Conclusions
In this study, a prototype of a distributed version of COMFA (D-COMFA) was developed and the effects of roadside structures including street trees and buildings on the thermal environment of spectators along the 2020 Tokyo Olympic marathon route were analyzed using this tool. The energy budget of a human body, which determines the thermal sensation of humans, was estimated for 1 m grid cells along the 300 m street segment using weather data measured at the nearest station on 9 August 2016.
The energy budget was positively related with sky view factor, air temperature, and solar radiation. Thermal comfort level was greatly improved under shade from buildings and trees. As considered by TMG [18], to grow the canopy size of existing street trees would improve the thermal comfort along the marathon course and help reduce the heat stress of spectators. Installing vegetation on building walls (green walls) would also help reduce reflection and heat radiation from building walls and eventually improve thermal comfort even at the locations close to buildings.
With the establishment of this method, it is possible to take specific measures for green enrichment in cities where urgent work is needed to take measures against urban heat, and it is expected to reduce the health damage of spectators for outdoor competitions at the 2020 Tokyo Olympic Games.
Author Contributions
S.H. developed D-COMFA; S.H. designed the experiments; S.H. performed D-COMFA simulations; S.H. and T.A. analyzed the results; S.H. wrote the paper; T.A., F.I. and C.M. contributed materials. All authors contributed to the interpretation of the results.
Acknowledgments
The authors would like to express their sincere thanks to Jennifer Vanos for providing them updated calculations from the COMFA model, and Chuck Kroll for his thorough review of English writings.
Conflicts of Interest
The authors declare no conflict of interest.
References
- Olimpismo. Olympic Movement’s Agenda 21. In Sport for Sustainable Development; IOC: Lausanne, Switzerland, 1999; p. 50. [Google Scholar]
- IOC Commission for Sport and Environment. Sustainability Through Sport; IOC: Lausanne, Switzerland, 2012. [Google Scholar]
- Ruiz, A.; Inef, L.; Prat, J.A. Climatic Heat Stress Studies at the Barcelona Olympic Games, 1992. Sports Med. Train. Rehabil. 1995, 6, 167–192. [Google Scholar]
- Martin, D.E. Climatic Heat Stress Studies at the Atlanta 1996 Olympic Stadium Venue, 1992–1995. Sports Med. Train. Rehabil. 1996, 6, 249–267. [Google Scholar] [CrossRef]
- Peiser, B.; Reilly, T. Environmental Factors in the Summer Olympics in Historical Perspective. J. Sports Sci. 2004, 22, 981–1001. [Google Scholar] [CrossRef] [PubMed]
- Kottek, M.; Grieser, J.; Beck, C.; Rudolf, B.; Rubel, F. World Map of the Köppen-Geiger Climate Classification Updated. Meteorol. Z. 2006, 15, 259–263. [Google Scholar] [CrossRef]
- Cheng, V.; Ng, E. Thermal Comfort in Urban Open Spaces for Hong Kong. Archit. Sci. Rev. 2006, 49, 236–242. [Google Scholar] [CrossRef]
- Ng, E.; Cheng, V. Urban Human Thermal Comfort in Hot and Humid Hong Kong. Energy Build. 2012, 55, 51–65. [Google Scholar] [CrossRef]
- Hwang, R.L.; Lin, T.P.; Cheng, M.J.; Lo, J.H. Adaptive Comfort Model for Tree-Shaded Outdoors in Taiwan. Build. Environ. 2010, 45, 1873–1879. [Google Scholar] [CrossRef]
- Hien, W.N.; Kardinal Jusuf, S.; Samsudin, R.; Eliza, A.; Ignatius, M. A Climatic Responsive Urban Planning Model for High Density City: Singapore’s Commercial District. Int. J. Sustain. Build. Technol. Urban Dev. 2011, 2, 323–330. [Google Scholar] [CrossRef]
- Yang, W.; Wong, N.H.; Jusuf, S.K. Thermal Comfort in Outdoor Urban Spaces in Singapore. Build. Environ. 2013, 59, 426–435. [Google Scholar] [CrossRef]
- Givoni, B.; Noguchi, M.; Saaroni, H.; Pochter, O.; Yaacov, Y.; Feller, N.; Becker, S. Outdoor Comfort Research Issues. Energy Build. 2003, 35, 77–86. [Google Scholar] [CrossRef]
- Givoni, B.; Noguchi, M. Outdoor Comfort Responses of Japanese Persons. In Proceedings of the 21th Conference Passive Low Energy Architecture, Eindhoven, The Netherlands, 19–22 September 2004. [Google Scholar]
- Thorsson, S.; Honjo, T.; Lindberg, F.; Eliasson, I.; Lim, E.M. Thermal Comfort and Outdoor Activity in Japanese Urban Public Places. Environ. Behav. 2007, 39, 660–684. [Google Scholar] [CrossRef]
- Ministry of the Environment. Promotion Method of Effective Heat Island Measures. Available online: https://www.env.go.jp/air/life/heat_island/guideline/h24/chpt2.pdf (accessed on 1 March 2018). (In Japanese)
- Tokyo Metropolitan Government (TMG) Bureau of the Environment. Verification of the Introduction of Fine Mist to the Metropolitan Bus Stop. Available online: http://www.kankyo.metro.tokyo.jp/climate/other/06-3busstop_mist.pdf (accessed on 1 March 2018). (In Japanese).
- Tokyo Metropolitan Government (TMG) Bureau of the Environment. Improvement of Pavement with Road Surface Temperature Rise Suppression Function. Available online: http://www.kankyo.metro.tokyo.jp/climate/other/03-1kensetsu_shiryo.pdf (accessed on 1 March 2018). (In Japanese).
- Tokyo Metropolitan Government (TMG) Bureau of the Environment. Measures Against Summer Heat by Enlarging the Canopy of Street Trees. Available online: http://www.kankyo.metro.tokyo.jp/climate/other/03-2kensetsu_shiryo.pdf (accessed on 1 May 2018). (In Japanese).
- Coutts, A.M.; White, E.C.; Tapper, N.J.; Beringer, J.; Livesley, S.J. Temperature and Human Thermal Comfort Effects of Street Trees across Three Contrasting Street Canyon Environments. Theor. Appl. Climatol. 2016, 126, 815. [Google Scholar] [CrossRef]
- Ng, E.; Chen, L.; Wang, Y.; Yuan, C. A Study on the Cooling Effects of Greening in a High-Density City: An Experience from Hong Kong. Build. Environ. 2012, 47, 256–271. [Google Scholar] [CrossRef]
- Sugawara, H.; Shimizu, S.; Takahashi, H.; Hagiwara, S.; Narita, K.; Mikami, T.; Hirano, T. Thermal Influence of a Large Green Space on a Hot Urban Environment. J. Environ. Qual. 2016, 45, 125. [Google Scholar] [CrossRef] [PubMed]
- ENVI-Met. Available online: http://www.envi-met.com/ (accessed on 25 April 2018).
- Huttner, S.; Bruse, M.; Dostal, P. Using ENVI-Met to Simulate the Impact of Global Warming on the Mi-Croclimate in Central European Cities. In Proceedings of the 5th Japanese-German Meeting on Urban Climatology, Freiburg im Breisgau, Germany, 6–8 October 2008. [Google Scholar]
- Morakinyo, T.E.; Lam, Y.F. Simulation Study on the Impact of Tree-Configuration, Planting Pattern and Wind Condition on Street-Canyon’s Micro-Climate and Thermal Comfort. Build. Environ. 2016, 103, 262–275. [Google Scholar] [CrossRef]
- Lee, H.; Mayer, H.; Chen, L. Contribution of Trees and Grasslands to the Mitigation of Human Heat Stress in a Residential District of Freiburg, Southwest Germany. Landsc. Urban Plan. 2016, 148, 37–50. [Google Scholar] [CrossRef]
- Salata, F.; Golasi, I.; Petitti, D.; de Lieto Vollaro, E.; Coppi, M.; de Lieto Vollaro, A. Relating Microclimate, Human Thermal Comfort and Health during Heat Waves: An Analysis of Heat Island Mitigation Strategies through a Case Study in an Urban Outdoor Environment. Sustain. Cities Soc. 2017, 30, 79–96. [Google Scholar] [CrossRef]
- Wang, Y.; Berardi, U.; Akbari, H. Comparing the Effects of Urban Heat Island Mitigation Strategies for Toronto, Canada. Energy Build. 2016, 114, 2–19. [Google Scholar] [CrossRef]
- Yang, S.R.; Lin, T.P. An Integrated Outdoor Spaces Design Procedure to Relieve Heat Stress in Hot and Humid Regions. Build. Environ. 2016, 99, 149–160. [Google Scholar] [CrossRef]
- Brown, R.D.; Gillespie, T.J. Estimating Outdoor Thermal Comfort Using a Cylindrical Radiation Thermometer and an Energy Budget Model. Int. J. Biometeorol. 1986, 30, 43–52. [Google Scholar] [CrossRef] [PubMed]
- Brown, R.D.; Gillespie, T.G. Microclimatic Landscape Design: Creating Thermal Comfort and Energy Efficienc; John Wiley & Sons, Inc.: New York, NY, USA, 1995. [Google Scholar]
- Kenny, N.A.; Warland, J.S.; Brown, R.D.; Gillespie, T.G. Part A: Assessing the Performance of the Comfa Outdoor Thermal Comfort Model on Subjects Performing Physical Activity. Int. J. Biometeorol. 2009, 53, 415–428. [Google Scholar] [CrossRef] [PubMed]
- Kenny, N.A.; Warland, J.S.; Brown, R.D.; Gillespie, T.G. Part B: Revisions to the COMFA Outdoor Thermal Comfort Model for Application to Subjects Performing Physical Activity. Int. J. Biometeorol. 2009, 53, 429–441. [Google Scholar] [CrossRef] [PubMed]
- Vanos, J.K.; Warland, J.S.; Gillespie, T.J.; Kenny, N.A. Improved Predictive Ability of Climate-Human-Behaviour Interactions with Modifications to the COMFA Outdoor Energy Budget Model. Int. J. Biometeorol. 2012, 56, 1065–1074. [Google Scholar] [CrossRef] [PubMed]
- Vanos, J.K.; Warland, J.S.; Gillespie, T.J.; Kenny, N.A. Thermal Comfort Modelling of Body Temperature and Psychological Variations of a Human Exercising in an Outdoor Environment. Int. J. Biometeorol. 2012, 56, 21–32. [Google Scholar] [CrossRef] [PubMed]
- Systems Research and Development Institute of Japan. 1998 Ministry of the Environment Contract Work Report: Study on Countermeasures against Heat Island Phenomenon. 1999. Available online: http://www.env.gov.jp/air/report/h20-04 (accessed on 29 May 2018). (In Japanese)
- Grimmond, C.S.B.; Potter, S.K.; Zutter, H.N.; Souch, C. Rapid Methods to Estimate Sky View Factors Applied to Urban Areas. Int. J. Clim. 2001, 21, 903–913. [Google Scholar] [CrossRef]
- Lillesand, T.; Kiefer, R.; Chipman, J. Concepts and Foundations of Remote Sensing. In Remote Sensing and Image Interpretation; Lillesand, T., Kiefer, R., Chipman, J., Eds.; John Wiley & Sons, Inc.: New York, NY, USA, 2004; pp. 1–57. [Google Scholar]
- Kenny, N.A.; Warland, J.S.; Brown, R.D.; Gillespie, T.G. Estimating the Radiation Absorbed by a Human. Int. J. Biometeorol. 2008, 52, 491–503. [Google Scholar] [CrossRef] [PubMed]
- I-Tree: Tools for Assessing and Managing Forests & Community Trees. Available online: http://www.itreetools.org/ (accessed on 28 May 2018).
- ArcGIS. Available online: https://www.arcgis.com/features/index.html (accessed on 25 April 2018).
- Welcome to Python.org. Available online: https://www.python.org/ (accessed on 25 April 2018).
- Gál, T.; Lindberg, F.; Unger, J. Computing Continuous Sky View Factors Using 3D Urban Raster and Vector Databases: Comparison and Application to Urban Climate. Theor. Appl. Climatol. 2009, 95, 111–123. [Google Scholar] [CrossRef]
- Chen, L.; Ng, E.; An, X.; Ren, C.; Lee, M.; Wang, U.; He, Z. Sky View Factor Analysis of Street Canyons and Its Implications for Daytime Intra-Urban Air Temperature Differentials in High-Rise, High-Density Urban Areas of Hong Kong: A GIS-Based Simulation Approach. Int. J. Climatol. 2012, 32, 121–136. [Google Scholar] [CrossRef]
- International Organization for Standardization. ISO 7726: Ergonomics of the Thermal Environment—Instruments for Measuring Physical Quantities, 2nd ed.; International Organization for Standardization (ISO): Geneva, Switzerland, 1998. [Google Scholar]
- Meeus, J. Astronomical Algorithms, 2nd ed.; Wollmann-Bell, Inc.: Richmond, Virginia, 1999. [Google Scholar]
- Nowak, D.J.; Crane, D.E.; Stevens, J.C.; Hoehn, R.E.; Walton, J.T.; Bond, J. A Ground-Based Method of Assessing Urban Forest Structure and Ecosystem Services. Arboric. Urban For. 2008, 34, 347–358. [Google Scholar]
- Iqbal, M. An Introduction to Solar Radiation; Academic: San Diego, CA, USA, 2012. [Google Scholar]
- Shu, M.; Hioki, Y. Comparison of Thermal Environment Improvement Effect for Parking Lots between Different Types OfGreening. J. Jpn. Soc. Reveg. Technol. 2011, 37, 318–329. [Google Scholar] [CrossRef]
- Teshirogi, J.; Takayanagi, K.; Iguchi, Y.; Kariya, T.; Handa, M. Study on the Positive Effects of Creating Shaded Areas of Greenery in Urban Environments during the Hot Summer Season, Both from the Perspective of Cooling the Environment Itself and Also from a Medical Perspective. Landsc. Res. Jpn. 2009, 72, 875–878. [Google Scholar] [CrossRef]
- Past Weather Data Download. Available online: http://www.data.jma.go.jp/gmd/risk/obsdl/index.php (accessed on 9 October 2017).
- Data Collection on Solar Radiation and Infrared Radiation. Available online: http://www.data.jma.go.jp/gmd/env/radiation/data_rad.html (accessed on 11 December 2017).
- John Wainwright and Mark Mulligan. Modelling and Model Building. In Environmental Modelling: Finding Simplicity in Complexity; Mulligan, M., Wainwright, J., Eds.; John Wiley & Sons, Inc.: Hoboken, NJ, USA, 2004; pp. 7–73. [Google Scholar]
- Hirabayashi, S.; Kroll, C.N.; Nowak, D.J. Development of a Distributed Air Pollutant Dry Deposition Modeling Framework. Environ. Pollut. 2012, 171, 9–17. [Google Scholar] [CrossRef] [PubMed]
- Prihodko, L.; Goward, S.N. Estimation of Air Temperature from Remotely Sensed Surface Observations. Remote Sens. Environ. 1997, 60, 335–346. [Google Scholar] [CrossRef]
- Weyhenmeyer, G.A.; MacKay, M.; Stockwell, J.D.; Thiery, W.; Grossart, H.P.; Augusto-Silva, P.B.; Baulch, H.M.; Eyto, E.; De Hejzlar, J.; Kangur, K.; et al. Citizen Science Shows Systematic Changes in the Temperature Difference between Air and Inland Waters with Global Warming. Sci. Rep. 2017, 7, 1–9. [Google Scholar] [CrossRef] [PubMed]
- Vancutsem, C.; Ceccato, P.; Dinku, T.; Connor, S.J. Evaluation of MODIS Land Surface Temperature Data to Estimate Air Temperature in Different Ecosystems over Africa. Remote Sens. Environ. 2010, 114, 449–465. [Google Scholar] [CrossRef]
- Heisler, G.M. Mean Wind Speed below Building Height in Residential Neighborhoods with Different Tree Different Tree Densities. ASHRAE Trans. 1990, 96, 1389–1396. [Google Scholar]
- Park, S.; Tuller, S.E. Advanced View Factor Analysis Method for Radiation Exchange. Int. J. Biometeorol. 2014, 58, 161–178. [Google Scholar] [CrossRef] [PubMed]
- Middel, A.; Lukasczyk, J.; Maciejewski, R. Sky View Factors from Synthetic Fisheye Photos for Thermal Comfort Routing—A Case Study in Phoenix, Arizona. Urban Plan. 2017, 2, 19. [Google Scholar] [CrossRef]
Figure 1.
Energy components of Rabs that stem from (a) solar radiation and (b) radiant heat.

Figure 2.
(a) Illustration of the algorithm to estimate SVF; (b) fisheye photograph showing a building and a tree overlapped.
Figure 2.
(a) Illustration of the algorithm to estimate SVF; (b) fisheye photograph showing a building and a tree overlapped.

Figure 3.
Study site along 2020 Tokyo Olympic marathon course in Tokyo, Japan; photograph taken northward from southern end of site, showing Yurinoki—tulip tree (Liriodendron tulipifera).
Figure 3.
Study site along 2020 Tokyo Olympic marathon course in Tokyo, Japan; photograph taken northward from southern end of site, showing Yurinoki—tulip tree (Liriodendron tulipifera).

Figure 4.
(a) SVF measurement location (b) fisheye measurement and estimate SVF comparisons.

Figure 5.
EB variations across time and space as a function of SVF and shade on August 9, 2016 at (a) 7 a.m.; (b) 9 a.m.; and (c) 1 p.m.
Figure 5.
EB variations across time and space as a function of SVF and shade on August 9, 2016 at (a) 7 a.m.; (b) 9 a.m.; and (c) 1 p.m.

Figure 6.
Rabs’s component (a) D; (b) V; (c) S; and (d) F as a function of SVF and shade on 9 August 2016 at 1 p.m.
Figure 6.
Rabs’s component (a) D; (b) V; (c) S; and (d) F as a function of SVF and shade on 9 August 2016 at 1 p.m.

Figure 7.
D-COMFA results for study site street at 10 a.m. 9 August 2016. (a) shade and sunlit areas and (b) EB.
Figure 7.
D-COMFA results for study site street at 10 a.m. 9 August 2016. (a) shade and sunlit areas and (b) EB.

Figure 8.
(a) Sunlit, building- and tree-shaded area fraction on street; (b) average EB for sunlit, building- and tree-shaded area on street.
Figure 8.
(a) Sunlit, building- and tree-shaded area fraction on street; (b) average EB for sunlit, building- and tree-shaded area on street.

Figure 9.
Results due to temperature adjustment for sunlit/shaded ground cover and surface objects, and under tree canopy at 1 p.m. for (a) M; (b) Conv; (c) Evap; (d) TRemit; and (e) G.
Figure 9.
Results due to temperature adjustment for sunlit/shaded ground cover and surface objects, and under tree canopy at 1 p.m. for (a) M; (b) Conv; (c) Evap; (d) TRemit; and (e) G.


Table 1.
Primary input parameters for each energy component.
| Parameters | Spatially Distributed | Energy Budget Components | ||||||
|---|---|---|---|---|---|---|---|---|
| Not Employed | Employed | |||||||
| human | Activity | M | ||||||
| Clothing | Conv | Evap | TRemit | |||||
| skin temperature | Conv | Evap | TRemit | |||||
| weather | air temperature | × | M | V | Conv | TRemit | ||
| relative humidity | × | M | Evap | |||||
| wind speed | × | Conv | Evap | |||||
| surface objects’ temperature | × | F | ||||||
| ground temperature | × | G | ||||||
| dew point temperature | × | Evap | ||||||
| air pressure | × | Evap | ||||||
| direct solar radiation | × | T | ||||||
| diffuse solar radiation | × | D | ||||||
| global solar radiation | × | R | ||||||
| location | shade | × | T, R | |||||
| sky view factor | × | D, V | ||||||
| wall view factor | × | S, F | ||||||
| albedo | ground cover | × | R | |||||
| surface object | × | S | ||||||
| human body | T, D, V, S, F, R, G | |||||||
Table 2.
Weather measurements at Tokyo Regional Headquarters and Tateno.
| Hour | Temperature 1 (°C) | Wind Speed 1 (m s−1) | Relative Humidity 1 (%) | Sky Cover 1 | Sky Cover 2 | Direct Solar Radiation 2 (W m−2) | Diffuse Solar Radiation 2 (W m−2) | Solar Elevation Angle 3 (°) |
|---|---|---|---|---|---|---|---|---|
| 7:00 | 27.7 | 1.8 | 73 | Scattered | Broken | 128 | 269 | 23.9 |
| 8:00 | 29.9 | 1.6 | 63 | Scattered | Broken | 181 | 339 | 36.0 |
| 9:00 | 33.5 | 4.5 | 47 | Scattered | Broken | 203 | 308 | 48.0 |
| 10:00 | 35.6 | 4.4 | 45 | Scattered | Broken | 533 | 317 | 59.0 |
| 11:00 | 35.8 | 4.1 | 41 | Scattered | Clear | 447 | 425 | 67.5 |
| 12:00 | 36.5 | 5.8 | 36 | Clear | Broken | 450 | 306 | 69.8 |
| 13:00 | 37.3 | 4.2 | 38 | Clear | Clear | 622 | 222 | 64.2 |
| 14:00 | 37.1 | 4.5 | 37 | Clear | Clear | 722 | 142 | 54.2 |
| 15:00 | 36.2 | 6.2 | 38 | Clear | Clear | 497 | 156 | 42.6 |
| 16:00 | 34.7 | 6.1 | 40 | Clear | Clear | 606 | 114 | 30.6 |
| 17:00 | 34.5 | 5.0 | 40 | Clear | Clear | 278 | 61.1 | 18.4 |
| 18:00 | 34 | 5.5 | 38 | Clear | Clear | 41.7 | 11.1 | 6.4 |
1 measurement at Tokyo Regional Headquarter; 2 measurement at Tateno; 3 calculated for study site.
Table 3.
Mean for SVF, energy components, and EB for sunlit, building- and tree-shaded cells at 1 p.m. on street.
Table 3.
Mean for SVF, energy components, and EB for sunlit, building- and tree-shaded cells at 1 p.m. on street.
| Parameter | Sunlit Cells | Building Shaded | Tree Shaded |
|---|---|---|---|
| SVF | 0.63 | 0.35 | 0.54 |
| M | 113 | 113 | 113 |
| T | 44 | 0 | 5.7 |
| D | 70 | 39 | 61 |
| V | 117 | 65 | 101 |
| S | 2.9 | 7.5 | 2.2 |
| F | 63 | 102 | 78 |
| R | 32 | 0 | 4.2 |
| G | 253 | 212 | 211 |
| Conv | 0.25 | 2.7 | 2.4 |
| TRemit | 397 | 395 | 395 |
| Evap | -2.2 | 3.4 | 2.7 |
| EB | 299 | 137 | 175 |
© 2018 by the authors. Licensee MDPI, Basel, Switzerland. This article is an open access article distributed under the terms and conditions of the Creative Commons Attribution (CC BY) license (http://creativecommons.org/licenses/by/4.0/).
Share and Cite
MDPI and ACS Style
Hirabayashi, S.; Abe, T.; Imamura, F.; Morioka, C. Development of a Distributed Modeling Framework to Estimate Thermal Comfort along 2020 Tokyo Olympic Marathon Course. Atmosphere 2018, 9, 210. https://doi.org/10.3390/atmos9060210
AMA Style
Hirabayashi S, Abe T, Imamura F, Morioka C. Development of a Distributed Modeling Framework to Estimate Thermal Comfort along 2020 Tokyo Olympic Marathon Course. Atmosphere. 2018; 9(6):210. https://doi.org/10.3390/atmos9060210
Chicago/Turabian StyleHirabayashi, Satoshi, Tsutomu Abe, Fumiko Imamura, and Chie Morioka. 2018. "Development of a Distributed Modeling Framework to Estimate Thermal Comfort along 2020 Tokyo Olympic Marathon Course" Atmosphere 9, no. 6: 210. https://doi.org/10.3390/atmos9060210
Note that from the first issue of 2016, this journal uses article numbers instead of page numbers. See further details here.