Wind Resource Assessment in the Southern Plains of the US: Characterizing Large-Scale Atmospheric Circulation with Cluster Analysis

Department of Geosciences, Auburn University, Auburn, AL 36849, USA
Atmosphere 2018, 9(3), 110; https://doi.org/10.3390/atmos9030110
Submission received: 29 January 2018
/
Revised: 27 February 2018
/
Accepted: 13 March 2018
/
Published: 16 March 2018
(This article belongs to the Special Issue Energy Meteorology)
Abstract
:A new approach for wind resource assessment in the Southern Plains of the US is proposed here. This new approach establishes the baseline frequency of occurrence of large-scale atmospheric circulations (weather regimes) by cluster analysis, using 38-yr NCEP-NCAR reanalysis daily data from 1979–2016. These baseline frequency values can help quantify the departure of wind resource from the long-term mean for a given month. In specific, two scenarios featuring favorable and unfavorable wind energy productions in the Callahan Divide Energy Center of Texas, US, are evaluated by the new approach of wind resource assessment in details. For the favorable scenario, it is found that the jet stream is configured to enhance the southwesterly flow over the Southern Plains, with a frequency of occurrence being nearly three times of the baseline frequency, whereas for the unfavorable scenario, the jet stream is found to suppress the low-level jet over the Southern Plains, with a frequency of occurrence being more than twice the baseline frequency. Hence, the new approach is proven to provide an objective and more efficient way in conducting wind resource assessment.
1. Introduction
Wind energy is an important source of clean energy which is nonpolluting and renewable. Unlike the fossil fuels, wind turbines generate power without emitting greenhouse gases nor toxic waste. According to the Energy Information Administration (EIA) of the US, in March of 2017, the wind and solar power have generated more than 10% of electricity for the first time in the US, and the projections show that this number of percentage will continue to grow steadily. By assessing and characterizing available wind resources, wind resource assessment is a crucial approach in the development, siting, and operation of wind farms. In terms of wind farm development, wind resource assessment provides the estimated wind energy production at prospective wind farms. In particular, the short-term (typically 1–2 years) observation of wind speed at turbine height is first obtained from meteorological towers set up in the prospective sites, and is then used to estimate the short-term wind energy production. Later on, the long-term wind energy production is estimated, most commonly derived from the long-term reanalysis data. In terms of wind farm’s operational performance, wind resource assessment could provide detailed analysis to characterize and evaluate the operation of wind farms.
A widely used method of wind resource assessment for operational wind farms is involved with synoptic pattern analysis, which is a subjective way to examine the dynamical linkage of jet streams and low-level wind resource so as to achieve an improved understanding of fundamental drivers of wind resource. Characterizing the wind resource departure from the expectation would allow to identify other operational factors affecting wind farm performance. In specific, the synoptic pattern analysis method is primarily carried out by subjective inspection of weather maps such that days with similar synoptic patterns in a specific month can be grouped together to form a sub-period. Each sub-period is commonly associated with the favorable, unfavorable or neutral low-level wind resources, respectively. The frequency of occurrence for each sub-period-accompanied synoptic pattern can be thus calculated for a given month. However, the long-term baseline for the frequency of occurrence of these identified synoptic patterns is not yet established. Brayshaw et al. [1] studied the impact of large-scale atmospheric circulation patterns on wind power generation and potential predictability of wind power over the UK. This study found that the North Atlantic Oscillation (NAO) phases influence the wind power generation of UK and the forecast of future NAO phases would help improve statistical forecasts of monthly wind power generation with months in lead. Another study by Thornton et al. [2] also confirmed that the large-scale atmospheric circulation patterns are responsible for the varying wind power and changing electricity demand during the winter season of the UK. Moreover, Jerez et al. [3] also found similar results in NAO impact on renewable energy resources in the southwestern Europe. Hence, in the present study, we desire to establish the climatological frequency of occurrence of certain large-scale atmospheric circulation patterns, associated with various types of wind resources, such that we would enable to compare the wind resource for a given month against the long-term values. This allows us to quantify by how much the wind resource in a specific month exceeds or underperforms the baseline wind resources.
Hence, in the present study, the Cluster Analysis approach is used to group similar synoptic weather patterns into clusters on a month-by-month basis. This enables us to improve the current method of subjective synoptic pattern analysis for operational wind assessment to the next level by explicitly quantifying the departure of wind resources from the baseline values. Detailed description of the Cluster Analysis method is provided in Section 2.
In this study, wind resource assessment is primarily performed over the Southern Plains of US, given the unique synoptic weather patterns fueling the wind power over this region. It has long been documented that, during the spring and summer time, the Great Plains of the US is characterized by frequent nocturnal low-level jets which are often associated with severe weather events such as thunderstorms [4,5,6,7,8,9]. Specifically, Bonner [4] examined the geographical distribution and diurnal variations of the low-level jet over the US based on the 2-yr radiosonde data. This study found that the Great Plains low-level jets occur most often from April to September, in particular during the nighttime, and they span over the Great Plains at the horizontal scale. Thus the wind resources of Great Plains are mainly determined by the low-level jet during the spring and summer seasons, and by jet stream during the fall and winter seasons.
The remainder of this study is organized as follows. Section 2 explains the methodology and data used in this study. In Section 3, two scenarios featuring favorable and unfavorable wind energy production in the Southern Plains are analyzed respectively. Finally, conclusions and discussion are presented in Section 4.
2. Methodology and Data
Cluster Analysis is a method used to classify multivariate data into groups in an objective manner [10,11]. It is a powerful tool in classifying a variety of meteorology related datasets. For instance, Jimenez et al. [12], Darby [13], Kaufmann and Whiteman [14], Cooter et al. [15], Beaver and Palazoglu [16] used cluster analysis to classify the wind patterns; Christiansen [11], Cheng and Wallace [17], Kalkstein et al. [18], Fovell and Fovell [19], Straus and Molteni [20], Straus et al. [21], Fereday et al. [22], Lorente-Plazas et al. [23], Garcia-Valero et al. [24] classified the weather regimes with cluster analysis; and Wolter [25], DeGaetano [26], Arnott et al. [27] applied cluster analysis to other areas of meteorology.
The Cluster Analysis and Principal Component Analysis (PCA) are two distinct approaches for grouping data and there are fundamental differences between them. In our present study, clusters are used in preference to principal components because clusters provide a simple way of partitioning the phase space into localized regions. Cluster centroids are the averages of similar circulation fields, representing physical circulation patterns, while PCA spatial patterns are constrained to be mutually orthogonal so that they do not necessarily resemble physical circulation patterns. In addition, opposite phases of principal components are constrained to have the same spatial pattern, which may not be appropriate for the physical phenomena such as the NAO, whereas clusters are not restricted in this way. Furthermore, while clusters are all approximately the same size, higher PCs account for relatively little of the total variance and thus account for reduced importance. Nevertheless, the PCA approach and cluster analysis could be combined together for clustering as done by Lorente-Plazas et al. [23], Jimenez et al. [28].
The hierarchical clustering and k-means clustering (or partitioning clustering) are the two primary types of cluster analysis methods. The hierarchical clustering builds the classification tree through iteration starting from the single data points and merging pairs based on the similarity criterion. The k-means clustering starts from the prescribed number of clusters and data points are agglomerated around kernels initially chosen from random seeds. In a sense, the k-means approach provides an optimal partition, in comparison to the hierarchical clustering [29]. In the present study, the k-means cluster analysis approach is adopted to minimize the within-cluster variance summed over all the clusters. Determining the optimal number of clusters is a challenge, nevertheless, abundant research efforts have been made in seeking the optimal number of clusters by assessing the stability of clusters [30,31]. The cluster stability is examined by inspecting the global minimum of the within-cluster variance summed over all the clusters. The cluster stability gradually decreases as the number of cluster, k, increases. This is also termed as Elbow criterion for determining the optimal number of clusters. k is suggested to locate around a bend in the curve. In the present study, the Elbow criterion is applied to the two selected scenarios and the optimal k is determined to be 4. However, the Elbow criterion is not always perfect in locating k in some other cases where a bend in the curve does not really exist. In that case, other criterion for choosing k should be considered as there is no consensus on ways of finding the optimal number of clusters so far.
The daily data of the National Centers for Environmental Prediction (NCEP)-National Center for Atmospheric Research (NCAR) reanalysis during 1979–2016 (38-yr) is used in this study. The k-means cluster analysis is performed upon this dataset to form distinct clusters for the selected months, in a sense of climatological cluster. The daily fields of NCEP-NCAR reanalysis are mostly available at 17 vertical pressure levels (p = 1000, 925, 850, 700, 600, 500, 400, 300, 250, 200, 150, 100, 70, 50, 30, 20 and 10 hPa) on a grid [32]. The monthly wind energy production data is taken from the US Energy Information Administration (EIA). The data spans from 2007–2016.
3. Results
3.1. An Overview of Wind Energy Production in the Southern Plains
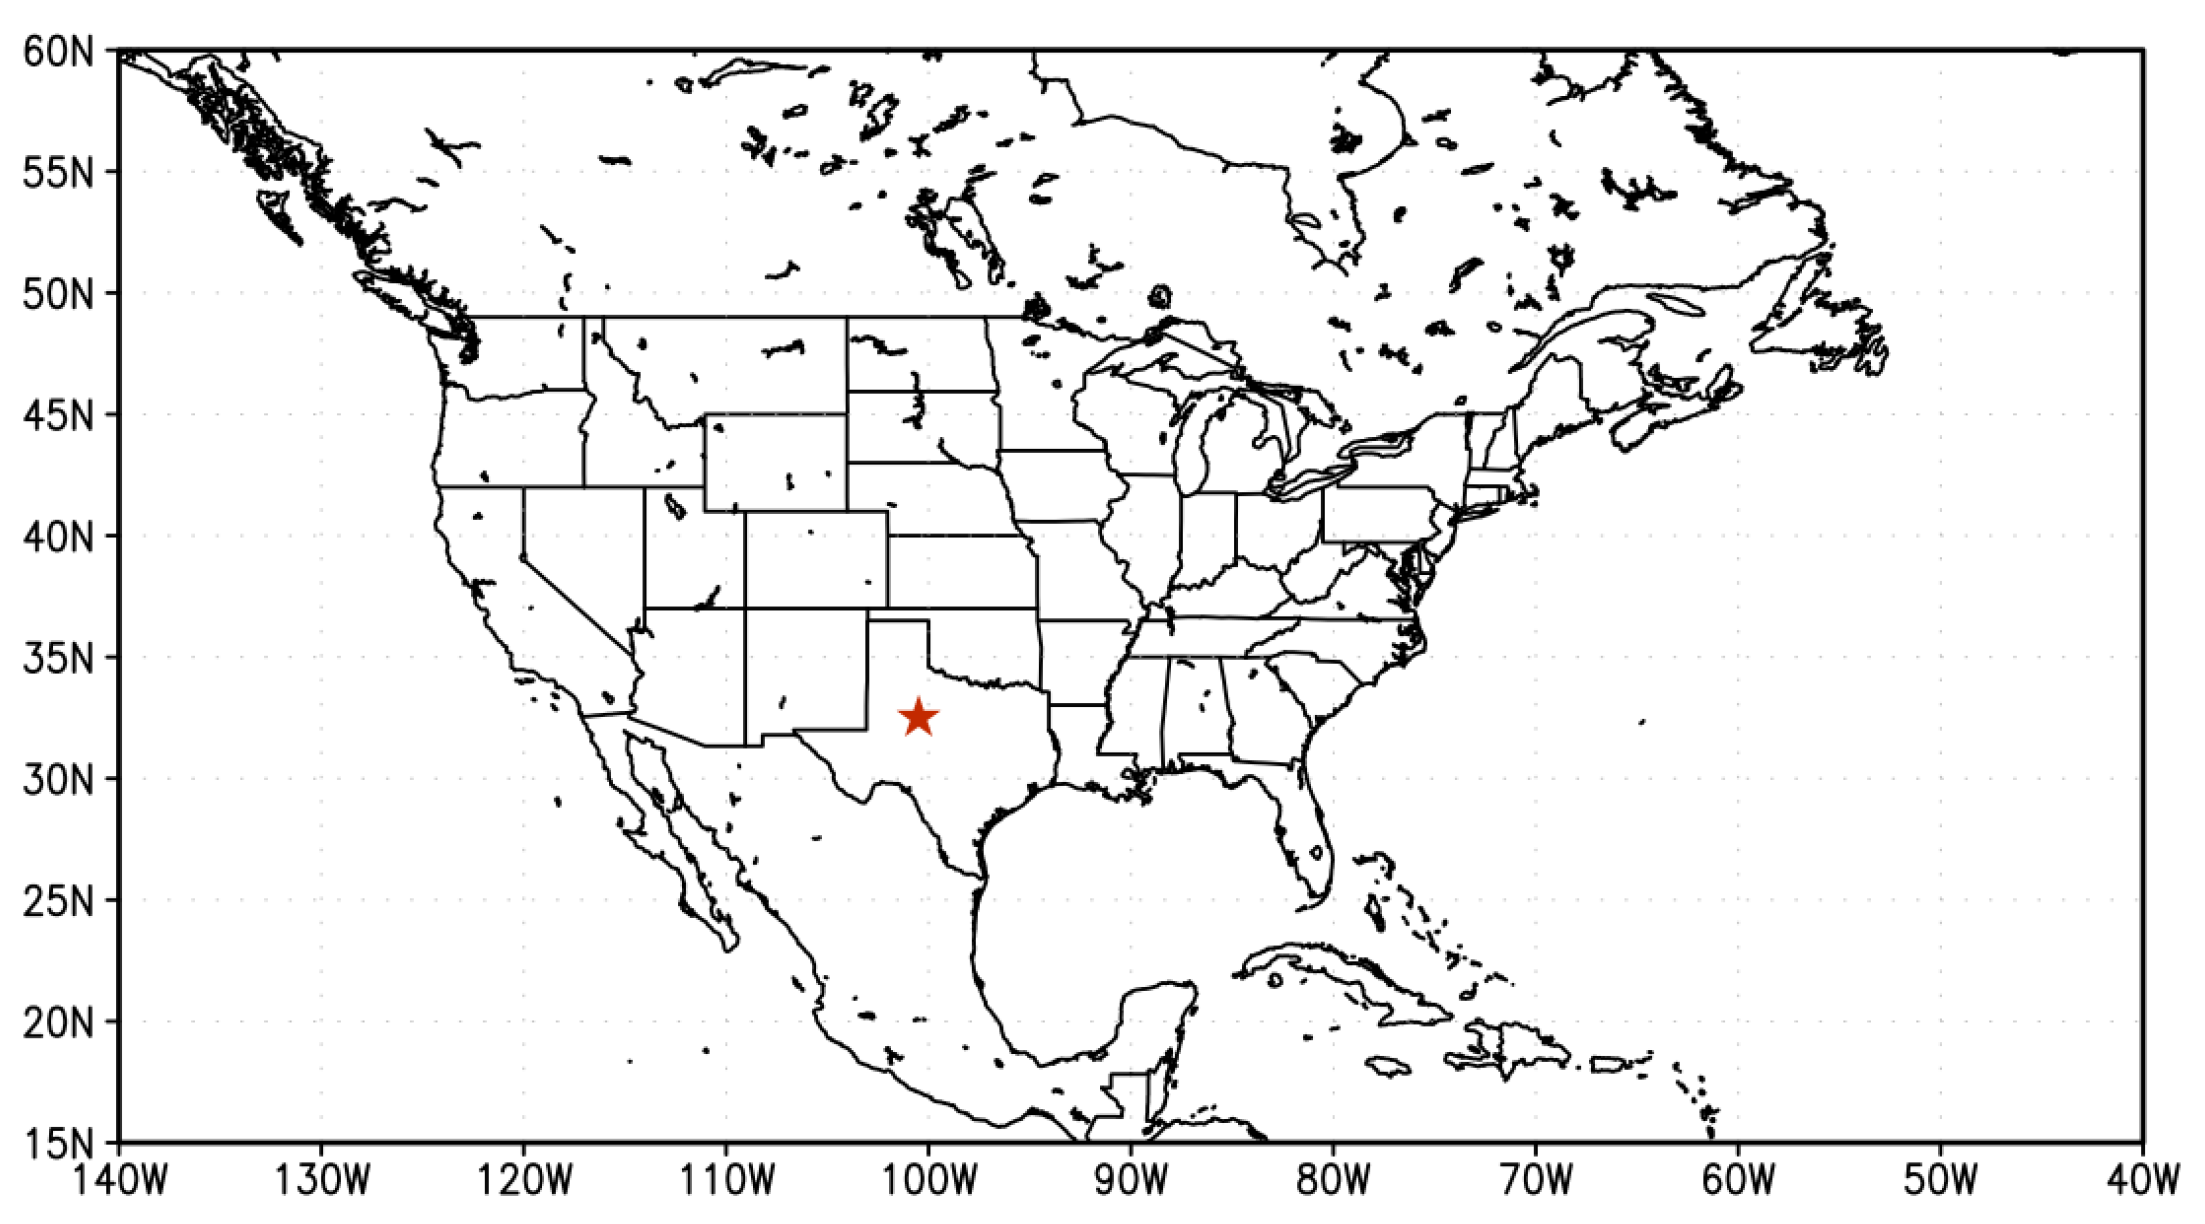
The Southern Plains of the US generally features good wind resource, primarily due to the low-level jet in the summer season and characteristic storm track in the winter season. In this work, the Callahan Divide Wind Energy Center was chosen to represent a typical wind farm in the Southern Plains. This energy center is an on-shore wind farm located in the City of Taylor, Texas, as shown in Figure 1. It is a 114-megawatt wind generation plant with 76 1.5-megawatt GE turbines that are capable of generating enough electricity power more than 24,000 home (https://www.nexteraenergyresources.com/pdf_redesign/callahandivide.pdf).
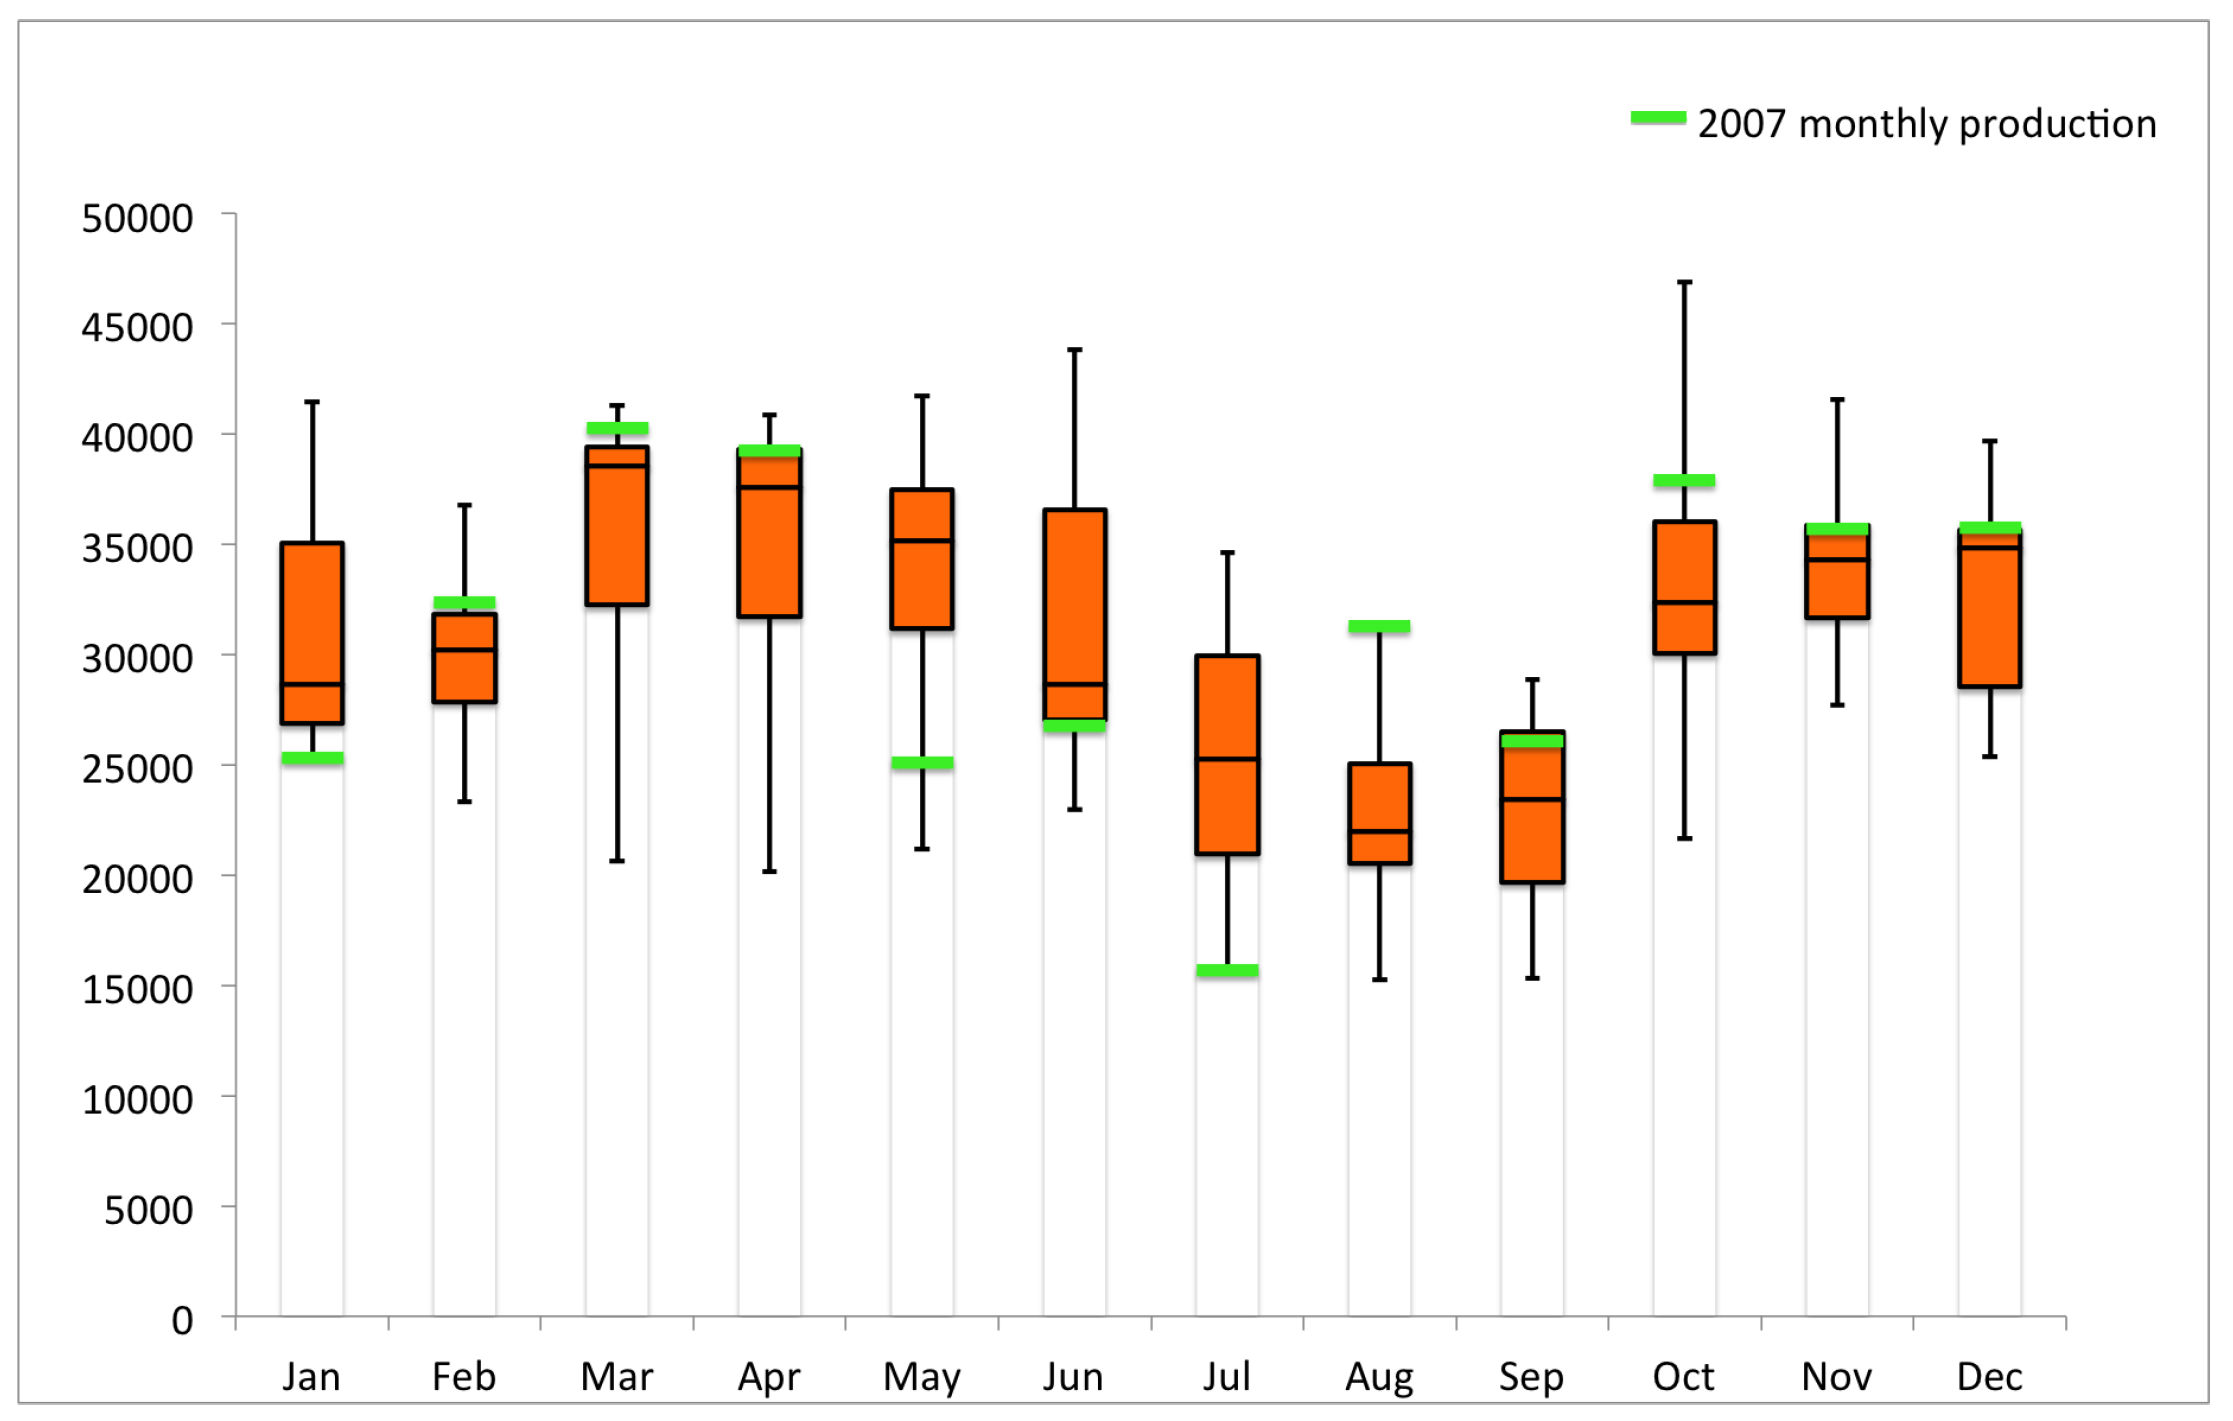
Figure 2 shows the whisker-box (in orange) of the monthly wind energy production in Callahan Divide from 2007–2016. The bottom and top of the box are the first and third quartiles, and the band inside the box is the second quartile or the median. The minimum and maximum of the data are represented by the two ends of the whiskers. The green bar in Figure 2 denotes the monthly wind energy production in 2007. For the summer months, the July 2007 wind energy performance is fairly noticeable as it reaches the minimum of the whisker-box of July, whereas for the fall and winter season, the October 2007 production stands out as it is above the first quartile of the whisker-box in October. Therefore, in the present work, we will focus on October 2007 as the favorable wind energy production scenario, and July 2007 as the unfavorable scenario for the wind resource assessment study.
3.2. October 2007: A Favorable Scenario for Wind Energy Production
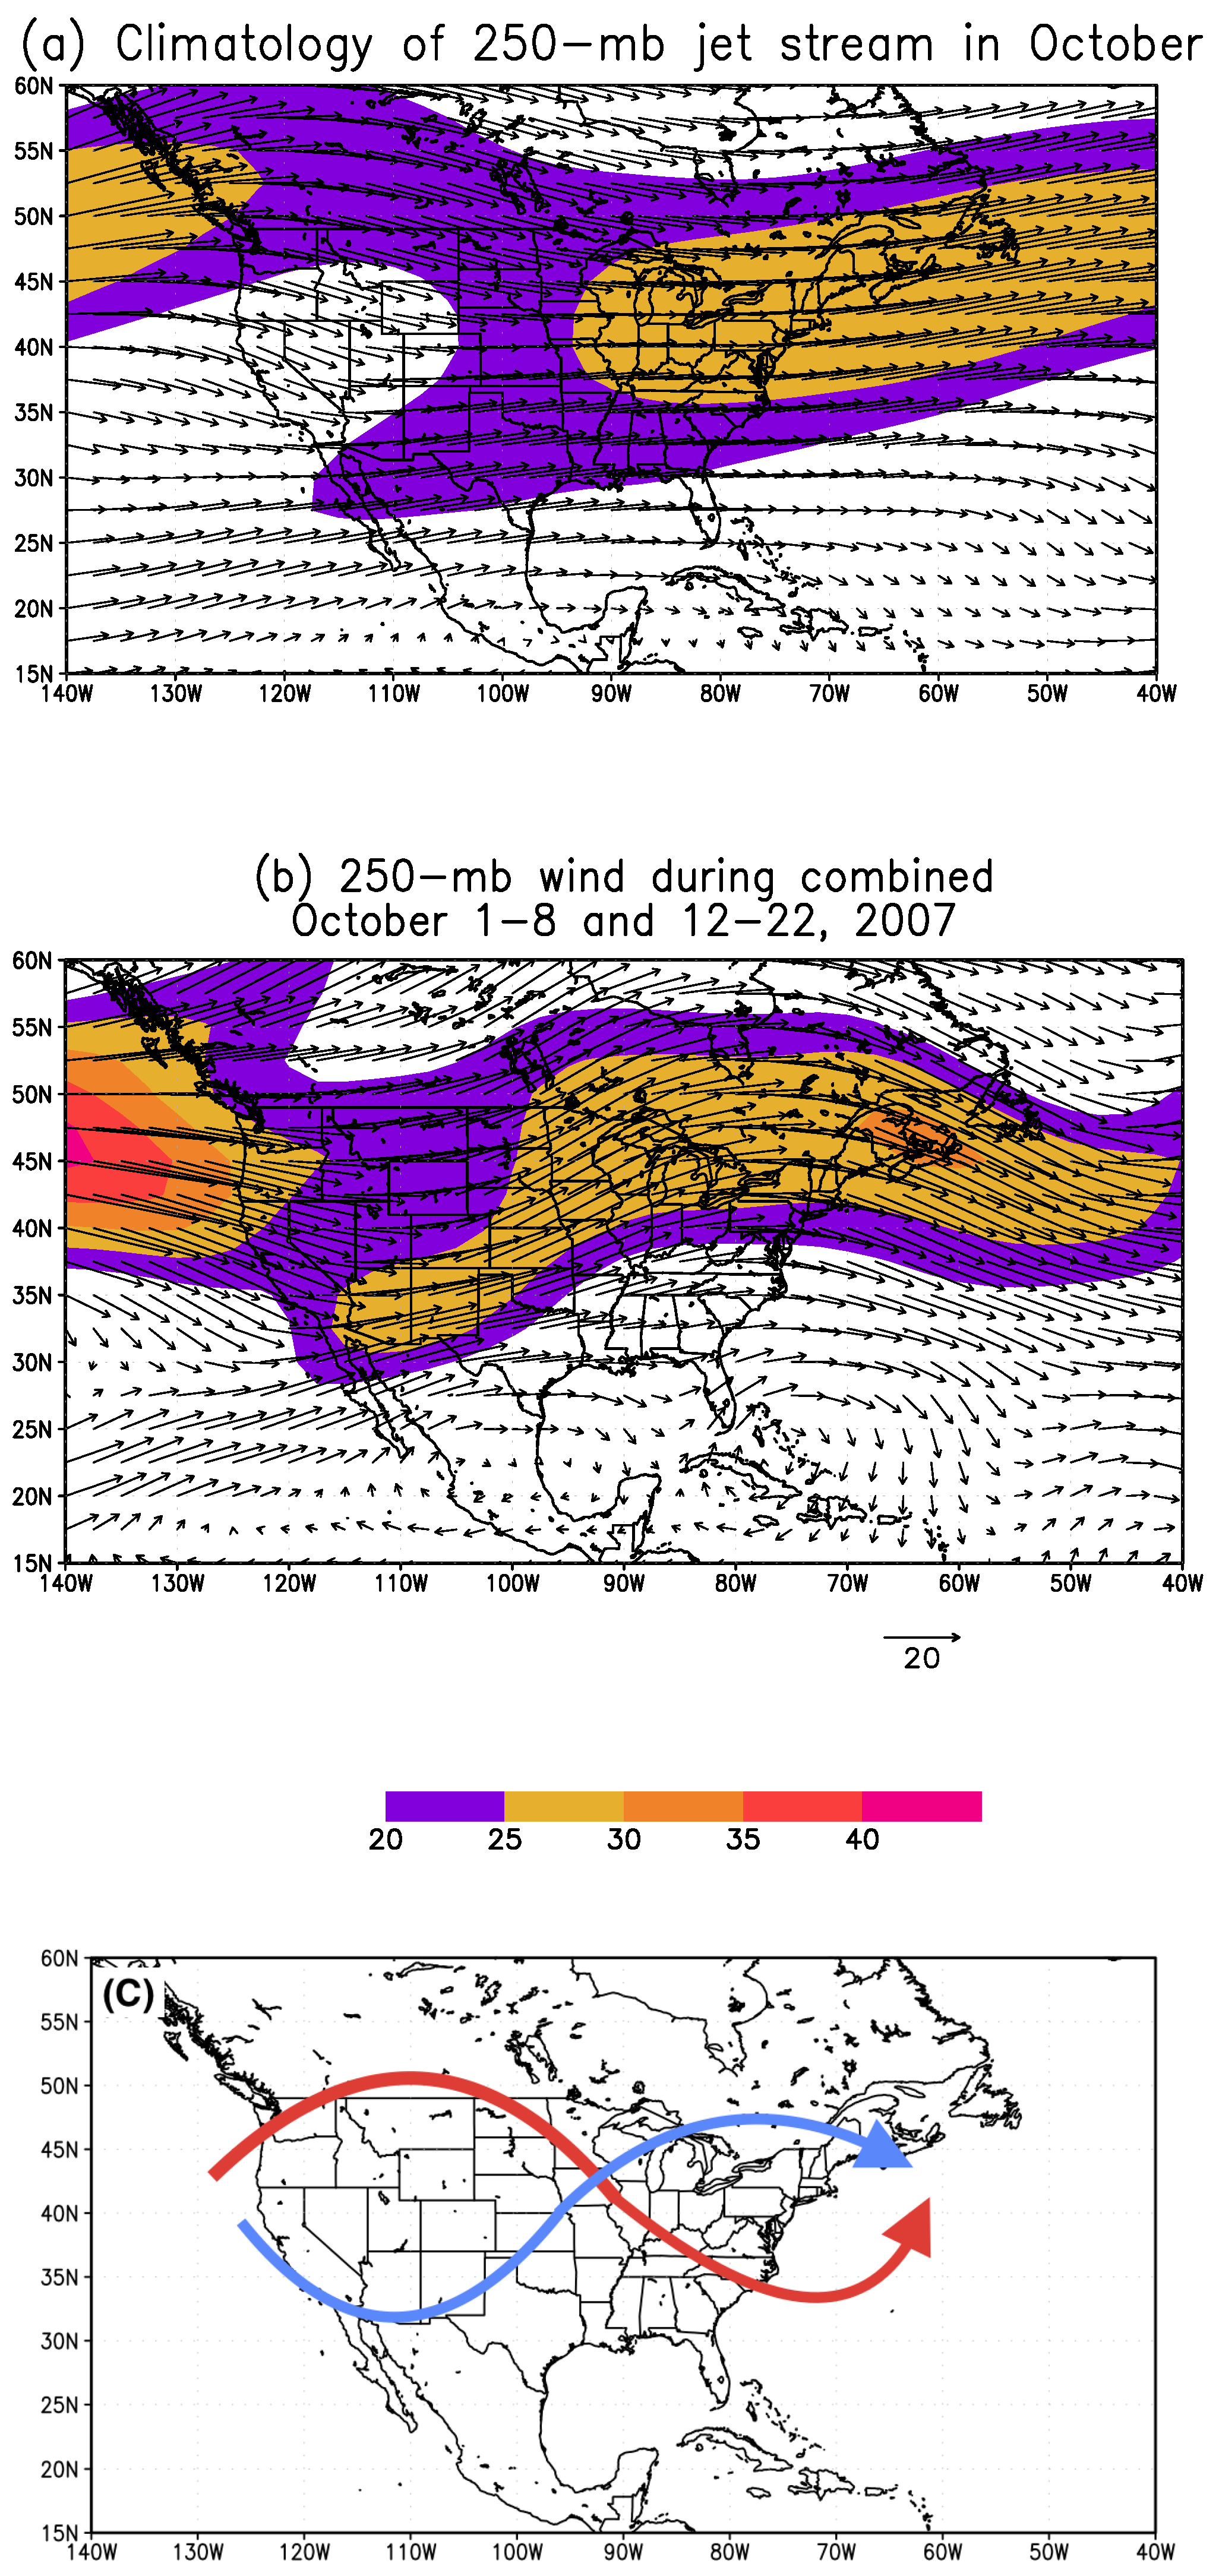
Figure 3a shows the typical jet stream for the month of October based on the 38-yr reanalysis data. The US Great Plains features dominant northwesterly wind whereas the peak wind magnitude is normally observed over the East Pacific Ocean as well as the Northeastern US. The northwesterly wind is the common wind resource for wind farms in the Great Plains. Nevertheless, for the jet stream of October 2007 as shown in Figure 3b, it does not follow the routine path as depicted in Figure 3a. Instead, it is characterized as the opposite pattern of the climatological October jet stream, with the trough located to the Southwest of the US and ridge over the Northeast US. With this distinct configuration of the October 2007 jet stream, the Southern Plains is dominated by the southwesterly wind, with the peak wind magnitude dominated over the Southern Plains as well. Specifically, with visual inspection of daily weather map, the two periods of 1–8 and 12–22 October are defined as a sub-period which is associated with excellent wind resources due to the dominant southwesterly flow over the Southern Plains.
To ease the comparison between the two types of jet streams, Figure 3c demonstrates the schematic illustration of jet streams derived from Figure 3a,b. It is evident that the October 2007 jet stream results in the excellent wind resources associated with the abundant southwesterly flow over the Southern Plains whereas the climatological October jet stream features a ridge being located to the further north of the US and a trough to the south such that the abundant northwesterly wind is dominant over the Northern Plains instead of the Southern Plains. Hence, the jet stream is found to be the major driver of the wind turbine hub-height wind performance.
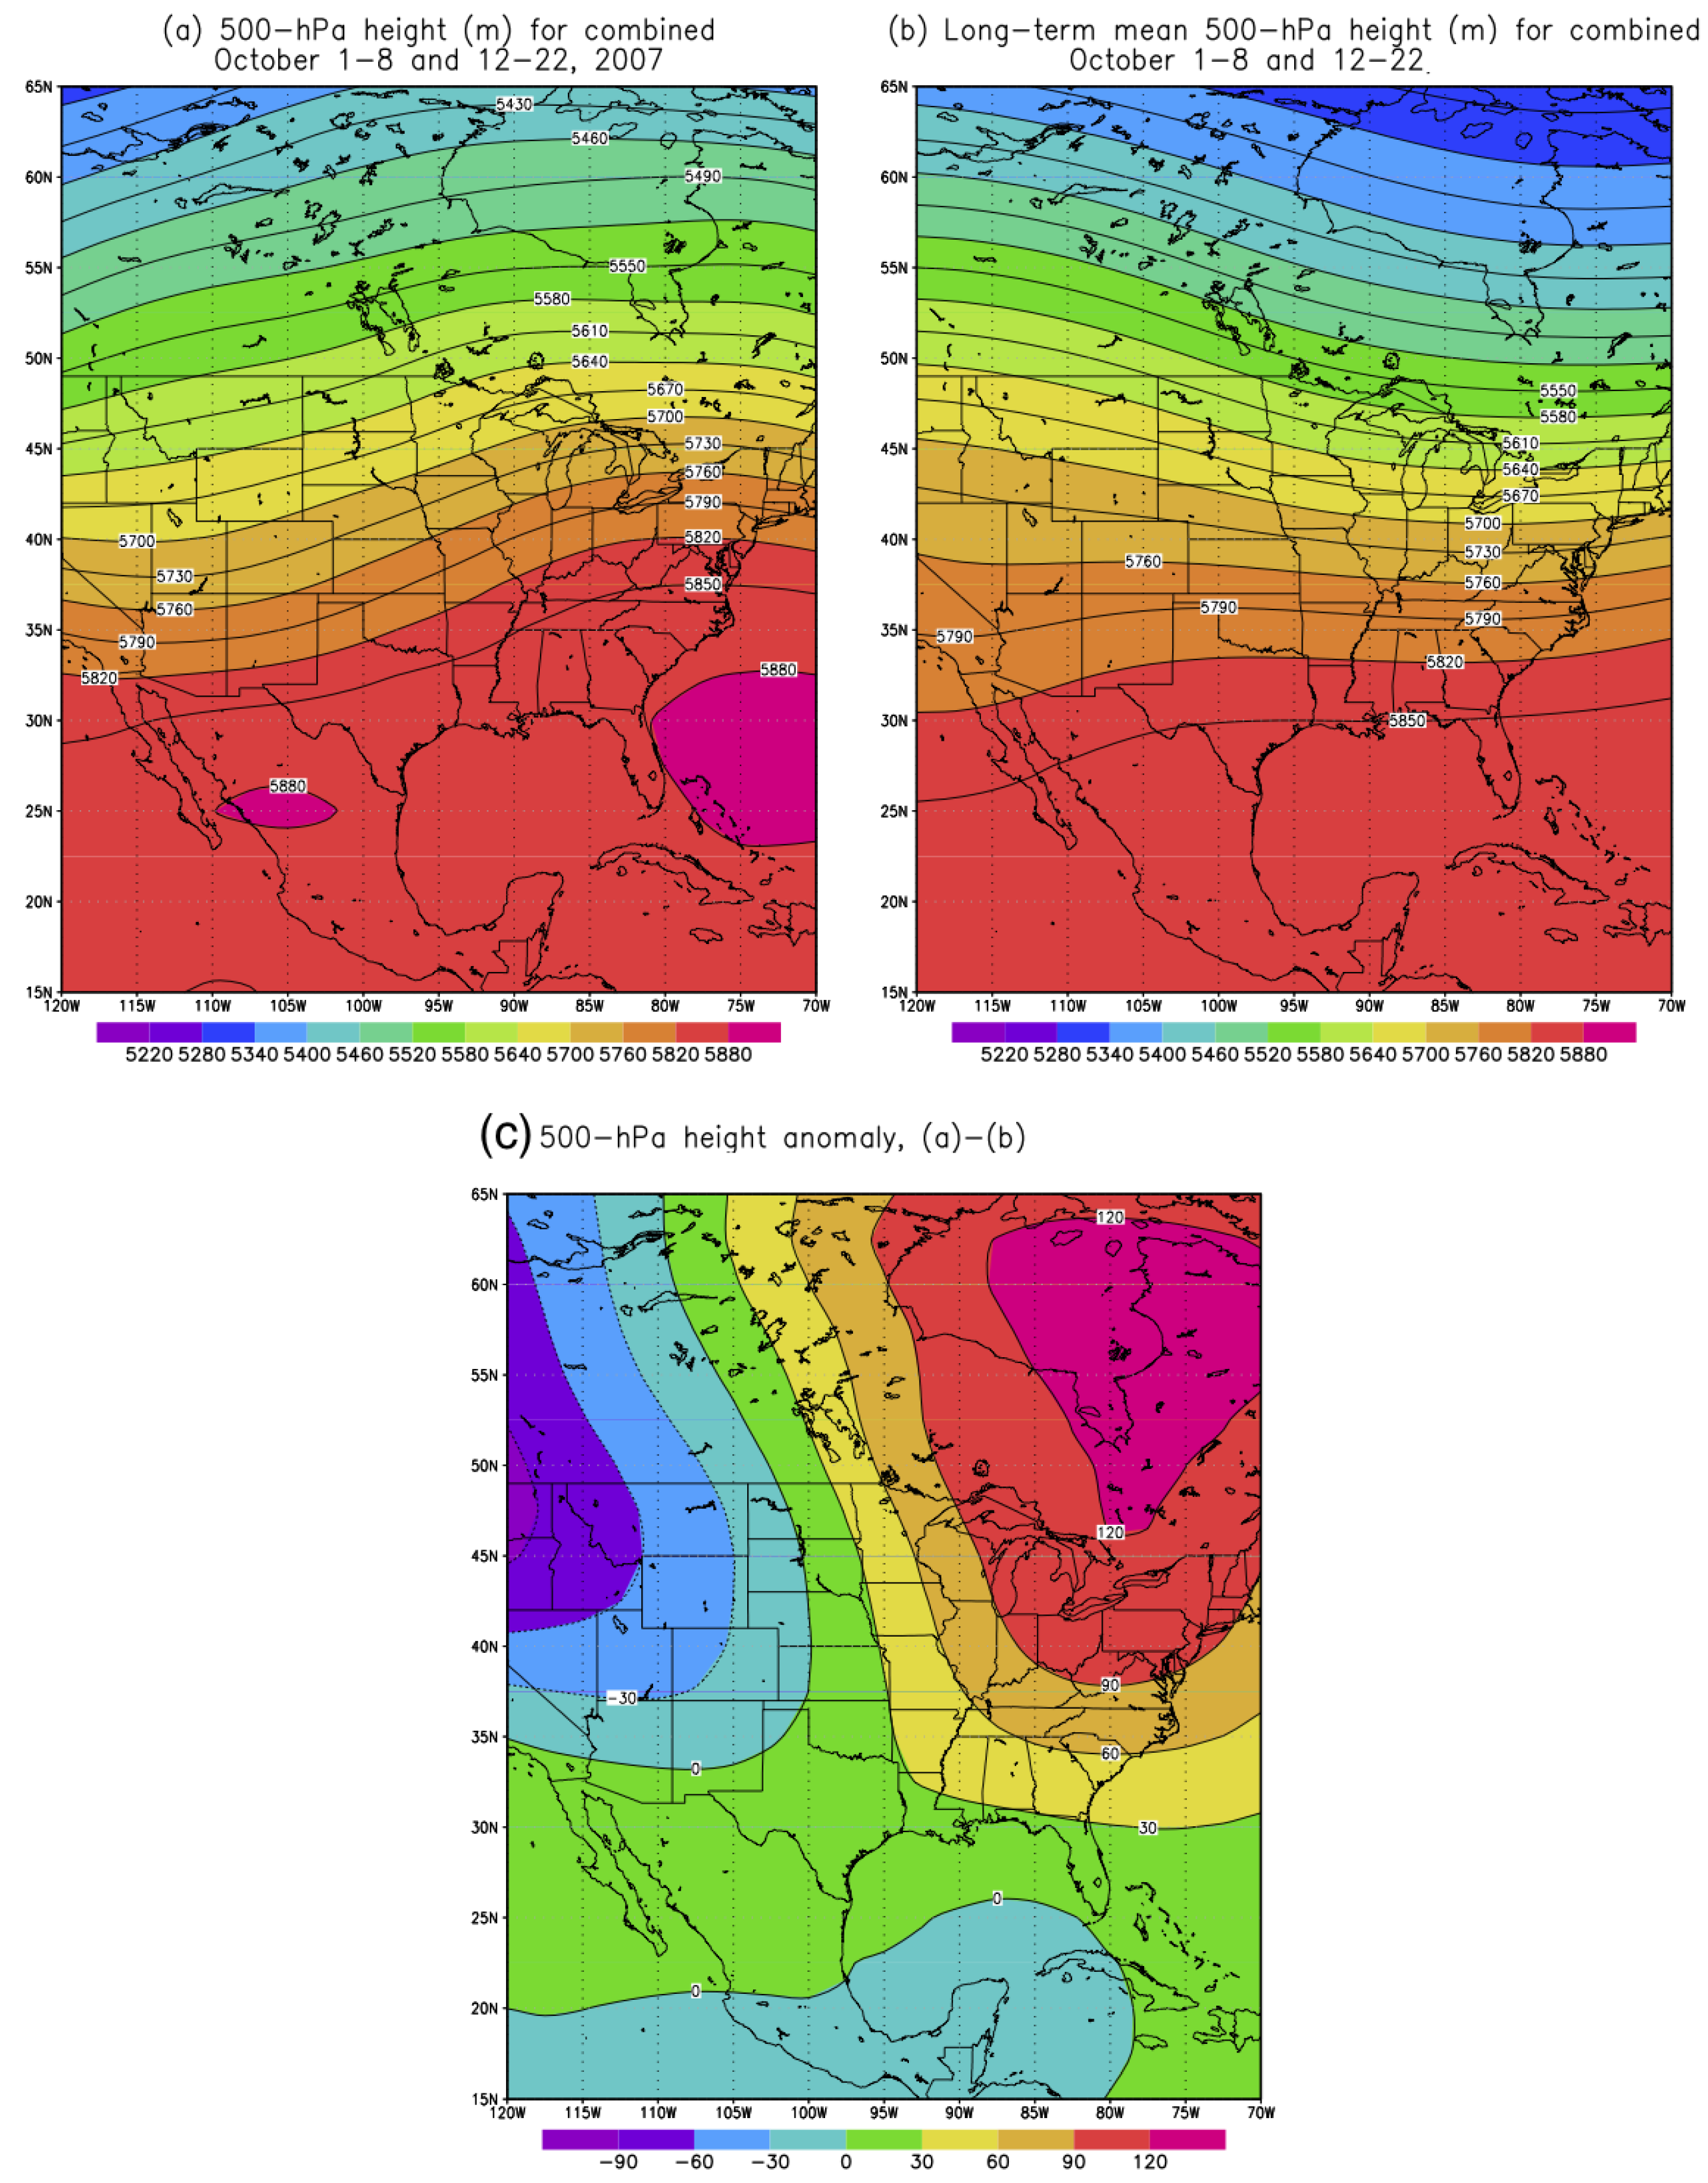
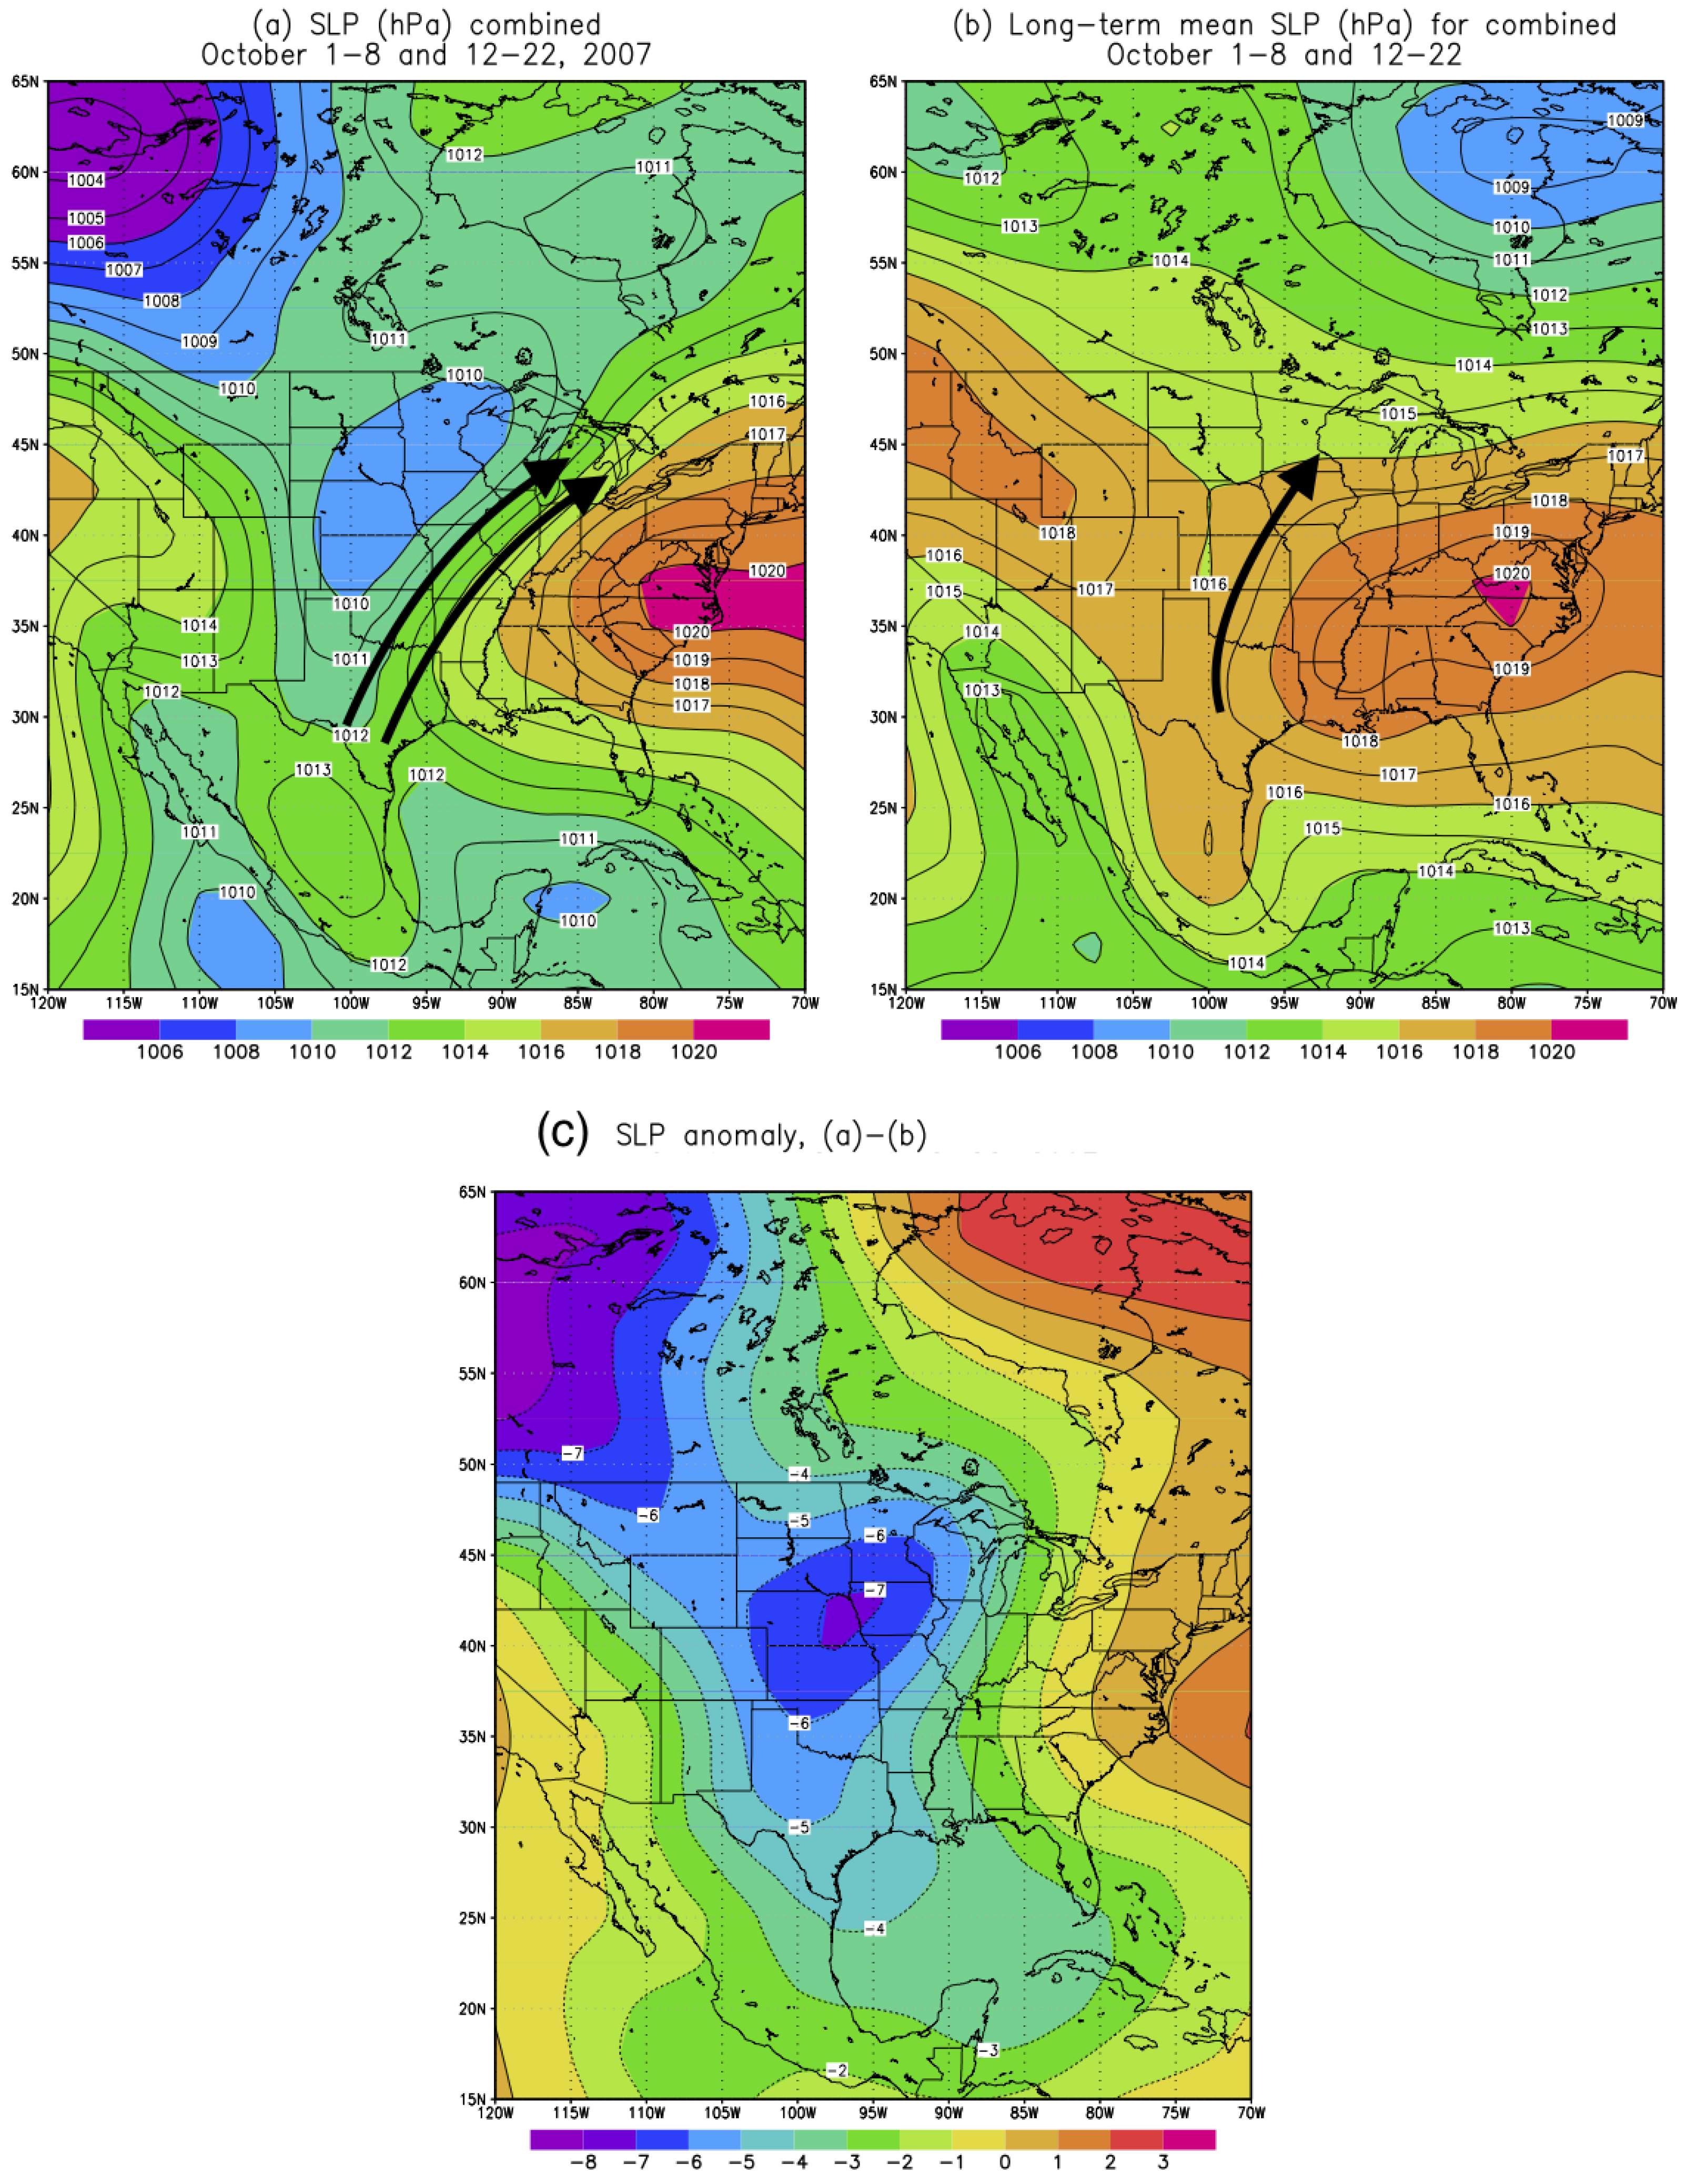
Figure 4a shows the 500-mb geopotential height field for the October 2007 predefined sub-period. Figure 4b shows the long-term mean 500-mb geopotential heights derived from 38-yr reanalysis data. Figure 4c shows the difference between a and b. Consistent with the jet stream shown in Figure 3b, the 500-mb geopotential height during October 2007 features the prevailing southwesterly wind over the Great Plains while the climatological 500-mb height field reflects the primary northwesterly wind over the Great Plains. The 500-mb height anomaly field as shown in Figure 4c highlights the anomalous trough to the west of US and ridge to the east. This is coincident with the aforementioned analysis regarding the jet stream configuration of October 2007. Based on the 500-mb height anomaly field, the prominent southerly flow anomaly is readily observed in Figure 4c. This provides fairly good wind resource for the Callahan Divide wind farm.
In a similar fashion, Figure 5 depicts the sea level pressures for the October 2007 over the predefined sub-period as shown in Figure 5a, the corresponding long-term October climatology shown in Figure 5b, and the anomaly sea level pressure as shown in Figure 5c. According to Figure 5a, the tight sea level pressure gradient between the sea level low and high over the Great Plains is associated with strong southwesterly flow, in contrast to the weaker southwesterly flow observed in the climatological sea level pressure field in Figure 5b. The anomaly field of sea level pressure, as shown in Figure 5c, highlights the intensified sea level low pressure center over the Great Plains during October 2007, which is consistent with the jet stream structure (trough to the west and ridge to the east of the US) shown in Figure 3b.
Based on the aforementioned analysis, for October 2007, there are 19 days out of 31 days that are accompanied with favorable wind resource in the Callahan Divide wind farm. In other words, for this specific month, the frequency of occurrence of the synoptic weather patterns favorable to the Southern Plains wind resources is nearly 61%. In order to further quantify how far this frequency is beyond the normal value (or climatological value), we desire to establish the baseline values to be compared against.
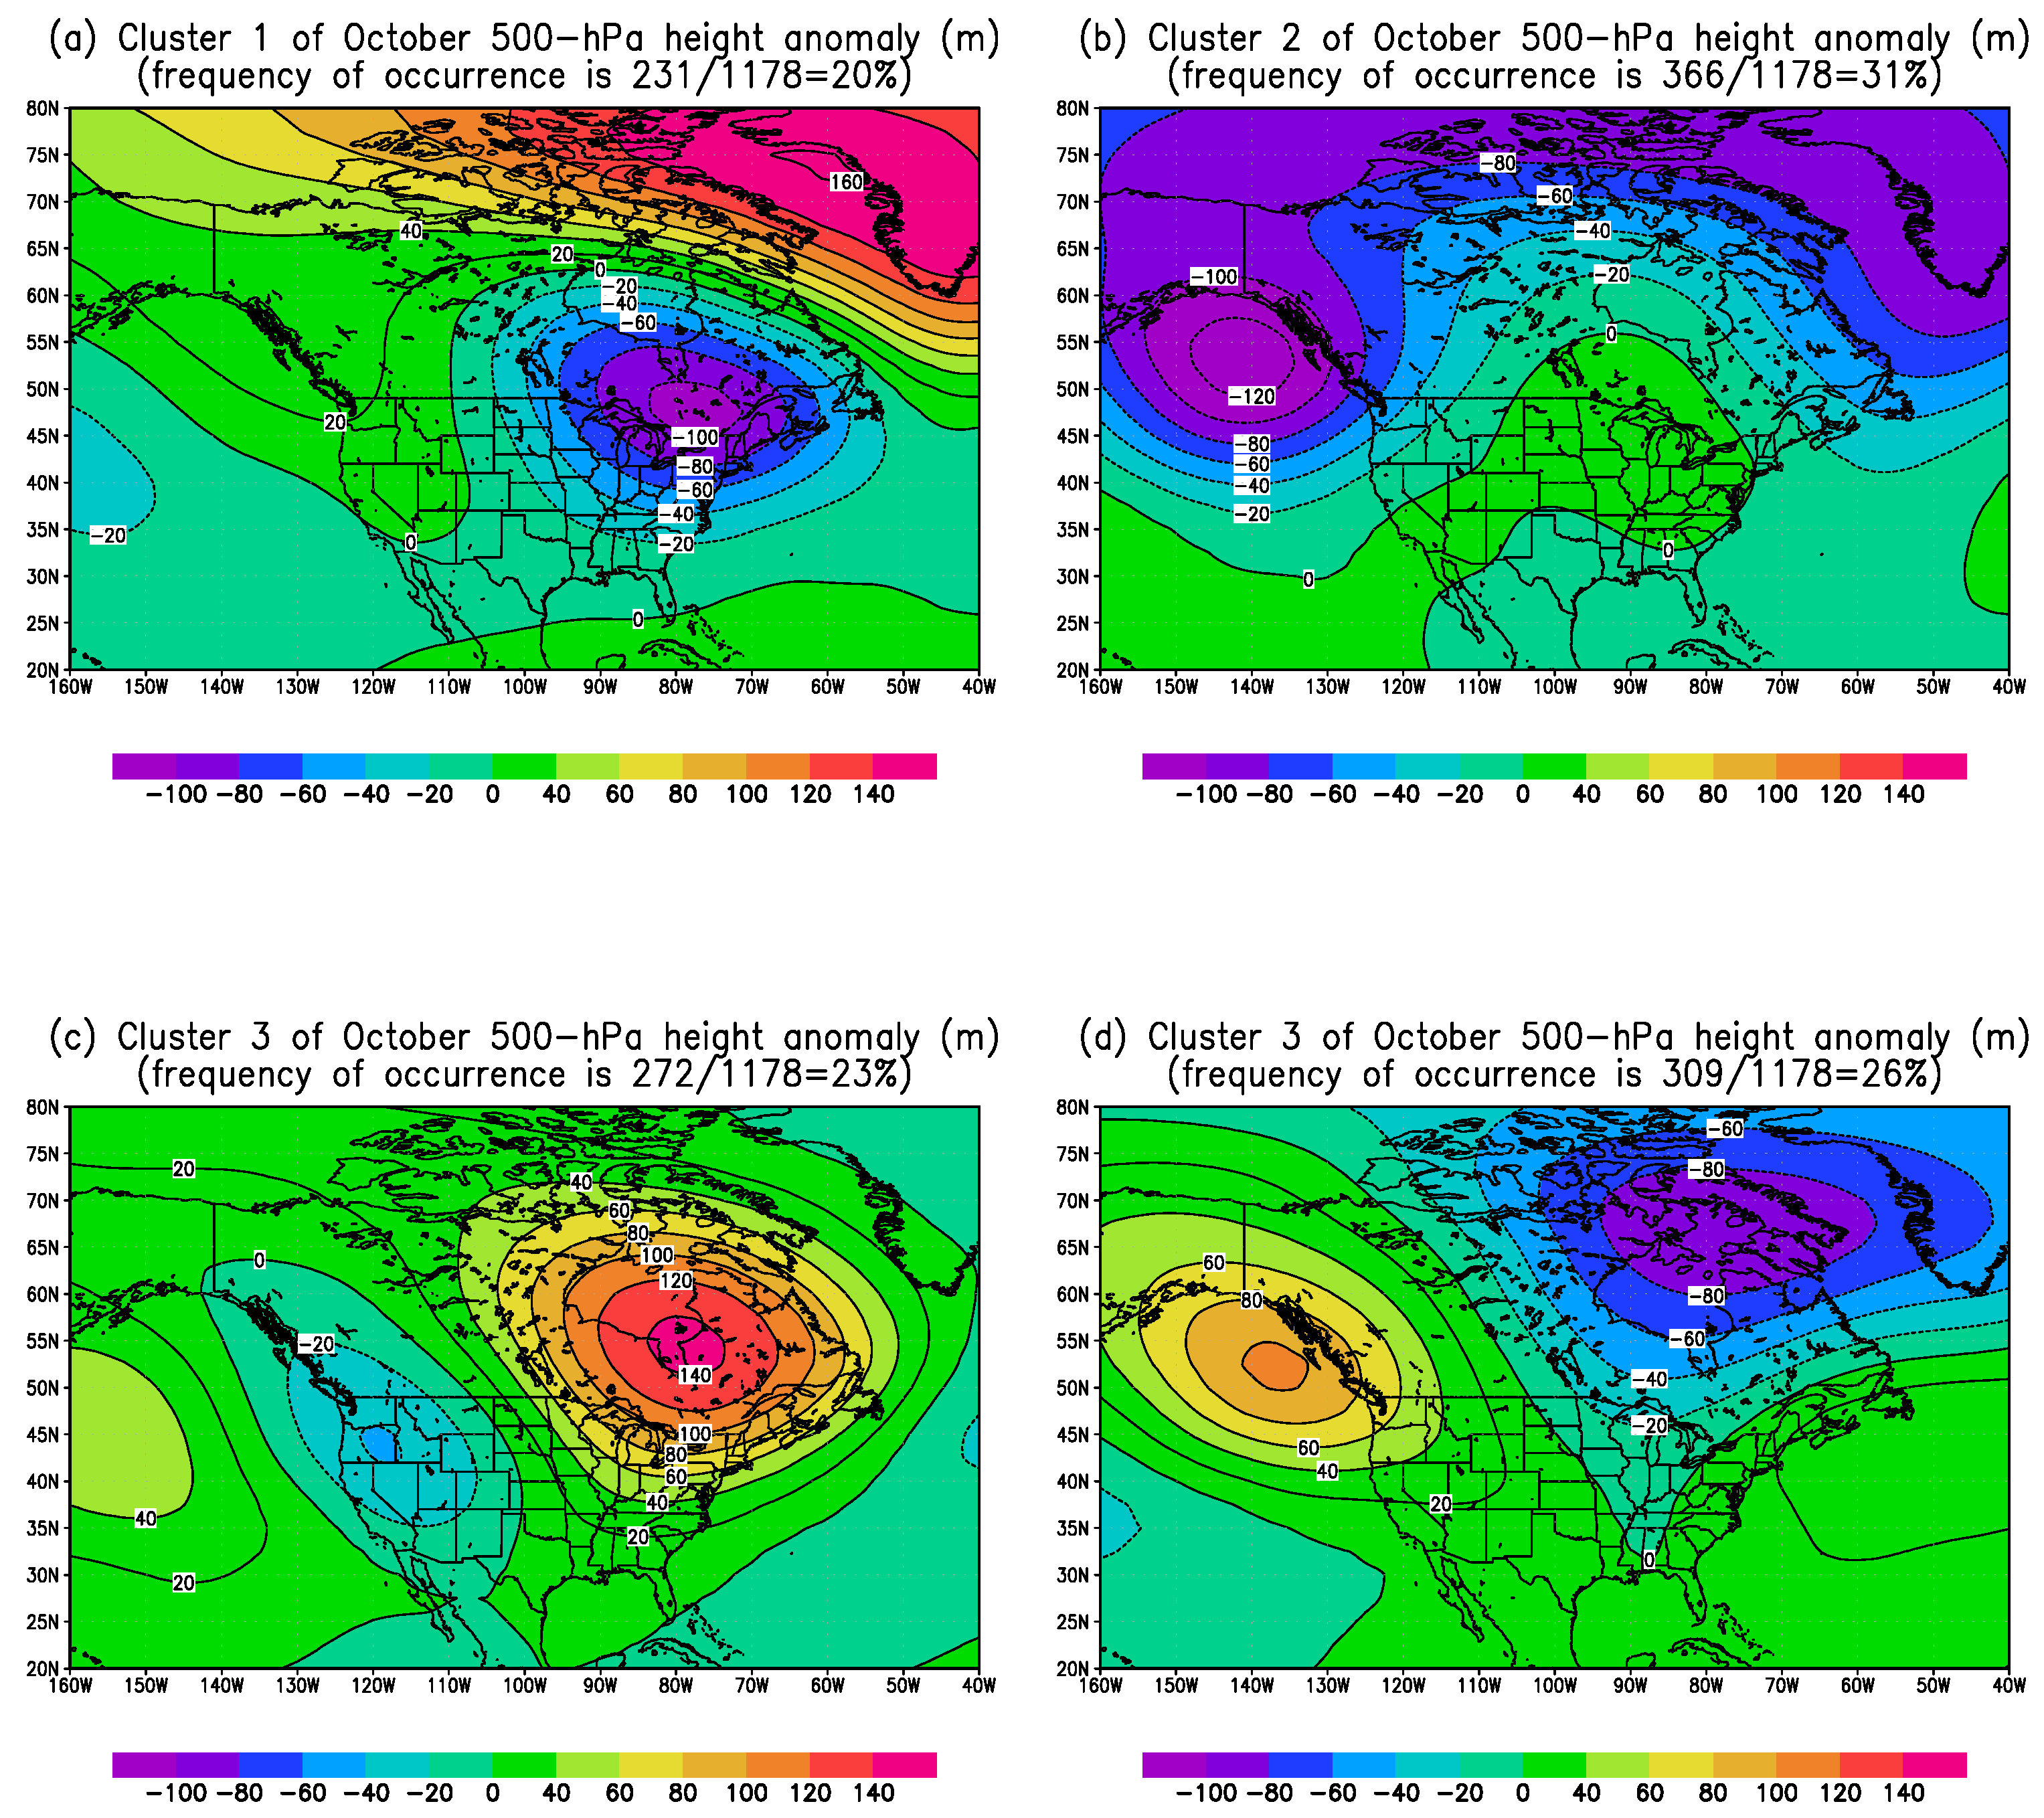
As the large-scale atmospheric circulation is commonly manifested by the mid-level geopotential height field, here we chose to perform the Cluster Analysis upon the daily 500-mb geopotential height of all Octobers during 1979–2016, namely, 1178 daily geopotential height maps at 500 mb. Four clusters of the daily 500-hPa height field for 38 October months are identified by the k-means cluster analysis approach. The standard deviation for each cluster is 1455 m, 1573 m, 1661 m and 1493 m, respectively. This implies that each cluster features similar compactness among its members, in general. In order to make the pattern of weather regimes stand out, Figure 6 displays the composites of each cluster with the long-term mean removed. The frequency of occurrence of each cluster is listed in the subtitles of Figure 6. Cluster 1 features a strong low anomaly over the Northeast of US. Cluster 2 features an anomalous low center over the East Pacific while a weak high pressure center over the US. In cluster 3, a pair of low and high pressure anomaly fields are dominant over the US. In cluster 4, a pair of high and low pressure anomaly fields, opposite to cluster 3, are dominant over the US. Hence, it is readily evident that cluster 3 is the favorable large-scale atmospheric circulation pattern to the wind resources in the Southern Plains of US.
Specifically, cluster 3 is manifested as anomalous low pressure center to the west and high pressure center to the east of US, which remarkably resembles the anomalous pattern over the predefined sub-period (1–8 and 12–22 October 2007) as shown in Figure 4c. The frequency of occurrence of cluster 3 is about 23% (272 days out of 1178 days), which can be interpreted as the baseline frequency, in contrast to the frequency of occurrence of similar patterns for October 2007 being 61% (19 days out of 31 days). This indicates that the marked jet stream of October 2007 takes place at a frequency that is nearly three times of the baseline frequency for the similar jet stream. Therefore, it clearly explains why the excellent wind resources were present in October 2007 at Callahan Divide wind farm.
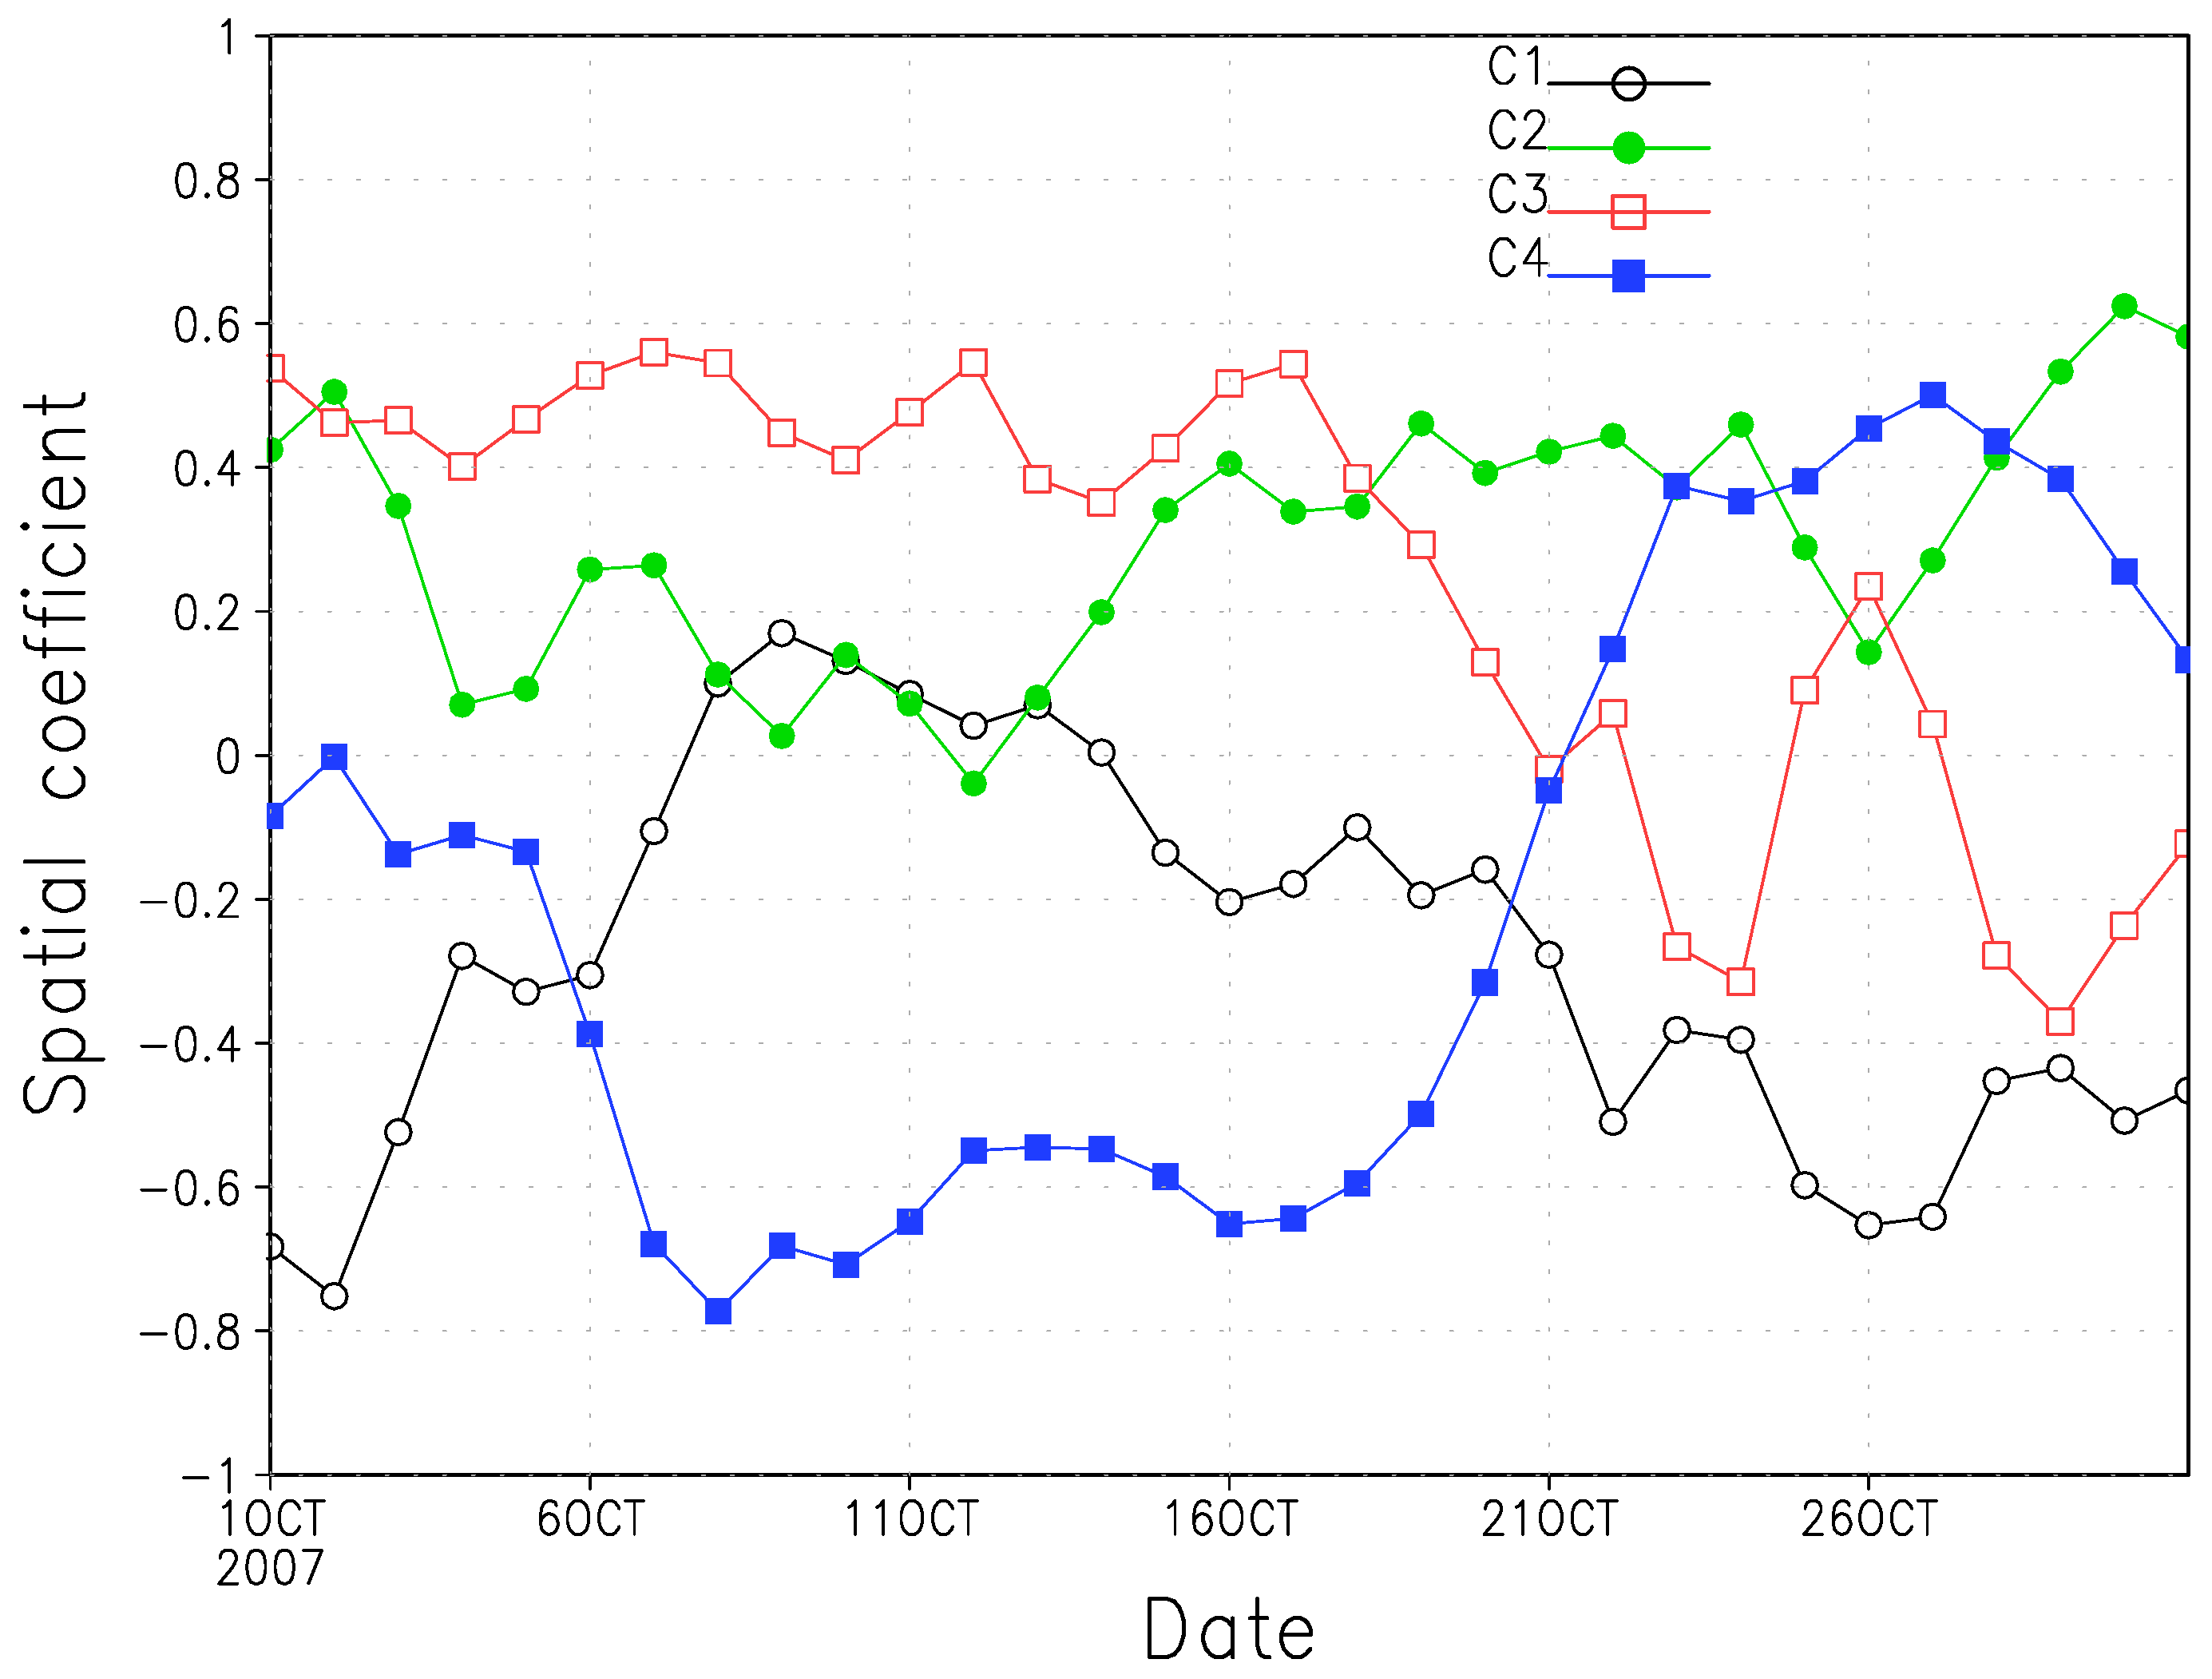
Figure 7 further examines the spatial pattern correlation between each of four clusters and the daily 500-mb height anomaly of October 2007. It confirms the good correlation between cluster 3 and the October 2007 daily 500-mb geopotential height anomaly, especially on the days during the predefined sub-period in October 2007 (1–8 and 12–22 October), with the average spatial pattern correlation being greater than 0.5 for these days. This also validates the selection of the predefined sub-period by the subjective visual inspection of synoptic weather maps.
In addition, the spatial pattern correlation coefficients (not shown) between cluster 3 (favorable patterns to the Southern Plains wind resources) and the daily 500-mb height anomaly of all Octobers during 38 years (1178 days in total) are computed and then areal-averaged over the North America. The result shows that, among the 38 years of October, the October 2007 is ranked top 5% given its number of days featuring fairly good spatial pattern correlation coefficients. Therefore, this serves another evidence that October 2007 is featured with excellent wind resources in the Southern Plains of US.
In summary, based on aforementioned analysis, the identification of primary clusters derived from the upper-level large-scale atmospheric circulation by Cluster Analysis is beneficial to wind resource assessment in the regions of interest in that the frequency of occurrence of certain clusters, favorable to local wind resources, can be used as the baseline to be compared against for assessing the operational wind farm performance in a given month.
3.3. July 2007: An Unfavorable Scenario for Wind Energy Production
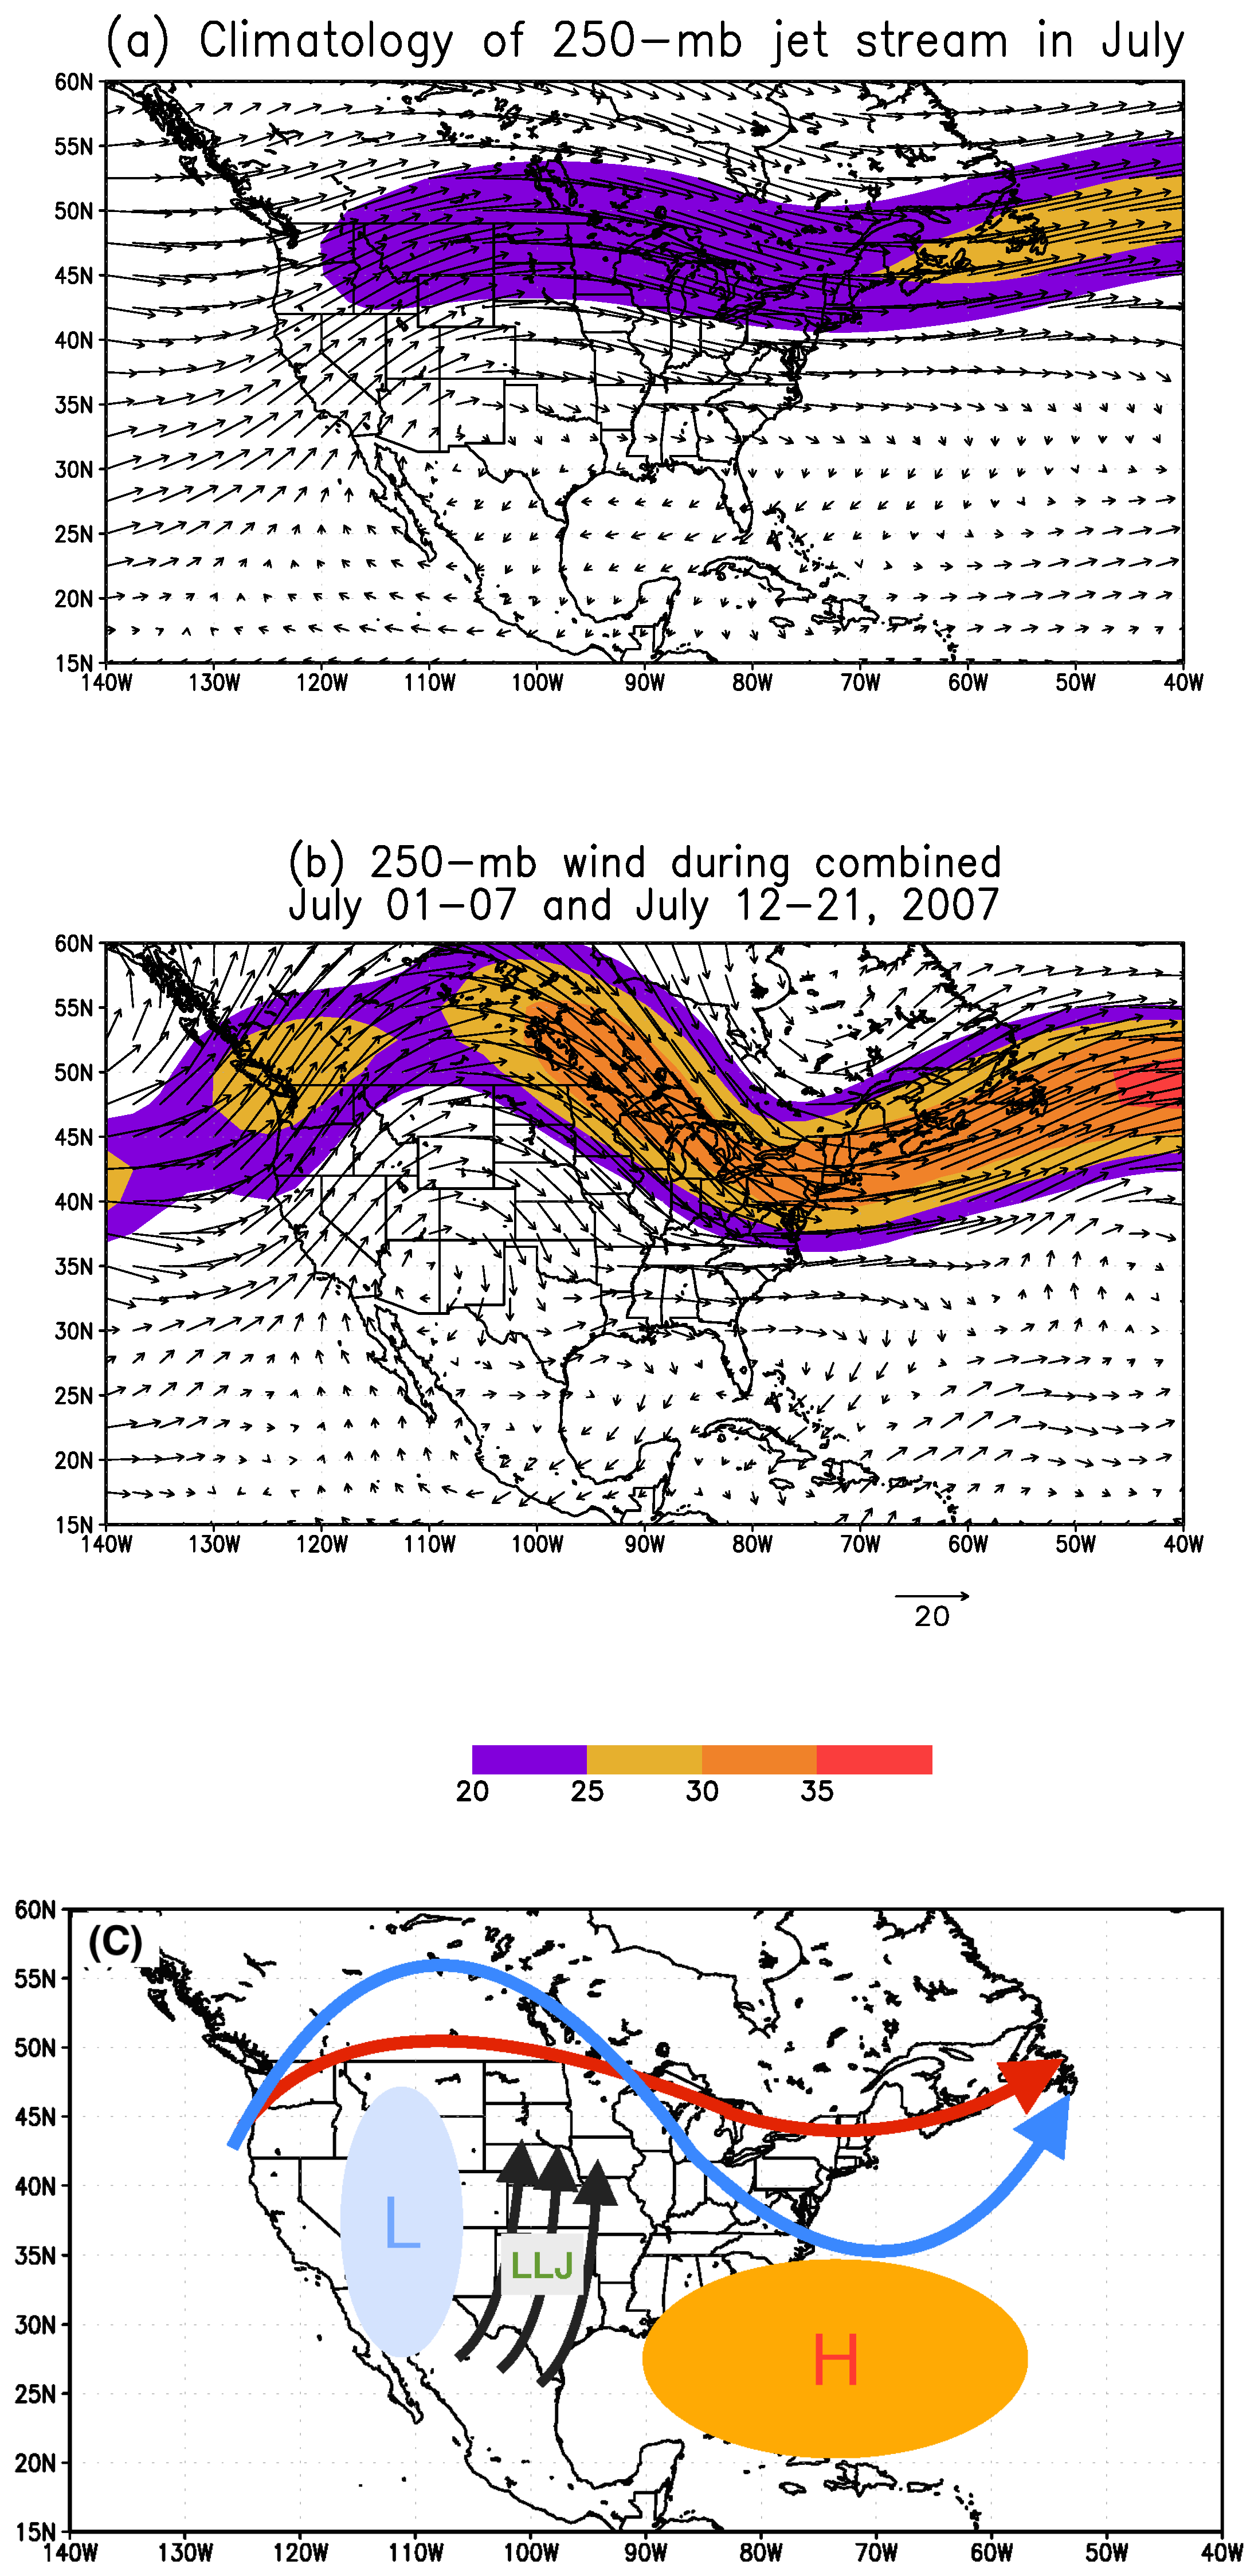
The July 2007 features anomalously low wind energy production in the Callahan Divide wind farm as shown in Figure 2. In particular, it reaches the minimum wind energy production among all months of July from 2007–2016. Figure 8a,b compares the climatological July jet stream and the jet stream of July 2007. As for the climatological July jet stream, it is dominated with northwesterly wind over the Great Plains, but retreats to the north in relative to the October jet stream as shown in Figure 3a. As for the specific jet stream of July 2007, it is manifested as an intensified ridge to the west and deepened trough to the east, in comparison to the climatological July jet stream. In particular, the days during 1–7 July and 12–21 July of 2007 are defined as the sub-period by visual inspection of daily weather maps. These days during this sub-period all feature the similar jet stream structure as shown in Figure 8b.
Figure 8c schematically illustrates the jet streams derived from Figure 8a,b. The red curve represents the climatological one and the blue shows the one of July 2007. It is clear that the jet stream of July 2007 is an amplified version of the climatological jet stream, with a pair of intensified ridge and trough over the domain. In addition, the known surface thermal low pressure (L) over the western US and the Bermuda high pressure (H) over the subtropical Atlantic Ocean are also depicted in this figure. These surface low and high centers are configured such that the strong pressure gradient in between results in the low-level jet, mainly Southwesterly flow, which primarily accounts for the summertime thunderstorms and precipitations over the Great Plains. In addition, the low-level jet is also a decent source of wind energy during the summer time in the Southern Plains. Based on Figure 8c, the deepened trough over the eastern US of July 2007 tends to displace the Bermuda high further south and east such that the pressure gradient in between the L and H centers would decrease which in turns leads to the weakened low-level jet. This explains why the wind resource of July 2007 is poor for Callahan Divide wind farm.
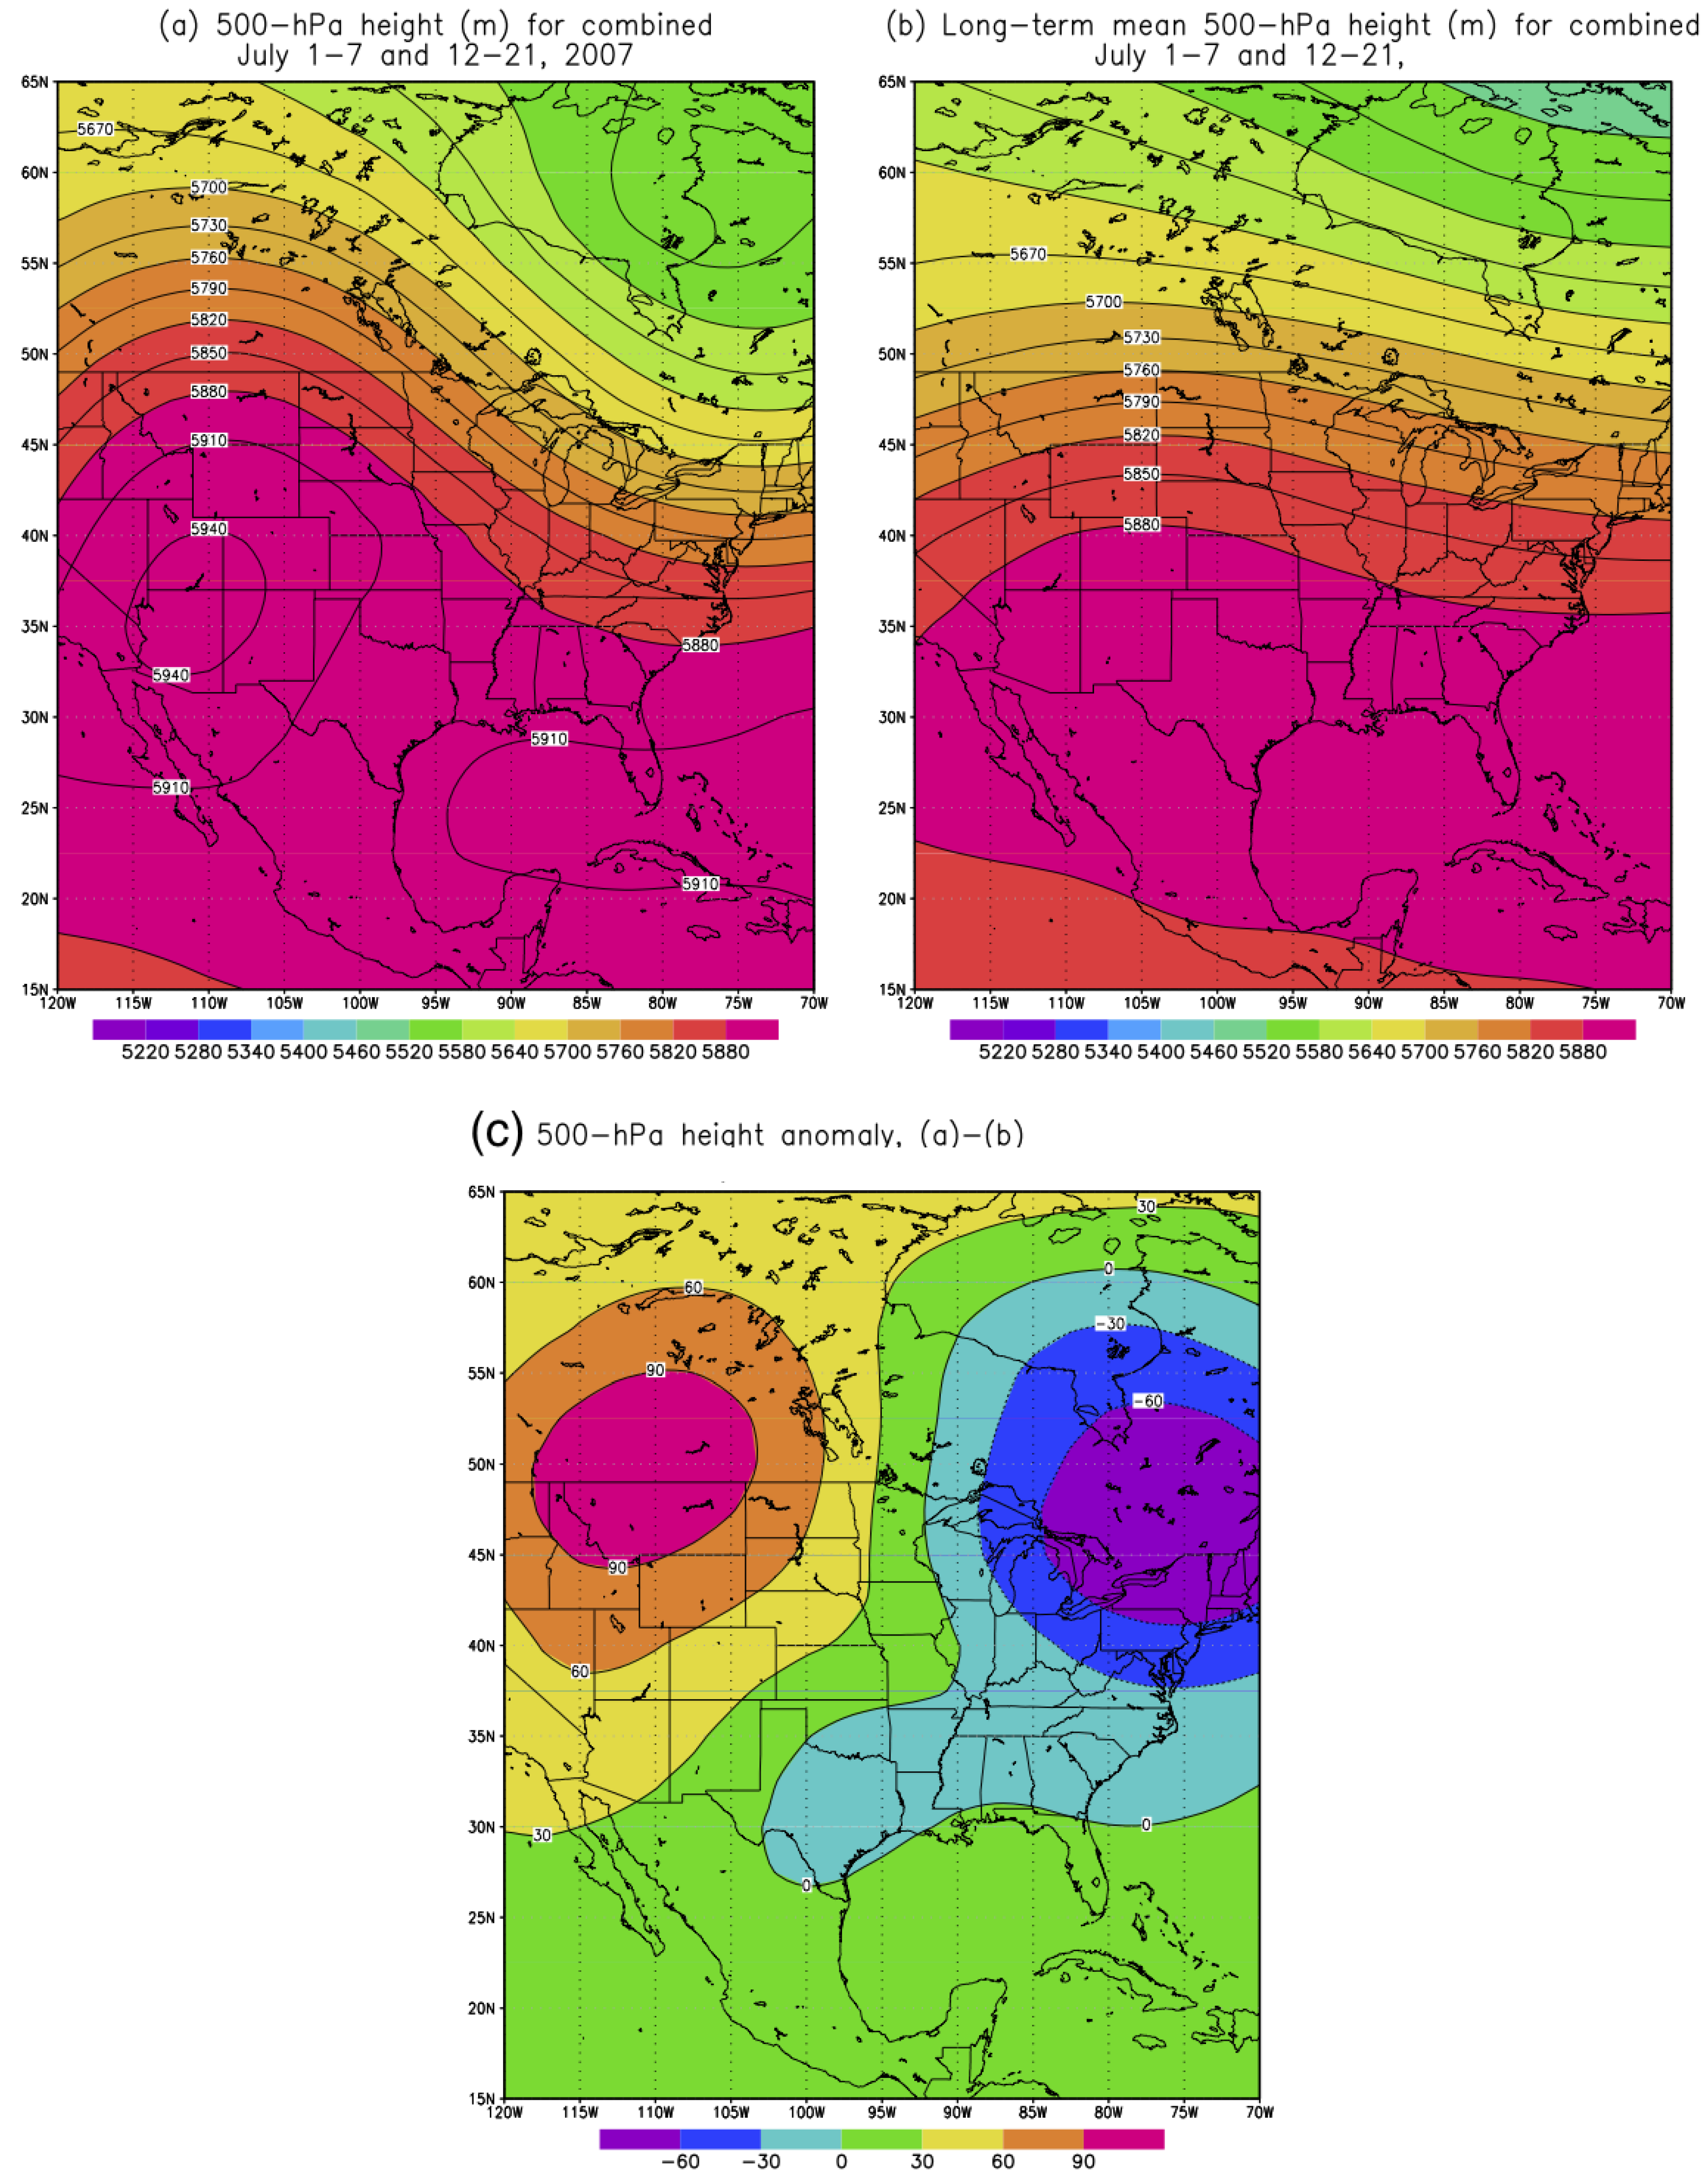
The 500-mb geopotential height for July 2007 over the predefined sub-period, as shown in Figure 9a, is evidently characterized as the amplified ridge and deepened trough over the western and eastern US respectively, in comparison to the climatological July 500-mb height field as shown in Figure 9b. A strong northwesterly flow can be observed over the Great Plains from Figure 9a. Figure 9c shows the anomaly field of 500-mb geopotential heights. Once again, the anomalous high pressure center and low pressure center are readily observed over the western and eastern US, respectively. This configuration is opposite to the surface pressure setting (surface thermal low to the west and Bermuda high to the east) required by the low-level jet. Hence, the July 2007 is associated with poor wind resources in the Southern Plains.
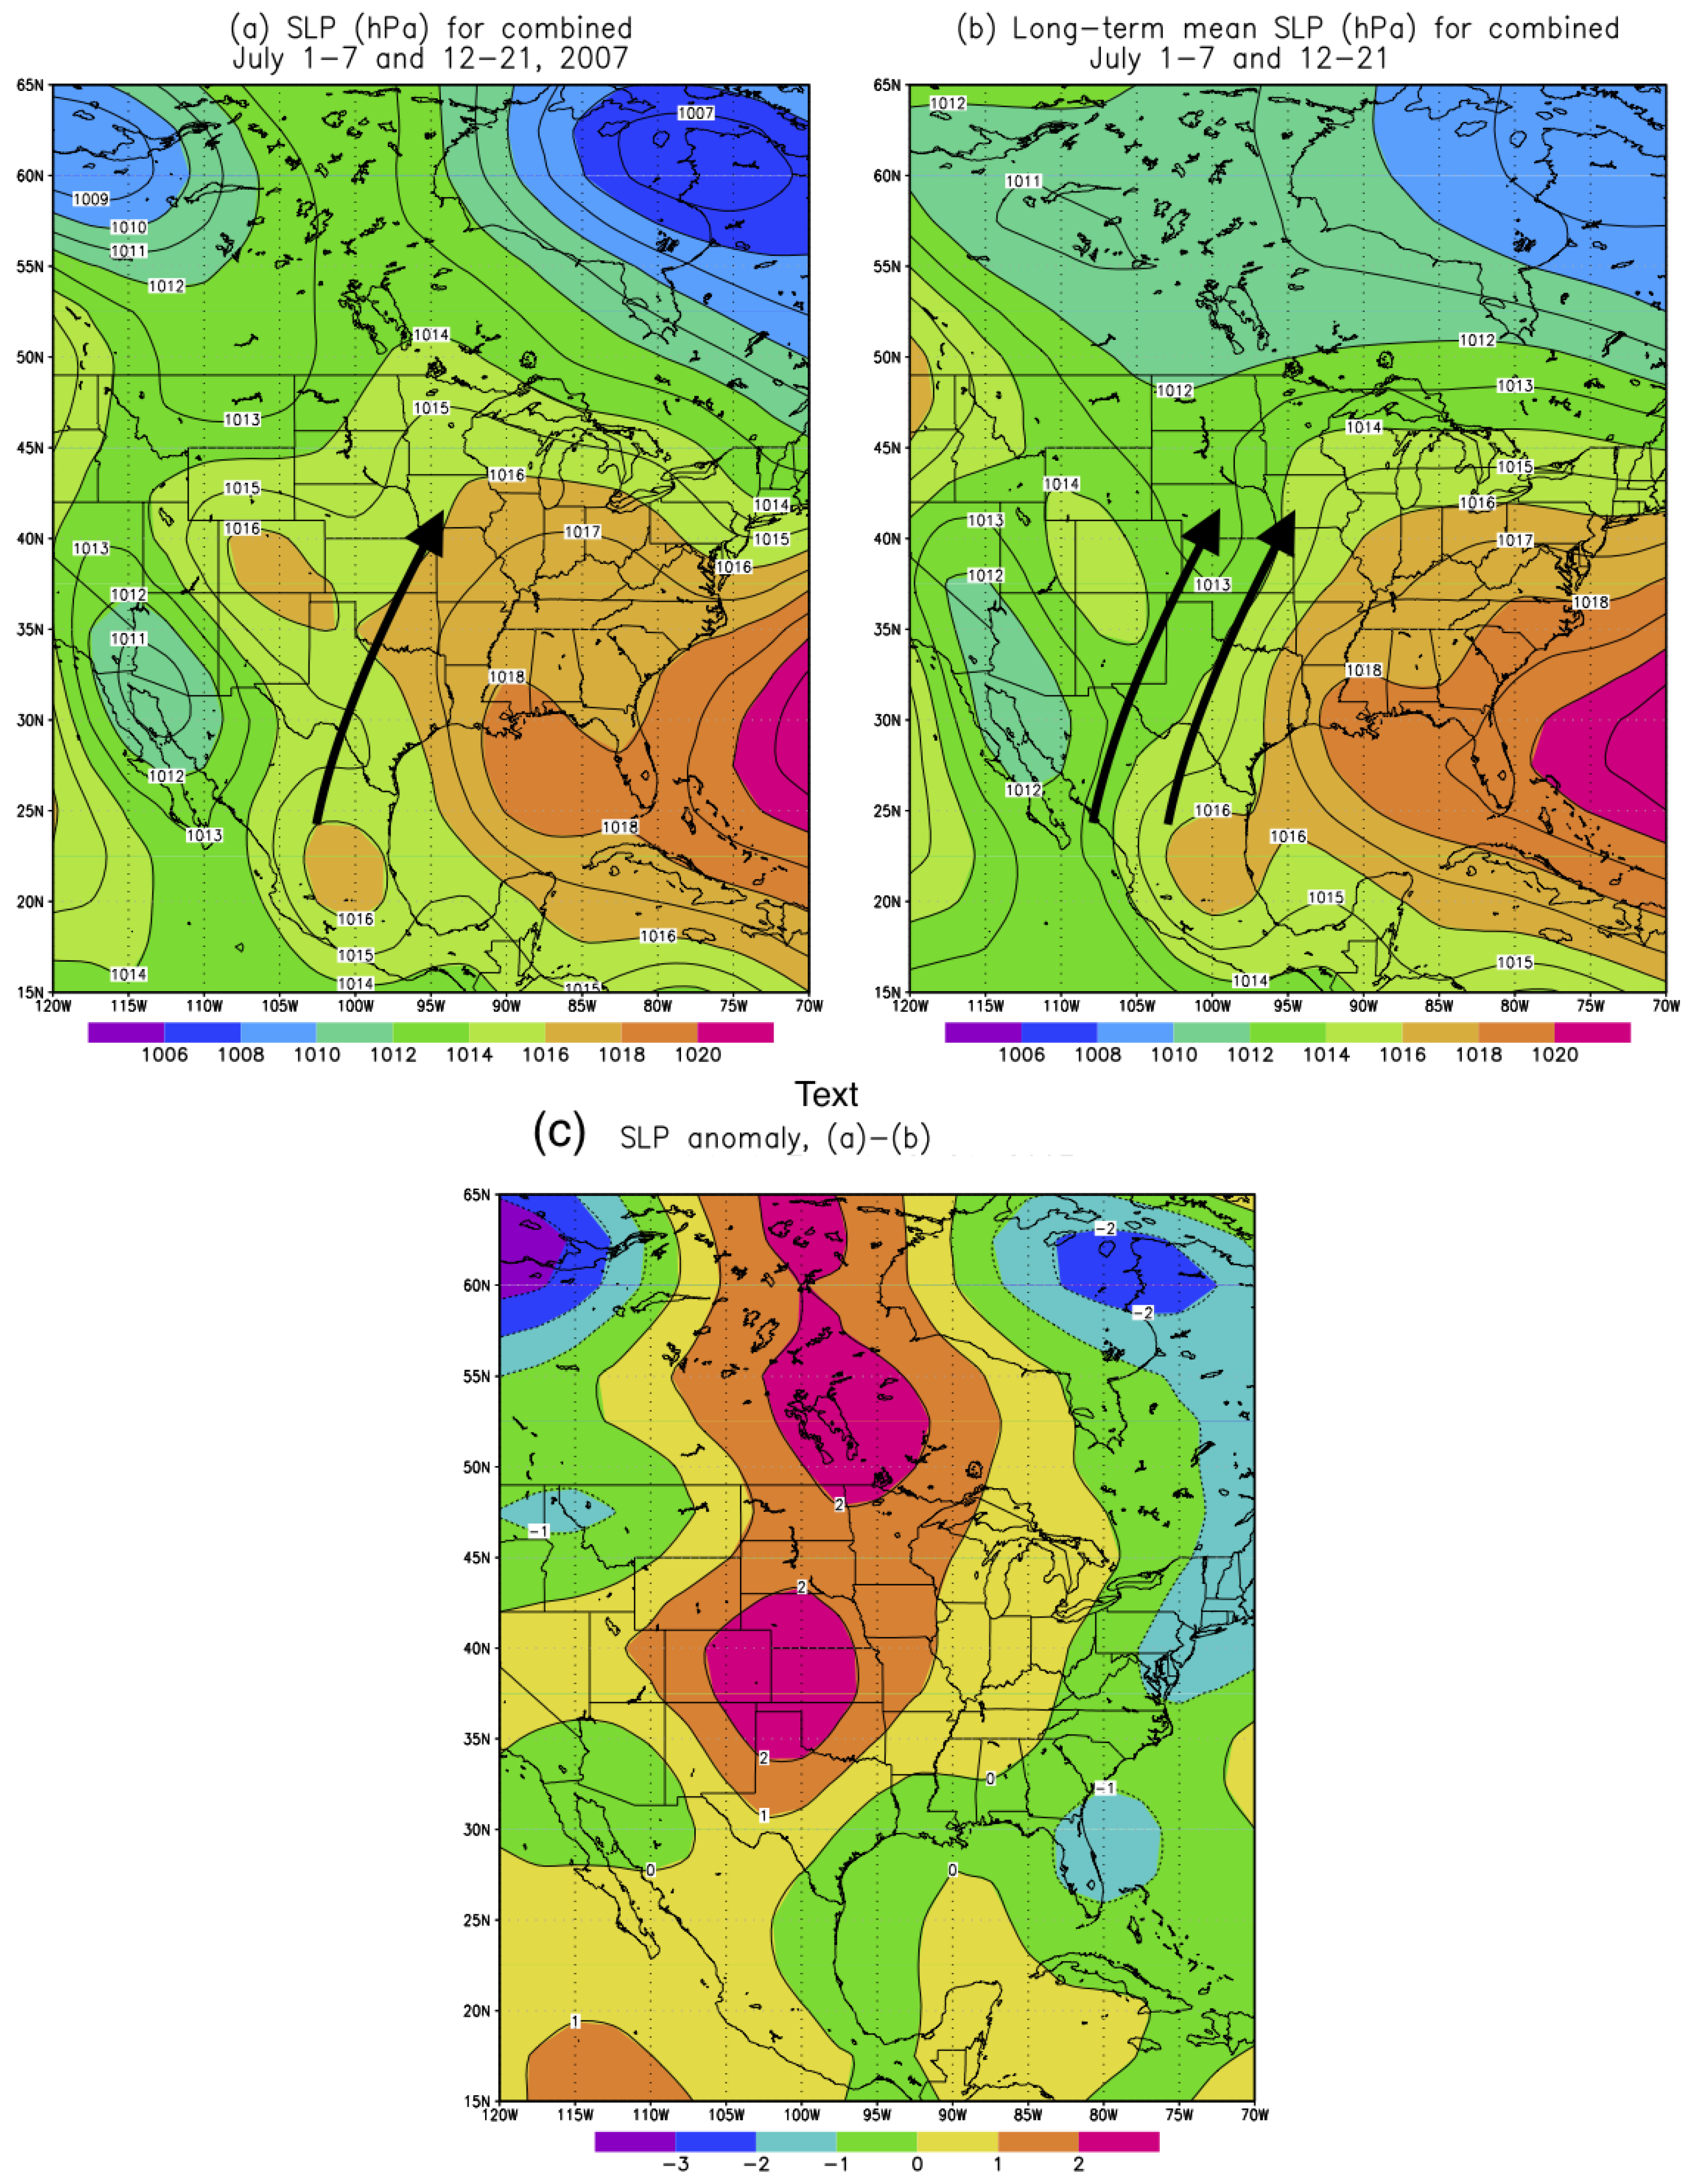
In a similar fashion as Figure 9, Figure 10 presents the sea level pressure comparison between July 2007 and the climatology. Due to the strengthened trough of the July 2007 jet stream, the Bermuda high was displaced to the south and also retreated to the subtropical Atlantic such that the low-level jet between the thermal low pressure and Bermuda high weakens, as depicted by the dark black arrows in Figure 10a,b. The anomaly of sea level pressure shown in Figure 10c highlights the weakened Bermuda high and decreasing intensity of the thermal low pressure center, which is in turn responsible for the reduced low-level jet in between.
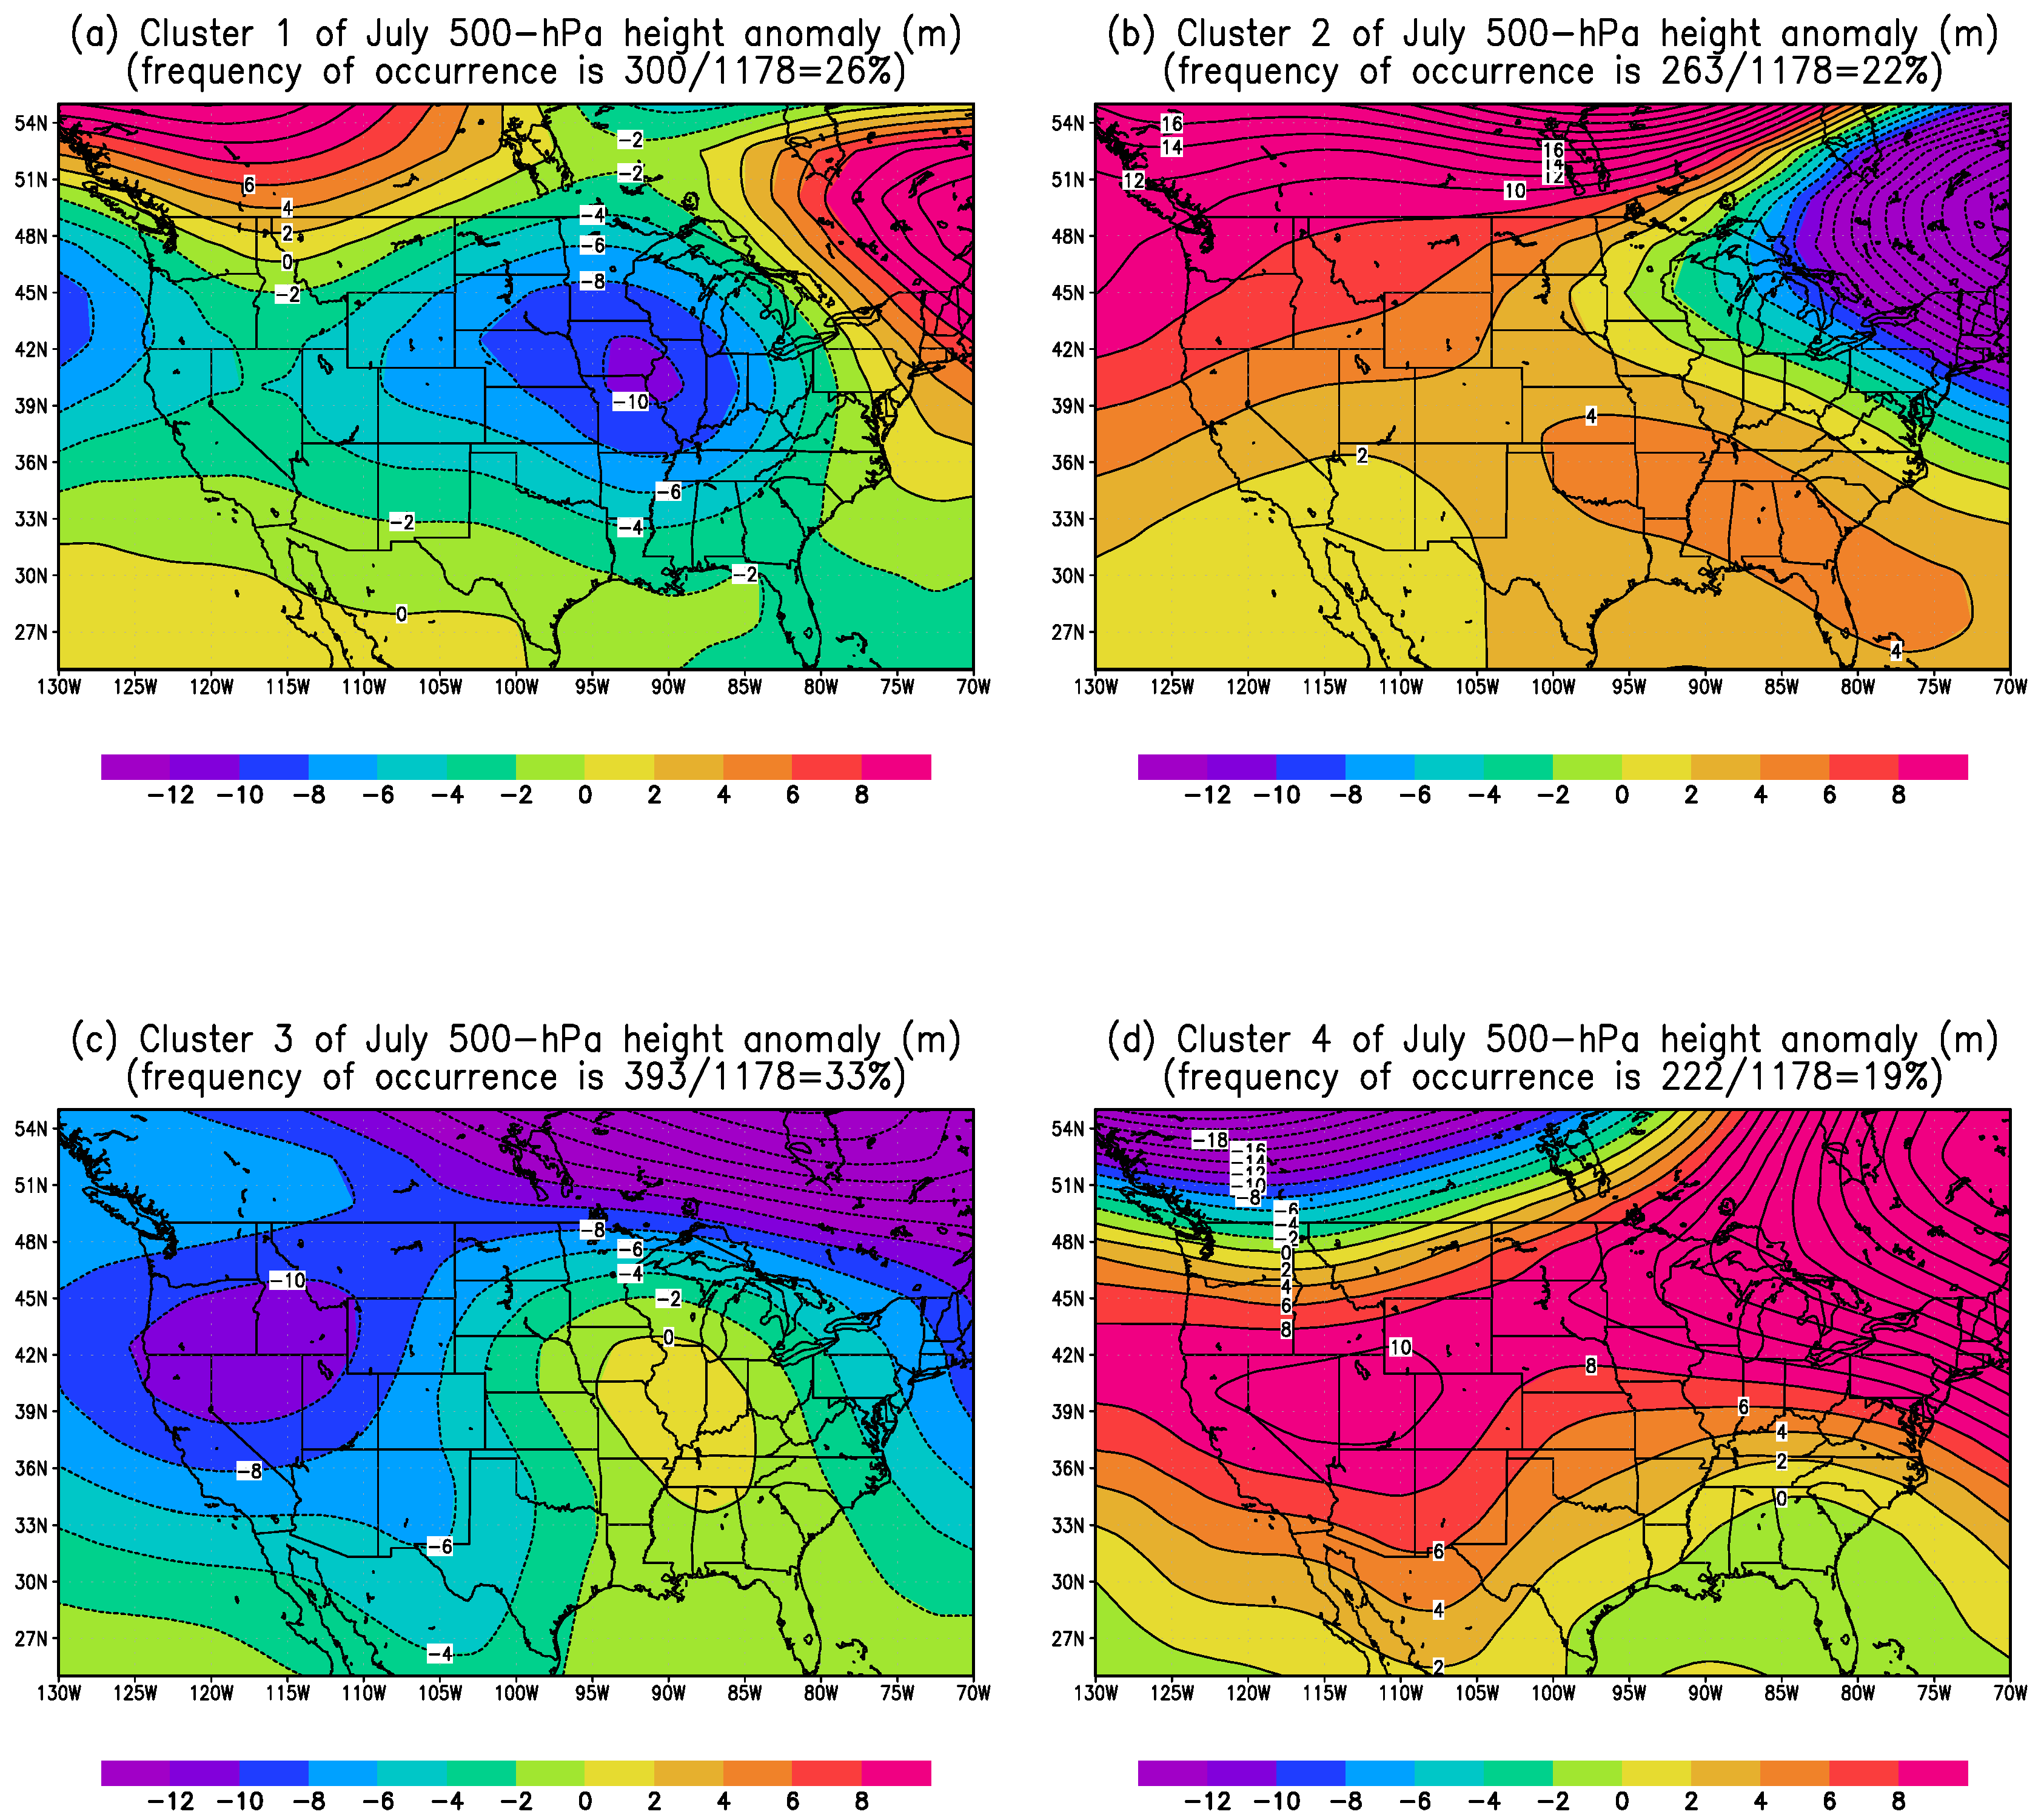
In a similar fashion to the way that clusters were identified for the 38-yr October months, four clusters are derived from daily 500-mb geopotential height of all July months during 1979–2016. The standard deviation of each cluster is 1086 m, 1030 m, 1292 m, and 995 m, respectively. This shows the reasonable compactness within members of each cluster. The compactness of July’s clusters seems to outperform that of the October’s clusters. Nevertheless, it is largely due to a slightly smaller domain being chosen for detecting the July’s clusters, as shown in Figure 11. Weather regimes are generally more prominent and persistent during winter/fall seasons than the summer season. In order to make the relatively weaker weather regimes of July months stand out, we need to slightly zoom in over the North America domain when performing the cluster analysis, in relative to the October’s cluster detection.
The four clusters derived from 38 July months, with the long-term mean removed, are presented in Figure 11. Among the four clusters, cluster 2 resembles the 500-mb height anomaly of July 2007 the most, shown in Figure 9c. For the 2007 July month, there are 17 (the predefined sub-period as 1–7 July and 12–21 July) out of 31 days that features the pair of anomalous high to the west and low to the east pattern at 500 mb, which is equivalent to about 55%. In terms of the frequency of occurrence of cluster 2, it occurs 263 days out of 1178 days, which translates to about 22%. Hence, for the unfavorable upper-level large-scale atmospheric circulation pattern that is primarily responsible for the poor wind resources in the Southern Plains during July 2007, it occurs at more than twice frequency of the long-term baseline derived from cluster 2. This serves a robust evidence that the dominant large-scale atmospheric circulation pattern of July 2007 is the key driver of the poor wind resources in the Southern Plains.
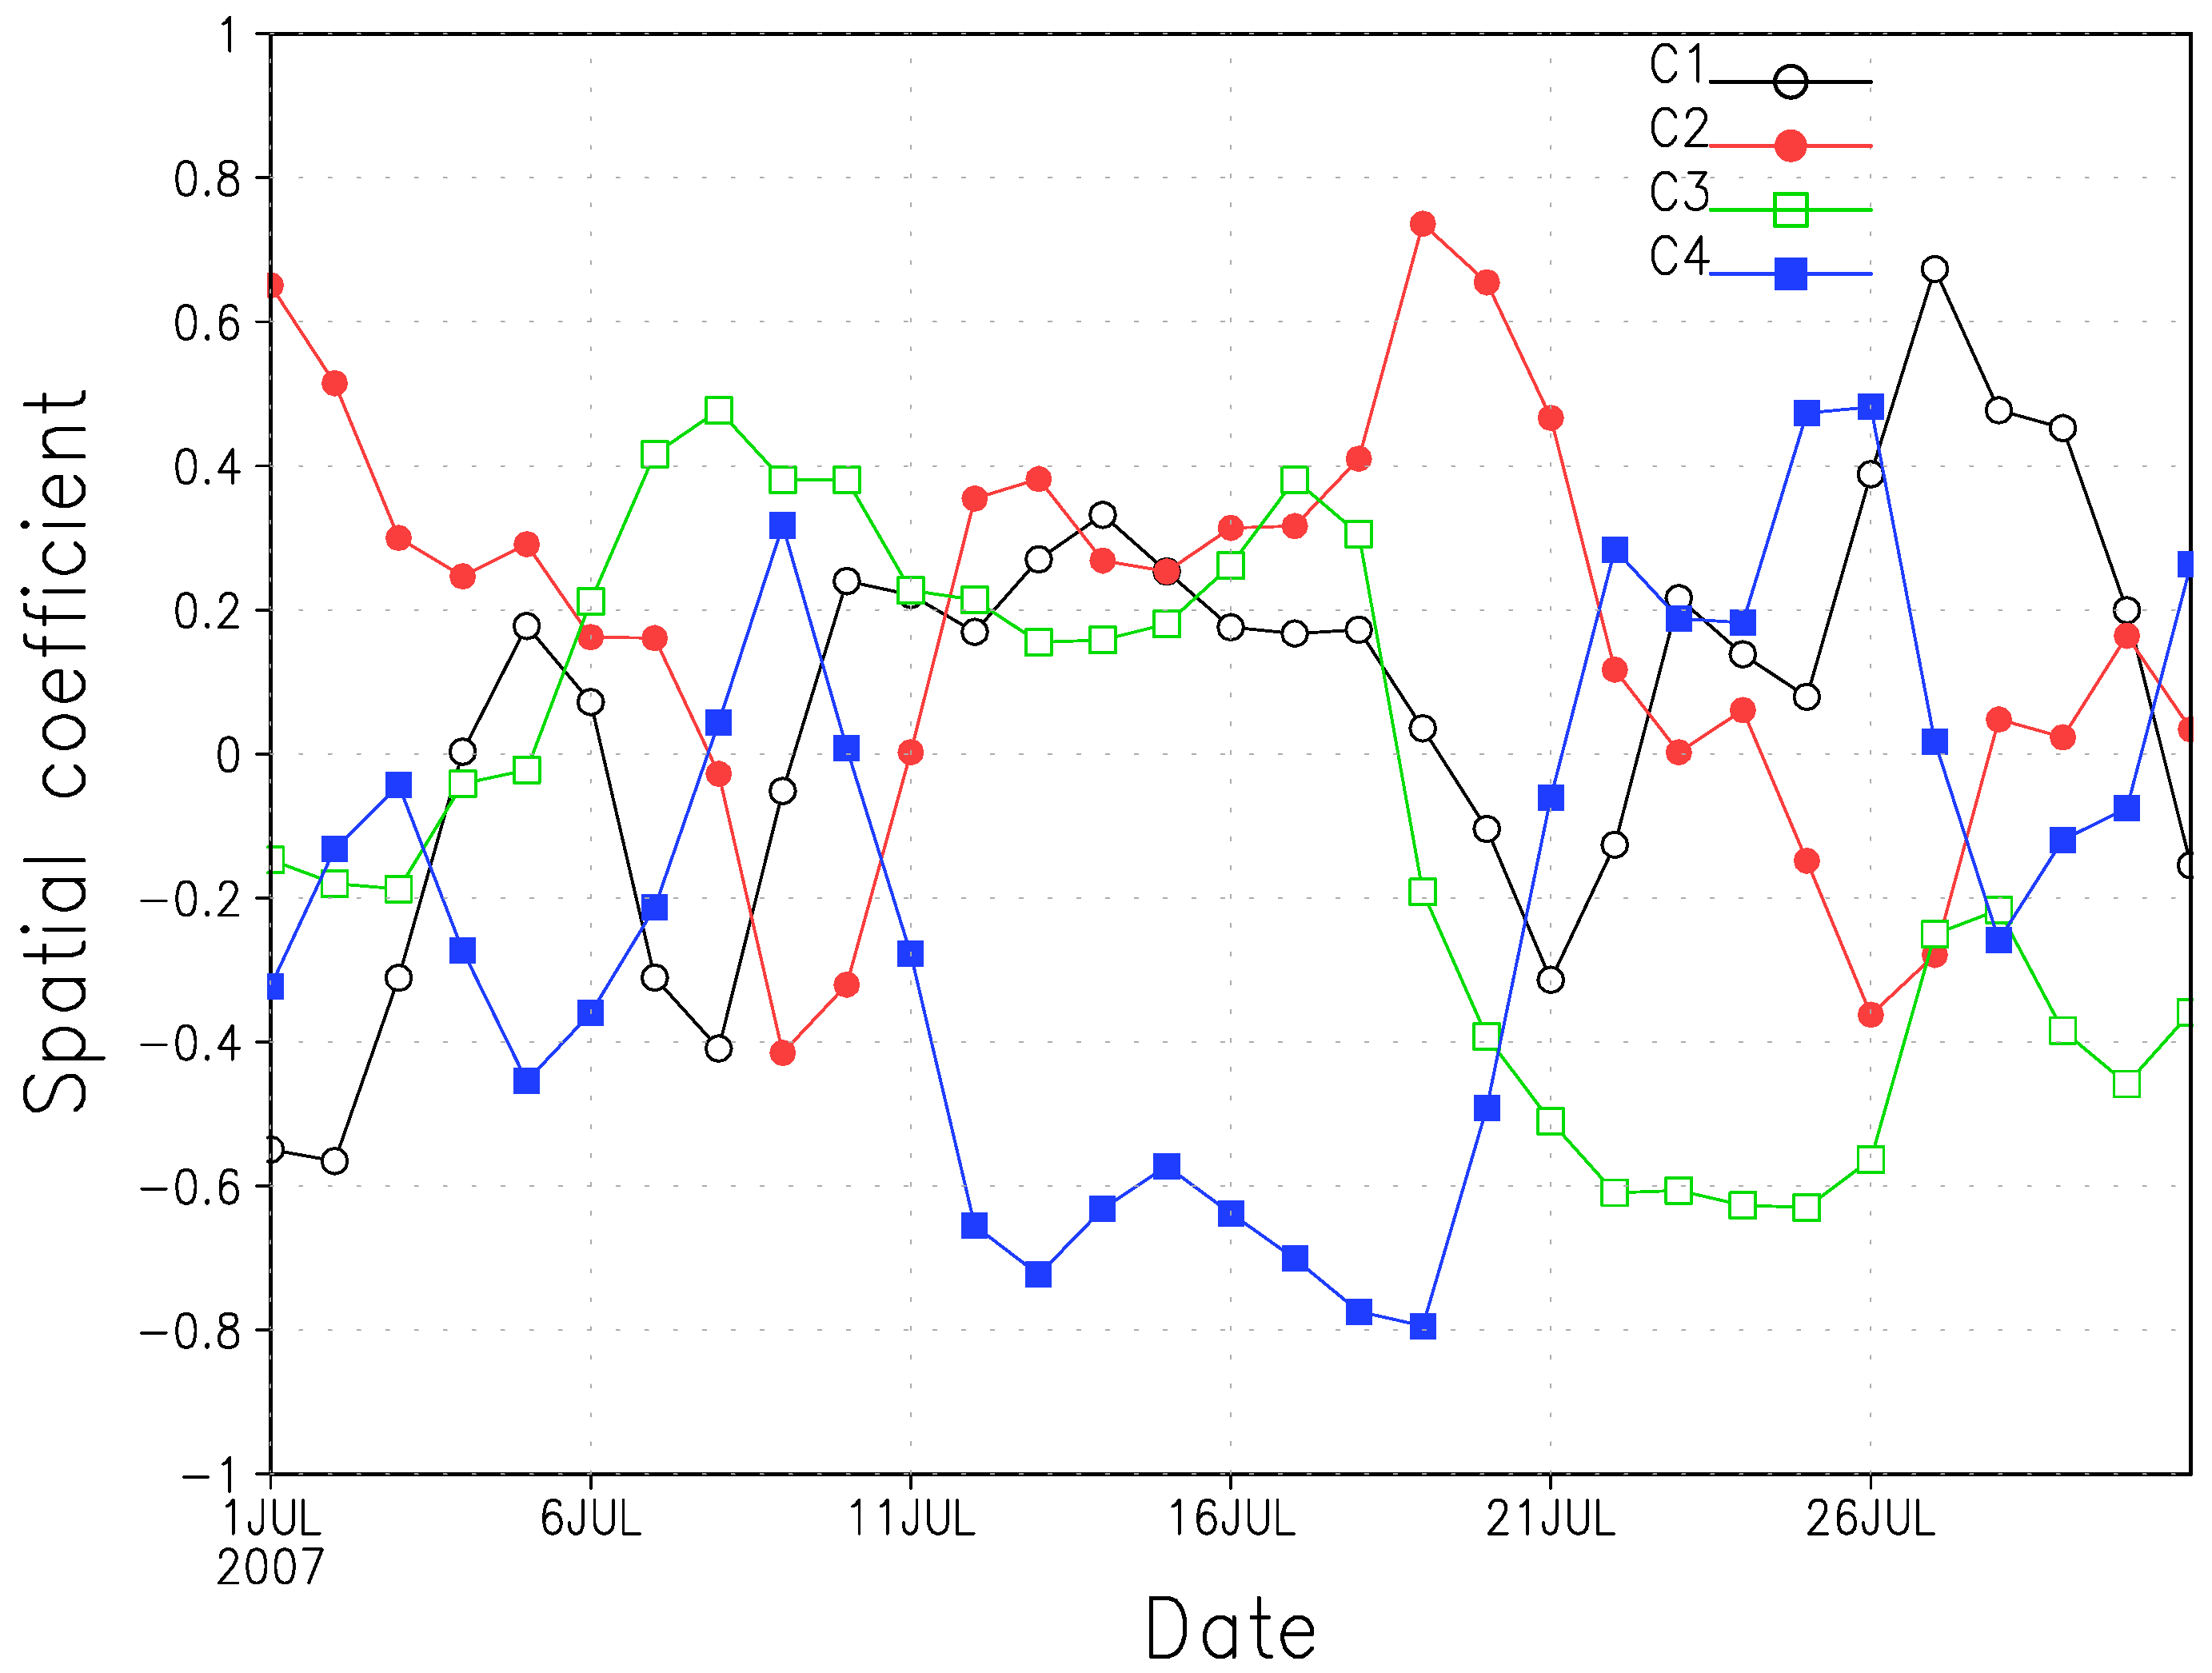
The area-averaged spatial pattern correlation between daily 500-mb height anomaly of July 2007 and the baseline four clusters is examined in Figure 12. Here the areal average is taken over the US domain, which is shown in Figure 11 . In particular, we are focused on the spatial pattern correlation with cluster 2. It is clear that during the predefined sub-period, namely, 1–7 July and 12–21 July, the spatial pattern correlation is generally good, with a temporal average being around 0.5. Thus this serves another evidence that cluster 2 represents the primary large-scale atmospheric circulation pattern that is accountable for the well-below-average wind energy production of Callahan Divide wind farm in July 2007.
In addition, the spatial pattern correlation coefficients (not shown) between cluster 2 and the daily 500-mb height anomaly of all July months during 38 years are also computed and then areal-averaged over the US domain. It is found that the July 2007 is ranked high given the number of days featuring fairly good spatial pattern correlation with cluster 2.
4. Conclusions and Discussion
Wind resource assessment is a vital process for the wind farm development as well as for the operational wind farm performance assessment. Possible operational factors affecting the wind farm performance can be detected through characterizing the wind resource departure from the norm. On top of the existing approach of subjectively inspecting weather maps associated with various wind resource, we are intended to improve wind resource assessment by integrating an objective approach which establishes a climatological frequency of occurrence of large-scale atmospheric circulation patterns (or weather regimes) responsible for wind resources. The k-means cluster analysis is performed upon the NCEP-NCAR daily reanalysis data during 1979–2016 such that clusters associated with dominant weather regimes are detected. These clusters can be used to assist with wind resource assessment by quantifying the baseline frequency of the large-scale atmospheric circulation patterns such that the degree to which the local wind resource departs from the baseline value can be determined.
In this study, we chose the Callahan Divide Wind Energy Center of Texas as the study site in the Southern Plains of the US. Two scenarios featuring favorable (October 2007) and unfavorable (July 2007) wind energy production in the Southern Plains are examined in details. For the month of October 2007, the primary jet stream enhances the low-level jet over the Southern Plains which in turn favors the wind energy production in the Callahan Divide wind farm. The frequency of occurrence of the favorable weather pattern to the Callahan Divide wind energy production performance is nearly three times higher than that of the long-term value. In contrast, the July 2007 features well-below-average wind energy production due to the anomalous jet stream which is the amplified version of the climatological summer jet stream. In consequence, the weakened low-level jet is resulted over the Southern Plains leading to the poor wind energy production in Callahan Divide. The dominant weather pattern of July 2007 is found to occur more than twice often as the climatological counterpart.
In summary, compared to the previous approach of wind resource assessment which involves subjectively inspecting daily weather maps, the new approach presented here provides an objective way to perform wind resource assessment. In addition, the new approach is more efficient than the old one in that the clustering process can be automated by programs. Nevertheless, it is important to note that the old approach is not completely discarded by the new approach. Instead, the new approach is a two-stage process which integrates the stage of subjectively inspecting weather maps as the first step. The second step is the automation of clustering. Hence, the new approach presented in this study is proven to make the entire process of wind resource assessment more efficient and complete.
In the present study, even though cluster analysis is only conducted upon the October and July months, as the demonstration of wind resource assessment for two opposite scenarios, the same process can be repeated among other months (not shown) as well in order to establish the baseline frequency values for these months.
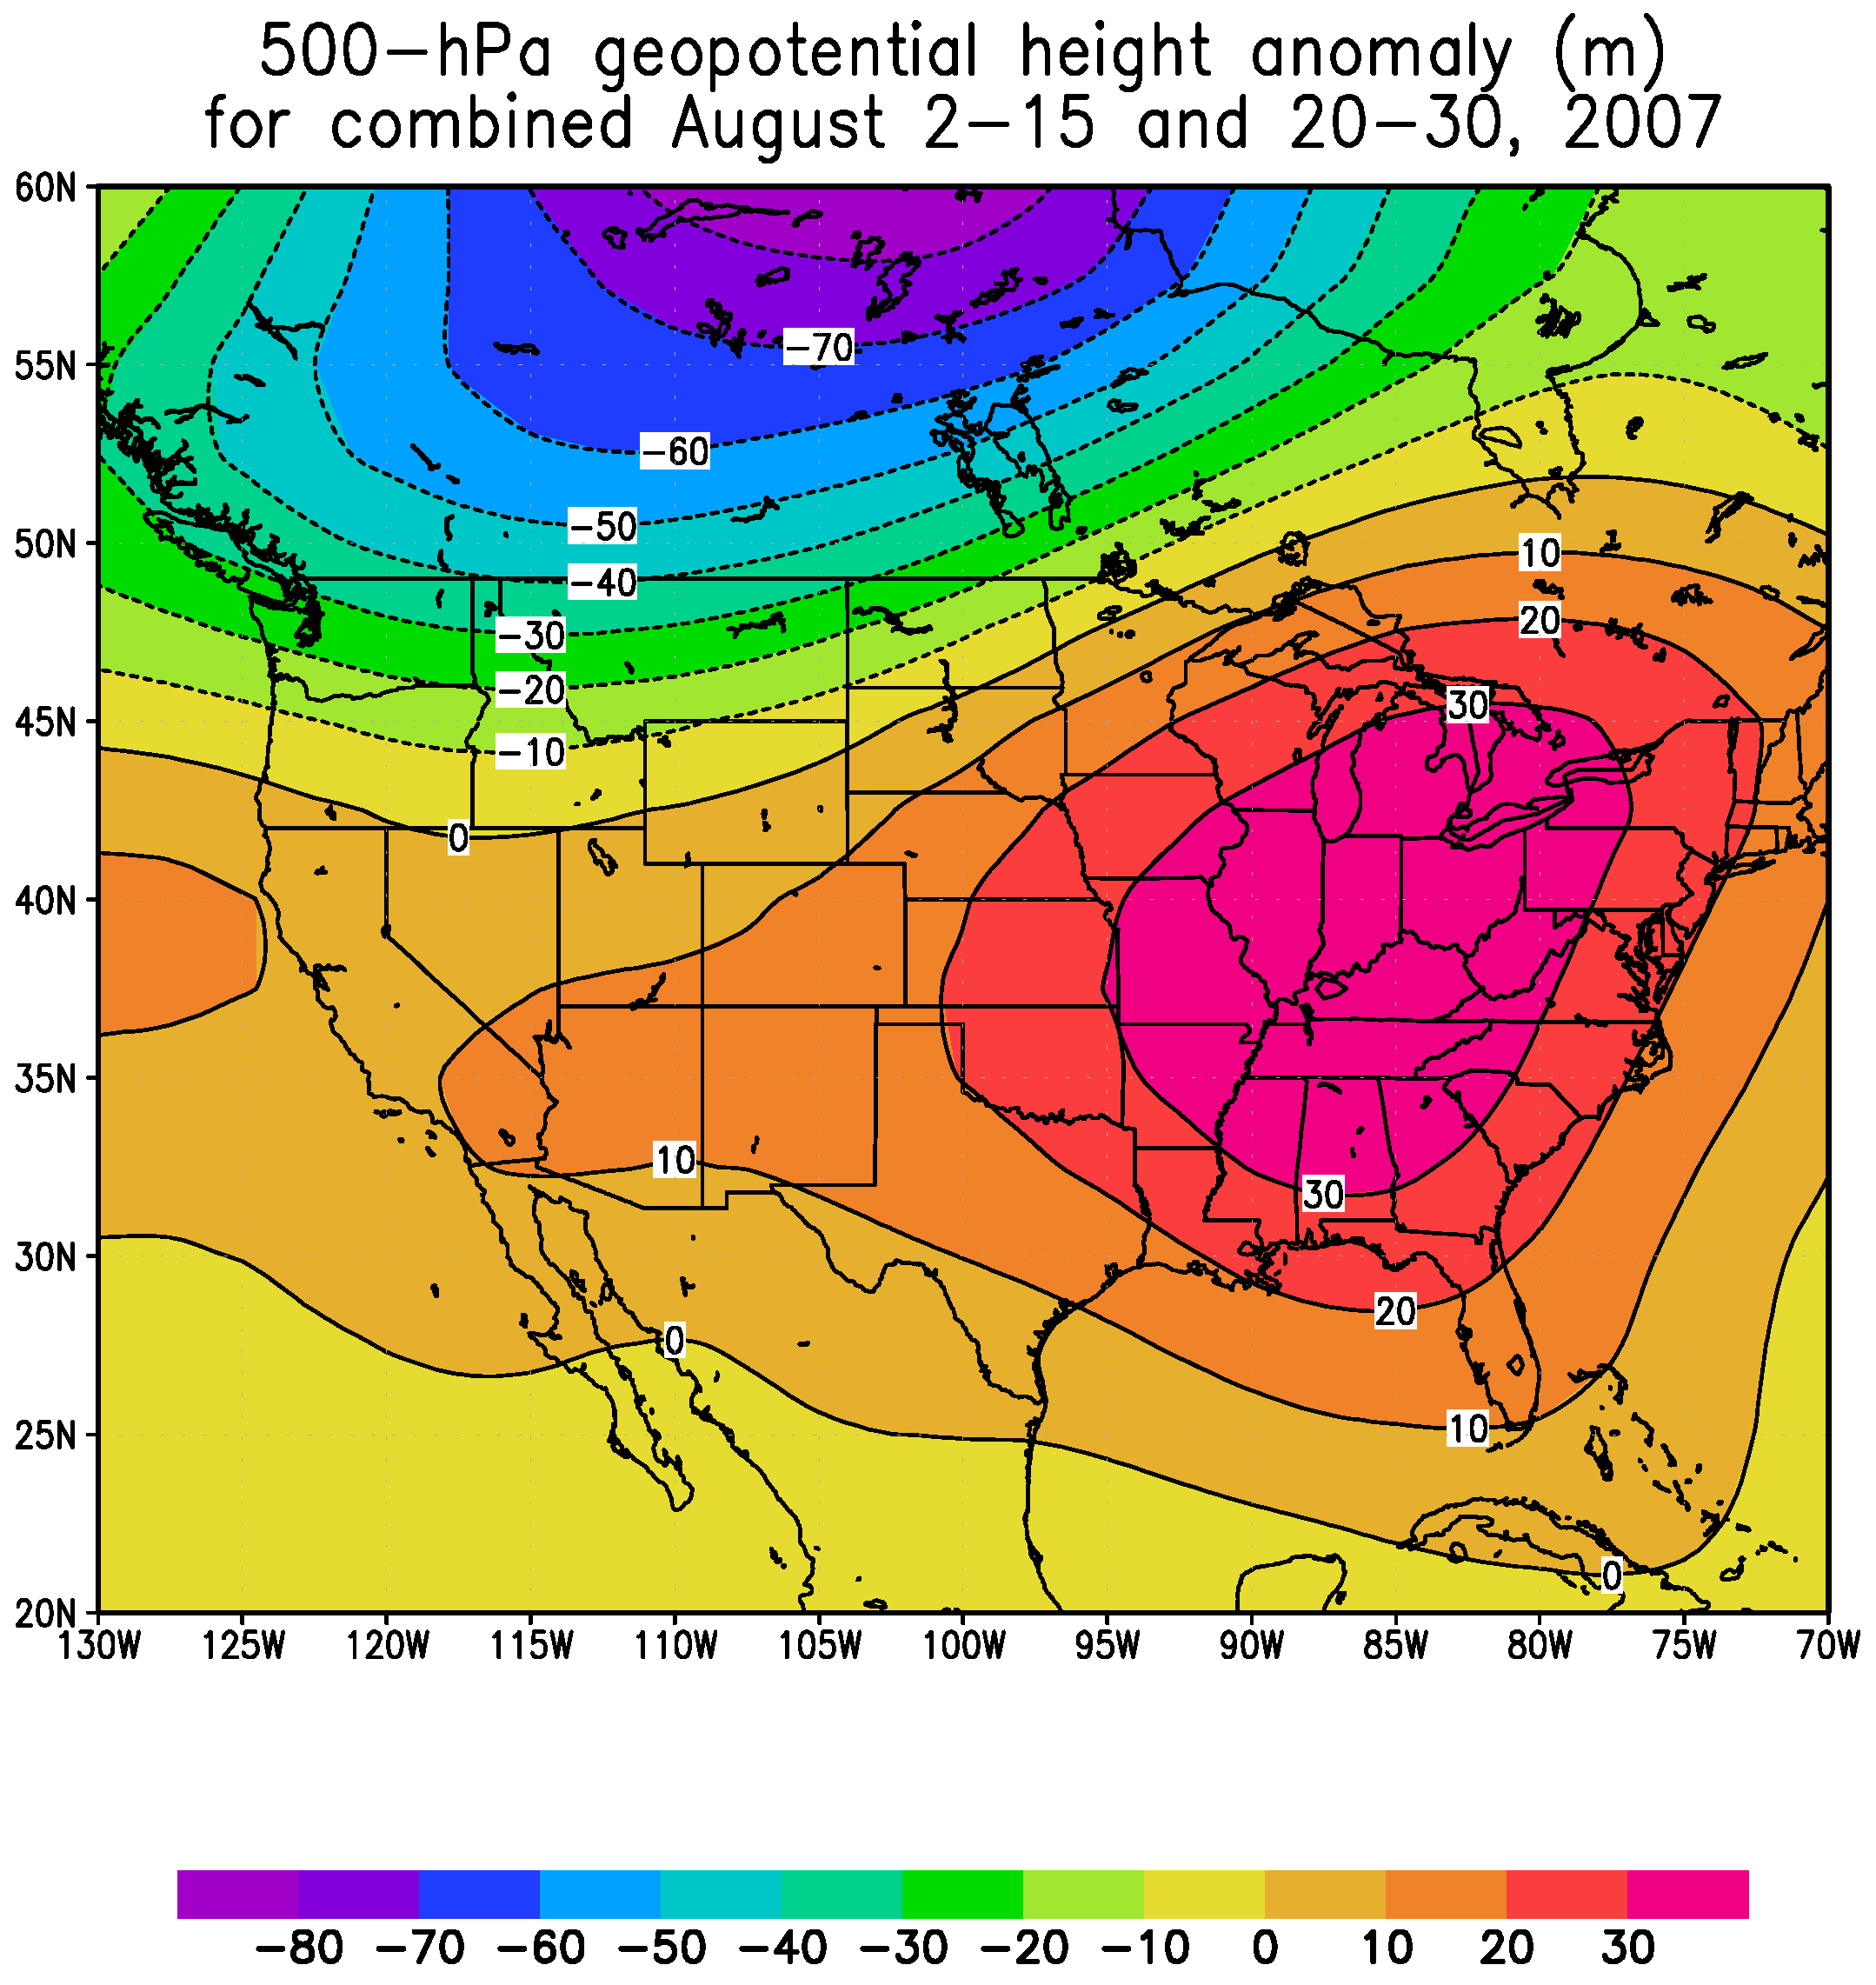
It is noticeable that July and August 2007 feature two extremes of wind energy production in Callahan Divide Energy Center, as shown in Figure 2, with July 2007 reaching the bottom of the Whisker-box while August 2007 reaching the top. Inspection upon the major clusters derived for August months shows that they are in close resemblance to those of July months. Further synoptic analysis of August 2007 indicates that about 25 out of 31 days during August 2007 are characterized with the anomalous 500-mb height pattern as shown in Figure 13. This pattern features high spatial correlation coefficients with cluster 3 among clusters of July months shown in Figure 11, over the sub-periods of 2–15 August and 20–30 August 2007. This cluster is also largely coincident with cluster 3 of October months as shown in Figure 6, with a low pressure anomaly dominant over the Western US and high pressure anomaly over the Eastern US. In other words, 25 out of 31 days (81%) during August 2007 are associated with intensified trough over the Western US and amplified ridge over the Eastern US such that the southwesterly over the Southern Plains is greatly strengthened under this configuration and thus excellent wind production is resulted. Simply speaking, in a very similar manner to the October 2007 case, the outstanding wind energy production in Callahan Divide Energy Center during August 2007 is primarily resulted from the favorable jet stream pattern. The comparison between July and August 2007 wind energy performance demonstrates a perfect example where the large-scale atmospheric circulation is the ultimate driver for various wind resources.
With lots of attention being drawn to the impact of global warming, we are curious about how much weather regimes could be altered by global warming. In addition to using the NCEP-NCAR daily reanalysis data between 1979–2016, we have also tested the period of 1979–2007 for cluster detection. The preliminary results show that the patterns of clusters detected from these two sets of long-term reanalysis data resemble each other very closely. In terms of intensity comparison, quantitative discrepancy is observed in some of these detected clusters. For instance, given cluster 3 (favorable to wind production in Southern Plains) detected from October months, the anomalous low center over the Western US is found to be somehow weakened for reanalysis during 1979–2016, in comparison to 1979–2007, whereas the anomalous high center to the East is found to be largely intact between two reanalysis periods. In terms of frequency of occurrence of clusters, small differences are found between clusters detected by two sets of reanalysis data. For instance, for cluster 3 of October months, the frequency of occurrence increases from 21% to 23% whereas for cluster 2 (unfavorable to wind production in Southern Plains) of July months it decreases from 26% to 22%. Hence, further analysis is guaranteed for identifying the underlying mechanisms responsible for this alteration in weather regimes due to climate change.
Given weather regimes of the summer season are weaker and less persistent than the winter and fall seasons, one limitation of the current approach for wind resource assessment is that it is relatively less effective in quantifying the summer wind resources. In other words, there could be times when none of the detected clusters correlates well with the dominant weather pattern of a specific summer month. In that case, additional analysis is required to further classify and quantify the prevailing weather pattern of this specific summer month.
In the present study, the initial seed selection of k-means clustering is carried out by using random seeding for the purpose of simplicity and efficiency. In order to ensure the repeatability and reproducibility of the clustering results, the k-means algorithm is performed over the long-term daily data multiple times. Due to the robustness of the detected weather regimes, the centroids of each identified cluster agree fairly well among these multiple runs. Nevertheless, different choice of initial cluster centers, in particular for those that are far away from the final cluster centers, could result in different clustering results, as k-means algorithm always tends to optimize the cost function. Hence, for the future work, the initial seed selection of k-means is desired to be implemented during the clustering process.
Furthermore, as for the future work, the artificial neural networks (ANN) is planed to classify the large-scale atmospheric circulation, and then be compared against the results with those derived with k-means Cluster Analysis. In particular, we are interested in using the Self-organizing Map (SOM) for cluster analysis. The SOM approach can be used in determining clusters by learning to recognize regularities and correlations between inputs vectors.
Acknowledgments
The author is grateful to the US Energy Information Administration for providing the wind energy production data in Callahan Divide Wind Energy Center.
Conflicts of Interest
The author declares no conflict of interest.
References
- Bradshaw, D.J.; Troccoli, A.; Fordham, R.; Methven, J. The impact of large scale atmospheric circulation patterns on wind power generation and its potential predictability: A case study over the UK. Renew. Energy 2011, 36, 2087–2096. [Google Scholar] [CrossRef]
- Thornton, H.E.; Scaife, A.A.; Hoskins, B.J.; Brayshaw, D.J. The relationship between wind powder, electricity demand and winter weather patterns in Great Britain. Environ. Res. Lett. 2017, 12, 1–10. [Google Scholar] [CrossRef]
- Jerez, S.; Trigo, R.M.; Vicente-Serrano, S.M.; Pozo-Vazquez, D.; Lorente-Plazas, R.; Lorenzo-Lacruz, J.; Santos-Alamillos, F.; Montaves, J.P. The impact of the North Atlantic Oscillation on renewable energy resources in southwestern Europe. J. Appl. Meteorol. Climatol. 2013, 52, 2204–2225. [Google Scholar] [CrossRef]
- Bonner, W.D. Climatology of the low-level jet. Mon. Weather Rev. 1968, 96, 833–850. [Google Scholar] [CrossRef]
- Bonner, W.D.; Paegle, J. Diurnal variations in the boundary layer winds over the south-central United States in summer. Mon. Weather Rev. 1970, 98, 735–744. [Google Scholar] [CrossRef]
- Higgins, R.W.; Yao, Y.; Yarosh, E.S.; Janowiak, J.E.; Mo, K.C. Influence of the Great Plains low-level jet on summertime precipitation and moisture transport over the central United States. J. Clim. 1997, 10, 481–507. [Google Scholar] [CrossRef]
- Hoecker, W.J. Three southerly low-level jet systems delineated by the Weather Burean special pibal network of 1961. Mon. Weather Rev. 1963, 91, 573–582. [Google Scholar] [CrossRef]
- Izumi, Y.; Barad, M.L. Wind and temperature variations during development of a low-level jet. J. Appl. Meteorol. Climatol. 1963, 2, 668–673. [Google Scholar] [CrossRef]
- Mitchell, M.J.; Arritt, R.A.; Labas, K. A climatology of the warm season Great Plains low-level jet using wind profiler observations. Weather Forecast. 1995, 10, 576–591. [Google Scholar] [CrossRef]
- Mo, K.; Ghil, M. Cluster analysis of multiple planetary flow regimes. J. Geophys. Res. 1988, 93, 10927–10952. [Google Scholar] [CrossRef]
- Christiansen, B. Atmospheric circulation regimes: Can cluster analysis provide the number? J. Clim. 2007, 20, 2229–2250. [Google Scholar] [CrossRef]
- Darby, L. Cluster analysis of surface winds in Houston, Texas, and the impact of wind patterns on ozone. J. Appl. Meteorol. Climatol. 2005, 44, 1788–1806. [Google Scholar] [CrossRef]
- Kaufmann, P.; Whiteman, C.D. Cluster-analysis classification of wintertime wind patterns in the Grand Canyon region. J. Appl. Meteorol. Climatol. 1999, 38, 1131–1147. [Google Scholar] [CrossRef]
- Cooter, E.J.; Swall, J.; Gilliam, R. Comparison of 700-hPa NCEP-R1 and AMIP-R2 wind patterns over the continental United States using cluster analysis. J. Appl. Meteorol. Climatol. 2007, 46, 1744–1758. [Google Scholar] [CrossRef]
- Beaver, S.; Palazoglu, A. Cluster analysis of hourly wind measurements to reveal synoptic regimes affecting air quality. J. Appl. Meteorol. Climatol. 2006, 45, 1710–1726. [Google Scholar] [CrossRef]
- Jimenez, P.; Gonzalez-Rouco, J.; Montavez, J.; Garcia-Bustamante, E.; Navarro, J. Climatology of wind patterns in the northeast of the Iberian Peninsula. Int. J. Climatol. 2009, 29, 501–525. [Google Scholar] [CrossRef]
- Cheng, X.; Wallace, J.M. Cluster analysis of the Northern Hemisphere wintertime 500-hPa height field: Spatial patterns. J. Atmos. Sci. 1993, 116, 2674–2696. [Google Scholar] [CrossRef]
- Kalkstein, L.S.; Tan, G.; Skindlov, J.A. An evaluation of three clustering procedures for use in synoptic climatological classification. J. Appl. Meteorol. Climatol. 1987, 26, 717–730. [Google Scholar] [CrossRef]
- Fovell, R.G.; Fovell, M. Climate zones of the conterminous United States defined using cluster analysis. J. Clim. 1993, 6, 2103–2135. [Google Scholar] [CrossRef]
- Straus, D.M.; Molteni, F. Circulation regimes and SST forcing: Results from large GCM ensembles. J. Clim. 2004, 17, 1641–1656. [Google Scholar] [CrossRef]
- Straus, D.M.; Corti, S.; Molteni, F. Circulation regimes: Chaotic variability versus SST-forced predictability. J. Clim. 2007, 20, 2251–2272. [Google Scholar] [CrossRef]
- Fereday, D.R.; Knight, J.R.; Scaife, A.A.; Folland, C.K. Cluster analysis of North Atlantic-European circulation types and links with tropical Pacific sea surface temperatures. J. Clim. 2008, 21, 3687–3703. [Google Scholar] [CrossRef]
- Lorente-Plazas, R.; Montavez, J.; Jerez, S.; Gomez-Navarro, J.; Jimenez-Guerrero, P.; Jimenez, P. A 49 year hindcast of surface winds over the Iberian Peninsula. Int. J. Climatol. 2015, 10, 3007–3023. [Google Scholar] [CrossRef]
- Garcia-Valero, J.; Montavez, J.; Jerez, S.; Gomez-Navarro, J.; Lorente-Plazas, R.; Jimenez-Guerrero, P. A seasonal study of the atmospheric dynamics over the Iberian Peninsula based on circulation types. Theroretic Appl. Climatol. 2012, 110, 291–310. [Google Scholar] [CrossRef]
- Wolter, K. The Southern Oscillation in surface circulation and climate over the tropical Atlantic, eastern Pacific, and Indian Oceans as captured by cluster analysis. J. Appl. Meteorol. Climatol. 1987, 26, 540–558. [Google Scholar] [CrossRef]
- DeGaetano, A. Delineation of mesoscale climate zones in the Northeastern United States using a novel approach to cluster analysis. J. Clim. 1996, 9, 1765–1782. [Google Scholar] [CrossRef]
- Arnott, J.M.; Evans, J.L.; Chiaromonte, F. Characterization of extratropical transition using cluster analysis. Mon. Weather Rev. 2004, 132, 2916–2937. [Google Scholar] [CrossRef]
- Jimenez, P.; Gonzalez-Rocco, J.; Garcia-Bustamante, E.; Navarro, J.; Montavez, J.; DeArellano, J.; Dudhia, J.; Munoz-Roldan, A. Surface wind regionalization over complex terrain: Evaluation and analysis of a high-resolution WRF simulation. J. Appl. Meteorol. Climatol. 2010, 49, 268–287. [Google Scholar] [CrossRef]
- Michelangeli, P.; Vautard, R.; Legras, B. Weather regimes: Recurrence and quasi stationarity. J. Atmos. Sci. 1995, 52, 1237–1256. [Google Scholar] [CrossRef]
- Luxburg, U. Clustering stability: An overview. Found. Trends Mach. Learn. 2010, 2, 235–274. [Google Scholar]
- Lange, T.; Roth, V.; Braun, M.; Buhmann, J. Stability-based validation of clustering solutions. Neural Comput. 2004, 16, 1299–1323. [Google Scholar] [CrossRef] [PubMed]
- Kalnay, E.; Kanamitsu, M.; Kistler, R.; Collins, W.; Deaven, D.; Gandin, L.; Iredell, M.; Saha, S.; White, G.; Woollen, J.; et al. The NCEP-NCAR 40-Year Reanalysis Project. Bull. Am. Meteorol. Soc. 1996, 77, 437–471. [Google Scholar] [CrossRef]
Figure 1.
The location of Callahan Divide Wind Energy Center (denoted as a star) in relative to the US map.
Figure 1.
The location of Callahan Divide Wind Energy Center (denoted as a star) in relative to the US map.

Figure 2.
The whisker-box of the wind energy production (in units of megawatthours) in Callahan Divide Energy Center, TX, United States, during 2007–2016. The green bar denotes the production in 2007.
Figure 2.
The whisker-box of the wind energy production (in units of megawatthours) in Callahan Divide Energy Center, TX, United States, during 2007–2016. The green bar denotes the production in 2007.

Figure 3.
250-mb wind vector (arrow) and magnitude (ms, color shade) for the October climatology in (a) and for the predefined sub-period of the October 2007 in (b), respectively. The schematic illustrations of the October climatological jet stream (red) and 2007 October jet stream over the predefined sub-period (blue) are in (c).

Figure 4.
500-mb geopotential height (in units of m) for the predefined sub-period of October 2007 in (a), for the long-term climatology in (b) and the anomaly in (c).
Figure 4.
500-mb geopotential height (in units of m) for the predefined sub-period of October 2007 in (a), for the long-term climatology in (b) and the anomaly in (c).

Figure 5.
Same as Figure 4 except for the sea level pressure field in units of hPa. The dark black lines with arrow highlight the dominant wind in (a,b).
Figure 5.
Same as Figure 4 except for the sea level pressure field in units of hPa. The dark black lines with arrow highlight the dominant wind in (a,b).

Figure 6.
Four clusters of 500-mb geopotential height anomaly (m) identified based on 38-yr daily reanalysis data over all months of October, with cluster 1 in (a), cluster 2 in (b), cluster 3 in (c) and cluster 4 in (d), respectively. The frequency of occurrence of each cluster is listed inside the parenthesis of each subtitle, in terms of percentage.

Figure 7.
The area-averaged spatial correlation R between 500-mb geopotential heights of daily October 2007 and each cluster. The areal average is taken over the North America.
Figure 7.
The area-averaged spatial correlation R between 500-mb geopotential heights of daily October 2007 and each cluster. The areal average is taken over the North America.

Figure 8.
Same as Figure 3, except for the July climatology jet stream and July 2007 jet stream over the predefined sub-period, respectively. The schematic illustrations of the July climatological jet stream (red) and 2007 July jet stream over the predefined sub-period (blue) are in (c). The LLJ stands for low-level jet. The L denotes the low pressure center and H the high pressure center.

Figure 9.
Same as Figure 4, except for the July 2007 case.
Figure 9.
Same as Figure 4, except for the July 2007 case.

Figure 10.
Same as Figure 5, except for the July 2007 case.
Figure 10.
Same as Figure 5, except for the July 2007 case.

Figure 11.
Same as Figure 6, except for the 38-yr July months.
Figure 11.
Same as Figure 6, except for the 38-yr July months.

Figure 12.
Same as Figure 7, except for the July 2007 case.
Figure 12.
Same as Figure 7, except for the July 2007 case.

Figure 13.
500-mb geopotential height anomaly (in units of m) for the predefined sub-period of August 2007, accompanied with excellent wind resources in Callahan Divide Wind Energy Center.
Figure 13.
500-mb geopotential height anomaly (in units of m) for the predefined sub-period of August 2007, accompanied with excellent wind resources in Callahan Divide Wind Energy Center.

© 2018 by the author. Licensee MDPI, Basel, Switzerland. This article is an open access article distributed under the terms and conditions of the Creative Commons Attribution (CC BY) license (http://creativecommons.org/licenses/by/4.0/).
Share and Cite
MDPI and ACS Style
Dong, L. Wind Resource Assessment in the Southern Plains of the US: Characterizing Large-Scale Atmospheric Circulation with Cluster Analysis. Atmosphere 2018, 9, 110. https://doi.org/10.3390/atmos9030110
AMA Style
Dong L. Wind Resource Assessment in the Southern Plains of the US: Characterizing Large-Scale Atmospheric Circulation with Cluster Analysis. Atmosphere. 2018; 9(3):110. https://doi.org/10.3390/atmos9030110
Chicago/Turabian StyleDong, Li. 2018. "Wind Resource Assessment in the Southern Plains of the US: Characterizing Large-Scale Atmospheric Circulation with Cluster Analysis" Atmosphere 9, no. 3: 110. https://doi.org/10.3390/atmos9030110
Note that from the first issue of 2016, this journal uses article numbers instead of page numbers. See further details here.