
Increased Exposure of China’s Cropland to Droughts under 1.5 °C and 2 °C Global Warming


1
School of Geographical Sciences, Nanjing University of Information Science and Technology, Ningliu Road 219, Nanjing 210044, China
2
Department of Infrastructure Engineering, The University of Melbourne, Melbourne 3010, Australia
3
Department of Hydraulic Engineering, Tsinghua University, Beijing 100084, China
*
Author to whom correspondence should be addressed.
Atmosphere 2022, 13(7), 1035; https://doi.org/10.3390/atmos13071035
Submission received: 11 May 2022
/
Revised: 18 June 2022
/
Accepted: 22 June 2022
/
Published: 29 June 2022
(This article belongs to the Special Issue Advanced Climate Simulation and Observation)
Abstract
:Global warming and human activities have intensified the duration, frequency, and extent of climatic extremes. The projected rise in global mean annual temperature of 1.5 °C/2 °C is thought to have severe impacts on the population exposed to droughts. Although these impacts on humans have been widely explored, the impacts associated with the cropland exposed to droughts have not been widely investigated. Here, we have examined the spatiotemporal pattern of China’s drought conditions and cropland exposure to droughts under global warming of 1.5 °C and 2 °C, along with the avoided impacts (as evaluated by the cropland exposure to droughts) when limiting the global warming to 1.5 °C instead of 2 °C. Results suggest that compared to the reference period (1995–2014), drought conditions will be alleviated when the projected rise in mean global temperature is limited to 1.5 °C rather than 2.0 °C. Although severe droughts tend to be mainly distributed in northwestern China, drought severities are increasing in southern China, especially in the southeastern region. In addition, the total cropland exposure to droughts across China exhibits an increasing trend in response to the 0.5 °C of additional global warming, especially in northwestern China and Huang−Huai−Hai region. If global warming could be limited to 1.5 °C, the avoided impact will exceed 30%, especially in northwestern China, southwestern China, and the Huang−Huai−Hai Plain. Furthermore, the rising cropland exposure to droughts under the 2 °C global warming is likely to be triggered by the rising frequencies of moderate and extreme droughts. Therefore, climate mitigation strategies are urgently needed to keep the global temperature rise below 1.5 °C, for the future sustainability of China’s cropland.
1. Introduction
A 1.09 °C increase in global surface temperature was observed in 2011–2020, as compared to 1850–1900 [1]. The rate of global warming is believed to exceed the bounds of natural variability [2]. Substantial changes brought by this unprecedented rate of global warming are happening in the climatic extremes (e.g., droughts, floods, and typhoon) [1,3]. For example, the widespread occurrences of droughts around the world in the 21st century due to occasional anomalies in climatic variables, as well as non−climatic factors, are becoming increasingly disastrous to mankind (e.g., causing damage to crops and raising serious concerns about agricultural production) [4,5]. These high drought risks accelerated by rapid global warming around the world are consequently challenging water and food security, especially in those regions with dense populations [6]. This concern is not only limited to historical observations but also to future projections. The latest CMIP6 models projections reaffirm the increase of up to 200% in the widespread drying and severe drought over most of the world under moderate–high emissions scenarios [7]. Meanwhile, according to several model projections, greenhouse gas−induced global warming may lead to more severe and widespread drought conditions [8,9].
As a complex phenomenon, drought can be influenced by a variety of factors and may occur almost anywhere in the world. Due to the complex terrain and climate characteristics, China has been frequently threatened by drought events on multiple timescales [10,11,12]. Yu, et al. [13] reported that the drought severity in China had been aggravating since the late 1990s, and the dry areas have been expanding. Zhou, et al. [14] found that more frequent recurrence of extreme droughts in large geographical regions of China has gravely affected the livelihoods of farming communities by severing agricultural yields. In the context of global warming, the frequency and duration of severe droughts are increasing not only in dry regions, but also in humid and sub−humid regions. For example, in the spring of 2011, the middle and lower reaches of the Yangtze River experienced the worst drought since 1954, causing serious damage to local agriculture [15]. In 2011–2012, Yunnan suffered from the most severe drought, which lasted for almost three years and resulted in huge economic losses [16]. The frequent occurrence and intensification of droughts are increasingly threatening food security and the ecological environment, as well as the development of the economy in our country. Therefore, a comprehensive assessment of climate change-induced droughts is urgently needed for providing reliable information for policymakers in climate mitigation and adaptation [17].
However, until recently, not much potentially reliable information on drought mitigation and adaptation has been suggested to combat the damage of drought to China’s agriculture. Some scholars developed drought indices to explore the mechanism and factors of drought occurrence and evolution in China in order to provide more accurate and comparable information on spatiotemporal variations in droughts for the farming communities [10,18,19,20]. A drought index is a necessary tool for drought assessment, for its importance in defining drought parameters and quantifying drought on different time scales. Until now, hundreds of drought indices have been proposed in the world [21]. Among the numerous drought indices, the Palmer Drought Severity Index (PDSI), the Standardized Precipitation Index (SPI), and the Standardized Precipitation Evapotranspiration Index (SPEI) can precisely reflect the meteorological drought and evaluate the agricultural drought [22,23,24]. The SPI, as a single variable index, is easy to compute and has a variety of time scales, which allows it to monitor both short−term drought and long-term drought [22,25]. However, it is also hard for the SPI to identify diverse categories of drought because it only considers the P and runoff (RO) [26]. The SPEI has been broadly used for characterizing multi-category drought for drought monitoring and projection, however, there are still some limitations for SPEI applications in different climate regions [27]. An improvement on SPI, SPEI measures drought severity mainly in terms of the P and PET, but research indicates that variation exists in the relations between P and PET in different climate regions [28]. Although PET plays an essential role in detecting water deficit, merely relying on it for detailing droughts can lead to biases in water-limited regions [29]. The PDSI has always been one of the most prominent indices for its ability of considering multiple surface water variants and precisely quantifying long-term changes in drought and aridity in the world [21,22,30]. Unlike the simple water balance represented in SPEI, PDSI adopts a two-layer bucket model to quantify the cumulative moisture departure in estimating the surface water–energy balance. Further, Dai, et al. [31] showed that the PDSI values are significantly correlated with measured soil moisture. Most importantly, actual evaporation is often determined, to a large degree, by the availability of soil moisture, not by PET. However, the original PDSI index still has some shortcomings. For example, it has strong dependence on data calibration and limitations in spatial comparability [32,33,34]. To overcome these deficiencies, the self-calibrating PDSI (scPDSI) was created in 2004 [34]. In comparison to the original PDSI, scPDSI can calibrate the PDSI by using local conditions. The scPDSI’s superiority of reducing value range has already been proved on a global scale since 2011 [30], and it was found to perform better than the original PDSI in Europe and North America [35,36]. Moreover, by comparing seven drought indices in China, Yang, et al. [37] found the scPDSI was the best at capturing the droughts in China. Therefore, in this study, we chose the scPDSI to detect the drought conditions.
Drought has multiple eco-hydrological and socioeconomic impacts on human society, such as increasing wildfire risks, water scarcity, loss of crops and livestock, and raising food prices [38]. Meanwhile, with the acceleration of population growth and urbanization, human settlements and livelihoods are expected to be more frequently exposed to droughts than any time in the past [39]. Exposure to droughts is not only restricted to people but also affects the entire ecosystem, for example, environmental resources, economic, social, and cultural assets that could be adversely affected [40]. However, more attention from previous studies has been paid to drought and its impacts on population [17,41,42]. Although droughts are causing severe impacts on agriculture in the 21st century, cropland exposure to droughts in China is far less studied. The cropland affected by drought was larger than 200 thousand km2 per year and the annual direct economic loss was larger than 34 billion yuan during 1984–2018 [43]. Food security will continue to be a global concern in the future, given crop yield failure as well as increasing water scarcity [44,45]. Some of the drought-prone regions of China where livelihoods are highly dependent on rain-fed agriculture would directly face challenges of water and food security [46]. Thus, investigating the cropland exposure to droughts in such drought-prone areas in China is potentially significant to ensure the future food security.
Global warming has become an increasing concern in recent years. Previous studies showed that climate change would have a significant impact on global food production and water resources, extreme weather and climate events, as well as on human health, when global warming reached 1–2 °C [17]. Moreover, under the global warming of 2.0 °C, extreme heat will frequently reach the tolerance thresholds of human health and agriculture production, posing widespread and serious threats to human livelihoods as well as to the ecological environment [6]. To reduce the climate risks, the Paris Agreement proposed to hold the global temperature rise well below 2.0 °C above preindustrial levels and to pursue efforts to limit the warming to 1.5 °C [47]. To meet this commitment, there have been multiple efforts devoted to investigate the variations in climatic extremes under the 1.5 °C and 2.0 °C global warming scenarios in recent years [48,49,50]. The Coupled Model Intercomparison Project (CMIP), organized by the World Climate Research Programme’s (WCRP) Working Group on Coupled Modelling (WGCM) 20 years ago [51], is aimed at better understanding the past, present, and future climate change rising from natural, unforced variability or in response to changes in radiative forcings in a multi-model context [52]. Compared with Coupled Model Intercomparison Project Phase 5 (CMIP5), models involved in Coupled Model Intercomparison Project Phase 6 (CMIP6) additionally considered socioeconomic factors, i.e., the shared socioeconomic pathways (SSPs). Instead of the single representative concentration pathways (RCPs) in CMIP5, the SSPs work in harmony with RCPs in CMIP6 under shared policy assumptions, making future scenarios more reasonable [19,53]. Moreover, the great improvements and suitability of CMIP6 models in simulating temperature and precipitation have already been proven in China [54]. Therefore, the recently released and designed CMIP6 models are reliable sources to reveal future climate changes in China.
In this study, we focused on three objectives: (1) to figure out the spatiotemporal variations in droughts in China under global warming of 1.5 °C and 2.0 °C; (2) to explore the impacts of droughts on cropland in a warmer world, namely, the variation in cropland exposure to droughts in a 1.5 °C/2.0 °C warmer climate; and (3) to what extent the cropland exposure to droughts could be avoided if the global warming target is limited to 1.5 °C instead of 2.0 °C. Addressing these critical issues is useful for understanding droughts and their long-term impacts on China’s cropland. It would further help policymakers to develop adaptation and mitigation strategies and to strengthen societal resilience to future drought-induced emergencies.
2. Data and Methods
2.1. Datasets
2.1.1. Climate Observations
We obtained the monthly gridded climate variables from the National Climate Centre of China Meteorological Administration (available from: http://data.cma.cn/ (accessed on 1 September 2020)). These variables include temperature, precipitation, wind speed, relative humidity, and shortwave radiation. This dataset is interpolated from more than 2400 ground-based observations, featuring a spatial resolution of 0.5° and spanning from the period 1961 to 2014.
2.1.2. CMIP6 Model Simulations
Climate simulations are downloaded from the World Research Programmer’s (WCRP) Coupled Model Intercomparison Project Phase 6 (CMIP6) (available from: https://esgf-node.llnl.gov/projects/cmip6/ (accessed on 1 September 2020)). This involves historical simulations for 1961–2014 and future simulations for 2015–2100 under different SSPs−RCPs. In this study, we selected three scenarios, i.e., SSP1−2.6 (denoting a green/low-gas-emission pathway in a sustainable world), SSP2−4.5 (denoting an intermediate−gas−emission pathway in a moderate world), and SSP5−8.5 (denoting a high−gas−emission pathway in a rapid−fossil fuel−evolution world) [55,56]. Here, model outputs include monthly precipitation, temperature, wind speed, downward shortwave radiation, and relative humidity (as listed in Table 1). Considering the availability of the required variables and climate change scenarios, four models (CanESM5, IPSL−CM6A−LR, MIROC6, and MRI−ESM2−0) under SSP1−2.6, SSP2−4.5, and SSP5−8.5 were applied in this research (as listed in Table 2). CMIP6 outputs will be bias-corrected against observational data by applying the equidistant cumulative distribution function (EDCDF, refer to Section 2.2.1 for more detail) method and resampled to a regular 0.5° spatial resolution through a spatial disaggregation method [4,57,58].
2.1.3. Historical and Future Land Use
The land use map of 2010 from the Data Centre of Resources and Environment, Chinese Academy of Sciences (CAS) was used to represent the historical land use conditions during the reference period (1995–2014) (available at: https://www.resdc.cn/ (accessed on 1 September 2020)), and its spatial resolution is 1 km. The harmonized set of scenarios developed by the Land−Use Harmonization project 2 (LUH2) was also applied to indicate future land use (available at: https://luh.umd.edu/index.shtml (accessed on 1 September 2020)). This dataset aims to estimate the fractional land-use patterns and land-use transitions and the key agricultural management information from the year 850 to 2100 at 0.25° resolution [59]. The land−use type of the LUH2 dataset could be divided into five main classes: primary vegetation (never impacted by human activities) and secondary vegetation (recovering from human disturbance), urban land, croplands, and pastures; the cropland includes all five crop types (e.g., C3 annual and perennial, C4 annual and perennial, and C3 nitrogen−fixing) [59]. As mentioned earlier, to spatially match the land use data with the climate datasets, we resampled the land use data to 0.5° spatial resolution.
2.2. Methods
2.2.1. Bias Correction
In this study, the systematic bias between climate simulations and climate observations is corrected by the Equidistant Cumulative Distribution Functions (EDCDF) method [57]. The EDCDF method can be written as:
Here, x is the climate variable, F is the cumulative distribution (CDF), oc denotes observations in the training period, mc denotes model outputs in the training period, and ms denotes model outputs in a correction period.
GCM outputs are downscaled to a common resolution of 0.5° by the Spatial Disaggregation (SD) method [4,58]. In this study, the bilinear interpolation method was applied to interpolate the observational variables over China to GCM coarse resolution. Anomaly fields of temperature between observational data and bias-corrected model outputs are defined as the difference between them. For precipitation, wind speed, relative humidity, and shortwave radiation, the anomaly field is the ratio of GCM output to observational data. After the above process, the downscaled GCM simulations are obtained eventually.
2.2.2. The Self-Calibrating Palmer Drought Severity Index
Similar to PDSI, the computation of scPDSI involves four surface water fluxes (i.e., evapotranspiration, soil recharge, runoff, and water loss to the soil) [24]. Discrepancies between the PDSI and scPDSI are the empirical constants and the duration factors. In contrast to PDSI, these values of the scPDSI are generated automatically based on the historical climate information of a location, and thus have better spatial comparability. In addition, according to previous studies, biases in the estimation of PET can lead to an overestimation of drying trends [60,61]. Due to the strong recommendation for drought analysis in China, we used the Penman–Monteith method to evaluate the potential evapotranspiration (PET) in this study. More details about the computational procedures of scPDSI and PET based on the Penman–Monteith method can refer to Wells et al. [34] and Burke et al. [8]. The drought severity calculated by scPDSI can be categorized into four groups: near-normal dry (−1.99 to 0), moderately dry (−2.99 to −2), severely dry (−3.99 to −3.0), and extremely dry conditions (≤−4.0) [24]. It is universally accepted that the scPDSI ≤ −2 denotes a drought event. Meanwhile, the drought area in this study is extracted as the ratio of the sum of pixels where the scPDSI ≤ −2 to total pixels. The drought frequency is defined as the ratio of the dry months (monthly scPDSI ≤ −2) to the total months [41,62].
2.2.3. The Cropland Exposure to Droughts
Cropland exposure to droughts is defined as the cropland area exposed to moderate, severe, and extreme droughts, respectively (i.e., the frequencies of these droughts multiplied by drought-affected cropland area, as described by various authors) [41,63]. In this study, we compared the changes in cropland exposure to drought under 1.5 °C and 2 °C global warming levels with the reference period (1995–2014).
2.2.4. Avoided Impacts of Cropland Exposure to Droughts
The impact of cropland exposure to droughts that are avoided under a 1.5 °C global warming period compared with a 2 °C global warming period is defined as AI [41], which is estimated as below:
where is the avoided impact and and are the changes under 1.5 °C and 2 °C global warming levels, respectively, compared with the reference period (1995–2014).
3. Results
3.1. Bias Correction of CMIP6 Models
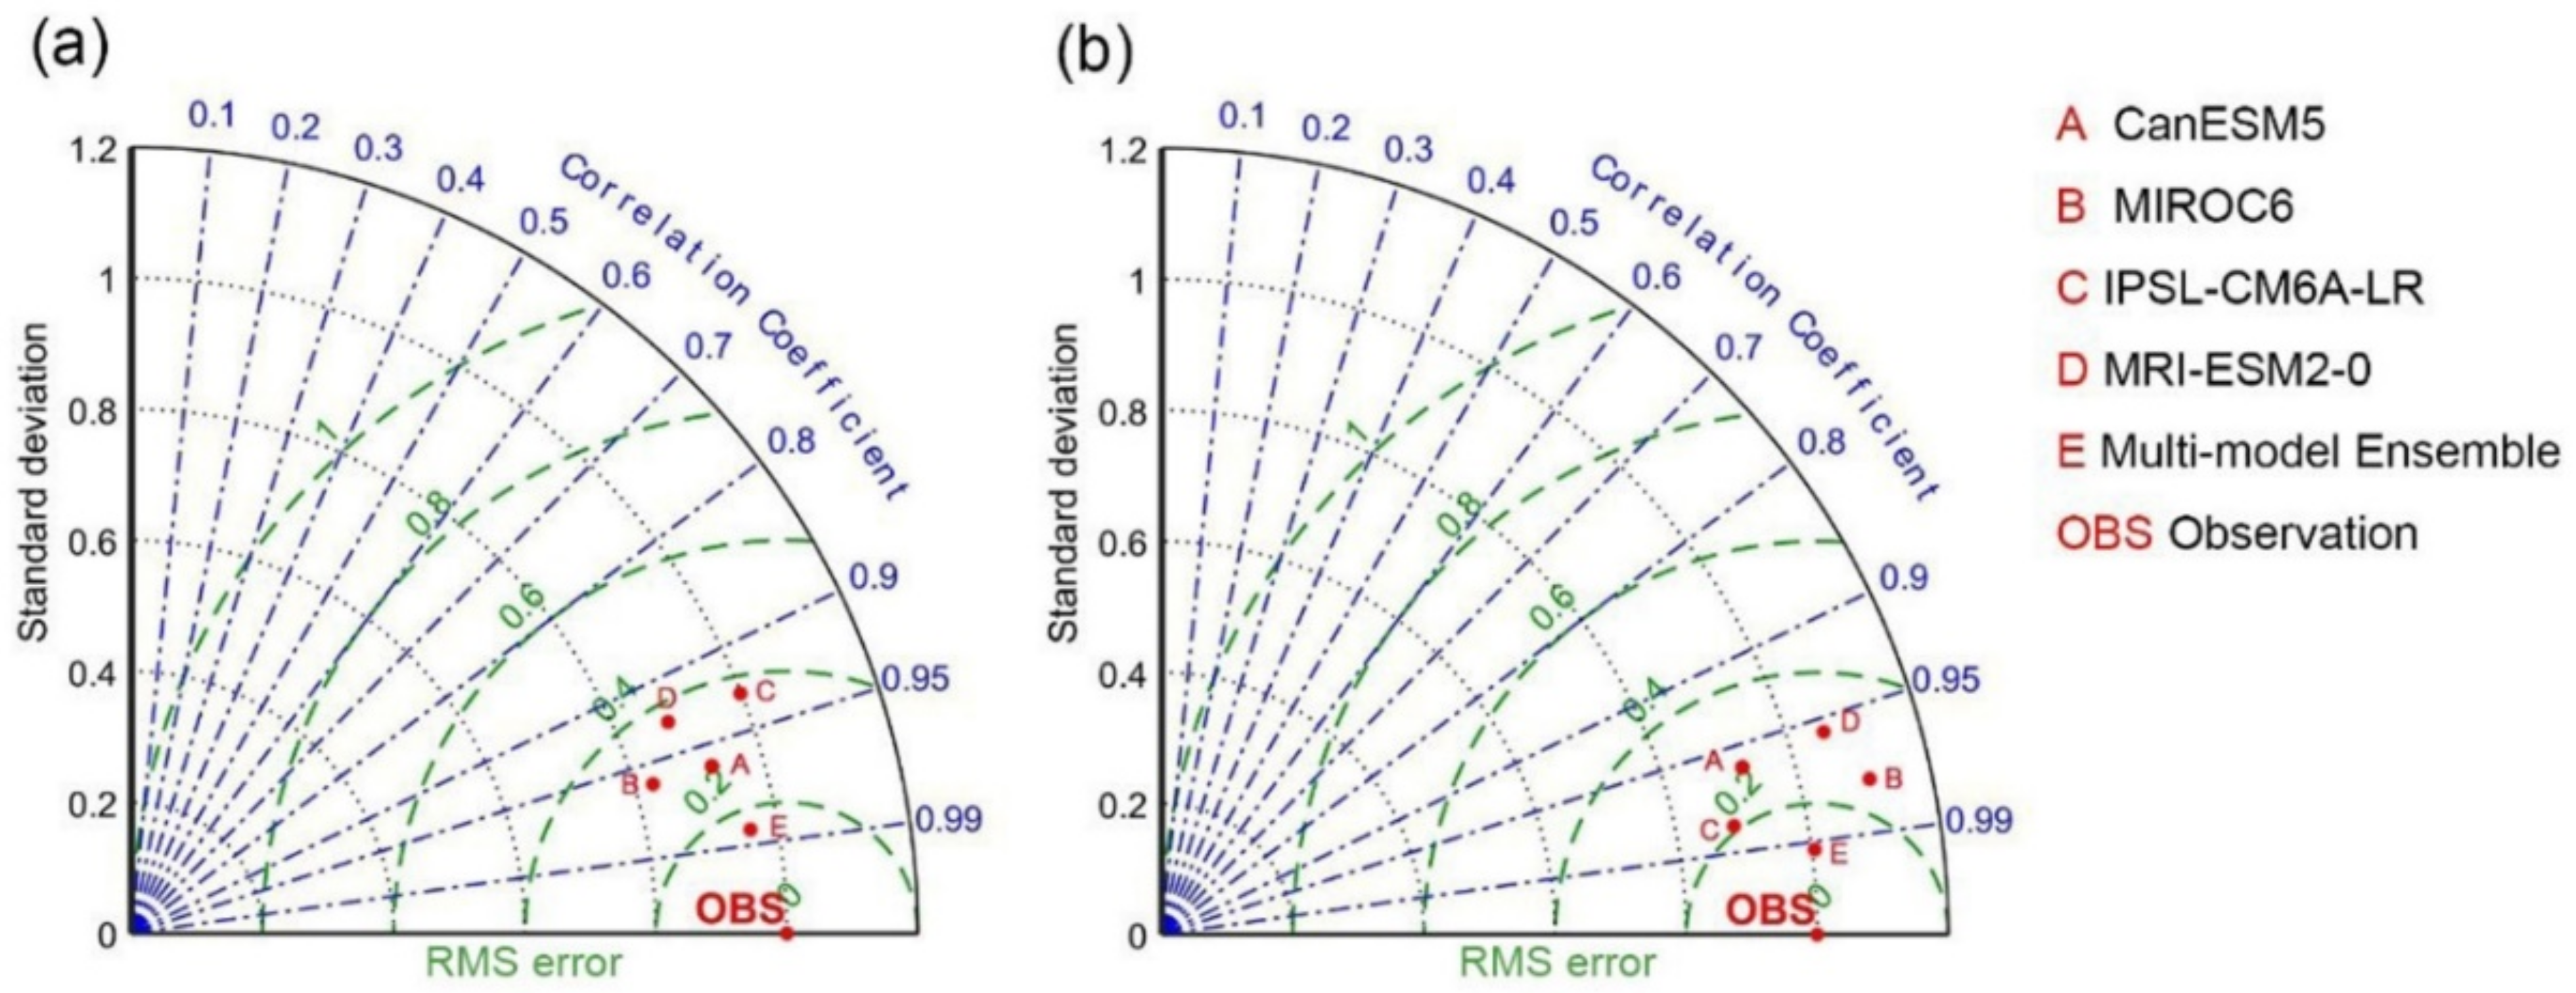
As a result of the proven advantage of comparing different model data in previous studies [64,65], the Taylor diagram was applied in this study to evaluate the performance of the bias-corrected CMIP6 data against the climate observation data.
After the bias correction, annual mean temperature and annual total precipitation derived from CMIP6 models are relatively consistent with climate observation data (Figure 1), with correlation coefficients above 0.9 and a RMS (Root Mean Square) error of less than 0.4. A better simulation accuracy in both annual mean temperature and the annual total precipitation was achieved by Multi−Model Ensemble (MME) based on four CMIP6 models (Figure 1a,b). We also compared monthly mean temperature and monthly total precipitation over 1961–2014, derived from climate observations, with climate simulations (Figure S1). Results show that the method of MME could capture monthly variations in temperature and precipitation quite well.
3.2. Variations and Projections of Temperature and Precipitation from 1995 to 2100 in China
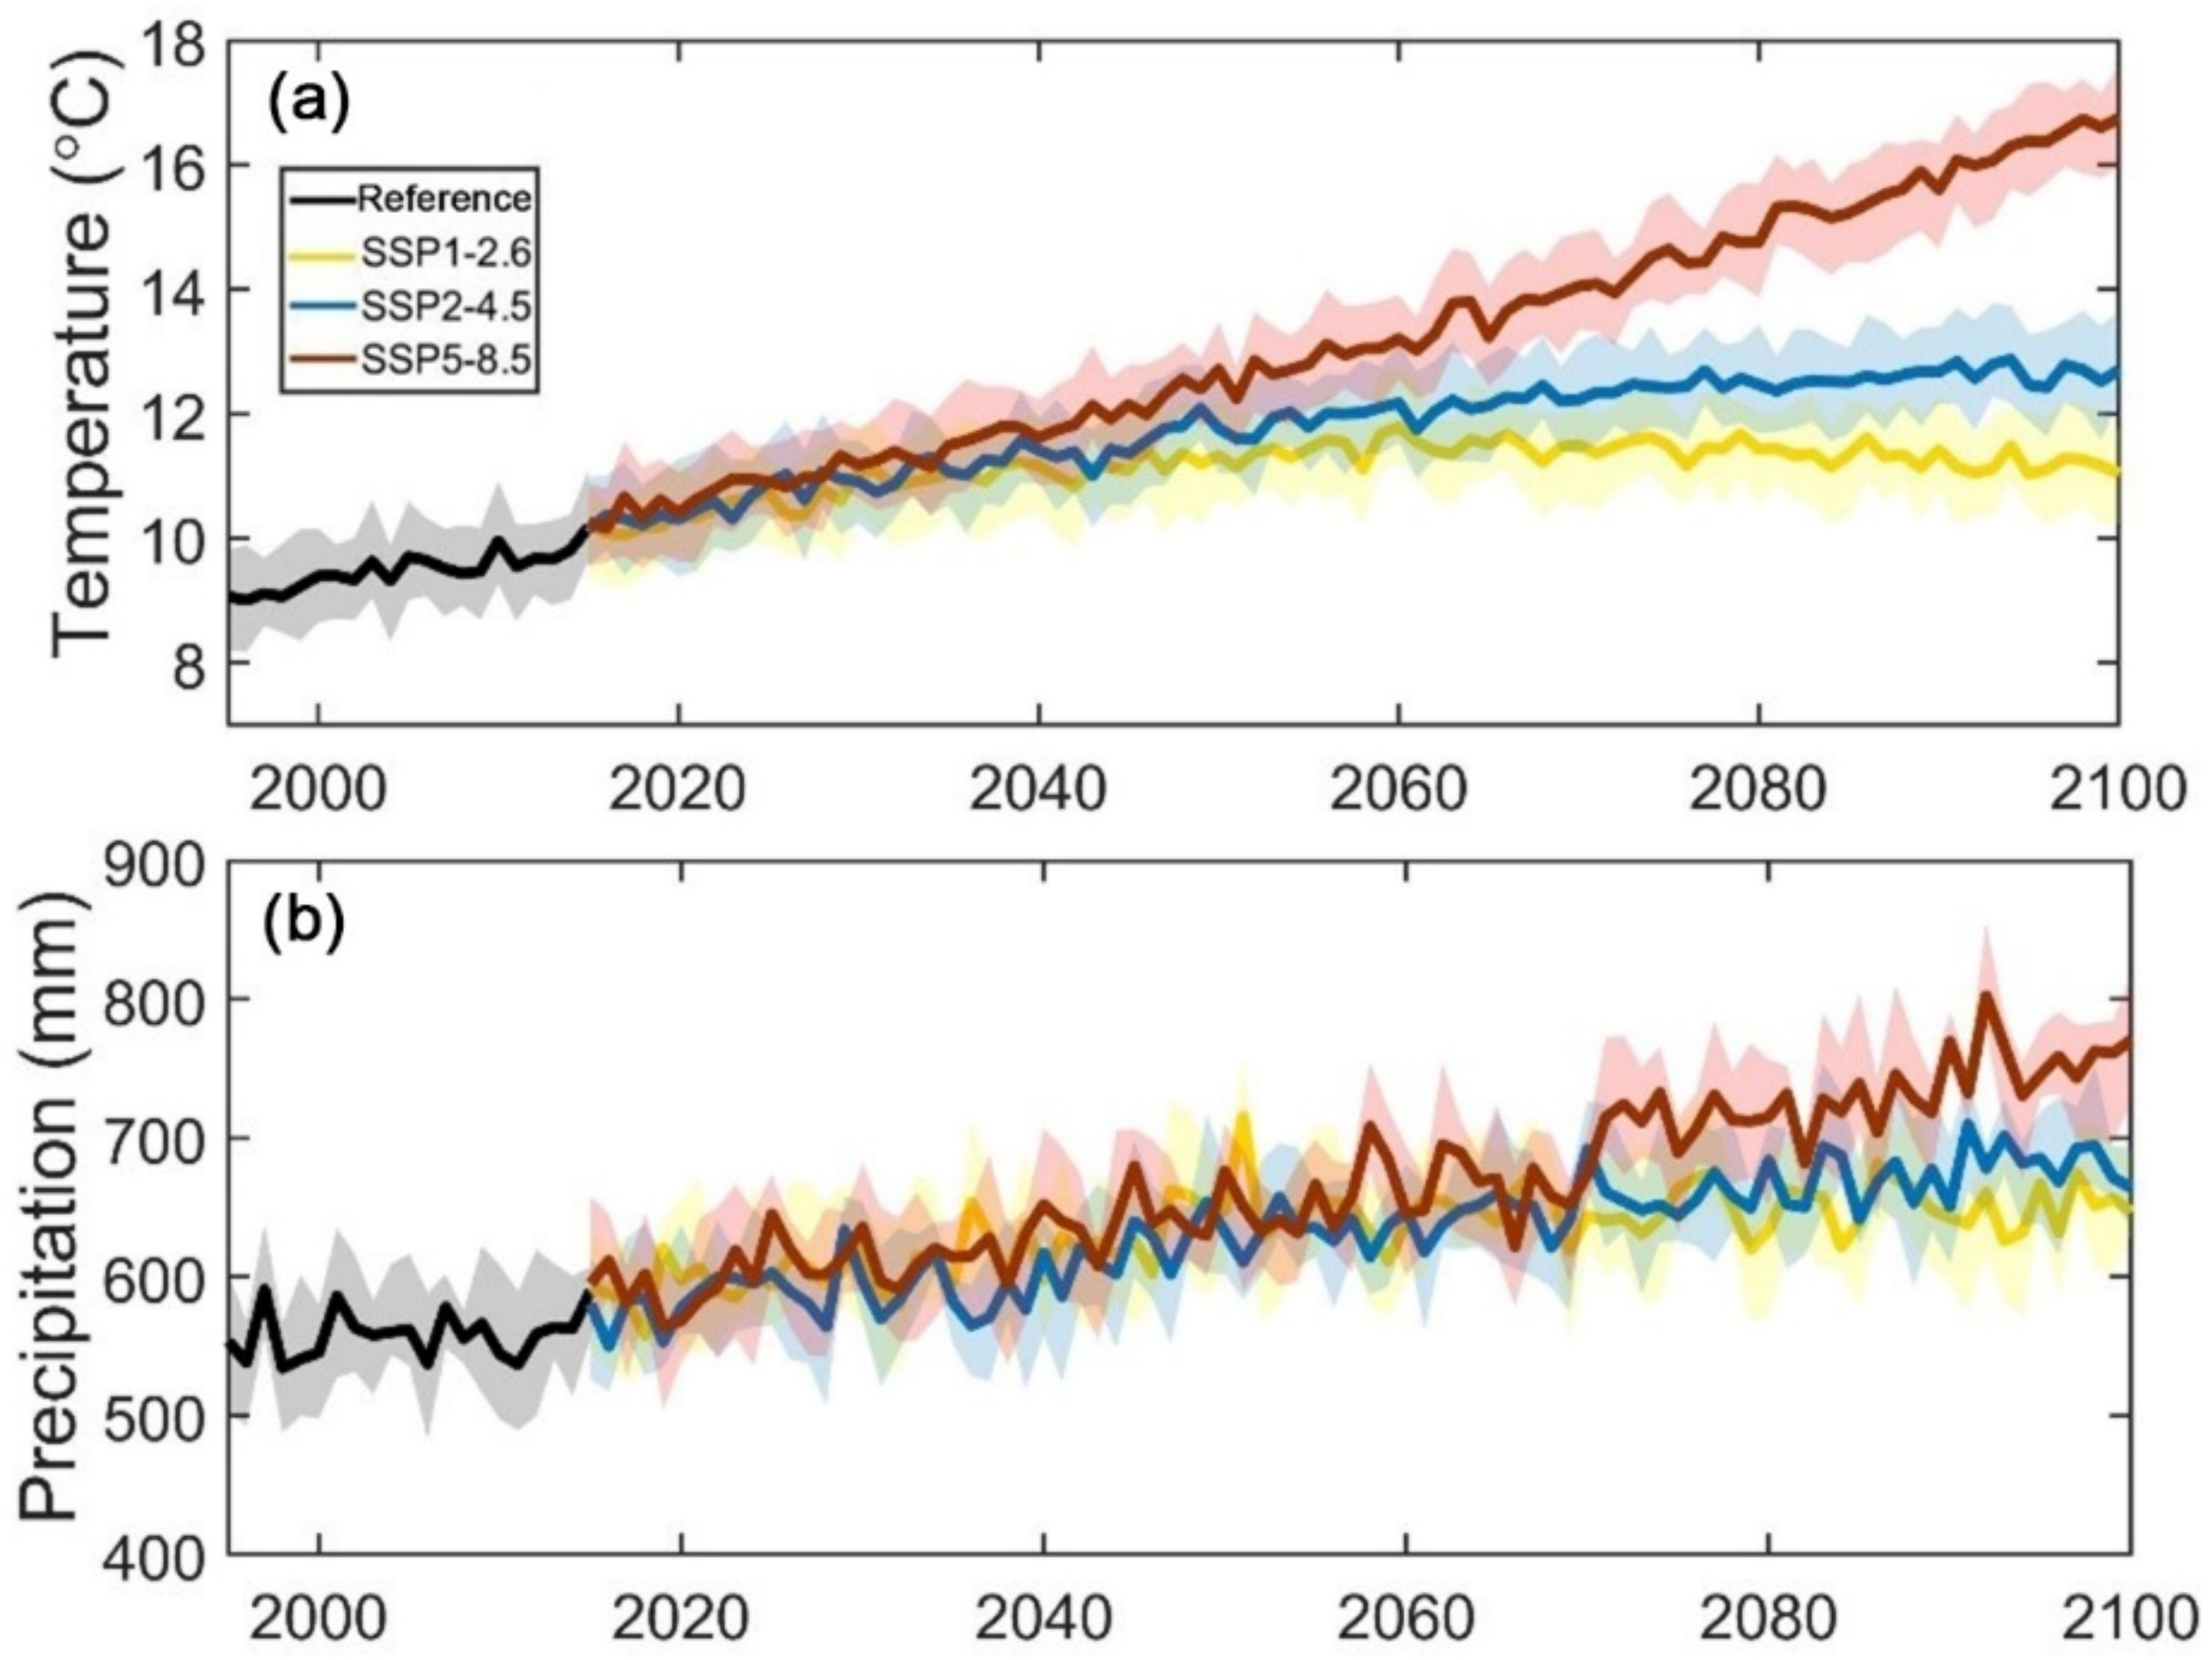
Results show that the annual mean temperature of China during 1995–2014 increased at a rate of 0.39 °C/10a (Figure 2a). Meanwhile, the annual total precipitation slightly increased at a rate of 5.52 mm/10a, from 554 mm to 563 mm (Figure 2b). Projections in future temperature and precipitation show different results under the three scenarios. To be specific, under SSP1−2.6, the annual mean temperature is projected to rise at a relatively higher rate (0.23 °C/10a) in 2015–2070 than in 2071–2100 (0.15 °C/10a) (Figure 2a). Under SSP2−4.5, the annual mean temperature is projected to rise faster than that under SSP1−2.6 (0.30 °C/10a for 2015–2100 (Figure 2a). A continuously amplified warming trend is monitored with an ongoing warming rate of 0.75 °C/10a in 2015–2100 under SSP5−8.5 (Figure 2a). During the same period, the annual total precipitation is also projected to increase at a rate of 6.34 mm/10a, 9.73 mm/10a, and 19.02 mm/10a, respectively under SSP1−2.6, SSP2−4.5, and SSP5−8.5 (Figure 2b). Overall, both annual mean temperature and annual total precipitation are detected to increase in China during the reference period (1995–2014) and thereafter, especially under SSP5−8.5.
3.3. Variations and Projections of Drought Conditions from 1995 to 2100 in China
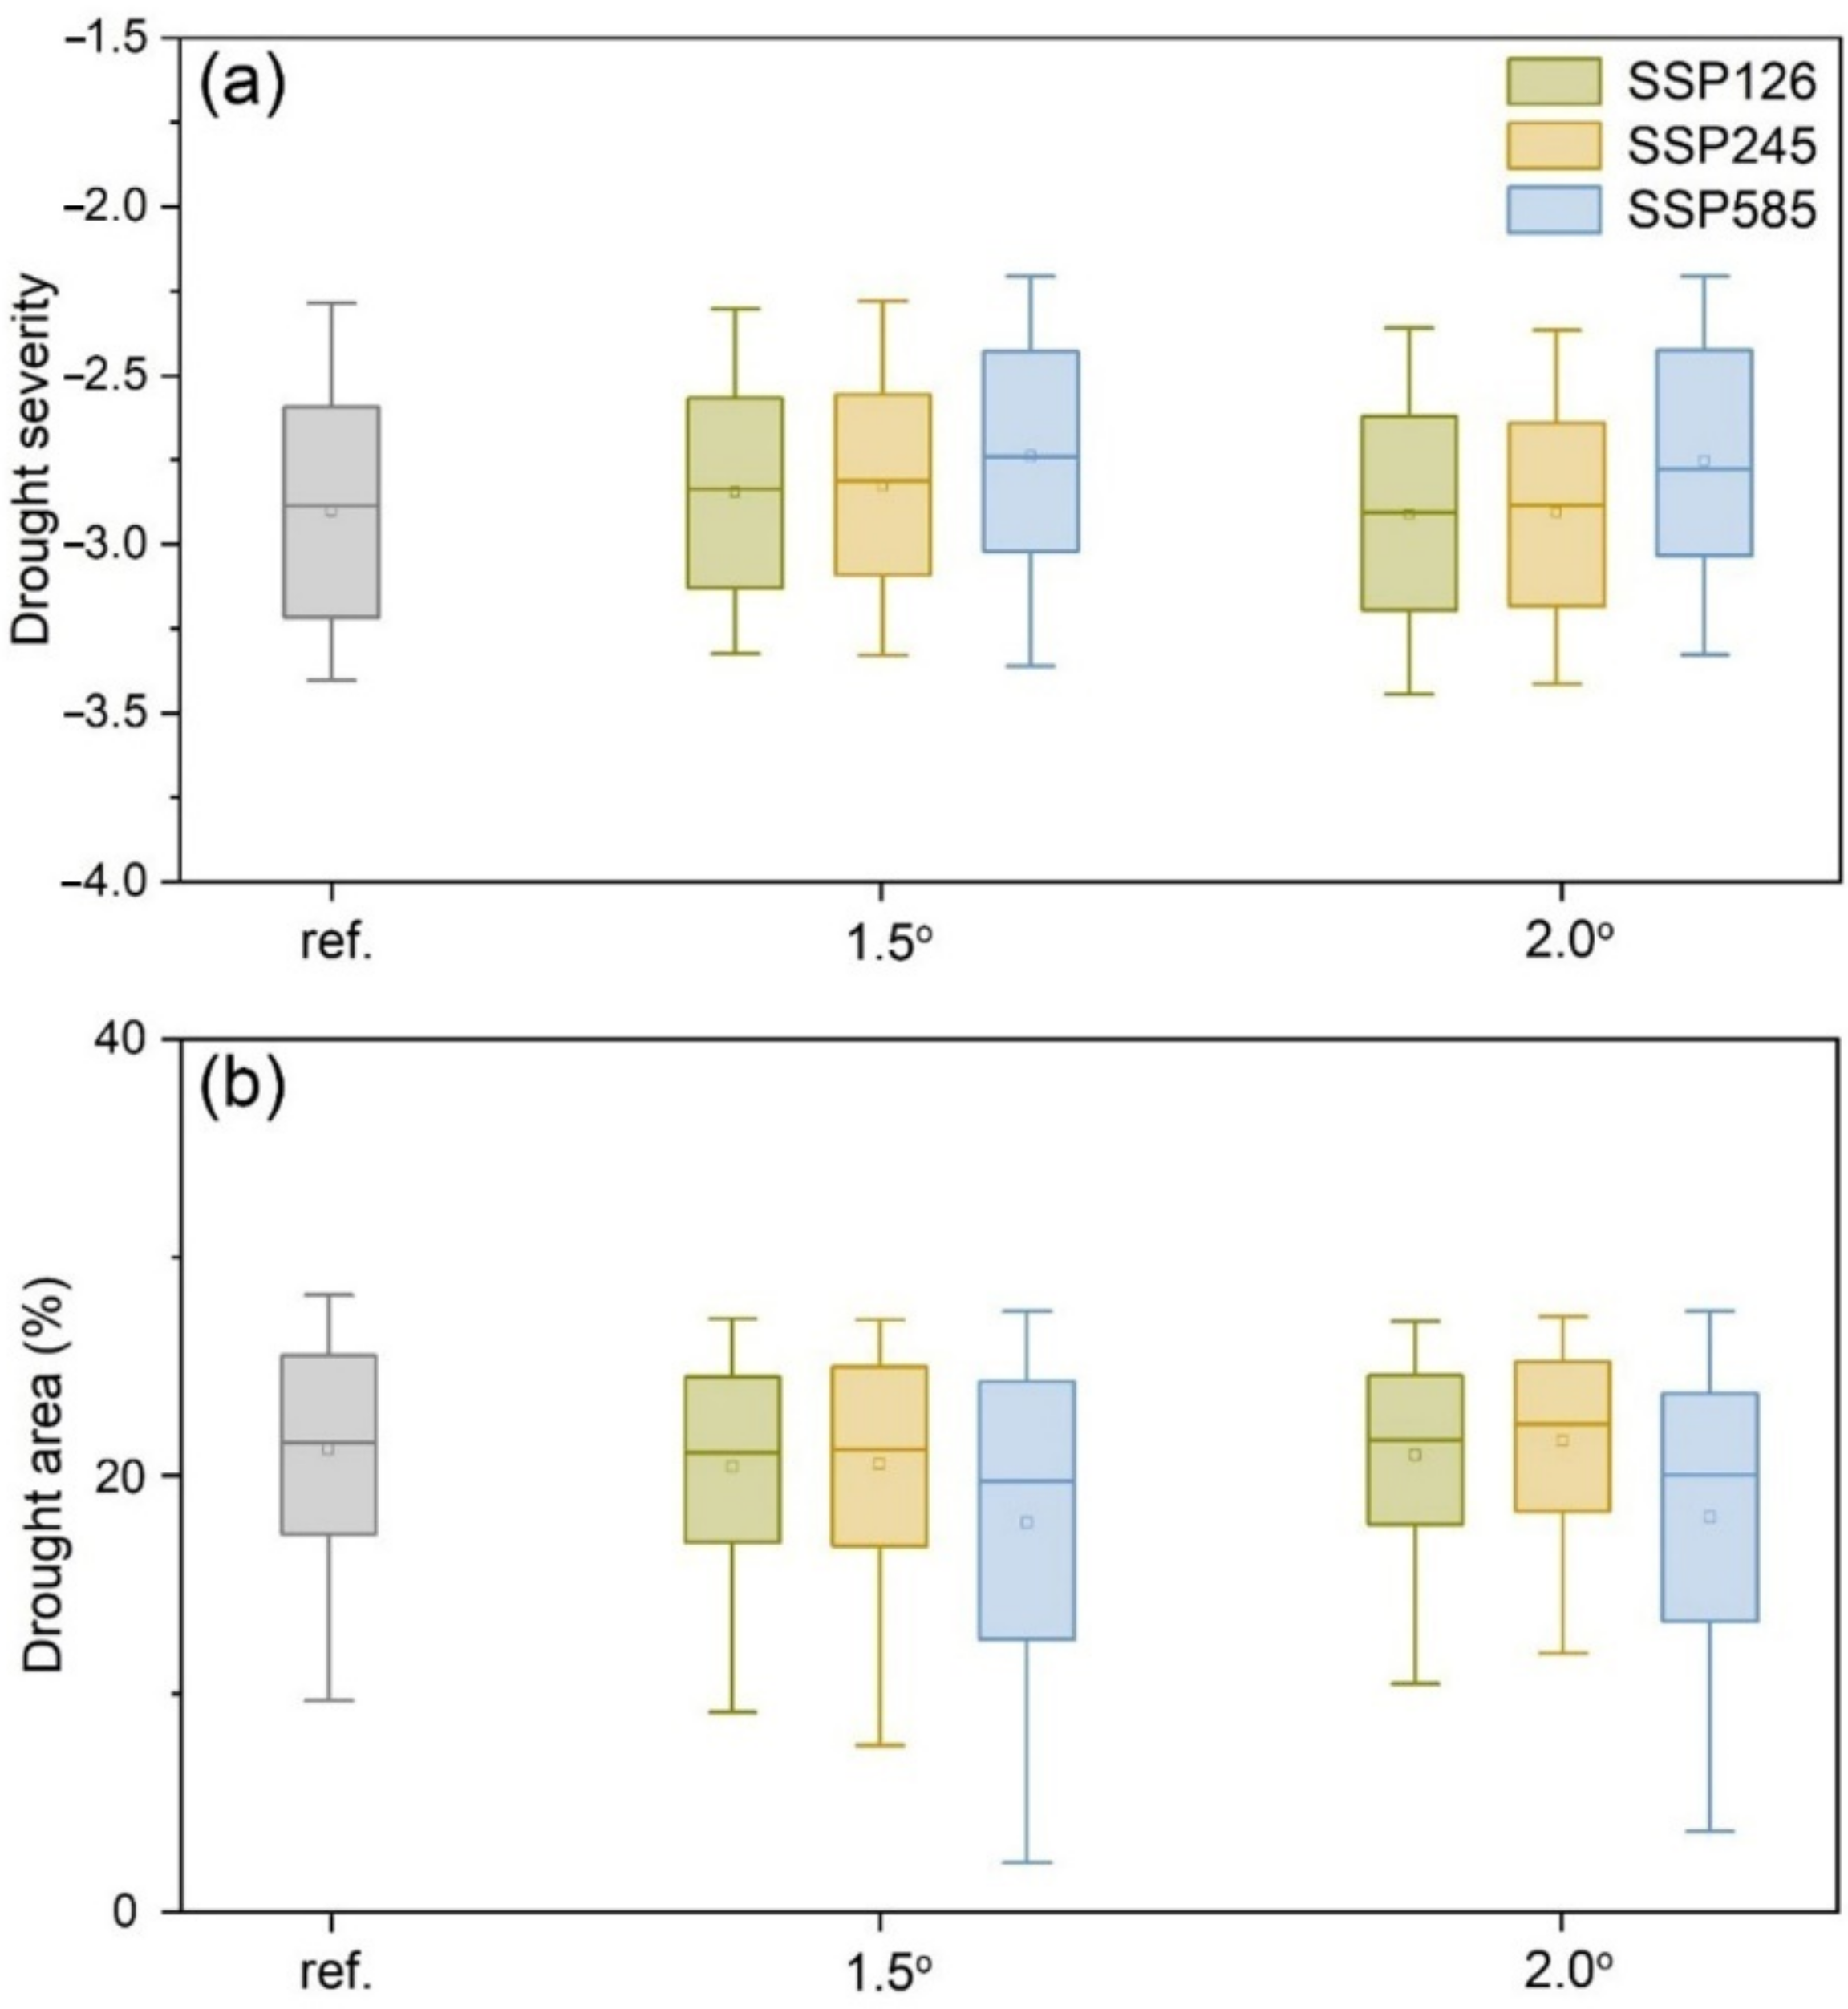
According to CMIP6 model simulations, a stable increase of 1.5 °C (2.0 °C) global average temperature (above the preindustrial level) will occur in the years of 2025 (2056), 2026 (2043), and 2024 (2038) under SSP1−2.6, SSP2−4.5, and SSP5−8.5, respectively [66]. Both drought severity (scPDSI ≤ −2) in dry regions and drought areas in China are identified by scPDSI for the reference period (1995–2014) and the 1.5 °C/2.0 °C global warming periods under SSP1−2.6, SSP2−4.5, and SSP5−8.5, respectively (Figure 3).
Relative to the reference period (when the drought severity was estimated to be −2.9), the general drought severity in the 1.5 °C global warming period will be alleviated, albeit there were some differences in the result under SSP1−2.6, SSP2−4.5, and SSP5−8.5 (Figure 3a). The average drought severity of all three scenarios in the 1.5 °C global warming period was −2.8, which is slightly lower than the drought severity in the reference period. However, the drought severity during the 2 °C global warming period is higher than the general drought severity during the 1.5 °C global warming period (as the averaged drought severity of the three scenarios during the 2 °C global warming period was estimated to be −2.86). Therefore, the overall drought situation in China will become worse in the global warming period of 2.0 °C compared with the global warming period of 1.5 °C.
Changes in drought area in China (Figure 3b) are consistent with the variations in drought severity. The drought area is projected to shrink in the global warming period of 1.5 °C (as the averaged drought area of the three scenarios was estimated to be 19.6%) and then slightly increase in the global warming period of 2.0 °C (as the averaged drought area of the three scenarios was estimated to be 20.2%). The percentages of the drought area in the 1.5 °C and 2.0 °C global warming periods are slightly lower than the reference period (as the drought area was estimated to be 21.2%). In addition, compared with the global warming period of 1.5 °C, the drought area is detected to expand in the global warming period of 2.0 °C under both SSP1−2.6 and SSP2−4.5, yet the change in drought area between the 1.5 °C and 2.0 °C global warming periods under SSP5−8.5 is not obvious.
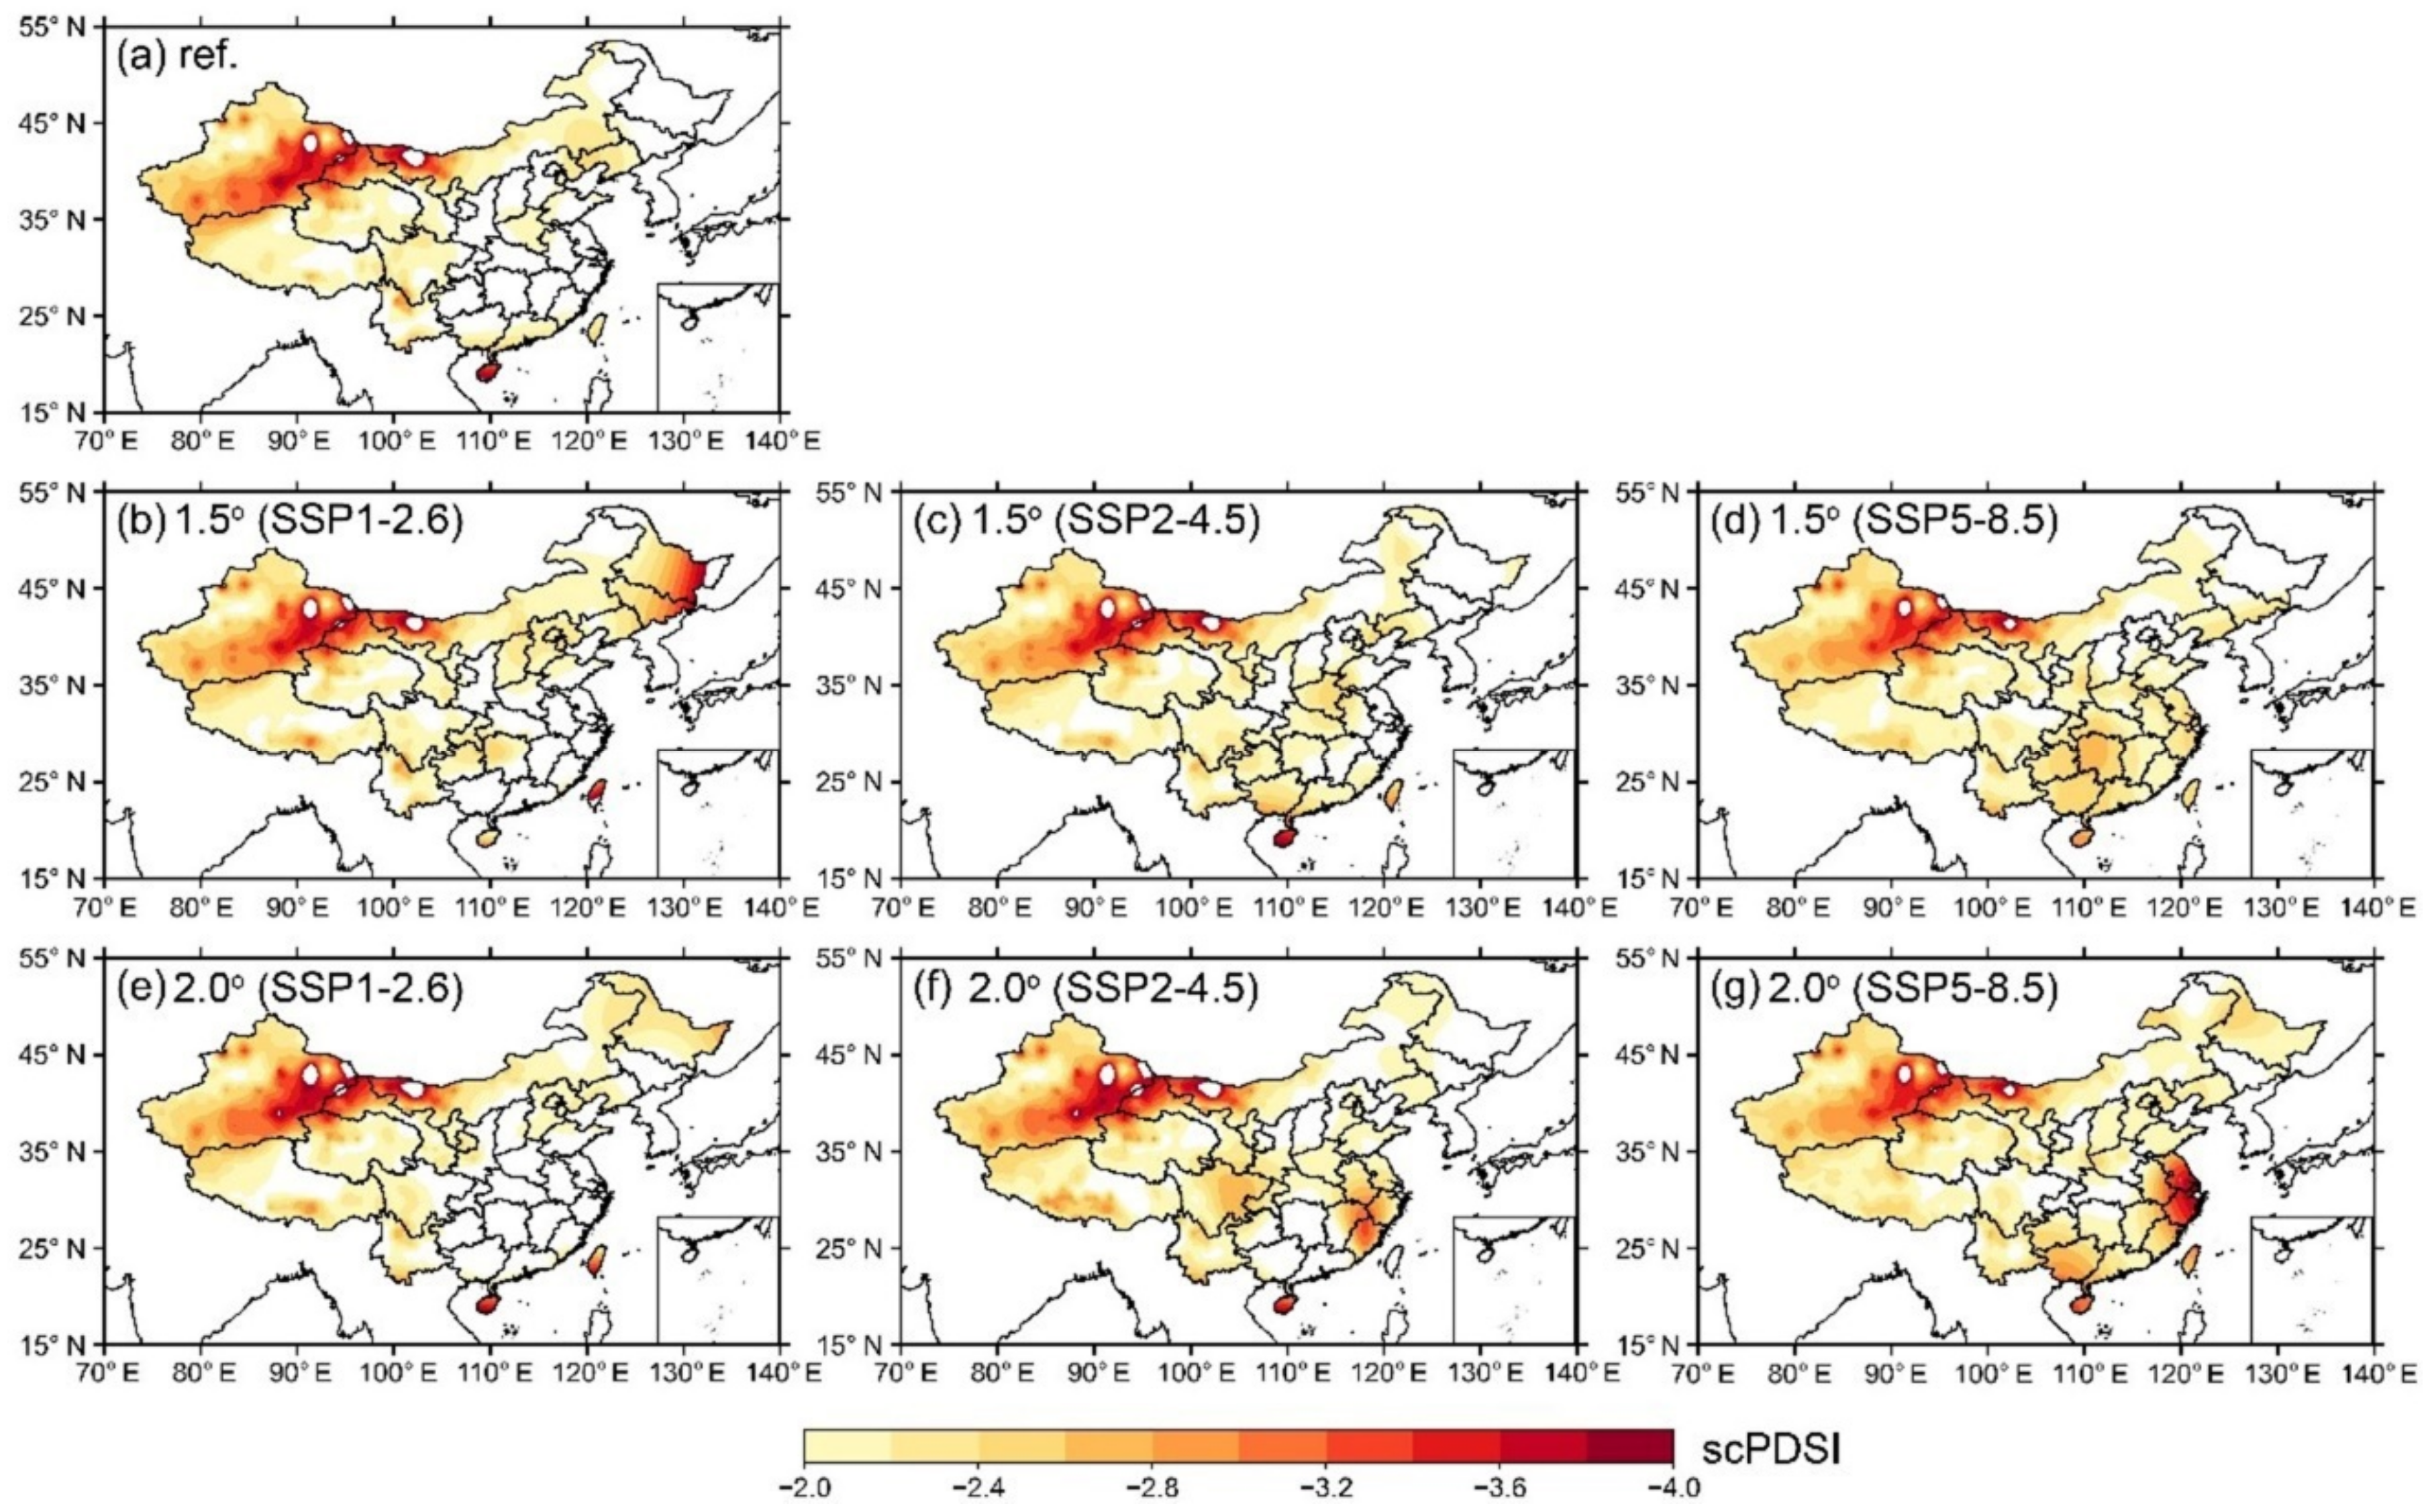
Severe droughts (scPDSI ≤ −3) were found to be mainly distributed in northwestern China during the reference period (1995–2014) (Figure 4a). The spatial distributions of dry regions (defined as regions with scPDSI ≤ −2) was found to differ from each other under the three SSPs−RCPs and two global warming periods. In the 1.5 °C global warming period (Figure 4b–d), the drought severity tends to become slightly increased in northeastern China under SSP1-2.6, but under SSP2−4.5 and SSP5−8.5, the drought severities tend to increase more in most regions of southern China, relative to the reference period. In the 2 °C global warming period (Figure 4e–g), a slight increase in drought severity is detected in northeastern China under SSP1−2.6, relative to the reference period. Note that compared to the reference period and the 1.5 °C global warming period, drought severities in the 2.0 °C global warming period under SSP2−4.5 and SSP5−8.5 will be maintained in southern China, especially in southeastern China.
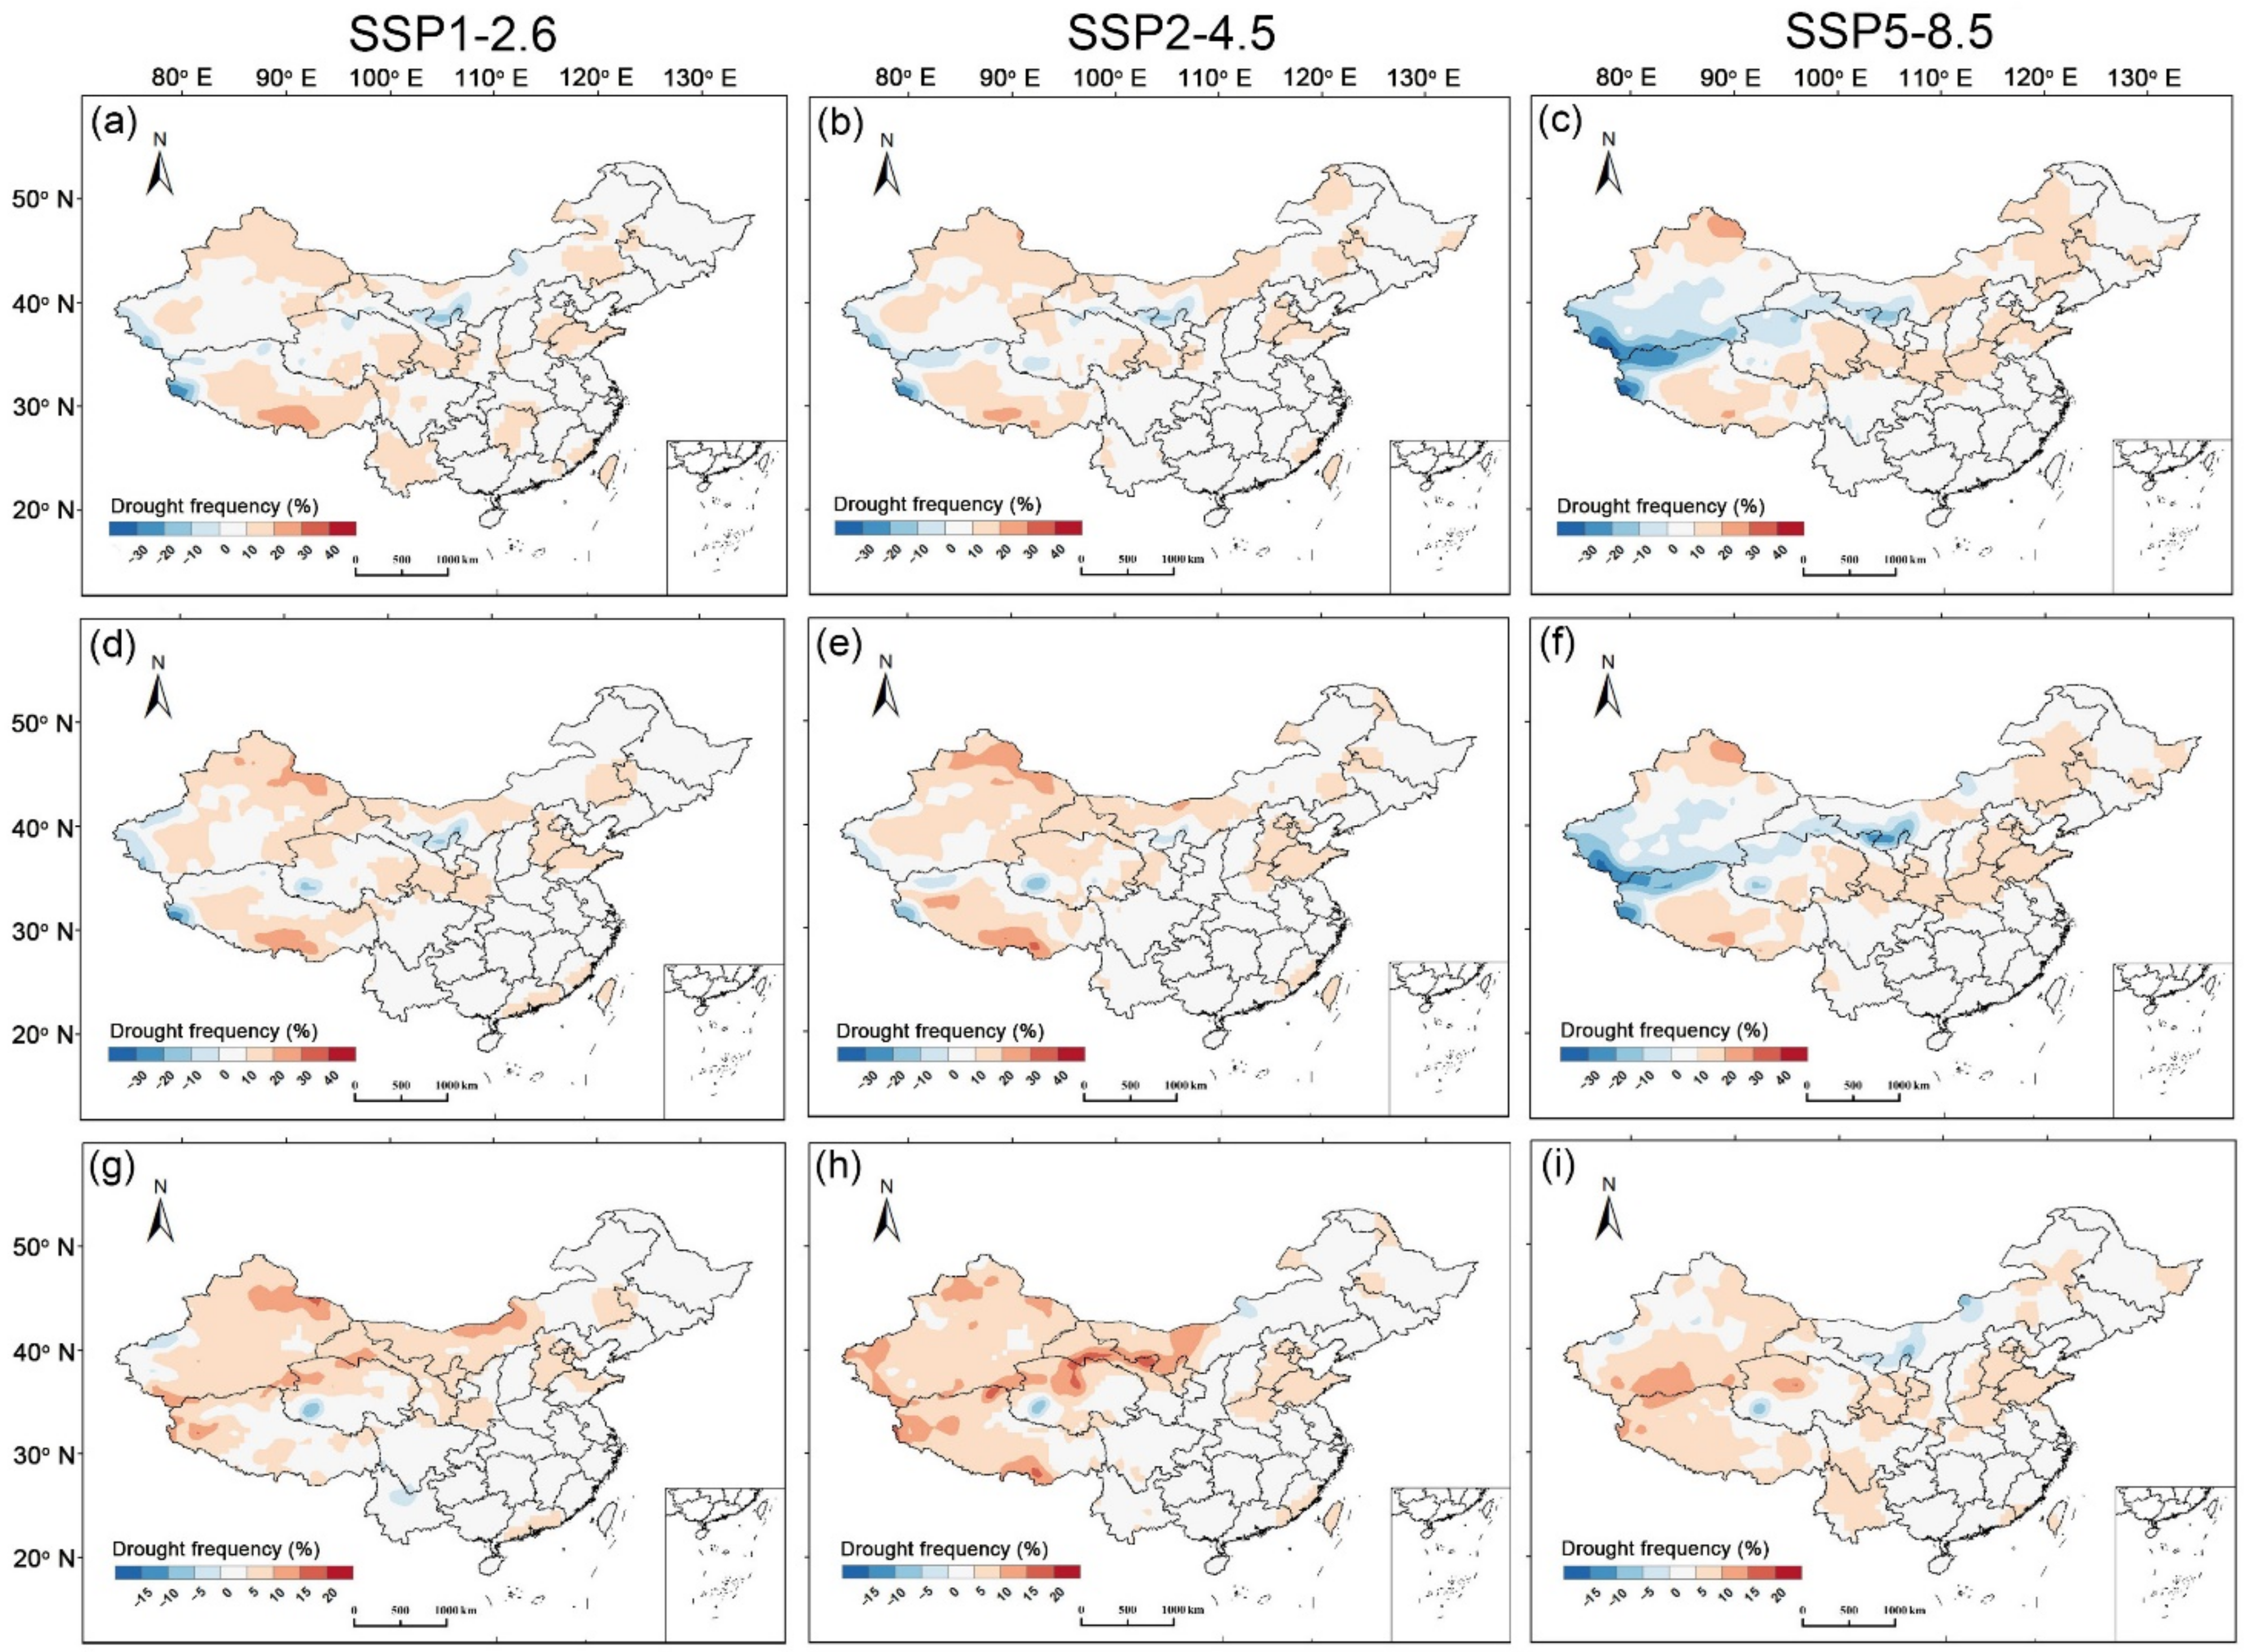
Figure 5 shows the spatial distribution of drought frequency during different global warming periods. In general, the drought frequencies will both be enhanced in northwestern China in the 1.5 °C (Figure 5a–c) and 2 °C (Figure 5d–f) global warming periods, relative to the reference period. Compared with the 1.5 °C global warming period, the drought frequency will increase more in the 2 °C global warming period, especially in northwestern China (e.g., Xinjiang, Qinghai, and Inner Mongolia). In terms of different scenarios, under SSP1−2.6 and SSP2−4.5, the drought frequency in the northwest, southwest, and Huang−Huai−Hai Plain will increase significantly as a whole. Under SSP5−8.5, compared with the 1.5 °C global warming period, the drought frequencies in parts of northwestern China (e.g., Inner Mongolia and Qinghai) will decrease, while the drought frequencies in southwestern China and the Yellow River Basin will increase more.
3.4. Changes in Cropland Exposure to Droughts
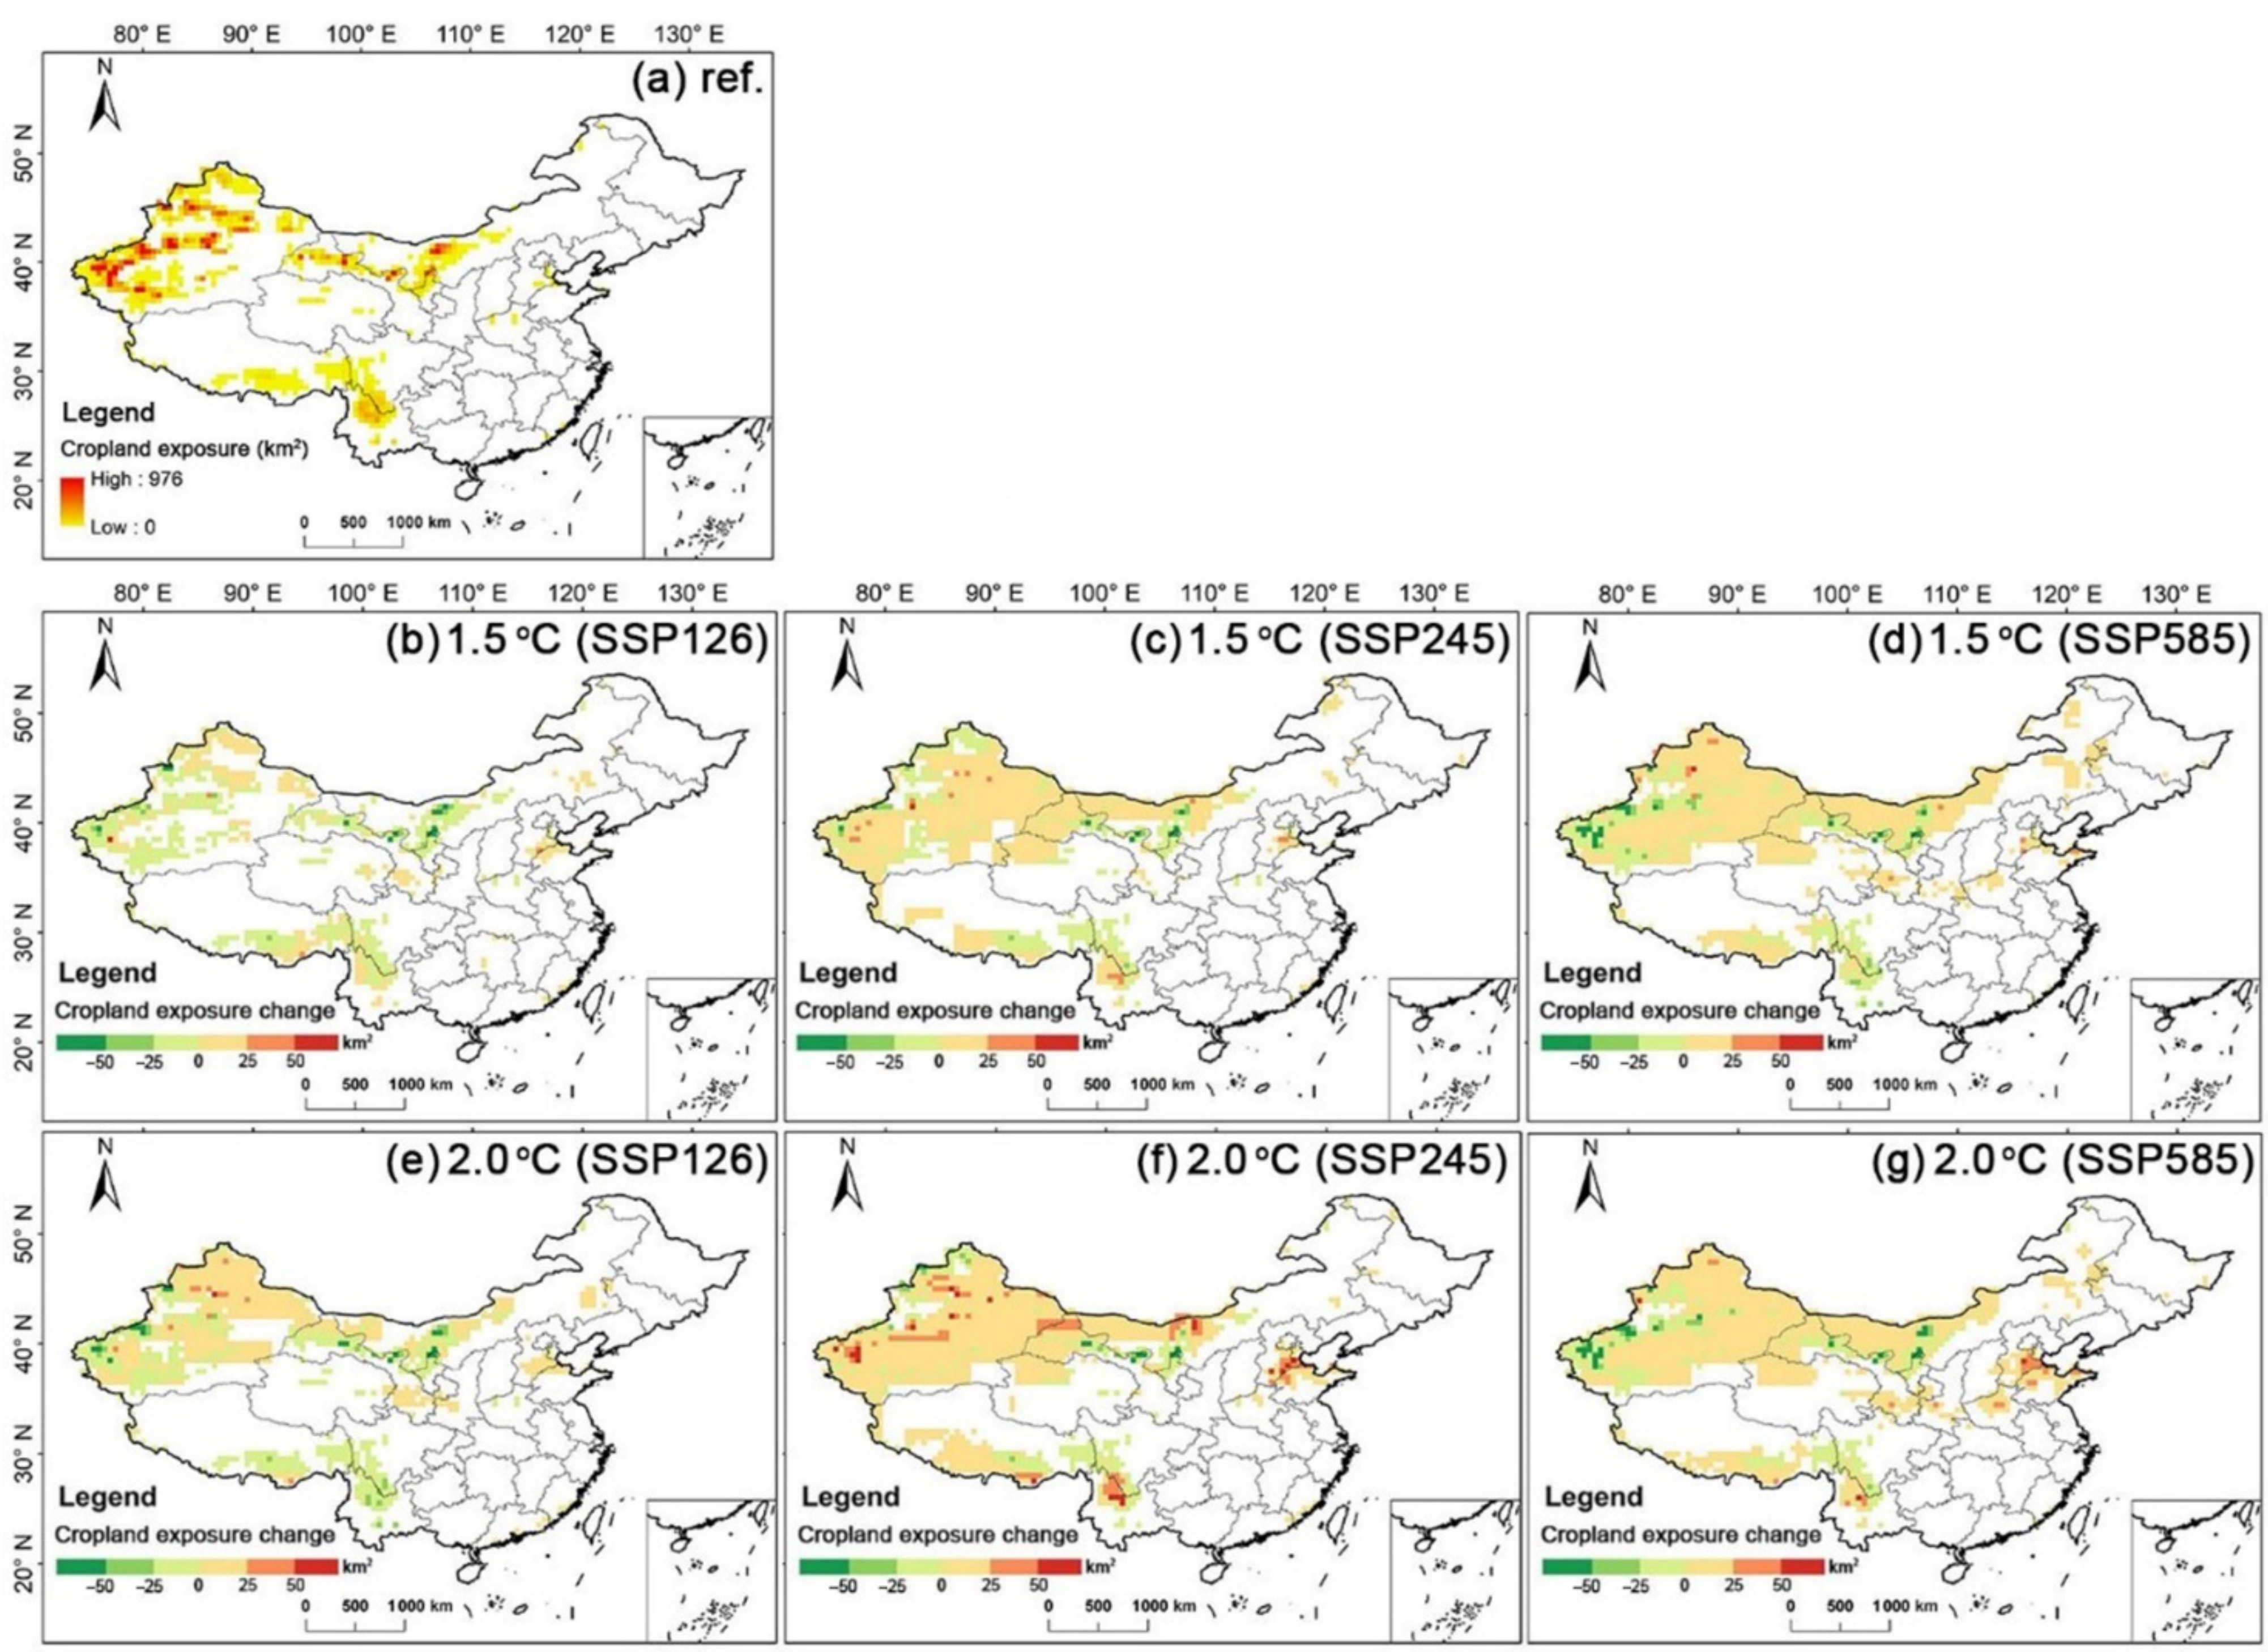
Figure 6a shows the cropland exposure to droughts in the reference period (1995–2014), and Figure 6b–g show the changes in cropland exposure to droughts during global warming periods of 1.5 °C and 2.0 °C, relative to the reference period. Higher cropland exposure to droughts is generally observed in northwestern and southwestern China during the reference period. In addition, in comparison to the reference period, enhanced cropland exposure to droughts during the two global warming periods is detected, especially during the 2.0 °C global warming period. To be specific, compared to SSP1−2.6, the cropland exposure to droughts under SSP2−4.5 will greatly increase in northwestern China under 1.5 °C global warming. Such an increasing trend will be amplified in northwestern China and the Yellow River Basin under SSP5−8.5. The spatial distribution of the cropland exposure to droughts under global warming conditions of 2.0 °C is similar to the situation under global warming conditions of 1.5 °C, but with a more significant increasing trend, especially under SSP2−4.5. It should be noted that the future cropland exposure will also increase more in the Huang−Huai−Hai Plain, especially during the 2.0 °C global warming period.
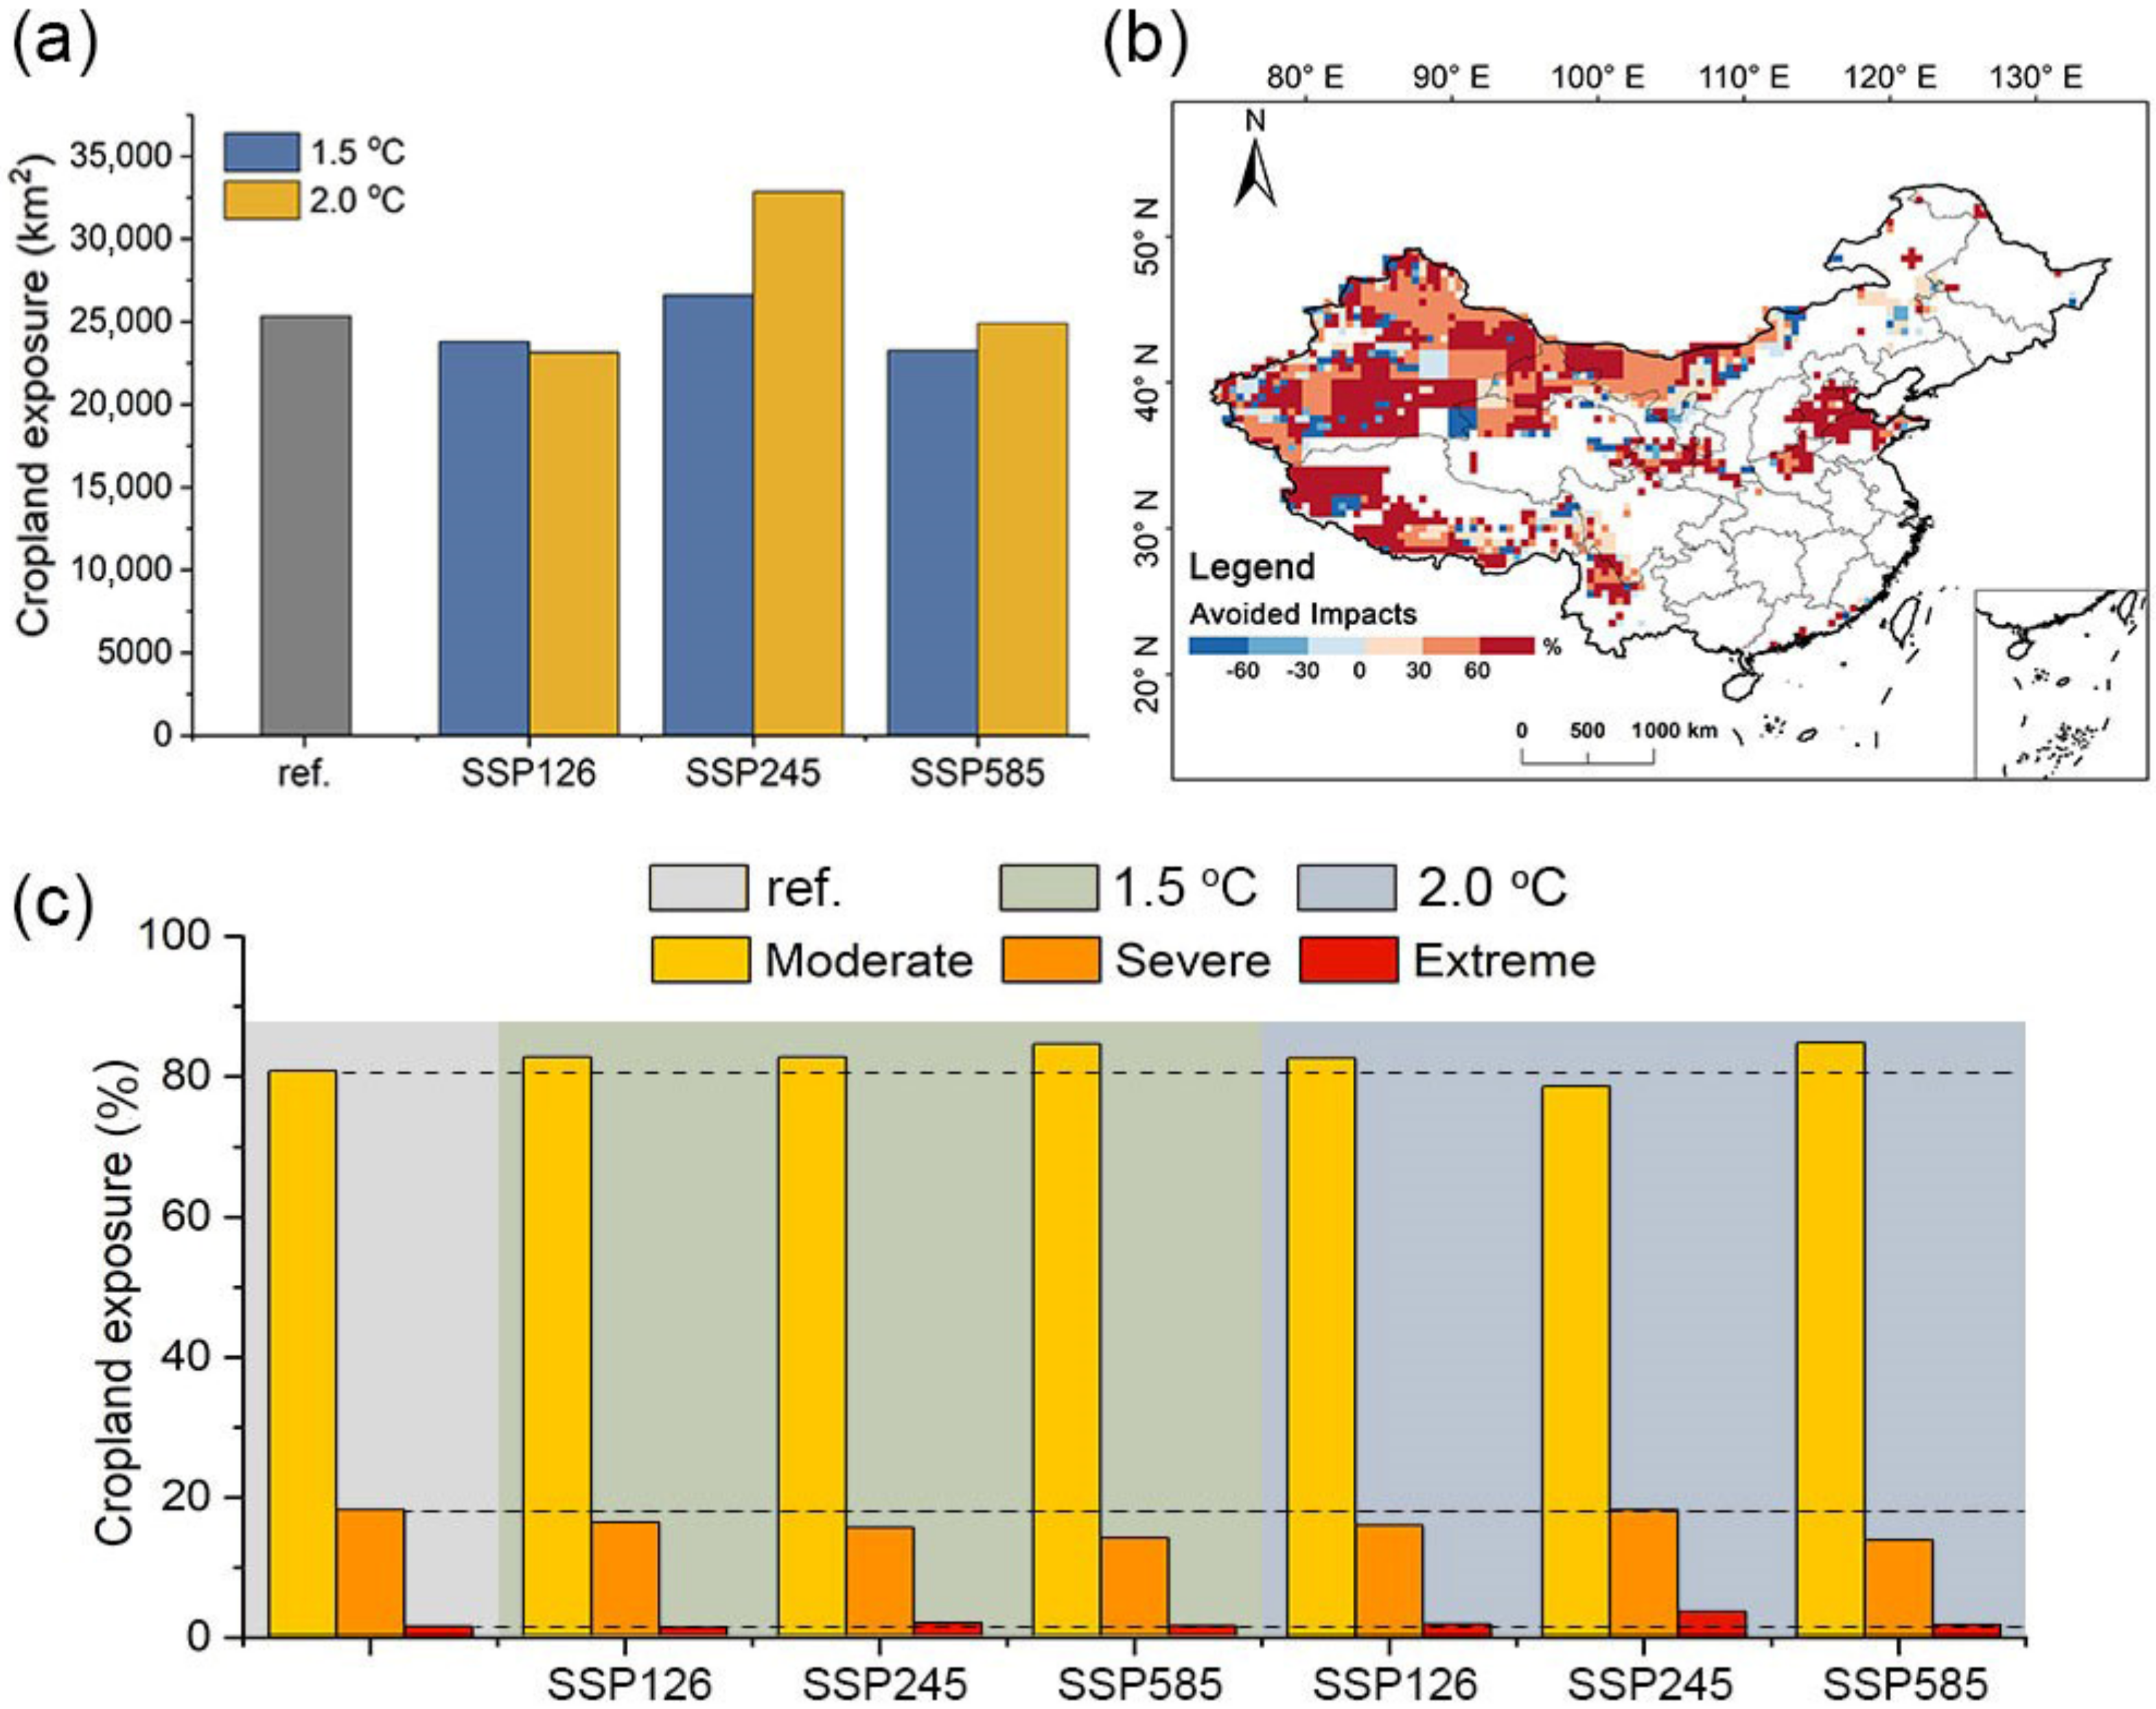
The total cropland exposure to droughts in the reference period is 25,347 km2 (Figure 7a). Under global warming of 1.5 °C, the cropland exposure to droughts under SSP1−2.6, SSP2−4.5, and SSP5-8.5 is 23,789 km2, 26,617 km2, and 23,256 km2, respectively (Figure 7a). However, under the global warming of 2 °C, the cropland exposure to droughts decreased to 23,141 km2 under SSP1−2.6, but increased to 32,854 km2 under SSP2−4.5 and 24,888 km2 under SSP5−8.5 (Figure 7a). In comparison to the reference period, the cropland exposure to droughts will decrease under SSP1−2.6 and SSP5−8.5, but increase under SSP2−4.5 in both 1.5 °C and 2.0 °C global warming periods. Furthermore, if the rise in global mean temperature is limited to 1.5 °C instead of 2 °C, the avoided impact will exceed 30%, especially in northwestern China, southwestern China, and the Huang−Huai−Hai region (Figure 7b). In addition, Figure 7c shows the cropland exposure to different kinds of droughts. We also found that the projected increase in cropland exposure mostly resulted from the moderate drought, which accounts for nearly 83.2% in the 1.5 °C global warming period and 81.8% in the 2 °C global warming period. The projected cropland exposure to extreme droughts only accounts for about 1.6% in the 1.5 °C global warming period and 2.3% in the 2 °C global warming period. That means, compared with the reference period (80.6% cropland exposure to moderate drought and 1.4% cropland exposure to extreme drought), the cropland exposure to moderate droughts and extreme droughts will increase in both the 1.5 °C and 2 °C global warming periods.
4. Discussion
Most CMIP6 models suggest that there will be a rise of 1.5 °C and 2 °C in global mean annual temperature by 2030 and 2050, respectively [66,67]. As the time is approaching, it is urgent to determine future drought conditions and their potential impacts on agricultural land. Our results indicate that both temperature and precipitation will increase rapidly in the mid−to−late 21st century, especially under the moderate–high emissions scenarios. Compared with 1.5 °C global warming, the overall drought severity and drought area in China will increase more in 2 °C global warming, especially under SSP2−4.5 and SSP5−8.5. This conclusion is in line with Su et al. [4] and Chen and Sun [17]. Our results also demonstrated that droughts will still be severe in northwestern China during 1.5 °C and 2 °C global warming periods. Qin et al. [68] reached a similar conclusion, that moderate and severe droughts will dominate in most of northwestern China during 2015–2100. This is mainly due to the rise in temperature in northern China [67]. We, therefore, should pay more attention to the occurrence of drought and its impacts on agricultural production particularly in northwestern China [69]. Moreover, southern China (especially southeastern China) is projected to witness even worse droughts during 1.5 °C and 2 °C global warming periods, especially under the SSP2−4.5 and SSP5−8.5. This is also consistent with the finding of Su et al. [19], which mentioned that increased changes in drought intensity were also found in humid regions (e.g., southeastern China). As a primary component of the water cycle, the evapotranspiration may influence the severe drought in a warmer context, to a large extent [70]. In addition, Su et al. [4] found that the evapotranspiration increased significantly in southern China during the 2 °C global warming period. Therefore, a possible explanation is that the growth of evapotranspiration in southern China exceed the increase in precipitation under the 2 °C global warming, although precipitation is projected to increase rapidly in the global warming world [19]. It should also be noted that the drought severity in southwestern China will also escalate in global warming periods of 1.5 °C and 2 °C. Considering the negative impact of the 2009–2012 extreme drought events in southwestern China on the local ecosystem [71] as well as our projections, China needs to preplan to combat the impacts posed by droughts in this region.
Agriculture is one of the most valuable fields among economic sectors, but climate change is altering the weather and, thus, it has a direct, biophysical effect on agricultural productivity [72]. To determine the potential impacts of drought on cropland, we calculated the cropland exposure to drought during global warming periods of 1.5 °C and 2 °C. Similar to the study of Spinoni et al. [73], our study also suggested that the cropland exposure to droughts will overall increase in the global warming period of 2.0 °C compared with the global warming period of 1.5 °C. A possible explanation is the increase in drought frequencies in the 2 °C global warming period, especially in northwestern China. In addition, we found that the spatial patterns of drought severities are distinct from those of cropland exposure to droughts in global warming periods of 1.5 °C and 2 °C. The overall cropland exposure to droughts exhibits an increasing pattern, especially in northwestern China, southwestern China, and the Huang−Huai−Hai region, while the drought severities are projected to increase noticeably in southwestern China and southeastern China. This may be related to the fact that drought severities are projected to increase more in southeastern China while drought frequencies are projected to be relatively lower. Considering there is no apparent difference in cropland area between the future and reference period (Figure S2), the increased cropland exposure to droughts in northwestern China, southwestern China, and the Huang-Huai-Hai region is probably due to the increasing drought frequencies.
We also found that the projected increase in cropland exposure in the 1.5 °C and 2 °C global warming periods mostly resulted from the moderate and extreme droughts, which is probably rooted in the increase in drought frequencies of moderate and extreme droughts. Considering the high incidence of moderate droughts in China and the destructive effects brought about by extreme droughts, China urgently needs to limit the adverse impacts on agriculture and develop strong measures to minimize the occurrences of droughts. In addition, if the rise in global mean temperature is limited to 1.5 °C, instead of 2 °C, the avoided impact will exceed 30%, especially in northwestern China, southwestern China, and Huang−Huai−Hai plain. From this perspective, the mitigation of warming by 0.5 °C is crucial to reduce cropland exposure, especially exposure to extreme droughts.
5. Conclusions
Taking advantage of the bias-corrected CMIP6 model simulations and the land-use datasets, we examined the spatiotemporal variations in drought conditions and cropland exposure to droughts in China under 1.5 °C/2 °C global warming scenarios. Results show that both the overall drought severity and frequency are projected to increase during the global warming period of 2 °C, compared with the global warming period of 1.5 °C. In terms of the distribution, the projected droughts will still dominate in northwestern China during global warming periods of 1.5 °C and 2 °C. Interestingly, a sudden increase in the drought severity is projected in humid, southeastern China, especially under SSP2−4.5 and SSP5−8.5, which may be related to the growth of evapotranspiration and the increase in precipitation in southern China under the 2 °C global warming condition. Meanwhile, cropland exposure to droughts exhibits an increasing trend in northwestern China, southwestern China, and the Huang−Huai−Hai region, in response to the 0.5 °C additional warming. We also found that the growing cropland exposure to droughts in the 2 °C global warming period is probably induced by the increased frequencies of moderate and extreme droughts. In addition, if the rise in global mean temperature is limited to 1.5 °C, instead of 2 °C, the avoided impact (the potential reduction in the cropland exposure to droughts) will exceed 30% in most areas in China. This study also proves the importance of mitigating global warming by 0.5 °C, which is crucial for climate adaptation policies and strategies in the 21st century.
Supplementary Materials
The following supporting information can be downloaded at: https://www.mdpi.com/article/10.3390/atmos13071035/s1. Figure S1. Comparison of muti-year monthly average temperature (a) and total precipitation (b) over China based on climate observations and CMIP6 outputs for 1961–2014; Figure S2. Spatial distribution of cropland area (km2) for the reference period (1995–2014) (a), the 1.5 °C global warming period (b–d), and the 2 °C global warming period (e–g).
Author Contributions
Conceptualization, L.M. and J.Z.; methodology, L.M. and J.Z.; supervision, L.M.; writing—original draft, L.M., J.Z., G.R.K. and R.L.; writing—review and editing, L.M. and G.R.K. All authors have read and agreed to the published version of the manuscript.
Funding
This study was financially supported by the National Key Research and Development Program of China (2019YFC1510200), the Key Project of National Social and Scientific Fund Program (16ZDA047), the Natural Science Foundation of Jiangsu Province (SBK2020040616), the Natural Science Foundation of the Jiangsu Higher Education Institutions of China (21KJB170003), and the National Natural Science Foundation of China (4210010673).
Data Availability Statement
All data resources are provided in the manuscript with links.
Acknowledgments
Giri Raj Kattel and Lijuan Miao would like to acknowledge Longshan at Nanjing University of Information Science and Technology.
Conflicts of Interest
The authors declare no conflict of interest. All the authors declare that they have no known competing financial interests that could have appeared to influence the scientific work reported in this manuscript.
References
- IPCC. In Proceedings of the Summary for Policymakers. In Climate Change 2021: The Physical Science Basis. Contribution of Working Group I to the Sixth Assessment Report of the Intergovernmental Panel on Climate Change; Cambridge University Press: Cambridge, UK; New York, NY, USA, 2021. [Google Scholar]
- Karl, T.R.; Trenberth, K.E. Modern Global Climate Change. Science 2003, 302, 1719–1723. [Google Scholar] [CrossRef] [PubMed] [Green Version]
- IPCC. Managing the risks of extreme events and disasters to advance climate change adaptation. In A Special Report of Working Groups I and II of the Intergovernmental Panel on Climate Change; Cambridge University Press: Cambridge, UK; New York, NY, USA, 2012. [Google Scholar]
- Su, B.; Huang, J.; Fischer, T.; Wang, Y.; Kundzewicz, Z.W.; Zhai, J.; Sun, H.; Wang, A.; Zeng, X.; Wang, G. Drought losses in China might double between the 1.5 °C and 2.0 °C warming. Proc. Natl. Acad. Sci. USA 2018, 115, 10600–10605. [Google Scholar] [CrossRef] [PubMed] [Green Version]
- IPCC. Global Warming of 1.5 °C. An IPCC Special Report on the Impacts of Global Warming of 1.5 °C above Pre-Industrial Levels and Related Global Greenhouse Gas Emission Pathways, in the Context of Strengthening the Global Response to the Threat of Climate Change, Sustainable Development, and Efforts to Eradicate Poverty; Cambridge University Press: Cambridge, UK; New York, NY, USA, 2018. [Google Scholar]
- Fahad, S.; Saud, S.; Chen, Y.; Wu, C.; Wang, D.E. Abiotic Stress in Plants; IntechOpen: London, UK, 2021. [Google Scholar]
- Zhao, T.; Dai, A. CMIP6 Model-Projected Hydroclimatic and Drought Changes and Their Causes in the Twenty-First Century. J. Clim. 2022, 35, 897–921. [Google Scholar]
- Burke, E.J.; Brown, S.J.; Christidis, N. Modeling the recent evolution of global drought and projections for the twenty-first century with the Hadley Centre climate model. J. Hydrometeorol. 2006, 7, 1113–1125. [Google Scholar] [CrossRef]
- Dai, A. Increasing drought under global warming in observations and models. Nat. Clim. Chang. 2013, 3, 52–58. [Google Scholar] [CrossRef]
- Chen, H.; Sun, J. Changes in Drought Characteristics over China Using the Standardized Precipitation Evapotranspiration Index. J. Clim. 2015, 28, 5430–5447. [Google Scholar] [CrossRef]
- Han, X.; Wu, J.; Zhou, H.; Liu, L.; Yang, J.; Shen, Q.; Wu, J. Intensification of historical drought over China based on a multi-model drought index. Int. J. Climatol. 2020, 40, 5407–5419. [Google Scholar] [CrossRef]
- Zhai, J.; Huang, J.; Su, B.; Cao, L.; Wang, Y.; Jiang, T.; Fischer, T. Intensity–area–duration analysis of droughts in China 1960–2013. Clim. Dyn. 2016, 48, 151–168. [Google Scholar] [CrossRef]
- Yu, M.; Li, Q.; Hayes, M.J.; Svoboda, M.D.; Heim, R.R. Are droughts becoming more frequent or severe in China based on the Standardized Precipitation Evapotranspiration Index: 1951–2010? Int. J. Climatol. 2014, 34, 545–558. [Google Scholar] [CrossRef]
- Zhou, L.; Wu, J.; Mo, X.; Zhou, H.; Diao, C.; Wang, Q.; Chen, Y.; Zhang, F. Quantitative and detailed spatiotemporal patterns of drought in China during 2001–2013. Sci. Total Environ. 2017, 589, 136–145. [Google Scholar] [CrossRef]
- Zhang, H.B.; Zhang, H.Y.; Chen, L.; Guo, J.P.; Shan, H.T.; Shang, J.L.; Liu, D.J. Anomalous Circulation of Droughts over the Middle and Lower Reaches of the Yangtze River in Spring of 2011. Mod. Agric. Sci. Technol. 2018, 7, 227–230. [Google Scholar]
- Qiu, J. China drought highlights future climate threats: Yunnan’s worst drought for many years has been exacerbated by destruction of forest cover and a history of poor water management. Nature 2010, 465, 142–144. [Google Scholar] [CrossRef] [PubMed] [Green Version]
- Chen, H.; Sun, J. Increased population exposure to extreme droughts in China due to 0.5 °C of additional warming. Environ. Res. Lett. 2019, 14, 064011. [Google Scholar] [CrossRef]
- Guo, H.; Bao, A.; Liu, T.; Jiapaer, G.; Ndayisaba, F.; Jiang, L.; Kurban, A.; De Maeyer, P. Spatial and temporal characteristics of droughts in Central Asia during 1966–2015. Sci. Total Environ. 2018, 624, 1523–1538. [Google Scholar] [CrossRef] [PubMed]
- Su, B.; Huang, J.; Mondal, S.K.; Zhai, J.; Wang, Y.; Wen, S.; Gao, M.; Lv, Y.; Jiang, S.; Jiang, T.; et al. Insight from CMIP6 SSP-RCP scenarios for future drought characteristics in China. Atmos. Res. 2021, 250, 105375. [Google Scholar] [CrossRef]
- Li, S.; Miao, L.; Jiang, Z.; Wang, G.; Gnyawali, K.R.; Zhang, J.; Zhang, H.; Fang, K.; He, Y.; Li, C. Projected drought conditions in Northwest China with CMIP6 models under combined SSPs and RCPs for 2015–2099. Adv. Clim. Change Res. 2020, 11, 210–217. [Google Scholar] [CrossRef]
- Dai, A. Drought under global warming: A review. Wiley Interdiscip. Rev. Clim. Chang. 2011, 2, 45–65. [Google Scholar] [CrossRef] [Green Version]
- McKee, T.B.; Doesken, N.J.; Kleist, J. The relationship of drought frequency and duration to time scales. In Proceedings of the 8th Conference on Applied Climatology, Anaheim, CA, USA, 17–22 January 1993; pp. 179–183. [Google Scholar]
- Vicente-Serrano, S.M.; Beguería, S.; López-Moreno, J.I. A multiscalar drought index sensitive to global warming: The standardized precipitation evapotranspiration index. J. Clim. 2010, 23, 1696–1718. [Google Scholar] [CrossRef] [Green Version]
- Palmer, W.C. Meteorological Drought; US Department of Commerce, Weather Bureau: Washington, DC, USA, 1965. [Google Scholar]
- Mishra, A.K.; Singh, V.P. A review of drought concepts. J. Hydrol. 2010, 391, 202–216. [Google Scholar] [CrossRef]
- Farahmand, A.; AghaKouchak, A. A generalized framework for deriving nonparametric standardized drought indicators. Adv. Water Resour. 2015, 76, 140–145. [Google Scholar] [CrossRef]
- Ayantobo, O.O.; Wei, J. Appraising regional multi-category and multi-scalar drought monitoring using standardized moisture anomaly index (SZI): A water-energy balance approach. J. Hydrol. 2019, 579, 124139. [Google Scholar] [CrossRef]
- Yang, Y.; Donohue, R.J.; McVicar, T.R.; Roderick, M.L. An analytical model for relating global terrestrial carbon assimilation with climate and surface conditions using a rate limitation framework. Geophys. Res. Lett. 2015, 42, 9825–9835. [Google Scholar] [CrossRef] [Green Version]
- Paulo, A.; Rosa, R.; Pereira, L. Climate trends and behaviour of drought indices based on precipitation and evapotranspiration in Portugal. Nat. Hazards Earth Syst. Sci. 2012, 12, 1481–1491. [Google Scholar] [CrossRef]
- Dai, A. Characteristics and trends in various forms of the Palmer Drought Severity Index during 1900–2008. J. Geophys. Res. 2011, 116, D12. [Google Scholar] [CrossRef] [Green Version]
- Dai, A.; Trenberth, K.E.; Qian, T. A global dataset of Palmer Drought Severity Index for 1870–2002: Relationship with soil moisture and effects of surface warming. J. Hydrometeorol. 2004, 5, 1117–1130. [Google Scholar] [CrossRef]
- Andreadis, K.M.; Clark, E.A.; Wood, A.W.; Hamlet, A.F.; Lettenmaier, D.P. Twentieth-Century Drought in the Conterminous United States. J. Hydrometeorol. 2005, 6, 985–1001. [Google Scholar] [CrossRef]
- Sheffield, J.; Andreadis, K.M.; Wood, E.F.; Lettenmaier, D.P. Global and Continental Drought in the Second Half of the Twentieth Century: Severity-Area-Duration Analysis and Temporal Variability of Large-Scale Events J. Clim. 2009, 22, 1962–1981. [Google Scholar] [CrossRef]
- Wells, N.; Goddard, S.; Hayes, M.J. A self-calibrating Palmer drought severity index. J. Clim. 2004, 17, 2335–2351. [Google Scholar] [CrossRef]
- Van der Schrier, G.; Briffa, K.; Osborn, T.; Cook, E. Summer moisture availability across North America. J. Geophys. Res. Atmos. 2006, 111, D11. [Google Scholar] [CrossRef]
- Van der Schrier, G.; Efthymiadis, D.; Briffa, K.; Jones, P. European Alpine moisture variability for 1800–2003. Int. J. Climatol. 2007, 27, 415–427. [Google Scholar] [CrossRef] [Green Version]
- Yang, Q.; Li, M.; Zheng, Z.; Ma, Z. Regional applicability of seven meteorological drought indices in China. Sci. China Earth Sci. 2017, 47, 337–353. [Google Scholar] [CrossRef]
- Mukherjee, S.; Mishra, A.; Trenberth, K.E. Climate Change and Drought: A Perspective on Drought Indices. Curr. Clim. Chang. Rep. 2018, 4, 145–163. [Google Scholar] [CrossRef]
- UNDESA. The World’s Cities in 2016; United Nations: New York, NY, USA, 2016. [Google Scholar]
- Field, C.B.; Barros, V.R. Climate Change 2014–Impacts, Adaptation and Vulnerability: Regional Aspects; Cambridge University Press: Cambridge, UK; New York, NY, USA, 2014. [Google Scholar]
- Chen, J.; Liu, Y.; Pan, T.; Liu, Y.; Sun, F.; Ge, Q. Population exposure to droughts in China under the 1.5 °C global warming target. Earth Syst. Dyn. 2018, 9, 1097–1106. [Google Scholar] [CrossRef] [Green Version]
- Sun, H.; Wang, Y.; Chen, J.; Zhai, J.; Jing, C.; Zeng, X.; Ju, H.; Zhao, N.; Zhan, M.; Luo, L.; et al. Exposure of population to droughts in the Haihe River Basin under global warming of 1.5 and 2.0 °C scenarios. Quat. Int. 2017, 453, 74–84. [Google Scholar] [CrossRef]
- China Meteorological Administration. Yearbook of Meteorological Disasters in China; Meteorological Press of China: Beijing, China, 2019. [Google Scholar]
- Rosegrant Mark, W.; Cline Sarah, A. Global Food Security: Challenges and Policies. Science 2003, 302, 1917–1919. [Google Scholar] [CrossRef] [Green Version]
- Kang, Y.; Khan, S.; Ma, X. Climate change impacts on crop yield, crop water productivity and food security—A review. Prog. Nat. Sci. 2009, 19, 1665–1674. [Google Scholar] [CrossRef]
- He, X.; Estes, L.; Konar, M.; Tian, D.; Anghileri, D.; Baylis, K.; Evans, T.P.; Sheffield, J. Integrated approaches to understanding and reducing drought impact on food security across scales. Curr. Opin. Environ. Sustain. 2019, 40, 43–54. [Google Scholar] [CrossRef]
- UNFCCC. Report of the ad hoc working group on the Durban platform for enhanced action on the eighth part of its second session, held in Geneva from 8 to 13 February 2015. In Proceedings of the United Nations Framework Convention on Climate Change, Geneva, Switzerland, 8–13 February 2015; United Nations: Geneva, Switzerland, 2015. [Google Scholar]
- Jiang, D.; Sui, Y.; Lang, X. Timing and associated climate change of a 2 °C global warming. Int. J. Climatol. 2016, 36, 4512–4522. [Google Scholar] [CrossRef]
- King, A.D.; Karoly, D.J.; Henley, B.J. Australian climate extremes at 1.5 °C and 2 °C of global warming. Nat. Clim. Chang. 2017, 7, 412–416. [Google Scholar] [CrossRef]
- Paltan, H.; Allen, M.; Haustein, K.; Fuldauer, L.; Dadson, S. Global implications of 1.5 °C and 2 °C warmer worlds on extreme river flows. Environ. Res. Lett. 2018, 13, 094003. [Google Scholar] [CrossRef]
- Meehl, G.A.; Boer, G.J.; Covey, C.; Latif, M.; Stouffer, R.J. Intercomparison makes for a better climate model. Eos Trans. Am. Geophys. Union 1997, 78, 445–451. [Google Scholar] [CrossRef]
- Eyring, V.; Bony, S.; Meehl, G.A.; Senior, C.A.; Stevens, B.; Stouffer, R.J.; Taylor, K.E. Overview of the Coupled Model Intercomparison Project Phase 6 (CMIP6) experimental design and organization. Geosci. Model Dev. 2016, 9, 1937–1958. [Google Scholar] [CrossRef] [Green Version]
- O’Neill, B.C.; Tebaldi, C.; Van Vuuren, D.P.; Eyring, V.; Friedlingstein, P.; Hurtt, G.; Knutti, R.; Kriegler, E.; Lamarque, J.-F.; Lowe, J. The scenario model intercomparison project (ScenarioMIP) for CMIP6. Geosci. Model Dev. 2016, 9, 3461–3482. [Google Scholar] [CrossRef] [Green Version]
- Zhu, H.; Jiang, Z.; Li, J.; Li, W.; Sun, C.; Li, L. Does CMIP6 Inspire More Confidence in Simulating Climate Extremes over China? Adv. Atmos. Sci. 2020, 37, 1119–1132. [Google Scholar] [CrossRef]
- O’Neill, B.C.; Kriegler, E.; Riahi, K.; Ebi, K.L.; Hallegatte, S.; Carter, T.R.; Mathur, R.; van Vuuren, D.P. A new scenario framework for climate change research: The concept of shared socioeconomic pathways. Clim. Chang. 2014, 122, 387–400. [Google Scholar] [CrossRef] [Green Version]
- O’Neill, B.C.; Kriegler, E.; Ebi, K.L.; Kemp-Benedict, E.; Riahi, K.; Rothman, D.S.; van Ruijven, B.J.; van Vuuren, D.P.; Birkmann, J.; Kok, K. The roads ahead: Narratives for shared socioeconomic pathways describing world futures in the 21st century. Glob. Environ. Chang. 2017, 42, 169–180. [Google Scholar] [CrossRef] [Green Version]
- Li, H.; Sheffield, J.; Wood, E.F. Bias correction of monthly precipitation and temperature fields from Intergovernmental Panel on Climate Change AR4 models using equidistant quantile matching. J. Geophys. Res. Atmos. 2010, 115, D10. [Google Scholar] [CrossRef]
- Wood, A.W.; Leung, L.R.; Sridhar, V.; Lettenmaier, D.P. Hydrologic Implications of Dynamical and Statistical Approaches to Downscaling Climate Model Outputs. Clim. Chang. 2004, 62, 189–216. [Google Scholar] [CrossRef]
- Hurtt, G.C.; Chini, L.; Sahajpal, R.; Frolking, S.; Bodirsky, B.L.; Calvin, K.; Doelman, J.C.; Fisk, J.; Fujimori, S.; Klein Goldewijk, K.; et al. Harmonization of global land use change and management for the period 850–2100 (LUH2) for CMIP6. Geosci. Model Dev. 2020, 13, 5425–5464. [Google Scholar] [CrossRef]
- Sheffield, J.; Wood, E.F.; Roderick, M.L. Little change in global drought over the past 60 years. Nature 2012, 491, 435–438. [Google Scholar] [CrossRef]
- Milly, P.; Dunne, K.A. A hydrologic drying bias in water-resource impact analyses of anthropogenic climate change. J. Am. Water Resour. Assoc. 2017, 53, 822–838. [Google Scholar] [CrossRef]
- Wang, G.; Gong, T.; Lu, J.; Lou, D.; Hagan, D.F.T.; Chen, T. On the long-term changes of drought over China (1948–2012) from different methods of potential evapotranspiration estimations. Int. J. Climatol. 2018, 38, 2954–2966. [Google Scholar] [CrossRef]
- Jones, B.; O’Neill, B.C.; McDaniel, L.; McGinnis, S.; Mearns, L.O.; Tebaldi, C. Future population exposure to US heat extremes. Nat. Clim. Chang. 2015, 5, 652–655. [Google Scholar] [CrossRef]
- Li, X.; Ting, M. Understanding the Asian summer monsoon response to greenhouse warming: The relative roles of direct radiative forcing and sea surface temperature change. Clim. Dyn. 2017, 49, 2863–2880. [Google Scholar] [CrossRef]
- Li, Q.; Zhang, L.; Xu, W.; Zhou, T.; Wang, J.; Zhai, P.; Jones, P. Comparisons of time series of annual mean surface air temperature for China since the 1900s: Observations, model simulations, and extended reanalysis. Bull. Am. Meteorol. Soc. 2017, 98, 699–711. [Google Scholar] [CrossRef] [Green Version]
- Tebaldi, C.; Debeire, K.; Eyring, V.; Fischer, E.; Fyfe, J.; Friedlingstein, P.; Knutti, R.; Lowe, J.; O’Neill, B.; Sanderson, B.; et al. Climate model projections from the Scenario Model Intercomparison Project (ScenarioMIP) of CMIP6. Earth Syst. Dynam. 2021, 12, 253–293. [Google Scholar] [CrossRef]
- Zhang, G.; Zeng, G.; Yang, X.; Jiang, Z. Future Changes in Extreme High Temperature over China at 1.5 °C–5 °C Global Warming Based on CMIP6 Simulations. Adv. Atmos. Sci. 2021, 38, 253–267. [Google Scholar] [CrossRef]
- Qin, J.; Su, B.; Tao, H.; Wang, Y.; Huang, J.; Li, Z.; Jiang, T. Spatio-temporal variations of dryness/wetness over Northwest China under different SSPs-RCPs. Atmos. Res. 2021, 259, 105672. [Google Scholar] [CrossRef]
- Wang, H.L.; Gan, Y.; Wang, R.Y.; Niu, J.-y.; Zhao, H.; Yang, Q.; Li, G.C. Phenological trends in winter wheat and spring cotton in response to climate changes in northwest China. Agric. For. Meteorol. 2008, 148, 1242–1251. [Google Scholar] [CrossRef]
- Miao, L.; Li, S.; Zhang, F.; Chen, T.; Shan, Y.; Zhang, Y. Future drought in the drylands of Asia under the 1.5 °C and 2.0 °C warming scenarios. Earth’s Future 2020, 8, e2019EF001337. [Google Scholar] [CrossRef]
- Lin, W.; Wen, C.; Wen, Z.; Gang, H. Drought in Southwest China: A review. Atmos. Ocean. Sci. Lett. 2015, 8, 339–344. [Google Scholar]
- Fahad, S.; Hasanuzzaman, M.; Alam, M.; Ullah, H.; Saeed, M.; Khan, I.A.; Adnan, M.E. Environment, Climate, Plant and Vegetation Growth; Springer: Cham, Switzerland, 2020. [Google Scholar]
- Spinoni, J.; Barbosa, P.; Bucchignani, E.; Cassano, J.; Cavazos, T.; Cescatti, A.; Christensen, J.H.; Christensen, O.B.; Coppola, E.; Evans, J.P. Global exposure of population and land-use to meteorological droughts under different warming levels and SSPs: A CORDEX-based study. Int. J. Climatol. 2021, 41, 6825–6853. [Google Scholar] [CrossRef]
Figure 1.
Taylor diagram of (a) annual mean temperature and (b) annual total precipitation for CMIP6 outputs, muti-model ensembles, and climate observations (1961–2014) in China.
Figure 1.
Taylor diagram of (a) annual mean temperature and (b) annual total precipitation for CMIP6 outputs, muti-model ensembles, and climate observations (1961–2014) in China.

Figure 2.
Variations and projections in (a) annual mean temperature and (b) annual total precipitation from 1995 to 2100 in China. Both annual mean temperature and annual total precipitation are detected to increase in China during 1995–2100, especially under SSP5−8.5.
Figure 2.
Variations and projections in (a) annual mean temperature and (b) annual total precipitation from 1995 to 2100 in China. Both annual mean temperature and annual total precipitation are detected to increase in China during 1995–2100, especially under SSP5−8.5.

Figure 3.
Drought severity (a) and drought area (b) in China for the reference period (1995–2014) and the 1.5 °C/2.0 °C global warming periods under SSP1−2.6, SSP2−4.5, and SSP5−8.5.
Figure 3.
Drought severity (a) and drought area (b) in China for the reference period (1995–2014) and the 1.5 °C/2.0 °C global warming periods under SSP1−2.6, SSP2−4.5, and SSP5−8.5.

Figure 4.
Spatial patterns of drought severity during (a) the reference period (1995–2014), (b–d) the 1.5 °C global warming period, and (e–g) the 2.0 °C global warming period.
Figure 4.
Spatial patterns of drought severity during (a) the reference period (1995–2014), (b–d) the 1.5 °C global warming period, and (e–g) the 2.0 °C global warming period.

Figure 5.
Spatial patterns of drought frequency change. (a–c) The 1.5 °C global warming period relative to the reference period (1995–2014), (d–f) the 2.0 °C global warming period relative to the reference period (1995–2014), and (g–i) the 2.0 °C global warming period relative to the 1.5 °C global warming period. Unit: %.

Figure 6.
Spatial distributions of the cropland exposure to droughts in the reference period (a), the 1.5 °C global warming period (b–d), and the 2.0 °C global warming period (e–g). Units: km2.
Figure 6.
Spatial distributions of the cropland exposure to droughts in the reference period (a), the 1.5 °C global warming period (b–d), and the 2.0 °C global warming period (e–g). Units: km2.

Figure 7.
(a) Cropland exposure to droughts in reference period and the 1.5/2.0 °C global warming periods, unit: km2; (b) Spatial distributions of the avoided impacts (the potential reduction in the cropland exposure to droughts) in China due to 0.5 °C less warming (limiting the global warming to 1.5 °C instead of 2.0 °C), unit: %; (c) Cropland exposure to moderate, severe, and extreme droughts in China in reference period and the 1.5/2.0 °C global warming periods, unit: %.


Table 1.
Detailed information of parameters in climatic datasets.
| Period | Parameter | Unit |
|---|---|---|
| History (1961–2014) | Monthly temperature | °C |
| Monthly precipitation | mm | |
| Monthly wind speed | m/s | |
| Future (2015–2100) | Monthly downward shortwave radiation | W/m2 |
| Monthly relative humidity | % |
Table 2.
Detailed information on CMIP6 models.
| Model Name | Modeling Group | Original Resolution |
|---|---|---|
| CanESM5 | Centre for Climate Modeling and Analysis, Canada | 2.8125° × 2.7906° |
| IPSL−CM6A−LR | Institute Pierre Simon Laplace, France | 2.5° × 1.2676° |
| MIROC6 | Atmosphere and Ocean Research Institute, Japan | 1.4063° × 1.4008° |
| MRI-ESM2-0 | Planck Meteorological Institute, Germany | 1.125° × 1.1215° |
Publisher’s Note: MDPI stays neutral with regard to jurisdictional claims in published maps and institutional affiliations. |
© 2022 by the authors. Licensee MDPI, Basel, Switzerland. This article is an open access article distributed under the terms and conditions of the Creative Commons Attribution (CC BY) license (https://creativecommons.org/licenses/by/4.0/).
Share and Cite
MDPI and ACS Style
Miao, L.; Zhang, J.; Kattel, G.R.; Liu, R. Increased Exposure of China’s Cropland to Droughts under 1.5 °C and 2 °C Global Warming. Atmosphere 2022, 13, 1035. https://doi.org/10.3390/atmos13071035
AMA Style
Miao L, Zhang J, Kattel GR, Liu R. Increased Exposure of China’s Cropland to Droughts under 1.5 °C and 2 °C Global Warming. Atmosphere. 2022; 13(7):1035. https://doi.org/10.3390/atmos13071035
Chicago/Turabian StyleMiao, Lijuan, Jing Zhang, Giri Raj Kattel, and Ran Liu. 2022. "Increased Exposure of China’s Cropland to Droughts under 1.5 °C and 2 °C Global Warming" Atmosphere 13, no. 7: 1035. https://doi.org/10.3390/atmos13071035
Note that from the first issue of 2016, this journal uses article numbers instead of page numbers. See further details here.