Article

Large-Scale Saharan Dust Episode in April 2019: Study of Desert Aerosol Loads over Sofia, Bulgaria, Using Remote Sensing, In Situ, and Modeling Resources

Institute of Electronics, Bulgarian Academy of Sciences, 72 Tsarigradsko Chaussee Blvd, 1784 Sofia, Bulgaria
*
Authors to whom correspondence should be addressed.
Atmosphere 2022, 13(6), 981; https://doi.org/10.3390/atmos13060981
Submission received: 22 April 2022 / Revised: 5 June 2022 / Accepted: 14 June 2022 / Published: 17 June 2022
(This article belongs to the Special Issue Atmospheric Composition and Regional Climate Studies in Bulgaria)

Abstract

:
Emissions of immense amounts of desert dust into the atmosphere, spreading over vast geographical areas, are in direct feedback relation with ongoing global climate changes. An extreme large-scale Saharan dust episode occurred over Mediterranean and Europe in April 2019, driven by a dynamic blocking synoptic pattern (omega block) creating conditions for a powerful northeastward circulation of air masses rich in dust and moisture. Here, we study and characterize the effects of related dust intrusion over Sofia, Bulgaria, using lidar remote sensing combined with in situ measurements, satellite imagery, and modeling data. Optical and microphysical parameters of the desert aerosols were obtained and vertically profiled, namely, backscatter coefficients and backscatter-related Ångström exponents, as well as statistical distributions of the latter as qualitative analogs of the actual particle size distributions. Dynamical and topological features of the dust-dominated aerosol layers were determined. Height profiles of the aerosol/dust mass concentration were obtained by synergistic combining and calibrating lidar and in situ data. The comparison of the retrieved mass concentration profiles with the dust modeling ones shows a satisfactory compliance. The local meteorological conditions and the aerosol composition and structure of the troposphere above Sofia during the dust event were seriously affected by the desert air masses.

1. Introduction

The natural and anthropogenic aerosols are important constituents [1,2] and major pollutants of the atmosphere [3]. They have significant impacts on the atmospheric chemistry and physics, energy balance, hydrological cycle, and visibility, thus affecting the biosphere, the ecological state of the environment, and human health. Aerosols have multiple direct and indirect effects on the atmospheric radiative properties [4,5,6], causing regional or even global climate changes [2,3,7]. The indirect aerosol effects include those on the physical, optical, and lifetime properties of clouds and, thus, on the precipitation regime, as they act as water/ice cloud condensation nuclei [6]. The fine fractions of the atmospheric aerosols are air pollutants endangering human health to a particularly high degree, since the particles easily penetrate the respiratory tract and the bloodstream upon inhalation, potentially causing serious health problems, such as lung cancer, cardiovascular and cardiopulmonary diseases, asthma, etc. [8,9].
Mineral dust is among the most widespread aerosol types strongly influencing the environment and human life in the various aspects mentioned above [10,11,12,13]. North Africa (Sahara Desert) is recognized to be the biggest area on Earth producing dust, with the mass of mineral particles emitted annually, reaching gigatons [14,15,16,17,18]. These tremendous amounts of dust are transported by air circulation systems thousands of kilometers across the Atlantic to North and South America, as well as to Europe and the Middle East [13,18,19,20,21,22,23]. A considerable part of these dust emissions crosses the Mediterranean and reaches mostly Southern and Central Europe, and less often the northern parts of the continent [10,13,23,24,25,26].
A number of studies have described the mechanism of desert dust transport from North Africa to Europe (see, e.g., [13,15,24,27]). In the spring-summer period of the year, the Saharan heat low [28], a near-surface thermal low-pressure system that is a significant component of the West African monsoon system [29], plays an important role in the Saharan dust spreading patterns. It manifests itself as an intensification of the humid southwestern monsoon flow from the Atlantic, as well as of the dry Harmatan from the north and east. Additionally, the high-energy Sharav cyclones, which usually appear in the spring and early summer, are able to mobilize large amounts of desert dust and transport them eastward over the Mediterranean basin [30]. For this reason, the most intense transport of dust from North Africa over the Mediterranean to Europe, including the Balkan Peninsula, happens mainly in spring and summer [31,32,33]. As a departure from this trend, some winter events of Saharan dust intrusions over Europe have been observed in recent years [34,35,36].
The normal course of the characteristic regional air circulations transporting dust is sometimes disrupted by blocking meteorological systems. These are synoptic situations in which the normal zonal flow of air masses is temporarily altered by the appearance of a flow sector with a high meridional component that obstructs the normal west–east movement of cyclone systems [37]. Examples of such blocking patterns are stationary ridges, omega blocks, dipole (Rex) blocks, Rosby wave breaking, etc. [38,39,40]. These synoptic patterns can create large areas of high atmospheric pressure with stable dry and clear weather conditions, or vice versa, such of low pressure and intense cloud transport and rainfalls. In particular, they can strongly influence the transfer of dust from Sahara over the Mediterranean and Europe, which naturally occurs in the predominant north–northeast nearly meridional direction.
Various measurement techniques are being utilized for atmospheric aerosol/dust tracking, detecting, and studying, including in situ sampling and passive or active remote sensing ones. Because of the desert aerosols’ natural distribution over large atmospheric domains with a high spatial and temporal dynamics, the remote sensing by ground, air and space-based passive and active sensors remains the main approach to studying and characterizing them [41,42,43,44,45].
The active remote sensing by lidars is a widely adopted and efficient technique for carrying out observations of atmospheric aerosols, including desert dust. Being particularly sensitive to changes in the atmospheric aerosol density, the lidar approach provides retrievals of vertical profiles characterizing the aerosol/dust optical and microphysical properties, such as backscattering or extinction coefficients and the Ångström exponent. Fixed or mobile ground-based lidar systems are used, as well as such mounted aboard aircrafts and satellites [32,44,46,47,48,49,50]. Lidars make it possible to determine the vertical stratification of aerosol layers and to monitor their dynamics with high spatial and temporal resolutions, reaching high altitudes. Modern lidar systems containing a variety of elastic, Raman and (de)polarization receiving channels allow complex and reliable characterization of aerosol properties, including determination of the degree of particles’ (non)sphericity [45,47,48]. Desert dust is one of the main types of aerosols being studied, which is due to its great climatological importance; systematic observations and analyses have been performed [32,42] by lidar networks around the world, such as the European Lidar Network (EARLINET) [51], a key component of the Aerosol, Clouds and Trace Gases Research Infrastructure (ACTRIS) [52].
An imperfection of the lidar technology is that it does not allow one to determine and/or profile some important quantitative aerosol characteristics, such as mass concentration and particle size distributions. Automated systems for environmental control provide in situ data from measurements of aerosol mass concentrations (PM2.5 and PM10). However, they are characterized by a high degree of locality of the measurements, lacking range resolution and spatial coverage. The appropriate combination of lidar data with in situ measurement data could make it possible to overcome the deficiencies of the two approaches and to calibrate the lidar data in view of achieving range profiling of the aerosol/dust mass concentration.
The passive satellite remote sensing plays an important role in detecting, identifying, and mapping the atmospheric aerosol/dust content, particularly in cases of studying atmospheric processes on intercontinental or global scale. The Moderate Resolution Imaging Spectroradiometer (MODIS) aboard the NASA’s Terra and Aqua satellites is a powerful and highly sensitive instrument for imaging and monitoring global dynamics and processes occurring on land and oceans, and in the lower atmosphere (including transport of aerosols and desert dust) [53]. Modeling and forecasting data from web-accessible resources are of great importance for determining the type and origin of aerosols, as well as for tracking their transport history to the place/time of observation [54,55,56,57].
In the second half of April 2019, an extreme massive large-scale Saharan dust episode was observed over the Mediterranean and Europe, spreading desert aerosols north to the polar region and west to the Caribbean [26,58,59,60]. In this paper, we report results of studying and characterizing the manifestations of this episode in the atmosphere above Sofia, Bulgaria, in the period 22–26 April 2019, after the long-range transport of desert aerosols, using lidar and in situ measurements combined with satellite imagery and modeling data.
The main objectives of the work are:
  • Studying and characterizing the optical and microphysical properties of the detected aerosol/dust layers, along with the topological and dynamical features of the aerosol/dust field density distribution; based on that, determining the strength of the dust event over Sofia, after the dust long-range transport.
  • Identifying the dust source areas, the driving synoptic mechanism and the connection between the large-scale spread and distribution of the dust plume with the regional air circulation systems; evaluating the effects of desert dust interaction with other aerosols during the transport and at the measurement site; assessing the impacts of the dust intrusion on the structure and composition of the local troposphere and meteorological conditions.
  • Exploring the possibilities for synergistic combination of data from lidar and in situ aerosol measurements to calibrate and convert retrieved vertical aerosol/dust backscatter profiles to mass concentration ones; comparing the latter with the available modeling/forecasting profiles of dust concentration and analyzing the degree of compliance in terms of shapes and values.
The paper content is organized as follows: After the introduction section, the applied instrumentation and methods are described in Section 2. The main results obtained of the conducted lidar and in situ measurements, along with those of dust/aerosol mass concentration profiling, are reported and discussed in Section 3, as are the results concerning Saharan dust transport modeling/forecasting and data reanalysis. The basic conclusions of the work are summarized in Section 4.

2. Instrumentation and Methods

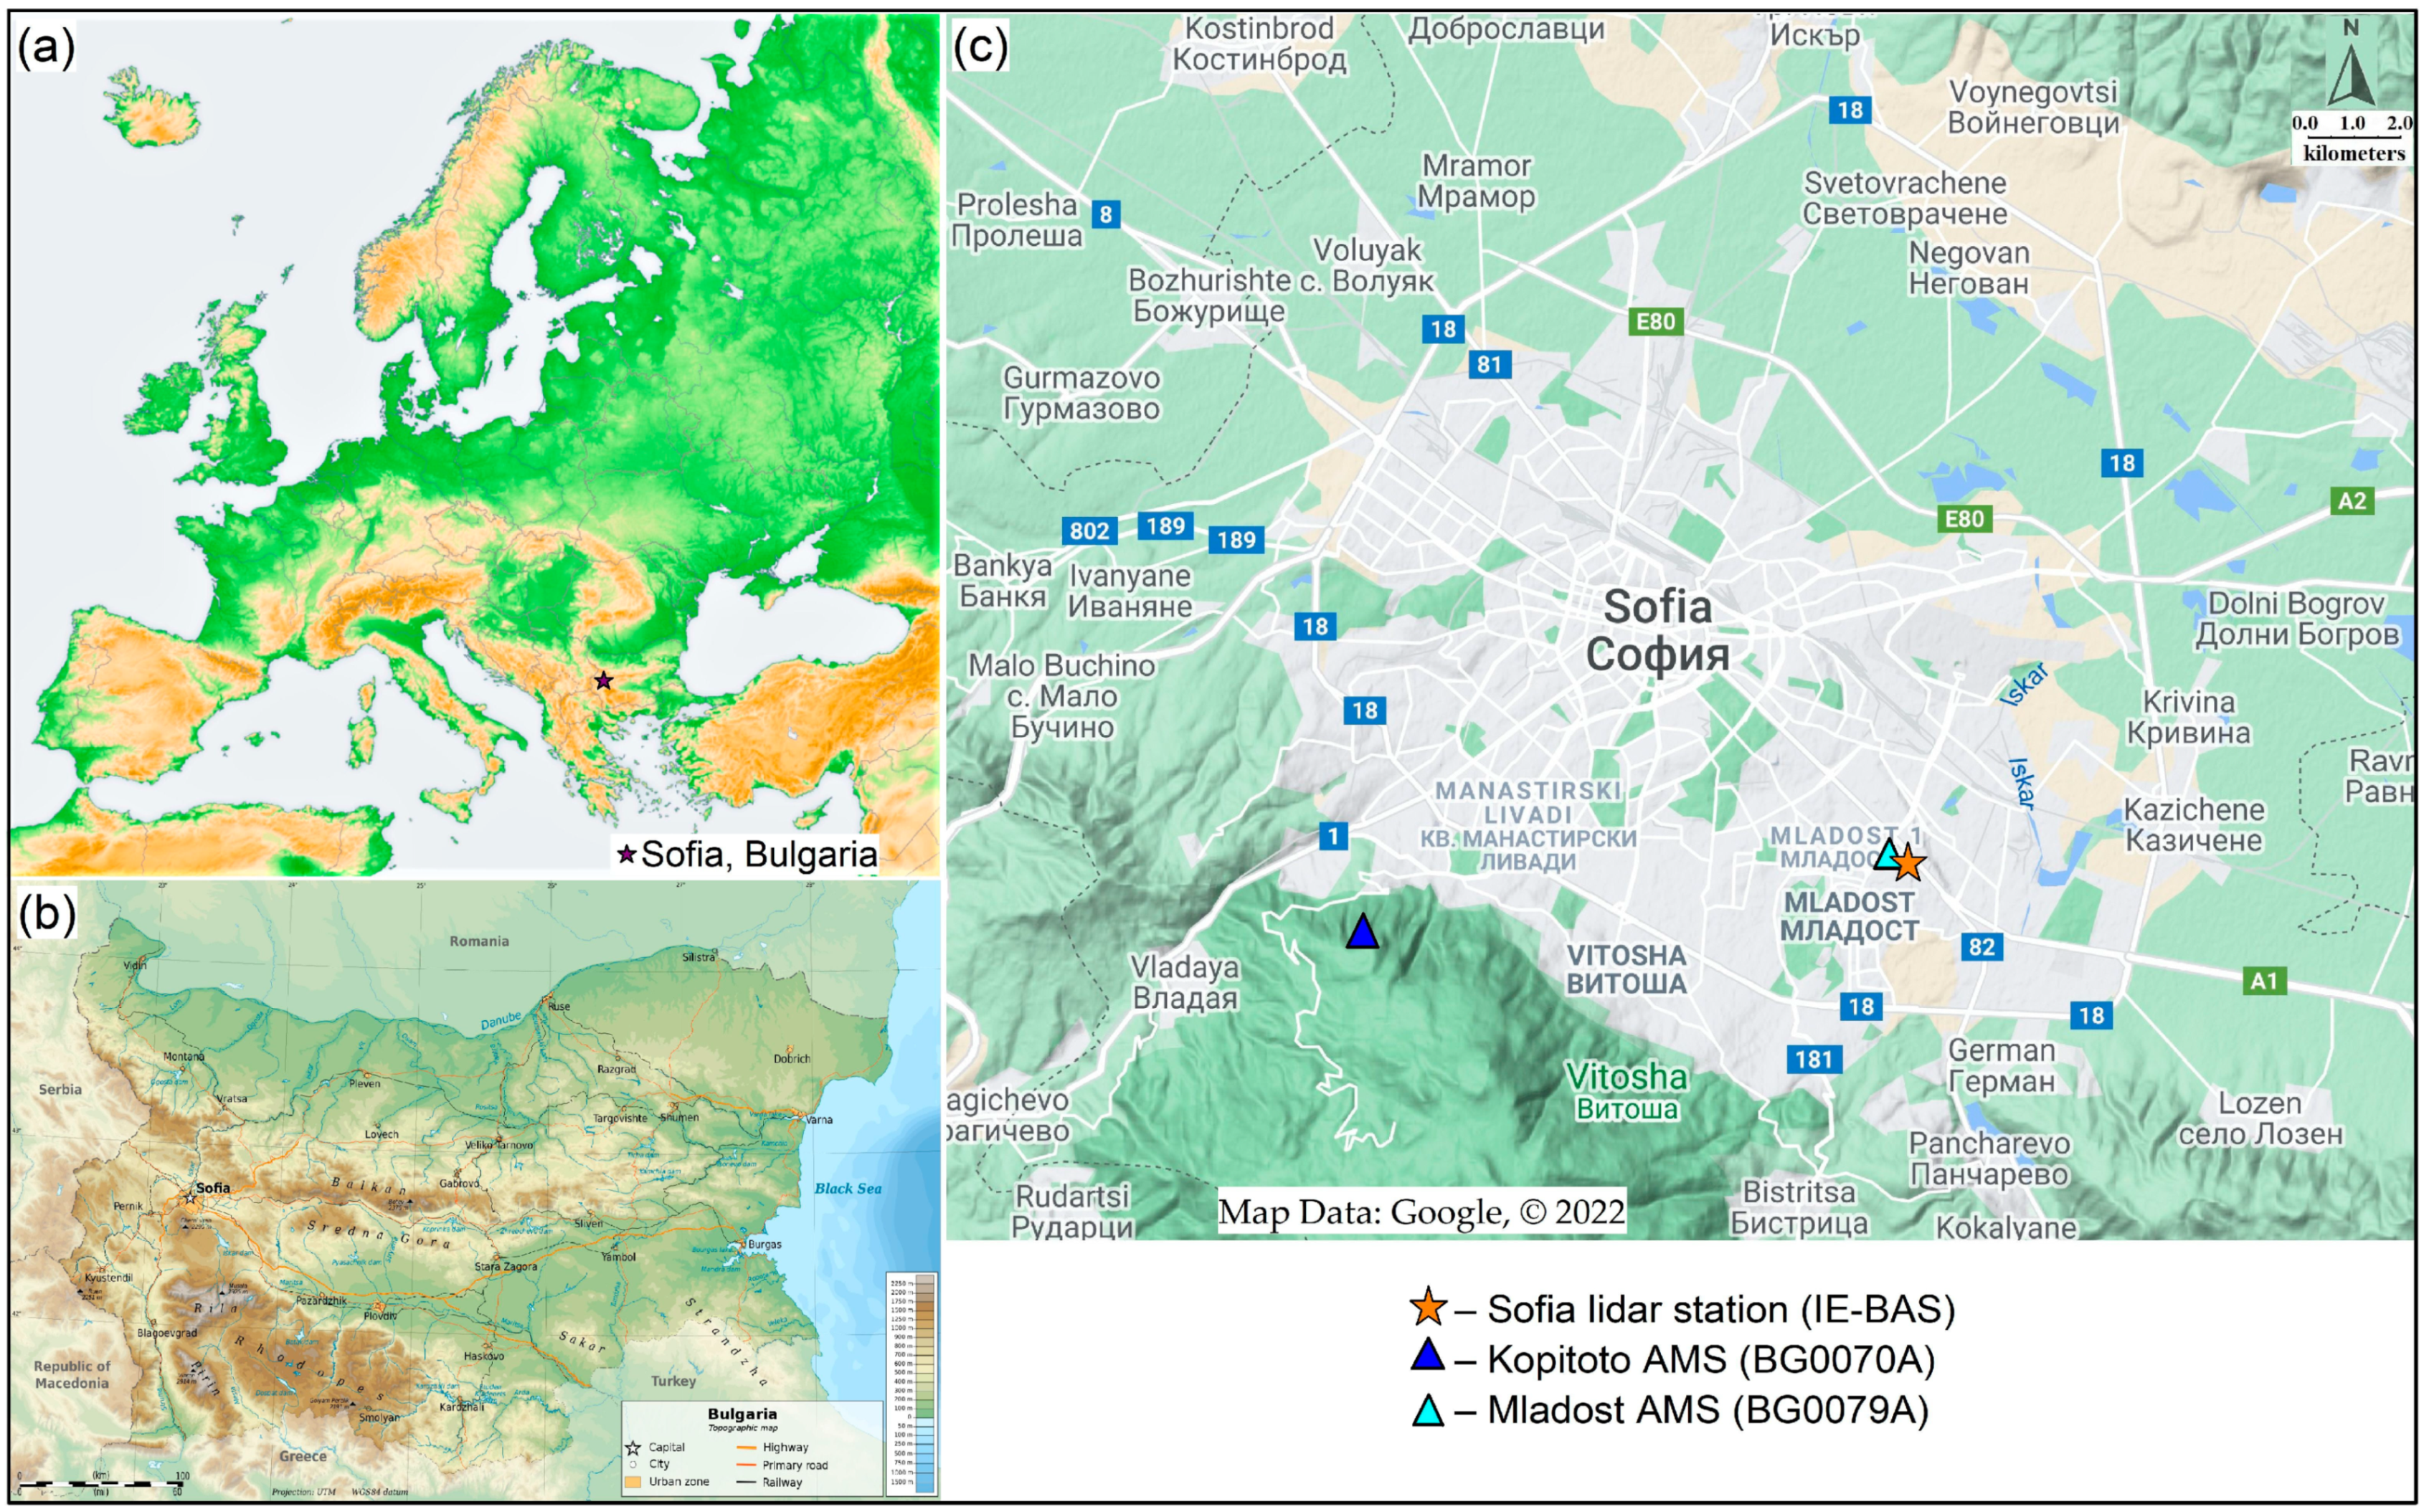
2.1. Measurement Site Description

The geographical setting of the measurement site is shown in Figure 1. Bulgaria is located in southeastern Europe, in the northeastern part of the Balkan Peninsula (Figure 1a). The capital Sofia is Bulgaria‘s largest city with a population of 1,249,277 as of 31 December 2020 [61]. It is located in Sofia Valley in the western part of the country (Figure 1b). The area of the valley is about 1180 km2. Its length from northwest to southeast is 75 km, with its width varying from 5 to 20 km. The average altitude of the valley is about 550 m above sea level (ASL). As seen in Figure 1, the valley is surrounded by mountains on all sides, the largest being the Balkan Mountains on the northeast and Vitosha Mountain on the south. The climate of Sofia is continental with 1961–1990 climate normal mean annual air temperature of 10 °C, mean annual precipitation of 576 mm and mean annual relative humidity of 68%—World Meteorological Organization (WMO) Station Number: 15614 [62].
The lidar measurements described in this work were performed at the Sofia lidar station (42.654055° N, 23.386972° E, 600 m ASL) located in the southeastern part of Sofia (Figure 1c) at the Institute of Electronics, Bulgarian Academy of Sciences (IE-BAS).
The vertical profiles of the meteorological parameters (air temperature, atmospheric pressure, relative humidity, dew point, mixing ratio, wind speed, and wind direction) are provided from daily (at 12:00 UTC) radiosonde measurements performed by the Central Meteorological Observatory of Sofia city, National Institute of Meteorology and Hydrology (NIMH)—WMO Station 15614 (42.655° N, 23.384° E, 586 m ASL). The station is located about 300 m away from the lidar site. The data are freely accessible at the site of the University of Wyoming [63].
The in situ measured data on the PM10 mass concentration used in this paper were provided by two automated measuring stations (AMSs) in Sofia, part of the National Automated System for Environmental Monitoring (NASEM). The system is supervised by the Ministry of Environment and Water (MoEW) via the Executive Environmental Agency (ExEA) [64] and is tasked with monitoring the ambient air quality in Bulgaria. The ExEA provides the technical, methodological, and software resources necessary for the NASEM operation and development. The positions of the two AMSs—one urban located close to the lidar site (Mladost AMS) and one rural reference station for aerosol background measurements located in the Vitosha Mountain (Kopitoto AMS), are indicated in Figure 1.

2.2. Remote Sensing Observational Instruments and Methods

The Saharan dust episode in April 2019 described and discussed in this paper was explored by using the two elastic-scatter channels of an aerosol lidar developed at the Laser Radars Laboratory of IE-BAS [49,50]. It is configured in a monostatic biaxial alignment; due to its position in the lab, its line of sight (LOS) is inclined at an angle of 32° with respect to the horizon. Thus, although signals backscattered from up to 30 km can be registered, the maximum sounding height is 16 km.
The radiation source is a high-power frequency-doubled Nd:YAG laser equipped with a single-pass optical amplifier (pulse energy of up to 800 mJ at 1064 nm, 100 mJ at 532 nm; pulse duration of 15 ns FWHM; repetition rate of 2 Hz; laser-beam divergence of 3 mrad). The lidar transmitting unit also includes prism-based optics to steer the output laser beam to the atmosphere and to adjust it precisely in order to achieve a good overlap between the beam and the telescope’s field of view. The lidar receiving unit consists of a telescope, a wavelength separator (spectrum analyzer), and high-sensitivity photo-electronic modules enabling registration of backscattered signals with a range/height resolution of 15/7.95 m. A Cassegrain type telescope (35 cm aperture; 200 cm focal length) receives the backscattered radiation from the atmosphere. The incoming optical signals collected by the telescope are directed to the wavelength separating unit. The spectrum analyzer has selective spectral channels for 1064 nm and 532 nm operated in analog mode and comprising specific combinations of narrowband interference filters, short/long band-pass filters, beam splitters, dichroic mirrors, and neutral densities. An effective suppression is, thus, achieved of the background noise and parasitic inter-channel cross-talk transmission over the filter’s blocking range (200–1100 nm) to levels of ≤10−4 (OD ≥ 4) of the peak transmission at 532 nm and 1064 nm. The photo-electronic modules comprise photo-receiving sensors—a photo-multiplier tube at 532 nm and an avalanche photodiode at 1064 nm, as well as 10-MHz 14-bit analog-to-digital converters.
Acquiring and processing of lidar data is performed using specialized software (TropoSuite) developed at the Institute of Physics, National Academy of Sciences of Belarus, Minsk, Belarus. The pre-processing includes optical background subtraction, profile smoothing, and range-correction of the raw lidar data, whereas the main processing involves calculation of the aerosol backscatter coefficient (BSC) and error estimation. The Klett–Fernald inversion algorithm [65,66] is used to retrieve the vertical BSC profiles. The algorithm is based on a prior selection of two values: a lidar ratio (the ratio of aerosol extinction and backscattering coefficients) which is assumed to be altitude independent, and a reference BSC value at a calibration height at which the particle backscatter signal is negligible compared to the molecular one. Under cloud-free conditions, the reference point is normally selected in the altitude range 6–10 km, and the constant lidar ratio is chosen in the interval 40–60 sr, depending on the dominating aerosol type [32,46,47,48,67,68,69,70,71]. The retrieved lidar profiles are calibrated using values of the molecular BSC known from the standard atmosphere model [72] for values of the air pressure and temperature measured close to the surface. The calibration altitude intervals of nearly pure molecular atmospheric content are determined by applying the standard Rayleigh fitting procedure [73,74,75].
In order to characterize qualitatively the dominant aerosol particle size fractions in the aerosol layers observed, profiles of the backscatter-related Ångström exponent (BAE) [49,67,76] are calculated based on the retrieved BSC profiles at 532 nm and 1064 nm:
BAE(z) = ln[BSC(z2)/BSC(z1)]/ln(λ12)
where λ1 = 1064 nm, λ2 = 532 nm, z is the lidar distance.
The BAE profiles thus determined are subjected to a statistical frequency-count analysis of BAE occurrences to obtain overall and partial BAE distributions, which are regarded as being qualitative counterparts of the real aerosol particle size distributions. Combining the time-averaged BAE profiles and the corresponding BAE distributions with the air-transport modeling data available from online web resources makes it possible to derive qualitative or semi-quantitative information concerning the type, origin, and microphysical properties of the aerosols observed [36,49,77].
The lidar observations of the atmosphere are performed in a regime of multiple registrations of lidar returns with an averaging time of 1 or 3 min (130 or 390 laser pulses). Subsequently, these profiles are averaged over the whole measurement period in order to estimate and visualize the integral mass vertical stratification of the aerosol layers registered. To illustrate the spatial distribution and temporal dynamics of the aerosol fields detected in each measurement cycle, color maps in height-time coordinates are constructed using a series of consecutively recorded range-corrected signals (RCS).

2.3. Modeling/Forecasting and Reanalysis Data Provision

The NMMB/BSC-Dust model [54,55] and the Hybrid Single-Particle Lagrangian Integrated Trajectory (HYSPLIT) model [56,57] are used in the paper to make assumptions about both the type and the origin of the aerosols in the layers detected by the lidar. The first one is an online multi-scale atmospheric dust model designed and developed at Barcelona Supercomputing Center-Centro Nacional de Supercomputación (BSC-CNS) in collaboration with the National Oceanic and Atmospheric Administration/National Centers for Environmental Prediction (NOAA/NCEP), NASA Goddard Institute for Space Studies, and the International Research Institute for Climate and Society (IRI). The dust model is fully embedded into the Non-hydrostatic Multiscale Model NMMB developed at NCEP [78,79]. The NMMB/BSC-Dust model provides dust forecasts for both regional (Northern Africa, Middle East, and Europe) and global domains [54,55,80].
The HYSPLIT model [56] is developed by the NOAA’s Air Resource Laboratory (ARL) to simulate the dispersion and trajectories of pollutants in the atmosphere over local to global scales. In this paper, we used the model to compute the air mass backward trajectories ending above Sofia during the time of lidar measurements, by running it interactively on the web through the ARL READY system [57].
Combining HYSPLIT backward trajectories with satellite imagery, such as from the moderate resolution imaging spectroradiometer (MODIS) [53], can provide insight into whether the significant concentrations of aerosols detected are caused by local sources of air pollution or are the result of an external air transport. The MODIS sensor has a total of 36 spectral bands, covering wavelengths from 0.4 μm to 14.4 μm, with varying spatial resolutions on those bands—250 m by 250 m (Bands 1–2), 500 m by 500 m (Bands 3–7) and 1 km by 1 km (Bands 8–36). Two such instruments, operating on the NASA Earth Observing System (EOS) Terra and Aqua satellites, are widely used for earth and climate measurements. In this paper, we use the MODIS Corrected Reflectanc imagery visualized in NASA Worldview website (https://worldview.earthdata.nasa.gov/, accessed on 17 February 2022), part of the NASA Earth Observing System Data and Information System (EOSDIS). The imagery resolution is 250 m, and the temporal resolution is daily. Thus, MODIS imagery offers a useful tool for timely and accurate monitoring of dust storms [81,82].
Reanalysis of climatological data by the National Centers for Environmental Prediction and the National Center for Atmospheric Research (NCEP/NCAR) [83,84] is applied for synoptic meteorological analyses regarding the Saharan dust episode. Maps of the composite mean of 700 hPa geopotential height and wind field are compiled using the Daily Mean Composite application provided by the NOAA Physical Sciences Laboratory [85].

3. Results and Discussion

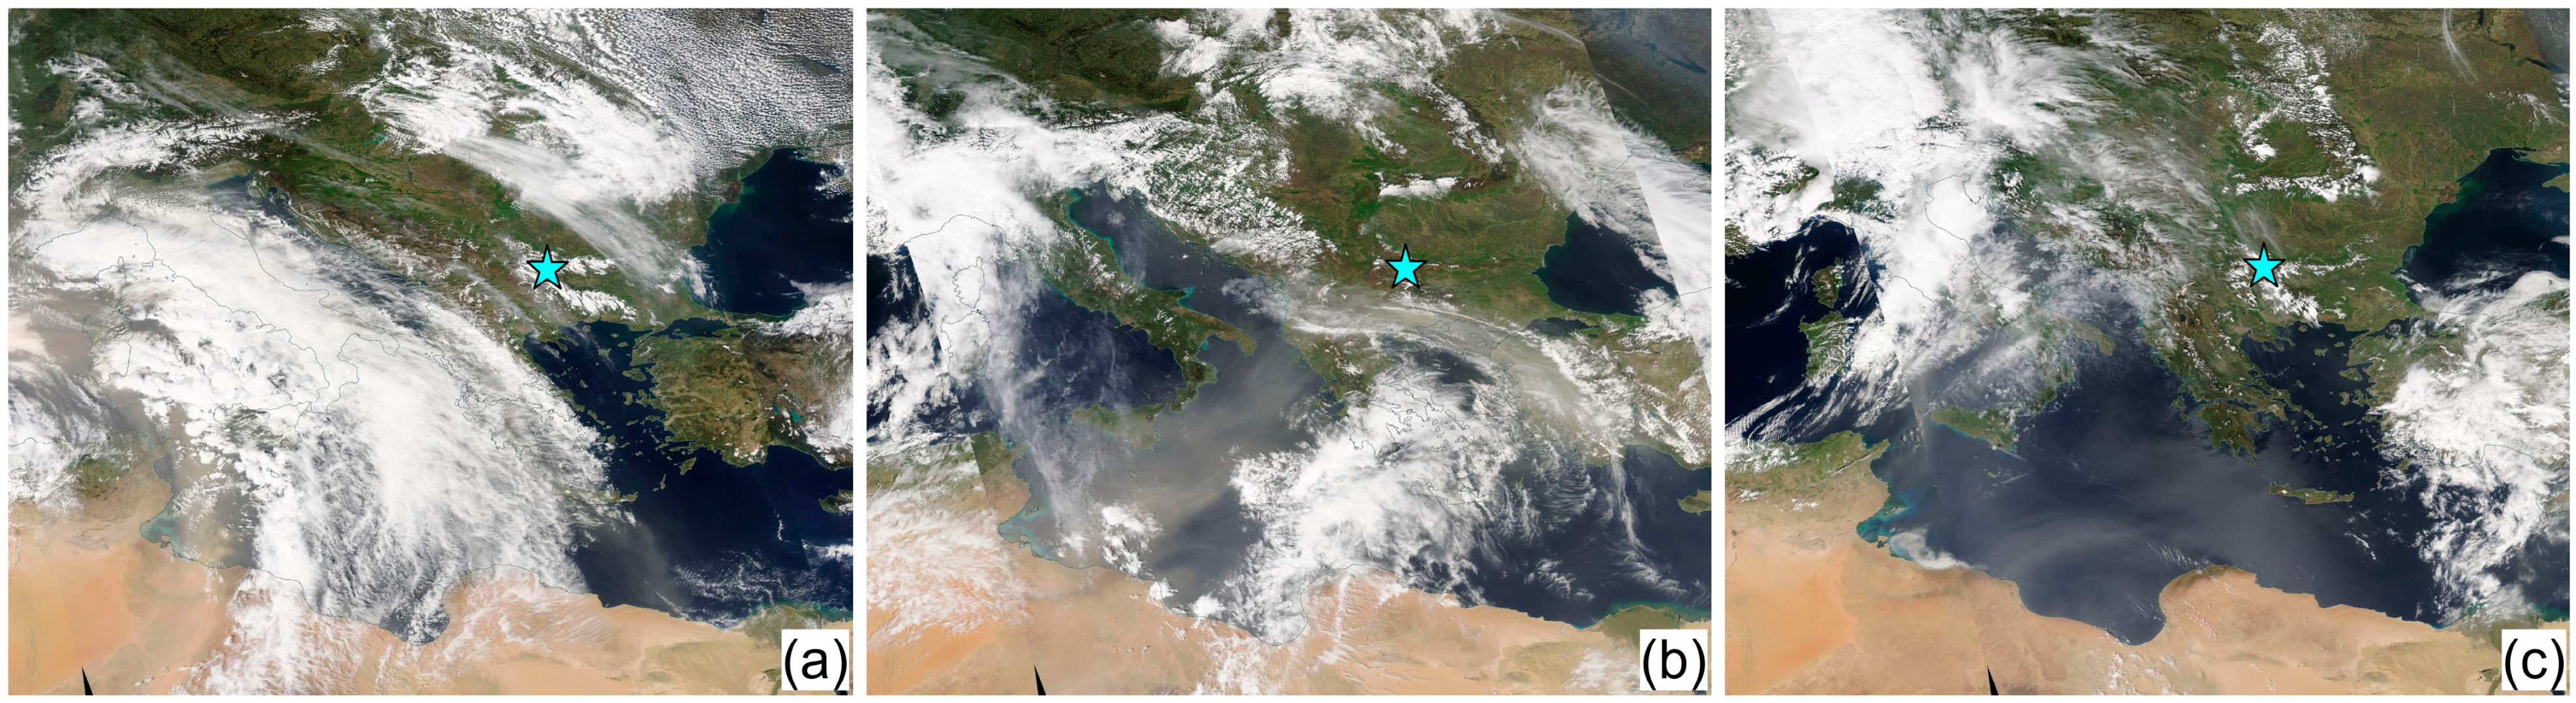
3.1. MODIS-Aqua Images of the Dust-Cloud Plume Spreading

Figure 2 shows satellite images obtained by the MODIS-Aqua satellite depicting the propagation of the dust plume and cloud coverage over the Mediterranean and Southeastern Europe at the beginning (22 April), the middle (24 April), and the end (26 April) of the period under review.
A distinctive feature of the dust transfer during this episode is the strong mixing of the dust plume with water clouds, which spread simultaneously as a mixed cloud-dust mass with a specific fibrous veil-like structure. At the beginning of the period, this cloud-dust mass is more compact and monolithic (Figure 2a); later on it is torn into separate zones dominated by clouds or dust (Figure 2b); subsequently, the former spreads to the north and east, whereas a cloudless zone, dominated by significant amounts of dust, is established over the Mediterranean (Figure 2c). Bulgaria, including Sofia, falls mainly in the mixed dust-cloud zones. Normally, Saharan dust is transported northeast to the Balkans in the form of warm and dry desert air masses [50]. In contrast, the mixture of dust and clouds observed during the episode discussed here rather suggests the spread of moisture-rich air masses. On the other hand, this is a prerequisite for the formation of cloudy and rainy conditions in the reached areas, which would make it difficult to track the event in its entirety with ground-based optical instruments for remote monitoring, such as lidars.

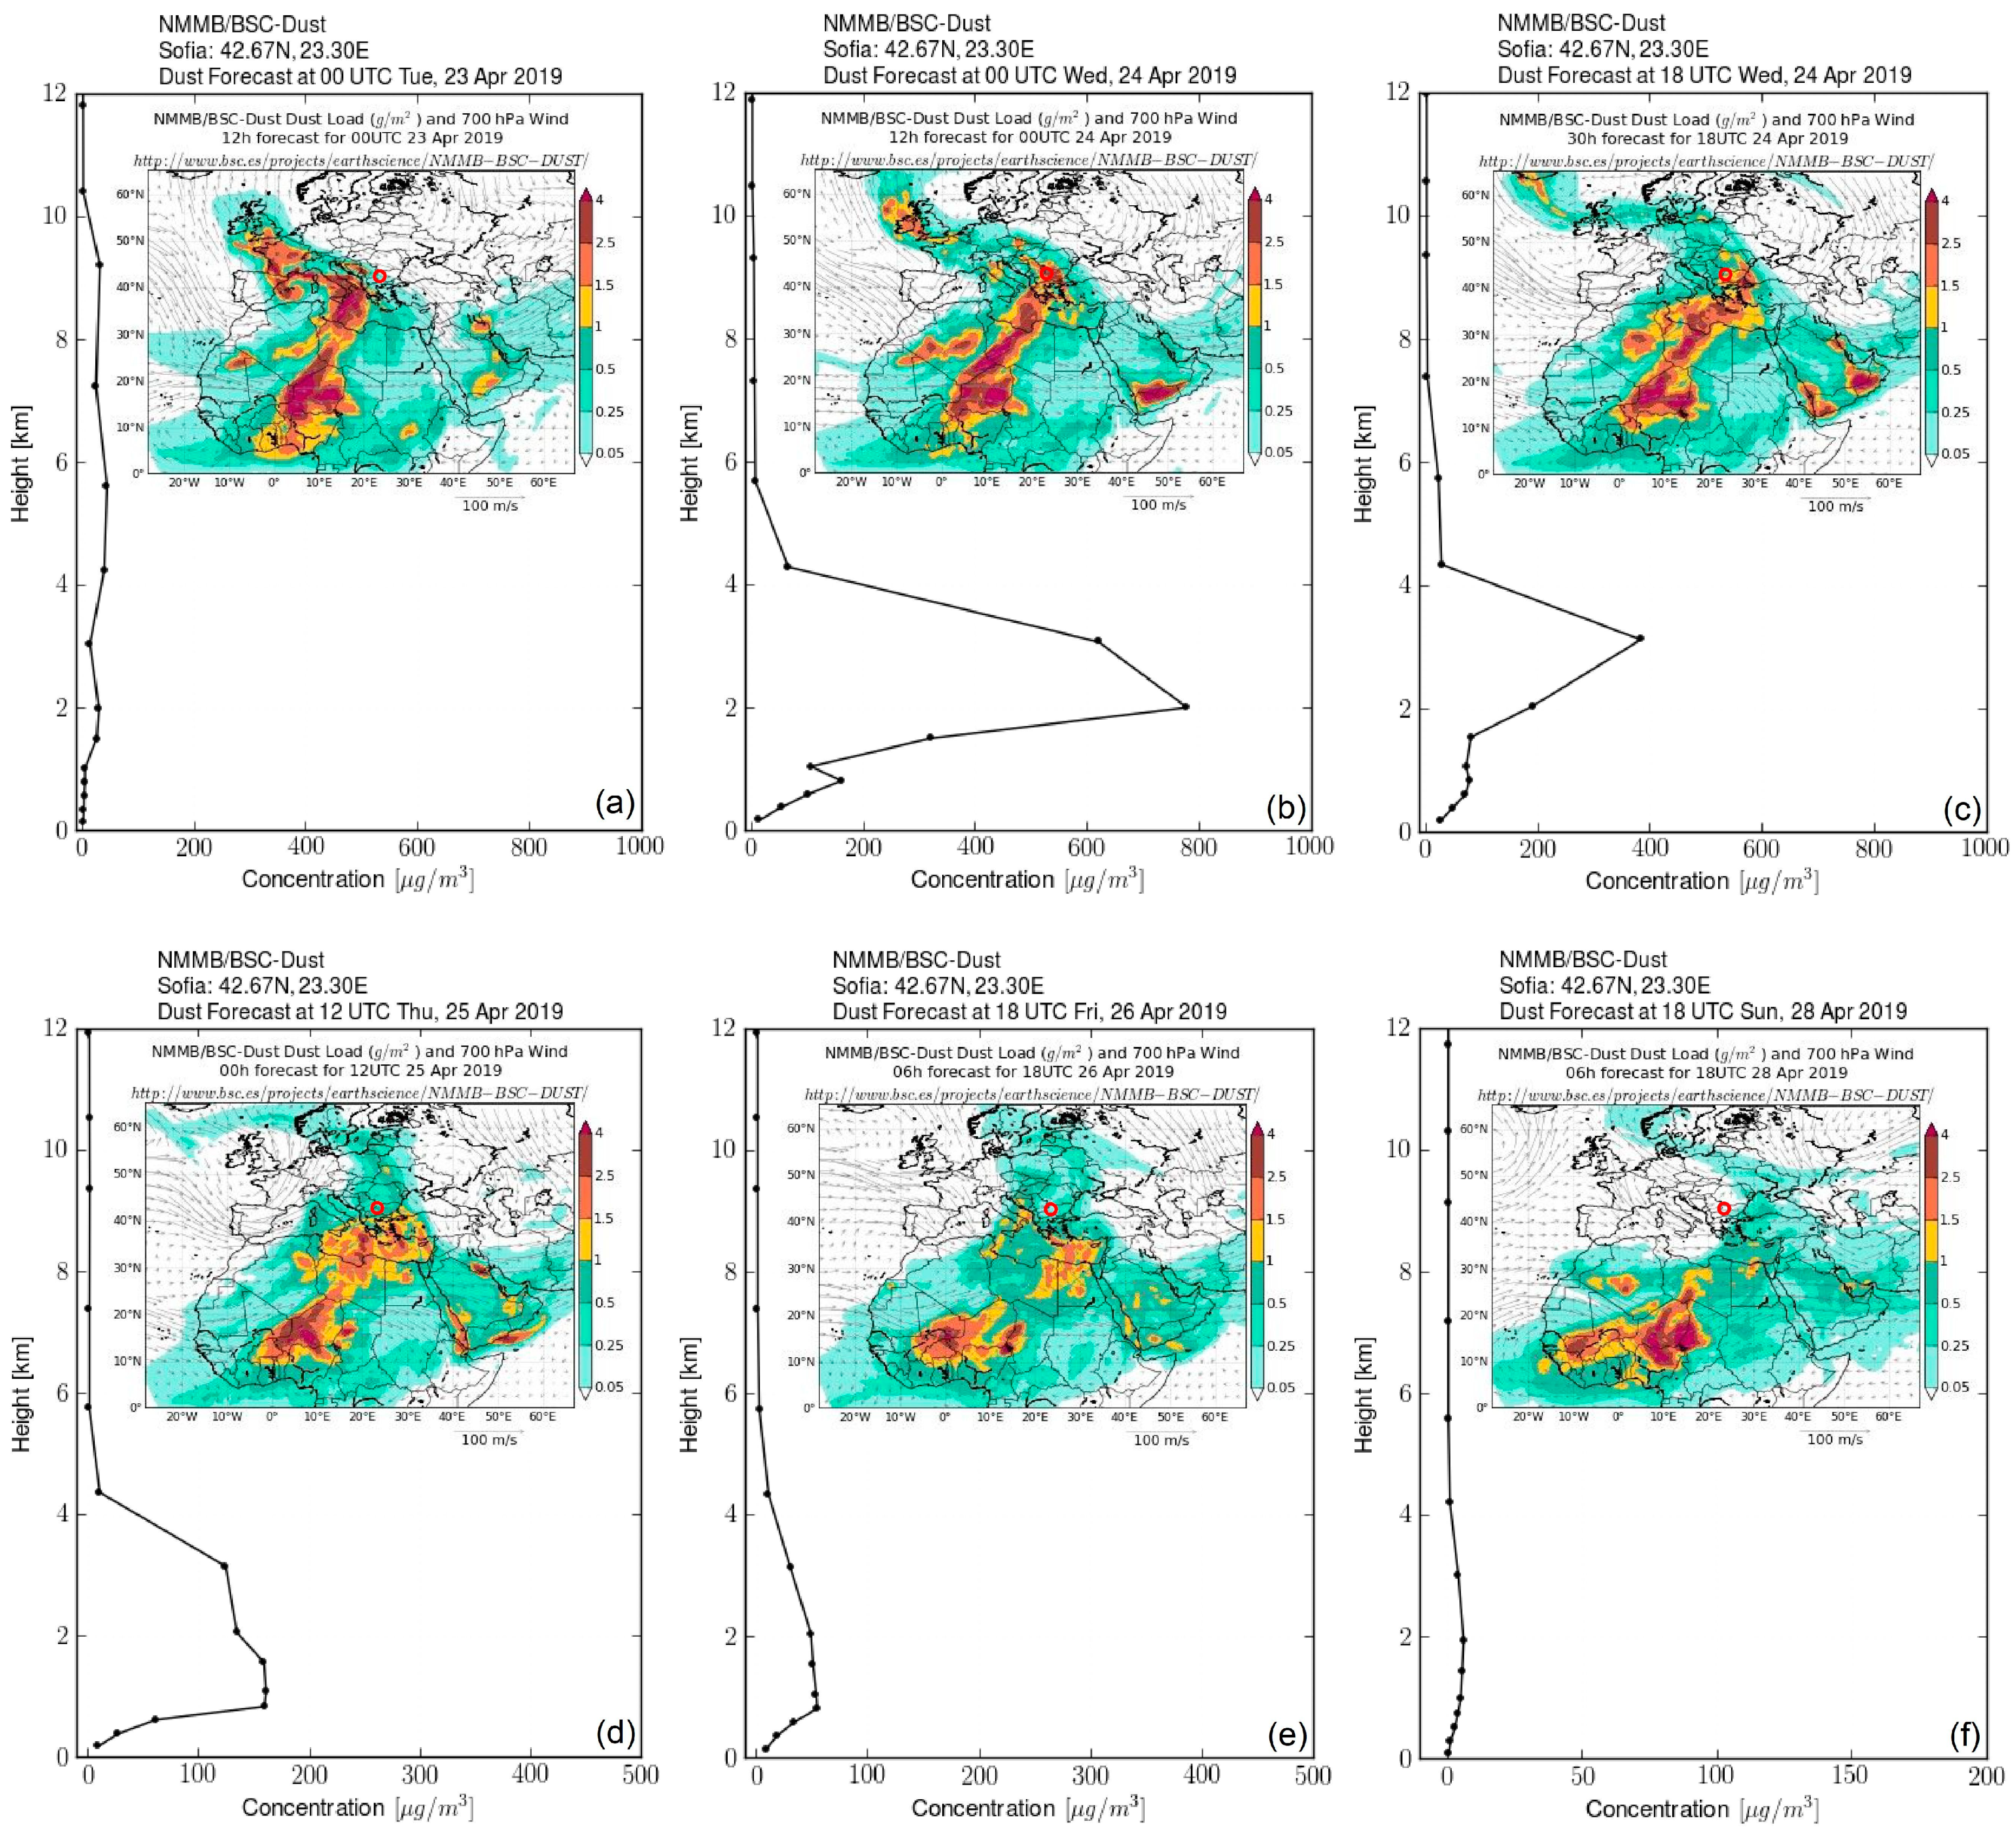
3.2. NMMB/BSC-Dust Global Dust Model Forecasts

Figure 3 presents the Global-scale NMMB/BSC-Dust model maps of the Saharan dust distribution for the same three characteristic days (22, 24, and 26 April) from the period of the dust episode considered here, as in Figure 2. Note that the three dates belong to the period of highest intensity and onset of abatement of the dust episode, the latter covering almost the entire second half of April 2019. The maps show two distinctive features of the transport of desert aerosols from the Sahara Desert. The first of them is the extremely wide geographical domains reached by dust loads; the second one is the atypically high densities of dust coverage in significant parts of the invaded areas, reaching 4 g/m2.
On the 22 April, Figure 3a, the main dust plume has covered with high densities the whole of Northern Africa, Western and Central Mediterranean, as well as Southern and Central Europe. On 24 April, Figure 3b, it has already reached Northern Europe, the British Isles, Iceland, and parts of Scandinavia. On the third of the days shown, 26 April (Figure 3c), the dust-invaded zones have spread even further north over all of Scandinavia and northeast to Greenland and the Arctic North. In addition, with smaller but still significant densities, desert aerosols have spread eastward over the Arabian Peninsula and Central Asia, as well as westward across the Atlantic Ocean, reaching the northern parts of South America. Thus, the picture of the Saharan dust spread during the period under consideration outlines a dust episode with exceptional strength and extent, significantly exceeding the heavy dust outbreaks typical for this period of the year [26,58,59].

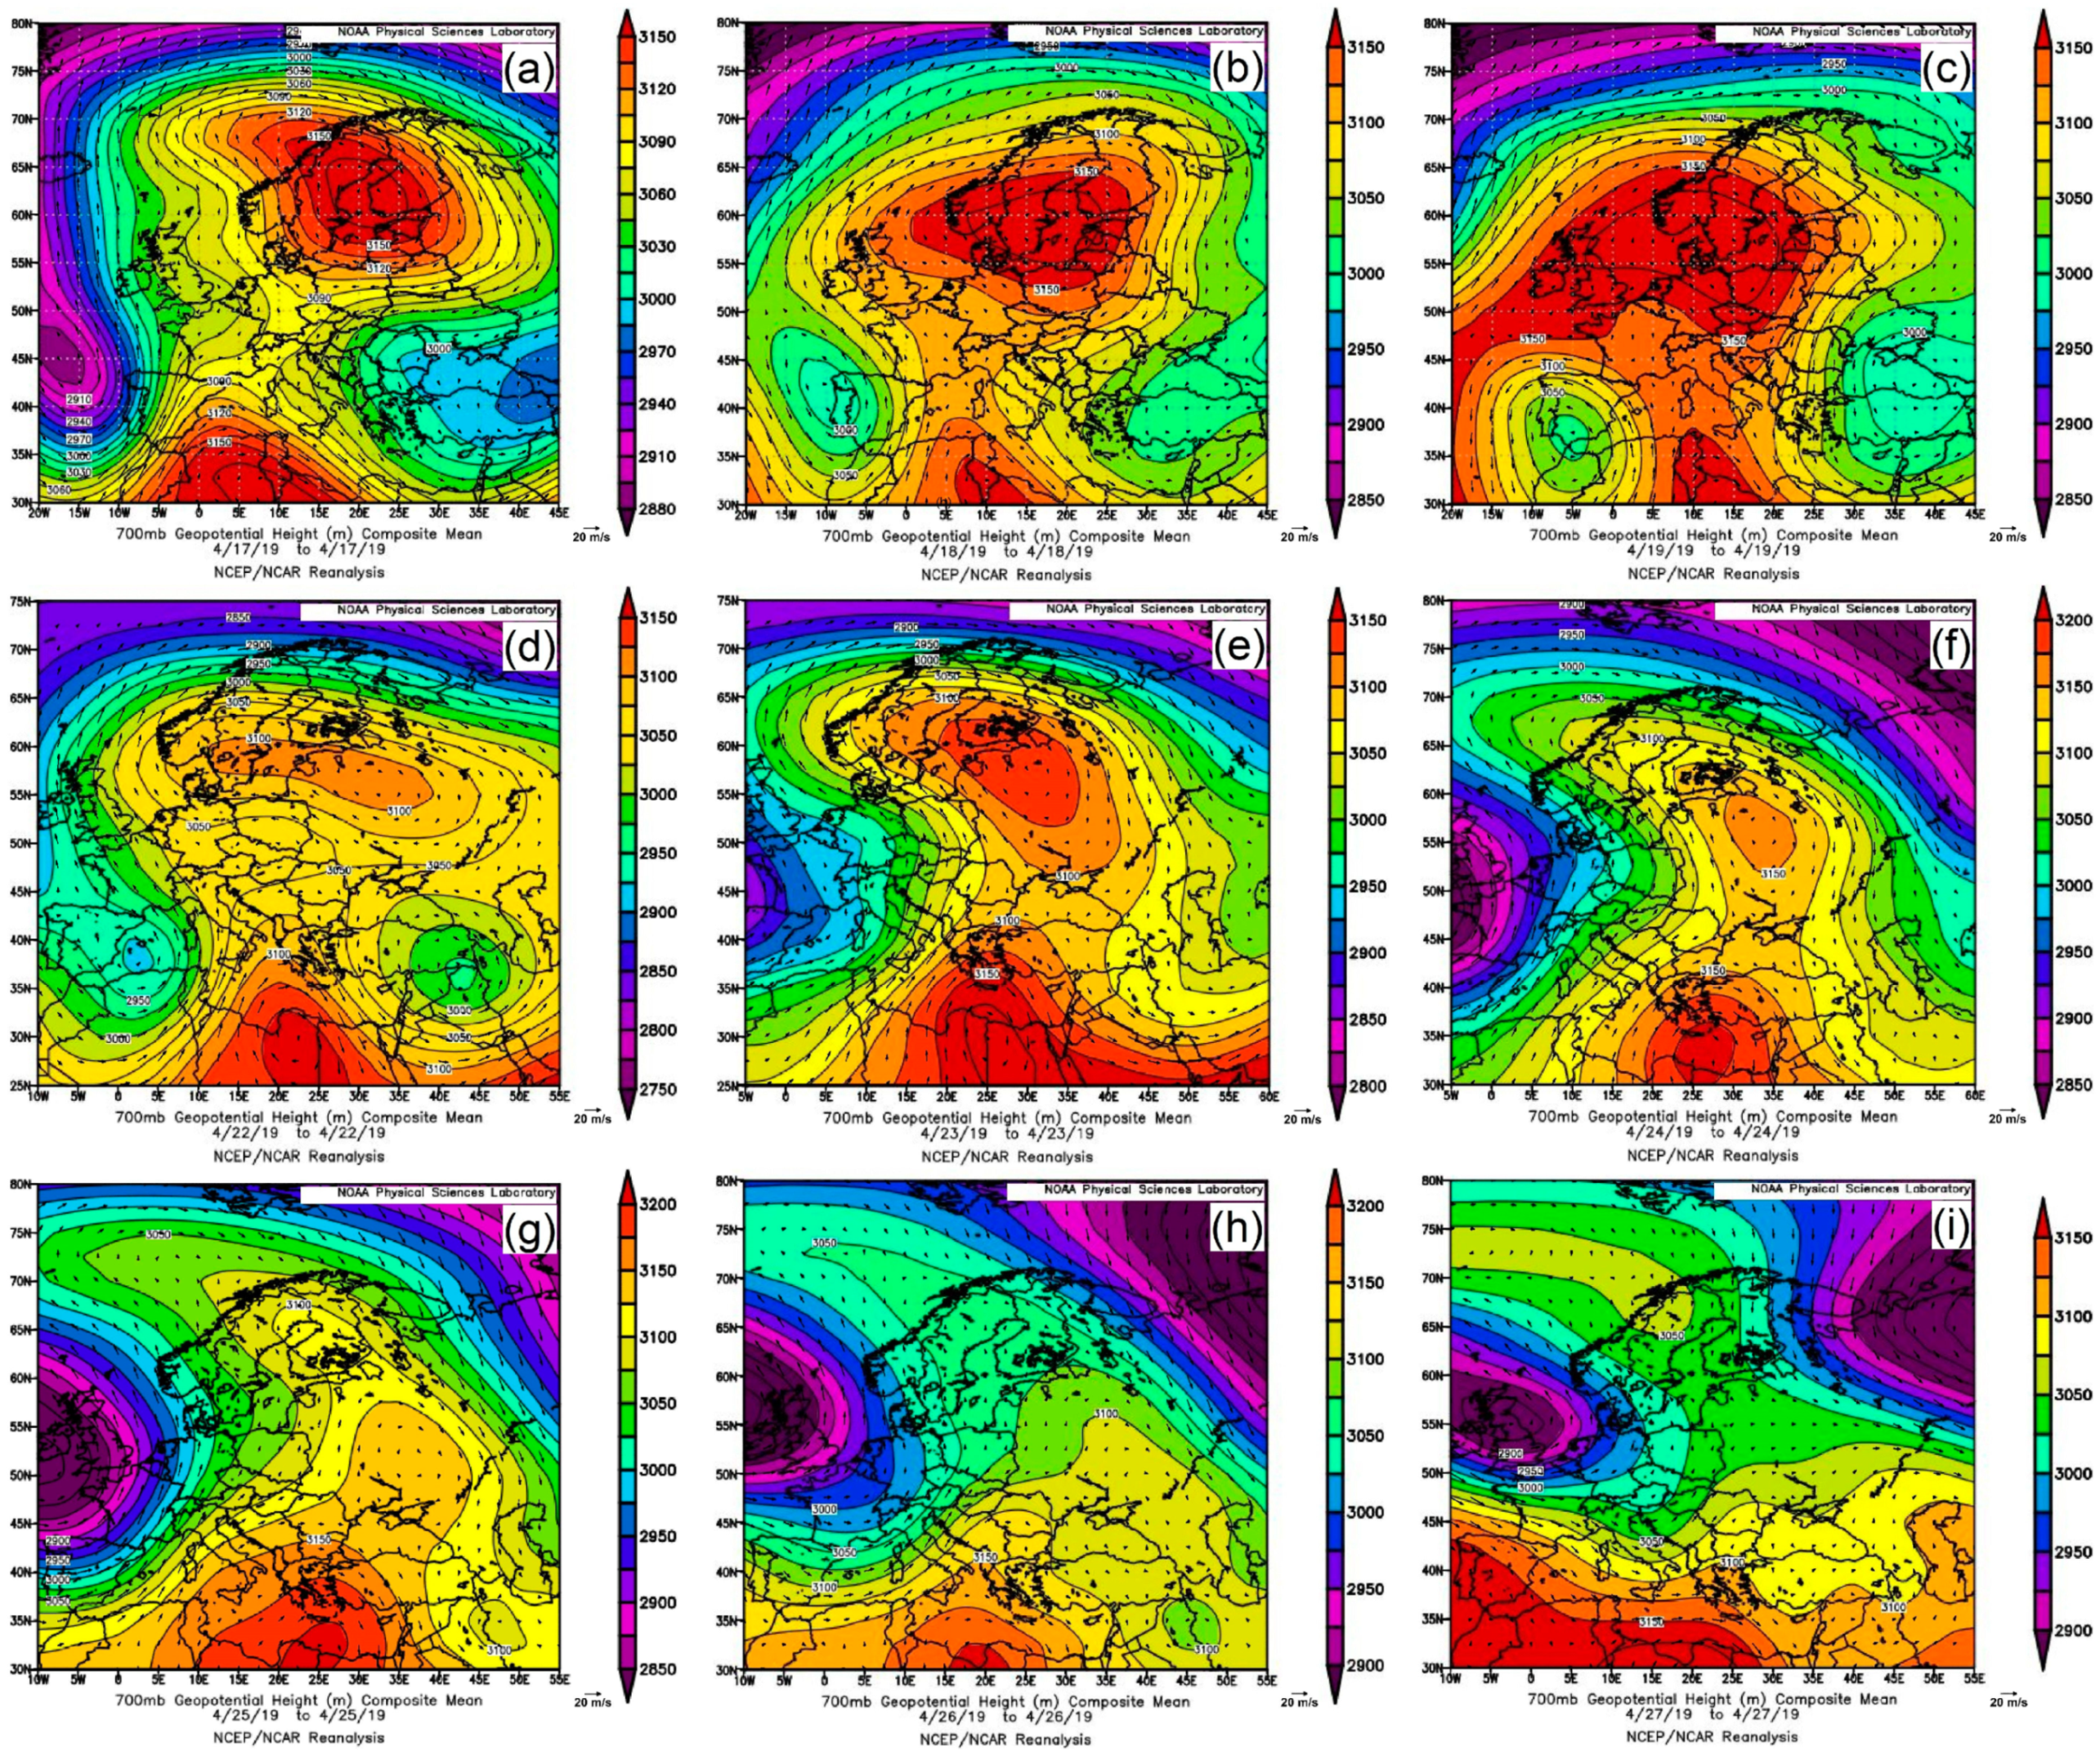
3.3. NCEP/NCAR Reanalysis

To clarify the mechanism and driving force of the large-scale episode in question, it is necessary to consider the synoptic situation in the geographical areas affected during the event. The geopotential height for a given atmospheric pressure value is a representative synoptic parameter for the formation of frontal systems and the related changes in the air circulation.
Figure 4 presents maps of the NCEP/NCAR reanalysis composite mean of 700 mb geopotential height and the horizontal wind vectors over the region of Northern Africa, Mediterranean and Europe (30–80° N, 10° W–55° E), during the period 17–27 April 2019. Figure 4a–c shows maps of geopotential height and wind vectors for a three-day period (17–19 April 2019) from the initial stage of the dust episode. They clearly show that over the uppermost northern regions of Africa, the Mediterranean, and Europe to its northern borders and beyond, an omega-like synoptic blocking pattern (omega block) [38,39,40] has formed, transforming the normal zonal air circulation over the region (from west to east) into one with a strong meridional component (from south to north and vice versa). The base stationary ridge of the structure, originally located on the Eastern African Mediterranean coast, is gradually moving east, while the main anti-cyclonic blocking high of the structure (with clockwise vorticity) remains relatively stable over Scandinavia and Northern Europe. The two satellite cyclonic cut-off lows (with anticlockwise vorticity) are formed in the interface zone of the Eastern Atlantic, Western Mediterranean, Northwestern Africa, and Southwestern Europe (the left one), and over the Black Sea and Turkey (the right one). For the episode considered here, of particular importance is the first of them, which is formed faster and is better expressed. The air masses in it are in a cycle of repetitive rotational movement around the center of low pressure, passing over the region outlined above with a high probability for enrichment with desert dust and moisture. During this initial period of the episode, the air circulation has more significant wind components mainly on the outer periphery of the omega pattern, while it is weak in its inner areas over the Mediterranean and Europe.
As can be seen in Figure 4d–f, during the three-day period of 22–24 April, the position of the base stationary ridge core of the omega pattern stabilizes in the zone 20–30° E, where the eastern parts of the Balkan Peninsula, Bulgaria, fall in its upper part. At the same time, the omega pattern itself is undergoing significant changes. From a well-formed, close to classic omega structure on 22 April, it deforms significantly under the influence of a cold frontal system from the west in the latitude range 40–60° N, thus losing its cyclonic cut-off lows. This is accompanied by markedly increased air circulation, with high wind-velocity values (up to over 20 m/s) from the west and Central Northern Africa (Algeria, Tunisia, Libya) to the northeast–north through the Central Mediterranean over Central and Northern Europe.
As can be seen in Figure 2 and Figure 3, the increased air circulation to higher latitudes is accompanied by an intensive transfer in this period of significant amounts of Saharan dust over the mentioned regions, including Bulgaria. During the next three-day period, 25–27 April, as a wide and even colder frontal system appears from the northeast, the omega pattern completely loses its typical shape, as one can see in Figure 4g–i. During the period, the air circulation through the Mediterranean to Europe gradually decreases and is increasingly reoriented from the northeast to the east, outside Sahara, with a tendency of restoring the zonal circulation over Europe‘s southern parts.
In summary, the large-scale and heavy dust episode observed over the Mediterranean and Europe in the second half of April 2019 is conditioned and driven by a dynamic synoptic blocking pattern creating conditions for a powerful joint circulation of air masses rich in desert dust from Northern Africa and ones with high humidity from the Eastern Atlantic and the Mediterranean.

3.4. NMMB/BSC-Dust Model Forecasts

Due to the great Saharan dust’s importance as a climatological, environmental and health factor, modeling and forecasting its distribution is important for timely and adequate monitoring and research of dust events, as well as for parameterizing and validating theoretical models for its description by experimental measurements. The models of the BSC-CNS are widely accepted standard tools for predicting dust episodes on a global and regional scale.
Figure 5 shows the forecast profiles of Saharan dust concentration over Sofia obtained by using the NMMB/BSC-Dust model of the BSC-CNS, as well as maps of dust load and wind field of 700 hPa (insets) over Northern Africa, Middle East, and Europe in the period 22–28 April 2019, for times coinciding with or close to those of the lidar observations described in this paper.
The first day on which the dust plume reached Sofia and lidar measurements were performed was 22 April 2019. Figure 5a shows diagrams of dust concentration and dust load referring to the end of that day, a few hours after the end of the lidar measurements. This is done in order to better reveal the height distribution of the dust concentration, for the purpose of comparing it with the lidar height profiles obtained by us, taking into account the space/time uncertainties of the model, particularly in the dust frontal area [34,86,87,88]. The left-hand part of the color chart shows the wind field of the deep low from the northwest, which causes an extensive vortex in the region of Southwestern Sahara over the territories of Western Sahara, Mauritania, Mali, and Niger, giving rise to the possibility of large masses of dust being lifted. These are directed by the powerful wind flow on the periphery of the base ridge of the omega pattern (Figure 4d,e) to the northeast through Algeria, Libya, and Tunisia over the Mediterranean to Central and Eastern Europe, including the Balkans.
The vertical profile of the dust concentration in Figure 5a for the first day of the dust intrusion shows the distribution of dust throughout the troposphere above Sofia (up to about 11 km). This leads to moderate values of concentration in height, in the range of 30–40 μg/m3. Such a height distribution of dust concentrations is likely related to the intense turbulent convection of air masses in the region of the left cut-off low of the omega pattern during the capture of dust in Northwestern Sahara. The dust plume front is formed from there via the disintegration of the cutoff low and transformation of the rotational energy of the cyclonic vortex into a linear one rapidly directed to the northeast.
As seen in Figure 5b, the densest dust plume parts (in dark brown color) enter Western Bulgaria and Sofia in the evening on 23 April. At the end of the day their density is in the range of 3–4 g/m2 and the dust concentrations at an altitude of about 2 km reaches 800 μg/m3, a value that is very high for the region and a record one for the event considered. At the same time, Sofia falls exactly in the main stream of the dust trail, which, in accordance with Figure 4e, is characterized by the highest intensity of air circulation for the period, respectively of the dust load, namely, by a strong southwest wind with a speed of approximately 20 m/s. As the dust concentration profile for this figure shows, the dust in the central densest part of the plume is concentrated almost entirely in the lower half of the troposphere, up to a height of about 6 km.
The density and height concentration of dust over Sofia and the region remain very high on 24 April, as shown in Figure 5c. The former exhibits values in the range of 1–2 g/m2, whereas the latter reaches 400 μg/m3 at a height of 3 km, which is half of the maximum previously observed. In general, the dust plume has become slightly wider and monolithic over Northern Africa and the Mediterranean, maintaining the direction of spreading. Only its front part over Eastern Europe has shifted slightly to the east-southeast to the Black Sea and Turkey, with Sofia remaining in its western part. These changes can be regarded as indications of some reduction in the intensity and speed of dust transport. This is confirmed by the decreased values of the southwest winds in the direction of the plume, which can be seen in Figure 4f. Nevertheless, one can conclude that on 24 April the dust event over Sofia is at its peak, which is also valid for the entire dust episode over Central and Eastern Europe.
On 25 April, Figure 5d, the tendency to a reduction in the dust-load power becomes apparent. The dust trail thins in its middle part and becomes fragmented into patches of lower density over Northern Africa and the Mediterranean, leaving Bulgaria outside the zone of high dust densities. Nevertheless, the values of dust load are moderate, falling in the range 0.5–1 g/m2, and the altitude concentration is redistributed more evenly in the range of up to 4 km, with a maximum of about 150 μg/m3 at altitudes of 1–1.5 km.
On the next day, 26 April, the dust plume in its high-concentration zone loses its nearly linear streaming, being torn into two main parts: one located in Southwestern Sahara and the other in Northeastern and Eastern Mediterranean, as shown in Figure 5e. The wind circulation is directed mainly eastward and much less to the northeast, due to the gradual deformation of the omega blocking pattern to a high-over-low similar one (Figure 4h). Northern and Eastern Europe remain in the dust-covered zone with declining dust load and concentration. For Sofia, the latter is in the range of 0.25–0.5 g/m2 and up to 50 μg/m3, respectively, which indicates a trend towards ending of the event in the region. This trend continues over the next two days. Figure 5f shows a dust load map and a dust concentration profile over Sofia at 18:00 UTC on 28 April. They clearly show that the main part of Europe and the Mediterranean, including Western Bulgaria, are free of dust, as evidenced by the very low residual dust concentrations above Sofia, namely, not exceeding 5 μg/m3.
In spite of the continuous existence during the coming days of sporadic low-level residual dust in some parts, mainly in Northern Europe, that are due to the large scale and strength of the dust episode, one can conclude that it has subsided almost completely by the end of April.

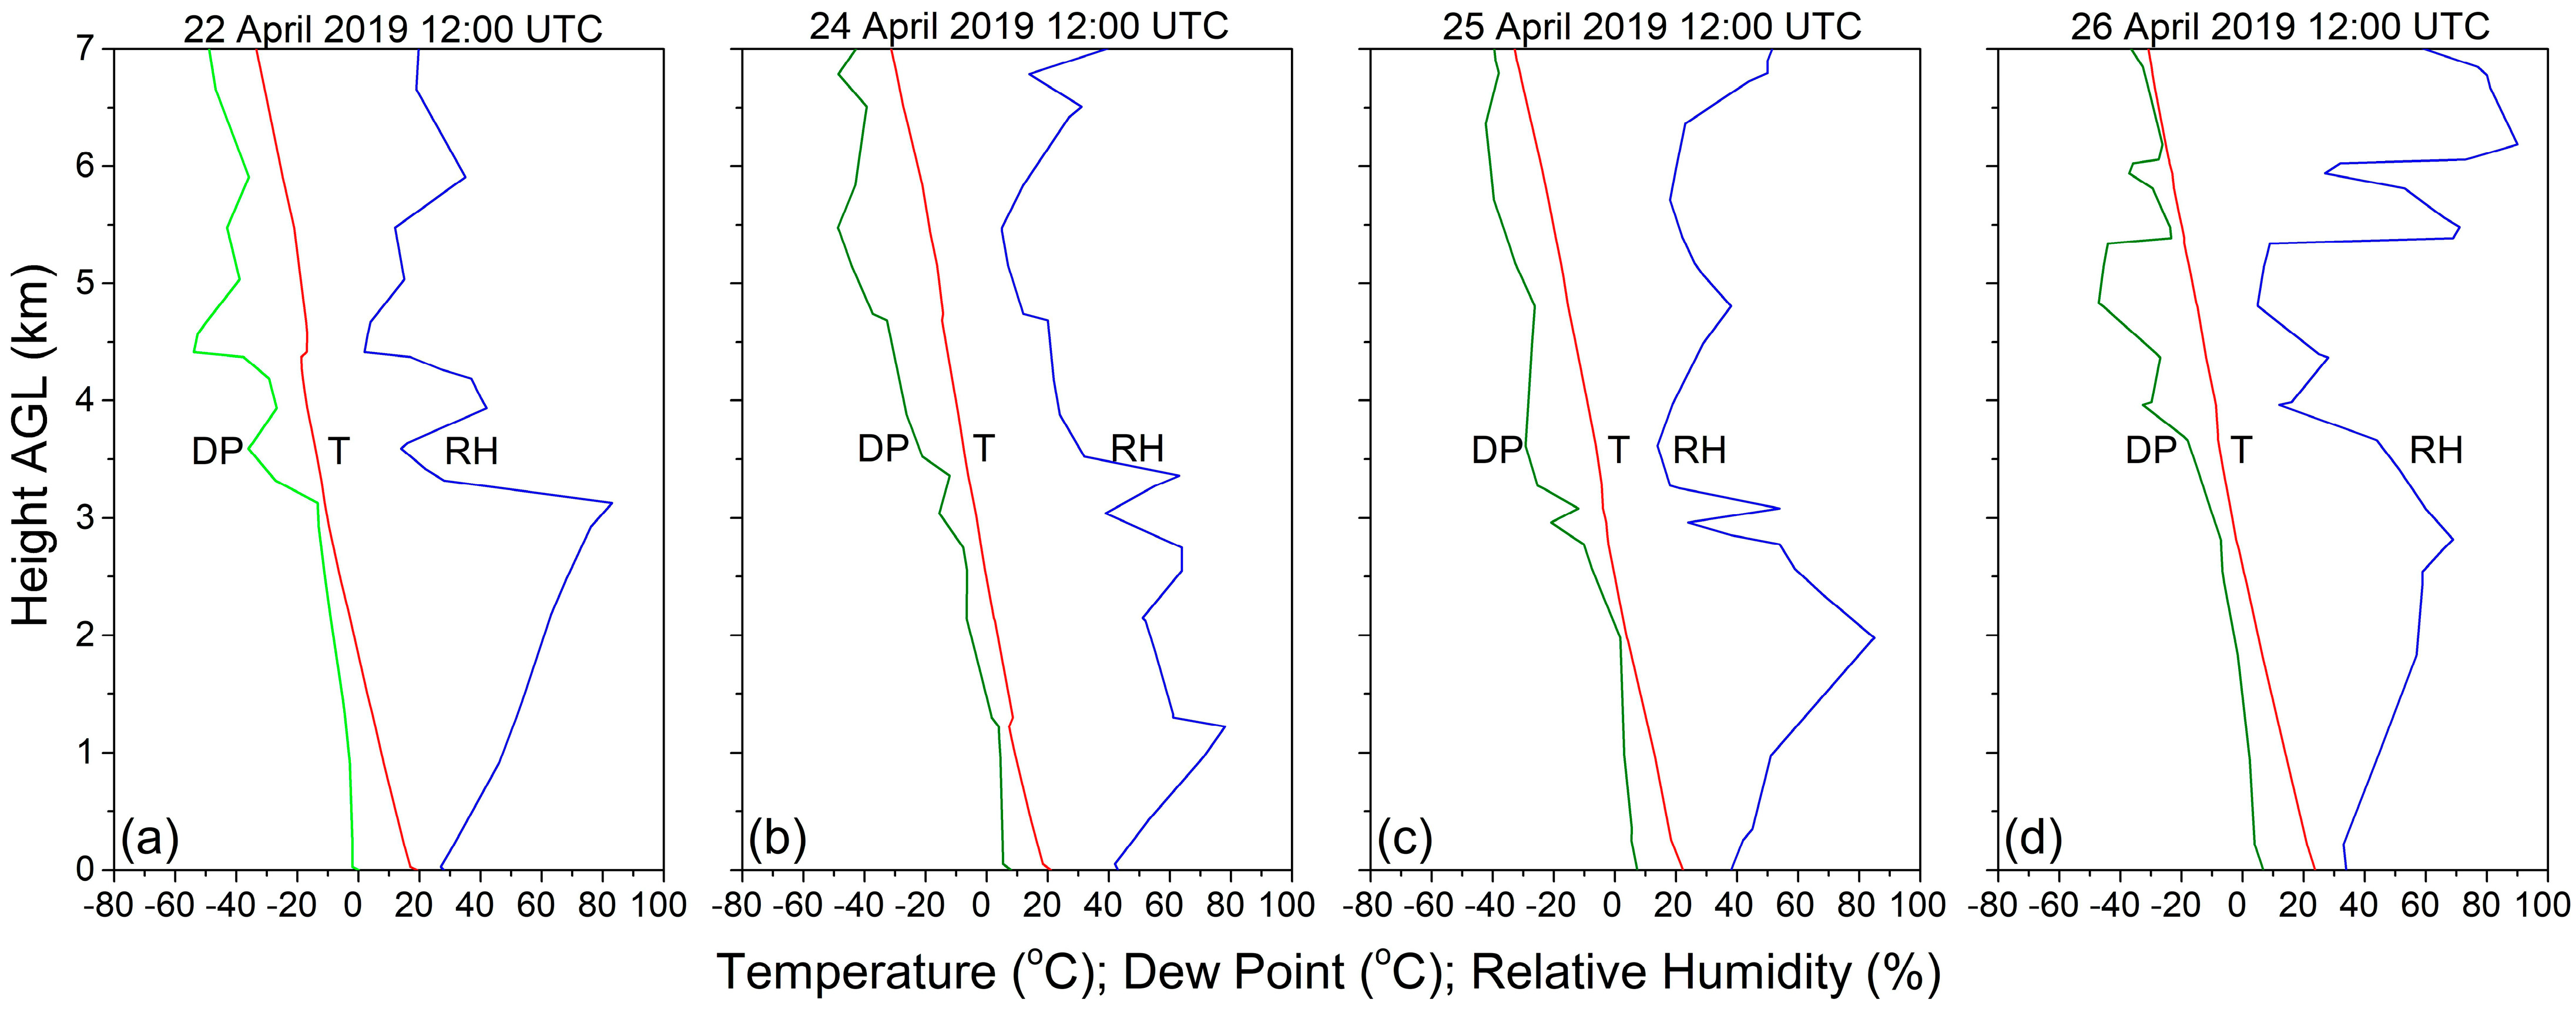
3.5. Meteorological Radiosonde Data

In order to clarify the desert aerosols impact on the local weather, diagrams with vertical profiles of meteorological parameters (air temperature, relative humidity, and dew point) up to a height of 7 km are presented in Figure 6, for the days of the event (22, 24–26 April 2019) when lidar atmospheric observations were conducted. The data, accessible at the site of the University of Wyoming [63] originate from the daily radiosonde measurements conducted at the NIMH-Sofia (WMO station 15614) located near the lidar site.
The temperature profiles show a normal course of decrease in height with ground values of 18–22 °C, which are relatively high, but not unusual for this season in Sofia [62]. Two well-expressed temperature inversions are observed: one at 4.3 km AGL on 22 April (Figure 6a), and a second at 1.2 km AGL on 24 April (Figure 6b). Two less pronounced inversions are also seen at 3 km AGL on 25 April (Figure 6c) and 3.7 km AGL on 26 April (Figure 6d). Bearing in mind the forecast dust concentration profiles in Figure 5, the first two inversions occur just below the lower limits of the main dust layers, while the second ones are close to their upper limits for the respective days.
As a rule, low values of the relative humidity are observed in the altitude ranges occupied by the Saharan dust layers [89,90,91] due to the fact that dust is transported normally by warm and dry desert air masses. In contrast, the diagrams in Figure 6a–d show relatively high RH values, reaching 70–80% in the height range of the dust layers. This is in agreement with the MODIS images in Figure 2, demonstrating that the spreading of dust mixed with clouds is a characteristic feature of the event arising from the formation of a dust-cloud mix by the cyclone over the Gibraltar region (Figure 4c), which enriches the dust plume with moisture. Note that when dust is transported by humid air masses, there is a high probability of nucleating raindrops with fine dust particle fractions.
Due to the high RH values observed over Sofia, the dew-point profiles in the altitude ranges of the dust layers (1–3 km AGL) in Figure 6 remain close to those of the temperature, thus favoring the processes of dust-nucleated condensation.
To conclude, during the dust event under consideration, the weather in Sofia was seriously and specifically influenced by the intrusion of air masses carrying dust and moisture.

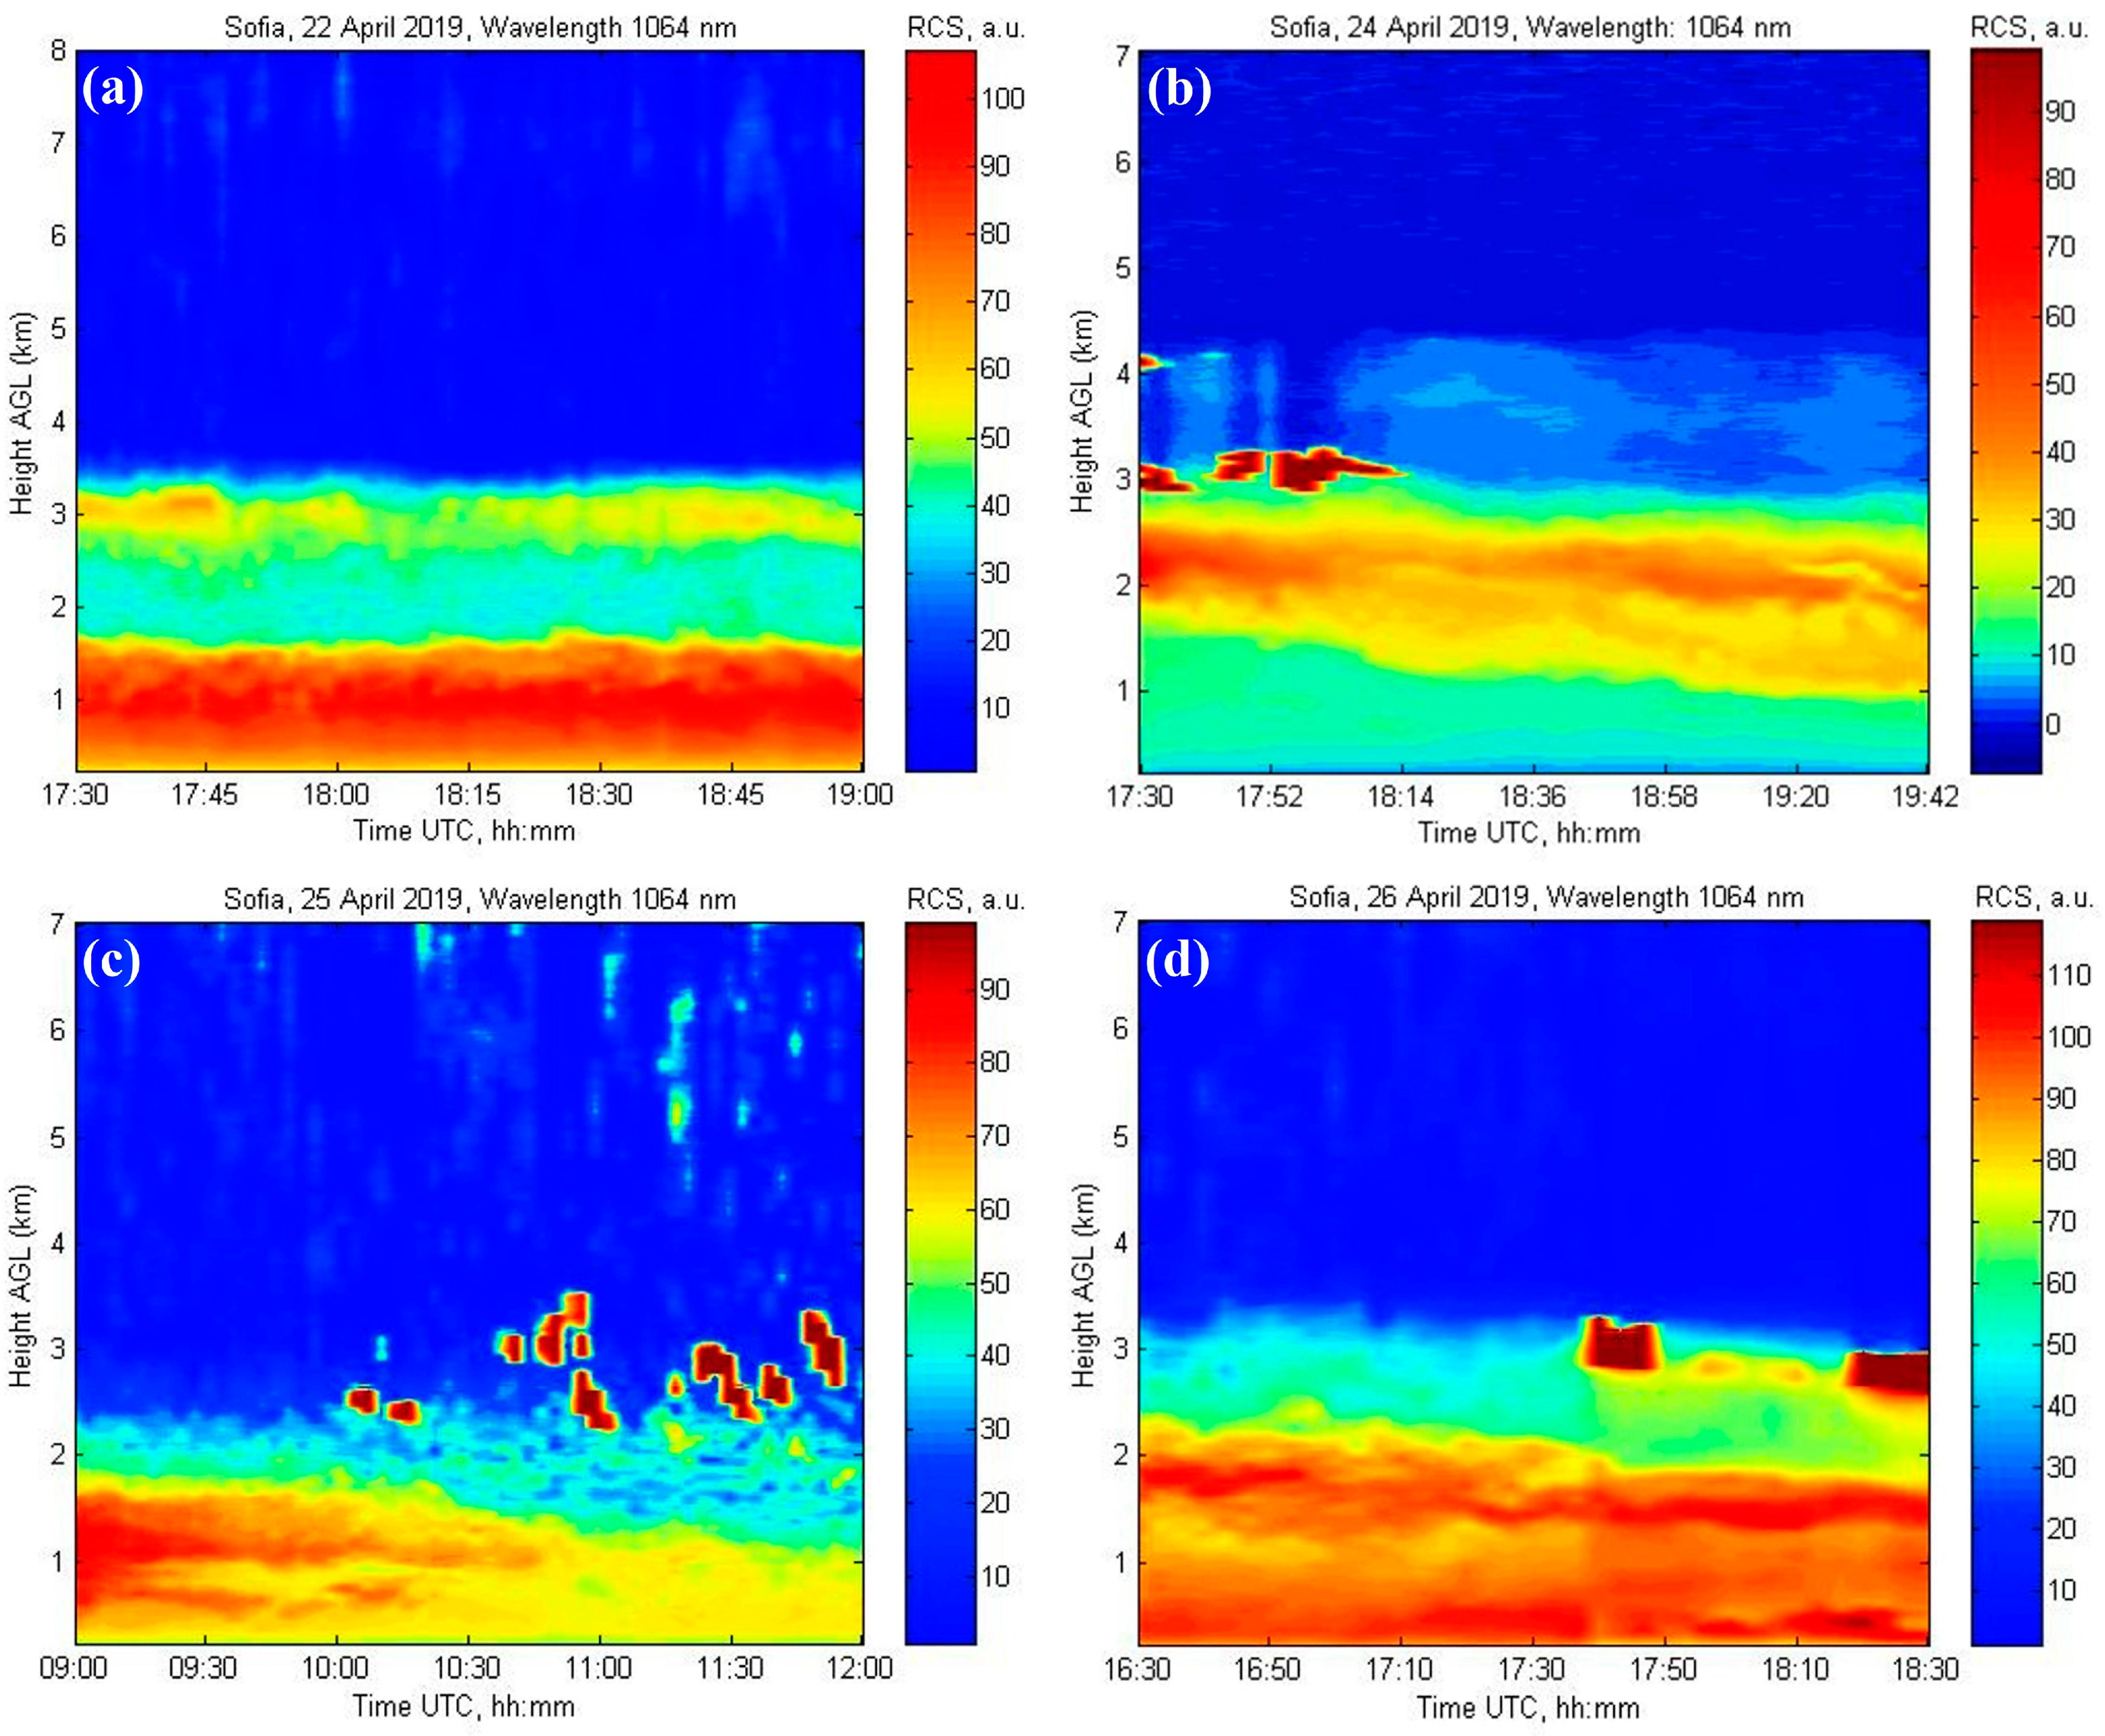
3.6. Lidar Observations of Aerosol/Dust Layering and Dynamics

Figure 7a–d shows colormaps of the height distribution and temporal dynamics of the aerosol/dust layers as time series of range-corrected lidar signals at 1064 nm (with 1–3 min averaging) for the days of the dust event when lidar measurements were conducted (22, 24, 25, and 26 April 2019). A common feature of the presented colormaps is that the aerosol/dust layers are located mainly in the lower half of the troposphere above Sofia, which is also in accordance with Figure 5a–d. This is why the maps are shown to heights of up to 8 km (Figure 7a) and up to 7 km (Figure 7b–d). As a rule, the aerosol/dust fields are distributed in two or more separate layers stacked on each other, including the one of the local atmospheric boundary layer (ABL).
Another characteristic feature of the aerosol distribution is the existence of an area at altitudes of about 3 km where clouds are present. Given its location within the altitude range occupied by dust, it is very likely that the clouds have been nucleated by fine dust particles during air transport or above the measurement site.
The representation of the aerosol distribution on the first day (22 April) of the event over Sofia (Figure 7a) shows two main layers—a dense one in the ABL area and a second one of weaker density located immediately above it at a height of about 3.5 km, as well as a very weak one at altitudes near 7 km, which is not well observable due to the short averaging time. This picture does not correspond well to the forecast profile of the dust concentration shown in Figure 5a, as well as to that for 18:00 on the same day, where only the layer at a height of 7 km is present. We attribute this poor correspondence to the highly dynamic and turbulent formation of the dust plume forepart, which makes the accurate forecasting difficult. Nevertheless, the similarity of that day’s aerosol distribution with those of the following days, as well as the microphysical characteristics of the aerosol/dust particles (discussed in Section 3.8) combined with the HYSPLIT aerosol transport data, demonstrate convincingly that the layers detected in the lower troposphere above Sofia on 22 April contained significant amounts of Saharan dust.
As is clear in Figure 5b,c, 24 April is the day of the strongest Saharan dust intrusion over Sofia region for the entire event. The related colormap in Figure 7b indicates the presence of aerosols from the surface to heights just above 4 km distributed in three distinct layers. The ground layer extends up to 1–1.5 km and nearly completely coincides with the seasonal local ABL. Above it, the main aerosol layer is located at heights of up to about 3 km, with its densest part at 2–2.5 km. In the 3–4 km height range, a secondary aerosol layer is observed with a significantly lower density. Above heights of 4.5 km, the atmosphere appears free of aerosols.
Over the next two days (Figure 7c,d), the aerosols are again distributed in two main layers, similarly to those in Figure 7a: a denser near-ground layer up to about 2 km and a less dense one above it up to 3–3.5 km, with the presence of clouds at heights of about 3 km.
In general, the aerosol density’s temporal dynamics in the dust-containing layers observed is not high, except for as measured on 25 April (Figure 7c), when it is characterized by greater fragmentation and variability. On that day, the weather was quite variable and mostly cloudy, which hindered the evening lidar measurement.

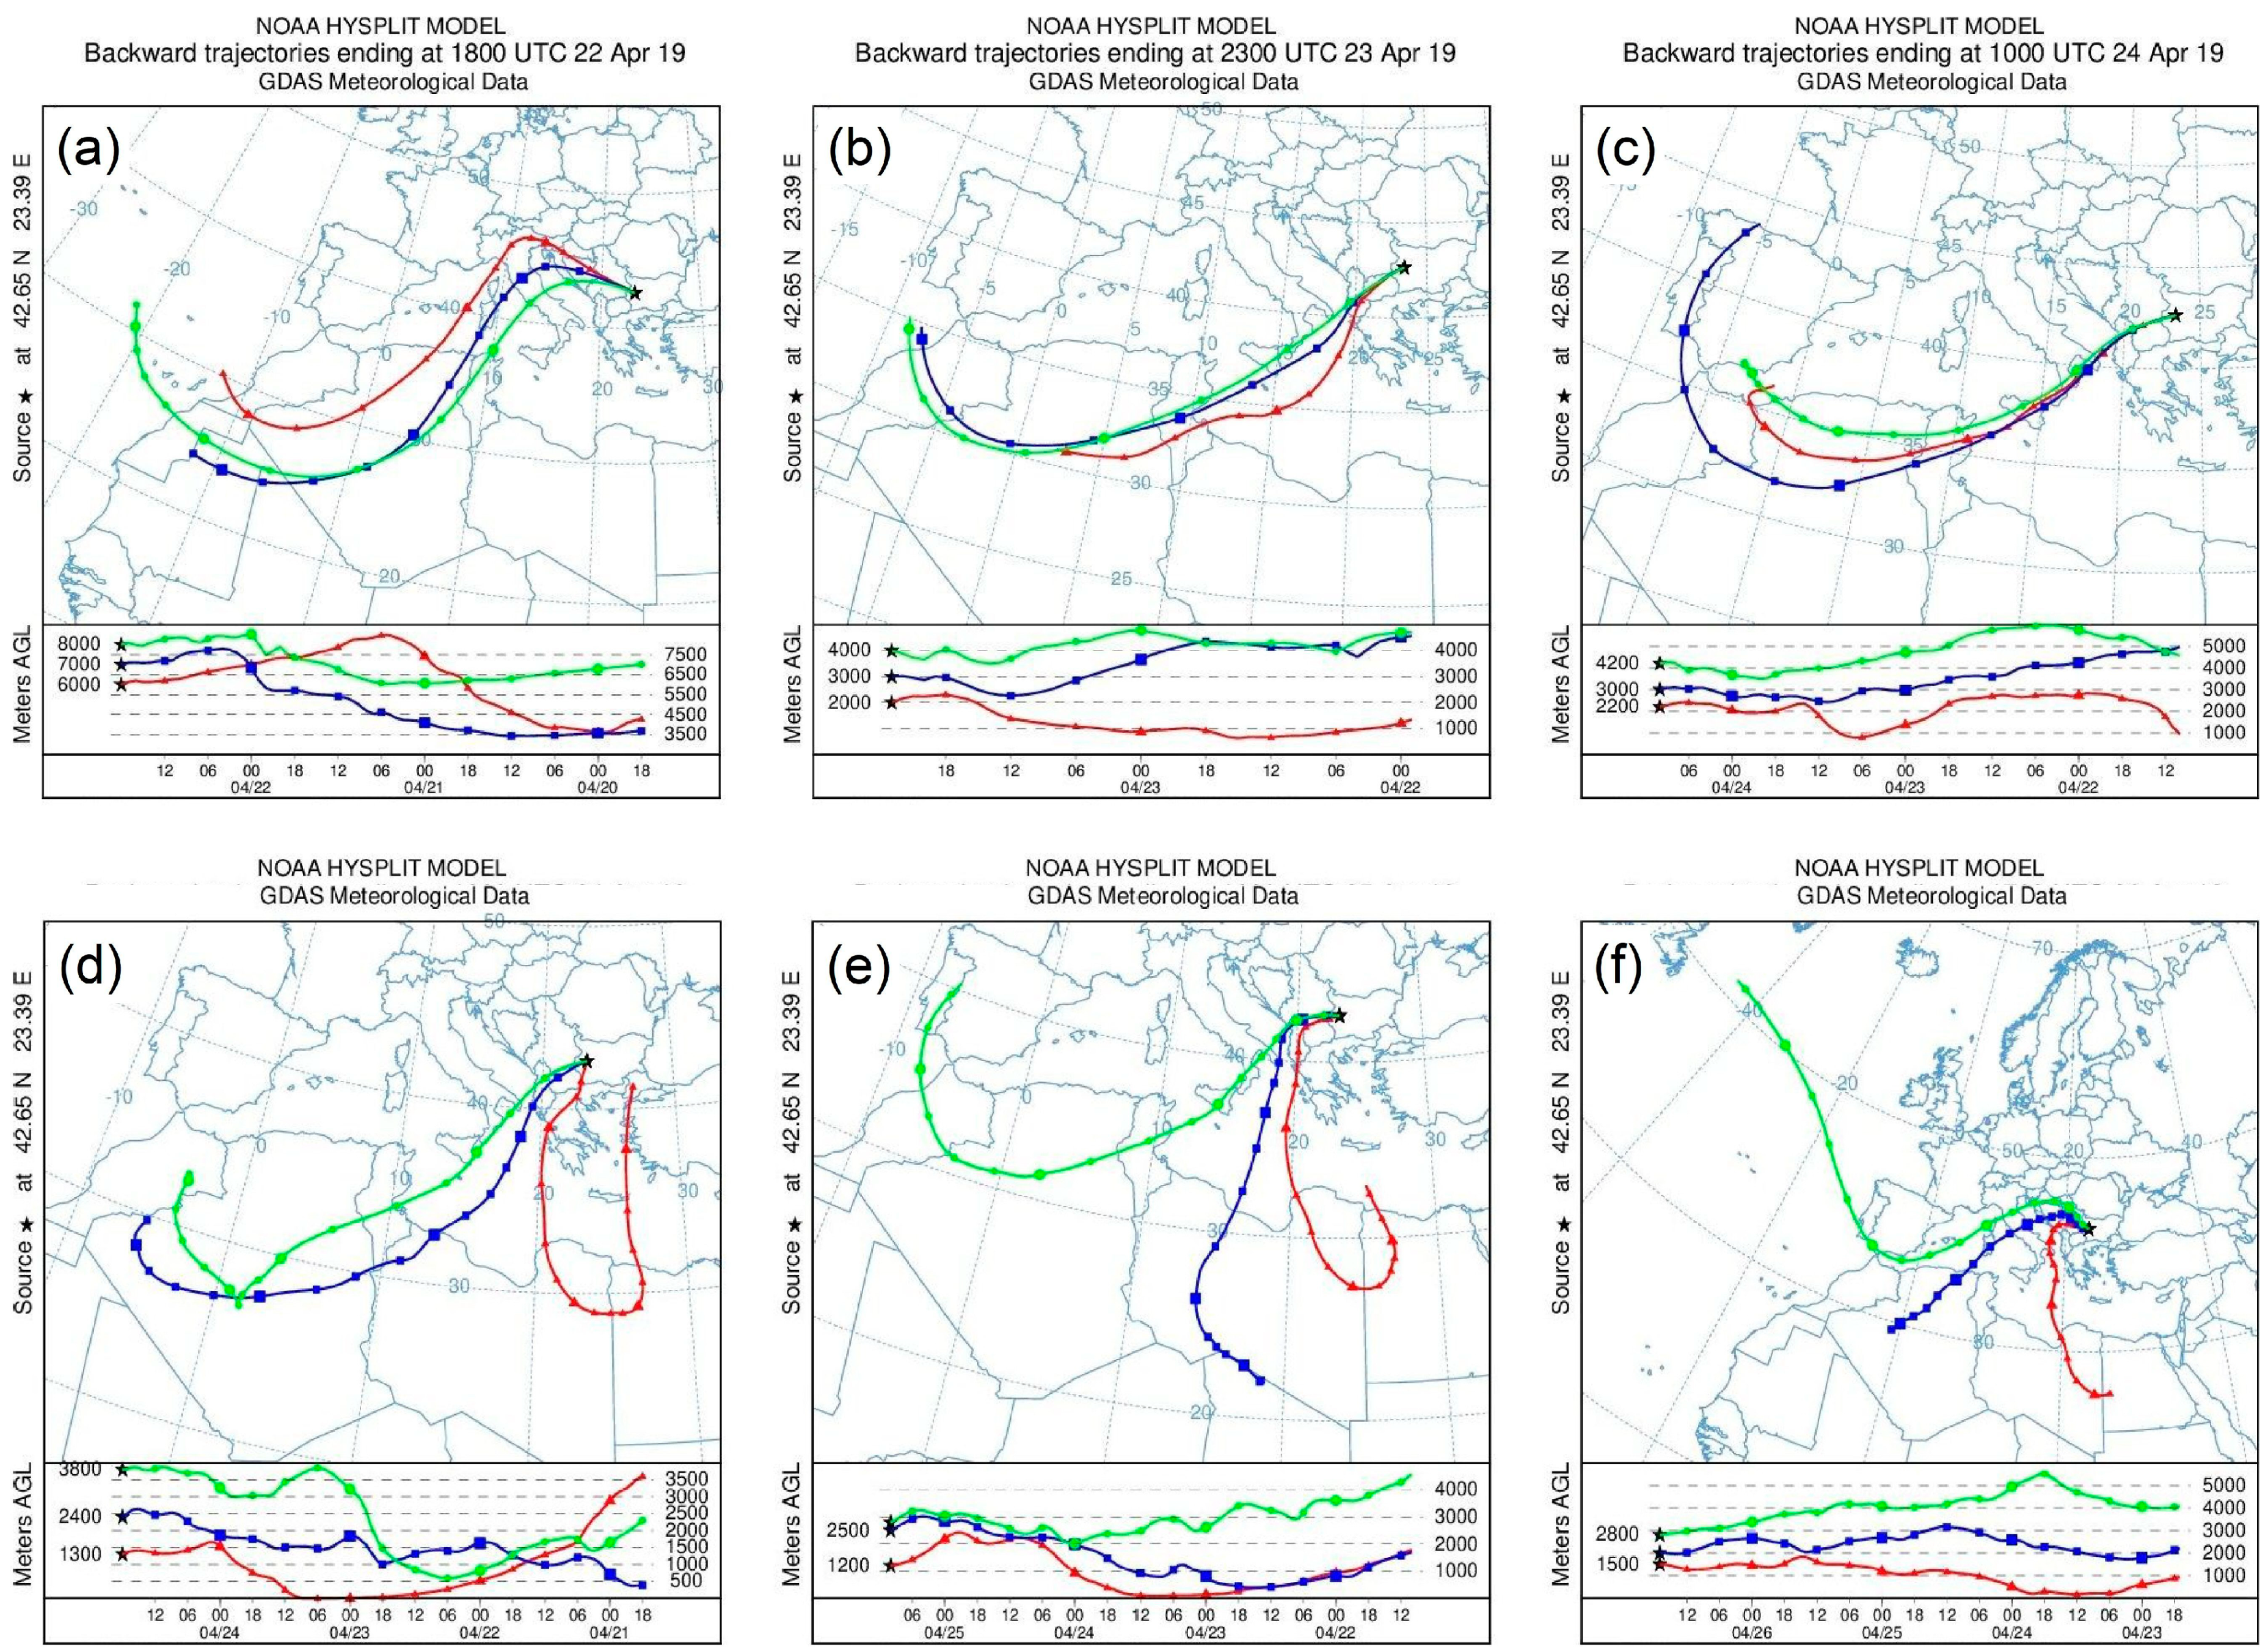
3.7. Air Transport Tracking Using the NOAA HYSPLIT Model

In order to establish the sources and trace the air transport route of the aerosol/dust layers observed, the corresponding backward trajectories ending above Sofia during the lidar measurements for the days considered were calculated using the NOAA HYSPLIT model [56,57]. The results are shown in Figure 8a–f. Sofia’s location is marked by a black star.
Figure 8a shows the backward trajectories ending at heights of 6, 7, and 8 km above Sofia at 18:00 UTC on 22 April during the lidar measurements (17:30–19:00). Their shapes and locations are in good agreement with the air circulation driven by the omega pattern, shown in Figure 4e, falling into the zone of most intense air transport outlined by the cyclonic left cut-off and the base ridge of the structure. It is also in agreement with the dust-load map for the evening hours of the day seen in the inset of Figure 5a. Both confirm that during the lidar measurement on that day the Saharan air layer reached Sofia region. At the same time, the HYSPLIT backward trajectories for heights below 4 km (not shown), at which the relatively dense aerosol layers in Figure 7a were recorded, had not reached North Africa even by the end of the day. However, the forecast profile of dust concentration for 00:00 UTC on 23 April (Figure 5a) shows the presence of dust throughout the troposphere above Sofia, including at altitudes below 4 km. Taking this into account, as well as the microphysical properties of the registered layers, it can be confidently stated that these are layers containing Saharan dust. Therefore, one can assume that they resulted from dust redistribution through downward convection from the upper half of the troposphere over Sofia, or a certain inaccuracy exists in the air-transport modeling, as discussed in the Section 3.6.
The backward trajectories presented in Figure 8b for heights of 2, 3, and 4 km refer to the end of 23 April, when the maximum of dust loading over Sofia for the whole event took place (Figure 5b). The dust transport is slightly reoriented and has a larger eastward component through the central Mediterranean, in accordance with the air circulation in Figure 4e.
Figure 8c,d shows the HYSPLIT backward trajectories ending above Sofia at heights in the range of 1–4 km during the daytime and evening lidar measurements, respectively, on 24 April—the day of the highest densities measured by the lidar for the entire period. They show the preservation of the characteristic shape of the air transport route from the previous days, passing mainly over Morocco, Algeria, and Tunisia and partly over the northern areas of Libya. For these first three days of the dust event over Sofia, the heights of the backward trajectories indicate that the mineral dust originates mainly from the Saharan ABL (up to 6 km), while the trajectory ending at 1300 m at 18:00 on 24 April has for about one day slid over Sahara surface in parts of northern Libya and Egypt, with possibility of capturing coarse fractions of dust.
This air transport pattern is also maintained during the next two days of the event, 25 and 26 April (Figure 8e,f)—the high backward trajectories (ending above Sofia at 2800 m) have crossed the upper Saharan ABL, while the lower ones (ending below 2500 m) have passed through its lower part. The lowest (red colored) trajectories again contain sections passing in the immediate vicinity of the Sahara surface, in areas of Libya. During these last two days, the lower (red and blue) backward trajectories deviate considerably from their initial orientation, following changes in the wind circulations due to the significant deformations and partial disintegration of the driving omega pattern (Figure 4g,h).
In summary, the picture of the Saharan dust air transport to Sofia region during the dust event studied, as outlined by the HYSPLIT backward trajectories, is indicative of a transfer of dust-containing air masses mainly from the western and partly from the central zones of Northern Sahara, with possibilities for capturing both finer dust particles from the Saharan ABL and coarse ones from or near the desert surface, as well as for carrying along humid air masses from over the Eastern Atlantic and the Mediterranean.

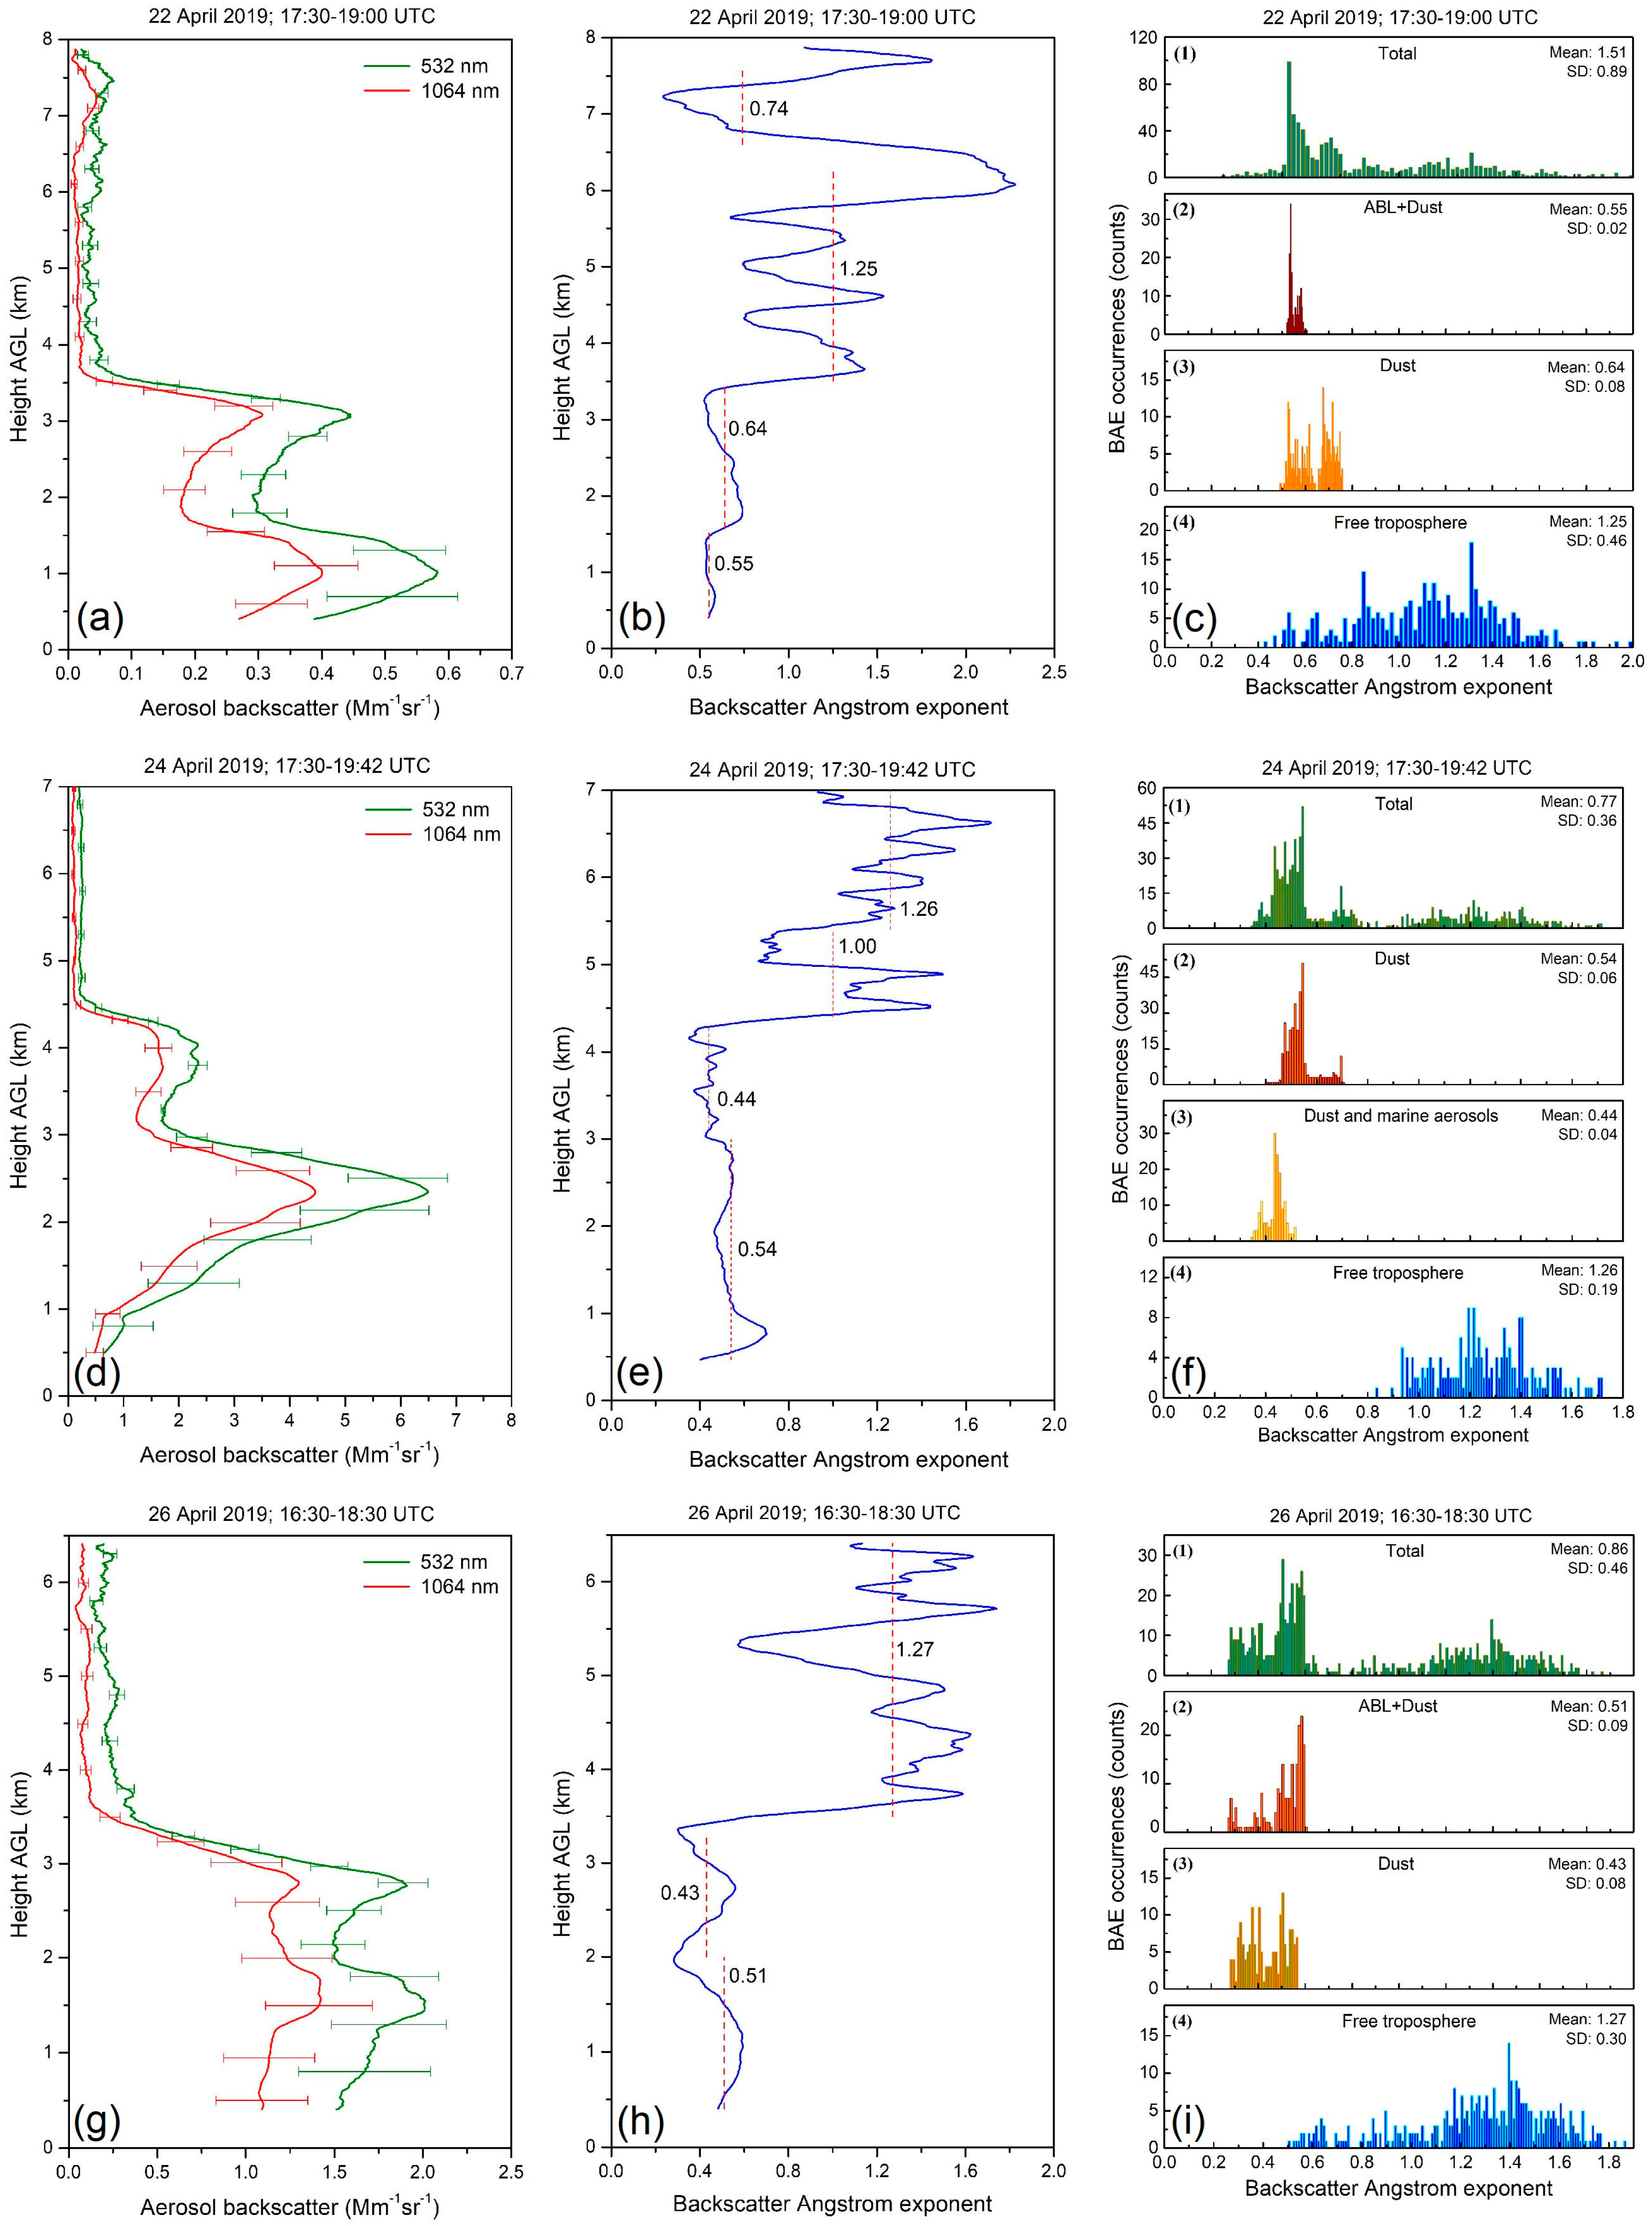
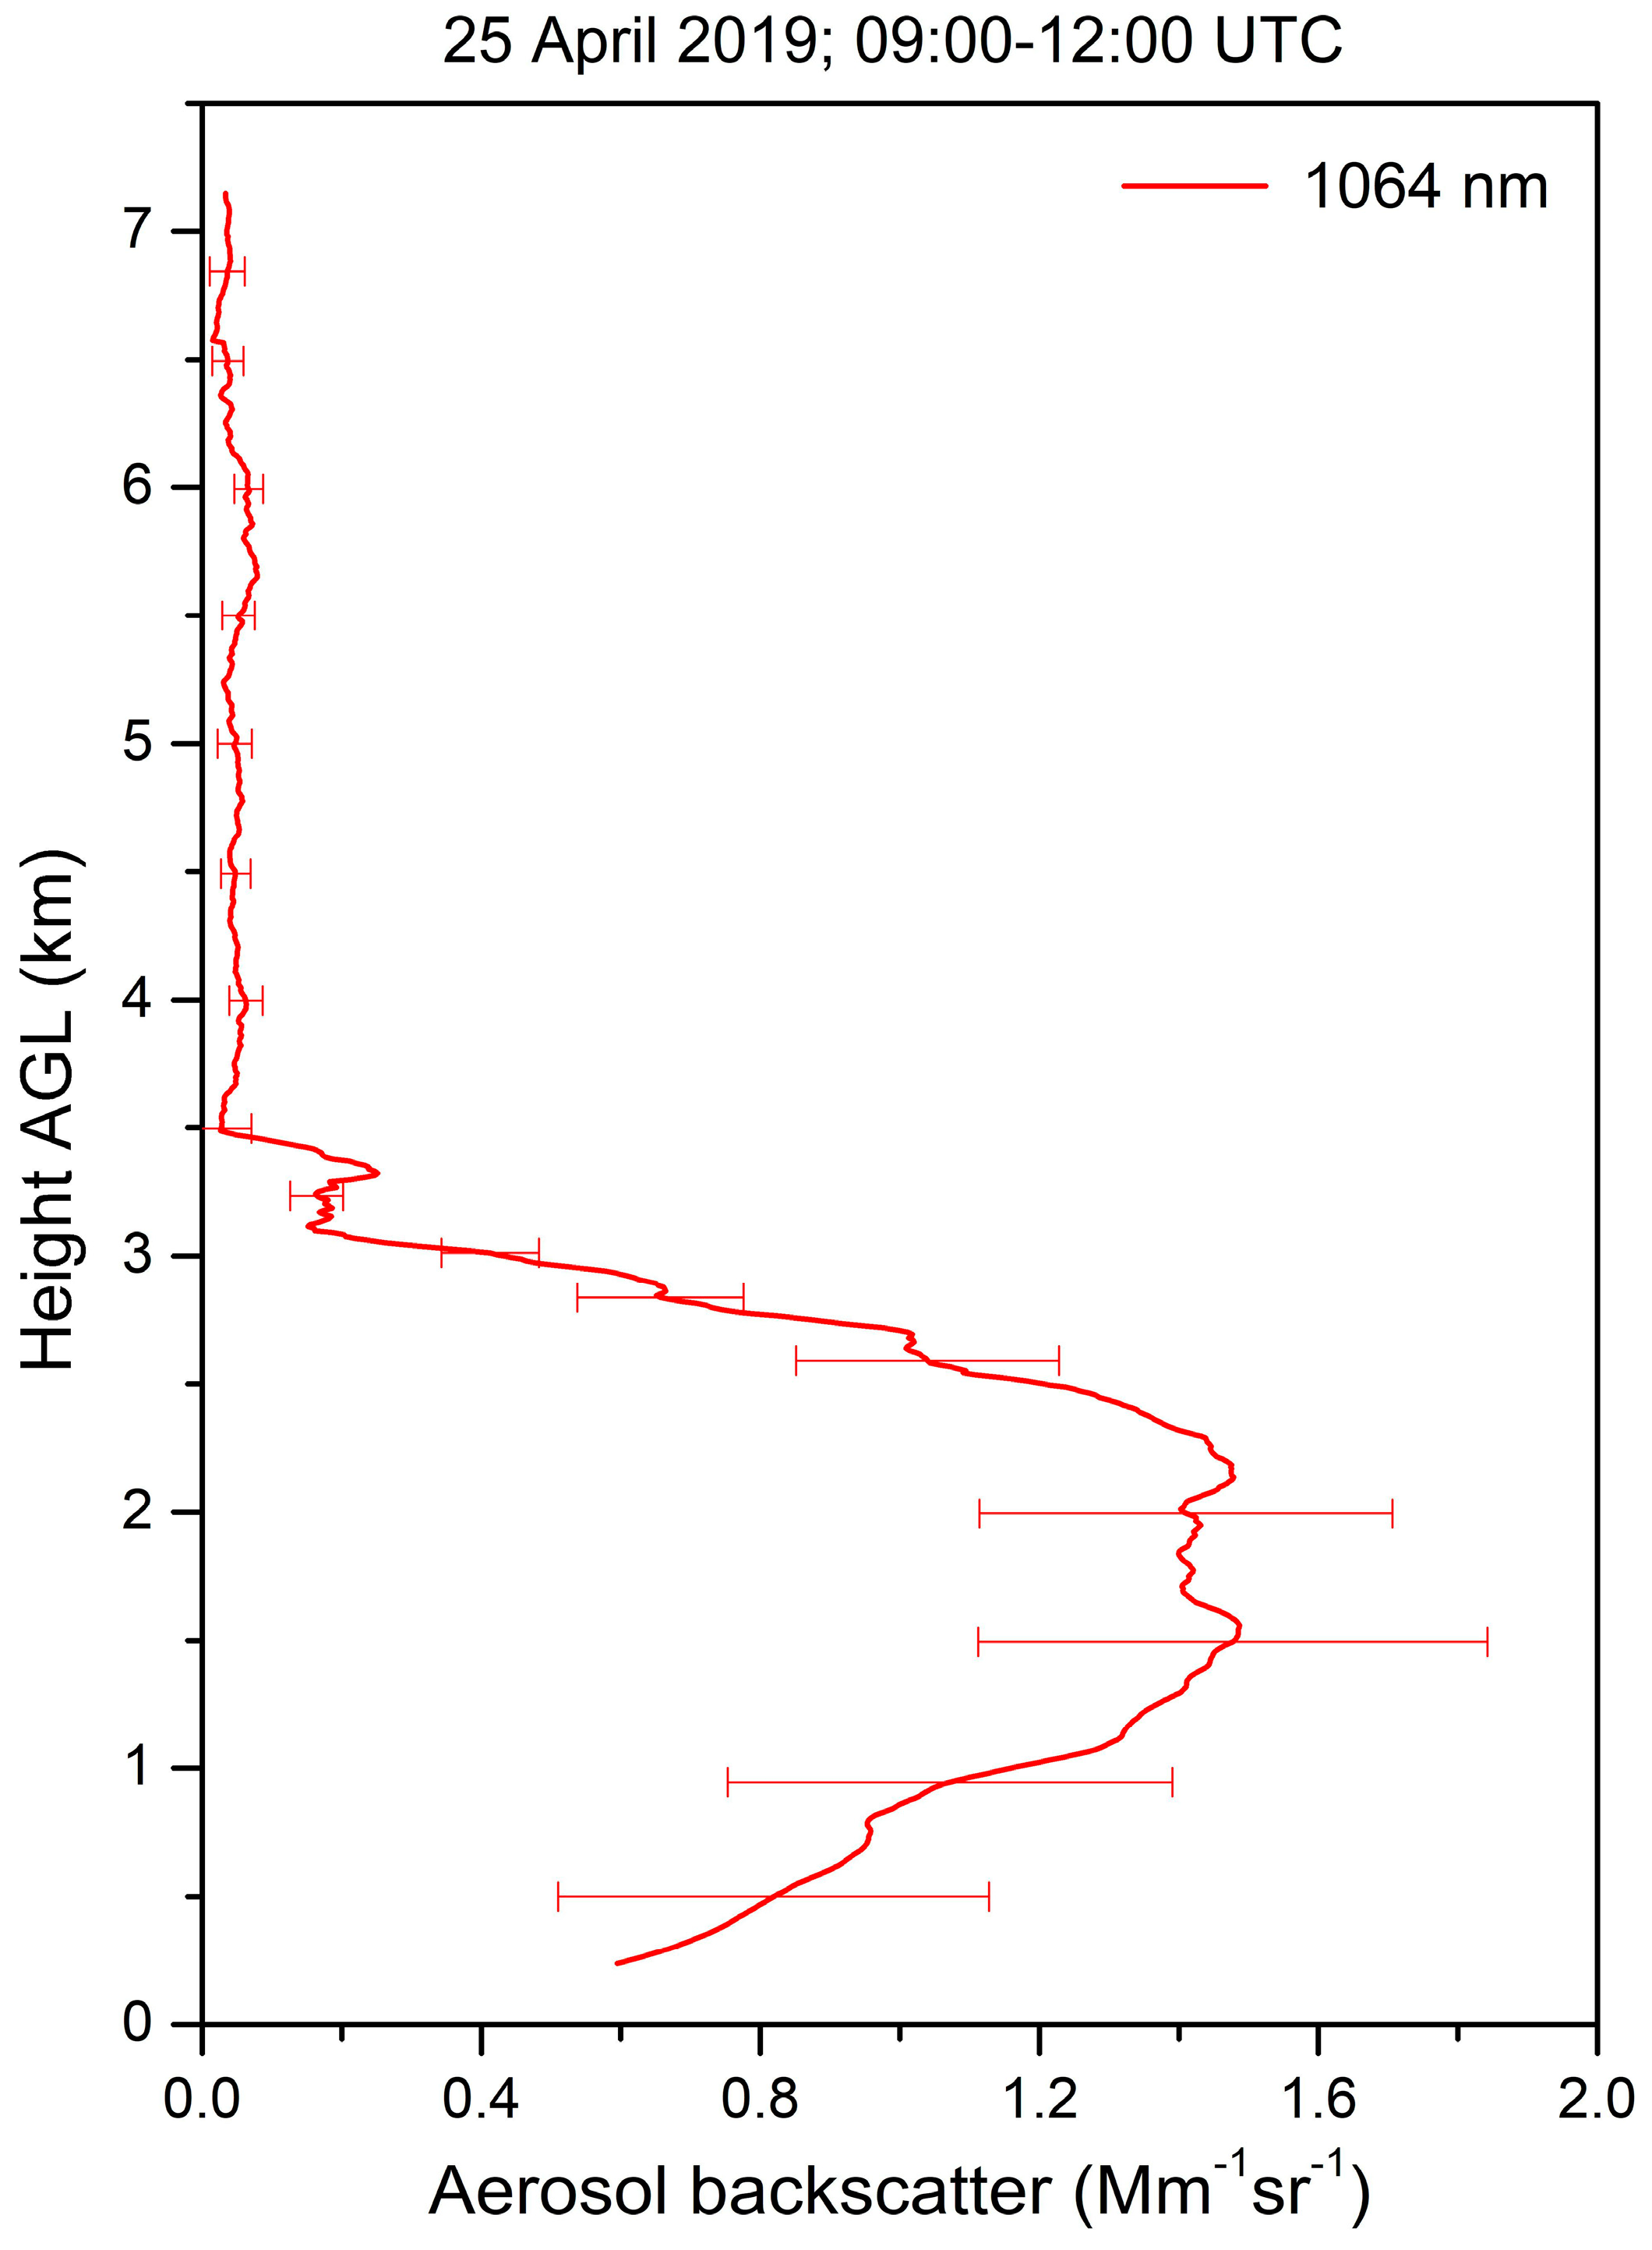
3.8. Lidar Profiling and Analysis of the Aerosol/Dust Optical and Microphysical Properties

Depending on the meteorological conditions, in particular the cloud cover, the lidar observations of aerosol/dust content of the atmosphere over Sofia were carried out in the period 22–26 April 2019. Two-wavelength (at 1064 nm and 532 nm) nighttime lidar measurements were performed on 22, 24, and 26 April, as well as a single-wavelength (at 1064 nm) daytime one on 25 April. The weather conditions did not allow lidar observations on 23 April.
Based on the time series of high-resolution lidar measurements, some of which were presented and discussed in Section 3.6, the integral height profiles of the aerosol backscattering coefficient averaged over the measurement’s total duration for the respective days were retrieved using the Klett–Fernald inversion approach [65,66]. For the cases of two-wavelength measurements, the backscatter-related Ångström exponents were calculated, profiled, and analyzed in order to characterize qualitatively the predominant aerosol/dust size fractions.
Figure 9a–i presents results regarding the above-mentioned parameters from the two-wavelength evening lidar measurements. In its left-hand column (Figure 9a,d,g), time-averaged vertical profiles of the aerosol BSC at 532 nm and 1064 nm are displayed up to heights of about 8 km. Separately, Figure 10 shows the single-wavelength daytime measurement at 1064 nm. The BSC profiles are retrieved using a constant lidar ratio of 45 sr, with calibration intervals selected in the altitude range 6–10 km, as described in Section 2.2.
Due to the integral nature of the profiles with an averaging time of about two hours, the aerosol/dust layer boundaries are expressed better than those seen on the colormaps in Figure 7. At their bottom, these layers merge with the local ABL, extending down to the surface, in accordance with the forecast profiles in Figure 5. The top boundaries of the dust layers are at heights of about 3.5 km on 22 April (Figure 9a), 25 April (Figure 10), and 26 April (Figure 9g), whereas on 24 April (Figure 9d) they are at about 4.5 km. Although separate sublayers are present in the structure of the aerosol field, as a rule they merge with each other in continuous configurations. An exception is the weak separate dust layer at a height of 6–8 km registered on 22 April (Figure 9a).
The profiles referring to 24 April (Figure 9d) show the presence of significant amounts of aerosols at heights up to 4.6 km distributed in a main dense layer extending up to 3.2 km with a pronounced peak at 2.35 km, and another one of a considerably lower density located immediately above the first one and centered at about 3.8 km. In general, the shapes and height distribution of the BSC profiles correspond well to those of the dust concentration profile in Figure 5c, except for the smaller upper sublayer, which is much better expressed in Figure 9d.
The maximum values of BSC determined at 1064 nm are in the range 0.8–4.5 Mm−1sr1, whereas those at 532 nm are between 1 Mm−1sr−1 and 6.5 Mm−1sr−1. The upper limits of these values were obtained during the nighttime measurement on 24 April (Figure 9d) at an altitude of about 2.5 km and reflected the situation shortly after the forecast absolute maximum of the event over Sofia occurring at the very beginning of the same date (Figure 5b). The BSC values quoted above are significantly higher than those normally measured over Sofia region, thus indicating the extreme intensity of the dust episode considered here. The maximum values of the BSC standard deviations (shown as error-bars on the profiles) are in the range of 20–25% with respect to the BSC mean.
The middle column of Figure 9b,e,h shows the vertical BAE profiles calculated based on the two-wavelength time-averaged BSC profiles for the respective days. The average BAE values are indicated for the dust-containing aerosol layers, as well as for the aerosol-free areas of the troposphere up to heights of 8 km (delineated by dashed lines). For the dust layers, these vary in the range of 0.43–0.74, logically pointing to the presence of coarse aerosols, such as desert ones. Above the aerosol/dust occupied areas, these values are around 1.26, which is typical for traces of background aerosols in the free troposphere [36,49].
The dust layers are nearly plateau-like with slight undulations around the mean, which is an indication of a composition that is close to a homogeneously mixed aerosol.
The average BAE values for 22 April (Figure 9b)—0.55 and 0.64 for the lower troposphere and 0.74 for the aloft dust layer, are higher than for the other days. In the case of the lower layers this is to be expected, as they refer to the first day of intrusion of dust-containing air masses over Sofia region, so that the percentage of local aerosols, some of which are finer, is still significant. For the aloft dust layer, the higher average value of BAE is due to the fact that the desert aerosols in it originate from altitudes of 3.5–6.6 km in the upper half of the Saharan ABL, where normally there are no very large dust fractions.
For 24 and 26 April, Figure 9e,h, the average BAE values for the dust layers vary in the range 0.43–0.54, indicating a more pronounced dominance of coarse fractions with a particle size in the over-micron range.
The right column of Figure 9c,f,i shows histograms of BAE distributions in terms of BAE occurrences in counts obtained for the whole BAE profiles and for characteristic sections of them, in particular for the dust-containing layers related to the three days considered. Note that such distributions are a qualitative analog of the actual size distributions of aerosol particles in an inverse proportion—lower BAE values correspond to larger particle sizes. The displayed histograms are the result of a statistical analysis of the BAE occurrences when scanning the BAE values with a bin window of 0.01. SD stands for the standard deviation of the individual BAE values with respect to the BAE mean value, being the square root of the BAE variance.
The panels labeled as (1) represent distributions corresponding to the whole BAE profiles, whereas the ones marked as (4) are for the respective sections of the free troposphere. The BAE distributions relating to the layers with a predominant dust content are shown in Figure 9’s panels(c)-(3), (f)-(2), and (i)-(3), while those for the dust layers mixed with aerosols of local ABL are given in panels (c)-(2) and (i)-(2).
Panel (f)-(3) shows the BAE distribution for the sublayer observed on 24 April (Figure 9e) in the altitude range 3.2–4.5 km and identified as containing a mixture of dust and marine aerosols. When extended to cover also several previous days, the backward trajectory for 3800 m in Figure 8e corresponding to this layer passes in close proximity to the surface of the North Atlantic for a period of six days (13–19 April), with a high probability of the air masses capturing coarse marine aerosols, whereafter they also cross areas over North Sahara, making it possible to collect desert dust [60].
As can be seen from the histograms in panels (2) and (3) of Figure 9c,f,i, the BAE values for dust-containing layers are distributed in the range 0.3–0.75, values usually measured for Saharan dust in Sofia region [36,49,50]. The normalized to the mean SD values range from about 4% (22 April, panel c-2) to about 18% (26 April, panels i-2 and 3) with an average of 9–12% at the peak of the event (24 April, panels f-2 and 3). It can be reasonably assumed that these relative variations of the BAE are also representative of the relative changes in the actual size of the dust particles with respect to their mean. These variations are acceptable, given that the desert aerosols detected originate from the entire altitude range from Sahara surface to the top of its ABL, as shown by the backward trajectories in Figure 8.
The BAE distributions relating to the free troposphere exhibit the wide shapes that are characteristic for the general background aerosols, extending in the range 0.4–2 and centered on BAE values of about 1.2.
The lidar observations on the aerosol’s optical and microphysical properties during the studied dust event over Sofia (Figure 9 and Figure 10) reveal that even after the long-range transport (≥2000 km) and the dust plume spreading over vast areas of the Mediterranean and Europe, the intensity of the dust loading remained high, confirming the extreme strength and large scale of the dust episode under consideration.

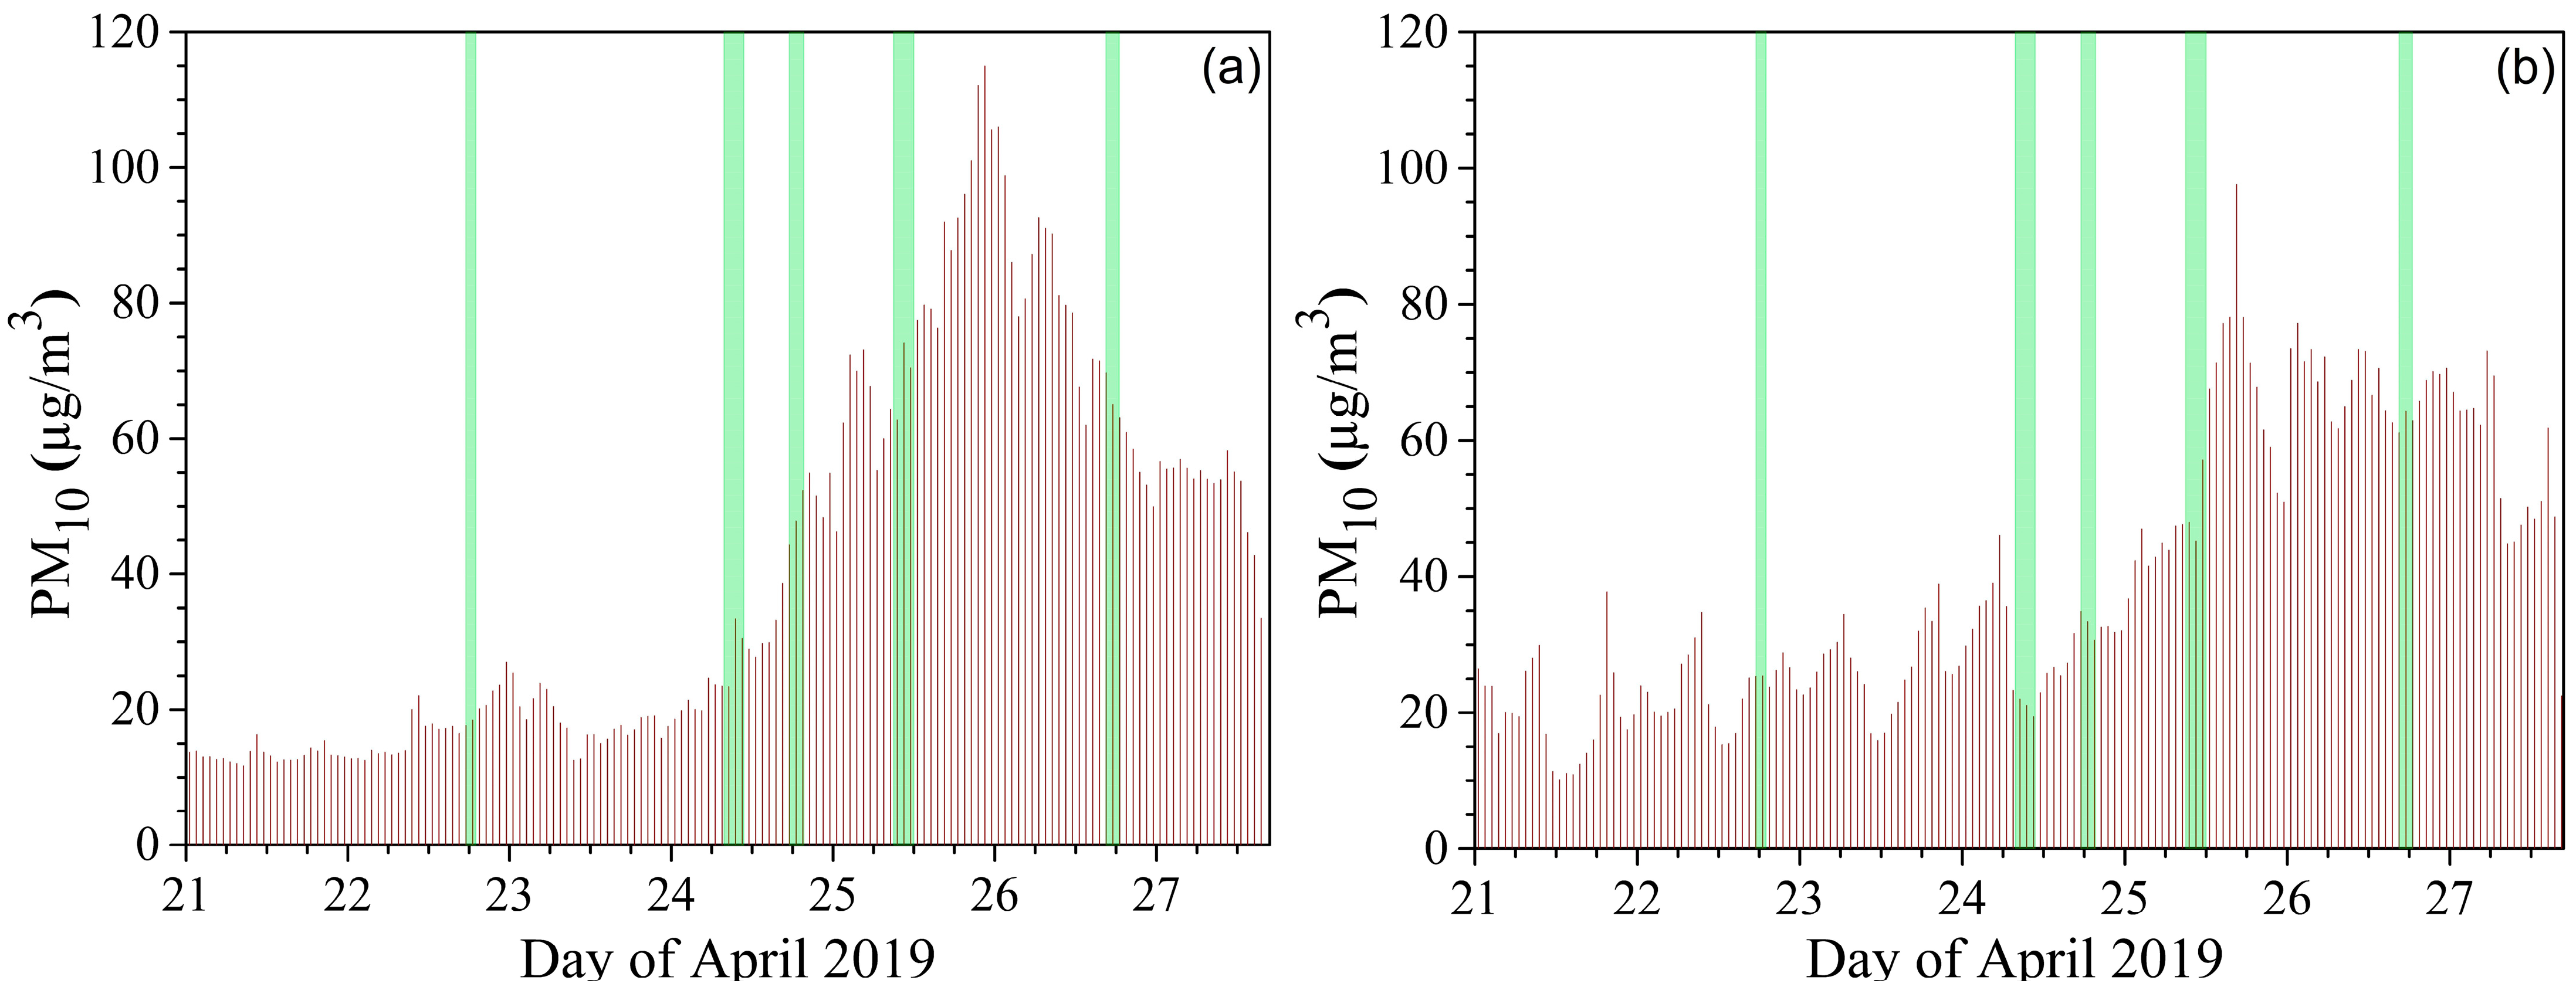
3.9. Results from In Situ PM10 Concentration Measurements (21–27 April 2019)

It has been shown that desert dust is the main natural source contributing to increased levels of PM10 in Southern Europe [59,92,93]. Furthermore, 96% of the mean annual PM10 daily limit value exceedances registered at Madrid rural background stations has been detected during Saharan dust outbreaks [92]. Specifically for the dust episode considered here, the authors of Ref. [26] reported that the atmosphere from Africa through Crete over Europe to Iceland had been loaded with an enormous amount of Saharan dust, reaching a PM10 concentration of >150 μg/m3. Our previous results from parallel lidar and in situ measurements during the last decade show similar results. Comparison of the transport episodes of Sahara Dust over Sofia with the time course of the PM10 concentration measured by the elevated rural Kopitoto AMS demonstrates a good correlation between the time intervals of these episodes and the intervals when measuring increased concentration of PM10 at the top of the local ABL [36].
The hourly mean values of the PM10 mass concentrations measured by two NASEM AMSs in the period of Saharan dust intrusion over Sofia analyzed in this work are presented in Figure 11. The lidar measurements intervals are marked by green stripes. Time series data of the hourly mean values of the PM10 mass concentrations registered by the AMSs in Sofia, operating in a continuous mode, are available at the European Environment Agency (EEA) database [94].
In order to analyze the air-quality situation during the event period, we selected two of the six stationary air-quality AMSs on the territory of the city of Sofia. The first one is the Mladost AMS (BG0079A) urban traffic station located at about 300 m away from the lidar site (42.655488° N, 23.383271° E, 586 m ASL). This is an area of high population density intersected by one of the main city thoroughfares with heavy traffic, so that it is strongly influenced by local emissions. The annual mean PM10 value registered by this station in 2019 is 32.72 μg/m3 [64]. The second one, the Kopitoto AMS (BG0070A), is located at about 800 m above the other AMSs (42.637192° N, 23.243864° E, 1321 m ASL) in the Vitosha Mountain. The station altitude is near the top of the local ABL and the data obtained are practically unaffected by local anthropogenic aerosols. Thus, it is classified as an elevated rural reference station for aerosol background measurements. The annual mean PM10 value registered by Kopitoto AMS in 2019 is 15.5 μg/m3 [64].
The low values of the mass concentration of about 10–15 μg/m3, measured on 21 April 2019 by the Kopitoto AMS are typical for this station in the absence of incoming external aerosols. As can be seen in Figure 11a, during the dust event period over Sofia when the lidar observations analyzed here were conducted, the PM10 concentrations measured exhibited a significant and stable increase with peak values of about 115 μg/m3 registered on 25 April 2019 in the time interval 21:00–23:00 UTC [94]. Due to technical reasons, no data are available for this station from 27 April, 15:00 UTC, to 30 April, 10:00 UTC, in the EEA database. The values of the PM10 mass concentration measured on 30 April 2019 (not shown in Figure 11a) returned to the normal values for this station of 5–10 μg/m3. Thus, the results of the in situ PM10 concentration measurements at the Kopitoto AMS confirm the presence of desert dust in the atmosphere above Sofia during the lidar observation period analyzed here.
The BSC-CNS forecast predicts a dust concentration peak around midnight between 23 and 24 April (Figure 5b). The discrepancy between that forecast and the above-mentioned time of the dust peak, obtained from in situ measurements, is illusory. It could be explained by the downward redistribution of the dust concentration which on 24 April reaches a maximum at an altitude of 2–2.5 km; this maximum further descends to about 0.8–1 km on 25 April, being in close proximity to the height of Kopitoto AMS (0.8 km AGL). On the other hand, the comparison of the BSC values ratio from the lidar measurements performed on 24 and 26 April (Figure 9d,g, respectively) for the altitude of 0.8 km with that of PM10 concentrations from in situ measurements for the respective hours (marked by green stripes) of Figure 11a shows virtually the same value of about 0.65, thus supporting the reliability of both measurements.
The above-described downward convection of desert aerosols is also evident in Figure 11b, on the diagram for PM10 concentration of the urban Mladost AMS, which is located just below the height level of the lidar site. It also shows a similar course of gradual increase in the aerosol concentration from 24 April to its maximum on 25–26 April, although with the more moderate values of about 70–80 μg/m3; this points to a descent of mineral aerosols to the surface, in accordance with the forecast profiles in Figure 5. As expected, the effect of increased dust concentrations is masked by comparable high levels of anthropogenic aerosols, given the station’s urban environment.
Thus, when remote lidar monitoring of predominantly homogeneous external aerosols (as in the case of Saharan dust considered here) is carried out simultaneously with in situ measurements by a reference rural AMS, which is indicative of the registration of this type of aerosols, it becomes possible to use data from such AMS in developing methodologies for calibrating the lidar profiles of optical aerosol characteristics and their subsequent conversion to aerosol mass concentration profiles.
Due to the coincidence of the time periods of registered higher than usual values of PM10 concentration measured by Kopitoto AMS with the period of the dust event, and taking into account the absence of other aerosol layers registered by the lidar, one can conclude that the data presented in Figure 11a refer almost entirely to mineral aerosols brought from Sahara Desert. This means that the data from Kopitoto AMS obtained during the event can be used for direct comparison with the concentrations forecast by the BSC-CNS models for the station’s altitude, as well as for quantitative calibration of the lidar measurements data.

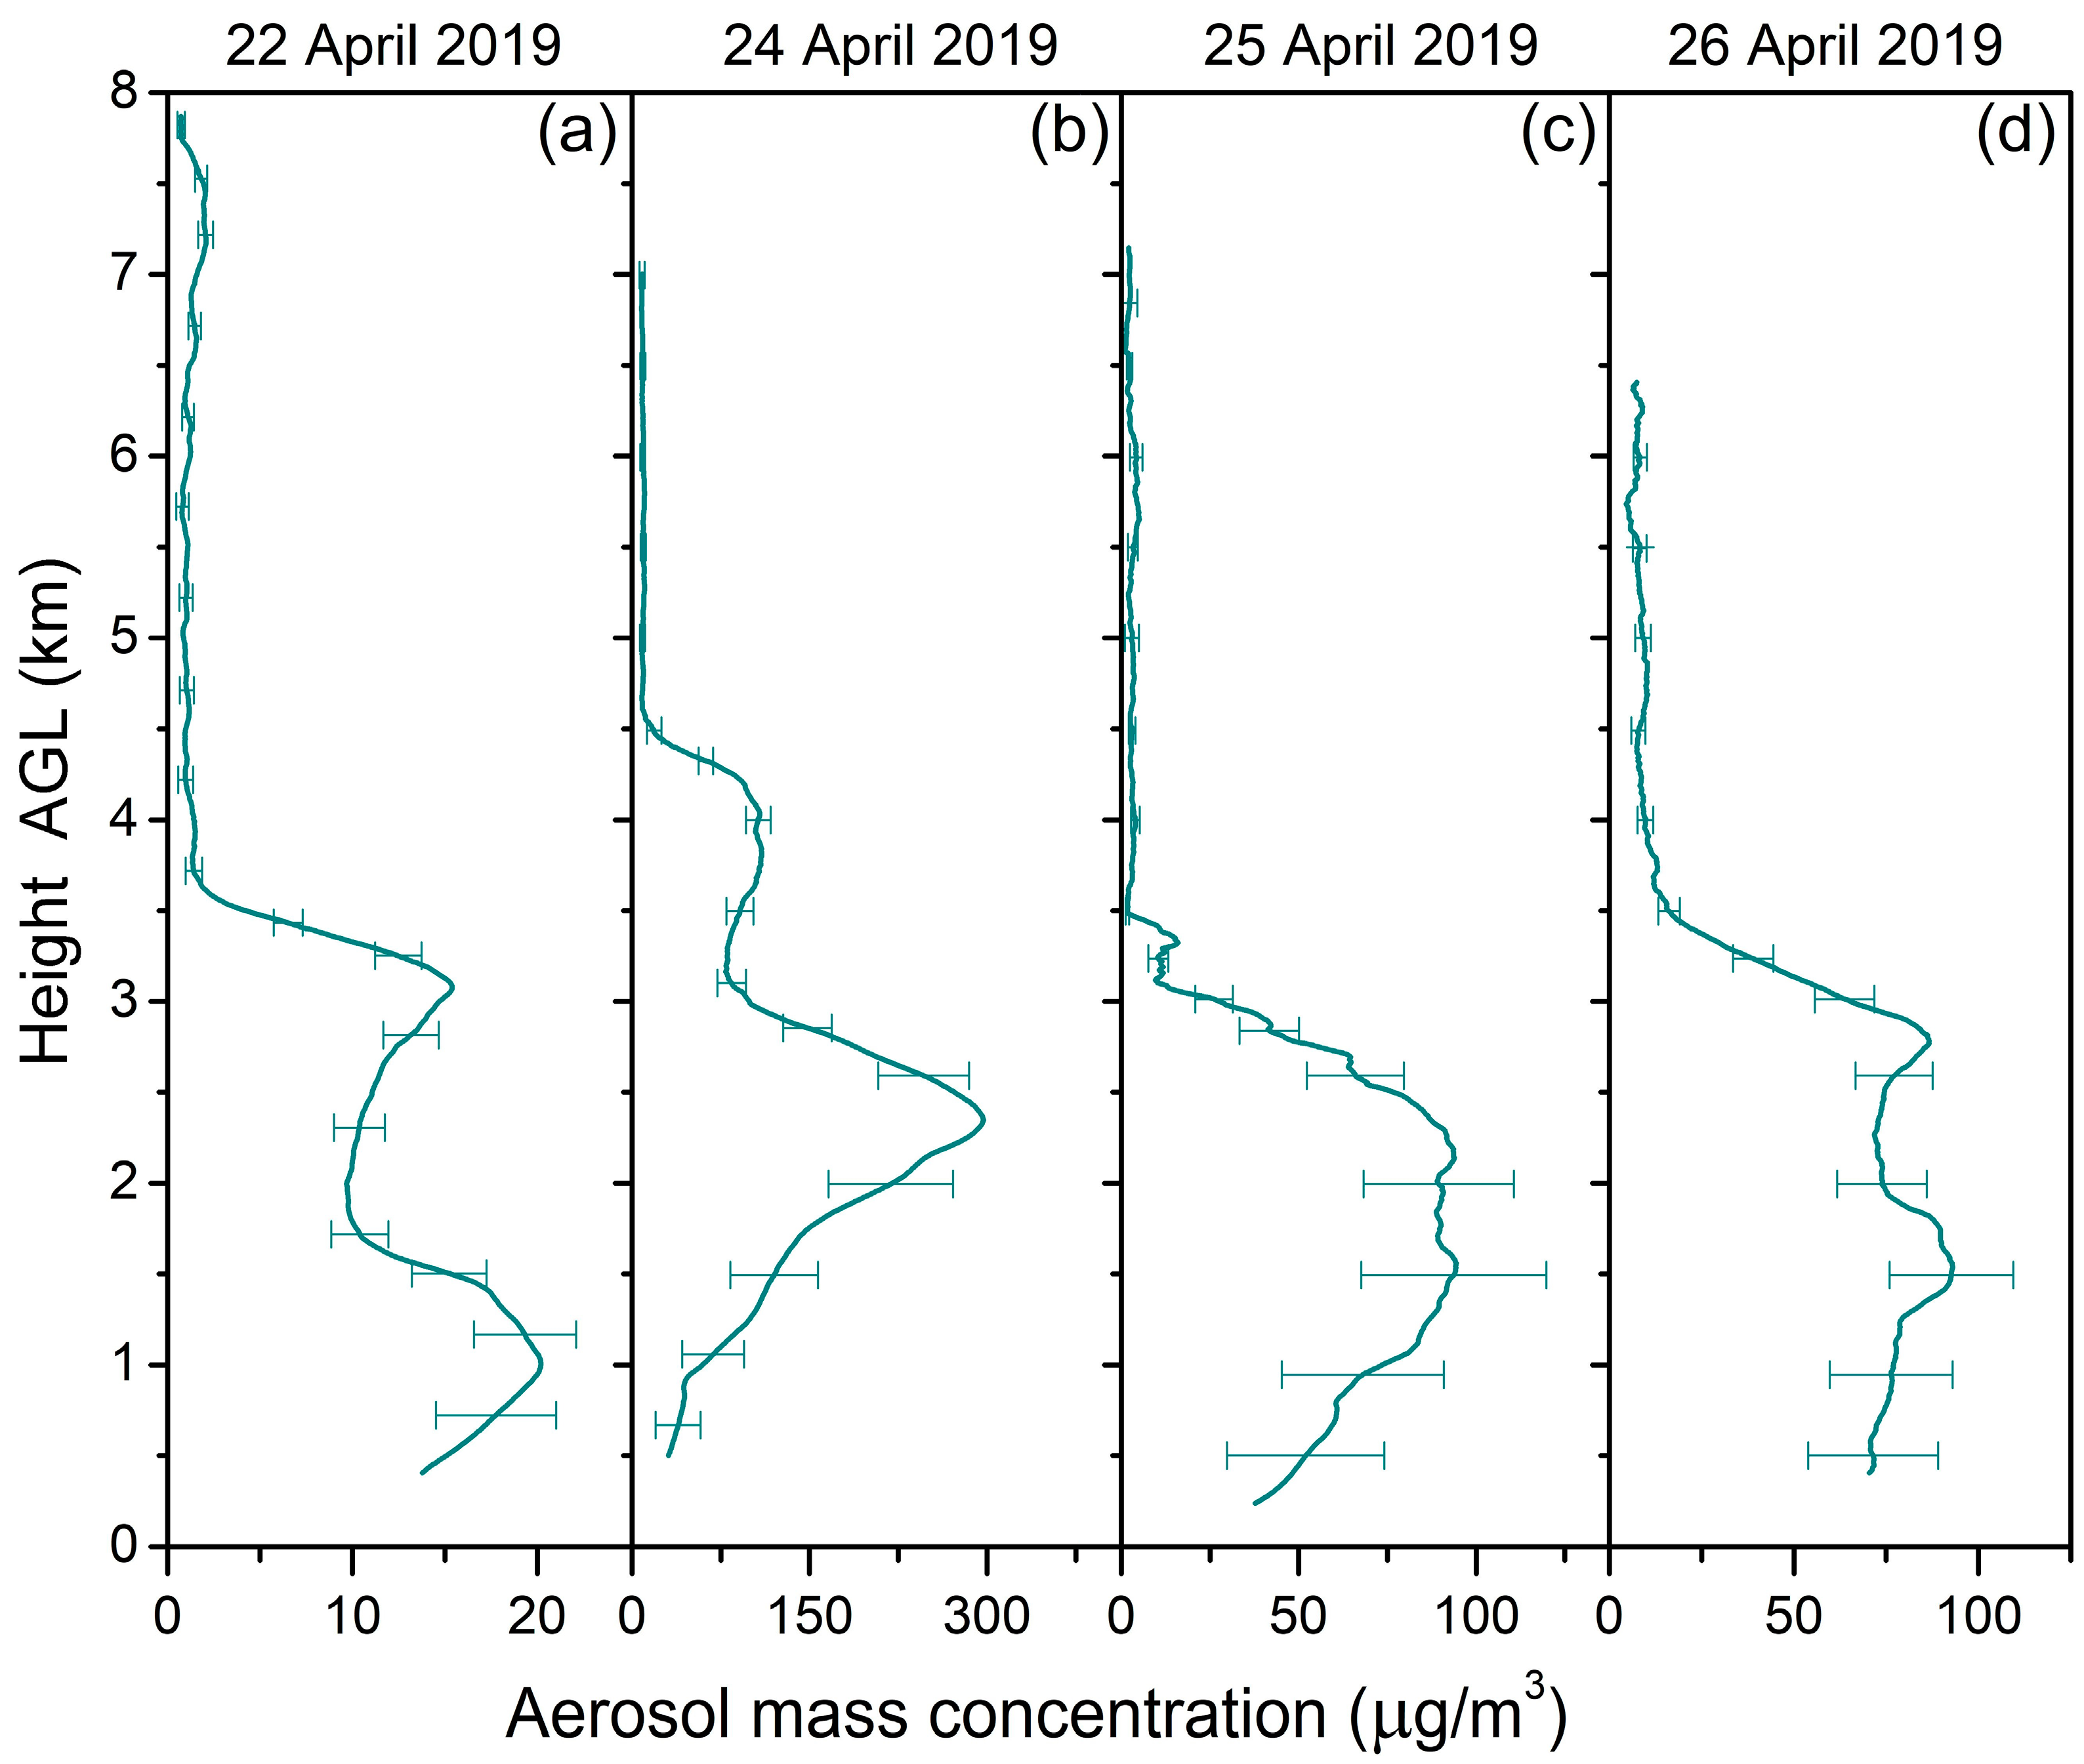
3.10. Aerosol/Dust Mass Concentration Profiling

The modeling and experimental results presented in the previous (sub)sections of this work unequivocally show that the aerosol layers observed in the atmosphere above Sofia in the period 22–26 April 2019 consisted exclusively of Saharan dust transferred within the heavy large-scale dust episode considered, which was partially mixed during the air transport with a limited amount of marine aerosols, as well as with local ABL aerosols. In addition, the small width of the BAE distributions of the dust-containing aerosol layers (Figure 9c,f,i) is an evidence of the high degree of mixing of the particulate matter in the layers, i.e., of their homogeneous composition. These two features, together with the absence of separate layers consisting of other aerosols, strongly favor the assumption that the lidar ratio is practically constant in the altitude ranges occupied by aerosols. This means that the height profiles of aerosol backscatter and extinction likely have nearly the same shape, one that follows the shape of the aerosol mass concentration (MC) profile. Thus, an opportunity is opened up for height profiling of the aerosol MC, using appropriate calibration [95], directly from the aerosol BSC profiles, without the need for intermediate determination of the aerosol extinction profiles. Here, this possibility is realized by using the vertical aerosol BSC profiles presented in Figure 9a,d,g and Figure 10, together with data from parallel in situ measurements of the aerosol PM10 concentration in the respective time intervals by the elevated rural Kopitoto AMS, shown in Figure 11a.
In order to calibrate the BSC profiles in reference to those of the aerosol MC, the ratios were determined of the aerosol PM10 concentration values (in µg/m3) measured at Kopitoto AMS to the aerosol BSC values (in 1/Mm sr) related to the station height (1321 m ASL or 721 m AGL), representing the backscatter-to-concentration conversion coefficients Kc (in g sr/m2). The calibration data for converting the aerosol BSC to MC are given in Table 1. The standard deviations presented of Kc and aerosol MC are calculated on the basis of those for aerosol BSCs, according to the error propagation theory [96] in the case of independent variables, which is valid here.
Since the aerosol BSCs were determined for the two lidar wavelengths (532 nm and 1064 nm), two Kc values and two MC height profiles were obtained corresponding to the two wavelengths. Figure 12 shows the mean aerosol MC height profiles thus calculated relating to the four days of lidar and in situ measurements. The height-integrated columnar values of the calculated MC are given in the last column of Table 1. Both the data for 24 April in Table 1 and the related MC profile in Figure 12b refer to the two-wavelength nighttime measurements. As the daytime measurement on 25 April was performed at 1064 nm only, the aerosol MC calibration was completed using only the BSC profile obtained at this wavelength.
The peak MC values for the measurement carried out on 22 April (Figure 12a) do not exceed 20 μg/m3, whereas the corresponding columnar concentration is of the order of 48 mg/m2, being relatively low in line with the low values of both the BSC (Figure 9a) and PM10 (Figure 11a) for the day. At the top, the part of the MC profile at heights of 6–8 km corresponds somewhat to the forecast profile for 18:00 UTC (not shown), whereas at the bottom (up to 4 km) it is similar to the modeled one shown in Figure 5a for these heights, relating to a slightly later time interval. For this first day of the dust plume intrusion over Sofia, some discrepancies exist in the height and time of the forecast profiles with respect to the actual ones retrieved from lidar and in situ measurements, as discussed in Section 3.8 for the case of the BSC profiles.
The comparison of the aerosol MC profiles obtained on 24–26 April, displayed in Figure 12b–d, with the modeled Saharan dust ones in Figure 5b–d for the same time periods shows a fairly good agreement regarding the layers’ height boundaries, the profiles’ shape and the MC values. Note that the heights in Figure 12 are AGL, while those in Figure 5 are ASL.
The aerosol MC peak value calculated for the main aerosol/dust layer observed on 24 April (Figure 12b) at a height of 2.4 km AGL (3 km ASL), being about 300 µg/m3, is slightly lower than the estimated forecast value of 400 µg/m3 (Figure 5b), while a good profile shape correspondence in the layer’s lower half is found. The sublayer superimposed on the main one with a level of about 100 µg/m3 located in the height range 3.2–4.5 km AGL (3.8–5.1 km ASL), which in Figure 5b is not well defined, to some extent compensates for the lower value of the main peak. The integral mass concentrations of the experimentally obtained and the modeled dust layers up to heights of 4.5 km AGL (5.1 km ASL) are of the order of 500 mg/m2 and 700 mg/m2, respectively. In this case, the existence can be acknowledged of a good qualitative and a satisfactory total quantitative correspondence, as the modeled integral concentration exceeds the experimentally obtained one by about 30%. It is worth noting that the height-resolution step applied to the BSC-CNS model profiles in the lower half of the troposphere, where the aerosol/dust layers are observed, is of about 1 km increasing upwards to 2 km, both values being incommensurably larger than that of 7.95 m specific to the profiles in Figure 12. For this reason, no detailed matching should be sought in the structure of the two types of profiles.
The MC profile in Figure 12c related to the daytime measurement conducted on 25 April shows a relatively good general similarity with its corresponding forecast profile in Figure 5d in terms of the aerosol distribution compactness and the layer boundaries. It is symmetrical, with a nearly even maximum of about 100 µg/m3 spread over the height range of 1.5–2.5 km AGL (2.1–3.1 ASL), while the modeled one is more asymmetrical, reaching at its bottom part (at 1–1.5 km ASL) about 150 µg/m3. As in the previous case, the integral mass concentration of the former, being about 200 mg/m2, is about 70% of that of the latter.
Regarding 26 April (Figure 12d), the MC profile becomes more plateau-like, with the maximum values of about 70–80 µg/m3 remaining nearly constant in the height range of 0.5–3 km AGL. The corresponding forecast profile in Figure 5e exhibits in its lower part similar levels, which decrease gradually upwards with values slightly below those of the aerosol MC profile measured. The dust layer integral concentrations of about 200 mg/m2 are close for both profiles, with a slight predominance of about 15% in favor of the measured one.
The partial discrepancies established above in terms of altitude ranges and time intervals between the modeled and the measured MC profiles in the beginning of the dust event, as well as the incomplete quantitative coincidence observed between them throughout the event’s course, confirm the need for acquiring and directly comparing the lidar and in situ data with the modeled data as a means of better parameterization of the models in view of increasing their spatial and temporal forecasting accuracy.

4. Conclusions

The Saharan dust episode that occurred in the second half of April 2019 is an event of an extraordinary massive large-scale transport of desert aerosols over the Mediterranean and Europe, up to the polar regions in the north and over the Atlantic to the Caribbean in the west, considerably exceeding the strong dust outbreaks typical for the spring-summer period. Being formed in the interface of the monsoon zone of Northwestern Africa, the Eastern Atlantic and the Western Mediterranean, the dust episode in question is conditioned and driven by a highly dynamic synoptic blocking pattern (omega block), creating conditions for powerful northeastward circulation of air masses rich in desert dust and moisture.
Confirmed by MODIS satellite images, a distinctive feature of the dust transport during this episode is the dust plume mixing with water clouds and their simultaneous joint spreading in the form of a mixed cloud-dust field with a specific fibrous veil-like structure. The HYSPLIT model backward trajectories show that the dust-containing air masses originated mainly from the western and partly from the central areas of Northern Sahara, with the possibility of capturing finer dust particles in the Saharan ABL and coarse ones on or near the desert surface, as well as for carrying moist air from the Eastern Atlantic and the Mediterranean.
The weather conditions in Sofia during the dust event, particularly the temperature and the atmospheric water content, are seriously and specifically affected by the intrusion of air masses rich of dust and moisture. The relatively low temporal dynamics observed of the aerosol density in the dust-containing layers during the predominant part of the lidar measurements is an indication of the high degree of mixing of the aerosol fractions and the homogeneity of the dust layers.
The lidar measurements show that the Saharan dust layers are concentrated in the lower half of the local troposphere, in relatively compact configurations superimposed on the ABL and penetrating it down to the surface, with a definite dominance over local aerosols. The biggest values of the aerosol BSC reveal that even after the dust plume long-range spread, covering vast areas over the Mediterranean and Europe, the dust density remains high, thus confirming the exceptional strength and large scale of the episode in question.
The higher than usual PM10 concentration values measured by the Kopitoto elevated rural AMS, increasing synchronously with the Saharan dust intrusion over Sofia region, demonstrate that this station’s data are representative in what concerns the detection and evaluation of external aerosols, particularly desert ones. The relatively high homogeneity of the aerosol mix dominated by dust and its rather narrow BAE distributions favoring the use of a constant lidar ratio allow one to calculate calibrating conversion coefficients and use the in situ data to construct vertical aerosol mass concentration profiles directly from the aerosol BSC profiles, avoiding the need for intermediate determination of the aerosol extinction profiles.
The comparison of the thus obtained vertical aerosol concentration profiles with the dust model forecast ones show a satisfactory correspondence regarding the layers’ height boundaries, the profiles’ shape, and the aerosol mass concentration values. The partial discrepancies observed between them, more typical in the case of the turbulent front part of the dust plume at the beginning of the dust event, show the need for collecting lidar and in situ data and comparing them with the modeled ones as a means of better parameterization of the models in view of increasing their spatial and temporal forecasting accuracy.

Author Contributions

Conceptualization, Z.P., T.D. and A.D.; methodology, Z.P. and T.D.; investigation, Z.P., A.D. and T.D.; data curation, Z.P., T.D., A.D. and L.V.; writing—original draft preparation, Z.P., A.D. and T.D.; writing—review and editing, Z.P. and T.D.; visualization, L.V., Z.P. and T.D.; project administration, T.D. and Z.P.; funding acquisition, T.D. and Z.P. All authors have read and agreed to the published version of the manuscript.

Funding

This research was funded by the Bulgarian Ministry of Education and Science (support for ACTRIS BG, part of the Bulgarian National Roadmap for Research Infrastructure) and by the Bulgarian National Science Fund under grant No. KP-06-N28/10/2018. The financial support is acknowledged for EARLINET in the ACTRIS Research Infrastructure by the European Union’s Horizon 2020 research and innovation programme under grant agreements no. 654109 (ACTRIS-2) and no. 871115 (ACTRIS IMP).

Institutional Review Board Statement

Not applicable.

Informed Consent Statement

Not applicable.

Data Availability Statement

The lidar measurement and analysis data presented in this study are available upon request from the authors. In situ and modeling/forecasting data are publicly available from the corresponding web resources cited in the paper.

Acknowledgments

The authors would like to acknowledge data and images from the NMMB/BSC-Dust model operated by the Barcelona Supercomputing Center, the NCEP Reanalysis images provided by the NOAA/ESRL Physical Sciences Laboratory, Boulder, CO, USA from their website at http://psl.noaa.gov/ (accessed on 15 February 2022), the use of imagery from the NASA Worldview application (https://worldview.earthdata.nasa.gov/, accessed on 17 February 2022), part of the NASA Earth Observing System Data and Information System (EOSDIS), and the NOAA Air Resources Laboratory for the provision of the HYSPLIT transport and dispersion model and READY website used in this publication.

Conflicts of Interest

The authors declare no conflict of interest.

References

  1. Pöschl, U. Atmospheric aerosols: Composition, transformation, climate and health effects. Angew. Chem. Int. Ed. 2005, 44, 7520–7540. [Google Scholar] [CrossRef] [PubMed]
  2. Seinfeld, J.H.; Pandis, S.N. Atmospheric Chemistry and Physics: From Air Pollution to Climate Change, 3rd ed.; Wiley: Hoboken, NJ, USA, 2016. [Google Scholar]
  3. Stocker, T.F.; Qin, D.; Plattner, G.-K.; Tignor, M.; Allen, S.K.; Boschung, J.; Nauels, A.; Xia, Y.; Bex, V.; Midgley, P.M. (Eds.) Intergovernmental Panel on Climate Change. In Climate Change 2013–The Physical Science Basis: Working Group I Contribution to the Fifth Assessment Report of the Intergovernmental Panel on Climate Change; Cambridge University Press: Cambridge, UK; Cambridge, NY, USA, 2013. [Google Scholar]
  4. Twomey, S. Aerosols, clouds and radiation. Atmos. Environ. 1991, 25, 2435–2442. [Google Scholar] [CrossRef]
  5. Haywood, J.; Boucher, O. Estimates of the direct and indirect radiative forcing due to tropospheric aerosols: A review. Rev. Geophys. 2000, 38, 513–543. [Google Scholar] [CrossRef]
  6. Lohmann, U.; Feichter, J. Global indirect aerosol effects: A review. Atmos. Chem. Phys. 2005, 5, 715–737. [Google Scholar] [CrossRef] [Green Version]
  7. Haywood, J. Atmospheric aerosols and their role in climate change. In Climate Change, 3rd ed.; Letcher, T.M., Ed.; Elsevier: Amsterdam, The Netherlands, 2021; Chapter 30; pp. 645–659. [Google Scholar]
  8. Anderson, J.O.; Thundiyil, J.G.; Stolbach, A. Clearing the air: A review of the effects of particulate matter air pollution on human health. J. Med. Toxicol. 2012, 8, 166–175. [Google Scholar] [CrossRef] [Green Version]
  9. Kim, K.-H.; Kabir, E.; Kabir, S. A review on the human health impact of airborne particulate matter. Environ. Int. 2015, 74, 136–143. [Google Scholar] [CrossRef]
  10. Goudie, A.S.; Middleton, N.J. Saharan dust storms: Nature and consequences. Earth-Sci. Rev. 2001, 56, 179–204. [Google Scholar] [CrossRef]
  11. Middleton, N.J. Desert dust hazards: A global review. Aeolian Res. 2017, 24, 53–63. [Google Scholar] [CrossRef]
  12. Choobari, O.A.; Zawar-Reza, P.; Sturman, A. The global distribution of mineral dust and its impacts on the climate system: A review. Atmos. Res. 2014, 138, 152–165. [Google Scholar] [CrossRef]
  13. Schepanski, K. Transport of mineral dust and its impact on climate. Geosciences 2018, 8, 151. [Google Scholar] [CrossRef] [Green Version]
  14. Prospero, J.M.; Ginoux, P.; Torres, O.; Nicholson, S.E.; Gill, T.E. Environmental characterization of global sources of atmospheric soil dust identified with the Nimbus 7 Total Ozone Mapping Spectrometer (TOMS) absorbing aerosol products. Rev. Geophys. 2002, 40, 1002. [Google Scholar] [CrossRef]
  15. Middleton, N.J.; Goudie, A.S. Saharan dust: Sources and trajectories. Trans. Inst. Br. Geogr. 2002, 26, 165–181. [Google Scholar] [CrossRef]
  16. Washington, R.; Todd, M.C.; Middleton, N.J.; Goudie, A.S. Dust-storm source areas determined by the total ozone monitoring spectrometer and surface observations. Ann. Assoc. Am. Geogr. 2003, 93, 297–313. [Google Scholar] [CrossRef]
  17. Tanaka, T.Y.; Chiba, M. A numerical study of the contributions of dust source regions to the global dust budget. Glob. Planet. Chang. 2006, 52, 88–104. [Google Scholar] [CrossRef]
  18. Engelstaedter, S.; Tegen, I.; Washington, R. North African dust emissions and transport. Earth-Sci. Rev. 2006, 79, 73–100. [Google Scholar] [CrossRef]
  19. Schepanski, K.; Tegen, I.; Macke, A. Saharan dust transport and deposition towards the tropical northern Atlantic. Atmos. Chem. Phys. 2009, 9, 1173–1189. [Google Scholar] [CrossRef] [Green Version]
  20. Weinzierl, B.; Ansmann, A.; Prospero, J.M.; Althausen, D.; Benker, N.; Chouza, F.; Dollner, M.; Farrell, D.; Fomba, W.K.; Freudenthaler, V.; et al. The Saharan aerosol long-range transport and aerosol–cloud-interaction experiment: Overview and selected highlights. Bull. Am. Meteorol. Soc. 2017, 98, 1427–1451. [Google Scholar] [CrossRef] [Green Version]
  21. Prospero, J.M.; Lamb, P.J. African droughts and dust transport to the Caribbean: Climate change implications. Science 2003, 302, 1024–1027. [Google Scholar] [CrossRef]
  22. Gkikas, A.; Obiso, V.; Perez Garcia-Pando, C.; Jorba, O.; Hatzianastassiou, N.; Vendrell, L.; Basart, S.; Solomos, S.; Gassó, S.; Baldasano, J.M. Direct radiative effects during intense Mediterranean desert dust outbreaks. Atmos. Chem. Phys. 2018, 18, 8757–8787. [Google Scholar] [CrossRef] [Green Version]
  23. Varga, G. Changing nature of Saharan dust deposition in the Carpathian Basin (Central Europe): 40 years of identified North African dust events (1979–2018). Environ. Int. 2020, 139, 105712. [Google Scholar] [CrossRef]
  24. Israelevich, P.; Ganor, E.; Alpert, P.; Kishcha, P.; Stupp, A. Predominant transport paths of Saharan dust over the Mediterranean Sea to Europe. J. Geophys. Res. 2012, 117, D02205. [Google Scholar] [CrossRef] [Green Version]
  25. Pey, J.; Querol, X.; Alastuey, A.; Forastiere, F.; Stafoggia, M. African dust outbreaks over the Mediterranean Basin during 2001–2011: PM10 concentrations, phenomenology and trends, and its relation with synoptic and mesoscale meteorology. Atmos. Chem. Phys. 2013, 13, 1395–1410. [Google Scholar] [CrossRef] [Green Version]
  26. Varga, G.; Dagsson-Waldhauserová, P.; Gresina, F.; Helgadottir, A. Saharan dust and giant quartz particle transport towards Iceland. Sci. Rep. 2021, 11, 11891. [Google Scholar] [CrossRef]
  27. Kubilay, N.; Nickovic, S.; Moulin, C.; Dulac, F. An illustration of the transport and deposition of mineral dust onto the eastern Mediterranean. Atmos. Environ. 2000, 34, 1293–1303. [Google Scholar] [CrossRef]
  28. Lavaysse, C.; Flamant, C.; Evan, A.; Janicot, S.; Gaetani, M. Recent climatological trend of the Saharan heat low and its impact on the West African climate. Clim. Dyn. 2016, 47, 3479–3498. [Google Scholar] [CrossRef] [Green Version]
  29. Sultan, B.; Janicot, S. The West African monsoon dynamics. Part II: The “preonset” and “onset” of the summer monsoon. J. Clim. 2003, 16, 3407–3427. [Google Scholar] [CrossRef]
  30. Di Iorio, T.; Di Sarra, A.; Sferlazzo, D.M.; Cacciani, M.; Meloni, D.; Monteleone, F.; Fuà, D.; Fiocco, G. Seasonal evolution of the tropospheric aerosol vertical profile in the central Mediterranean and role of desert dust. J. Geophys. Res. 2009, 114, D02201. [Google Scholar] [CrossRef] [Green Version]
  31. Meloni, D.; Di Sarra, A.; Monteleone, F.; Pace, G.; Piacentino, S.; Sferlazzo, D.M. Seasonal transport patterns of intense Saharan dust events at the Mediterranean island of Lampedusa. Atmos. Res. 2008, 88, 134–148. [Google Scholar] [CrossRef]
  32. Papayannis, A.; Amiridis, V.; Mona, L.; Tsaknakis, G.; Balis, D.; Bösenberg, J.; Chaikovski, A.; De Tomasi, F.; Grigorov, I.; Mattis, I.; et al. Systematic lidar observations of Saharan dust over Europe in the frame of EARLINET (2000–2002). J. Geophys. Res. 2008, 113, D10204. [Google Scholar] [CrossRef] [Green Version]
  33. Soupiona, O.; Papayannis, A.; Kokkalis, P.; Mylonaki, M.; Tsaknakis, G.; Argyrouli, A.; Vratolis, S. Long-term systematic profiling of dust aerosol optical properties using the EOLE NTUA lidar system over Athens, Greece (2000–2016). Atmos. Environ. 2018, 183, 165–174. [Google Scholar] [CrossRef]
  34. Fernández, A.J.; Sicard, M.; Costa, M.J.; Guerrero-Rascado, J.L.; Gómez-Amo, J.L.; Molero, F.; Barragán, R.; Basart, S.; Bortoli, D.; Bedoya-Velásquez, A.E.; et al. Extreme, wintertime Saharan dust intrusion in the Iberian Peninsula: Lidar monitoring and evaluation of dust forecast models during the February 2017 event. Atmos. Res. 2019, 228, 223–241. [Google Scholar] [CrossRef]
  35. Oduber, F.; Calvo, A.I.; Blanco-Alegre, C.; Castro, A.; Nunes, T.; Alves, C.; Sorribas, M.; Fernández-González, D.; Vega-Maray, A.; Valencia-Barrera, R.M.; et al. Unusual winter Saharan dust intrusions at Northwest Spain: Air quality, radiative and health impacts. Sci. Total Environ. 2019, 669, 213–228. [Google Scholar] [CrossRef] [PubMed]
  36. Deleva, A.D.; Peshev, Z.Y.; Vulkova, L.A.; Dreischuh, T.N. Lidar study of unusual winter Saharan dust loads above Sofia, Bulgaria: Impacts on the local weather and troposphere. J. Appl. Remote Sens. 2021, 15, 024517. [Google Scholar] [CrossRef]
  37. Barriopedro, D.; García-Herrera, R.; Trigo, R.M. Application of blocking diagnosis methods to general circulation models. Part I: A novel detection scheme. Clim. Dyn. 2010, 35, 1373–1391. [Google Scholar] [CrossRef]
  38. Barriopedro, D.; García-Herrera, R.; Lupo, A.R.; Hernández, E. A Climatology of Northern Hemisphere blocking. J. Clim. 2006, 19, 1042–1063. [Google Scholar] [CrossRef] [Green Version]
  39. Woollings, T.; Barriopedro, D.; Methven, J.; Son, S.-W.; Martius, O.; Harvey, B.; Sillmann, J.; Lupo, A.R.; Seneviratne, S. Blocking and its response to climate change. Curr. Clim. Chang. Rep. 2018, 4, 287–300. [Google Scholar] [CrossRef] [Green Version]
  40. Lupo, A.R. Atmospheric blocking events: A review. Ann. N. Y. Acad. Sci. 2021, 1504, 5–24. [Google Scholar] [CrossRef]
  41. Pérez, C.; Nickovic, S.; Baldasano, J.M.; Sicard, M.; Rocadenbosch, F.; Cachorro, V.E. A long Saharan dust event over the western Mediterranean: Lidar, Sun photometer observations, and regional dust modeling. J. Geophys. Res. 2006, 111, D15214. [Google Scholar] [CrossRef]
  42. The EARLINET Publishing Group 2000–2015. EARLINET Saharan Dust 2000–2015; World Data Center for Climate (WDCC) at DKRZ: Hamburg, Germany, 2018. [Google Scholar]
  43. Yin, Z.; Ansmann, A.; Baars, H.; Seifert, P.; Engelmann, R.; Radenz, M.; Jimenez, C.; Herzog, A.; Ohneiser, K.; Hanbuch, K.; et al. Aerosol measurements with a shipborne Sun–sky–lunar photometer and collocated multiwavelength Raman polarization lidar over the Atlantic Ocean. Atmos. Meas. Tech. 2019, 12, 5685–5698. [Google Scholar] [CrossRef] [Green Version]
  44. Marinou, E.; Amiridis, V.; Binietoglou, I.; Tsikerdekis, A.; Solomos, S.; Proestakis, E.; Konsta, D.; Papagiannopoulos, N.; Tsekeri, A.; Vlastou, G.; et al. Three-dimensional evolution of Saharan dust transport towards Europe based on a 9-year EARLINET-optimized CALIPSO dataset. Atmos. Chem. Phys. 2017, 17, 5893–5919. [Google Scholar] [CrossRef] [Green Version]
  45. Müller, D.; Lee, K.H.; Gasteiger, J.; Tesche, M.; Weinzierl, B.; Kandler, K.; Müller, T.; Toledano, C.; Otto, S.; Althausen, D.; et al. Comparison of optical and microphysical properties of pure Saharan mineral dust observed with AERONET Sun photometer, Raman lidar, and in situ instruments during SAMUM 2006. J. Geophys. Res. 2012, 117, D07211. [Google Scholar] [CrossRef] [Green Version]
  46. Mona, L.; Liu, Z.; Müller, D.; Omar, A.; Papayannis, A.; Pappalardo, G.; Sugimoto, N.; Vaughan, M. Lidar measurements for desert dust characterization: An overview. Adv. Meteorol. 2012, 2012, 356265. [Google Scholar] [CrossRef]
  47. Balis, D.S.; Amiridis, V.; Nickovic, S.; Papayannis, A.; Zerefos, C. Optical properties of Saharan dust layers as detected by a raman lidar at Thessaloniki, Greece. Geophys. Res. Lett. 2004, 31, L13104. [Google Scholar] [CrossRef]
  48. Soupiona, O.; Samaras, S.; Ortiz-Amezcua, P.; Böckmann, C.; Papayannis, A.; Moreira, G.A.; Benavent-Oltra, J.A.; Guerrero-Rascado, J.L.; Bedoya-Velásquez, A.E.; Olmo, F.J.; et al. Retrieval of optical and microphysical properties of transported Saharan dust over Athens and Granada based on multi-wavelength Raman lidar measurements: Study of the mixing processes. Atmos. Environ. 2019, 214, 116824. [Google Scholar] [CrossRef]
  49. Peshev, Z.Y.; Dreischuh, T.N.; Evgenieva, T.T.; Deleva, A.D.; Tonev, D.; Stoyanov, D.V. Lidar observations of long-range transported Saharan dust over Sofia, Bulgaria: A case study of dust mixed with local aerosols. J. Appl. Remote Sens. 2016, 10, 036009. [Google Scholar] [CrossRef]
  50. Deleva, A.D.; Peshev, Z.Y.; Dreischuh, T.N.; Chaikovsky, A.P.; Slesar, A.S.; Fedarenka, A. Lidar observations of Saharan dust loads above Sofia, Bulgaria: Dust layers extending throughout the troposphere (a case study). J. Appl. Remote Sens. 2020, 14, 014504. [Google Scholar] [CrossRef]
  51. Pappalardo, G.; Amodeo, A.; Apituley, A.; Comeron, A.; Freudenthaler, V.; Linné, H.; Ansmann, A.; Bösenberg, J.; D’Amico, G.; Mattis, I.; et al. EARLINET: Towards an advanced sustainable European aerosol lidar network. Atmos. Meas. Tech. 2014, 7, 2389–2409. [Google Scholar] [CrossRef] [Green Version]
  52. Aerosol, Clouds and Trace Gases (ACTRIS) Research Infrastructure. Available online: https://www.actris.eu (accessed on 21 March 2022).
  53. MODIS (Moderate Resolution Imaging Spectroradiometer). Available online: https://modis.gsfc.nasa.gov/ (accessed on 15 March 2021).
  54. Pérez, C.; Haustein, K.; Janjic, Z.; Jorba, O.; Huneeus, N.; Baldasano, J.M.; Black, T.; Basart, S.; Nickovic, S.; Miller, R.L.; et al. An online mineral dust aerosol model for MESO to global scales: Model description, annual simulations and evaluation. Atmos. Chem. Phys. 2011, 11, 13001–13027. [Google Scholar] [CrossRef] [Green Version]
  55. Haustein, K.; Pérez, C.; Baldasano, J.M.; Jorba, O.; Basart, S.; Miller, R.L.; Janjic, Z.; Black, T.; Nickovic, S.; Todd, M.C.; et al. Atmospheric dust modeling from MESO to global scales with the online NMMB/BSC-dust model–Part 2: Experimental campaigns in Northern Africa. Atmos. Chem. Phys. 2012, 12, 2933–2958. [Google Scholar] [CrossRef] [Green Version]
  56. Stein, A.F.; Draxler, R.R.; Rolph, G.D.; Stunder, B.J.B.; Cohen, M.D.; Ngan, F. NOAA’s HYSPLIT Atmospheric Transport and Dispersion Modeling System. Bull. Am. Meteorol. Soc. 2015, 96, 2059–2077. [Google Scholar] [CrossRef]
  57. Rolph, G.; Stein, A.; Stunder, B. Real-time environmental applications and display system: READY. Environ. Model. Softw. 2017, 95, 210–228. [Google Scholar] [CrossRef]
  58. Ajtai, N.; Stefanie, H.; Mereuta, A.; Radovici, A.; Botezan, C. Multi-sensor observation of a Saharan dust outbreak over Transylvania, Romania in April 2019. Atmosphere 2020, 11, 364. [Google Scholar] [CrossRef] [Green Version]
  59. Calidonna, C.R.; Avolio, E.; Gullì, D.; Ammoscato, I.; De Pino, M.; Donateo, A.; Lo Feudo, T. Five years of dust episodes at the Southern Italy GAW Regional Coastal Mediterranean Observatory: Multisensors and modeling analysis. Atmosphere 2020, 11, 456. [Google Scholar] [CrossRef]
  60. Peshev, Z.; Deleva, A.; Vulkova, L.; Dreischuh, T. Lidar observations of massive Saharan dust intrusion above Sofia, Bulgaria, in April 2019. J. Phys. Conf. Ser. 2021, 1859, 012031. [Google Scholar] [CrossRef]
  61. National Statistical Institute, Republic of Bulgaria. Population by Towns and Sex. Available online: https://nsi.bg/en/content/2981/population-towns-and-sex (accessed on 15 March 2022).
  62. National Oceanic and Atmospheric Administration, National Centers for Environmental Information. The World Meteorological Organization (WMO) Climate Normals. Available online: https://www.ncei.noaa.gov/products/wmo-climate-normals (accessed on 15 March 2022).
  63. University of Wyoming. Upperair Air Data. Available online: http://weather.uwyo.edu/upperair/sounding.html (accessed on 1 February 2022).
  64. Executive Environment Agency (ExEA), Ministry of Environment and Water—Bulgaria. National System for Environmental Monitoring. Available online: http://www.eea.government.bg/kav/ (accessed on 15 March 2020).
  65. Klett, D. Stable analytical inversion solution for processing lidar returns. Appl. Opt. 1981, 20, 211–220. [Google Scholar] [CrossRef] [PubMed] [Green Version]
  66. Fernald, G. Analysis of atmospheric lidar observations: Some comments. Appl. Opt. 1984, 23, 652–653. [Google Scholar] [CrossRef]
  67. Mona, L.; Amodeo, A.; Pandolfi, M.; Pappalardo, G. Saharan dust intrusions in the Mediterranean area: Three years of Raman lidar measurements. J. Geophys. Res. 2006, 111, D16203. [Google Scholar] [CrossRef] [Green Version]
  68. Tesche, M.; Gross, S.; Ansmann, A.; Müller, D.; Althause, D.; Freudenthaler, V.; Esselborn, M. Profiling of Saharan dust and biomass-burning smoke with multiwavelength polarization Raman lidar at Cape Verde. Tellus B 2011, 63, 649–676. [Google Scholar] [CrossRef] [Green Version]
  69. Nicolae, D.; Nemuc, A.; Müller, D.; Talianu, C.; Vasilescu, J.; Belegante, L.; Kolgotin, A. Characterization of fresh and aged biomass burning events using multiwavelength Raman lidar and mass spectrometry. J. Geophys. Res. 2013, 118, 2956–2965. [Google Scholar] [CrossRef]
  70. Giannakaki, E.; van Zyl, P.G.; Müller, D.; Balis, D.; Komppula, M. Optical and microphysical characterization of aerosol layers over South Africa by means of multi-wavelength depolarization and Raman lidar measurements. Atmos. Chem. Phys. 2016, 16, 8109–8123. [Google Scholar] [CrossRef] [Green Version]
  71. Veselovskii, I.; Hu, Q.; Goloub, P.; Podvin, T.; Korenskiy, M.; Derimian, Y.; Legrand, M.; Castellanos, P. Variability in lidar-derived particle properties over West Africa due to changes in absorption: Towards an understanding. Atmos. Chem. Phys. 2020, 20, 6563–6581. [Google Scholar] [CrossRef]
  72. United States Committee on Extension to the Standard Atmosphere. U.S. Standard Atmosphere 1976; U.S. Government Printing Office: Washington, DC, USA, 1976. [Google Scholar]
  73. Freudenthaler, V. Lidar Rayleigh-Fit Criteria. In Proceedings of the EARLINET-ASOS 7th Workshop, Madrid, Spain, 9–11 February 2009; Available online: https://epub.ub.uni-muenchen.de/12970/ (accessed on 23 March 2022).
  74. Freudenthaler, V.; Linné, H.; Chaikovski, A.; Rabus, D.; Groß, S. EARLINET LiDAR quality assurance tools. Atmos. Meas. Tech. Discuss. 2018, 1–35. [Google Scholar] [CrossRef] [Green Version]
  75. Berjón, A.; Barreto, A.; Hernández, Y.; Yela, M.; Toledano, C.; Cuevas, E. A 10-year characterization of the Saharan Air Layer lidar ratio in the subtropical North Atlantic. Atmos. Chem. Phys. 2019, 19, 6331–6349. [Google Scholar] [CrossRef] [Green Version]
  76. Del Guasta, M. Daily cycles in urban aerosols observed in Florence (Italy) by means of an automatic 532–1064 nm LIDAR. Atmos. Environ. 2002, 36, 2853–2865. [Google Scholar] [CrossRef]
  77. Valenzuela, A.; Olmo, F.J.; Lyamani, H.; Antón, M.; Titos, G.; Cazorla, A.; Alados-Arboledas, L. Aerosol scattering and absorption Ångström exponents as indicators of dust and dust-free days over Granada (Spain). Atmos. Res. 2015, 154, 1–13. [Google Scholar] [CrossRef] [Green Version]
  78. Janjic, Z. A Unified Model Approach from Meso to Global Scales. Geophys. Res. Abstr. 2005, 7, 05582. Available online: http://meetings.copernicus.org/www.cosis.net/abstracts/EGU05/05582/EGU05-J-05582.pdf (accessed on 1 February 2022).
  79. Janjic, Z.; Black, T. An ESMF Unified Model for a Broad Range of Spatial and Temporal Scales. Geophys. Res. Abstr. 2007, 9, 05025. Available online: http://meetings.copernicus.org/www.cosis.net/abstracts/EGU2007/05025/EGU2007-J-05025.pdf (accessed on 1 February 2022).
  80. Gama, C.; Tchepel, O.; Baldasano, J.M.; Basart, S.; Ferreira, J.; Pio, C.; Cardoso, J.; Borrego, C. Seasonal patterns of Saharan dust over Cape Verde—A combined approach using observations and modelling. Tellus B Chem. Phys. Meteorol. 2015, 67, 24410. [Google Scholar] [CrossRef] [Green Version]
  81. Kaufman, Y.J.; Koren, I.; Remer, L.A.; Tanré, D.; Ginoux, P.; Fan, S. Dust transport and deposition observed from the Terra-Moderate Resolution Imaging Spectroradiometer (MODIS) spacecraft over the Atlantic Ocean. J. Geophys. Res. 2005, 110, D10S12. [Google Scholar] [CrossRef] [Green Version]
  82. Kaskaoutis, D.G.; Kambezidis, H.D.; Nastos, P.T.; Kosmopoulos, P.G. Study on an intense dust storm over Greece. Atmos. Environ. 2008, 42, 6884–6896. [Google Scholar] [CrossRef]
  83. Kalnay, E.; Kanamitsu, M.; Kistler, R.; Collins, W.; Deaven, D.; Gandin, L.; Iredell, M.; Saha, S.; White, G.; Woollen, J.; et al. The NCEP/NCAR 40-year reanalysis project. Bull. Am. Meteorol. Soc. 1996, 77, 437–471. [Google Scholar] [CrossRef] [Green Version]
  84. Kistler, R.; Kalnay, E.; Collins, W.; Saha, S.; White, G.; Woollen, J.; Chelliah, M.; Ebisuzaki, W.; Kanamitsu, M.; Kousky, V.; et al. The NCEP–NCAR 50-year reanalysis: Monthly means CD-ROM and documentation. Bull. Am. Meteorol. Soc. 2001, 82, 247–268. [Google Scholar] [CrossRef]
  85. NOAA/ESRL Physical Sciences Laboratory, Boulder Colorado, Daily Mean Composites Website. Available online: https://psl.noaa.gov/data/composites/day (accessed on 21 February 2022).
  86. Basart, S.; Vendrell, L.; Baldasano, J.M. High-resolution dust modelling over complex terrains in West Asia. Aeolian Res. 2016, 23, 37–50. [Google Scholar] [CrossRef]
  87. Binietoglou, I.; Basart, S.; Alados-Arboledas, L.; Amiridis, V.; Argyrouli, A.; Baars, H.; Baldasano, J.M.; Balis, D.; Belegante, L.; Bravo-Aranda, J.A.; et al. A methodology for investigating dust model performance using synergistic EARLINET/AERONET dust concentration retrievals. Atmos. Meas. Tech. 2015, 8, 3577–3600. [Google Scholar] [CrossRef] [Green Version]
  88. Karami, S.; Kaskaoutis, D.G.; Kashani, S.S.; Rahnama, M.; Rashki, A. Evaluation of nine operational models in forecasting different types of synoptic dust events in the Middle East. Geosciences 2021, 11, 458. [Google Scholar] [CrossRef]
  89. Shu, S.; Wu, L. Analysis of the influence of Saharan air layer on tropical cyclone intensity using AIRS/Aqua data. Geophys. Res. Lett. 2009, 36, L09809. [Google Scholar] [CrossRef] [Green Version]
  90. Wu, L. Impact of Saharan air layer on hurricane peak intensity. Geophys. Res. Lett. 2007, 34, L09802. [Google Scholar] [CrossRef] [Green Version]
  91. Dunion, J.P.; Velden, C.S. The impact of the Saharan air layer on Atlantic tropical cyclone activity. Bull. Am. Meteorol. Soc. 2004, 85, 353–366. [Google Scholar] [CrossRef] [Green Version]
  92. Salvador, P.; Artíñano, B.; Molero, F.; Viana, M.; Pey, J.; Alastuey, A.; Querol, X. African dust contribution to ambient aerosol levels across central Spain: Characterization of lo ng-range transport episodes of desert dust. Atmos. Res. 2013, 127, 117–129. [Google Scholar] [CrossRef]
  93. Salvador, P.; Pey, J.; Pérez, N.; Querol, X.; Artíñano, B. Increasing atmospheric dust transport towards the western Mediterranean over 1948–2020. NPJ Clim. Atmos. Sci. 2022, 5, 34. [Google Scholar] [CrossRef]
  94. European Environment Agency (EEA). Download of Air Quality Data. Available online: https://discomap.eea.europa.eu/map/fme/AirQualityExport.htm (accessed on 15 July 2020).
  95. Yang, L.; Hu, Z.; Huang, Z.; Wang, L.; Han, W.; Yang, Y.; Tao, H.; Wang, J. Detection of a dust storm in 2020 by a multi-observation platform over the Northwest China. Remote Sens. 2021, 13, 1056. [Google Scholar] [CrossRef]
  96. Bevington, P.R.; Robinson, D.K. Data Reduction and Error Analysis for the Physical Sciences, 3rd ed.; McGraw–Hill: New York, NY, USA, 2003. [Google Scholar]
Figure 1. Geographical situation of the area of measurements: topographic maps of (a) Europe (source: https://commons.wikimedia.org/wiki/File:Europe_topography_map_en.png, accessed on 1 February 2022), (b) Bulgaria (source: https://commons.wikimedia.org/wiki/File:Bulgaria-geographic_map-en.svg, accessed on 1 February 2022), and (c) Sofia (Google maps image). The positions are indicated of Sofia, the lidar station, and the Kopitoto AMS and Mladost AMS.
Atmosphere 13 00981 g001
Figure 2. MODIS-Aqua true-color images of the dust-cloud plume spread for (a) 22 April 2019, (b) 24 April 2019, and (c) 26 April 2019. The blue star indicates the position of Sofia station. The images are downloaded from the NASA Worldview website (https://worldview.earthdata.nasa.gov/, accessed on 17 February 2022) by using the NASA Worldview Snapshots application.
Atmosphere 13 00981 g002
Figure 3. Global-scale NMMB/BSC-Dust model results for the dust load and the 700 hPa wind field at 12 h forecast for 12 UTC on (a) 22 April 2019, (b) 24 April 2019, and (c) 26 April 2019.
Atmosphere 13 00981 g003
Figure 4. Synoptic meteorological situation of the Saharan dust event studied: NCEP/NCAR reanalysis composite mean of 700 mb geopotential height (shaded, units in m) and horizontal wind vectors (black arrows, units in m/s), for the period 17–27 April 2019.
Atmosphere 13 00981 g004
Figure 5. NMMB/BSC-Dust forecast Saharan dust concentration profiles above Sofia and regional maps (insets) of dust load and the 700 hPa wind field, for the period 22–28 April 2019. Sofia position is indicated by a red circle.
Atmosphere 13 00981 g005
Figure 6. Meteorological radiosonde diagrams for the days of lidar measurements: (a) 22 April 2019, (b) 24 April 2019, (c) 25 April 2019, and (d) 26 April 2019; T—temperature; DP—dew point; RH—relative humidity.
Atmosphere 13 00981 g006
Figure 7. Color-coded time series of range-corrected lidar signals measured at 1064 nm on (a) 22 April 2019, (b) 24 April 2019, (c) 25 April 2019, and (d) 26 April 2019.
Atmosphere 13 00981 g007
Figure 8. HYSPLIT backward trajectories ending above Sofia at heights of the observed aerosol/dust layers, during or close to the lidar measurements conducted on (a) 22 April 2019, (b) 23 April 2019, (c,d) 24 April 2019, (e) 25 April 2019, and (f) 26 April 2019. The red, blue, and green colored trajectories refer to selected end-point heights (in ascending order) denoted next to the black star symbols in the bottom sections of panels (af).
Atmosphere 13 00981 g008
Figure 9. Time-averaged vertical profiles of the aerosol BSC at 532 nm and 1064 nm (left column) and corresponding BAE (middle column), together with frequency-count BAE distributions (right column) resulting from lidar measurements performed on (ac) 22 April 2019, (df) 24 April 2019, and (gi) 26 April 2019.
Atmosphere 13 00981 g009
Figure 10. Time-averaged vertical profile of the aerosol BSC as retrieved from the daytime lidar measurements performed on 25 April 2019.
Atmosphere 13 00981 g010
Figure 11. Hourly mean values of the PM10 mass concentrations measured by the (a) Kopitoto AMS (BG0070A) and (b) Mladost AMS (BG0079A) in the period 21–27 April 2019. The vertical green bars indicate the time intervals of the lidar measurements.
Atmosphere 13 00981 g011
Figure 12. Vertical profiles of the aerosol/dust mass concentration determined by the combined use of data from lidar and in situ measurements.
Atmosphere 13 00981 g012
Table 1. Calibration data for converting aerosol backscatter to mass-concentration.
Date
in 2019
BSC (532 nm)
(Mm−1sr−1)
BSC (1064 nm)
(Mm−1 sr−1)
PM10(µg m−3)Kc (532 nm)
(g sr m−2)
Kc (1064 nm)
(g sr m−2)
Columnar MC
(mg m−2)
22 April1.30 ± 0.240.87 ± 0.1517.75813.71 ± 2.5820.53 ± 3.5847.95 ± 0.04
24 April0.93 ± 0.530.58 ± 0.1940.86943.99 ± 25.1970.59 ± 22.68529.33 ± 0.68
25 April 1.59 ± 0.5960.578 38.05 ± 14.05219.26 ± 0.40
26 April2.03 ± 0.471.37 ± 0.3273.65136.35 ± 8.4253.60 ± 12.48249.67 ± 0.28
Publisher’s Note: MDPI stays neutral with regard to jurisdictional claims in published maps and institutional affiliations.

