Article

An Analysis of the Microstructure of the Melting Layer of a Precipitating Stratiform Cloud at the Dissipation Stage

1
Beijing Weather Modification Center, Beijing 100089, China
2
Institute of Atmospheric Physics, Chinese Academy of Sciences, Beijing 100029, China
3
College of Earth and Planetary Sciences, University of Chinese Academy of Sciences, Beijing 100049, China
4
China Meteorological Administration (CMA) Weather Modification Centre (WMC), Beijing 100081, China
5
Wuqing Meteorological Observatory of Tianjin, Tianjin 301700, China
*
Authors to whom correspondence should be addressed.
Atmosphere 2022, 13(2), 284; https://doi.org/10.3390/atmos13020284
Submission received: 27 December 2021 / Revised: 2 February 2022 / Accepted: 4 February 2022 / Published: 8 February 2022
(This article belongs to the Section Meteorology)

Abstract

:
In this study, we investigated the macro- and microstructures of layered precipitation clouds in spring in Jilin Province, China. The premise of the campaign was to observe cloud particles in the melting layer (ML). The weather was developed under the influence of the Mongolia cyclone, which brought a large range of precipitation to the northeast. Combining the Droplet Measurement Technology (DMT) and Particle Measuring Systems (PMS) data, small particles accounted for the majority of all particles at each level above and below the ML. In our observations, both ice crystals (50–300 μm) and snowflakes (>300 μm) had two peaks between −5 and −2 °C. The high concentration of ice crystals at a temperature of −2.65 °C (4865 m) attained a maximum value of 287 L−1 and snowflakes with 47 L−1, which was similar to the previous studies. The Hallett–Mossop ice multiplication process operated most effectively at the temperature of −5 °C in this study. Even at the cloud dissipation stage, new droplets were still generated between −5 and −6 °C, providing abundant liquid water content (LWC) for the upper cloud. Although irregulars were observed, needles and spheres dominated in the observed cloud region of low LWC (<0.1 g m−3) at temperatures of −6 to −3 °C. These cloud conditions fit into the Hallett–Mossop criteria.

1. Introduction

Regarding precipitation clouds, the vertical cloud structure reflects the dynamic and thermal structural characteristics and microphysical characteristics of precipitation cloud clusters [1,2,3,4]. Many observations and analyses have revealed that the structure of stratiform clouds and the precipitation process are complicated, related not only to the concentration of ice crystals in clouds, cloud thickness, and supercooled water content, but also to the characteristics of the warm layer and the microphysical and dynamic processes in clouds [5,6,7,8,9]. In situ aircraft measurements of these clouds enable us to better understand cloud microphysics [10,11,12,13,14,15]. Ice crystal habits in the melting layer (ML), where snow melts to rain, is central to understanding the formation and growth processes of particles in the clouds.
To better understand the characteristics of stratiform cloud precipitation, we must consider the detailed microphysical processes and properties of the melting layer (ML) such as the continuous growth of aggregates via the agglomeration of small particles, the fragmentation of these aggregates, and the effect on particle melting, which have not been resolved [16]. Melting is a very important process in cooling air, which generates a downdraft. Changing the density and temperature of ice particles affects the falling speed, particle size distribution (PSD), and mass distribution of these particles. Most current research on the upper and lower regions of the ML has relied on ground-based cloud radar measurements [17,18,19]. Above the ML, in situ images and triple-frequency radar signatures both indicated the presence of moderately rimed aggregates [18]. Heymsfield et al. suggested that the radar-bright band was due to these relatively few, very large aggregates that survive to warmer temperatures [19,20]. Willis and Heymsfield concluded that most of the ice mass melted, and thus most of the cooling of air occurred in a thin layer above the location of the radar-bright band [20].
In previous studies, the ice crystals in the ML were usually assumed to be ice crystal particles of a specific shape. The melting process of particles was capable of modulating the thermal structure of the ML through the exchange of latent heat with the environment [21], and as a result, may change the precipitation dynamics [9,22]. Carlin and Ryzhkov [21] found that, in addition to riming, concurrent changes in aggregation and precipitation intensity and the associated cooling may plausibly cause the observed sagging bright band signatures. ML properties were modified by the ambient environment, and microphysical processes taking place in the ML [23]. Such melting effects ultimately lead to a decrease in particle size, the consequent decrease in particle concentration, and a signal reduction below the radar-bright band [24]. Heymsfield et al. [25] found that if the relative humidity was too low, the particles will sublimate completely as they fall into the melting layer, but snow pellets survive to even warmer temperatures. The growth process of particles could be inferred from the melting characteristics of ice particles [26,27].
Previous studies have shown that the ice crystals’ habits were dependent on the cloud temperature [28,29,30]. Melting proceeded from the smallest to the largest particles, beginning between +0.5 and +1 °C and ending at about +2 °C [16]. Hou et al. [12] found that ice particle habits were characterized by dendrites at −1 °C, needles at −3 °C, and again, dendrites and irregulars between −6 and −9 °C with few spheres coexisting. A mixture of several ice crystal’ habits was identified at temperatures between 0 and −16 °C in all of the clouds studied [15]. The rimed ice particles and needles coexisted at temperatures between −3 and −5 °C in the embedded convective region [13]. Ice splinters produced during riming could account for the relatively high concentrations of ice particles in clouds that encompass temperatures between −2.5 and −8 °C [9]. The Hallett–Mossop process and fragmentation of freezing drops cannot fully explain the observed high ice concentration in shallow stratiform clouds without significant riming occurring [31].
In this study, we investigated the macro- and microstructures of layered precipitation clouds in spring in Jilin Province, China. With the use of comprehensive detection data of the stratiform cloud system on 29 June 2012, the characteristics of cloud particles measured during aircraft detection, the corresponding condensation mechanism and the microphysical process and properties of the ML were analyzed in detail. The rest of this paper is organized as follows. In Section 2, the case data are described and presented. Details on the flight experimental design and setup are provided in Section 3. In Section 4, the in situ aircraft measurements are described, the case results are examined, and a comparison of these results to the measured data is presented. Finally, a summary and our conclusions are presented in Section 5.

2. Data Description

Two Y-12 aircrafts, provided by the Baicheng and Tongliao Weather Modification Offices, individually equipped with in situ cloud microphysical probes manufactured by Particle Measuring Systems (PMS) and Droplet Measurement Technology (DMT). The cooperative exploration flight experiment included vertical and horizontal measurements at different precipitation stages and levels in the target area. The flight features including the beginning and end times and the airborne detection instruments are listed in Table 1. The project consisted of two instrumented aircraft making two short flights through the cloud.
The Tongliao aircraft was instrumented with a cloud and aerosol spectrometer (CAS) with a size range from 0.61 to 50 μm, a precipitation imaging probe (PIP) with a size range from 100 to 6200 μm, and a 2D cloud imaging probe (CIP) with a size range from 25 to 1550 μm. The Baicheng aircraft was equipped with a forward scattering spectrometer probe (FSSP-100) with a size range from 0.5 to 47 μm, an OAP-2D-P (2D-P) with a size range from 100 to 6400 μm, and an OAP-2D-C (2D-C) with a size range from 25 to 800 μm. The Tongliao aircraft was equipped with a condensation nuclei counter (CCN) with a size range from 0.5 to 10 μm. In addition to the above probes, the aircraft were equipped with an Aircraft Integrated Meteorological Measurement System (AIMMS-20, Aventech Research Inc., Ontario, Canada) and a liquid water content−100 (LWC-100) instrument.

3. Flight Experimental Design

The two aircraft took off from Baicheng Airport to observe the same stratiform cloud precipitation system. A very rigorous experimental design was established to analyze the precipitation process of stratiform clouds. The experiment mainly focused on the vertical distribution of the precipitation microstructure. To ensure representative observation results, sixteen horizontal flight trajectories associated with precipitating clouds over Baicheng were selected in the study.
The observation area of this experiment was mainly in Baicheng. Baicheng is inland, which located at the northernmost end of Jilin Province, connected to Inner Mongolia and Heilongjiang. It belongs to the semi-arid monsoon climate area of the middle temperate zone. On 29 June 2012, the two aircraft carried out two detection campaigns of the cloud system including thirty-seven horizontal flight legs (Figure 1 and Figure 2). All flight legs targeting the same cloud case were executed in the morning, except that they occurred at different horizontal levels. This study selected sixteen horizontal flight legs above 3.0 km and below 6.0 km during aircraft ascent and mainly studied the PSDs near the height of the ML. The corresponding horizontal flight information is listed in Table 2.
The stratiform cloud precipitation process was developed under the influence of a Mongolia cyclone, which caused large-scale precipitation in northeast China. At the mature precipitation stage, there was a clear bright band, and cloud development occurred relatively vigorously. Altostratus (As), altocumulus (Ac), and nimbostratus (Ns) were the main cloud systems, accompanied by low-level fractonimbus clouds. The Ns base occurred at approximately 1.0 km; the top was not higher than 4.0 km (Figure 2). There were fractonimbus clouds below the Ns cloud system, which were thicker during the development of the cloud system. The bright band of the radar echo was observed at 06:22, after which the cloud system gradually weakened. During the aircraft flights, the main cloud system had already reached the late stage of precipitation, and the bright band of the radar echo gradually disappeared.

4. In Situ Aircraft Measurements

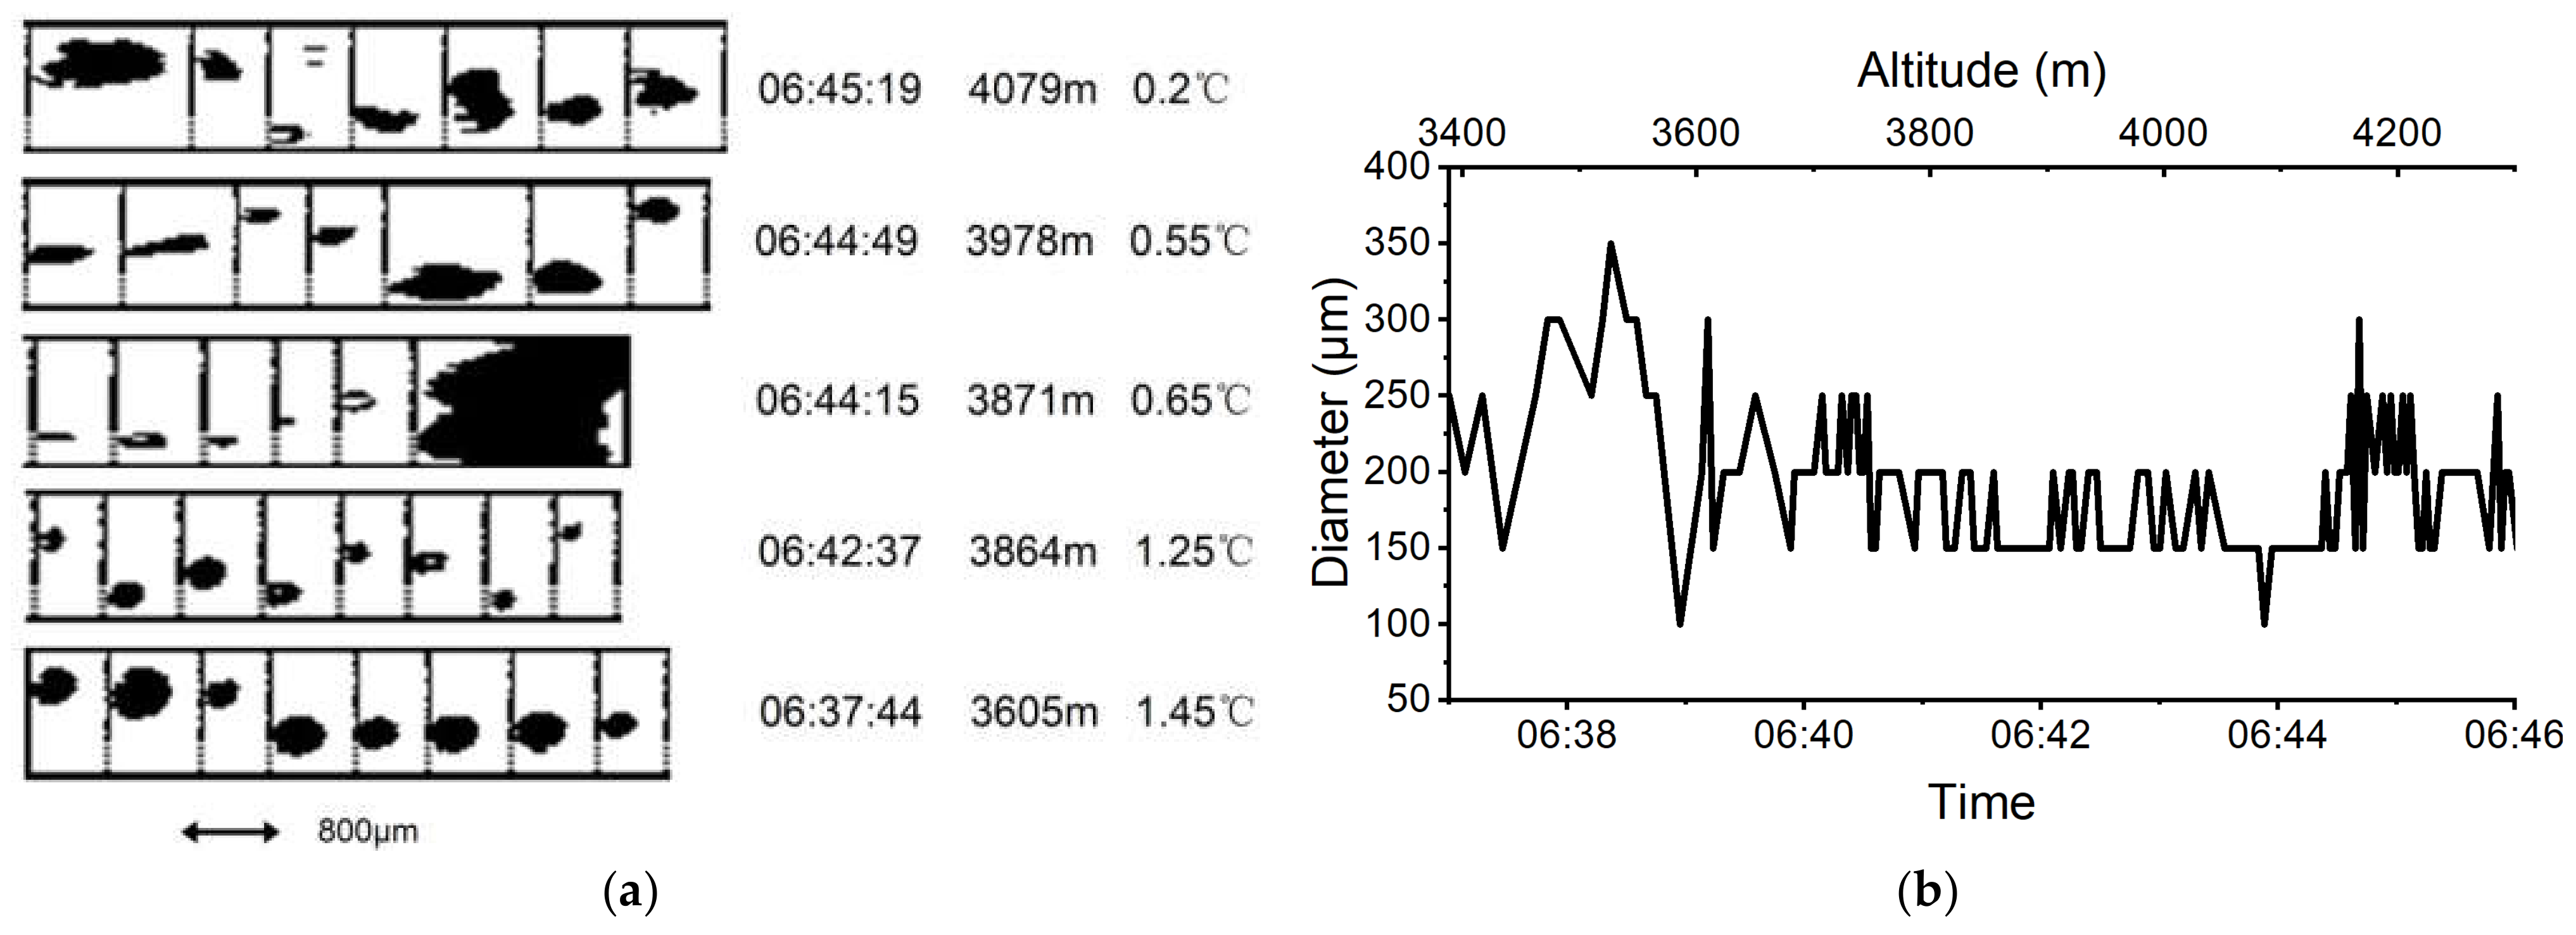
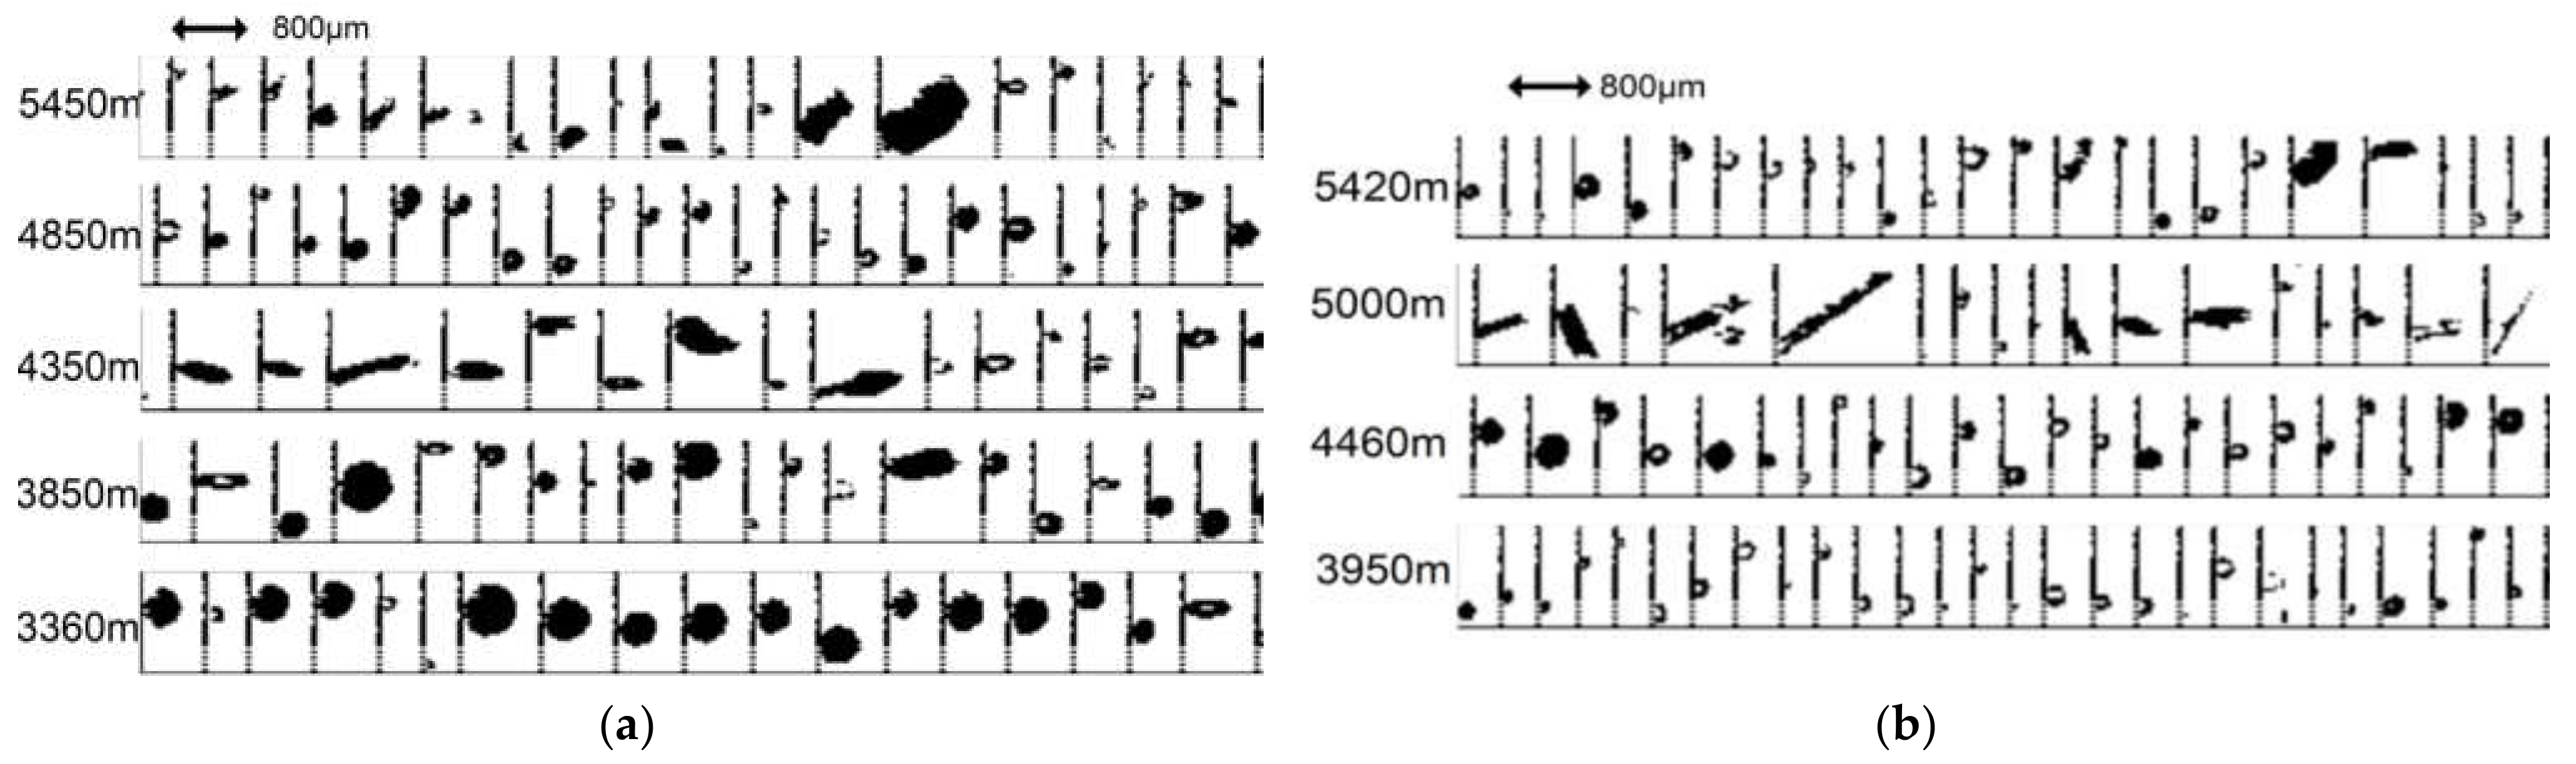
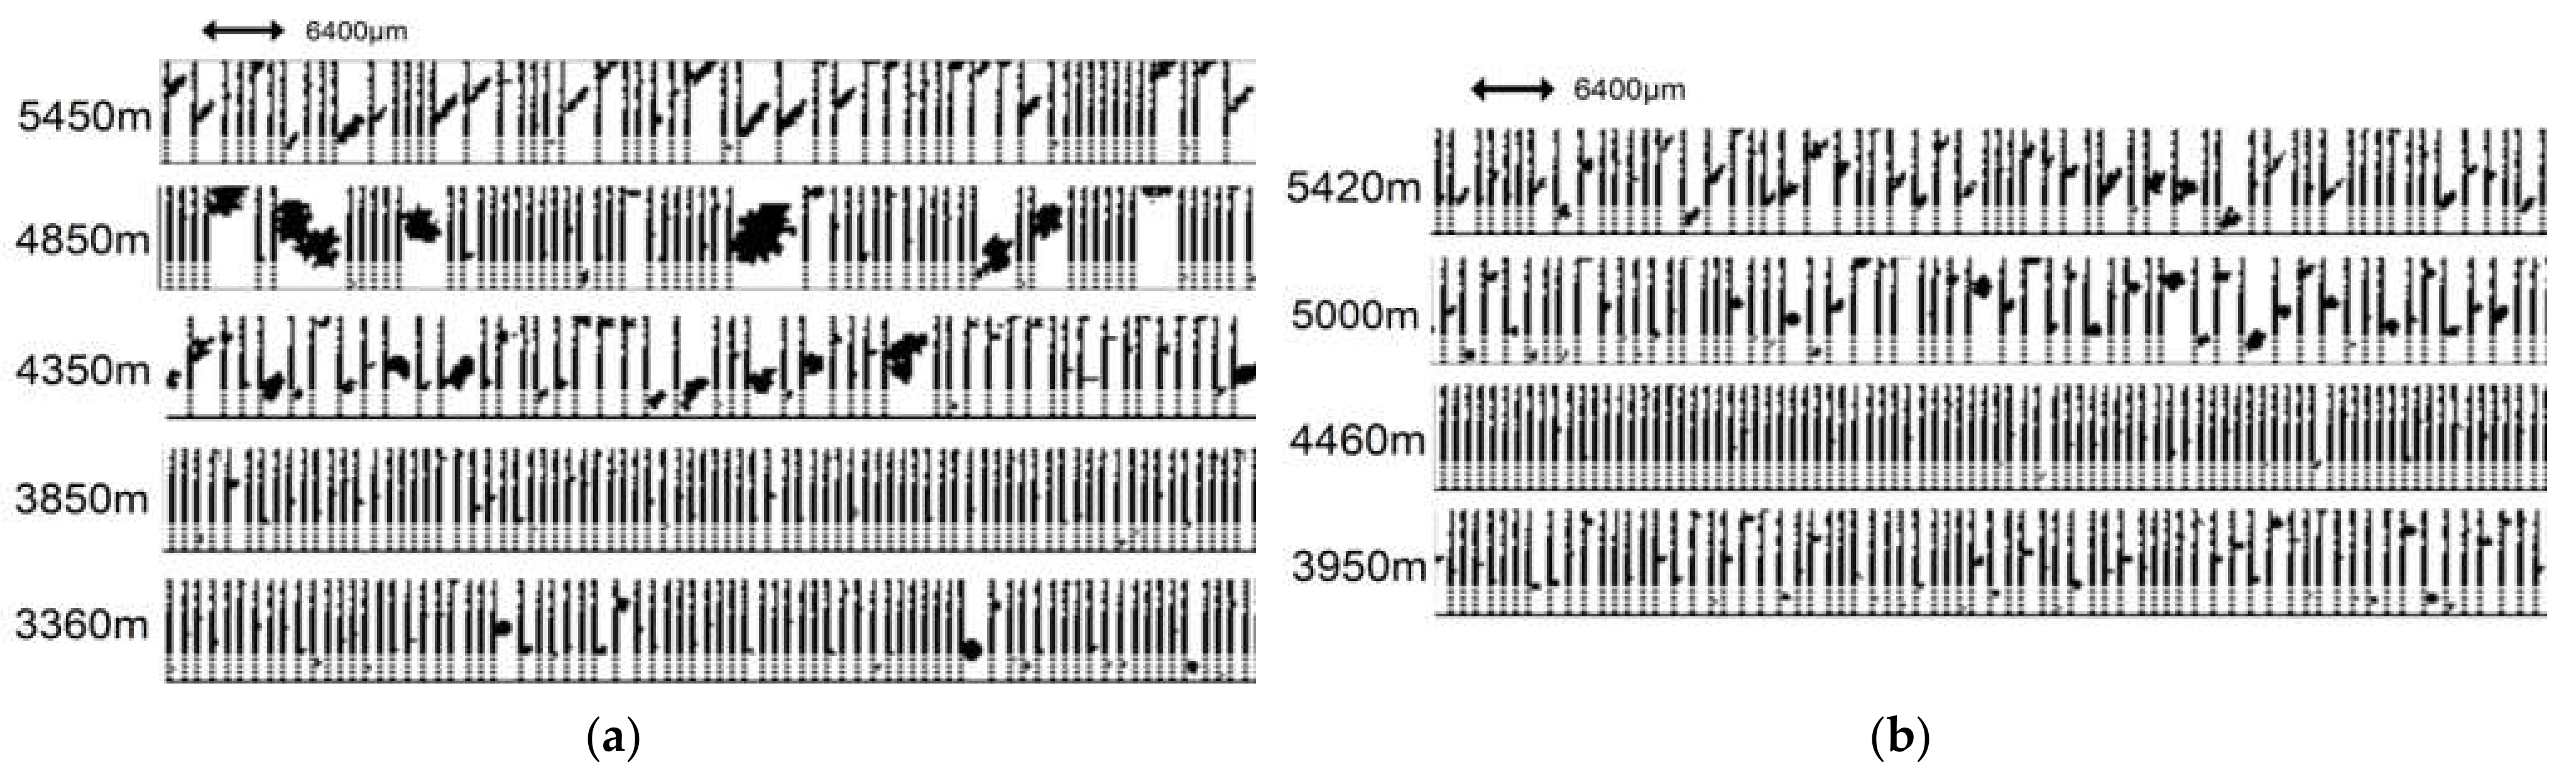
4.1. Vertical Variation in the Particle Habits

According to the first flight records, precipitation reached the ground when the Tongliao aircraft took off at 06:05. The plane entered the cloud system, and the height of the cloud base occurred at approximately 1000 m, and the Ns cloud top occurred at approximately 3583 m. The aircraft entered the upper layer of the cloud system at 3900 m, in which Ac and As clouds existed. The CAS and FSSP probe detected aerosols and cloud droplets below the 0 °C layer, while above the 0 °C layer, ice crystals and droplets coexisted.
Figure 3 shows the vertical distribution of cloud droplets measured by the CAS and FSSP. The particle concentration, diameter, and LWC measured by the CAS were less than 1 cm−3, 10.88 μm, and 0.0018 g m−3 separately from temperatures from −3 to −2 °C. There was a LWC value of 0 g m−3 between −2 and 1.4 °C, indicating that the aircraft was outside the cloud. However, the maximum cloud droplet concentration measured by the FSSP in the layer with a temperature of −0.55 °C was 65.5 cm−3. In the 0 °C layer, the maximum average cloud droplet diameter reached 13.5 μm. The maximum value of LWC in the clouds was lower than 0.028 g m−3. The FSSP and CAS probes detected that the cloud particle concentration revealed a multipeak distribution. Sampling strategy and limitations exist in aircraft observation and it is difficult to assess how the properties of a cloud change in the vertical direction from data averaged for different levels [32,33]. The concentration number, average diameter, and LWC of the same cloud system varied greatly at different locations, and the difference was similar to that of two precipitating stratiform cloud systems in Hou et al. [12]. The cloud detected by DMT had a two-layer structure with a cloud-free area in the middle, while the cloud systems detected by PMS were continuous.
During the FSSP SF (Figure 4), the cloud droplet concentration distribution was larger than that during the first flight from the −6 to −5 °C layer and −2 to −3 °C layer (as shown in Figure 4a). The diameter seems to have discrete intervals for FSSP, which is not physical and comes from instrument limitations or program bias (as shown in Figure 3b and Figure 4b). In the −6 to −4.5 °C layers, the LWC was high with a maximum value of 0.025 g m−3. Even at the cloud dissipation stage, new droplets were still generated between −5 and −6 °C, providing abundant LWC for the upper cloud. This was consistent with Hou et al. [13], in which the peak LWC was generally less than 0.1 g m−3 was observed from −3 to −6 °C cell in the stratiform regions. However, LWC was much smaller in our case.
Measurements of concentrations in many cases exhibited large uncertainties (Figure 3 and Figure 4). In comparison, CAS was more discrete than FSSP, so the FSSP data were more reliable. The profiles of the total concentration, average diameter, and LWC as a function of temperature in the ML were summarized. Within the critical temperature range from 0 to +1 °C, the uncertainty in the observations was larger than any trend in this small temperature range. For ice particles, there was no obvious increase in total concentration and average diameter in the ML with the FSSP probe. Ice particles melted into raindrops as the temperature increased. Moreover, the fall speed of the raindrops was higher than that of the ice particles. Consequently, the total concentration of ice particles decreased. However, the results in ML by the CAS probe were quite different. In contrast to the results by the FSSP probe, total concentration, average diameter, and LWC measured by the CAS probe were all increased in ML. The falling and melting of the large upper ice and snow crystal particles is one plausible explanation.

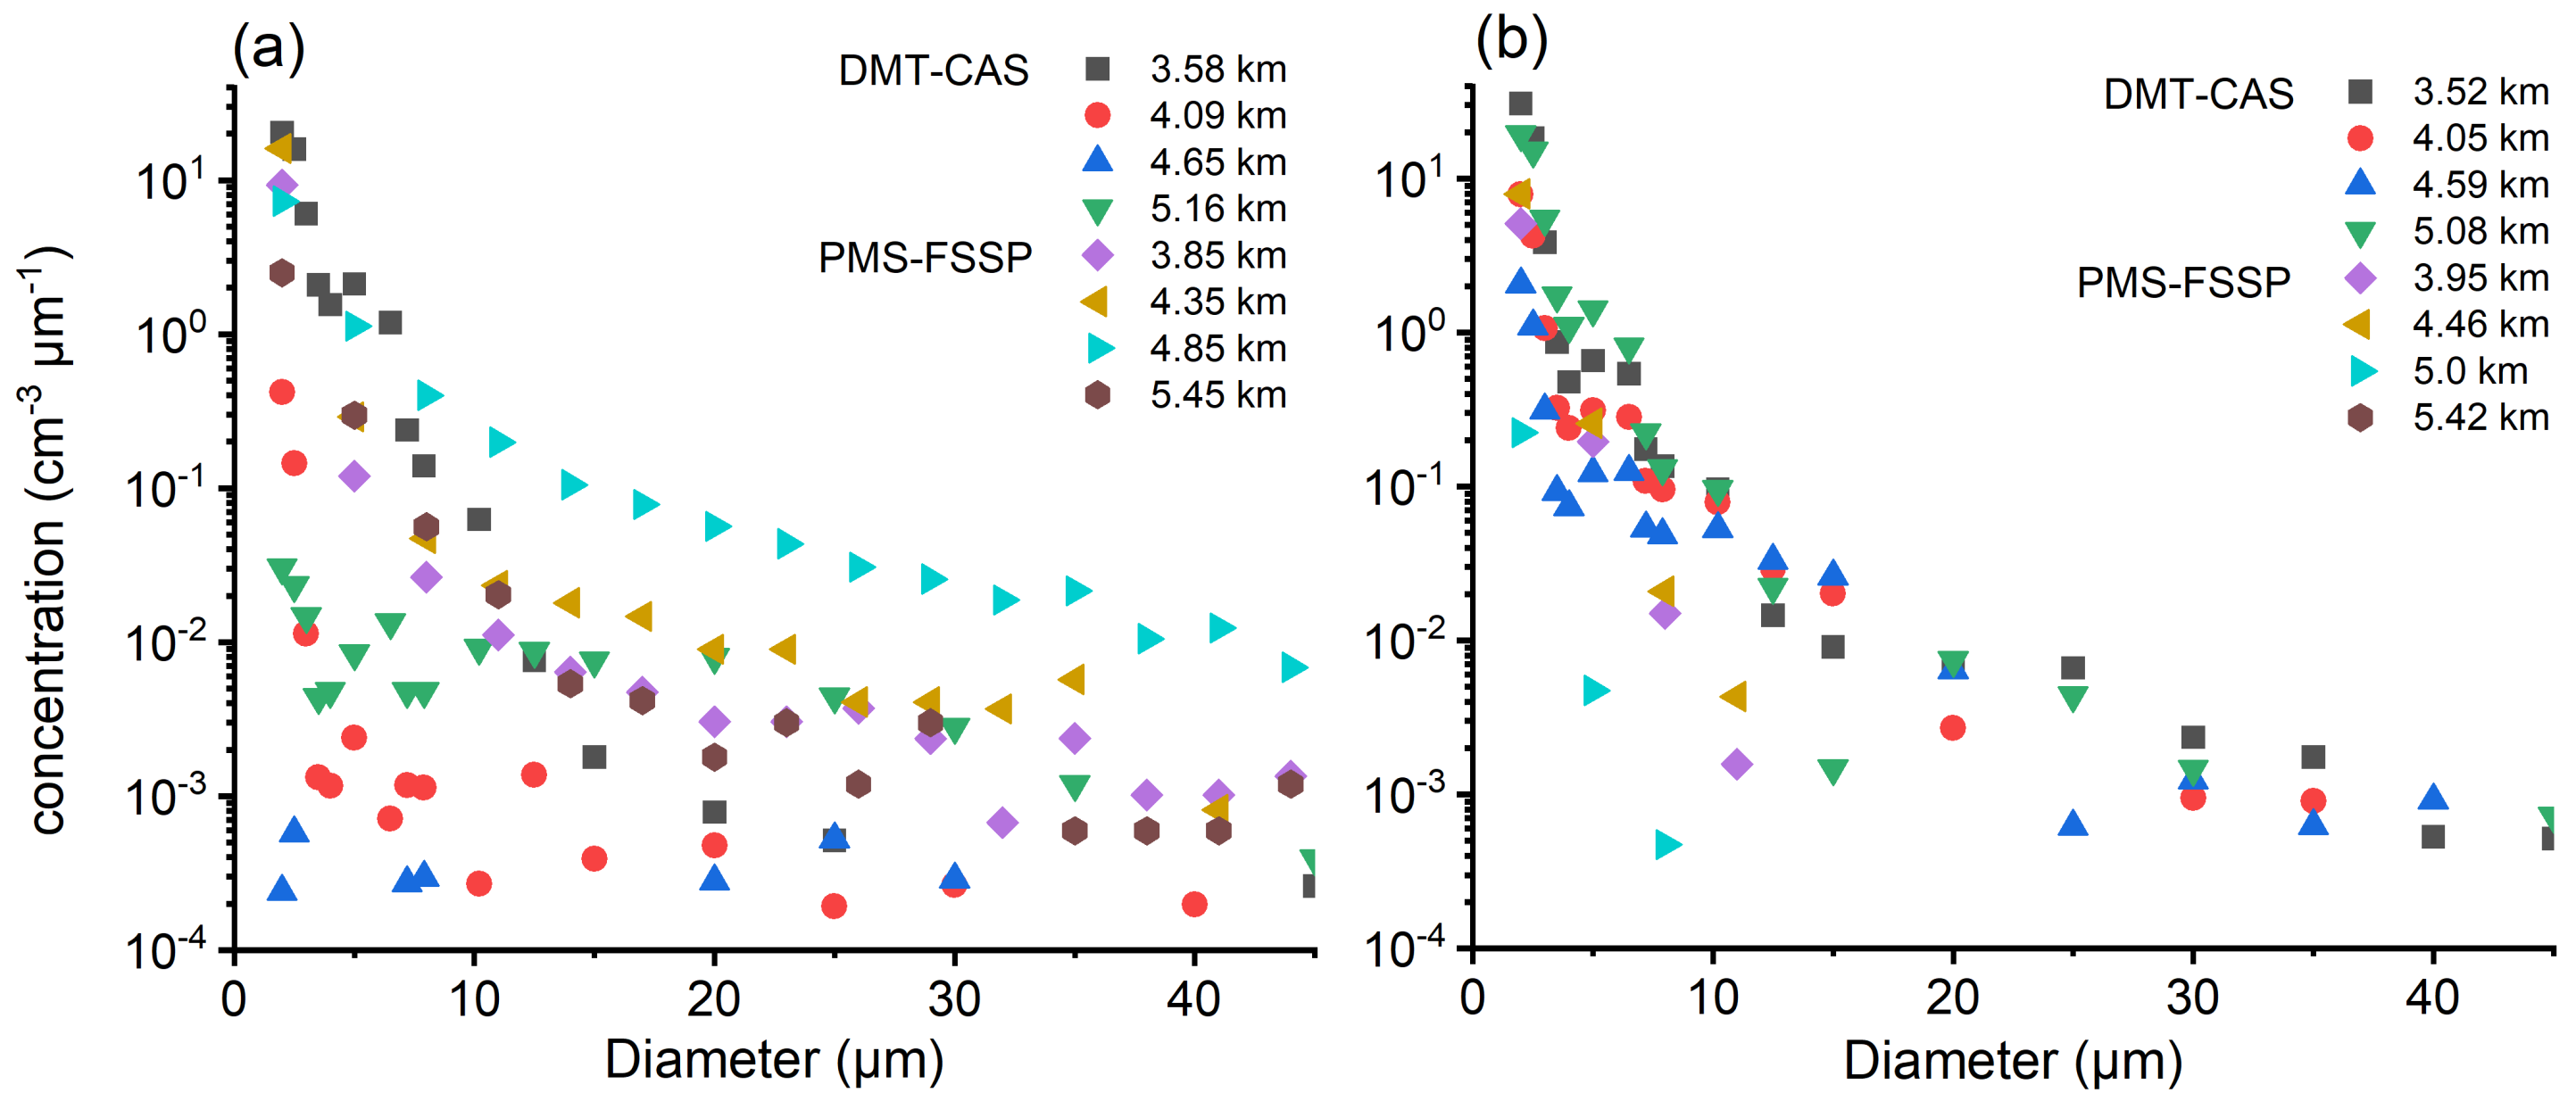
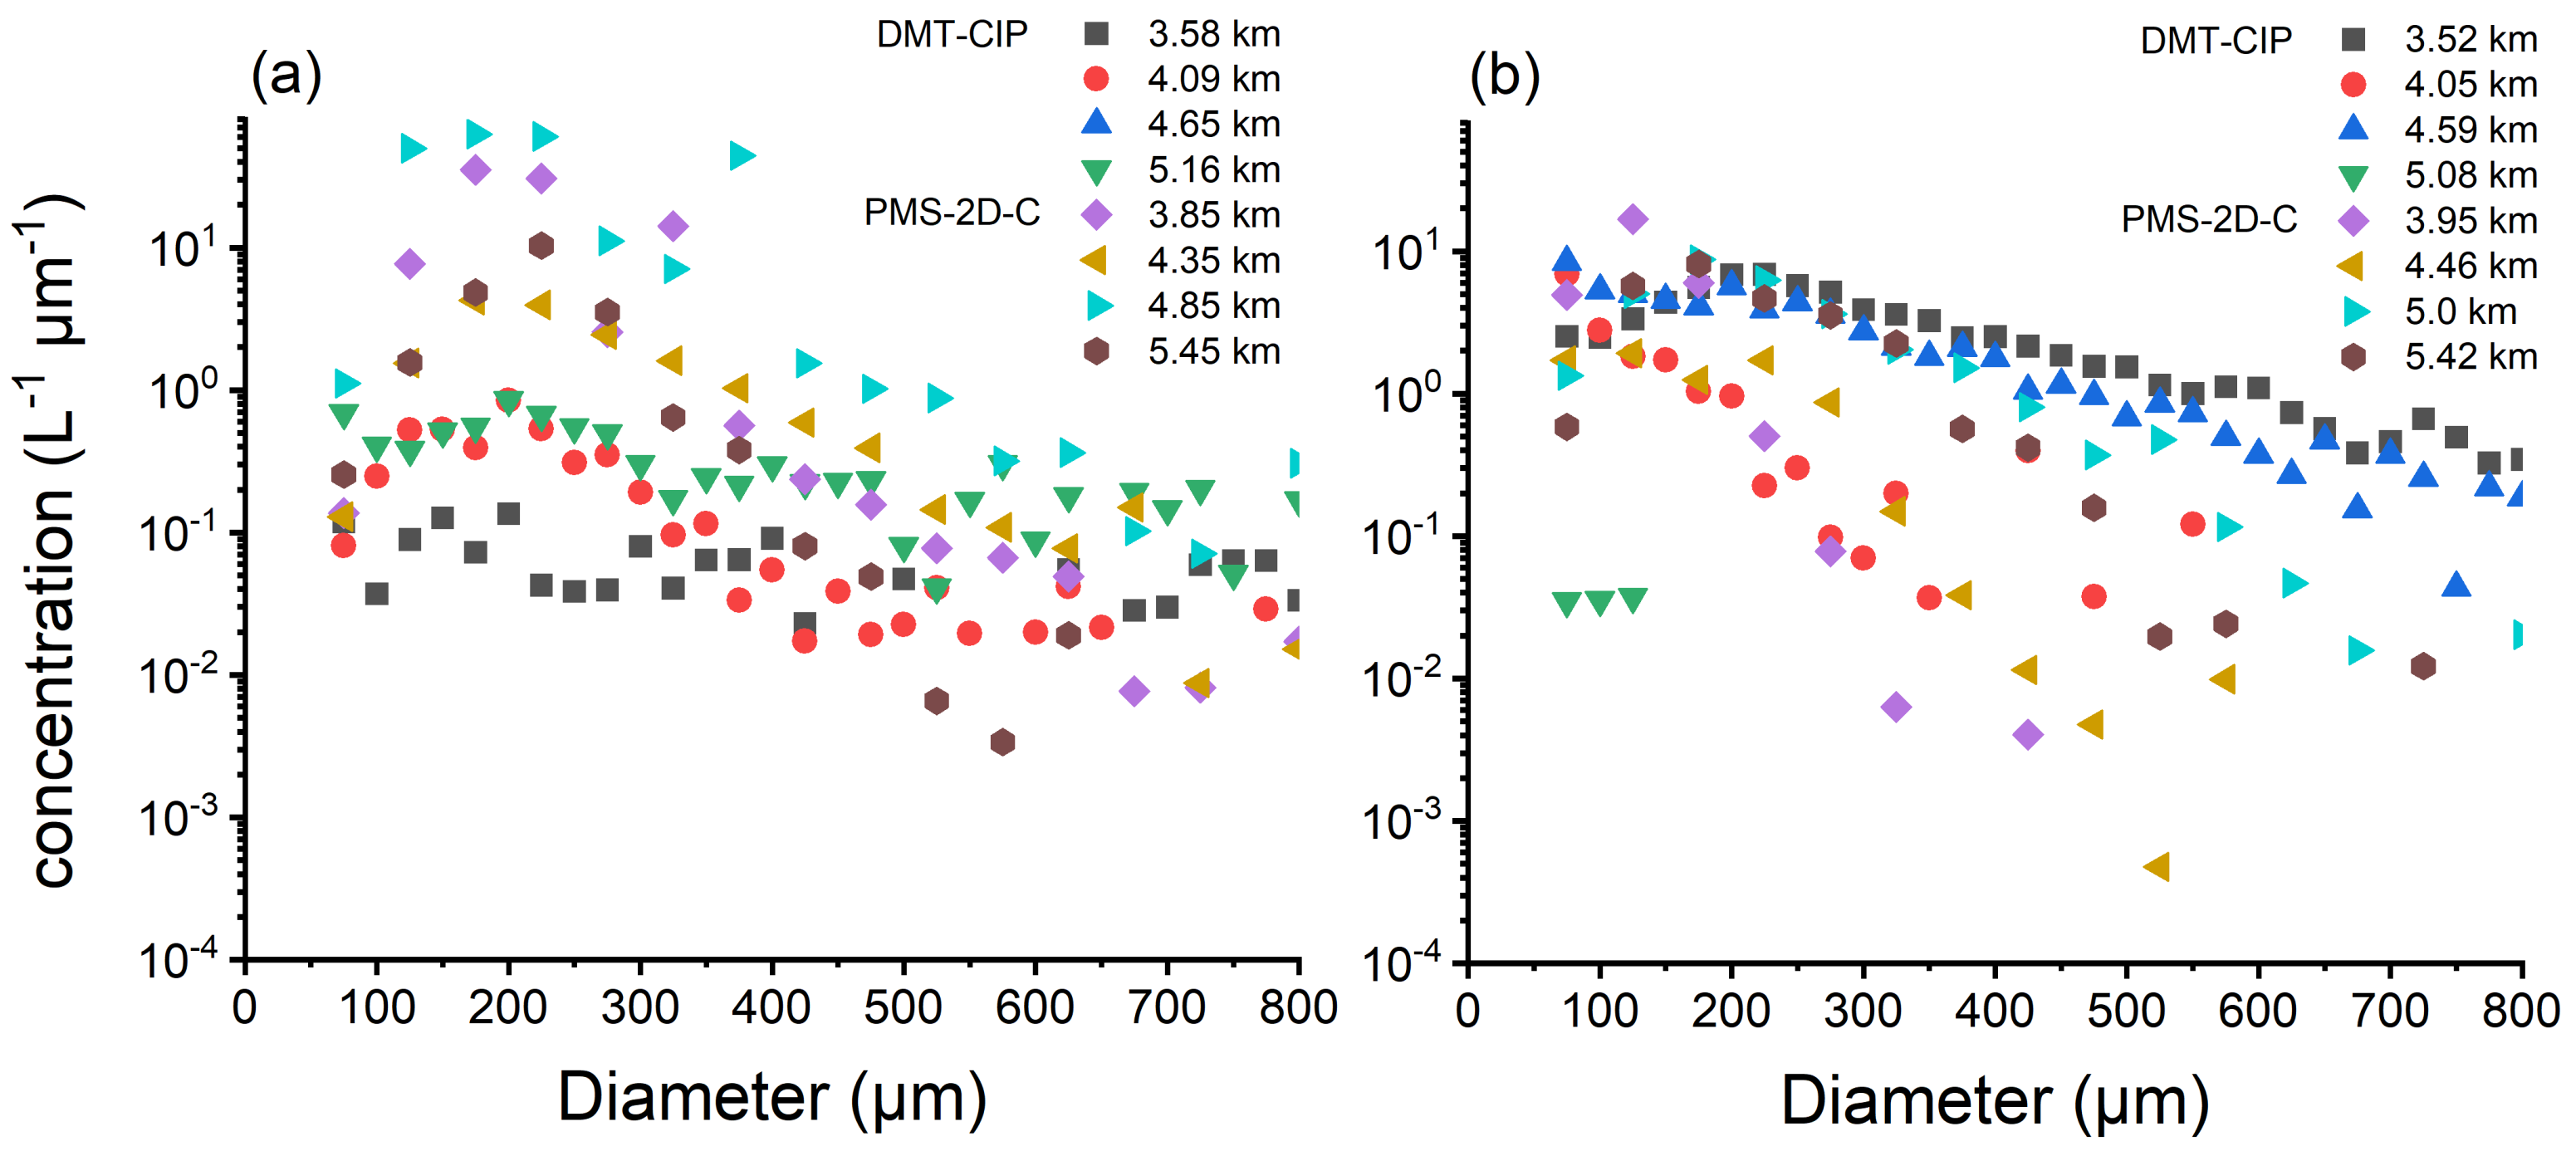
4.2. Particle Size Distribution and Spectral Parameters

Figure 5 shows the average PSD at different altitudes, as listed in Table 2. The concentration data from the CAS, FSSP, 2D-C, and CIP were averaged over the same altitude to reduce spurious variability. Regarding particles larger than 2 μm, the concentration was plotted on logarithmic axes, with the size plotted on linear axes. The highest cloud droplet concentration was observed for the 2-μm cloud droplets at all flight altitudes. There was a small peak value from approximately 5–7 μm measured by the CAS. The diameters of the cloud droplets mostly varied between 2 μm and 10 μm, and the concentration of cloud droplets with a particle diameter larger than 10 μm was less than 0.3 cm−3 μm−1.
The concentration of cloud droplets measured with the FSSP SF in each bin (>10 μm) was lower than that of FSSP FF, and the shape of the PSD became narrower at the latter stage. This could be related to the descent of particles through the As and Ac clouds, leading to a rapid decrease in cloud droplets and an increase in the concentration of cloud droplets in the Ns cloud system. The broadening of the particle spectrum from 3.5 km to 4.59 km measured with the CAS SF also showed that phenomenon.
During the CIP SF (Figure 6b), the cloud particles increased at each horizontal flight leg (except for 5.08 km). The maximum diameter of cloud particles measured by the FSSP SF was smaller than 330 μm at 3.95 km, and the peak value of the cloud particle concentration in the Ns cloud top could reach 20 L−1 μm−1. The concentration of ice and snow crystals that melted and fell into Ns cloud increased rapidly. The concentration of ice and snow crystal particles in the cloud near 5.4 km was larger than that in the FF, and a large number of ice and snow crystal particles were generated.
The ice and snow crystal particles between −3 to 0 °C decreased due to melting and precipitation. At 5.16 km, the concentration of ice crystal and snow crystal was less than 1 L−1 (as shown in Figure 6a and Figure 7a,b), and both were less than 0.1 L−1 at 5.08 km (as shown in Figure 6b and Figure 7c,d).
The formation and growth mechanisms of ice particles could greatly affect initiation and duration of precipitation. Regarding the cloud particles detected by the 2D-C and CIP probe, the particles between 50 and 300 μm in size above the 0 °C layer were regarded as ice crystals, and those with a diameter larger than 300 μm were regarded as snowflakes, as in previous studies [12,34,35]. The formation and growth of ice and snow crystals in the cold layer play a notable role in precipitation.
Rangno and Hobbs [9] and Yang et al. [14] found that ice concentration was between 10 and 100 L−1 in the stratiform cloud, while in the cumulus cloud, the maximum ice concentration could be more than several hundred per liter [36,37]. In this study, ice crystals were generated faster during the first detection, which could be related to the multiplication process. Above 0 °C, the ice crystal concentrations first increased and then decreased with decreasing temperature and then increased in the −5 °C layer. The concentration of ice crystals at a temperature of −2.65 °C (4865 m) attained a maximum value of 287 L−1 and snowflakes of 47 L−1. This was similar to previous studies, where ice crystal concentration was 348 L−1 and snowflakes was 73.5 L−1 [12]. The distribution of the concentration of snow crystals was similar to that of the concentration of ice crystals, as detected by the aircraft. However, high concentrations of large particles were found in the 2D-C SF, ice crystal concentration was up to 103 L−1, and snowflakes with 11.3 L−1 at temperatures from −3.5 to −6 °C.
Due to the low altitude of DMT aircraft, only particle spectrum information below −2 °C can be obtained (as shown in Figure 7). When the temperature was higher than 0 °C, the particles consisted of melting ice, snow crystal particles, cloud drops, and raindrops. The particle number concentration of ice crystal and snowflakes at about −2 °C was less than 1 L−1, respectively. The value by CIP around −2 °C was much smaller than that detected by 2D-C probe; comparison below −3 °C was not feasible due to a lack of data. There was large uncertainty in the concentration of ice and snow crystals.
Considering the previous experimental results [13,22], we concluded that high concentrations of cloud droplets and large ice particles provided a favorable environment for ice multiplication in our case, even at the cloud dissipation stage. Although observations were conducted during the ML of the stratiform clouds in this case, particle properties from lower temperature to high temperature stages could reveal the weakening of precipitation [12]. Both ice crystals and snowflakes had two peaks between −5 and −2 °C. For the mixed-phase layer, ice and snowflake particle concentrations increased with decreasing height until 0.5–1.0 km above the 0 °C layer [37].

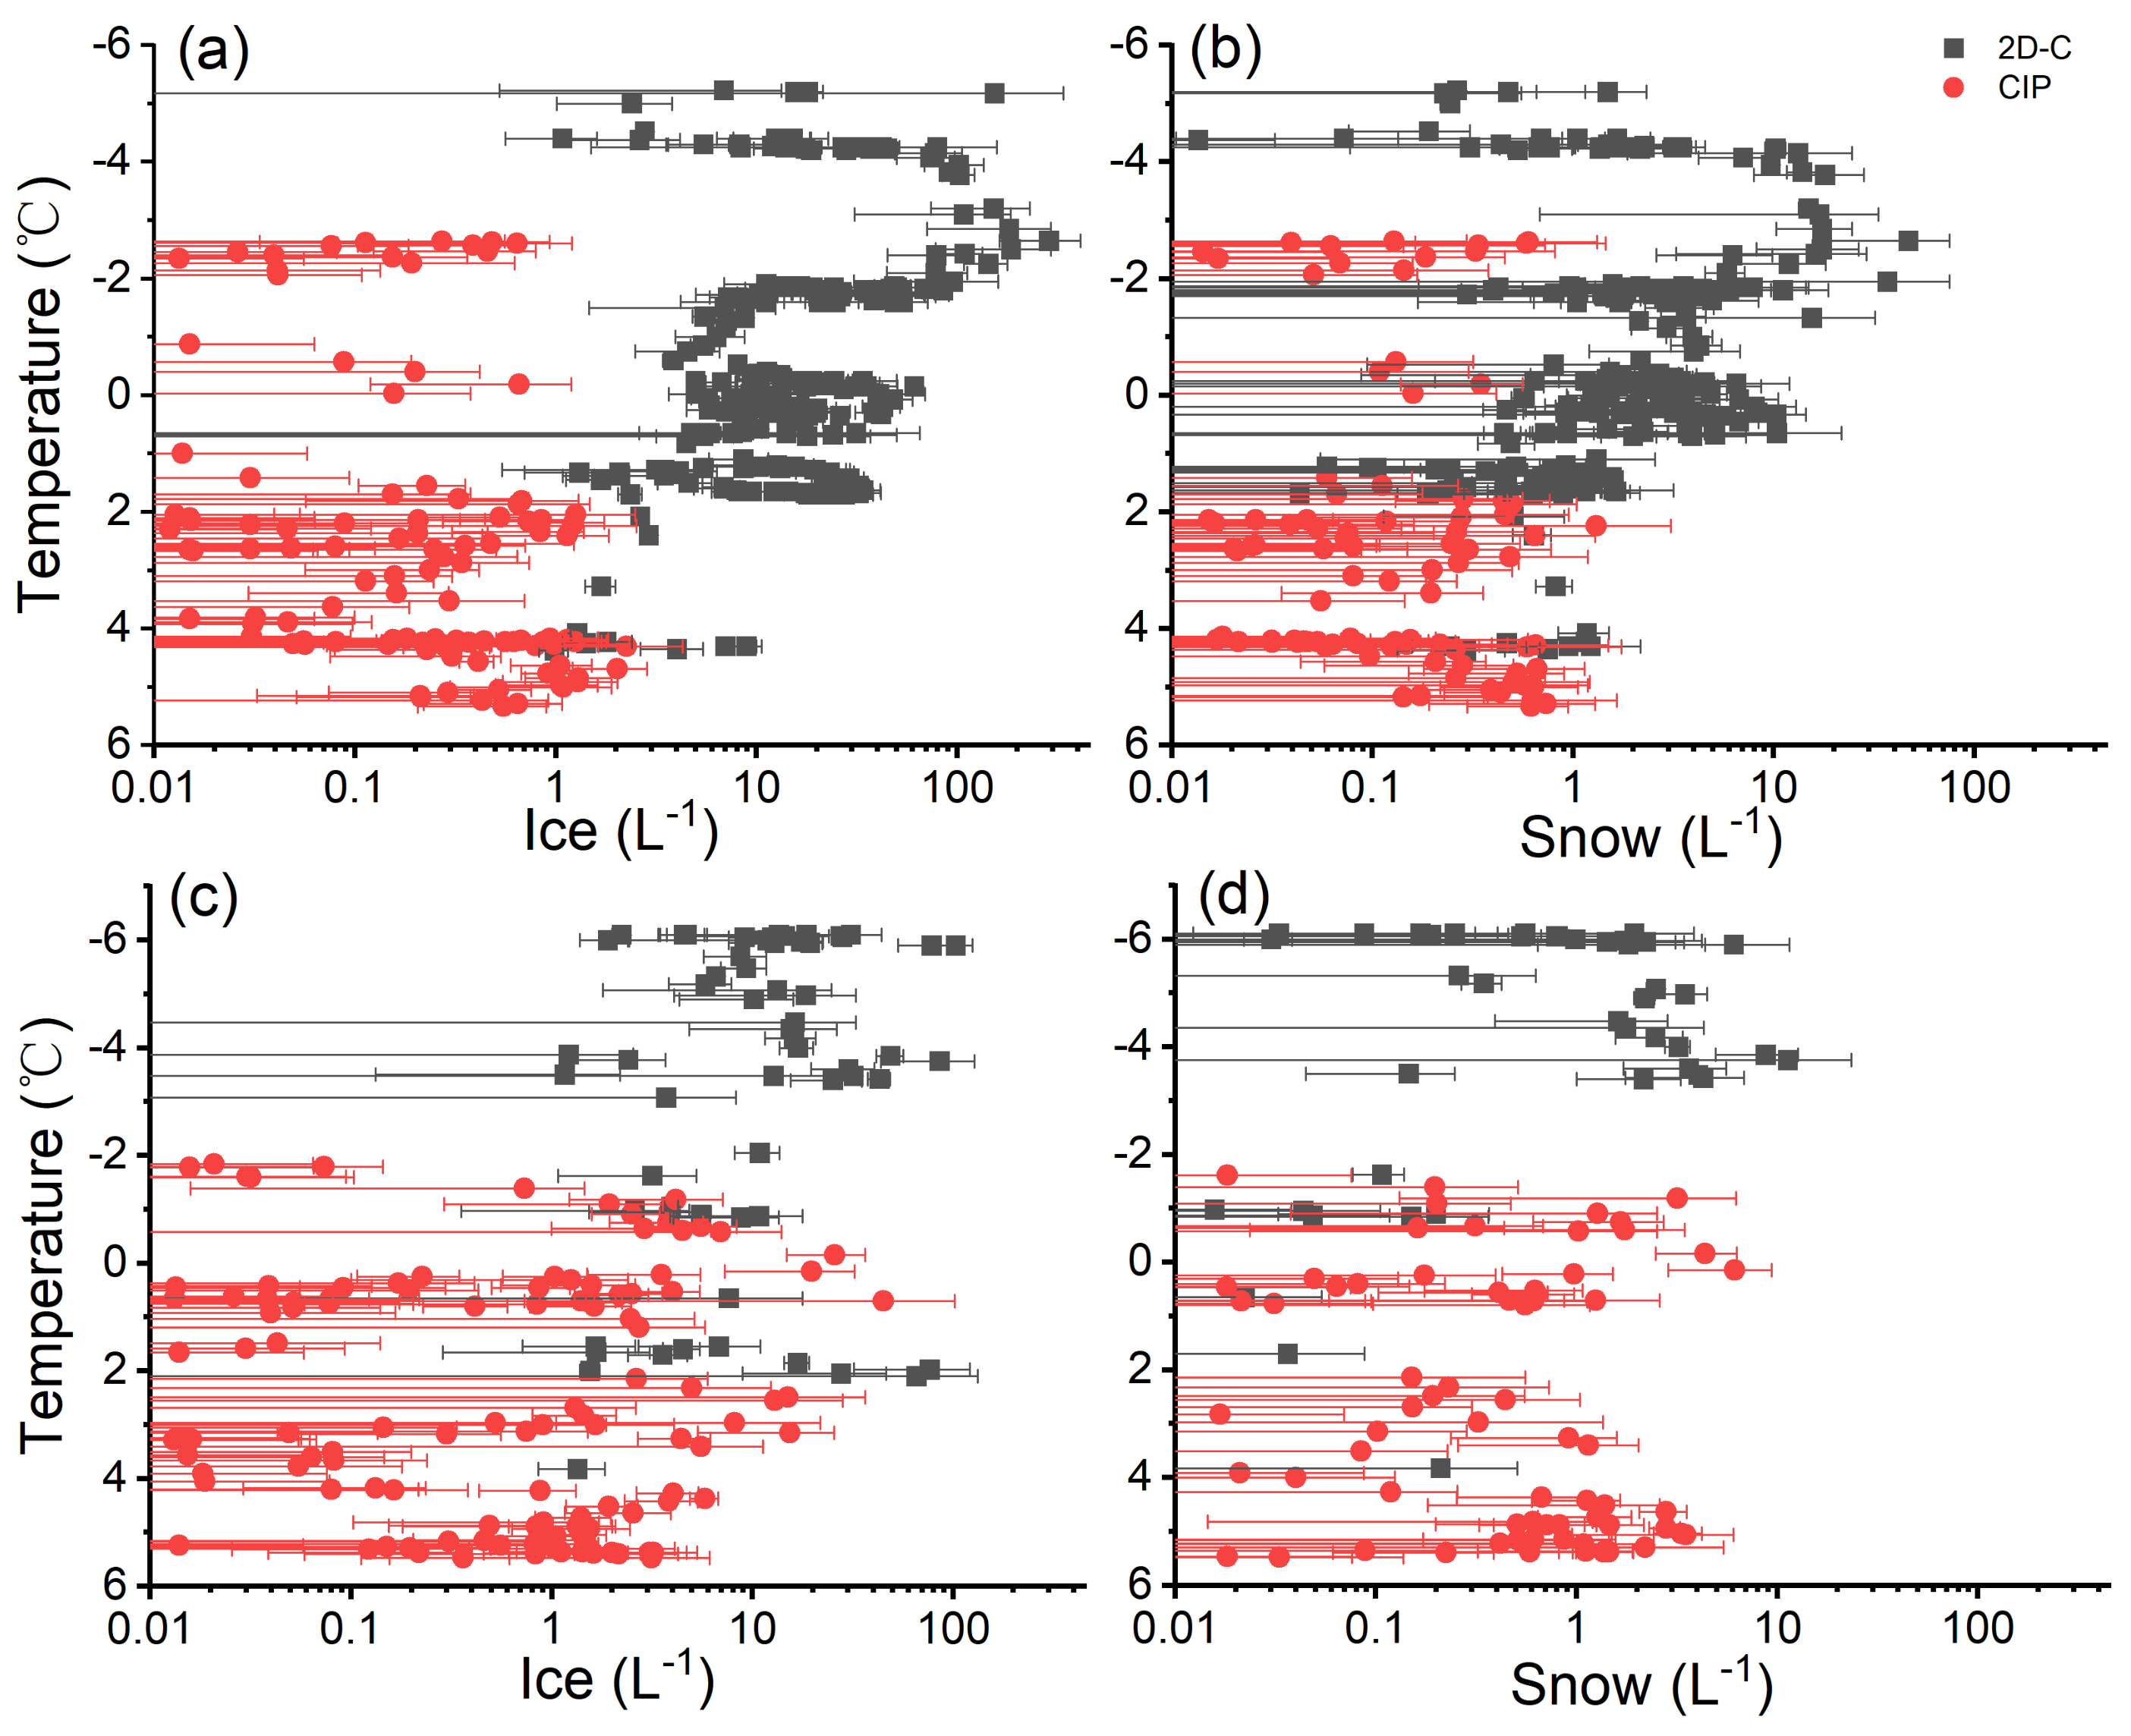
4.3. Characteristics of the Melting Layer (ML)

In fact, by the time of the aircraft observations, the radar-bright bands had disappeared. Figure 8 shows the particle shape and average diameter in the ML. There were irregular particles at a height of 4079 m (temperature: 0.2 °C), which could be formed by the descent of ice crystal particles above the 0 °C layer (Figure 8a). Irregular particles were still detected at 3978 m, which were partially melted. The aggregation of particles was observed at 3871 m, and small spherical particles were detected at 3864 m. The particles were almost completely melted, while the particles at 3605 m had melted into raindrops. Figure 8b shows that the average particle diameter varied between 3650 and 4300 m, mainly from 150–250 μm. This indicated that the large ice crystal particles at this stage entered the ML above 0 °C and melted, accompanied by the ice crystal particle fragmentation process. The average particle diameter was small, which continued to decline. Then, the clouds and raindrops aggregated and grew, and the average particle diameter increased.
Figure 9a shows the particle images recorded by the PMS-2D-C probe at each level. There were spherical, needle, and irregular ice and snow crystals at altitudes of 4850 m and 5450 m. The aggregation of ice and snow crystal particles promoted particle growth. Needle ice crystal particles, melting ice crystal particles, and small raindrops occurred at an altitude of 4350 m. Distinguishable needles at 4850 m and 4350 m suggest deposition as one of the basic growth mechanisms, and spheres suggest freezing of supercooled droplets.
At an altitude of 5000 m, mainly needle ice and snow crystal particles were observed, while melting ice crystal particles, small raindrop particles, and coalesced particles were observed at an altitude of 4460 m (as shown in Figure 9b). Aggregation of dendrites could be observed at levels above 4460 m, but was not the dominant process. Only a few (<10%) ice particles were pristine in the −3 to −10 °C temperature range in the 2D imageries. A large number of unidentifiable ice particles could have originated from the shattering of larger drops during freezing in fall [9,14].
By collecting the PMS data of many stratiform clouds, Korolev et al. [38] classified ice particles into four categories: spheres, irregulars, dendrites, and needles/columns. Needles absolutely dominated at temperatures from −4 to −3 °C, in agreement with the results of Korolev et al. [38]. Ice particle habits were characterized by dendrites at −1 °C, by needles at −3 °C, and again by dendrites and irregulars at −6 to −9 °C [26,39]. In comparison, needles absolutely dominated at temperatures from −4 to −3 °C in this case, which is in agreement with the results of Korolev et al. [38].
The typical size spectra of ice particles could not be well sampled by 2D-C alone, and 2D-P was often more sensitive to the presence of large particles than 2D-C [14]. Therefore, we needed to combine the data of 2D-P with different sizing ranges to ensure the accuracy of size spectra provided by 2D probes. Needles occurred at the temperature of −5.2 °C, the same as the 2D-C (as shown in Figure 10a). Plate-shaped and dendritic ice crystals were observed at altitudes of 4350 m and 4850 m, and there was an aggregation of snow and ice crystals with the 2D-P. The identification of riming and aggregation levels of ice crystals may roughly depend on their size and density. Aggregation was favorable for the increase in average diameters such as the maximum diameter of 6400 μm at 4850 m for the mixed-phase layer.
The needle ice crystals detected had become plate-shaped and dendritic ice crystals were found at altitudes ranging from 5000 to 5420 m (as shown in Figure 10b). Large precipitation particles such as snow clusters and ice crystal aggregates fell at this altitude, randomly collided with cloud droplets, and fractured, thus causing discontinuities in the large particles at heights from 3950 to 4460 m and disrupting the particle spectrum (Figure 6b). Ice particle habits in the 2D-P probe were characterized by irregulars and dendrites at 0 to −2 °C, needles at −5 °C, and dendrites and irregulars again at −6 °C.
The majority of ice particles in natural clouds were of irregular shape, found for each 5 °C temperature interval in the range −45 °C < T < 0 °C [38]. Previous studies [40,41] have discussed the occurrence of columns and needles since they were thought to be associated with secondary ice production. Heymsfield and Willis [40] reported that needles were observed primarily in regions of low LWC (<0.1 g m−3) and weak vertical motions (−1 to 1 m s−1). The combined presence of large droplets exceeding 24 μm in diameter and the evident increase in needles occurred most frequently at temperatures of −5 °C [13]. In our observations, however, although irregulars were observed, needles and spheres dominated in the observed cloud region of low LWC (<0.1 g m−3) at temperatures from −6 to −3 °C. Hallet–Mossop criteria were cloud droplet diameter >25 µm, −8 °C < T < −3 °C, and presence of riming (implies that supercooled water and some ice are present) [42]. These cloud conditions fit into the Hallett–Mossop criteria.

5. Conclusions and Discussions

In the shallow stratiform cloud area, the growth of particles was mainly condensation, while in the embedded convective and deep stratiform cloud area, the growth of particles included condensation, riming, and aggregation. The aggregation of ice crystals had a greater impact on the broadening of PSDs [15]. However, the aggregation process became very weak in the ML. Due to deep stratiform cloud system dissipation in this study, in which ice and snow crystal particles collided, melted, and precipitated, the concentration of small particles in each layer at the various altitudes was much higher, and the number of large particles decreased. During the dissipation stage, even in deep stratiform clouds, the PSDs in the ML became narrower.
Previous studies suggest that the characteristics of ice crystal habits were different in clouds, and deep clouds with high cloud top and low temperature can produce more complex ice crystal habits such as bullets, dendrites, and aggregates [29,43]. Hou et al. [12] found that needles at −3 °C and dendrites and irregulars dominated between −6 and −9 °C, with few occurrences of spheres. In the embedded convective region, the rimed ice particles and needles dominated at temperatures between −3 and −5 °C [13]. However, although irregulars were observed, spheres and needles absolutely dominated from −6 to −3 °C in this case.
The ice-bulb temperature is of great importance to the melting process, which controls whether the ice particles are sublimating, growing, or melting [44]. Ice multiplication can occur without the riming process being involved at temperatures of approximately −5 °C [45]. The Hallett–Mossop ice multiplication process operated most effectively at the temperature of −5 °C in this study. Even at the cloud dissipation stage, the cloud conditions fit into the Hallett–Mossop criteria [42]. Needles and large spheres were observed in the stratiform cloud region of low LWC at temperatures of −5 °C. High concentrations of cloud droplets and large ice particles provided a favorable environment for ice multiplication in this case.
Previous studies [10,46] have shown that ice crystal concentrations were considerably higher than would have been predicted from the ice nuclei concentrations. Both the highest snow and ice crystal concentrations were approximately 102 L−1. In this study, due to ice multiplication, the highest ice particle concentration reached approximately 287 L−1. Aggregates occurred on more than 50% of the occasions if the ice particle concentrations were in excess of 103 L−1 and the temperatures above −5 °C [47]. Aggregation was present in the dendritic growth region, but was not dominant in this study.
Considering that this study was based on a single case only, in which some errors existed in the instruments, it is necessary to reach general conclusions by examining more cases in future work. Generally, DMT instruments are considered to be more accurate than that of PMS, but it seems the opposite was true in this case. The instrument will be further calibrated at a later date. Nevertheless, the promising results in the current study demonstrate the microphysical characteristics of stratiform clouds in the dissipation stage.
Our observations were obtained at the dissipation stage of cloud precipitation, and further study should focus on the importance of aggregation in the ML. In general, aircraft observations are significant in facilitating research on the properties of stratiform cloud precipitation processes, but they are limited in the analysis of the detailed evolution of ML particles [32,33]. Therefore, we plan to use these observations in numerical models for further study of the detailed characteristics of stratiform cloud precipitation.

Author Contributions

H.L. conceived the study, L.W., Y.L. and T.H. contributed to the observation data processing; L.W., W.H., R.Z., M.H., X.Z. and T.H. analyzed the results. All authors have read and agreed to the published version of the manuscript.

Funding

This research was funded by the National Key Research and Development Program of China, grant number 2018YFC1507900, and the National Natural Science Foundation of China, grant number 41705119, 41775166 and 41575131.

Institutional Review Board Statement

Not applicable.

Informed Consent Statement

Not applicable.

Data Availability Statement

Data available upon request from all the authors.

Conflicts of Interest

The authors declare no conflict of interest.

References

  1. Houze, R.A. Cloud Dynamics; Academic Press, Inc.: New York, NY, USA, 1993; p. 573. [Google Scholar]
  2. Szoke, E.J.; Zipser, E.J.; Jorgensen, D.P. A Radar Study of Convective Cells in Mesoscale Systems in GATE. Part I: Vertical Profile Statistics and Comparison with Hurricanes. J. Atmos. Sci. 1986, 43, 182–198. [Google Scholar] [CrossRef] [Green Version]
  3. Hobbs, P.V. Research on clouds and precipitation Past, present, and future. Bull. Am. Meteorol. Soc. 1989, 70, 282–285. [Google Scholar] [CrossRef] [Green Version]
  4. Zipser, E.J.; Lutz, K.R. The vertical profile of radar reflectivity of convective cells: A strong indicator of storm intensity and lightning probability. Mon. Weather Rev. 1994, 122, 1751–1759. [Google Scholar] [CrossRef] [Green Version]
  5. Hogan, R.J.; Behera, M.; O’Connor, E.J.; Illingworth, A.J. Estimate of the global distribution of stratiform supercooled liquid water clouds using the LITE lidar. Geophys. Res. Lett. 2004, 31, L05106. [Google Scholar] [CrossRef] [Green Version]
  6. Zhang, D.; Wang, Z.; Kollias, P.; Vogelmann, A.M.; Yang, K.; Luo, T. Ice particle production in mid-level stratiform mixed-phase clouds observed with collocated A-Train measurements. Atmos. Chem. Phys. 2018, 18, 4317–4327. [Google Scholar] [CrossRef] [Green Version]
  7. Hou, T.; Lei, H.; Hu, Z.; Yang, J.; Li, X. Simulations of Microphysics and Precipitation in a Stratiform Cloud Case over Northern China: Comparison of Two Microphysics Schemes. Adv. Atmos. Sci. 2019, 37, 117–129. [Google Scholar] [CrossRef]
  8. Rutledge, S.A.; Hobbs, P. The Mesoscale and Microscale Structure and Organization of Clouds and Precipitation in Midlatitude Cyclones. VIII: A Model for the “Seeder-Feeder” Process in Warm-Frontal Rainbands. J. Atmos. Sci. 1983, 40, 1185–1206. [Google Scholar] [CrossRef] [Green Version]
  9. Rangno, A.L.; Hobbs, P.V. Ice particles in stratiform clouds in the Arctic and possible mechanisms for the production of high ice concentrations. J. Geophys. Res. Earth Surf. 2001, 106, 15065–15075. [Google Scholar] [CrossRef]
  10. Heymsfield, A.J. Precipitation Development in Stratiform Ice Clouds: A Microphysical and Dynamical Study. J. Atmos. Sci. 1977, 34, 367–381. [Google Scholar] [CrossRef] [Green Version]
  11. Orville, H.D.; Farley, R.D.; Hirsch, J.H. Some Surprising Results from Simulated Seeding of Stratiform-Type Clouds. J. Clim. Appl. Meteorol. 1984, 23, 1585–1600. [Google Scholar] [CrossRef] [Green Version]
  12. Hou, T.; Lei, H.; Hu, Z. A comparative study of the microstructure and precipitation mechanisms for two stratiform clouds in China. Atmos. Res. 2010, 96, 447–460. [Google Scholar] [CrossRef]
  13. Hou, T.; Lei, H.; He, Y.; Yang, J.; Zhao, Z.; Hu, Z. Aircraft Measurements of the Microphysical Properties of Stratiform Clouds with Embedded Convection. Adv. Atmos. Sci. 2021, 38, 966–982. [Google Scholar] [CrossRef]
  14. Yang, J.; Lei, H.; Hu, Z.; Hou, T. Particle size spectra and possible mechanisms of high ice concentration in nimbostratus over Hebei Province, China. Atmos. Res. 2014, 142, 79–90. [Google Scholar] [CrossRef]
  15. Zhu, S.C.; Guo, X.L.; Lu, G.X.; Guo, L. Ice crystal habits and growth processes in stratiform clouds with embedded convection examined through aircraft observation in northern China. J. Atmos. Sci. 2015, 72, 2011–2032. [Google Scholar] [CrossRef]
  16. Heymsfield, A.J.; Bansemer, A.; Poellot, M.R.; Wood, N. Observations of Ice Microphysics through the Melting Layer. J. Atmos. Sci. 2015, 72, 2902–2928. [Google Scholar] [CrossRef]
  17. Mason, S.L.; Chiu, C.J.; Hogan, R.J.; Moisseev, D.; Kneifel, S. Retrievals of Riming and Snow Density From Vertically Pointing Doppler Radars. J. Geophys. Res. Atmos. 2018, 123, 13–807. [Google Scholar] [CrossRef] [Green Version]
  18. Tridon, F.; Battaglia, A.; Chase, R.J.; Turk, F.J.; Leinonen, J.; Kneifel, S.; Mroz, K.; Finlon, J.; Bansemer, A.; Tanelli, S.; et al. The Microphysics of Stratiform Precipitation During OLYMPEX: Compatibility Between Triple-Frequency Radar and Airborne In Situ Observations. J. Geophys. Res. Atmos. 2019, 124, 8764–8792. [Google Scholar] [CrossRef] [Green Version]
  19. Heymsfield, A.J.; Schmitt, C.; Bansemer, A. Ice Cloud Particle Size Distributions and Pressure-Dependent Terminal Velocities from In Situ Observations at Temperatures from 0° to −86 °C. J. Atmos. Sci. 2013, 70, 4123–4154. [Google Scholar] [CrossRef]
  20. Willis, P.T.; Heymsfield, A.J. Structure of the melting layer in mesoscale convective storm stratiform precipitation. J. Atmos. Sci. 1989, 46, 2008–2025. [Google Scholar] [CrossRef] [Green Version]
  21. Carlin, J.T.; Ryzhkov, A.V. Estimation of Melting-Layer Cooling Rate from Dual-Polarization Radar: Spectral Bin Model Simulations. J. Appl. Meteorol. Clim. 2019, 58, 1485–1508. [Google Scholar] [CrossRef]
  22. Szeto, K.K.; Lin, C.A.; Stewart, R.E. Mesoscale Circulations Forced by Melting Snow. Part I: Basic Simulations and Dynamics. J. Atmos. Sci. 1988, 45, 1629–1641. [Google Scholar] [CrossRef]
  23. Trömel, S.; Ryzhkov, A.V.; Hickman, B.; Mühlbauer, K.; Simmer, C. Polarimetric Radar Variables in the Layers of Melting and Dendritic Growth at X Band—Implications for a Nowcasting Strategy in Stratiform Rain. J. Appl. Meteorol. Clim. 2019, 58, 2497–2522. [Google Scholar] [CrossRef]
  24. Oraltay, R.G.; Hallett, J. The Melting Layer: A Laboratory Investigation of Ice Particle Melt and Evaporation near 0 °C. J. Appl. Meteorol. 2005, 44, 206–220. [Google Scholar] [CrossRef]
  25. Heymsfield, A.J.; Bansemer, A.; Theis, A.; Schmitt, C. Survival of Snow in the Melting Layer: Relative Humidity Influence. J. Atmos. Sci. 2021, 78, 1823–1845. [Google Scholar] [CrossRef]
  26. Zawadzki, I.; Szyrmer, W.; Bell, C.; Fabry, F. Modeling of the Melting Layer. Part III: The Density Effect. J. Atmos. Sci. 2005, 62, 3705–3723. [Google Scholar] [CrossRef]
  27. Li, H.; Von Lerber Tiira, A.J.; Moisseev, D. Towards the connection between snow microphysics and melting layer: Insights from multi-frequency and dual-polarization radar observations during BAECC. Atmos. Chem. Phys. Disc. 2020, 20, 9547–9562. [Google Scholar] [CrossRef]
  28. Pruppacher, H.; Klett, J. Microphysics of Clouds and Precipitation; Atmospheric and Oceanographic Sciences Library 18; Kluwer Academic Publishers: Dordrecht, The Netherlands, 1997. [Google Scholar]
  29. Evans, A.G.; Locatelli, J.D.; Stoelinga, M.T.; Hobbs, P.V. The IMPROVE-1 Storm of 1–2 February 2001. Part II: Cloud Structures and the Growth of Precipitation. J. Atmos. Sci. 2005, 62, 3456–3473. [Google Scholar] [CrossRef]
  30. Woods, C.P.; Stoelinga, M.T.; Locatelli, J.D. Size Spectra of Snow Particles Measured in Wintertime Precipitation in the Pacific Northwest. J. Atmos. Sci. 2008, 65, 189–205. [Google Scholar] [CrossRef]
  31. Yang, J.; Wang, Z.; Heymsfield, A.J.; DeMott, P.J.; Twohy, C.H.; Suski, K.J.; Toohey, D.W. High ice concentration observed in tropical maritime stratiform mixed-phase clouds with top temperatures warmer than −8 °C. Atmos. Res. 2019, 233, 104719. [Google Scholar] [CrossRef]
  32. Field, P.R. Aircraft Observations of Ice Crystal Evolution in an Altostratus Cloud. J. Atmos. Sci. 1999, 56, 1925–1941. [Google Scholar] [CrossRef]
  33. Heymsfield, A.J.; Bansemer, A.; Field, P.; Durden, S.L.; Stith, J.L.; Dye, J.E.; Hall, W.; Grainger, C.A. Observations and Parameterizations of Particle Size Distributions in Deep Tropical Cirrus and Stratiform Precipitating Clouds: Results from In Situ Observations in TRMM Field Campaigns. J. Atmos. Sci. 2002, 59, 3457–3491. [Google Scholar] [CrossRef]
  34. Nakaya, U. Snow Crystals: Natural and Artificial; Harvard University Press: Cambridge, MA, USA, 1954. [Google Scholar]
  35. You, L.G.; Xiong, G.Y.; Gao, M.R.; Lu, Y.J.; Sun, K.F.; Ren, D.F. The characteristics of ice crystal formation and snow growth processes of in spring stratiform clouds in Jilin Province. Acta Meteorol. Sin. 1965, 35, 423–433. (In Chinese) [Google Scholar]
  36. Hobbs, P.V.; Rangno, A.L. Ice Particle Concentrations in Clouds. J. Atmos. Sci. 1985, 42, 2523–2549. [Google Scholar] [CrossRef] [Green Version]
  37. Crawford, I.; Bower, K.N.; Choularton, T.W.; Dearden, C.; Crosier, J.; Westbrook, C.; Capes, G.; Coe, H.; Connolly, P.J.; Dorsey, J.R.; et al. Ice formation and development in aged, wintertime cumulus over the UK: Observations and modelling. Atmos. Chem. Phys. 2012, 12, 4963–4985. [Google Scholar] [CrossRef] [Green Version]
  38. Korolev, A.; Isaac, G.A.; Hallett, J. Ice particle habits in stratiform clouds. Q. J. R. Meteorol. Soc. 2000, 126, 2873–2902. [Google Scholar] [CrossRef]
  39. Pruppacher, H.R.; Klett, J.D. Microphysics of Clouds and Precipitation; Reidel: Boston, MA, USA, 1978; pp. 44–47. [Google Scholar]
  40. Heymsfield, A.; Willis, P. Cloud Conditions Favoring Secondary Ice Particle Production in Tropical Maritime Convection. J. Atmos. Sci. 2014, 71, 4500–4526. [Google Scholar] [CrossRef]
  41. Field, P.R.; Lawson, R.P.; Brown, P.R.A.; Lloyd, G.; Westbrook, C.; Moisseev, D.; Miltenberger, A.; Nenes, A.; Blyth, A.; Choularton, T.; et al. Chapter 7. Secondary Ice Production—Current state of the science and recommendations for the future. Meteorol. Monogr. 2016, 58, 7.1–7.20. [Google Scholar] [CrossRef] [Green Version]
  42. Hallett, J.; Mossop, S.C. Production of secondary ice particles during the riming process. Nature 1974, 249, 26–28. [Google Scholar] [CrossRef]
  43. Stark, D.; Colle, B.A.; Yuter, S.E. Observed Microphysical Evolution for Two East Coast Winter Storms and the Associated Snow Bands. Mon. Weather Rev. 2013, 141, 2037–2057. [Google Scholar] [CrossRef]
  44. Kneifel, S.; von Lerber, A.; Tiira, J.; Moisseev, D.; Kollias, P.; Leinonen, J. Observed relations between snowfall microphysics and triple-frequency radar measurements. J. Geophys. Res. Atmos. 2015, 120, 6034–6055. [Google Scholar] [CrossRef] [Green Version]
  45. Knight, C.A. Ice growth from the vapor at −5 °C. J. Atmos. Sci. 2012, 69, 2031–2040. [Google Scholar] [CrossRef]
  46. Hobbs, P.V.; Houze, R.A.; Matejka, T.J. The Dynamical and Microphysical Structure of an Occluded Frontal System and its Modification by Orography. J. Atmos. Sci. 1975, 32, 1542–1562. [Google Scholar] [CrossRef] [Green Version]
  47. Hobbs, P.V.; Chang, S.; Locatelli, J.D. The dimensions and aggregation of ice crystals in natural clouds. J. Geophys. Res. Earth Surf. 1974, 79, 2199–2206. [Google Scholar] [CrossRef]
Figure 1. Three-dimensional trajectory diagram of the two aircraft (black: PMS aircraft first flights (PMS FF), red: PMS aircraft second flights (PMS SF), blue: DMT aircraft first flights (DMT FF), green: DMT aircraft second flights (DMT SF)).
Atmosphere 13 00284 g001
Figure 2. Detection flight trajectories: Time–Altitude diagram: (a) black: PMS FF, gray: DMT FF (b) black: PMS SF, gray: DMT SF.
Atmosphere 13 00284 g002
Figure 3. Based on the DMT-CAS data (red circles: 2–45 μm) FF and the PMS-FSSP data (black squares: 2–45 μm) FF, the variation in (a) the cloud droplet concentration, (b) average diameter, and (c) liquid water content (LWC). Standard deviations represent uncertainties in the probe detection.
Atmosphere 13 00284 g003
Figure 4. The same as in Figure 3, the SF variation in (a) the cloud droplet concentration, (b) average diameter, and (c) LWC.
Atmosphere 13 00284 g004
Figure 5. PSD (2–45 μm) detected by FF: (a) PMS-FSSP (3.85, 4.35, 4.85, 5.45 km), DMT-CAS (3.58, 4.09, 4.65, 5.16 km), SF: (b) PMS-FSSP (3.95, 4.46, 5.0, 5.42 km), DMT-CAS (3.52, 4.05, 4.59, 5.08 km).
Atmosphere 13 00284 g005
Figure 6. PSD (75–800 μm) detected by FF: (a) PMS-2D-C (3.85, 4.35, 4.85, 5.45 km), DMT-CIP (3.58, 4.09, 4.65, 5.16 km), SF: (b) PMS-2D-C (3.95, 4.46, 5.0, 5.42 km), DMT-CIP (3.52, 4.05, 4.59, 5.08 km).
Atmosphere 13 00284 g006
Figure 7. Variation and standard deviations with the height detected by the PMS-2D-C and the DMT-CIP probe FF: (a) ice crystal concentration and (b) snow crystal concentration. The SF: (c) ice crystal concentration and (d) snow crystal concentration (black squares: 2D-C; red circles: CIP). Standard deviations represent uncertainties in the probe detection.
Atmosphere 13 00284 g007
Figure 8. Measurements of the 2D-C probe of (a) particle images and (b) average diameter in the melting layer.
Atmosphere 13 00284 g008
Figure 9. 2D-C images at selected heights during (a) the first Baicheng Y-12 aircraft flight and (b) the second Baicheng Y-12 aircraft flight.
Atmosphere 13 00284 g009
Figure 10. 2D-P images at selected heights during (a) the first Baicheng Y-12 aircraft flight and (b) the second Baicheng Y-12 aircraft flight.
Atmosphere 13 00284 g010
Table 1. Flight features including aircraft, beginning and end times, and main instruments.
DateAircraftTime (CST–hhmm)Main Instruments
29 June 2012TongliaoFirst flights: 0607–0738CAS, PIP, CIP, and CCN
second flights: 0854–1025
29 June 2012BaichengFirst flights: 0557–0751FSSP-100, 2D-P, and 2D-C
second flights: 0856–1014
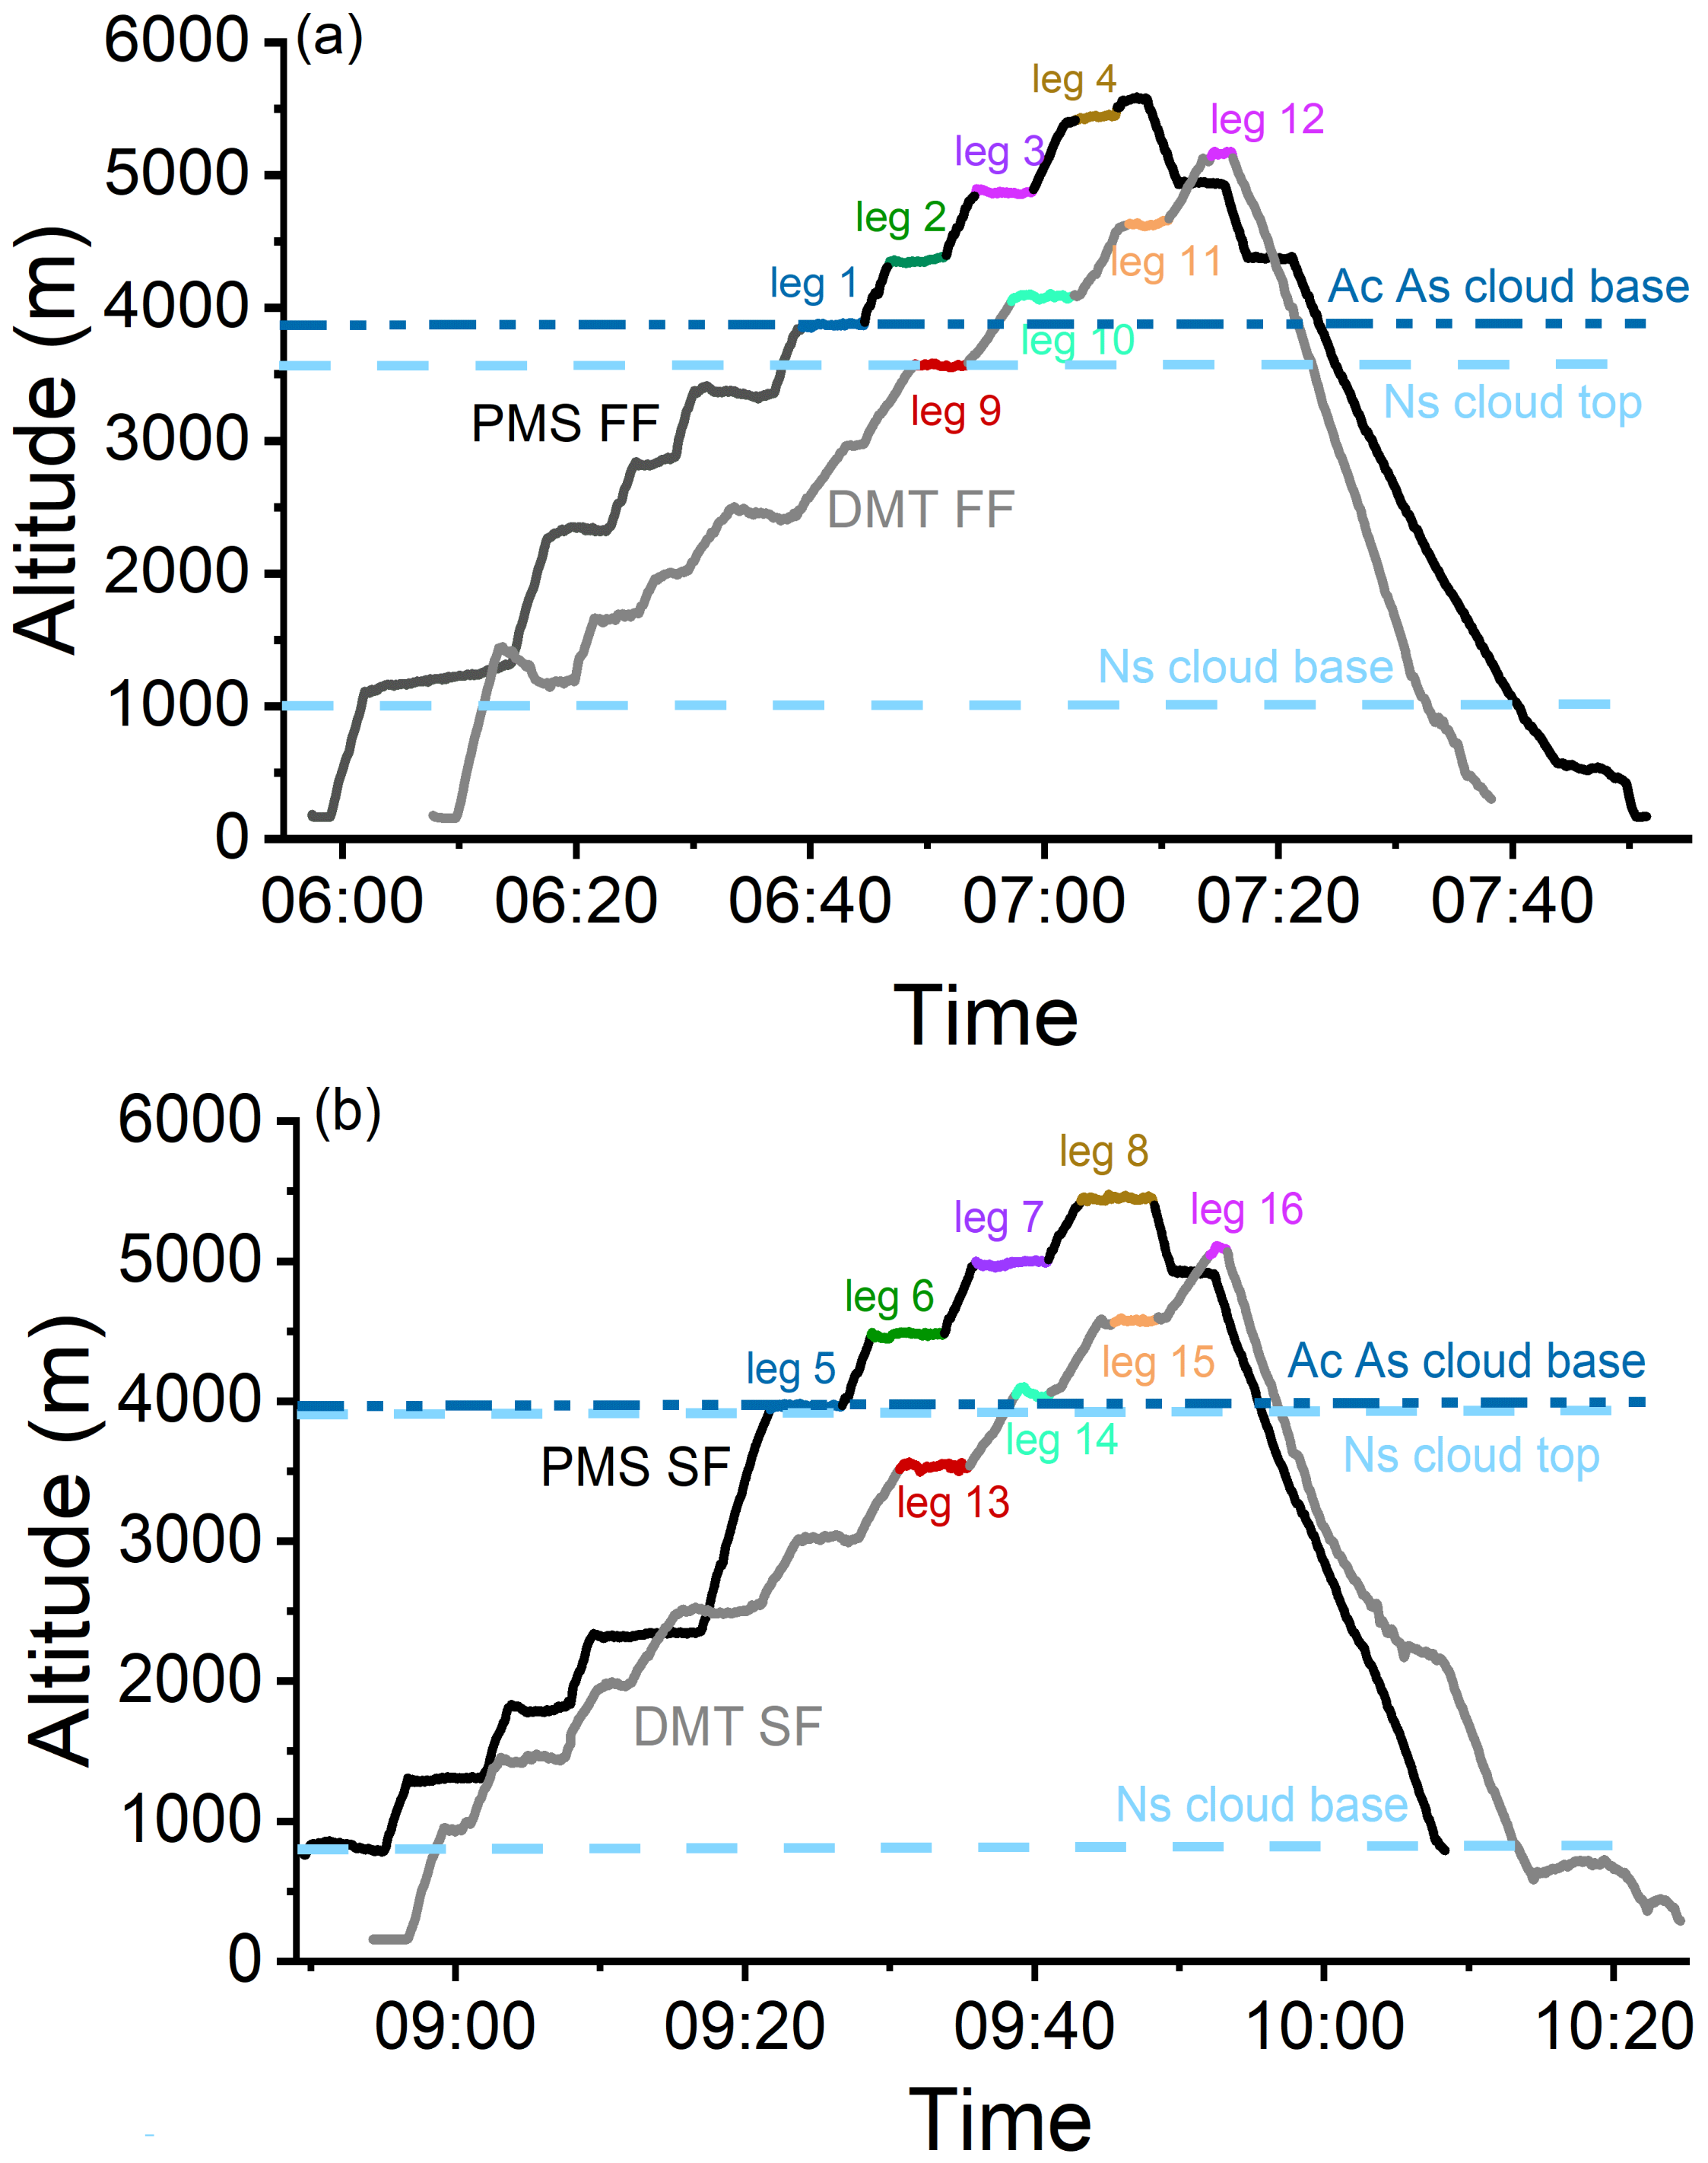
CST: China Standard Time.
Table 2. Horizontal flight leg features including aircraft, beginning and end times, altitude, and cloud temperature.
No.AircraftTime (CST–hhmm)Altitude (km)Temperature (°C)
leg 1Baicheng0639–06443.85From 0.7 to 1.7
leg 2Baicheng0646–06514.35From −1.3 to 0.3
leg 3Baicheng0654–06594.85From −3.8 to −1.6
leg 4Baicheng0702–07065.45From −5.25 to −4.35
leg 5Baicheng0921–09263.95From 0.95 to 2.1
leg 6Baicheng0928–09334.46From −2.55 to −0.55
leg 7Baicheng0936–09405.0From −5.0 to −3.4
leg 8Baicheng0943–09475.42From −6.15 to −5.25
leg 9Tongliao0649–06533.58From 4.16 to 4.33
leg 10Tongliao0657–07024.09From 1.85 to 2.62
leg 11Tongliao0706–07104.65From 0.45 to 1.64
leg 12Tongliao0714–07165.16From −2.65 to −2.08
leg 13Tongliao0930–09353.52From 4.8 to 5.9
leg 14Tongliao0938–09404.05From 2.94 to 3.8
leg 15Tongliao0945–09484.59From 0.33 to 0.86
leg 16Tongliao0951–09525.08From −2.4 to −0.68
Note: Temperature—hundredths of Celsius degree; altitude—units of meters.
Publisher’s Note: MDPI stays neutral with regard to jurisdictional claims in published maps and institutional affiliations.

