
What Drives Climate Change Adaptation Practices in Smallholder Farmers? Evidence from Potato Farmers in Indonesia


1
Department of Tropical Agriculture and International Cooperation, National Pingtung University of Science and Technology, Pingtung 912, Taiwan
2
Department of Socio-Economics, Faculty of Agriculture, Brawijaya University, Malang 65145, Indonesia
3
Department of Agribusiness Management, National Pingtung University of Science and Technology, Pingtung 912, Taiwan
4
Assessment Institute for Agricultural Technology East Java, Indonesian Agency for Agriculture Research and Development, Ministry of Agriculture, Malang 65152, Indonesia
*
Authors to whom correspondence should be addressed.
Atmosphere 2022, 13(1), 113; https://doi.org/10.3390/atmos13010113
Submission received: 17 December 2021
/
Revised: 8 January 2022
/
Accepted: 10 January 2022
/
Published: 11 January 2022
(This article belongs to the Special Issue Global Climate Change and Food Security: Recent Trends, Current Progress and Future Directions)
Abstract
:The potato is the third most consumed crop globally after rice and wheat, but climate change has often disrupted its production. Therefore, adaptation practices are needed to maintain potato productivity. This study investigates the determinants of on- and off-farm climate change adaptation practices among smallholder farmers in Indonesia, considering adaptation intensity, which has not discussed in previous literature. The cross-sectional data were collected from 302 smallholder potato farmers in East Java, Indonesia, analyzed by a multivariate probit model to estimate the determinants. An ordered probit model was subsequently employed to understand the intensity factors. The findings indicated that the significant factors that affect farmers’ choice of on-farm adaptations were the farmers’ education, their participation in farmers’ groups, agricultural-related infrastructure, and agriculture output prices. Meanwhile, the off-farm adaptations were significantly affected by the farmers’ education, employed family members, agriculture-related infrastructure, and livestock ownership. The ordered probit model also suggested that participation in farmers groups and agricultural-related infrastructure were the most significant factors that encouraged adaptation. Therefore, adaptation planning should consider these factors to optimally improve farmers’ adaptation capacity.
1. Introduction
Climate change is the world’s most significant environmental challenge, with widespread impacts across economic sectors, communities, natural resources, and biodiversity [1]. Agriculture is especially prone to these effects, due to its inherent sensitivity to environmental change [2,3,4] and has been, indeed, negatively impacted to a large extent [5,6,7]. A significant detrimental impact of climate change is that it stimulates and accelerates the growth and spread of fungi, bacteria, pests, and diseases on crops [8]. Moreover, it affects the cycles of weed and insect appearance, migration time, and season length [8,9]. As an agrarian country, agricultural sectors in Indonesia have been substantially affected by climate change; for instance, Mosey et al. (2010) found that, in Indonesia, climate change has caused water scarcity, reduced soil moisture, lowered soil fertility, and increased precipitation and evaporation. These have reduced the country’s agricultural productivity.
Numerous studies have explained how temperature changes significantly affect horticultural yields [10]. Using a simulation model to estimate the impact of climate change on crop production in the Huamburque, Tito et al. [11] found that increasing temperature has negatively impacted maize and potato yields by more than 87%. Meanwhile, Raymundo et al. [12] applied future climate change scenarios to the current potato farming systems. Using the SUBSTOR-Potato model, they projected that by 2050 the decline in global potato yield would rise from 2% to 6%, and 26% by 2085.
The potato is the third most consumed crop globally, after rice and wheat [13]. More than 156 countries grow potatoes, and many people depend on potato farming for their livelihoods in developing countries [14]. The United Nations have projected that the world population will reach 9.8 billion by 2050, with 95% of the increase happening in developing countries. The potato plays an essential role in the global food supply and offers an alternative plant to strengthen food security as the worldwide population increases [14]. However, potato production has been decreasing for several decades, along with the increasing population in developing countries [15].
In Indonesia, potato is a significant commodity because it is a diet alternative valued higher than other vegetable commodities [16,17]. However, compared with other agricultural countries (i.e., Vietnam, Cambodia, and Laos), Indonesia is the most vulnerable to climate change risks in Southeast Asia. This is because Indonesia is one of the top four countries globally with extreme weather and natural disasters, such as floods, drought, landslides, and tornadoes [18,19]. Supriyanto et al. [20] claimed that high precipitation with prolonged heavy rain had impacted hectares of potato crop failure in East Java, which resulted in significant economic losses. Setiyanto and Pasaribu [21] have projected that between 2015 and 2030, climate change will severely impact potato productivity in Java, especially among the smallholder farmers.
Adaptation is the most effective measure to deal with the negative impact of climate change [5,22]. According to the Intergovernmental Panel on Climate Change (IPCC), climate change adaptation is “the process of adjustment to actual or expected climate and its effects” (IPCC, 2014). Along the same line, Shafrill et al. (2019) define climate change adaptation as the anticipation of environmental change’s negative impacts, an undertaking of appropriate measures to mitigate the hazards, and a seizing of opportunities that may arise. To achieve adaptation goals, appropriate strategies are needed. Such strategies can be implemented in the agricultural sector on two different levels, i.e., community and personal. On a personal level, individuals and households initiate and implement the actions to fulfill their self-interests [23]—a behavioral response to an environmental change for one’s benefit [24]. In this case, there may be difficulty posed by limited capital. Considering this, the current study focuses on adaptation on a personal level. Past studies have reported several adaptation practices, including using a new variety, improved irrigation system, and changes in planting date and crop patterns [4,25].
The literature has also highlighted the importance of climate change adaptation practices in agriculture. For instance, a study conducted by Khanal, Wilson, Hoang, and Lee [25] summarized that climate change adaptation practices employed by farmers significantly improve agricultural yields. Meanwhile, Ahmad and Afzal [26] used propensity score-matching analysis to estimate the benefits of climate change adaptation practices for farm yields and crop sales income. They found that farmers who adopted the climate change adaptation reaped higher yields and profited more than those who did not. In line with this, Mottaleb et al. [27] indicated a positive and significant effect of adaptation practice on farmers’ productivity and that agriculture production could be increased by about 42–65 kg/hectare.
Nevertheless, adaptation decision-making is heavily influenced by socio-economic factors, such as farming experience and education level [28], wealth, government support, access to fertile land, and credit [29], as well as socio-demographic characteristics and institutional accessibility [30,31]. Farmers’ decisions to adopt climate change adaptation practices are constrained by their limited physical, natural, social, financial, or human capital [32]. In other words, if the adoption rate is to be improved, household capital must first be improved [4]. Kuang, Jin, He, Wan, and Ning [32] pointed out that the essential livelihood capital that can increase farmers’ adaptation capacity is social capital, followed by human and physical capitals.
Previous studies have documented that one of the determinants of farmers’ climate change adaptation is the farmers’ demographic profiles [33]. However, the existing literature only focuses on on-farm adaptation practices in dealing with climate change [25,34,35], when, in fact, farmers also apply off-farm adaptation practices. Previous studies have only investigated the determinants of farmers’ decision-making by multivariate probit or binary logistic regression, e.g., Khanal, Wilson, Hoang, and Lee [25], Trinh, Rañola Jr, Camacho, and Simelton [4], and Arun Yeo [36]. They overlooked the combination of adaptation practices employed by farmers, often referred to as adaptation intensity. Moreover, investigations on the determinants of climate change adaptation involving potato farmers are relatively new in the Indonesian context. Therefore, to fill these gaps, the current study aims to investigate the determinants for both on-farm and off-farm adaptation practices among Indonesian farmers and estimate the intensity. We hypothesized that climate change adaptation practice and adaptation intensity would be significantly influenced by farmers’ socio-demographic profiles (i.e., education, age, and number of family members), agriculture-related factors (i.e., total area, land status, and irrigation), social capital (i.e., farmers’ groups, cooperative, climate information, and social activity), agriculture-related assets (i.e., agriculture machinery and storage), and financial capital (i.e., access to credit and public transfer).
2. Materials and Methods
2.1. Research Location, Sampling, and Data Collection
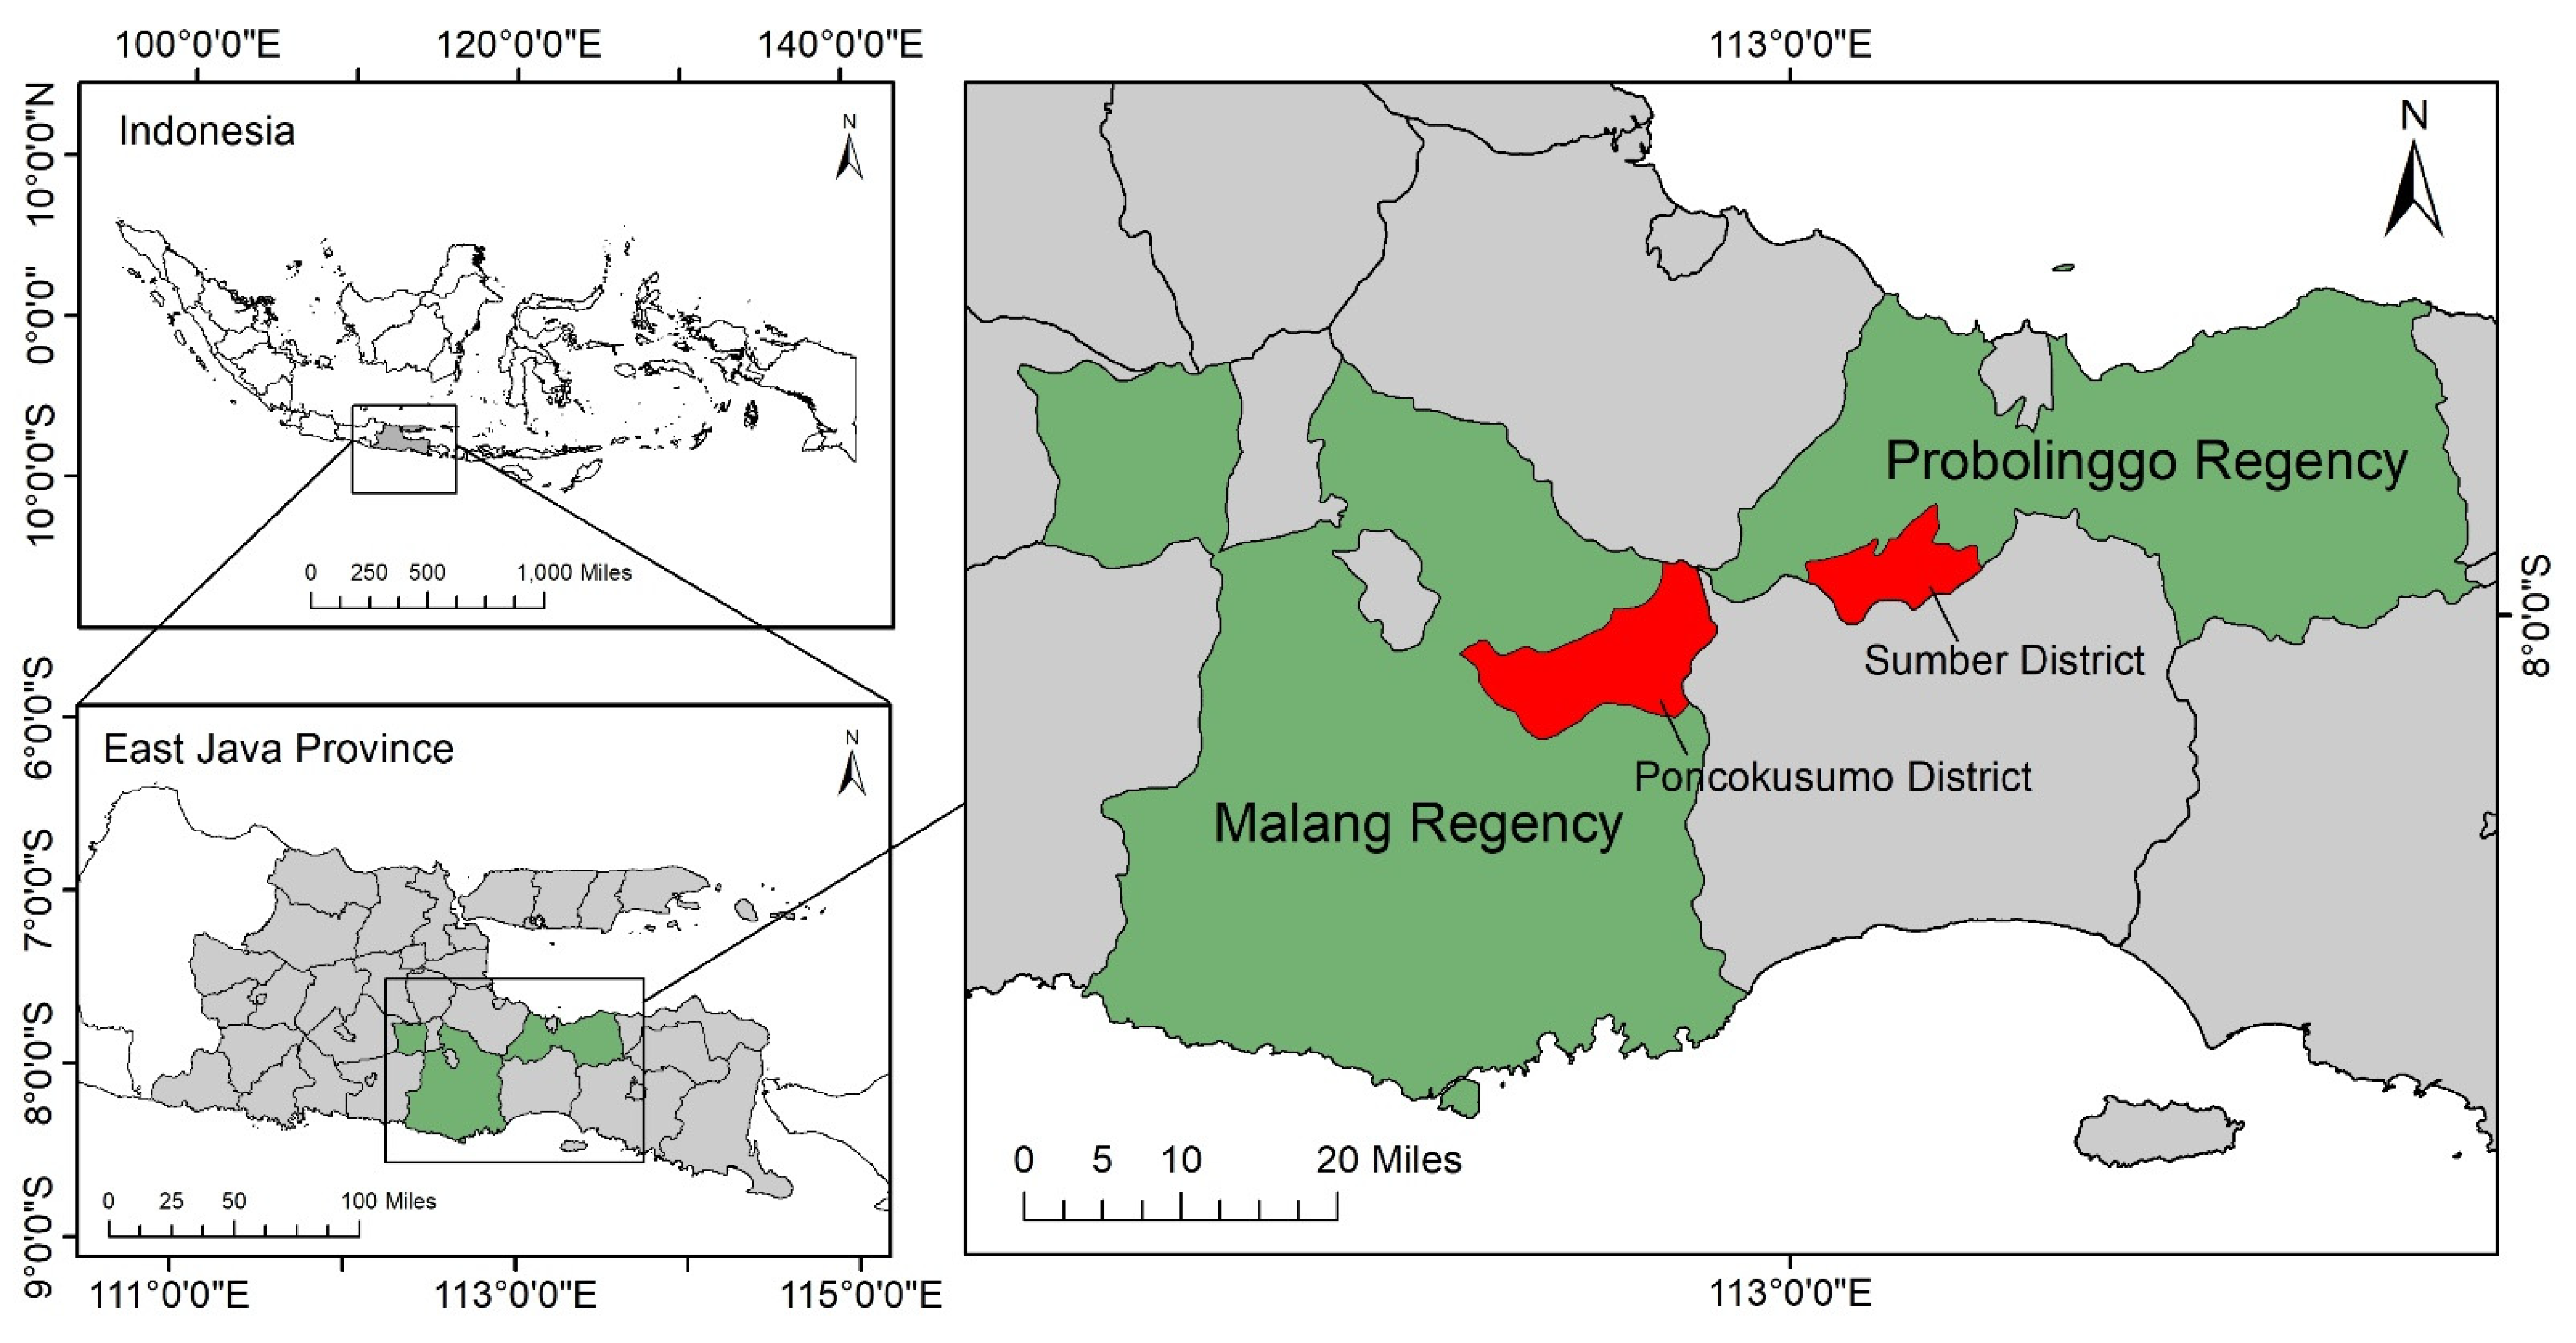
This research was conducted in East Java Province, Indonesia (Figure 1), as one of the top potato-producing locations in Indonesia. According to BPS [37], potato production reached 320,209 tons in 2019, higher than Central Java and West Java. In 2020, the total harvested areas of potato farms rose from 12,670 to 15,479 square meters; there were 6,919,467 full-time farmers with an average agricultural land of 1054.16 M2 and an average income of 1,081,298 per month [38].
Multistage random sampling was used in this study. Firstly, we selected two regencies in East Java, i.e., Malang and Probolinggo, because the two regencies were the highest horticultural producers in the province. Both are part of Bromo Tengger Semeru National Park (BTS) and have been identified as areas with the highest risks to climate change impacts. The regencies were considered as the four strategic ‘agropolitan’ areas that significantly contribute to regional economic growth. Secondly, one district with the highest number of potato producers was selected, namely, Poncokusumo for Malang and Sumber for Probolinggo. The selection was informed by the insight from the local agricultural departments. Thirdly, two villages in each district were selected. Finally, 75 to 80 farmers were chosen from each village, so the sample size was 305. However, three respondents were excluded from the analysis due to missing data, so the final number of the respondents was 302.
The survey data were collected from August to September 2021 through face-to-face interviews with a structured questionnaire. Trained enumerators conducted these. This survey was conducted during the COVID-19 pandemics. The enumerators followed the government regulation to prevent the virus outbreak. They were from local universities with relevant educational backgrounds: agriculture and socio-economics. Before the interviews, each enumerator did a mockup interview to ensure understanding and clarity, and to anticipate a potential problem.
The survey questionnaire was divided into five parts. The first part was about household profiles, i.e., the number of family members, education levels, ages, and farming experience; the second: asset ownership and agricultural-related infrastructure. The third: social capital, e.g., social networks, activities, and participation in agriculture-related institutions; the fourth: financial capital cash income activity and access to credit. The fifth: climate change. In the last part, the respondents answered a fundamental question about climate change: have you ever heard of climate change? The answer was either yes or no. If the answer is no, then the enumerator explained climate change. If the answer is yes, the respondent was asked to elaborate, and the enumerator would confirm or clarify the answer. After that, the respondent was asked about the impact of climate change on agricultural sectors and their adaptation practices.
2.2. Data Analysis
The multivariate probit model (MVP) was used to estimate the factors associated with farmers’ choices to adopt climate change adaptation practices. The MVP model included simultaneous models to allow for inter-relationships between independent and dependent variables. The decision-making choices reflected the adaptation practices as the dependent variables. Each dependent variable was a binary variable, with a value of one if the farmers decided to adopt it, and zero otherwise. These models reflected the influence of the set of explanatory variables on each option and allowed for the free correlation of error terms.
The MVP model allows for a flexible correlation structure for unobservable variables [40]. Given the explanatory variables, it was assumed that the multivariate response was an unobserved latent variable, resulting from the multivariate normal distribution. Modeling the decision-making using an MVP framework is more efficient, and the estimation is more precise in the case of simultaneous adoption [41]. Empirically, the farmer’s adaptation model can be specified as follows:
where Yij (j =1, 2, 3, …) represents the different adaptation practices by the ith farmer (I = 1, …, 302), X′ij is a 1 × k vector of observed variables that affect the adaptation practices, βj is a k × 1 vector of unknown parameters (to be estimated), and εij is the unobserved error term. The vectors were variables including education, family members, agricultural-related variables, social, natural, and financial capital.
Yij = X’ijβj + eij
Moreover, we also investigated the determinants of farmers’ adaptation intensity, using an ordered probit model. We built the adaptation intensity as an ordinal value based on the number of adaptations. For instance, 1 to 7 for on-farm adaptation and 1–4 for off-farm adaptation. Specifically, the equation can be modeled as follows:
where is a vector of adaptation intensity, including off-farm and on-farm adaptations, and is the vector of the explanatory variables, including education, family members, agricultural-related variables, social capital, natural capital, and financial capital. , is a constant , regression coefficient, and represents the error term.
3. Result and Discussion
3.1. Descriptive Statistics
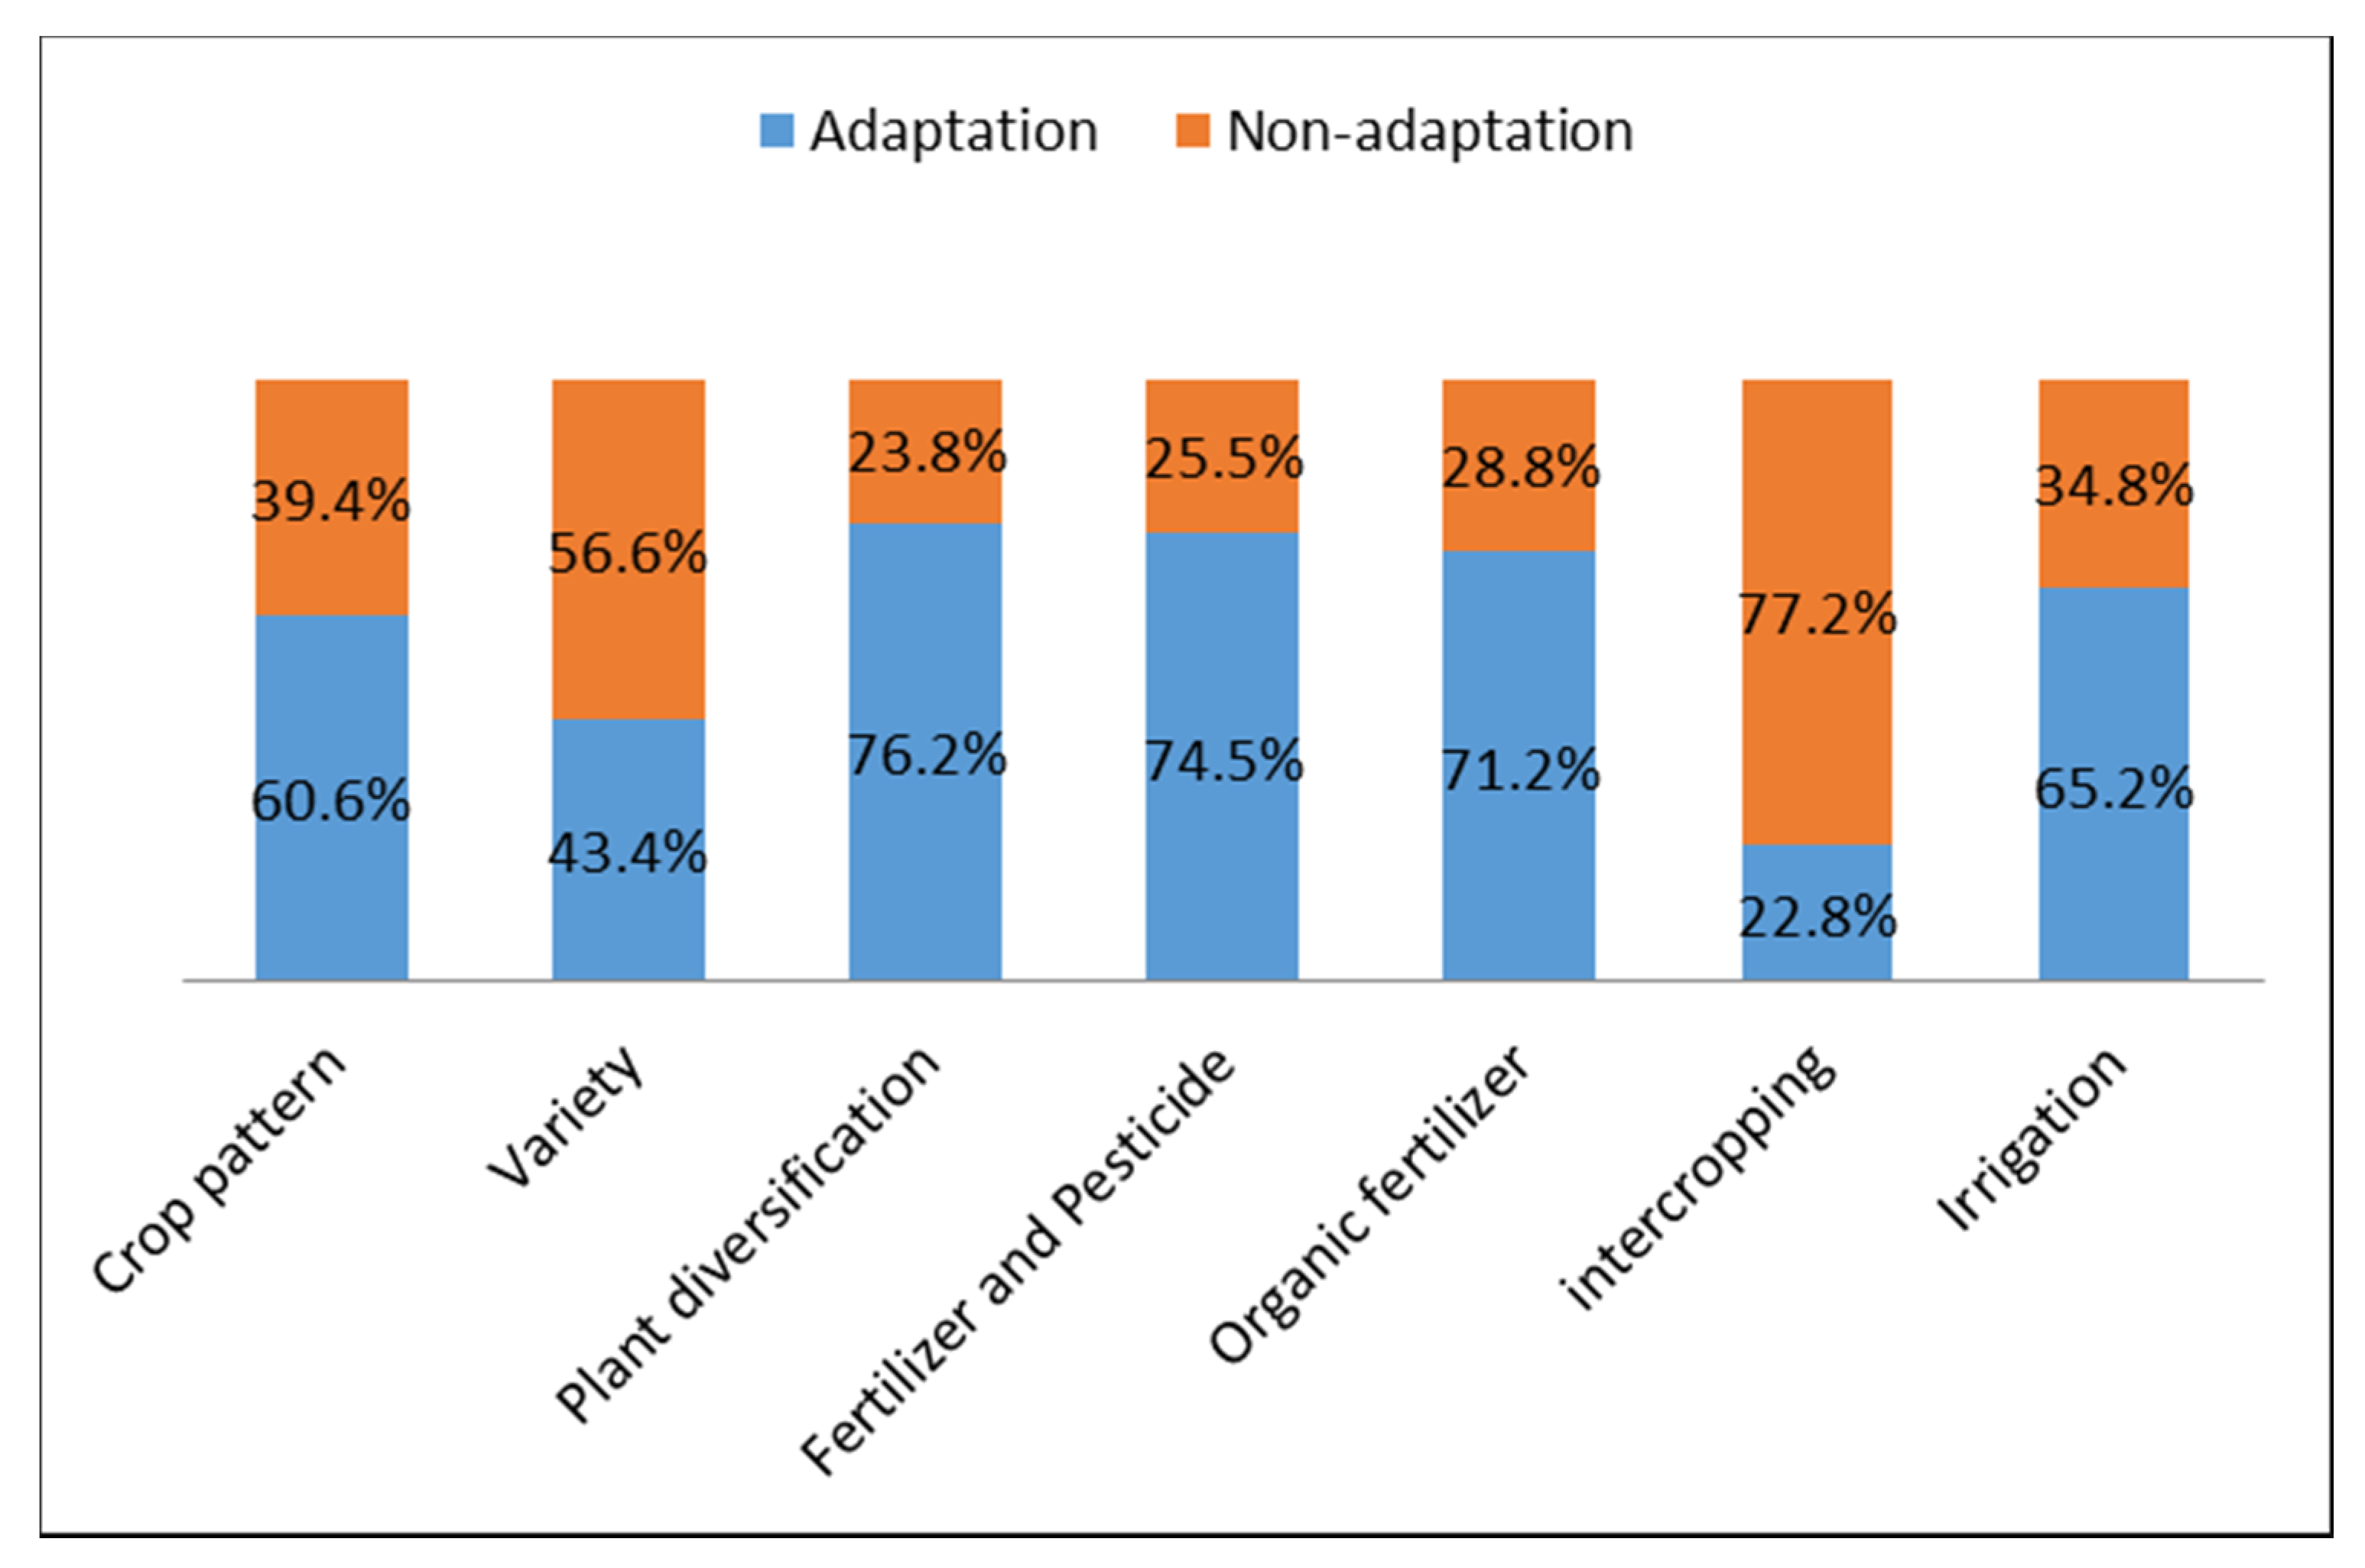
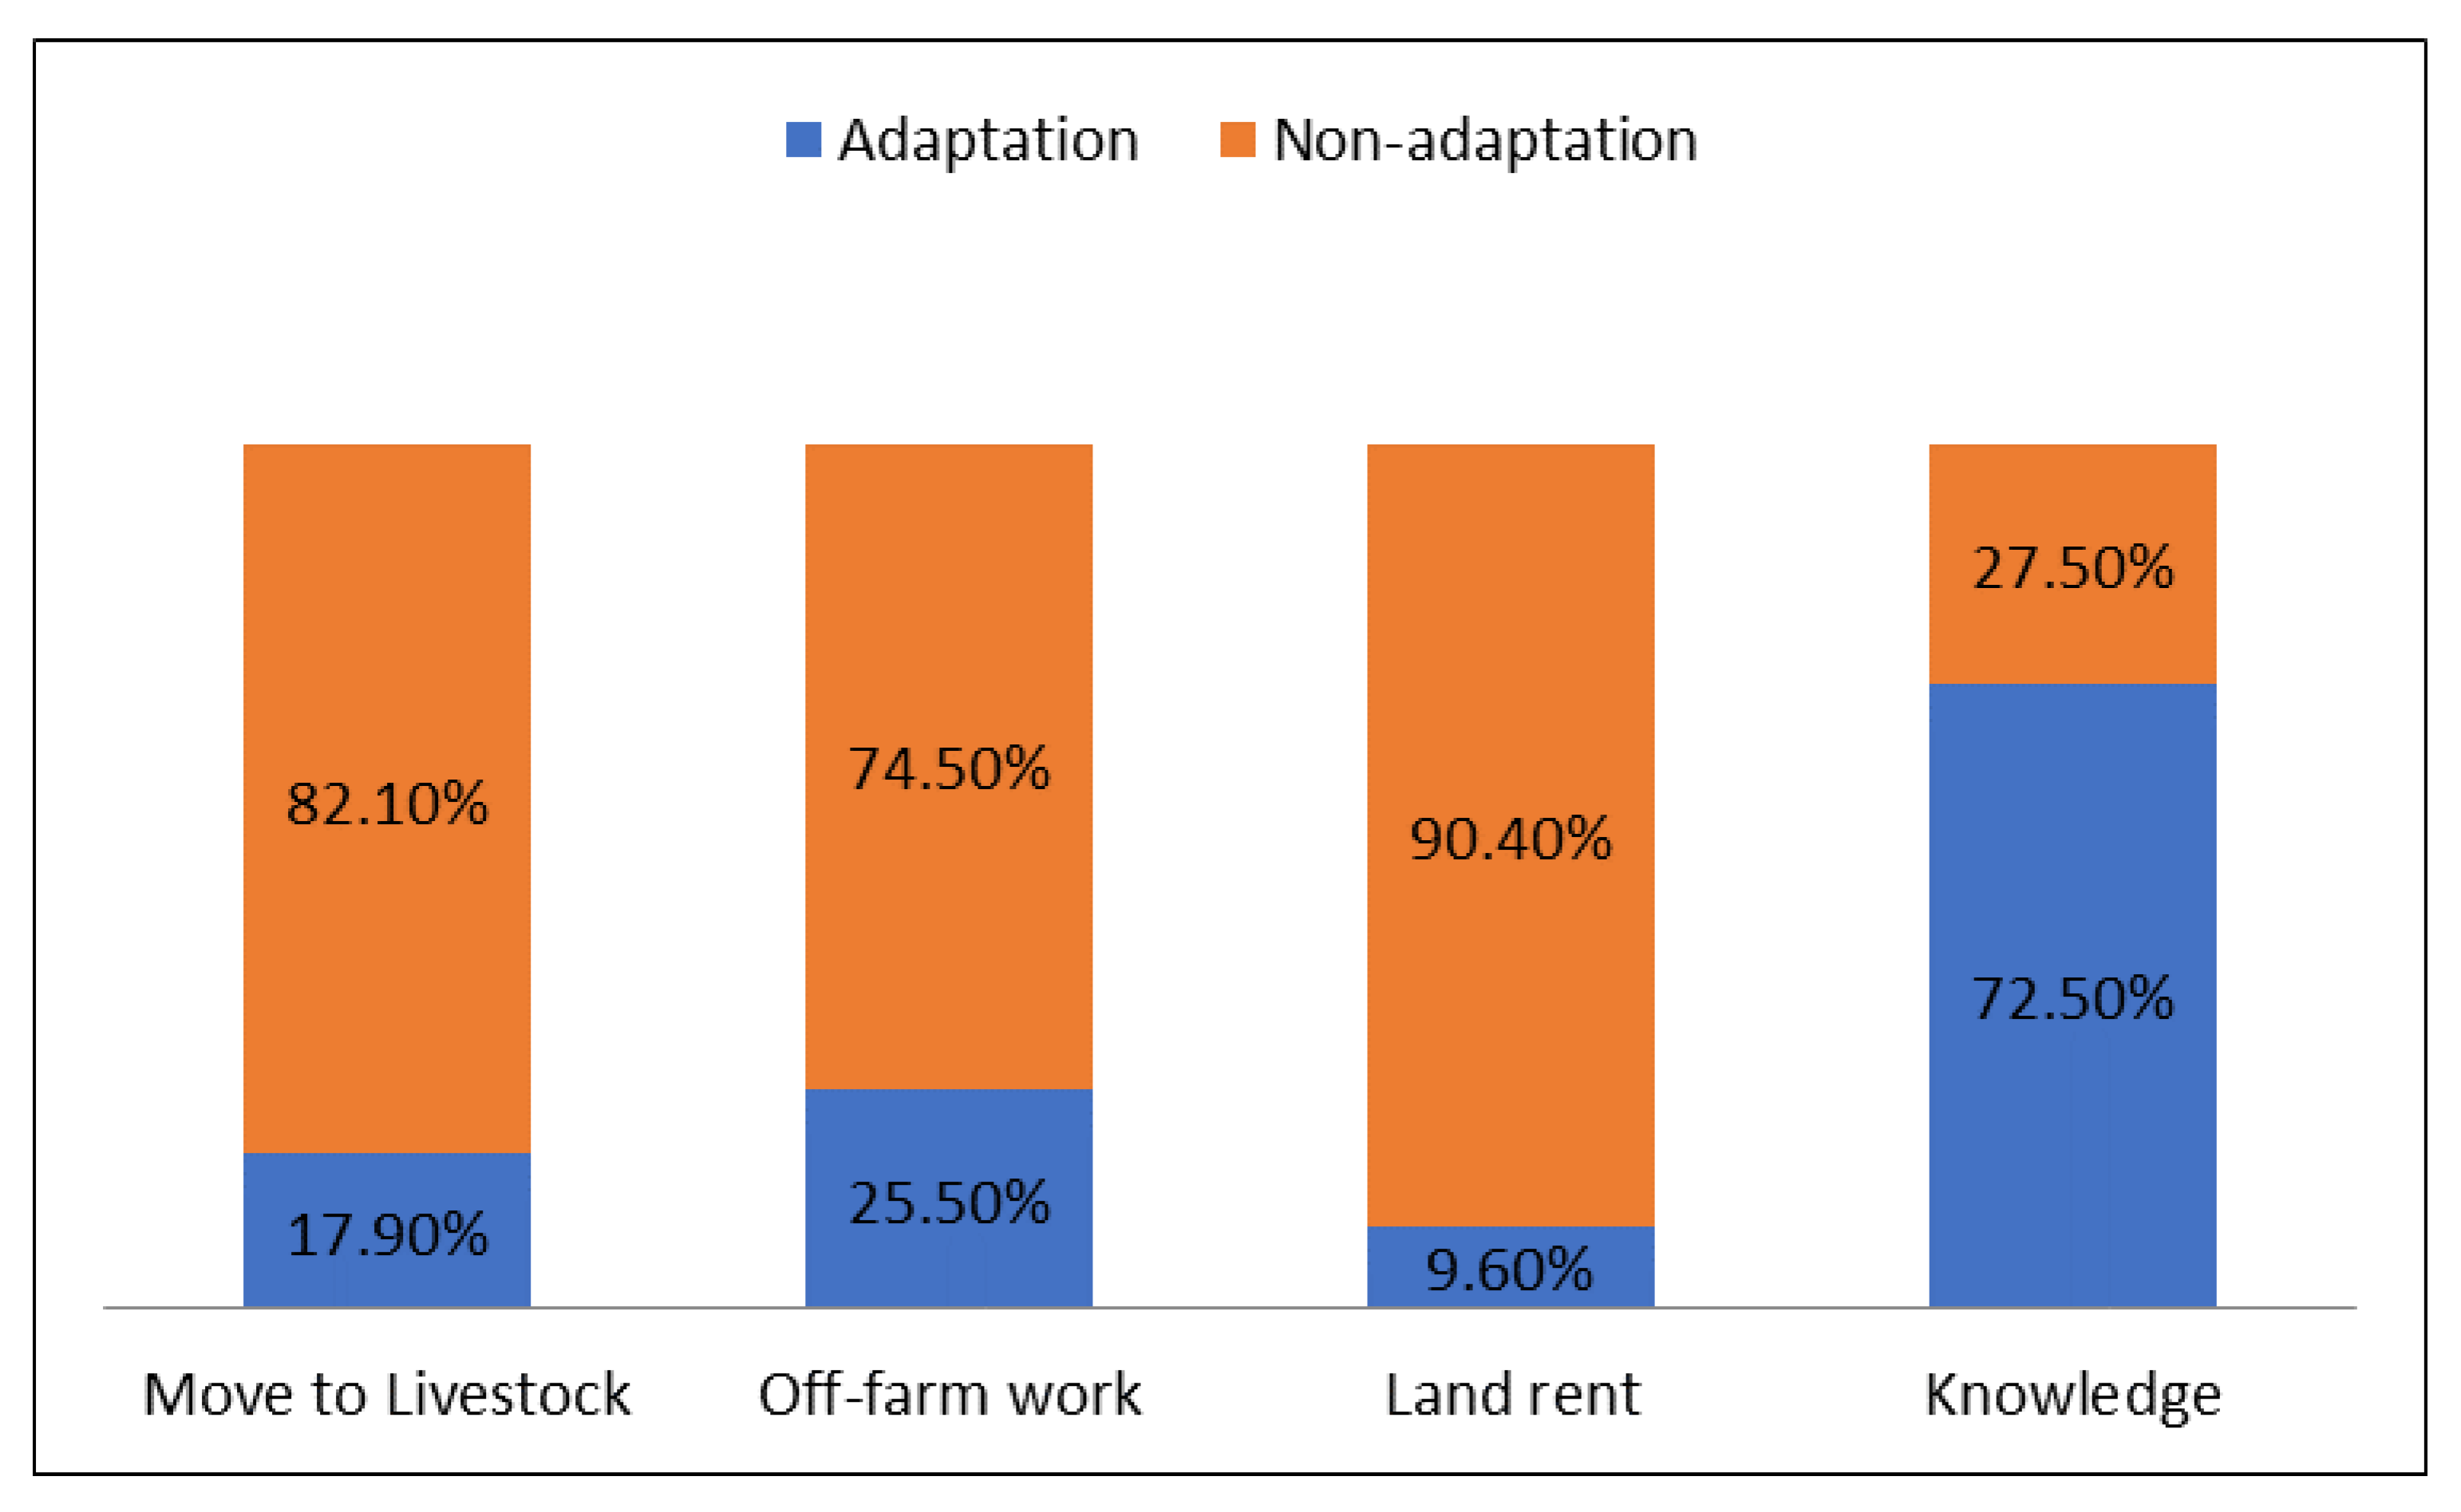
Figure 2 and Figure 3 present the percentage of on- and off-farm adaptation practices employed by the farmers. From the on-farm adaptation results, the most popular adaptation practices were plant diversification, fertilizer and pesticide use, organic fertilizer use, improved irrigation systems, and changes in crop pattern, with the values of 76%, 74%, 71%, 65%, and 61%, respectively. The result further revealed that 43% of household farmers changed the potato variety. The farmers used Granola L and Granola K varieties in the research location. It was then reported that some farmers opted for Granola K more, which is easier to cultivate and more resistant to pest and disease attacks. Only 22% of the respondents used an intercropping system. The farmers stated that potato cultivation has been performed for generations, and it was the only cultivation technique well-understood by the farmers. They were less likely to adopt crop rotation (intercropping system). The various climate-induced problems have stimulated them to improve their understanding of agriculture, including the pre-cultivation, cultivation, harvest, and post-harvest. This will assist them in mitigating the impact of climate change. A small number of farmers switched to livestock farming, took up an off-farm job, and even put their cultivated land on a lease.
After discussed adaptation practices in Figure 2 and Figure 3, we demonstrate the result of the mean and standard deviation of the selected variable in this study (Table 1). The educational level of the household head was generally low; most were primary school graduates (6 years). The highest education of the household member was junior high school (8 years) or the secondary level. Moreover, the average number of family members aged below 16 years or above 60 years old was approximately one. On the household level, there was a probability that one of the family members was an employed person aside from the household head. Based on Table 1, the average number of employed persons was between 1 and 2. The mean total area of the interviews was 1.8 ha.
Furthermore, the interview result found that most farmers had access to irrigation but limited interaction with other farmers and farmers groups. Most were landowners, and they had their irrigation machinery, but they did not have agricultural machines such as hand tractors or manure spreaders. The descriptive results also found that most farmers did not have enough access to climate information (rainfall, temperature, dry season, etc.). Only a few participated in cooperatives or were involved in social activities (such as religious groups and community events). Most were members of a farmer association.
Meanwhile, the access to agricultural infrastructure (such as roads) was good, which meant that they could securely transport their agricultural commodities. On average, they had access to credit used for potato cultivation. Lastly, few had agricultural storage and livestock, and received public transfer (such as pensions, subsidies, and remittances). The last information from Table 1 is the average potato price, which was approximately 8189 Rupiah/kg. This price was higher than those claimed by the farmers in the interviews in both regencies (Probolinggo and Malang). They stated that the average price for potato commodities was around 7000–8000 Rupiah/kg, the low price was about 6000 Rupiah/kg, and the high price was approximately 8000–10,000 Rupiah/kg or above.
3.2. Empirical Result from the Multivariate Probit Model: On-farm Adaptation Practices
The determinants of the farmers’ decisions on on-farm adaptation choices are presented in Table A1 in Appendix A. The result from the likelihood ratio of Wald chi-square was highly significant at the 1% level (p-value = 0.001). The result indicated that the variable used in this study appropriately explained the model. In addition, the likelihood ratio test showed a significant effect at 1% (p-value 0.001), indicating no correlation between the personal equation in the MVP model. Therefore, the use of the MVP model is valid in this study.
The education variable showed a negative coefficient on crop pattern, fertilizer, and pesticide adaptation practices, with a statistically significant value at 10% each, but it had a negative coefficient on intercropping. The finding indicates that education reduced farmers’ decisions to adopt crop patterns, fertilizer, and pesticide practices. It improves the probability of adopting the intercropping approach. More educated farmers have more knowledge on agriculture [42]. Therefore, in dealing with climate change, they were less likely to increase the quantity of the pesticide and fertilizer because they understand the negative impact of chemicals on the environment.
Land status coefficient positively and significantly affected the irrigation practice. If farmers owned the land, they were likely to improve the system. Compared with the rented farmland, farmers had full access to their land, so it was easier to adjust their adaptation practices, including improving the irrigation system. In the study area, the farmers improved the irrigation by building irrigation wells.
The social network positively affected farmers’ decisions to adopt the intercropping practice, suggesting that farmers connected with other farmers outside the village were more likely to apply the practice. A social network is a social capital that provides a medium to share best practices, including intercropping in the research location; intercropping is a usual practice that several farmers have employed to deal with the negative impact of climate change and improve agricultural productivity.
Cooperative membership negatively and significantly affected the farmers’ decisions to apply the crop pattern practice. Being cooperative allows farmers to receive agricultural support quickly and thereby offers higher market opportunities. However, it is essential to note that being a cooperative member means that farmers are tied in certain agreements, such as when they should cultivate the plant, how much support they get from the cooperative, etc. Farmers are less likely to change their crop patterns with such binding ties.
Participation in social activities showed a positive and significant effect on intercropping adaptation, but it negatively and significantly affected farmers’ decisions to apply the irrigation system practice. It may be the case that the information circulated among farmers was more about the intercropping practice, and less about the irrigation system practice. This is in line with the finding in a study involving Vietnamese farmers. Trinh, Rañola Jr, Camacho, and Simelton [4] summarized that intercropping is the most preferred adaptation that the local farmers apply.
Interaction in a farmers’ group has a positive coefficient and statistically significant effect on adopting crop patterns, fertilizer and pesticide, and intercropping adaptation practices. However, it has a negative coefficient with a statistically significant value of 5%. The results suggest that farmers who participate in a group are more likely to change their crop pattern, increase the use of pesticides and fertilizer, and apply the intercropping practice. Farmer groups or associations are agricultural-related institutions that provide agricultural-related technology innovation, information, and input [43,44,45]. Being a member of a farmers’ group, similar to the social networks, allows farmers to receive agricultural support, such as pesticides and fertilizer. Easy access tends to encourage more use. In the group, members may also talk about intercropping and become more motivated to try the practice.
Climate information had a positive and significant effect on crop pattern adaptation, but it significantly and positively affected pesticide, fertilizer, and irrigation adaptation practices. Farmers with access to climate information were more likely to improve their fertilizer and pesticide use, as well as their irrigation system. This is because they were more aware of the current state of the climate. For instance, if they know that the rainy season will be short, they will anticipate building irrigation infrastructure to supply the agricultural needs or improve their use of fertilizer and pesticides. According to Rahman et al. [46], climate information is an essential factor determining adaptation to climate change. It improves awareness of climate events such as temperature change and rain intensity.
Irrigation infrastructure had a positive and significant coefficient for plant diversification and organic fertilizer adoption. Irrigation infrastructure enables farmers to diversify their plants, because the water supply can be guaranteed. This guarantee could also be the reason they are more inclined to adopt organic fertilizer. When one critical success factor is settled, they can pursue the others, such as the sustainability of the fertilizer.
The agricultural machinery variable shows an exciting finding, as it significantly affects all on-farm adaptation practices, except for plant diversification. Agricultural machinery is an essential physical capital that enables farmers to manage and develop their agricultural land. In the study area, farmers rarely own farming machinery. They usually rent it at a high price, so it could be a barrier for farmers to apply adaptation practices to climate change. Making this facility more accessible could increase farmers’ adaptation capacity to climate change.
Agricultural storage had a negative coefficient, and was statistically significant at a 5% level on the adoption of intercropping practices. This is because farmers with agricultural storage tend to focus on maximizing one specific crop—potato. In this study, high potato production meant the need storage to keep their product. Therefore, having such storage reduces farmers’ probability of applying the intercropping adaptation practices.
Access to credit had a negative and significant effect on the farmers’ decisions to apply the intercropping adaptation practice. Although this means financial capital, it also means a tie. For instance, farmers should sell their specific agriculture production (i.e., potato) to the institution that provides credit for them. Therefore, the farmers’ probability of applying the intercropping practice may decline.
Livestock ownership had a positive and significant effect on plant diversification. Besides planting the main crop, farmers usually grow other produce to feed their livestock, such as Pennisetum purpureum Schaum. However, this ownership significantly and negatively affected farmers’ decision to apply the irrigation adaptation practice, probably because the livestock also need a water supply, so both priorities must be arranged wisely.
The public transfer showed a positive and significant effect on crop pattern and irrigation adaptation, suggesting that farmers who received the public transfer were more likely to change their crop pattern and improve their irrigation. The public transfer is a financial capital that can support farmers’ livelihood and agricultural-related investments. Farmers can change their crop patterns if they have the finance. They can also invest in agricultural-related infrastructure, such as irrigation improvement.
Output price coefficients showed a positive and significant effect on plant diversification and fertilizer and pesticide adaptation practices, suggesting that the higher output prices increased the farmers’ probability of applying plant diversification and improving the use of pesticides and fertilizers. When the output price increases, farmers may be motivated to improve their yields by intensifying the use of fertilizers and pesticides.
3.3. Empirical Result from the Multivariate Probit Model: Off-farm Adaptation Practices
The result from the likelihood ratio of Wald chi-square was highly significant at the 1% level (p-value = 0.001). The result indicated that the variable used in this study appropriately explained the model. In addition, the likelihood ratio test showed a significant effect at 5% (p-value 0.013), revealing no correlation between the individual equation in the MVP model. Therefore, using the MVP model in the off-farm adaptation model is valid.
The result of off-farm adaptations’ determinants is presented in Table 2. Education had a significant and positive coefficient on off-farm adaptation and a negative effect on knowledge improvement. More educated farmers were more likely to take off-farm jobs and less likely to seek knowledge improvement. Meanwhile, the dependency ratio had a positive and significant effect on livestock adaptation. This is probably because raising livestock can be done at home. Meanwhile, the dependency ratio significantly and negatively affected farmers’ decisions to take off-farm jobs, because farmers need to spend time with their families.
As for access to irrigation, it had a negative and significant coefficient on training adaptation practices. The same is true for land status, which had a negative and significant effect on livestock adaptation. Access to water and land ownership may encourage them to focus on farming activities.
Cooperative membership had a positive and significant effect on farmers’ decisions to participate in off-farm training. Being cooperative members reduces farmers’ probability of joining non-agricultural training. Involvement in social activity had a positive and significant coefficient on land leasing, probably because of the higher marketing opportunities to find a tenant. Farmer groups had a negative and significant coefficient on livestock adaptation, likely because farmer groups are agriculture-related social capital that provide crop–agriculture-related information, so farmers’ motivation to adopt livestock farming practice is low. Climate information showed a positive and significant effect on farmers’ decisions to participate in off-farm training. Having access to climate information makes farmers more aware of the risks. Therefore, improving their off-farm knowledge would be useful in maintaining their livelihoods.
An irrigation infrastructure reduces the farmers’ probability of putting their land on a lease. This is because irrigation infrastructure is a physical capital that helps agriculture productivity. With such investment, farmers are more likely to operate their land independently. Meanwhile, agricultural machinery discourages farmers’ decision to adopt livestock farming practices and land leasing, but it positively and significantly affects farmers’ decision to participate in off-farm training. Although this increases farmers’ participation in an off-farm activities, it reduces farmers’ decisions to join the actual practices, i.e., livestock and off-farm practices. When farmers have agricultural machinery, they tend to focus on agricultural productions to earn income. Agricultural-related infrastructure showed a positive and significant effect on off-farm training. Farmers with access to good agricultural road infrastructure were more likely to participate in an off-farm activities.
Access to credit had a positive coefficient and significantly affected farmers’ participation in off-farm work. This is because access to credit supports farmers’ finance if they wish to do an off-farm job. Livestock ownership showed a positive and significant effect on farmers’ decisions to adopt livestock practices, but discouraged farmers’ decisions to participate in off-farm training.
3.4. The Determinants of Adaptation Intensity
Table 3 presents the determinants of on-farm and off-farm adaptation intensity, which the ordered probit model estimated, since the adaptation intensity is an ordinal variable. Generally, the on-farm adaptation intensity was significantly affected by farmers’ groups, climate information, agriculture machinery, and the availability of agricultural roads. Still, it was negatively and significantly affected by cooperative membership. Meanwhile, the availability of farming roads, access to credit, and livestock ownership were positively and significantly affected by the off-farm adaptation intensity. It was positively and significantly affected by irrigation infrastructure.
In terms of on-farm adaptation intensity, cooperative membership had a negative and significant coefficient on farmers’ adaptation intensity. Being a cooperative member reduced farmer’s adaptation intensity, because of the binding agreements that come together with the membership, which may decrease the adaptation intensity. In contrast, the positive and significant coefficient of the farmers’ groups suggested that those who participate tend to display higher adaptation intensity. Social capital, such as participation in farmer groups, allows farmers to obtain agricultural-related information, especially for adaptation to climate change or government extension material. Agents often deliver training for farmers through the farmer group as well. This finding is in line with the previous studies by Trinh, Rañola Jr, Camacho, and Simelton [4], Amare and Simane [47], and Awazi et al. [48].
Climate information had a positive and significant coefficient at the 10% level, suggesting that the farmers increased intensity with this knowledge. Climate information meant that farmers were more aware of climate changes to effectively anticipate and deal with them. This is in line with studies by Marie et al. [49], Rahman, Toiba, and Huang [46], Bryan, Deressa, Gbetibouo, and Ringler [29], highlighting the positive influence of climate information on adaptation. Agriculture machinery and infrastructure (i.e., roads) had a positive and significant effect on adaptation intensity. They are physical capital that helps farmers in applying adaptation practices. This finding is consistent with previous research that revealed a positive association between adaptation and agricultural machinery and roads [50,51].
Secondly, the off-farm adaptation was negatively and significantly affected by irrigation infrastructure. Farmers with irrigation infrastructure were less likely to apply off-farm adaptation practices. This is because irrigation infrastructure is an investment built by the farmers on their cultivated land. Therefore, farmers’ motivation to maximize land productivity is higher than the motivation to apply the off-farm adaptation. The agricultural road had a positive and significant coefficient, increasing their off-farm adaptation intensity. Access to credit had a positive and significant effect on off-farm adaptation intensity because access to credit provides financial support. This finding is the opposite of previous studies by Ma et al. [52], Anang et al. [53], and Anang and Yeboah [54], who revealed the negative association between access to credit and off-farm adaptation practice. In the research area, usually, farmers are not only inclined to make purchases for their on-farm agricultural needs, but also for off-farm agricultural needs. Finally, livestock ownership is positive and statistically significant at 1%, increasing the chance to intensify off-farm adaptation. This finding is in line with Issahaku and Abdul-Rahaman [52], Rowhani et al. [53], and Rakshandrah [54], who pointed out the positive effect of livestock ownership on off-farm activities.
4. Conclusions
This study investigated the determinants of farmers’ climate change adaptation practices and examined the factors affecting farmers’ adaptation intensity. The climate change adaptation strategies were divided into on-farm and off-farm groups. The cross-sectional data were collected from 302 potato farmers in East Java, Indonesia, and analyzed by an MVP model to estimate the determinants of farmers’ choices on the adaptation practices. We also employed an ordered probit model to examine the factors affecting farmers’ adaptation intensity. This has not been used in previous research documented in the literature. The finding indicated that the seven major on-farm adaptation practices implemented by potato farmers in East Java are: changing crop patterns; use of the new varieties; plant diversification; improvement in fertilizer and pesticide use; adoption of organic fertilizer; intercropping; and improved irrigation systems. Meanwhile, there are four major off-farm adaptation practices: livestock farming; off-farm work; land lease; and off-farm knowledge improvement. Based on the objective of this study, we concluded two major findings. First, the MVP estimation revealed that farmers’ decisions to implement on-farm adaptations are significantly affected by education, participation in farmers’ groups, agricultural-related infrastructure, and agriculture output prices. Meanwhile, the off-farm adaptations are significantly affected by education, numbers of employed family members, agriculture-related infrastructure, and livestock ownership. Secondly, the ordered probit model suggested that participation in farmers’ groups and agriculture-related infrastructure were the most significant factors that intensified the adaptation.
Given the critical role of adaptation practices to mitigate the negative impact of climate change, farmers should apply the adaptation continuously. The government, as the policymaker, should consider the essential factors affecting farmers’ adoption, such as social capital promotion through farmer groups, social activities, and networks. Providing climate information in rural areas can also increase farmers’ awareness of climate change. Increasing the agricultural-related infrastructure, such as roads subsidizing agricultural machinery and improving credit access, can also support the adaptation.
Understanding the factors affecting farmers’ adaptation practices will increase farmers’ adaptation to climate change capacity. It will also contributes to the farmers’ regional and global food security, making improvements in agricultural productivity and food supplies.
Author Contributions
Conceptualization, methodology and validation, T.S.P., W.-C.H., and S.S.; investigation, resources, data curation, T.S.P., S.S., and M.S.; formal analysis, writing—original draft preparation, T.S.P., S.S; writing—review and editing, T.S.P., W.-C.H., and M.S.; supervision W.-C.H. All authors have read and agreed to the published version of the manuscript.
Funding
This research received no external funding.
Institutional Review Board Statement
Not applicable.
Informed Consent Statement
Not applicable.
Data Availability Statement
Data presented in this study can be requested to the correspondence author.
Conflicts of Interest
The authors declare no conflict of interest.
Appendix A

Table A1.
The determinant of on-farm adaptation practices.
| Variable | Crop Pattern | Variety | Plant Diversification | Fertilizer and Pesticide | Organic Fertilizer | Intercropping | Irrigation | |||||||
|---|---|---|---|---|---|---|---|---|---|---|---|---|---|---|
| Coef. | Std. Error | Coef. | Std. Error | Coef. | Std. Error | Coef. | Std. Error | Coef. | Std. Error | Coef. | Std. Error | Coef. | Std. Error | |
| Education | −0.104 | 0.055 * | −0.017 | 0.040 | 0.021 | 0.047 | −0.093 | 0.049 * | 0.022 | 0.040 | 0.162 | 0.061 *** | −0.036 | 0.052 |
| Family education | 0.043 | 0.046 | 0.028 | 0.037 | 0.051 | 0.045 | −0.035 | 0.043 | −0.041 | 0.038 | −0.030 | 0.046 | −0.041 | 0.044 |
| Dependency | −0.033 | 0.133 | −0.047 | 0.114 | −0.058 | 0.135 | 0.134 | 0.129 | −0.011 | 0.120 | 0.110 | 0.138 | 0.071 | 0.144 |
| Family labor | 0.059 | 0.107 | 0.042 | 0.075 | 0.054 | 0.096 | −0.090 | 0.101 | −0.059 | 0.080 | 0.019 | 0.112 | 0.185 | 0.116 |
| Total area | 0.002 | 0.066 | 0.027 | 0.047 | −0.055 | 0.062 | −0.017 | 0.054 | 0.011 | 0.045 | −0.019 | 0.067 | −0.007 | 0.061 |
| Access to irrigation | −0.016 | 0.214 | −0.204 | 0.186 | −0.121 | 0.228 | −0.130 | 0.214 | −0.002 | 0.199 | 0.130 | 0.214 | 0.272 | 0.235 |
| Land status | −0.201 | 0.234 | 0.262 | 0.204 | 0.006 | 0.247 | −0.187 | 0.243 | −0.208 | 0.219 | 0.011 | 0.248 | 0.499 | 0.236 ** |
| Social network | −0.020 | 0.597 | 0.020 | 0.484 | −0.654 | 0.590 | 0.102 | 0.703 | 0.685 | 0.606 | 1.319 | 0.521 ** | −0.369 | 0.561 |
| Cooperative | −0.991 | 0.338 *** | −0.183 | 0.303 | −0.038 | 0.326 | −0.336 | 0.367 | −0.199 | 0.302 | 0.026 | 0.338 | −0.032 | 0.396 |
| Social activity | 0.270 | 0.207 | 0.056 | 0.170 | −0.178 | 0.216 | −0.032 | 0.201 | −0.096 | 0.180 | 0.396 | 0.221 * | −0.438 | 0.216 ** |
| Farmer group | 0.619 | 0.234 *** | −0.111 | 0.184 | −0.447 | 0.218 ** | 0.756 | 0.258 *** | 0.062 | 0.193 | 0.715 | 0.241 *** | 0.244 | 0.264 |
| Climate information | −0.495 | 0.232 ** | 0.000 | 0.177 | 0.211 | 0.221 | 0.444 | 0.233 * | 0.014 | 0.189 | 0.299 | 0.228 | 0.496 | 0.250 ** |
| Irrigation infrastructure | 0.096 | 0.242 | −0.247 | 0.191 | 0.407 | 0.228 * | 0.286 | 0.234 | 0.691 | 0.196 *** | −0.336 | 0.255 | 0.381 | 0.244 |
| Agriculture machinery | 1.190 | 0.204 *** | 0.627 | 0.131 *** | −0.086 | 0.128 | 0.366 | 0.177 ** | −0.359 | 0.113 *** | −1.011 | 0.215 *** | 0.793 | 0.207 *** |
| Agriculture road | 1.124 | 0.392 *** | 0.380 | 0.335 | 1.432 | 0.375 *** | 1.637 | 0.365 *** | −0.434 | 0.326 | −1.179 | 0.356 *** | 2.462 | 0.648 *** |
| Storage | 0.354 | 0.260 | −0.108 | 0.194 | 0.223 | 0.229 | 0.060 | 0.259 | 0.282 | 0.201 | −0.620 | 0.278 ** | 0.027 | 0.290 |
| Access to credit | 0.150 | 0.214 | −0.037 | 0.176 | 0.044 | 0.216 | 0.064 | 0.208 | −0.222 | 0.185 | −0.626 | 0.223 *** | 0.116 | 0.219 |
| Livestock ownership | 0.094 | 0.096 | 0.023 | 0.082 | 1.057 | 0.578 *** | 0.013 | 0.099 | −0.053 | 0.094 | −0.007 | 0.114 | −0.499 | 0.142 *** |
| Public transfer | 0.865 | 0.410 ** | −0.318 | 0.257 | 0.041 | 0.306 | 0.632 | 0.403 | 0.018 | 0.258 | −0.636 | 0.456 | 1.343 | 0.641 ** |
| Output prices | 0.000 | 0.000 | 0.000 | 0.000 | 0.000 | 0.000 *** | 0.000 | 0.000 *** | 0.000 | 0.000 | 0.000 | 0.000 | 0.000 | 0.000 |
| Constant | −2.175 | 1.003 | −0.982 | 0.843 | 1.480 | 1.129 | −2.455 | 0.972 | 1.792 | 0.934 | −0.025 | 1.004 | −2.150 | 1.172 |
| Log-likelihood | −912.722 | Likelihood ratio test = 0 | ||||||||||||
| Wald chi2(140) | 354.820 | Number of obs = 302 | ||||||||||||
| Prob > chi2 | 0.000 | |||||||||||||
Note: *, **, *** denote significance on 10%, 5%, and 1% respectively.
References
- Sabbaghi, M.A.; Nazari, M.; Araghinejad, S.; Soufizadeh, S. Economic impacts of climate change on water resources and agriculture in Zayandehroud river basin in Iran. Agric. Water Manag. 2020, 241, 106323. [Google Scholar] [CrossRef]
- Sivakumar, M. Operational agrometeorological strategies in different regions of the world. Chall. Oppor. Agrometeorol. 2011, 11, 551–571. [Google Scholar] [CrossRef]
- Smit, B.; Skinner, M.W. Adaptation options in agriculture to climate change: A typology. Mitig. Adapt. Strateg. Glob. Change 2002, 7, 85–114. [Google Scholar] [CrossRef]
- Trinh, T.Q.; Rañola Jr, R.F.; Camacho, L.D.; Simelton, E. Determinants of farmers’ adaptation to climate change in agricultural production in the central region of Vietnam. Land Use Policy 2018, 70, 224–231. [Google Scholar] [CrossRef]
- Di Falco, S.; Yesuf, M.; Kohlin, G.; Ringler, C. Estimating the impact of climate change on agriculture in low-income countries: Household level evidence from the Nile Basin, Ethiopia. Environ. Resour. Econ. 2012, 52, 457–478. [Google Scholar] [CrossRef]
- Mendelsohn, R. The impact of climate change on agriculture in developing countries. J. Nat. Resour. Policy Res. 2008, 1, 5–19. [Google Scholar] [CrossRef] [Green Version]
- Molua, E.L. The economic impact of climate change on agriculture in Cameroon. World Bank Policy Res. Work. Pap. 2007, 4364, 4–31. Available online: https://papers.ssrn.com/sol3/papers.cfm?abstract_id=1016260 (accessed on 3 July 2021).
- Ebert, A.W. Vegetable production, diseases, and climate change. In World Agricultural Resources and Food Security; Emerald Publishing Limited: Bingley, UK, 2017. [Google Scholar]
- Prasad, B.; Chakravorty, S. Effects of Climate Change on Vegetable Cultivation—A Review. Nat. Environ. Pollut. Technol. 2015, 14, 923–929. [Google Scholar]
- Lemi, T.; Hailu, F. Effects of climate change variability on agricultural productivity. Int. J. Environ. Sci. Nat. Resour. 2019, 17, 14–20. [Google Scholar] [CrossRef]
- Tito, R.; Vasconcelos, H.L.; Feeley, K.J. Global climate change increases risk of crop yield losses and food insecurity in the tropical Andes. Glob. Change Biol. 2018, 24, e592–e602. [Google Scholar] [CrossRef]
- Raymundo, R.; Asseng, S.; Robertson, R.; Petsakos, A.; Hoogenboom, G.; Quiroz, R.; Hareau, G.; Wolf, J. Climate change impact on global potato production. Eur. J. Agron. 2018, 100, 87–98. [Google Scholar] [CrossRef]
- Devaux, A.; Kromann, P.; Ortiz, O. Potatoes for sustainable global food security. Potato Res. 2014, 57, 185–199. [Google Scholar] [CrossRef]
- CIP. Why Are Potatoes Important? International Potato Center: Lima, Peru, 2017. [Google Scholar]
- FAO. OECD-FAO Agricultural Outlook 2021–2030; Food Agriculture Organization: Rome, Italy, 2021. [Google Scholar]
- Ezeta, F.; Papademetriou, M. An Overview of Potato Produciton in Asia and the Pacific Region: Markets, Development and Constraints. 2008. Available online: ftp://ftp.fao.org/docrep/fao/010/i0200e/i0200e00.pdf (accessed on 3 February 2021).
- Taylor, A.S.; Dawson, P. Major Constraints to Potato Production in Indonesia: A Review. Am. J. Potato Res. 2021, 98, 171–186. [Google Scholar] [CrossRef]
- Kuswanto, H.; Hibatullah, F.; Soedjono, E.S. Perception of weather and seasonal drought forecasts and its impact on livelihood in East Nusa Tenggara, Indonesia. Heliyon 2019, 5, e02360. [Google Scholar] [CrossRef] [PubMed] [Green Version]
- Measey, M. Indonesia: A vulnerable country in the face of climate change. Glob. Major. E-J. 2010, 1, 31–45. [Google Scholar]
- Supriyanto, E.; Wasito, E.; Hasan, A.; Ernanda, D.; Balqis, K. Design of a Water Sprinkler System and Monitoring of Soil Moisture in Potato Cultivation of the Kledung Horticulture Seed Center based on the Internet of Things (IoT). JAICT 2020, 5, 20–25. [Google Scholar]
- Setiyanto, A.; Pasaribu, S. Predicting the impacts of climate change on Indonesia’s five main horticulture commodities. In IOP Conference Series: Earth and Environmental Science; IOP Publishing: Bristol, UK, 2021; p. 012009. [Google Scholar]
- Di Falco, S.; Veronesi, M.; Yesuf, M. Does adaptation to climate change provide food security? A micro-perspective from Ethiopia. Am. J. Agric. Econ. 2011, 93, 829–846. [Google Scholar] [CrossRef] [Green Version]
- IPCC. The Physical Science Basis. 2007. Available online: https://www.ipcc.ch/report/ar4/wg1/ (accessed on 3 July 2021).
- Gifford, R. The dragons of inaction: Psychological barriers that limit climate change mitigation and adaptation. Am. Psychol. 2011, 66, 290. [Google Scholar] [CrossRef] [PubMed]
- Khanal, U.; Wilson, C.; Hoang, V.-N.; Lee, B. Farmers’ adaptation to climate change, its determinants and impacts on rice yield in Nepal. Ecol. Econ. 2018, 144, 139–147. [Google Scholar] [CrossRef]
- Ahmad, D.; Afzal, M. Climate change adaptation impact on cash crop productivity and income in Punjab province of Pakistan. Environ. Sci. Pollut. Res. 2020, 27, 30767–30777. [Google Scholar] [CrossRef]
- Mottaleb, K.A.; Rejesus, R.M.; Murty, M.; Mohanty, S.; Li, T. Benefits of the development and dissemination of climate-smart rice: Ex ante impact assessment of drought-tolerant rice in South Asia. Mitig. Adapt. Strateg. Glob. Change 2017, 22, 879–901. [Google Scholar] [CrossRef]
- Fadina, A.M.R.; Barjolle, D. Farmers’ adaptation strategies to climate change and their implications in the Zou Department of South Benin. Environments 2018, 5, 15. [Google Scholar] [CrossRef] [Green Version]
- Bryan, E.; Deressa, T.T.; Gbetibouo, G.A.; Ringler, C. Adaptation to climate change in Ethiopia and South Africa: Options and constraints. Environ. Sci. Policy 2009, 12, 413–426. [Google Scholar] [CrossRef]
- Alemayehu, A.; Bewket, W. Smallholder farmers’ coping and adaptation strategies to climate change and variability in the central highlands of Ethiopia. Local Environ. 2017, 22, 825–839. [Google Scholar] [CrossRef]
- Arunrat, N.; Wang, C.; Pumijumnong, N.; Sereenonchai, S.; Cai, W. Farmers’ intention and decision to adapt to climate change: A case study in the Yom and Nan basins, Phichit province of Thailand. J. Clean. Prod. 2017, 143, 672–685. [Google Scholar] [CrossRef]
- Kuang, F.; Jin, J.; He, R.; Wan, X.; Ning, J. Influence of livelihood capital on adaptation strategies: Evidence from rural households in Wushen Banner, China. Land Use Policy 2019, 89, 104228. [Google Scholar] [CrossRef]
- Wu, W.; Ma, B.-L. Assessment of canola crop lodging under elevated temperatures for adaptation to climate change. Agric. For. Meteorol. 2018, 248, 329–338. [Google Scholar] [CrossRef]
- Harvey, C.A.; Saborio-Rodríguez, M.; Martinez-Rodríguez, M.R.; Viguera, B.; Chain-Guadarrama, A.; Vignola, R.; Alpizar, F. Climate change impacts and adaptation among smallholder farmers in Central America. Agric. Food Secur. 2018, 7, 57. [Google Scholar] [CrossRef]
- Ojo, T.; Baiyegunhi, L. Determinants of climate change adaptation strategies and its impact on the net farm income of rice farmers in south-west Nigeria. Land Use Policy 2020, 95, 103946. [Google Scholar] [CrossRef]
- Arun Yeo, J.-H. Perception to Adaptation of Climate Change in Nepal: An Empirical Analysis Using Multivariate Probit Model. Sci 2020, 2, 87. [Google Scholar]
- BPS. Potato Production by Province, Years 2015–2019; Central Bureau of Statistics: Jakarta, Indonesia, 2020.
- BPS. East Java Province in Figures 2021; Statistics Indonesia: Jakarta, Indonesia, 2021.
- GeoSIS. Indonesian SHP Data. Available online: https://geosis.id/blog/data-shp-seluruh-indonesia/ (accessed on 3 October 2021).
- Becker, H.; Loder, A.; Schmid, B.; Axhausen, K.W. Modeling car-sharing membership as a mobility tool: A multivariate Probit approach with latent variables. Travel Behav. Soc. 2017, 8, 26–36. [Google Scholar] [CrossRef] [Green Version]
- Mittal, S.; Mehar, M. Socio-economic factors affecting adoption of modern information and communication technology by farmers in India: Analysis using multivariate probit model. J. Agric. Educ. Ext. 2016, 22, 199–212. [Google Scholar] [CrossRef]
- Raza, M.H.; Abid, M.; Yan, T.; Naqvi, S.A.A.; Akhtar, S.; Faisal, M. Understanding farmers’ intentions to adopt sustainable crop residue management practices: A structural equation modeling approach. J. Clean. Prod. 2019, 227, 613–623. [Google Scholar] [CrossRef]
- Abdul-Rahaman, A.; Abdulai, A. Do farmer groups impact farm yield and efficiency of smallholder farmers? Evidence from rice farmers in northern Ghana. Food Policy 2018, 81, 95–105. [Google Scholar] [CrossRef]
- Bellemare, M.F.; Novak, L. Contract farming and food security. Am. J. Agric. Econ. 2017, 99, 357–378. [Google Scholar] [CrossRef]
- Henderson, H.; Isaac, A.G. Modern value chains and the organization of agrarian production. Am. J. Agric. Econ. 2017, 99, 379–400. [Google Scholar] [CrossRef]
- Rahman, M.; Toiba, H.; Huang, W.-C. The impact of climate change adaptation strategies on income and food security: Empirical evidence from small-scale fishers in Indonesia. Sustainability 2021, 13, 7905. [Google Scholar] [CrossRef]
- Amare, A.; Simane, B. Determinants of smallholder farmers’ decision to adopt adaptation options to climate change and variability in the Muger Sub basin of the Upper Blue Nile basin of Ethiopia. Agric. Food Secur. 2017, 6, 64. [Google Scholar] [CrossRef] [Green Version]
- Awazi, N.P.; Tchamba, M.N.; Avana, T.M.-L. Climate change resiliency choices of small-scale farmers in Cameroon: Determinants and policy implications. J. Environ. Manag. 2019, 250, 109560. [Google Scholar] [CrossRef]
- Marie, M.; Yirga, F.; Haile, M.; Tquabo, F. Farmers’ choices and factors affecting adoption of climate change adaptation strategies: Evidence from northwestern Ethiopia. Heliyon 2020, 6, e03867. [Google Scholar] [CrossRef]
- Islam, M.M.; Barman, A.; Kundu, G.K.; Kabir, M.A.; Paul, B. Vulnerability of inland and coastal aquaculture to climate change: Evidence from a developing country. Aquac. Fish. 2019, 4, 183–189. [Google Scholar] [CrossRef]
- Rolnick, D.; Donti, P.L.; Kaack, L.H.; Kochanski, K.; Lacoste, A.; Sankaran, K.; Ross, A.S.; Milojevic-Dupont, N.; Jaques, N.; Waldman-Brown, A. Tackling climate change with machine learning. arXiv 2019, arXiv:1906.05433. [Google Scholar]
- Ma, W.; Zhou, X.; Renwick, A. Impact of off-farm income on household energy expenditures in China: Implications for rural energy transition. Energy Policy 2019, 127, 248–258. [Google Scholar] [CrossRef]
- Anang, B.T.; Nkrumah-Ennin, K.; Nyaaba, J.A. Does off-farm work improve farm income? Empirical evidence from Tolon district in northern Ghana. Adv. Agric. 2020, 2020, 1406594. [Google Scholar] [CrossRef]
- Anang, B.T.; Yeboah, R.W. Determinants of off-farm income among smallholder rice farmers in Northern Ghana: Application of a double-hurdle model. Adv. Agric. 2019, 2019, 7246176. [Google Scholar] [CrossRef] [Green Version]
Figure 1.
Selected location of study. Source: GeoSIS [39].
Figure 1.
Selected location of study. Source: GeoSIS [39].

Figure 2.
On-farm adaptation practices.

Figure 3.
Off-farm adaptation practices.

Table 1.
Descriptive statistics and measurement of study variables.
| Variable | Measurement | Mean | Std. Dev. |
|---|---|---|---|
| On-farm adaptation intensity | Number of on-farm adaptation (1–7) | 4.139 | 1.327 |
| Off-farm adaptation intensity | Number of off-farm adaptation (1–4) | 1.255 | 0.834 |
| Education | Farmers’ education level (years) | 6.235 | 2.413 |
| Family education | Higher education level of family members | 8.000 | 2.668 |
| Dependency | Number of family members aged higher than 65 years old and lower than 16 years old | 0.742 | 0.742 |
| Employed family member | Number of employed family members (Person) | 1.606 | 1.198 |
| Total area | Total cultivated area (Ha) | 1.834 | 1.955 |
| Access to irrigation | Dummy, 1 if the farmers had to do natural irrigation; 0 otherwise | 0.656 | 0.476 |
| Land status | Dummy, 1 if owning land; 0 otherwise | 0.722 | 0.449 |
| Social network | Dummy, 1 if the farmers interacted with other farmers; 0 otherwise | 0.030 | 0.170 |
| Cooperative | Dummy, 1 if the farmers participated in cooperative membership; 0 otherwise | 0.096 | 0.295 |
| Social activity | Dummy, 1 if the farmers participated in farmers group; 0 otherwise | 0.666 | 0.473 |
| Farmer group | Dummy, 1 if the farmers participated in a social activity; 0 otherwise | 0.301 | 0.460 |
| Climate information | Dummy, 1 if the farmers had climate information access; 0 otherwise | 0.351 | 0.478 |
| Irrigation Infrastructure | Dummy, 1 if the farmers had irrigation infrastructure; 0 otherwise | 0.579 | 0.494 |
| Agriculture machinery | Numbers of agriculture machinery owned by farmers (units) | 0.709 | 0.828 |
| Agriculture road | Dummy, 1 if the farmers had access to agricultural road infrastructure; 0 otherwise | 0.917 | 0.276 |
| Storage | Dummy, 1 if the farmers had agricultural storage; 0 otherwise | 0.308 | 0.462 |
| Access to credit | Dummy, 1 if the farmers had access to credit; 0 otherwise | 0.566 | 0.496 |
| Livestock ownership | Number of livestock owned by the farmers | 0.245 | 0.900 |
| Public transfer | Dummy, 1 if the farmers received public transfer; 0 otherwise | 0.109 | 0.312 |
| Output prices | Agricultural output price (Rupiah/Kg) | 8189.404 | 1149.471 |
Table 2.
The determinant of off-farm adaptation practices.
| Variables | Livestock | Off-Farm Work | Land Rent | Training | ||||
|---|---|---|---|---|---|---|---|---|
| Coef. | Std. Error | Coef. | Std. Error | Coef. | Std. Error | Coef. | Std. Error | |
| Education | 0.000 | 0.051 | 0.143 | 0.047 *** | 0.038 | 0.054 | −0.125 | 0.058 ** |
| Family education | −0.003 | 0.047 | 0.033 | 0.041 | 0.001 | 0.055 | 0.019 | 0.046 |
| Dependency | −0.246 | 0.152 | −0.269 | 0.133 ** | 0.092 | 0.161 | 0.160 | 0.157 |
| Employed family member | 0.220 | 0.105 *** | 0.134 | 0.092 | 0.209 | 0.104 ** | −0.161 | 0.108 |
| Total area | −0.048 | 0.066 | −0.026 | 0.057 | −0.035 | 0.075 | 0.055 | 0.087 |
| Access to irrigation | 0.103 | 0.252 | 0.134 | 0.206 | 0.170 | 0.300 | −0.424 | 0.237 * |
| Land status | −0.414 | 0.243 * | −0.109 | 0.225 | −0.058 | 0.309 | 0.176 | 0.251 |
| Social network | 0.371 | 0.550 | 0.357 | 0.495 | −3.743 | 306.898 | 0.027 | 0.579 |
| Cooperative | −0.077 | 0.419 | 0.182 | 0.331 | −0.733 | 0.536 | −0.925 | 0.400 ** |
| Social activity | −0.030 | 0.219 | 0.081 | 0.191 | 0.485 | 0.268 * | −0.308 | 0.226 |
| Farmer group | −0.737 | 0.285 ** | −0.090 | 0.211 | −0.003 | 0.296 | 0.385 | 0.263 |
| Climate information | 0.320 | 0.242 | −0.132 | 0.207 | 0.027 | 0.259 | 0.706 | 0.248 *** |
| Irrigation infrastructure | −0.367 | 0.254 | −0.132 | 0.216 | −0.970 | 0.306 *** | −0.154 | 0.257 |
| Agriculture machinery | −0.323 | 0.195 * | −0.525 | 0.174 *** | 0.038 | 0.152 | 1.099 | 0.224 *** |
| Agriculture road | 4.506 | 118.916 | 0.654 | 0.412 | −0.123 | 0.451 | 3.018 | 0.593 *** |
| Storage | −0.090 | 0.282 | −0.323 | 0.243 | −0.006 | 0.271 | −0.206 | 0.299 |
| Access to credit | 0.099 | 0.227 | 0.484 | 0.202 ** | 0.111 | 0.257 | −0.034 | 0.228 |
| Livestock ownership | 0.350 | 0.085 *** | 0.140 | 0.094 | −0.041 | 0.194 | −0.198 | 0.112 ** |
| Public transfer | −0.395 | 0.394 | −0.017 | 0.331 | 0.354 | 0.326 | −0.456 | 0.394 |
| Output prices | 0.000 | 0.000 | 0.000 | 0.000 | 0.000 | 0.000 | 0.000 | 0.000 |
| Constant | −4.255 | 118.919 | −1.741 | 0.964 | −0.712 | 1.224 | −2.060 | 1.158 |
| Log-likelihood | −437.424 | |||||||
| Wald chi2(140) | 178.040 | |||||||
| Prob > chi2 | 0.000 | |||||||
| Number of obs | 302 | |||||||
| Likelihood ratio test | 0.013 | |||||||
Note: *, **, *** denote significance on 10%, 5%, and 1% respectively.
Table 3.
The determinant of adaptation intensity.
| Variable | On-Farm Adaptation | On-Farm Adaptation | ||
|---|---|---|---|---|
| Coef. | Std. Error | Coef. | Std. Error | |
| Education | −0.015 | 0.032 | 0.025 | 0.035 |
| Family education | −0.010 | 0.029 | 0.034 | 0.032 |
| Dependency | 0.029 | 0.089 | −0.100 | 0.099 |
| Employed family member | 0.069 | 0.061 | 0.106 | 0.066 |
| Total area | 0.003 | 0.035 | −0.020 | 0.040 |
| Access to irrigation | 0.020 | 0.145 | 0.012 | 0.161 |
| Land status | 0.099 | 0.162 | −0.110 | 0.178 |
| Social network | 0.347 | 0.407 | 0.266 | 0.419 |
| Cooperative | −0.528 | 0.245 ** | −0.486 | 0.277 |
| Social activity | −0.008 | 0.134 | −0.010 | 0.148 |
| Farmers’ group | 0.394 | 0.150 *** | −0.121 | 0.164 |
| Climate information | 0.244 | 0.144 * | 0.279 | 0.157 |
| Irrigation infrastructure | 0.210 | 0.154 | −0.423 | 0.169 ** |
| Agriculture machinery | 0.362 | 0.093 *** | 0.023 | 0.100 |
| Agriculture road | 1.382 | 0.269 *** | 2.152 | 0.336 *** |
| Storage | 0.072 | 0.156 | −0.269 | 0.174 |
| Access to credit | −0.143 | 0.141 | 0.284 | 0.155 * |
| Livestock ownership | −0.025 | 0.070 | 0.161 | 0.077 *** |
| Public transfer | 0.071 | 0.207 | −0.114 | 0.231 |
| Output prices | 0.000 | 0.000 | 0.000 | 0.000 |
| Cut 1 | −1.871 | 0.744 | 0.074 | 0.740 |
| Cut 2 | −0.617 | 0.668 | 2.181 | 0.747 |
| Cut 3 | 0.141 | 0.667 | 3.036 | 0.751 |
| Cut 4 | 0.913 | 0.672 | 3.915 | 0.769 |
| Cut 5 | 1.756 | 0.675 | ||
| Cut 6 | 2.894 | 0.679 | ||
| Cut 7 | 4.756 | 0.760 | ||
| Log-likelihood | −441.049 | −298.081 | ||
| LR chi2(20) | 113.640 | 97.090 | ||
| Prob > chi2 | 0.000 | 0.000 | ||
| Pseudo R2 | 0.114 | 0.140 | ||
| Number of obs | 302 | |||
Note: *, **, *** denote significance on 10%, 5%, and 1% respectively.
Publisher’s Note: MDPI stays neutral with regard to jurisdictional claims in published maps and institutional affiliations. |
© 2022 by the authors. Licensee MDPI, Basel, Switzerland. This article is an open access article distributed under the terms and conditions of the Creative Commons Attribution (CC BY) license (https://creativecommons.org/licenses/by/4.0/).
Share and Cite
MDPI and ACS Style
Purwanti, T.S.; Syafrial, S.; Huang, W.-C.; Saeri, M. What Drives Climate Change Adaptation Practices in Smallholder Farmers? Evidence from Potato Farmers in Indonesia. Atmosphere 2022, 13, 113. https://doi.org/10.3390/atmos13010113
AMA Style
Purwanti TS, Syafrial S, Huang W-C, Saeri M. What Drives Climate Change Adaptation Practices in Smallholder Farmers? Evidence from Potato Farmers in Indonesia. Atmosphere. 2022; 13(1):113. https://doi.org/10.3390/atmos13010113
Chicago/Turabian StylePurwanti, Tina Sri, Syafrial Syafrial, Wen-Chi Huang, and Mohammad Saeri. 2022. "What Drives Climate Change Adaptation Practices in Smallholder Farmers? Evidence from Potato Farmers in Indonesia" Atmosphere 13, no. 1: 113. https://doi.org/10.3390/atmos13010113
Note that from the first issue of 2016, this journal uses article numbers instead of page numbers. See further details here.