Article

Analysis of Spatiotemporal Variability in Extreme Climate and Potential Driving Factors on the Yunnan Plateau (Southwest China) during 1960–2019

1
School of Earth Sciences, Yunnan University, Kunming 650504, China
2
Yunnan Vocational and Technical College of Agriculture, Kunming 650031, China
*
Author to whom correspondence should be addressed.
Atmosphere 2021, 12(9), 1136; https://doi.org/10.3390/atmos12091136
Submission received: 22 June 2021 / Revised: 1 September 2021 / Accepted: 2 September 2021 / Published: 4 September 2021
(This article belongs to the Section Climatology)

Abstract

:
Global warming is increasing the frequency and intensity of extreme weather events around the world. The extreme climate in plateau and mountainous areas is sensitive and fragile. Based on the software Rclimdex 1.0, the spatio-temporal variation characteristics of 27 extreme climate indices at 120 meteorological stations were calculated in Yunnan from 1960 to 2019. The results show that the extreme temperature is rising, and the warming rate at night is higher than that in the daytime. It showed a trend of warming and drying, and precipitation was concentrated into more intense bursts. Extreme temperature cold indices (TX10p, TN10p, FD0, ID0, and CSDI) were negatively correlated with extreme precipitation indices (R × 5 day, PRCPTOT, R10 mm, R20 mm, and R25 mm). Extreme temperature warmth indices (TX90p and TN90p) were positively correlated with extreme precipitation indices (R × 5 day, CWD, PRCPTOT, R10 mm, R20 mm, and R25 mm). The change rate of extreme temperature does not increase linearly with altitude. The increase in middle-altitude and high-altitude areas is higher than that in low-altitude areas. Compared with ENSO and AO, NAO is a vital circulation pattern affecting the extreme climate in Yunnan. The influence of NAO on Yunnan’s extreme climate indices is most significant in the current month and the second month that follows. NAO was negatively correlated with extreme temperature warm indices (TN90p, TX90p, SU25, and TR20). NAO positively correlates with the extreme cold temperature indices (TN10p and TX10p). Except that ENSO has a significant effect on CDD, the effect of the general circulation patterns on the extreme temperature indices was more significant than that on the extreme precipitation indices in Yunnan. The results of this study are helpful to further understand and predict the characteristics of extreme climatic events and the factors affecting their geographical locations and atmospheric circulation patterns in Yunnan.

1. Introduction

The fifth assessment report of the IPCC shows that the global surface temperature increased by 0.85 °C from 1880 to 2012, and the warming trend has accelerated significantly since the 1990s [1,2]. This trend will continue for a long time, and the warming rate will be more apparent [3]. According to the “State of the Global Climate 2020” report released by the World Meteorological Organization (https://public.wmo.int/en, accessed on 27 August 2021), 2011–2020 was the warmest decade on record. By 2065, the increased temperature will have increased by 2–3 °C in Asia [4]. This will significantly increase the frequency and intensity of extreme weather events [5]. Extreme weather events are defined as historically rare meteorological events that occur in a certain area over a certain period, usually with a probability of less than 5% or 10% [6,7]. Extreme climatic events are characterized by suddenness, great destructiveness, and unpredictability compared with the average climatic state [8]. They have a significant impact on the long-term stability of the ecosystem and the development of the human economy and society [9,10]. Ten thousand extreme weather events were recorded globally between 1996 and 2016, causing 524,000 people to lose their lives and USD 3.16 trillion of direct economic losses. Moreover, scholars estimate that long-term extreme weather events could cost 0.01–0.25% of GDP per year in the world [11].
Extreme climate events mainly include extreme temperature, extreme precipitation, extreme wind, compound events, etc. In comparison, extreme temperature and extreme precipitation are more easily measured and combined into datasets and indices. The study of global extreme temperature events shows that the indices of cold days and cold nights show a decreasing trend, while the indices of the warm days and warm nights show an increasing trend [12,13]. More than 70 percent of regions have an increasing number of warm days and a decreasing number of cold nights [14]. Studies on global extreme precipitation events show that the number of global precipitation days is increasing, and regions with increased heavy precipitation are more than those with reduced heavy precipitation [15,16,17]. Precipitation has been on the rise in most parts of the world in the past 30 years [18,19]. Under the background of global warming and the general increase in extreme temperature, the trend of change in China is consistent with that of the whole world, which mainly shows that the cold indices of extreme temperature decrease while the warm indices increase [20]. The warming phenomenon is evident, and the frostfree period has increased significantly in northern China [21]. The regional average temperature increases, and the frequency of extreme warm events increases in southern China [22]. Domestic scholars mainly study extreme climate events over the past decades in China. They found that extreme precipitation and its duration are also increasing in China [23,24], but there are significant differences among different regions. Since the 21st century, the climate has become drier in northwest China, the extreme precipitation has increased significantly in south China, and the frequency and intensity of extreme precipitation have increased significantly in southwest China [25,26,27,28].
Previous studies have shown that plateaus and mountains are more sensitive and vulnerable to climate changes [29]. Yunnan is located in the southwest of China, with plateau and mountainous areas accounting for more than 90% of the region’s total area. The region has high altitudes, complex and diverse terrain. Due to global warming, Yunnan has experienced significant climate changes in recent decades [30]. It leads to the frequent occurrence of extreme climate in Yunnan, which has caused considerable losses of the agricultural production in the whole province. However, there are few studies on the spatiotemporal variation characteristics of the extreme climate indices in Yunnan. Xu et al. [31] analyzed spatiotemporal variation characteristics of extreme climate using 13 extreme climate indexes from 31 meteorological stations during 1960–2015 in Yunnan, and found that extreme warm events increased gradually, while extreme cold events decreased gradually. The warming rate at night was higher than that in the daytime. Cao et al. [32] analyzed spatiotemporal variation characteristics of precipitation in central Yunnan based on four extreme precipitation indexes of 49 meteorological stations from 1964 to 2013. They found that the number of heavy precipitation days and the maximum days of continuous rain showed a significant decreasing trend. Some studies have shown that regional extreme climate events may be related to the large-scale atmospheric circulation model anomalies.
This paper intends to analyze the characteristics and causes of Yunnan’s extreme climate indices to further improve the research in this field. Based on the software Rclimdex1.0 (https://github.com/ECCC-CDAS/RClimDex, accessed on 27 August 2021), 27 extreme climate indices of 120 meteorological stations in Yunnan from 1960 to 2019 were calculated, and their spatiotemporal variation characteristics were analyzed. The relationship between the extreme climate indices and the influence of geographical locations and atmospheric circulation patterns on the extreme climate indices were discussed to explore the spatiotemporal variation of the extreme climate indices characteristics and causes of extreme climatic events in Yunnan.

2. Study Area

Yunnan is located at the southwest border of China, with a longitude between 97°31′ E and 106°11′ E and latitude between 21°8′ N and 29°15′ N (Figure 1). The Tropic of Cancer traverses the southern part of the province and is a low-latitude inland area. Yunnan belongs to the mountainous plateau terrain, and its terrain is complex and diverse. Mountain area occupies 84% of the province’s territory, and plateau area occupies 10% of the province’s territory. Yunnan belongs to the subtropical plateau monsoon type climate, three-dimensional climate characteristics, many types, slight annual temperature differences, sizeable daily temperature differences, dry and wet seasons, temperature with the terrain level vertical change is very obvious. There are three zones of climate: cold, warm, and hot (including subtropical) in Yunnan. The climate is a frigid zone in northwest Yunnan, with long winter and short spring and autumn, but without summer. Eastern Yunnan and central Yunnan belong to the temperate climate, the four seasons are similar to spring, but whenever it rains, it is as cold as winter; southern and southwestern Yunnan belong to low-heat valley areas, some of which are south of the Tropic Cancer and fall into the tropical zone, just as the saying goes, “One may experience four seasons in a mountain and the weather is completely different even in the same day within ten miles”.

3. Materials and Methods

3.1. Materials

The meteorological data were obtained from the Center for Resources and Environment Science and Data, Institute of Geographic Sciences and Natural Resources Research, CAS (https://www.resdc.cn/data.aspx?DATAID=230, accessed on 27 August 2021). It contains the daily maximum temperature, daily minimum temperature, and daily precipitation of 120 meteorological stations in Yunnan from 1960 to 2019. According to the Chinese meteorological geography division manual [33,34], the study area was divided into five sub-regions: central Yunnan (region I), northeast Yunnan (region II), northwest Yunnan (region III), southeast Yunnan (region IV), and southwest Yunnan (region V). The distribution locations of its meteorological stations are shown in Figure 1. The meteorological data is interpolated on the map based on the ANUSPLIN method. ANUSPLIN interpolation method is based on ordinary thin disk and local thin disk spline function interpolation theory, and the integrated ANUSPLIN software package is used for spatial interpolation. Altitude was used as a covariable to improve the interpolation accuracy. After experiments, the quadratic spline interpolation is used, the specific algorithm can be referred to Liu et al. [35]. The resolution of all raster data is 1km.
The atmospheric circulation data used in this study include the El Nino-Southern Oscillation Index (ENSO), the Arctic Oscillation Index (AO), and the North Atlantic Oscillation (NAO). They come from the Oceanic and Atmospheric Administration Climate Prediction Center (NOAA) (http://www.cpc.ncep.noaa.gov, accessed on 27 August 2021). Its time series is 1960–2019.
The ENSO is based on the multiple ENSO indices—MEI. The NAO is the standard sea-level pressure difference over Gibraltar and southwest Iceland; The AO is the time coefficient of the first mode of the empirical orthogonal function analysis of the sea level pressure anomaly outside the tropical northern hemisphere.

3.2. Methods

3.2.1. Extreme Climate Indices

The Expert Group on Climate Change and Indicators (ETCCDI) defines 27 core climate extremes indicators which include 11 extreme precipitation indices and 16 extreme temperature indices. These extreme climate indices can be calculated using Rclimdex1.0. The base period chosen is the default period 1960–1990. The software calculates extreme weather indices using quality control and homogenization station data [36,37]. It runs in the R (http://www.rproject.org, accessed on 27 August 2021) programming environment. In order to ensure the reliability of the data, Rclimdex1.0 software is used to screen the outliers and the daily data’s error values [38]. As climate characteristics are complex and diverse in Yunnan, Rclimdex1.0 software will be used to calculate all 27 extreme climate indices to evaluate the changing characteristics of extreme weather in Yunnan. Their detailed definitions are shown in Table 1.

3.2.2. Statistical Methods

Sen’s slope method was used to calculate extreme climate indices’ evolution law and the Mann–Kendall non-parametric statistical test method was used to carry out a significance test to reveal its evolution law. Pearson correlation coefficient (R) was adopted to represent the correlation between extreme climate indices (the correlation between extreme temperature indices and extreme precipitation indices) and the correlation between extreme climate indices and atmospheric circulation indices. Their formulas and their principles are shown in these references [39,40,41].
Cross-correlation analysis was used to analyze the lag effect of atmospheric circulation patterns on extreme climate indices. The formulas are as follows:
r k = C K ^ ( x , y ) δ x ^ δ y + k ^
In Formula (1), the covariance CK (x, y) and mean square deviation σx, σy+k of the sample are, respectively expressed as:
{ C K ^ = 1 n k i = 1 n k ( x i x ) ( y i + k y i + k ) δ x ^ = [ 1 n k i = 1 n k ( x i x i ) 2 ] 1 2 δ y + k ^ = [ 1 n k i = 1 n k ( y i + k y i + k ) 2 ] 1 2
where the mean value is:
{ x i = 1 n k i = 1 n k x i y i + k = 1 n k i = 1 n k y i + k
where: n is the number of samples of sequence xt and yt; k = 0, ±1, ±2, …. As a rule of thumb, the absolute value of the time delay k should be less than n/4. As the relationship between the monthly extreme climate indices of 60 years and the atmospheric circulation patterns were analyzed, n = 456, n/4 = 114, and k = 114 were selected.

4. Result

4.1. Spatiotemporal Variation of Extreme Temperature Indices

Figure 2 and Table 2 imply the temporal change characteristics of the extreme temperature indices. The extreme temperature cold indices (CSDI, FD0, ID0, TN10p, and TX10p) showed a significant decrease (p < 0.01) in Yunnan from 1960 to 2019. Its descending rate is −0.17 d/a, −0.23 d/a, −0.008 d/a, −0.40%/a, and −0.20%/a, respectively. However, the other 11 extreme temperature indices showed an increasing trend. Among them, eight extreme temperature indices (TNn, TNx, TXx, SU25, TR20, WSDI, TN90p, and TX90p) showed a significant upward trend (p < 0.01), and the rate of increase was 0.04 °C/a, 0.03 °C/a, 0.04 °C/a, 1.07 d/a, 0.52 d/a, 0.30 d/a, 0.45%/a, and 0.48%/a, respectively. In particular, the increase rate of TNn is much greater than the rate of global warming. These indicate that it has been warming significantly in the past 60 years in Yunnan.
In general, the linear trend of extreme climate indices in each sub-region is consistent with that of the whole Yunnan. However, the GSL did not decrease significantly in southwestern and southeastern Yunnan, and the trend was opposite to that in other sub-regions of Yunnan. The slope value of TXx is greater than that of TNx, while the slope value of Txn is greater than that of TNN in Yunnan. The slope value of TX90p is greater than that of TN90p, and the slope value of Tx10p is smaller than that of TN10p except for the southeastern part of Yunnan. The above analysis shows that it is gradually warming, and the warming rate at night is higher than that in the daytime in Yunnan.
Figure 3 reveals the spatial distribution characteristics of the extreme temperature indices in Yunnan. The five extreme temperature warm indices (TX90p, TN90p, SU25, TR20, and WSDI) were significantly increased (p < 0.05), accounting for 92.74%, 89.52%, 91.13% 52.42%, and 40.00% of meteorological stations, respectively. SU25 and TR20 showed a significant increase (p < 0.05), which were mainly distributed in southeast and northeastern Yunnan. The four extreme temperature cold indices (TX10p, TN10p, FD0, and CSDI) significantly decreased (p < 0.05), accounting for 22.58%, 79.84%, 40.68%, and 24.19% of meteorological stations, respectively. TX10p, TN10p, and CSDI have the most apparent decreasing trend which are mainly distributed in southwest Yunnan. FD0 shows the most apparent decreasing trend in central Yunnan. More than 89% stations of the three extreme indices (TXx, TNx, and TNn) showed no significant growth. In addition, the trend of TXn, GSL, and DTR showed noticeable regional differences. The meteorological stations with TXn decreasing trend were mainly distributed in Ailao Mountain and Wuliang Mountain. The stations with decreasing DTR were mainly distributed in the boundary of central Yunnan and southeast Yunnan. The stations with a decreasing trend of GSL were mainly distributed in southwest Yunnan, while the stations with an increasing trend of GSL were mainly distributed in central and northwest Yunnan.

4.2. Spatiotemporal Variation of Extreme Precipitation Indices

Figure 4 and Table 2 indicate the temporal variation characteristics of the extreme precipitation indices. The trend analysis shows a noticeable drying trend in Yunnan from 1960 to 2019, and the precipitation was concentrated into more intense bursts. R × 1 day, CDD, and SDII showed an increasing trend. The other eight extreme precipitation indices (R × 5 day, CWD, PRCPTOT, R10 mm, R20 mm, R25 mm, R95p, and R99p) show falling in less intense bursts. Only the change rate of CWD and PRCPTOT reached a significant level (p < 0.05). Their rate of change is −0.06 d/a and −2.48 mm/a, respectively.
There are obvious differences in extreme precipitation in different sub-regions. Five extreme precipitation indices (R × 5 day, PRCPTOT, R1 0 mm, R20 mm, and R25 mm) showed an increasing trend in northeastern Yunnan. The rate of change is 0.97 mm/a, 1.08 mm/a, 0.042 d/a, 0.044 d/a, and 0.029 d/a. It is the opposite of extreme precipitation rates in other regions. R95p and R99p showed an increasing trend in central, southeastern, and northeastern Yunnan, and their increasing rates were both greater than 0.9 mm/a. It shows that the intensity of single precipitation (R × 1 day) in the above-mentioned area is increasing.
The spatial distribution characteristics of the extreme precipitation indices are shown in Figure 5. Six extreme precipitation indices (R95p, R99p, CDD, R10 mm, R20 mm, and R25 mm) show apparent spatial differentiation. For example, R95p and R99p increased significantly in 16.13% and 29.03% of sites, respectively, mainly distributed in central, northeastern, and southeastern Yunnan. Meteorological stations with a significant increase in CDD accounted for 33.87%, mainly in northwestern and southwestern Yunnan; meteorological stations with a significant decrease in CDD accounted for 10.48%, mainly in southeastern and central and southern Yunnan. The proportion of meteorological stations with a downward trend of R10 mm, R20 mm, and R25 mm are all greater than 80% in northeastern Yunnan; while in other regions, the meteorological stations with an upward trend of R10 mm, R20 mm, and R25 mm are significantly more than those with a downward trend. However, this trend of change did not pass the p = 0.05 significance test. There are fewer meteorological stations whose five extreme precipitation indices (R × 1 day, R × 5 day, PRCPTOT, CWD, and SDII) pass the significance test, and their spatial changes are not noticeable. For example, the proportion of meteorological stations with a significant increase and a significant downward trend in R × 1 day did not exceed 3%.
In comparison, the proportion of meteorological stations with a significant downward trend in R × 5 day accounted for 20.12%, mainly distributed in northwest, southwest, and southeast of Yunnan. PRCPTOT and CWD decreased significantly at less than 10% of meteorological sites. These stations are widely distributed in Yunnan.

4.3. Co-Relationships of Extreme Climate Indices

Figure 6 indicates the correlation of extreme climate indices in different regions of Yunnan from 1960 to 2019. Five extreme warm indices (TX90p, TN90p, SU25, TR20, and WSDI) and four cold indices (TX10p, TN10p, FD0, and CSDI) were significantly negatively correlated (p < 0.05). The correlation coefficient between TN10p and TN90p and the correlation coefficient between SU25 and TX10p are less than −0.8 in all sub−regions, indicating a significant negative correlation between cold and warm extreme events in each region. In the past 60 years, the correlations of all extreme precipitation indices in the whole of Yunnan are positive, but there will be some unique situations in different regions. For example, CDD is negatively correlated with seven extreme precipitation indices (R × 1 day, PRCPTOT, R10 mm, R20 mm, and R25 mm) in northwestern and northeastern Yunnan; In contrast, CWD is negatively correlated with eight extreme precipitation indices (R × 1 day, R × 5 day, R10 mm, R20 mm, R25 mm, R95p, R99p, and SDII) are negatively correlated in central Yunnan. Except for CWD and CDD, other extreme precipitation indices were significantly positively correlated with PRCPTOT (p < 0.05). It shows that extreme precipitation and changes of precipitation intensity affected PRCPTOT.
The cold indices (TX10p, TN10p, FD0, ID0, and CSDI) of extreme temperature were negatively correlated with the extreme precipitation indices (R × 5 day, PRCPTOT, R10 mm, R20 mm, and R25 mm). Extreme temperature warm indices (TX90p and TN90p) were positively correlated with extreme precipitation indices (R × 5 day, CWD, PRCPTOT, R10 mm, R20 mm, and R25 mm) in different sub−regions of Yunnan. This correlation has reached a significant level in central Yunnan. It shows that Tmin has a promoting effect on the precipitation in winter, and Tmax has an inhibitory effect on the precipitation in summer.

4.4. Main Reasons for Changes in Extreme Climate Indices

4.4.1. The Influence of Geographic Location on Extreme Climate Indices Variation

Table 3 describes the relationship between extreme climate indices and geographical factors (longitude, latitude, and altitude). The seven extreme temperature indices (TNn, TNx, TXx, TXn, SU25, TR20, and GSL) were significantly negative with altitude (p < 0.05), These correlation coefficients were all less than −0.5. This indicates that the above indexes have evident negative dependence on altitude. There was a significant positive correlation between FD0 and altitude (p < 0.05). Their correlation coefficient was 0.71, indicating that the number of frosty days increases significantly with elevation. However, the correlation coefficient between relative temperature indices (TX10p, TN10p, TX90p, and TN90p) and geographical factors is close to 0, indicating that their change is less affected by geographical factors. The correlation coefficient between R × 1 day and latitude and the correlation coefficient between CDD and altitude is negative than the correlation coefficient between geographical location and extreme precipitation indices. Compared with latitude and longitude, altitude has a more significant influence on the extreme climate indices in Yunnan.
Based on the natural breakpoint method [42], the altitude ranges are divided into four groups (Table 4). It is found that the rate of extreme temperature change does not increase linearly with altitude. For example, SU25 and TN10p showed the fastest growth rate in the interval II, and their change rates were 1.36d/a and 0.47d/a, respectively. WSDI and TX10p have the fastest growth rate in the interval III, and their growth rates are 0.03d/a and 0.52d/a, respectively. The change rate of the extreme precipitation indices may show a reverse trend in different altitude regions. For example, CDD shows a decreasing trend in the range I and an increasing trend when the altitude is above 1448 m. R99p shows an increasing trend in the intervals I and II, showing a decreasing trend in the intervals III and IV. It shows that precipitation is strongly limited by altitude.

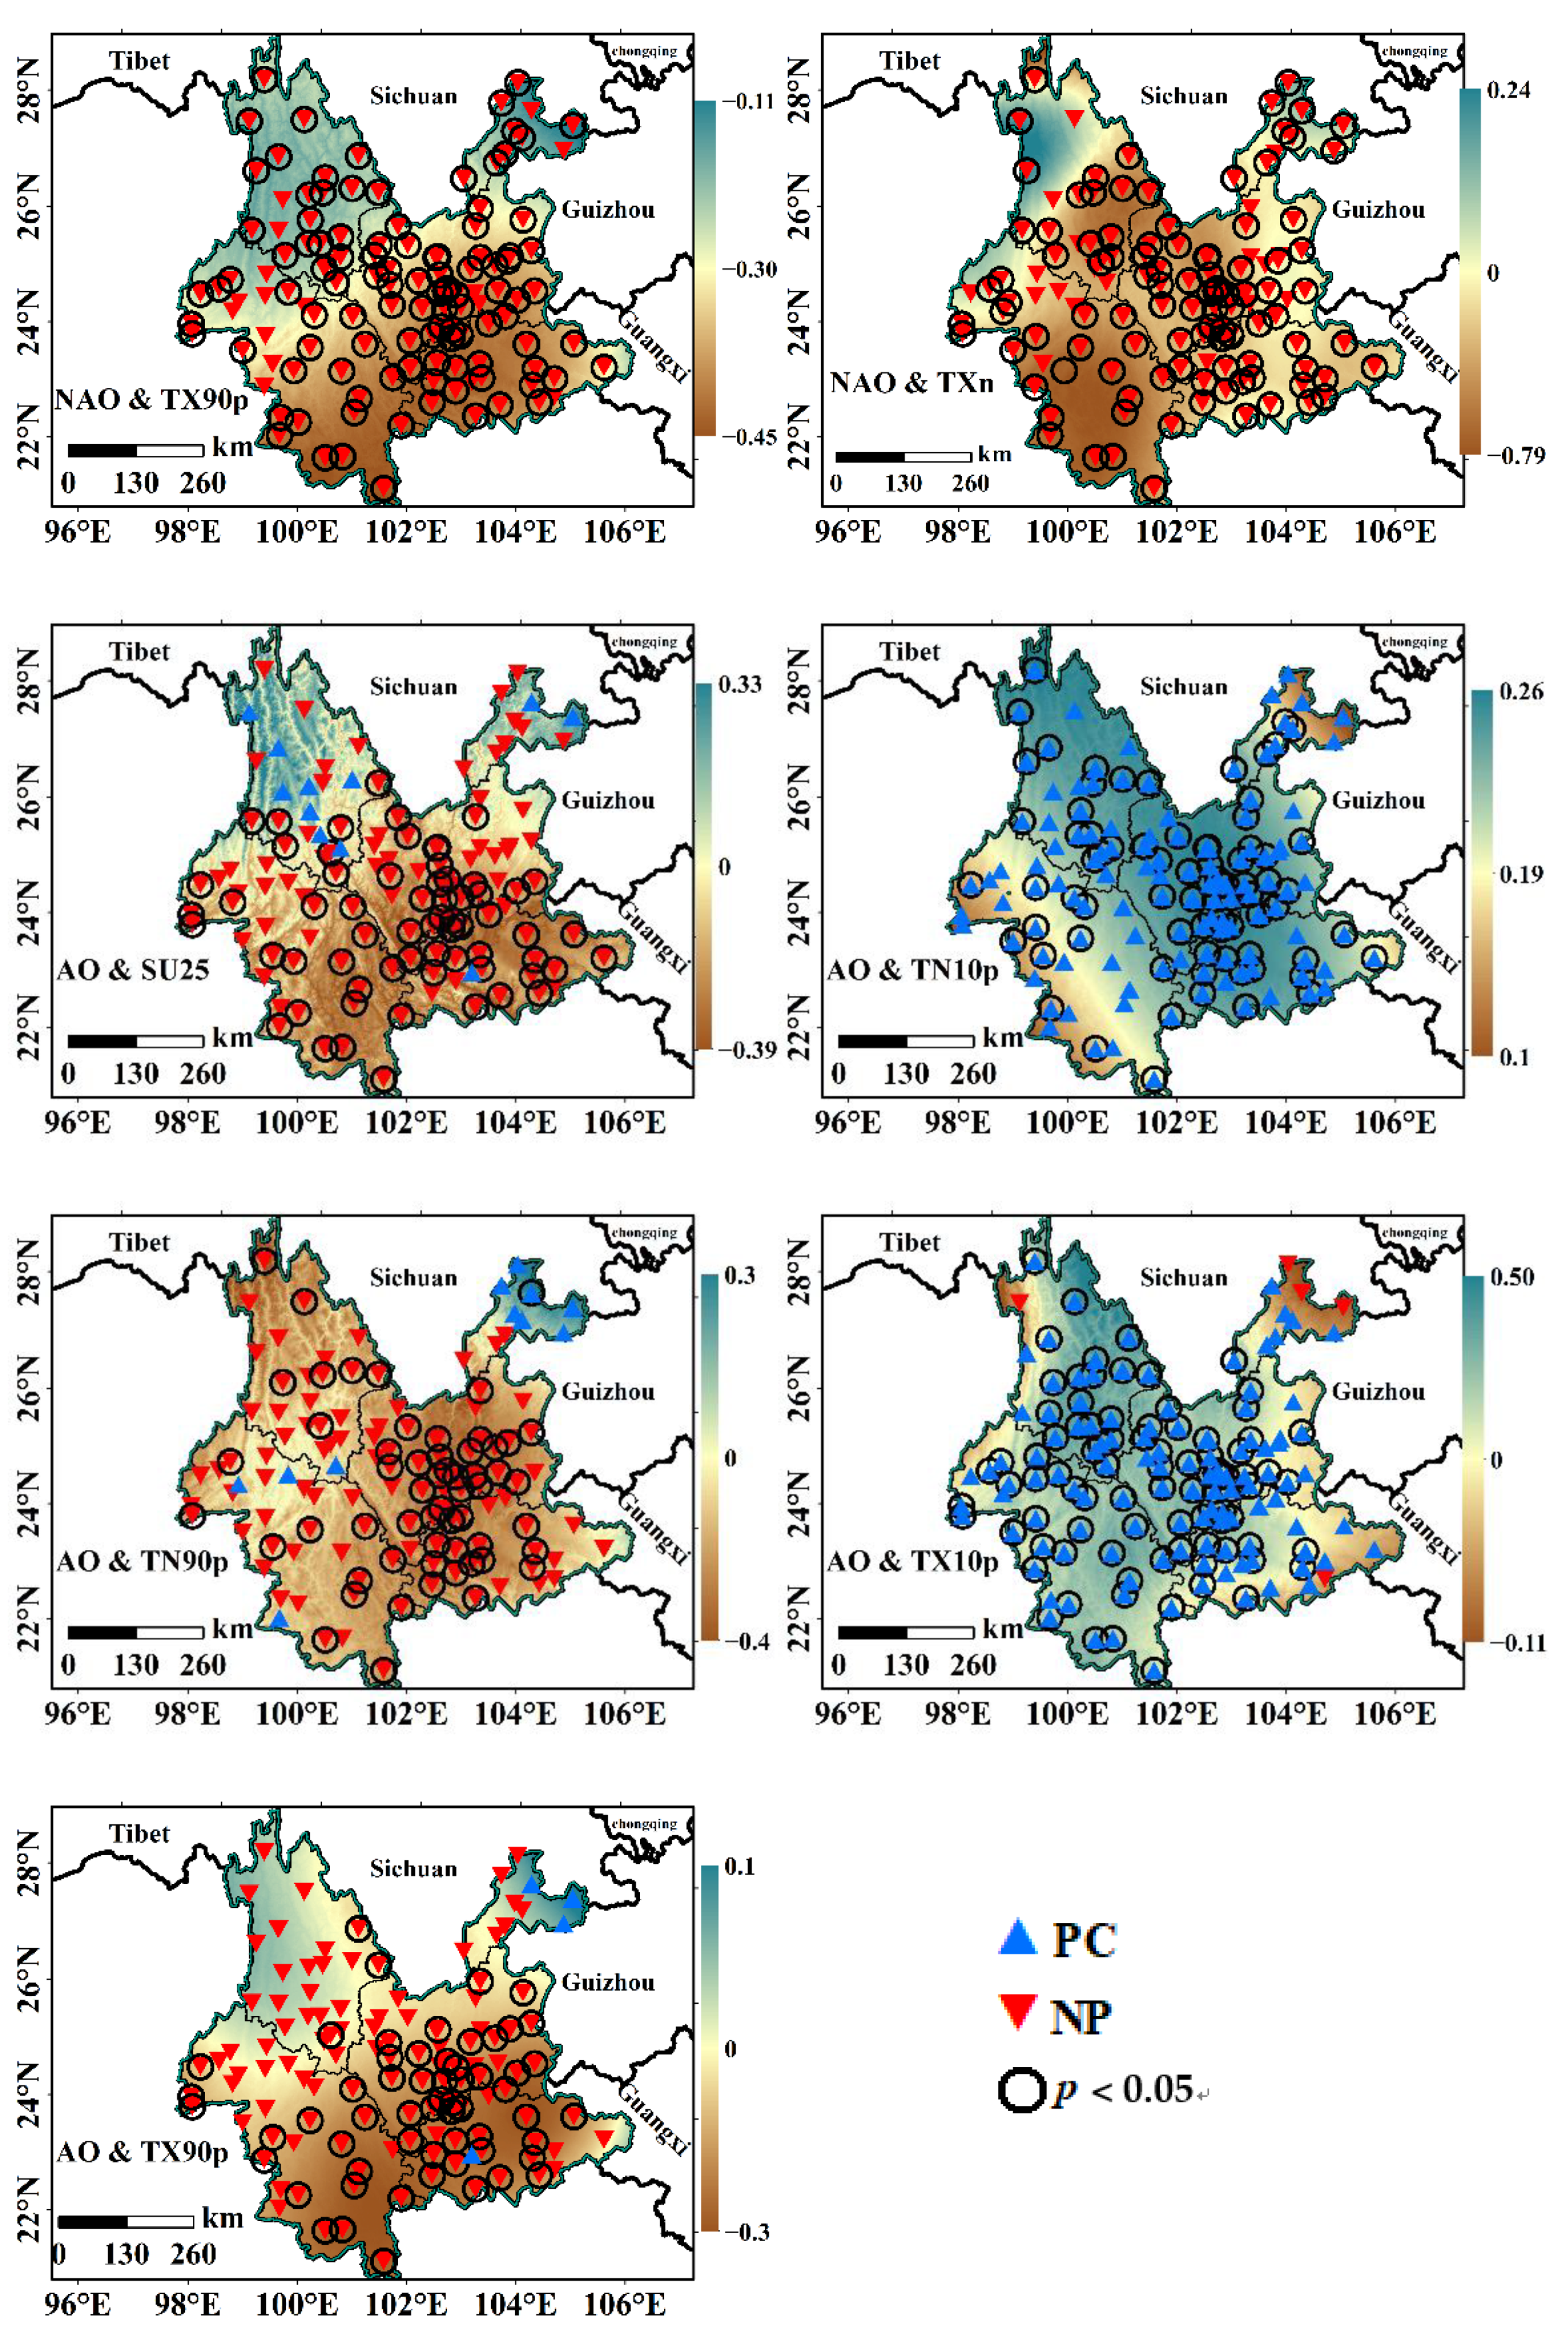
4.4.2. The Influence of Atmospheric Circulation Patterns on Extreme Climate Indices Variation

In order to understand the effects of atmospheric circulation patterns (NAO, AO, and NAO) on extreme climate indices, the authors analyzed their relationships on different time scales (monthly, quarterly, and annually). As Rclimdex1.0 only provides monthly data for 11 extreme climate indices (R × 1 day, R × 5 day, TNn, TXn, TXx, TNx, TX10p, TN10p, TX90p, TN90p, and DTR), the authors analyzed the correlation between these 11 extreme climate indices and atmospheric circulation patterns on the monthly and quarterly time scales (Table 5). Except for spring and autumn, the correlation between NAO and extreme climate indices passed the significance test with the highest proportion on all time scales. At the same time, the influence of atmospheric circulation patterns on the extreme temperature indices is more significant than that on the extreme precipitation indices in Yunnan.
NAO had the most significant influence on the extreme climate indices in the same month and its following month in Yunnan. NAO was negatively correlated with the warm temperature indices (TN90p, TX90p, SU25, and TR20). NAO was positively correlated with cold temperature indices (TN10p and TX10p). Except for TN10p, the correlation between NAO and the remaining ten extreme climate indices passed the significance test. The correlation between AO and TN10p and TN90p has passed the significance test of the two−month lag and the three−month lag, which indicates that the AO has a lag effect on the changes of temperature in winter and summer nights in Yunnan. On the seasonal scale, AO significantly (p < 0.05) affected DTR and R × 1 day in spring. There was a significant, positive correlation between ENSO and R × 5 day in winter and summer (p < 0.05). However, the correlation between autumn atmospheric circulation patterns and extreme climate indices did not pass the significance test. At the annual scale, only the correlation of CDD in ENSO passed the significance test, indicating that the continuous drought at the annual scale may be related to the positive and negative phase fluctuations of ENSO.
The correlation between the extreme climate indices and the general circulation patterns (ENSO, AO, and NAO) was analyzed on a site-by-site basis in Yunnan during 1960−2019 (Figure 7). The top five sites (five indices with the highest proportion of correlation passing significance test p < 0.05) that passed the significance test of the correlation between ENSO and extreme climate indices were CDD, TNx, TXx, GSL, and TXn. Except for the highest proportion of meteorological stations (73.39%) that passed the correlation test between CDD and ENSO, the remaining were all extreme temperature indices. The proportion of ENSO and TNx, and TXx were 36.29% and 34.68%, respectively.
ENSO and GSL, ENSO, and CDD were significantly negatively correlated, with the proportions being 53.23% and 72.58%, respectively. The spatial distribution of the correlation between ENSO and TXn shows apparent regional differentiation: the meteorological stations showing a significant positive correlation are mainly distributed in northeastern, southeast, and southeastern Yunnan east of 103° E; the stations showing negative correlation are mainly distributed in the remaining area west of 103° E.
The proportions of AO and the extreme temperature warm indices (TN90p, TX90p, and SU25) showing a significant negative correlation are: 45.16%, 47.58%, and 51.61%; the proportions of AO having a significant positive correlation with the extreme temperature cold indices (TN10p and TX10p) are 62.90% and 73.39%, respectively. The spatial distribution characteristics of NAO and extreme climate are similar to the distribution characteristics of the relationship between AO and extreme climate in Yunnan. However, the impact of NAO on the extreme climate is even more significant in Yunnan. In terms of significant correlation, the top five sites between extreme climate indices and NAO were TX10p (91.13%), TX90p (87.09%), TN10p (83.87%), TXn (83.06%), and SU25(75%). The results showed that the AO and NAO significantly influenced the extreme temperature than extreme precipitation in Yunnan.

5. Discussion

5.1. Variation Characteristics of Extreme Temperature Indices in Yunnan during 1960–2019

Current studies show that the changing trend of extreme temperature is consistent with that of previous studies in Yunnan [43]. It has shown a warming trend in Yunnan in the past 60 years. The extreme warming indices (TX90p and TN90p) increased less than the cold indices (TX10p and TN10p) decreased radiation. This trend is consistent with the findings of the fourth meeting of the IPCC. Moreover, four extreme temperature indices (TXx, TNx, TXn, and TNn) showed a slow upward trend.
Moreover, the warming rate in winter (TX10p and TN10p) is more significant than that in summer (TX90p and TN90p). The reason may be that the “heat source” over the Qinghai−Tibet Plateau increases the heat exchange between the atmosphere of the Qinghai−Tibet Plateau and the surrounding atmosphere [40]. This has a noticeable effect on the increase in temperature in winter in Yunnan. This asymmetry of temperature increase resulted in an insignificant decreasing trend of the daily temperature range (DTR) in Yunnan. However, DTR showed a downward trend in central Yunnan. It is the core area of the agricultural economy in Yunnan. The significant increase in temperature at night mainly causes a significant decrease in the DTR. It can be explained by increased concentrations of greenhouse gases and increased aerosols absorbed by nocturnal radiation [44]. It significantly affects the growth of vegetation [45,46,47]. Rising temperatures at night, for example, will increase plant respiration.
The opposite trends of CSDI and WSDI, FD0 and TR20, and ID0 and SU25 in Yunnan indicate a warming trend in different sub-regions. WSDI showed a significant upward trend, while CSDI showed a significant downward trend in all sub-regions, which was consistent with the work of Tong [40]. More than 99%’s meteorological stations of the extreme temperature warm indices (TX90p, TN90p, SU25, TR20, and WSDI) has a positive slope, and 90% of the meteorological stations’ readings of the extreme temperature cold indices (TX10p, TN10p, FD0, and CSDI) has a negative slope. It shows that the extreme climate change is consistent with that of the global world in Yunnan [31]. TX10p, TN10p, and CSDI have the most apparent downward trend in the southwest of Yunnan, and FD0 has the most apparent downward trend in central Yunnan, indicating a significant warming rate in the southwest and central Yunnan in winter. This may be as the positive phase of ENSO causes the abnormally high temperature in winter in Yunnan. ENSO in the positive phase caused the weak East Asian winter monsoon, leading to an apparent warm winter in the eastern part of Yunnan [48,49]. The spatial distribution of TXn and GSL showed apparent spatial differentiation. This uneven spatial distribution can be attributed to the combined effects of global change, atmospheric circulation oscillation, urbanization, topography, and altitude [50].

5.2. Variation Characteristics of Extreme Precipitation Indices in Yunnan during 1960–2019

During the study period, the drought trend was evident in Yunnan, and the precipitation intensity increased, and the CDD rising rate was much higher than the national average level [51], indicating an apparent arid trend in Yunnan. R × 1 day, CWD, and SDII showed a slight downward trend, while the remaining eight extreme precipitation indices (R × 5 day, CDD, R95p, R99p, R10 mm, R20 mm, and R25 mm) showed an increasing trend. The possible reason is that global warming increases the frequency and intensity of regional extreme temperature events and intensifies the global water cycle rate. This increases the intensity of regional precipitation.
The intensification of global warming leads to the increase in El Nino frequency. The combined effect of the increased El Nino phenomenon and the circulation anomaly on the Qinghai−Tibet Plateau leads to the increase in precipitation intensity and continuous decrease in precipitation in Yunnan [52]. For example, five extreme precipitation indices (R × 5 day, PRCPTOT, R10 mm, R20 mm, and R25 mm) were opposed to the regional variation trend in northeast Yunnan. However, their changes did not pass the significance test of p = 0.05, indicating no significant wetting trend and the possibility of heavy precipitation events in northeast Yunnan in the past 60 years. However, R95p and R99p showed an increasing trend in central and southeast Yunnan, indicating that precipitation intensity in the above regions showed an increasing trend.
Cloud condensation nuclei may be responsible for the increase in precipitation in this region. Central Yunnan is one of the 19 urban agglomerations promoted by China in recent years, with a high urbanization rate [53]. The increase in precipitation in areas with a high urbanization rate may be mainly due to the increase in atmospheric buoyancy and convection—that is, atmospheric aerosols cause the increase in precipitation and precipitation intensity in the metropolitan area [54,55]. The increase in cloud condensation nuclei may be caused by the increase in aerosols in the atmosphere. This research result is similar to the reasons for the increase in precipitation and precipitation intensity in high−urbanization regions worldwide [56]. The spatial distribution of six extreme precipitation indices (R95p, R99p, CDD, R10 mm, R20 mm, and R25 mm) showed noticeable regional differences. For example, CDD increased significantly in southeastern and central and southern Yunnan, which indicated that the arid trend in the above regions was prominent.
The increasing trend of five extreme precipitation indices (R95p, R99p, R10 mm, R20 mm, and R25 mm) is still related to the advancing direction of warm and wet airflow from the South China Sea and the starting region of the rainy season in central and southeast Yunnan. Overall, the correlation of each extreme precipitation index is positive in Yunnan. However, in some areas, there are exceptional cases. For example, CDD was negatively correlated with five extreme precipitation indices (PRCPTOT, R × 1 day, R10 mm, R20 mm, and R25 mm) in the northwest and northeast Yunnan. The increase or decrease in CDD, as an index of drought status, would lead to the opposite change of PRCPTOT. In the recent 60 years, the intensification of drought, the decrease in annual total precipitation, and the decrease in single-day precipitation have led to increased precipitation intensity in Yunnan. The above reasons also lead to the opposite trend of CWD with the eight extreme precipitation indices (R × 1 day, R × 5 day, R10 mm, R20 mm, R25 mm, R95p, R99p, and SDII) in Yunnan.
In addition, in the context of the accelerating water cycle in land and sea systems and global warming, the link between extreme precipitation changes and extreme temperature changes needs to be considered, which suggested these two extreme indices are not always independent [57]. Allan and Soden [58] studied the response of extreme precipitation to atmospheric warming based on satellite observation and mathematical model simulation. The result was a completely different link between extreme precipitation and rising temperatures. There are fewer rainstorm events in the cold phase, while more rainstorm events in the warm phase.
For example, precipitation intensity indices (R95p, R99p, and SDII) positively correlate with extreme warm temperature indices while negatively correlated with extreme precipitation cold indices. This indicates that the increase in extreme warm events and the decrease in extreme cold events will change the possibility of extreme precipitation events in Yunnan. The amplification of the hydrological cycle due to global warming will lead to more extreme precipitation characteristics: more significant precipitation events and greater intervals between precipitation events [59]. This also revealed a positive relationship between extreme temperature increase and precipitation intensity (R95p, R99p, and SDII) and drought duration (CDD) in Yunnan.

5.3. Influencing Factors (Geographical Factors (Longitude, Latitude, and Altitude)) of Extreme Climate Characteristics in Yunnan

Yunnan is characterized by complex terrain and significant regional differences. Compared with longitude and latitude, altitude plays a leading role in the process of extreme climate change in regions with complex topography [60]. Studies have pointed out that extreme weather and extreme hydrological events in plateau and mountainous areas are susceptible to altitude [61]. The trend coefficients of FD0 and ID0 were significantly different above and below the 2112 m elevation boundary, although there was no positive or negative change trend. This may be attributed to the significant decrease in FD0 and ID0 at high altitudes (p < 0.05) conducive to intermittent permafrost development, active periglacial processes, and persistent snow and ice cover [60]. Such a significant warming event at high altitudes would also have a significant impact on regional ecosystems. Under the simple airflow and terrain model, the temperature decreases linearly with the elevation. However, four extreme warming indices (SU25, TR20, TN90p, and TX90p) do not show the fastest change rate in the highest altitude region. This can be attributed to the poor air circulation in some closed intermountain depressions at middle and high elevations (some studies have shown that the average wind speed in closed intermountain depressions is about 80% of that in common areas) and the aggregation effect of warm and wet airflow [60].
The change rate of CDD and SDII is positive and negative, around 1488 m. The rate of change of R99p is positive and negative, around 2112 m. This indicates that the aridity trend is noticeable, and the precipitation is more precipitation was concentrated into more intense bursts in the low altitude region. The extreme precipitation (R99p) over middle and high altitudes showed a decreasing trend. This may be due to water vapor propagation direction and water vapor flux under different elevation gradients [62].

5.4. Influencing Factors (Atmospheric Circulation Patterns (NAO, AO, and NAO)) of Extreme Climate Characteristics in Yunnan

Abnormal development of atmospheric circulation patterns often leads to abnormal weather phenomena [63]. In Yunnan, atmospheric circulation patterns (ENSO, AO, and NAO) extreme temperature is more significant than its influence on extreme precipitation [64]. This is due to the weakening of the eastern subtropical westerly jet in the upper troposphere, which affects the activity of the Rossby wave. It is not conducive to the establishment of the Qinghai−Tibet Plateau and Bay of Bengal trough. The subtropical strong air pressure and slightly southerly position of the western Pacific Ocean highly inhibits the input of low-level water vapor into Yunnan [65].
Except for spring and autumn, NAO has a more significant impact on extreme climate than AO and ENSO on them in Yunnan at different time scales, which indicates that NAO is a vital circulation factor affecting the characteristics of extreme climate change in Yunnan. The correlation between NAO and ten extreme climate indices (TX10p, TN10p, TN90p, TNn, TNx, TXn, TXx, DTR, R × 1 day, and R × 5 day) reached a significant level in that month and its following second month. This is as the asymmetric connection between NAO and blocking circulation on the atmospheric scale has an asymmetric influence on temperature and precipitation in advance or behind [66,67]. Its lag period is about two weeks. The minimum time scale of this study is one month, which also explains why the correlation between NAO and the ten extreme climate indices on the one-month lag scale reaches a significant level.
The correlation between NAO and extreme climate indices in winter and summer passing the significance test is more than that between NAO and extreme climate indices in spring and autumn passing the significance test. This is due to the temporary stabilization of the airflow caused by the excessive seasonal shift of positive and negative phases of NAO during the spring and autumn. NAO is significantly positively correlated with extreme precipitation indices (R × 1 day and R × 5 day) in winter, which may be due to the increase and enhancement of the reflectivity of the Greenland ice sheet in winter and the warming of polar air temperature, which narrates the original temperature gradient from polar to the equator and intensifies the southward distance of the low-pressure trough [68]. This may enhance the unstable winter monsoon system, which in turn increases extreme precipitation events in Yunnan.
ENSO had the most significant effect on CDD. A significant negative correlation between ENSO and CDD (p < 0.05) accounted for 73.39% of stations. This indicates that ENSO is the critical factor affecting the persistent drought in Yunnan. As a strong signal of land−sea water vapor exchange [69], the interannual variation of ENSO has a substantial impact on monsoon and precipitation in China’s monsoon region. Although different ENSO events can affect precipitation levels in southwest China, they will not change the trend of winter precipitation in the life cycle of Madden−Julian oscillation [70]. This also explains the correlation between the continuous drought in winter and spring in Yunnan and the ENSO oscillation period. The correlation between ENSO and TXn east of 103° E is positive, ENSO and TXn west of is negative; this can be attributed to the interannual variation of ENSO on the decrease in cloud cover caused by the gradual decrease in monsoon precipitation from coastal to inland [63].
AO has a significant influence on the climate zones outside the tropics of the northern hemisphere and is the dominant factor of winter circulation in the northern hemisphere [71]. This study found that AO had a significant effect on the relative cold indices (TX10p and TN10p) and substantially affected the extreme warm indices (TX90p, TN90p and SU25) in Yunnan. This is as the “amplification” effect of global warming has accelerated the melting of the Arctic ice sheet and reduced shortwave reflectivity in the summer months. This has a profound effect on temperature over China by influencing Siberian High. Zuo et al. [72], when describing how AO affects the 35 °C high temperature, pointed out that the influence of AO on local sea surface temperature may be one of the reasons for the potential temperature changes in mainland China. This also explains the negative correlation between the increase in summer high temperature and AO in Yunnan.
At the same time, we found that the influence of geographical location (longitude, latitude, and altitude) on temperature extremum indices (TX10p, TX10p, TX90p, and TN90p) was almost negligible and minor, indicating that AO/NAO was the critical factor affecting the most extreme temperature changes in Yunnan. At the same time, the authors also found that the sites with a significant negative correlation between AO and CDD accounted for 34.68%, which indicated that AO was also an important factor affecting the persistent drought in winter and spring in Yunnan. For example, Chen et al. [73] studied the abnormal influence of the nonlinear combination of ENSO and AO on the winter climate in East Asia, so the continuous drought in winter and spring in Yunnan may be affected by the joint influence of Siberian High, ENSO, and OA.

6. Conclusions

The authors investigated spatial and temporal dynamics of extreme climate indices and the factors causing extreme climate indices in Yunnan during 1960–2019. Based on Rclimdex1.0, 27 extreme climate indices were selected. Based on the linear trend, their spatiotemporal variation characteristics are analyzed. Based on Pearson’s correlation coefficient, the correlations among 27 extreme climate indices are analyzed. At the same time, the relationship between these extreme climate indices and the information about geographical location and atmospheric circulation model was analyzed, respectively. The conclusions are as follows:
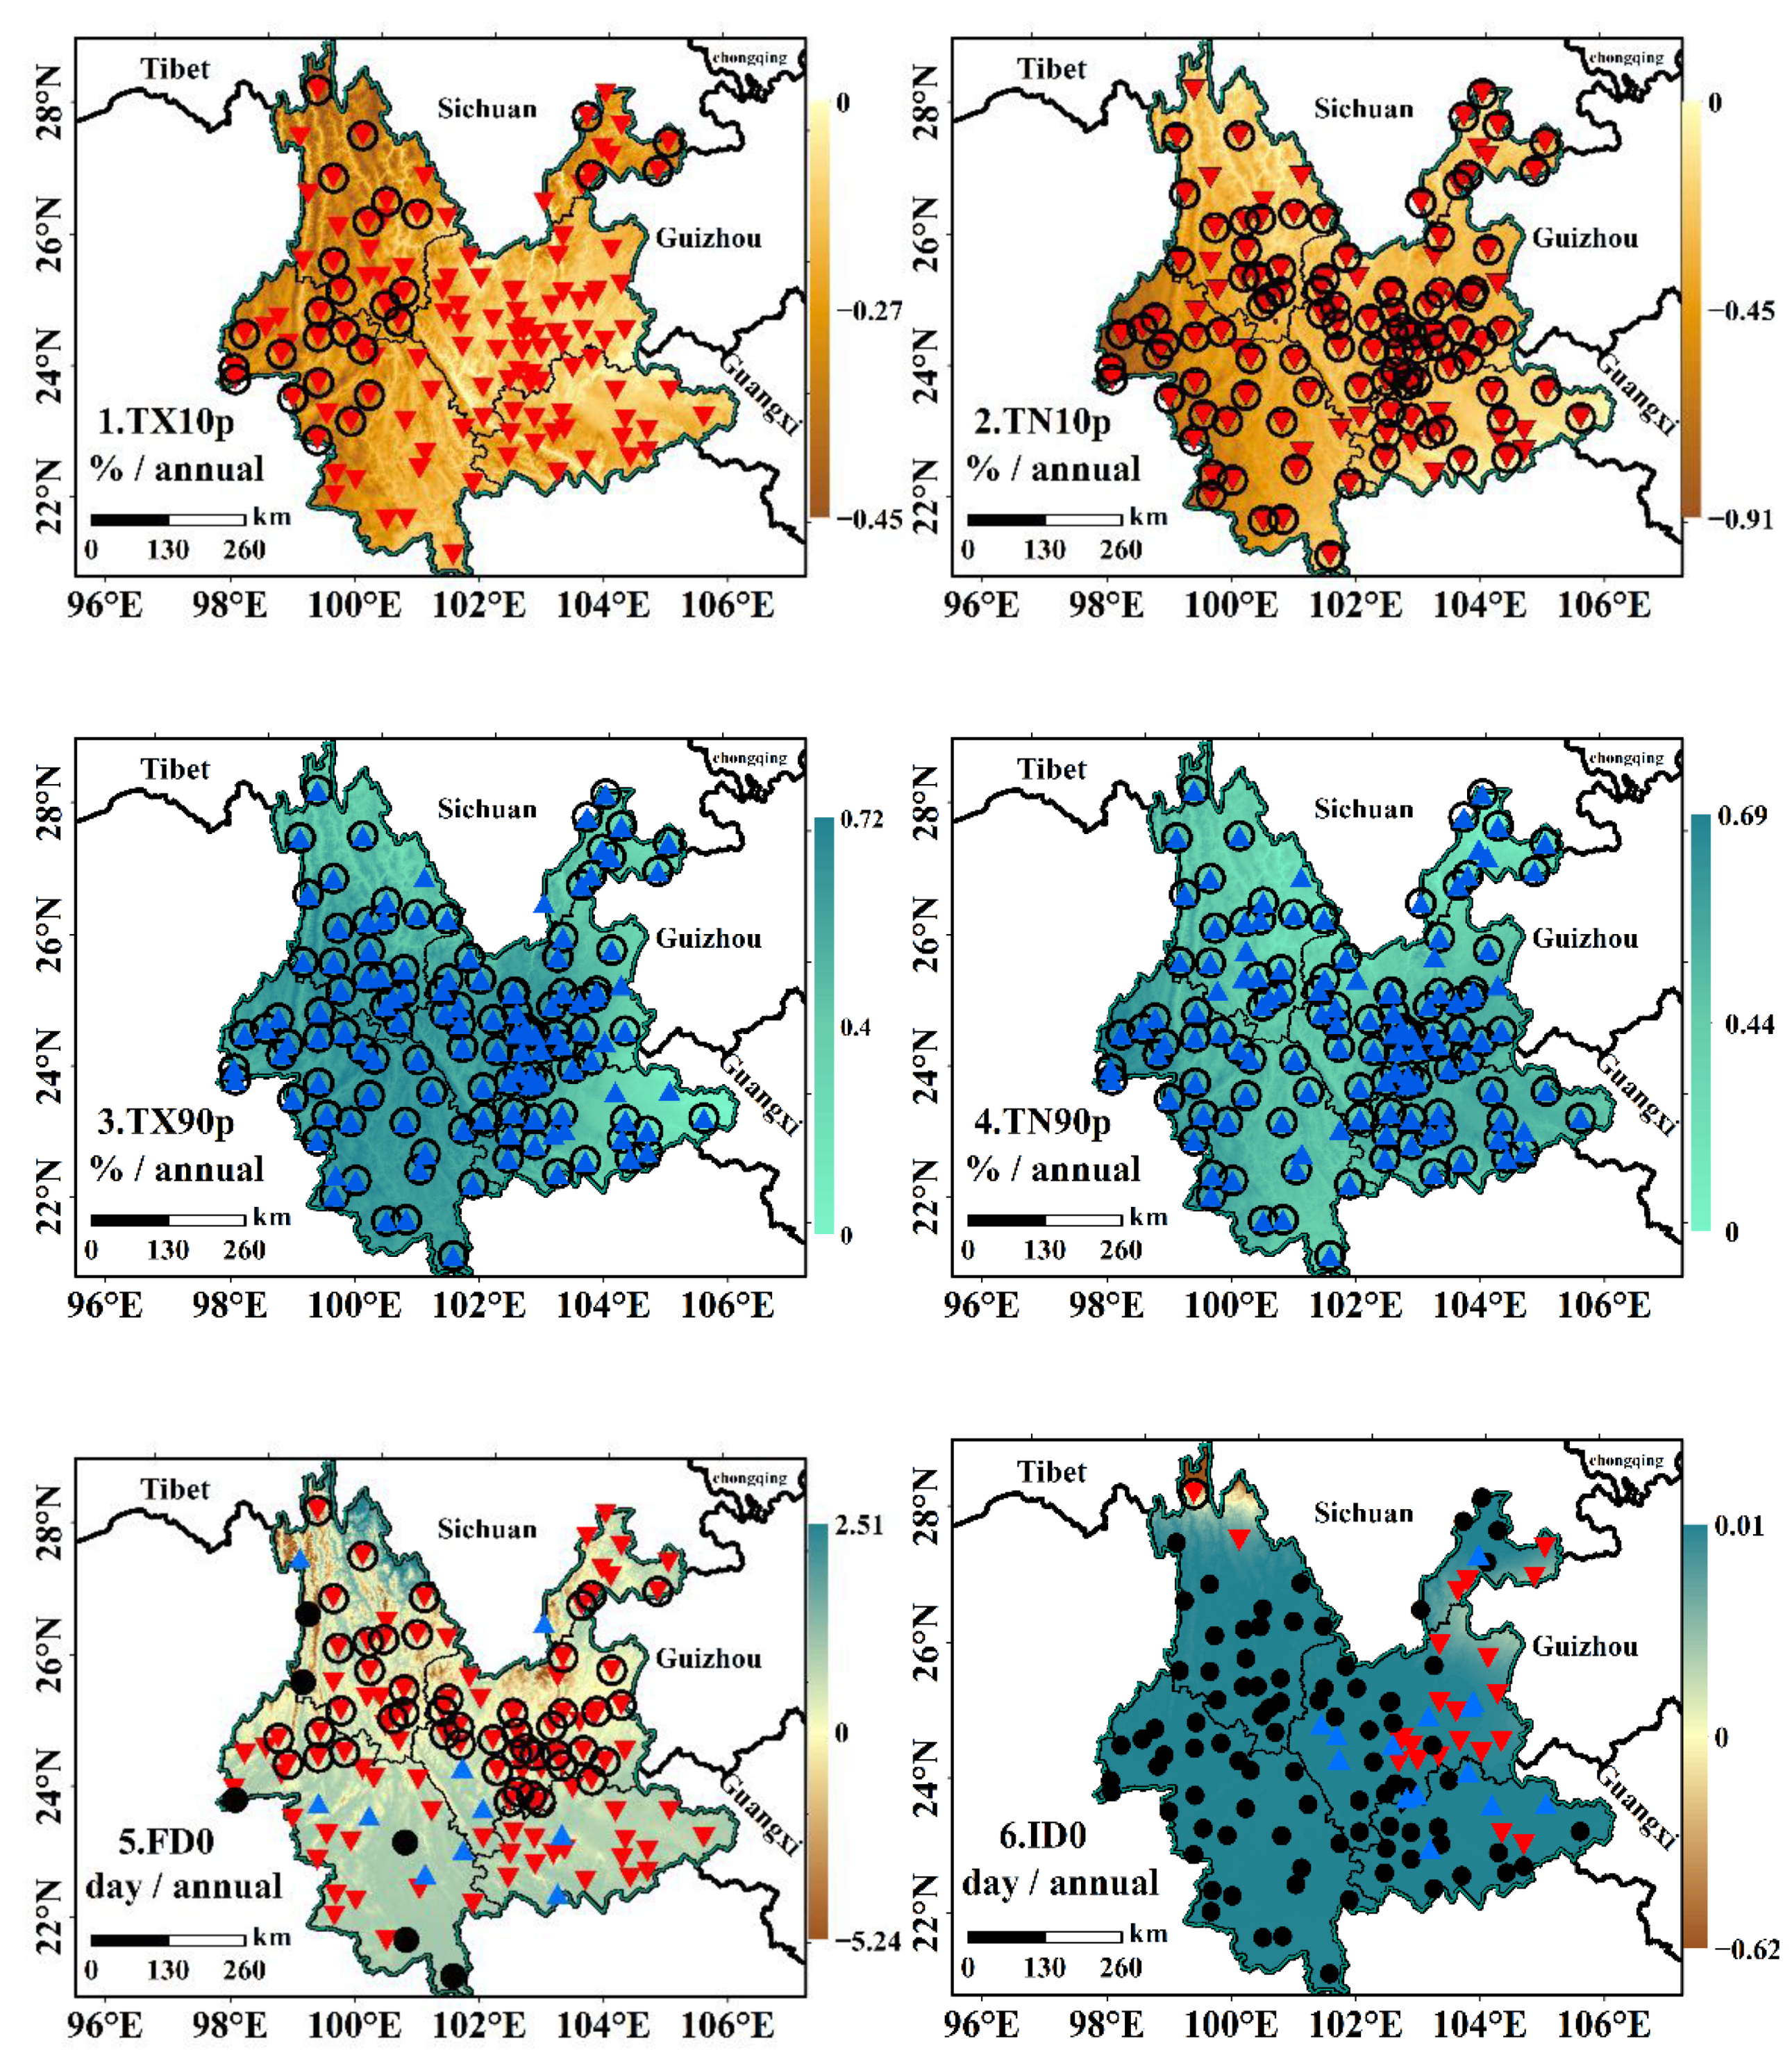
  • In the past 60 years, the extreme temperature has been increasing in Yunnan. The warming rate at night is higher than that during the daytime. The most apparent warming area is located in the southwest of Yunnan.
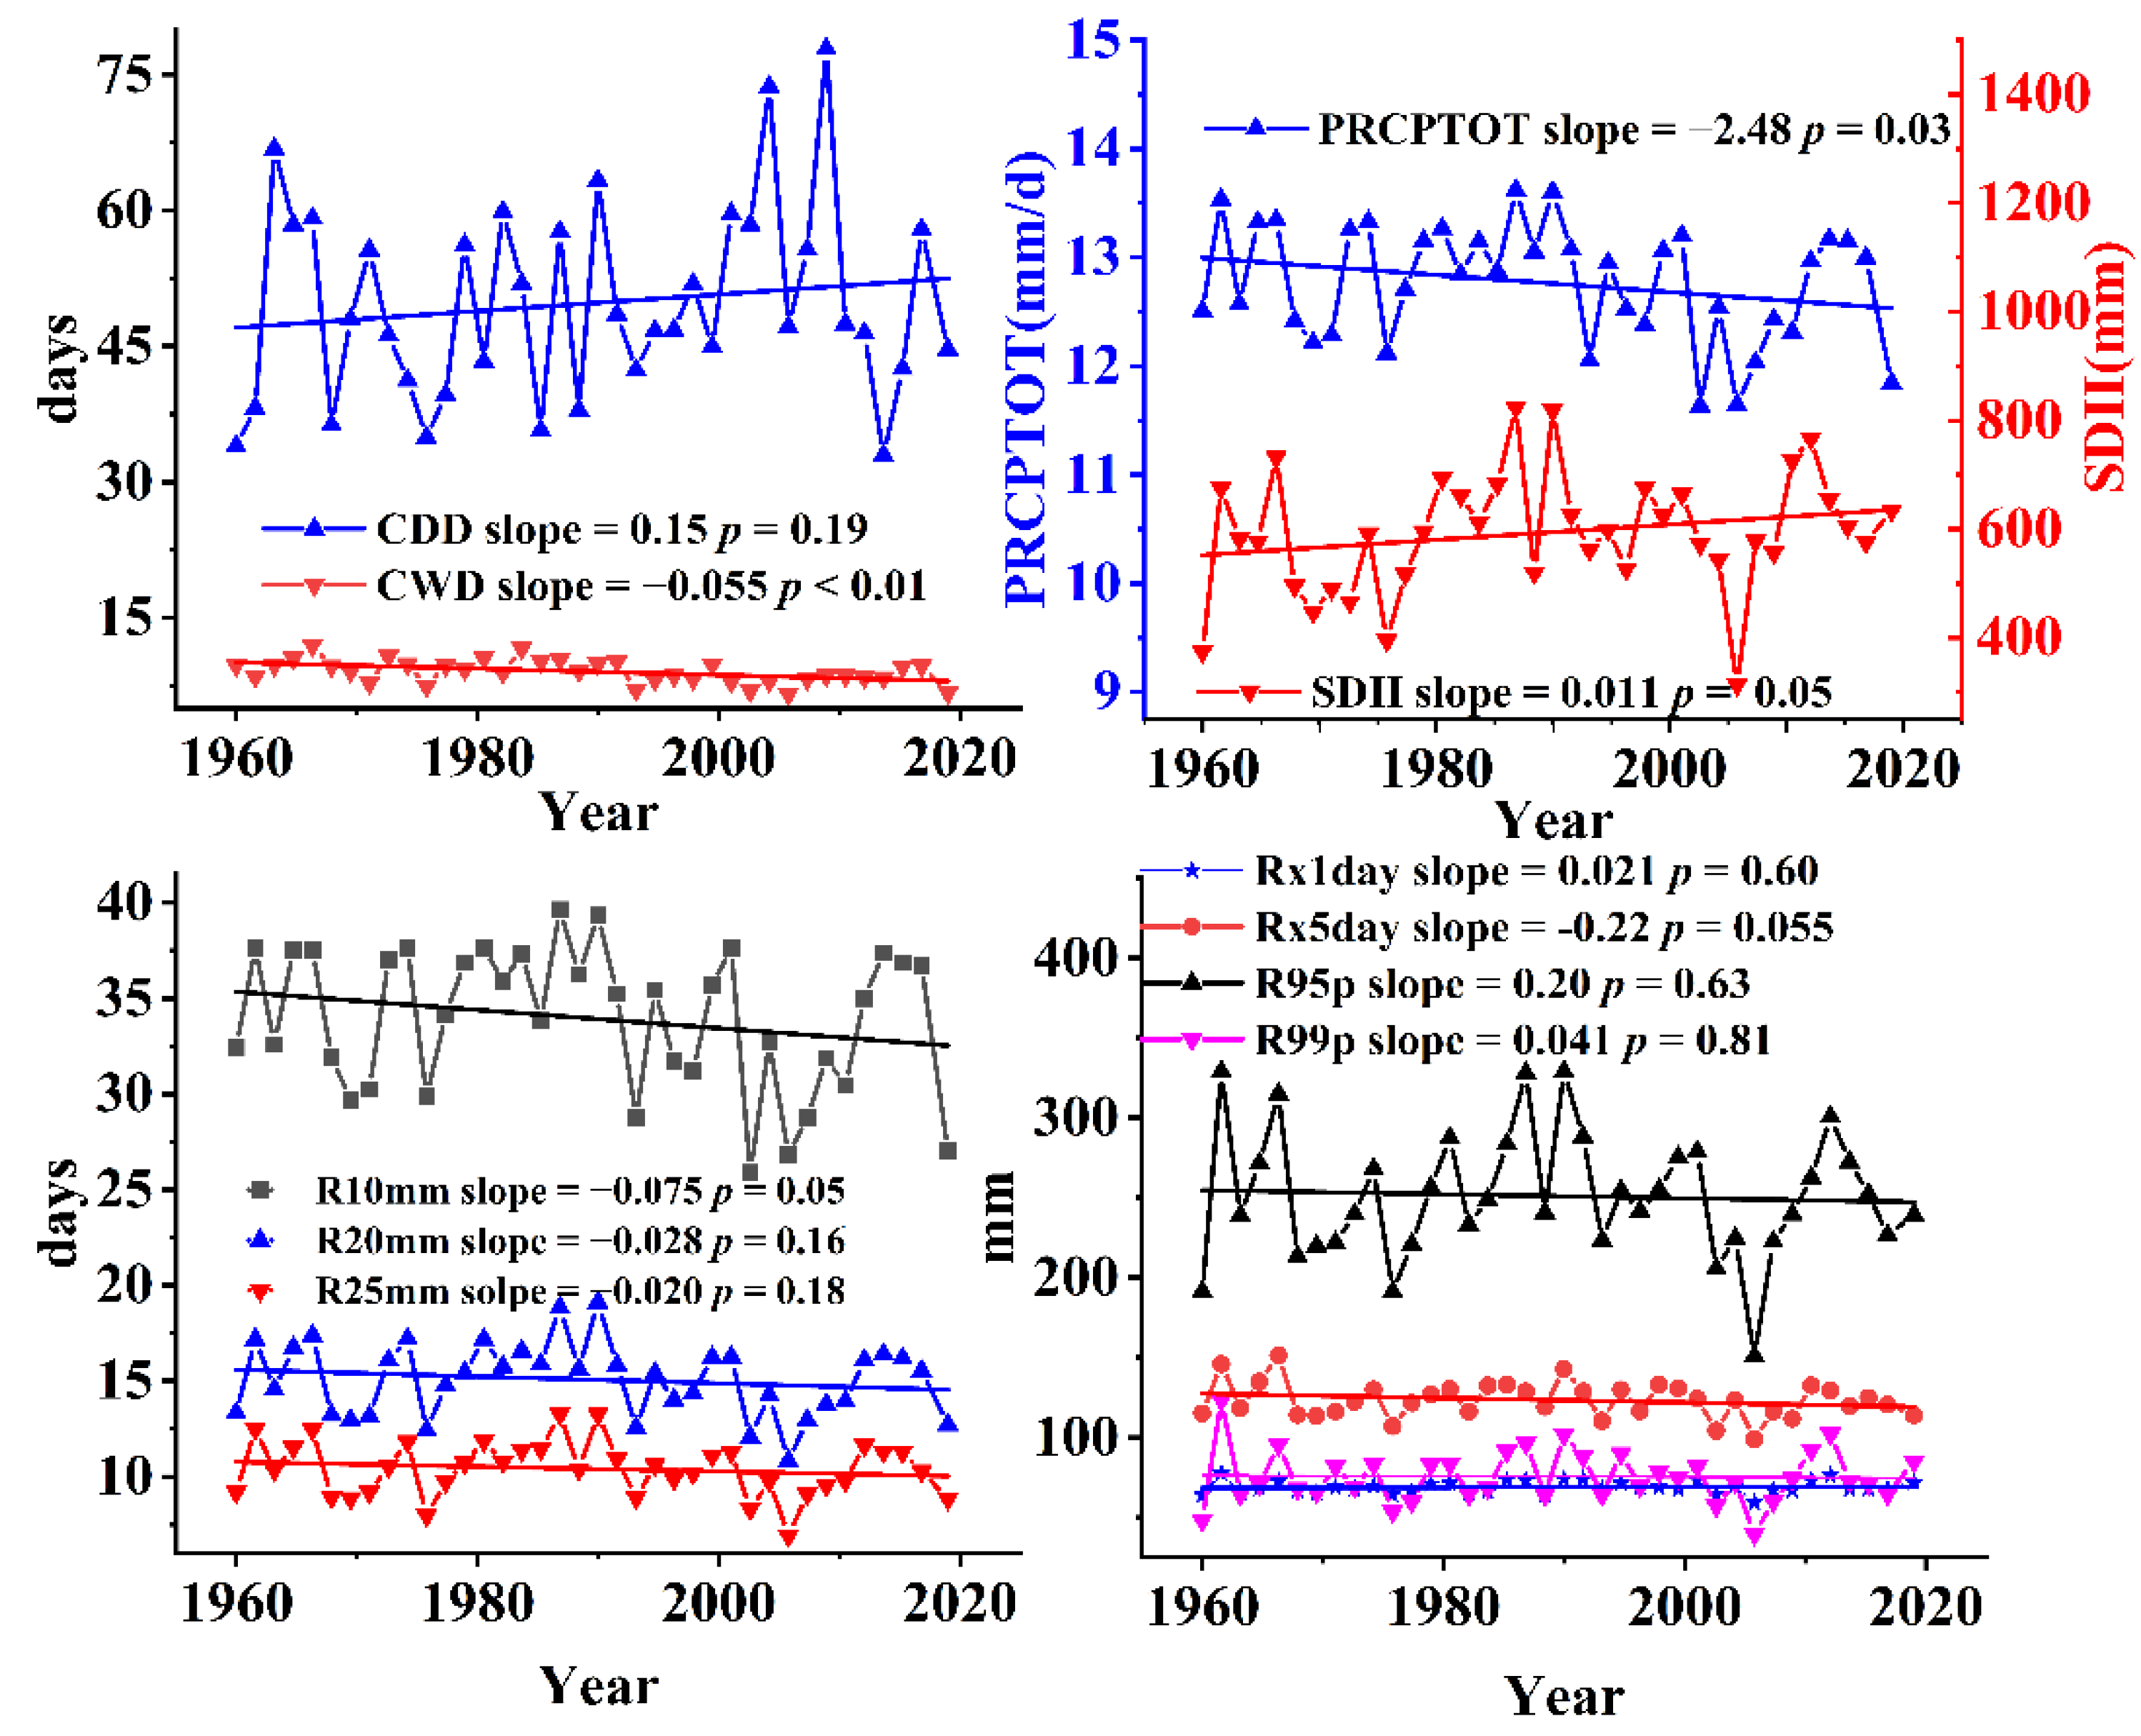
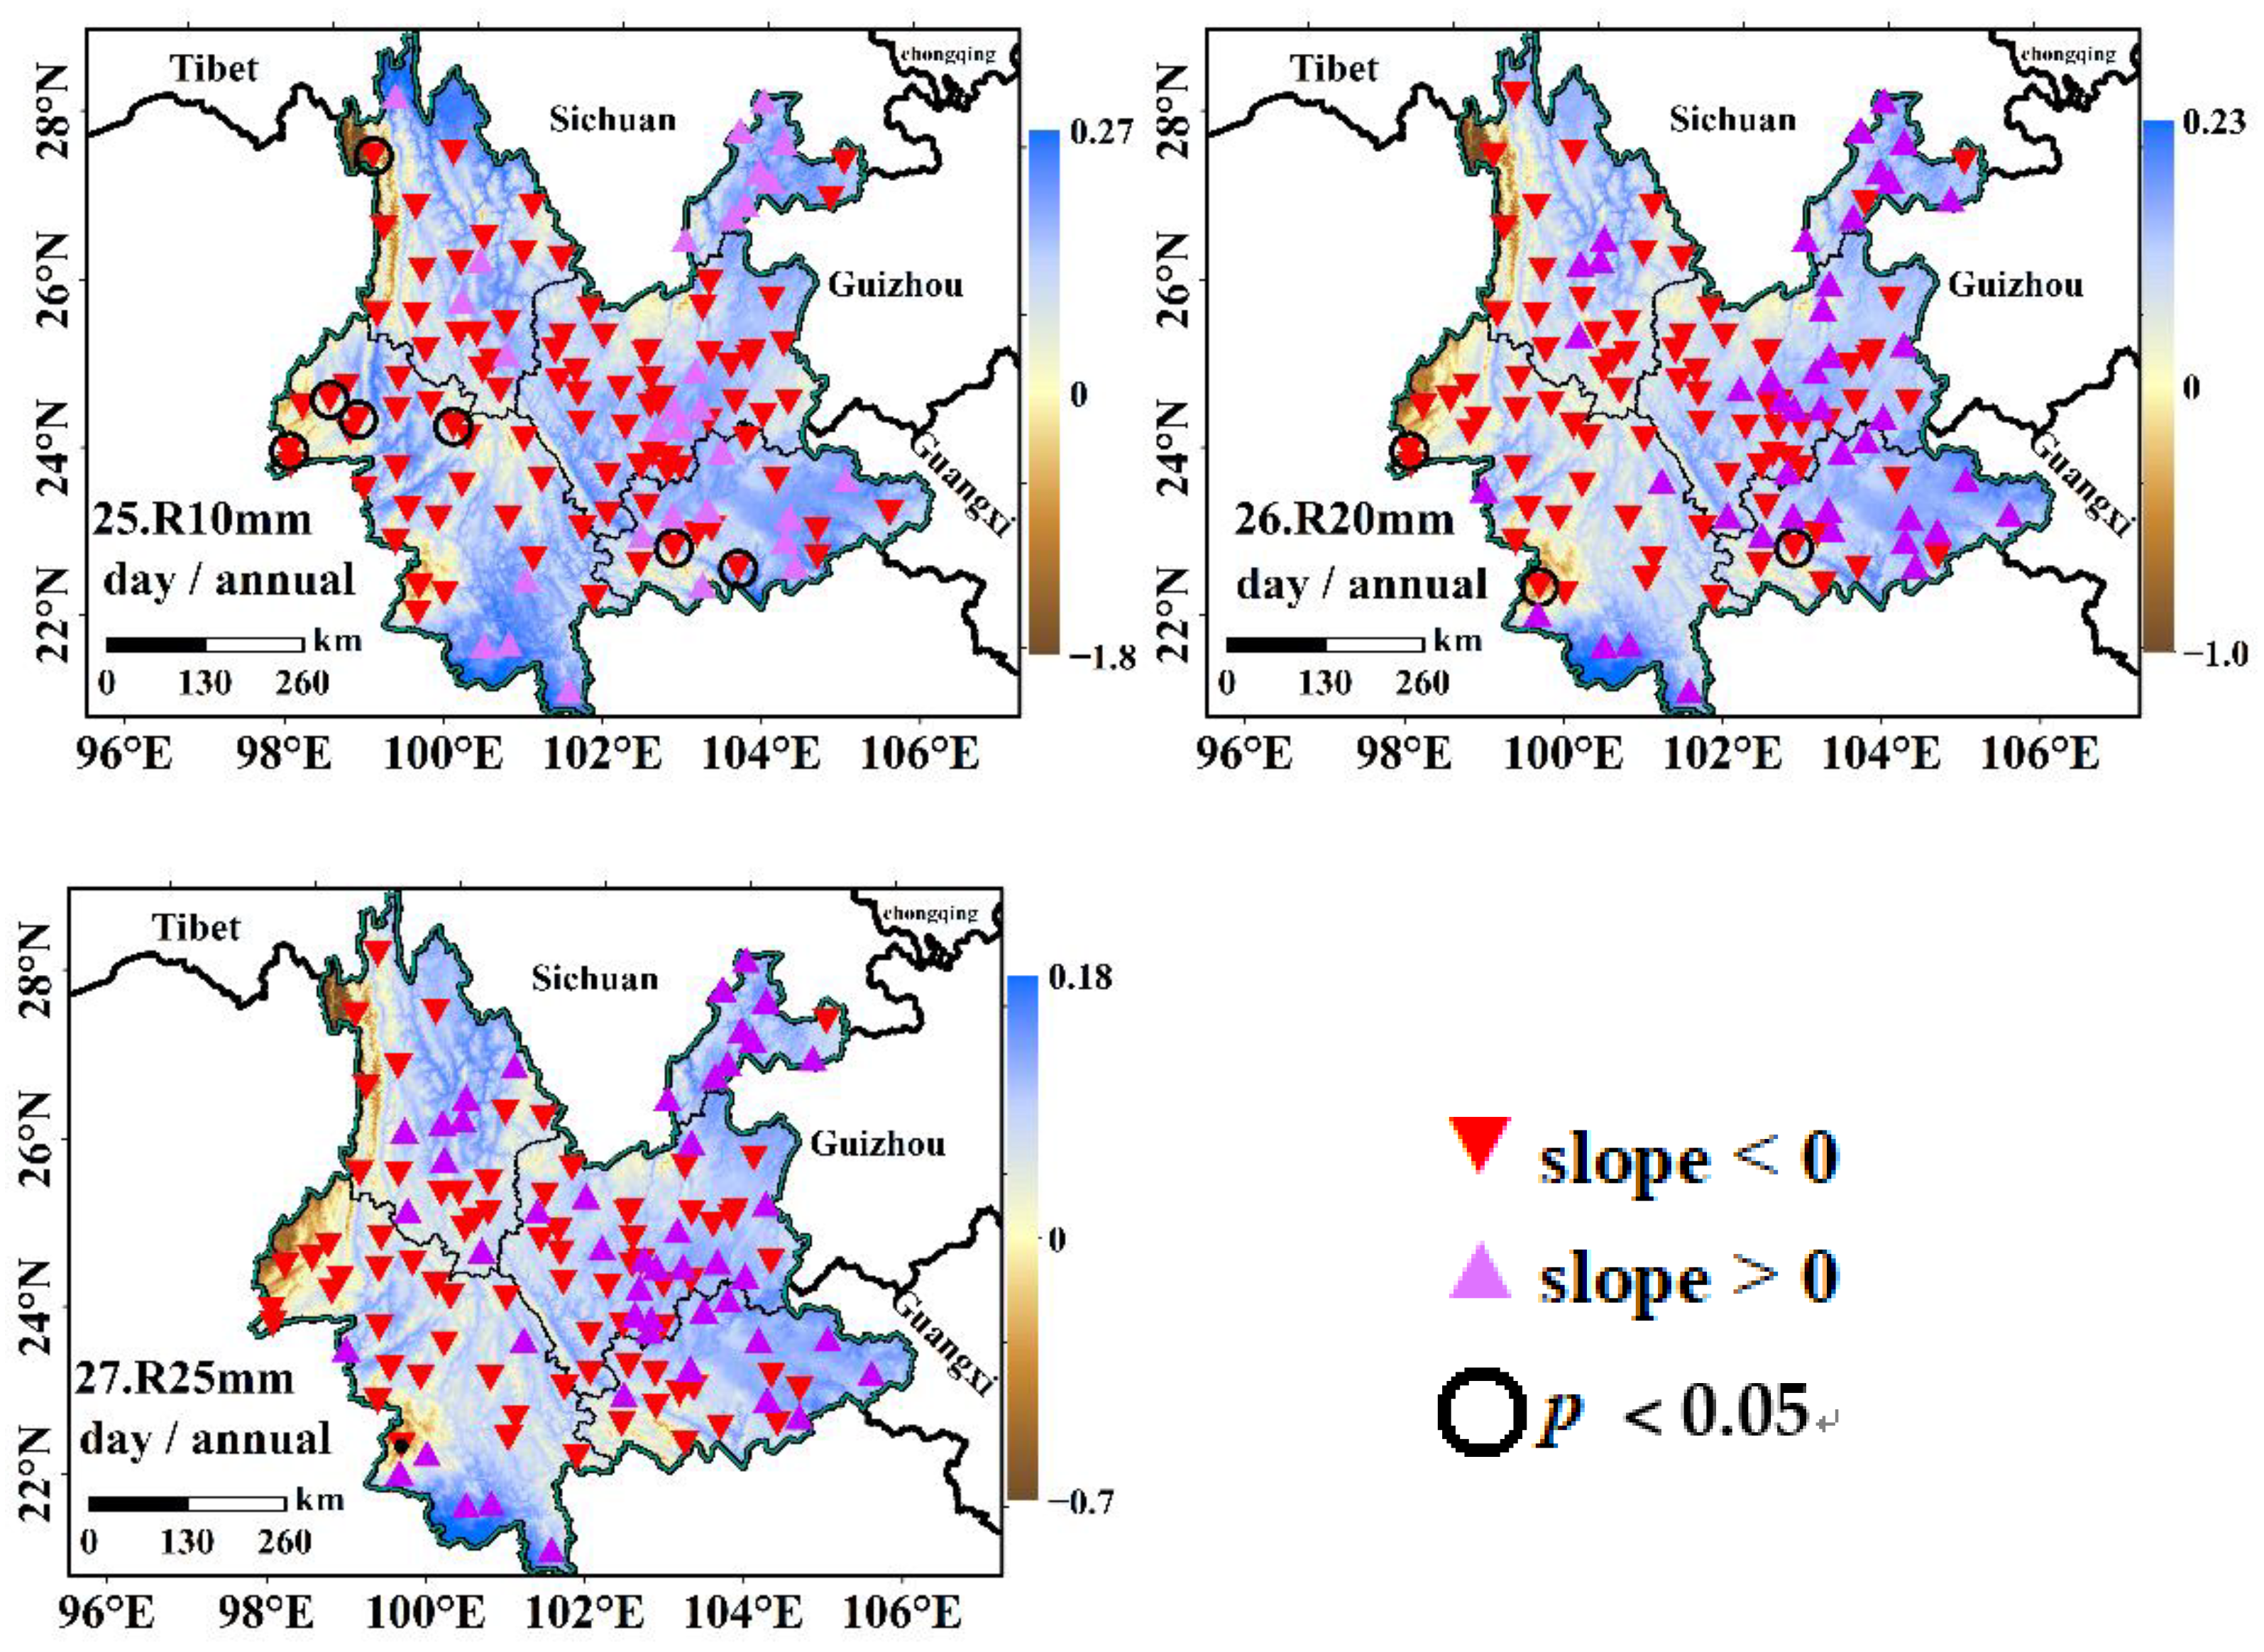
  • Yunnan showed a gradual drying trend, and the extreme precipitation was concentrated into more intense bursts from 1960 to 2019. Most of the extreme precipitation indices showed no significant changes. Only CWD and PRCPTOT showed a significant downward trend (p < 0.05). The spatial difference of extreme precipitation is very different. There was an apparent wetness trend in northeast Yunnan, and the persistent drought (CDD) intensified in the northwest and southwest Yunnan.
  • The cold indices (TX10p TN10p, FD0, ID0, and CSDI) of extreme temperature were negatively correlated with extreme precipitation indices (R × 5 day, PRCPTOT, R10 mm, R20 mm, and R25 mm). Extreme temperature warm indices (TX90p and TN90p) positively correlated with extreme precipitation indices (R × 5 day, CWD, PRCPTOT, R10 mm, R20 mm and R25 mm) in each sub-region. The correlation is most prominent in central Yunnan.
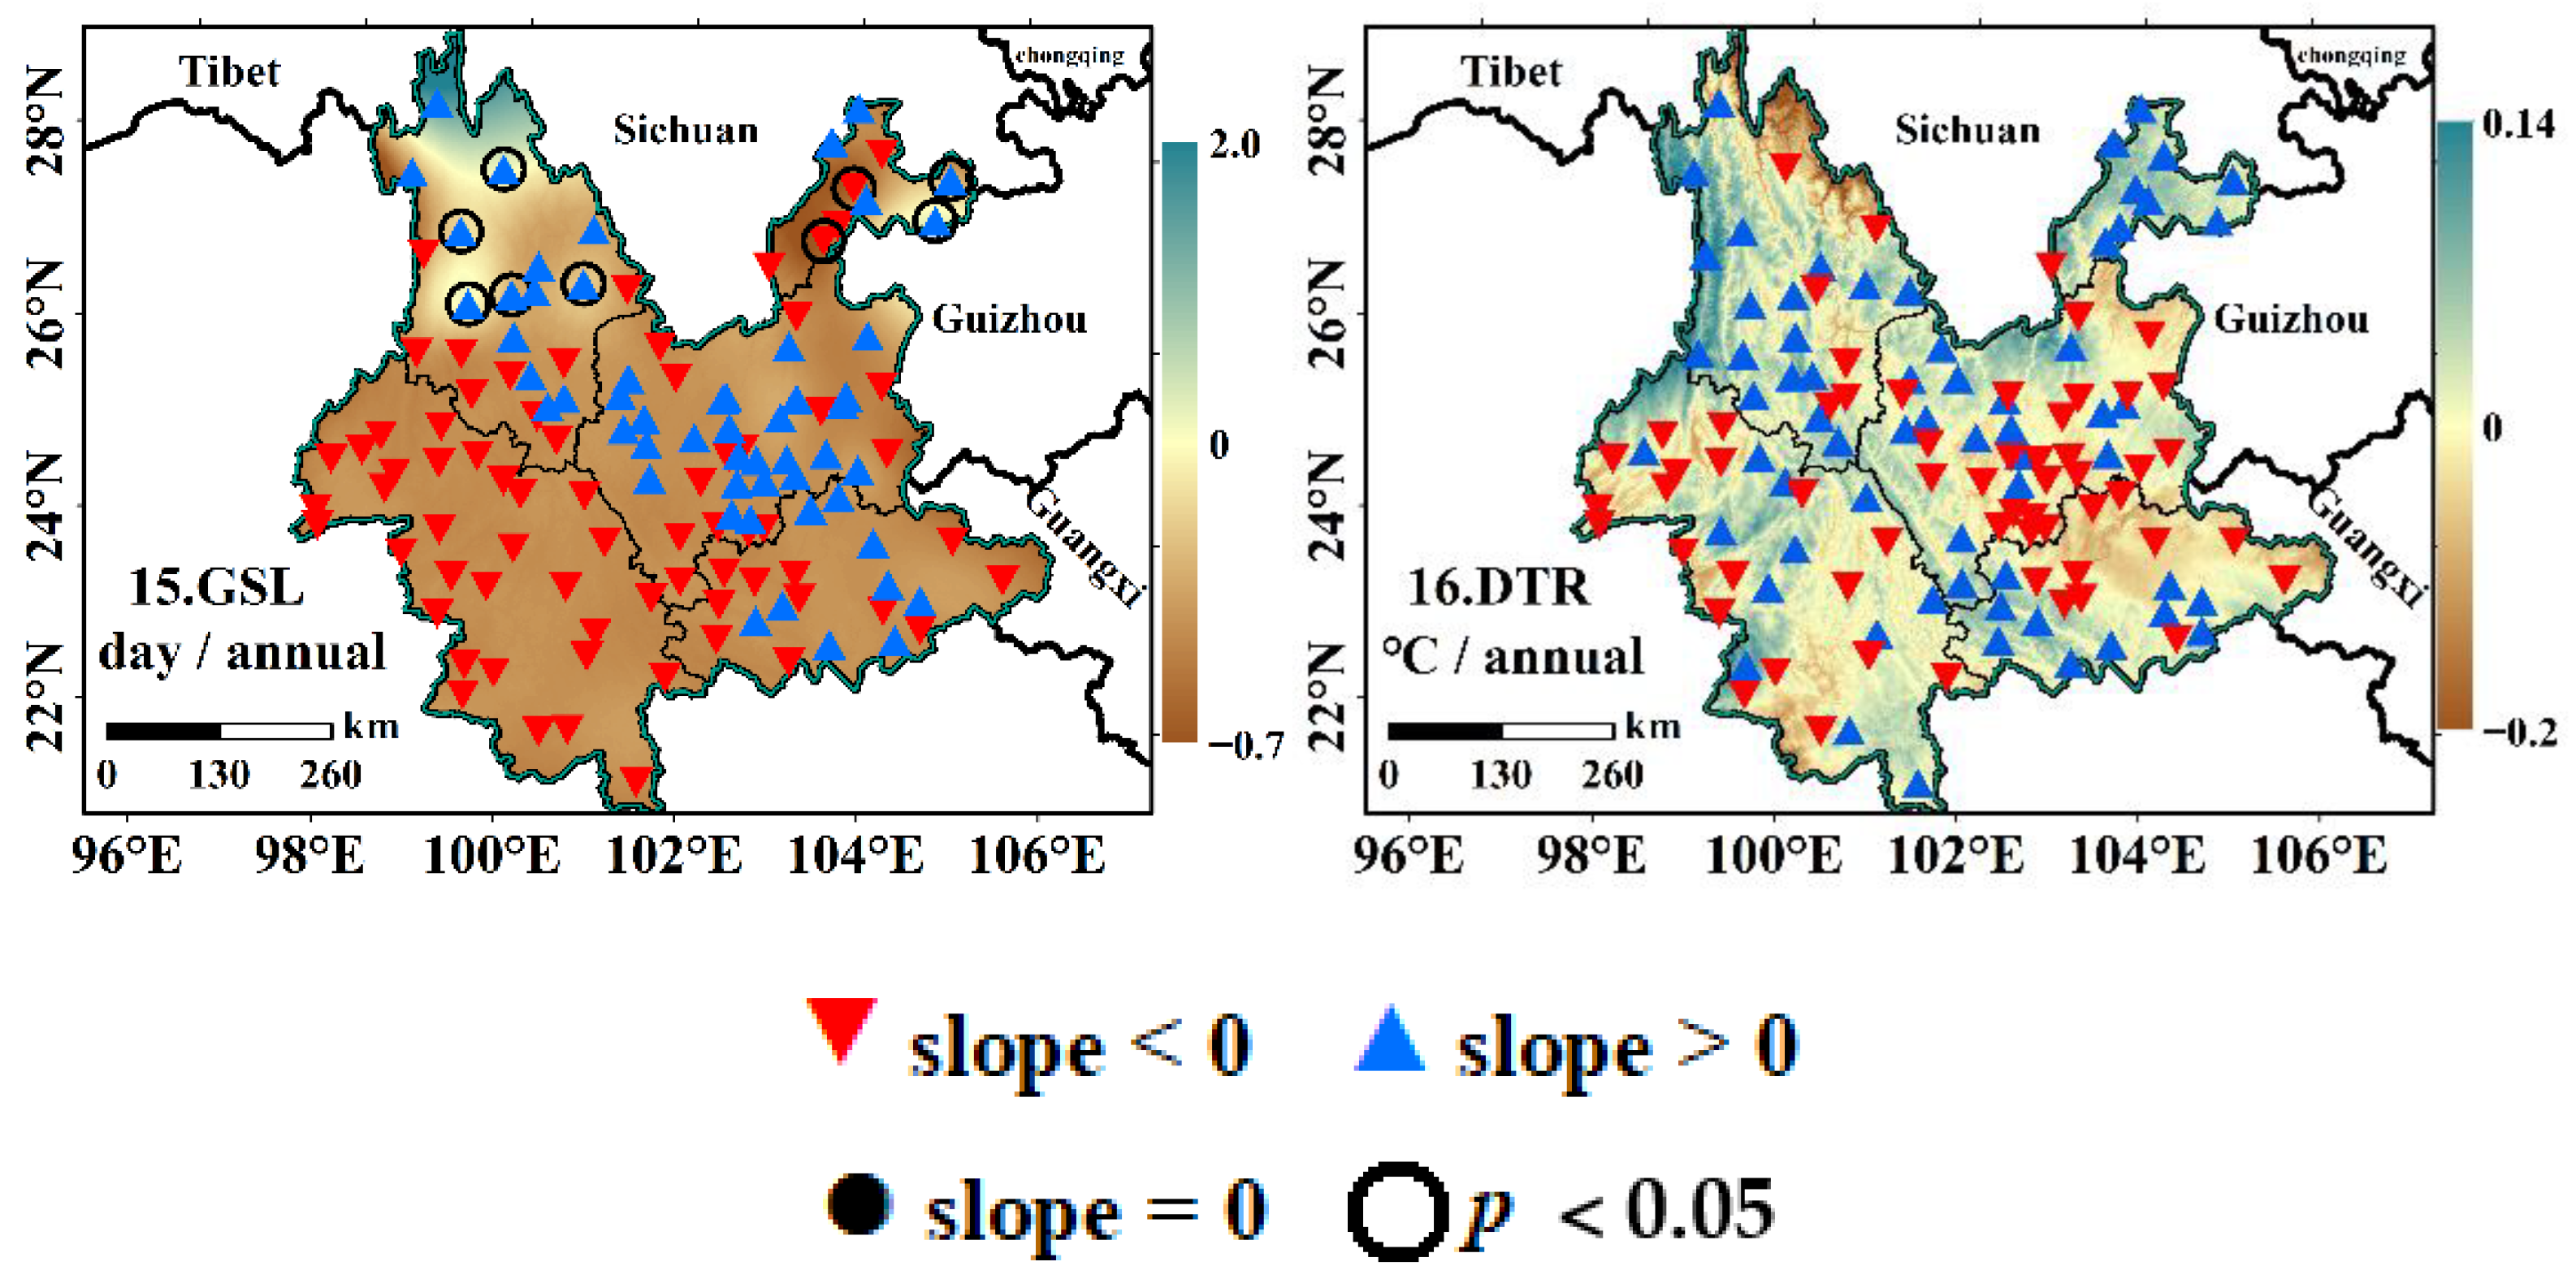
  • Compared with longitude and latitude, altitude is the most critical factor affecting extreme climate change in Yunnan. The change rate of extreme temperature does not increase linearly with altitude. In general, the warming rate in the middle- and high-altitude region is more significant than that in the low altitude region.
  • Compared with ENSO and AO, NAO is a vital circulation pattern affecting extreme climate in Yunnan. NAO had the most significant influence on Yunnan’s extreme climate indices in that month and its following second month. NAO is negatively correlated with extreme temperature warming indices (TN90p, TX90p, SU25, and TR20). The North Atlantic Oscillation (NAO) positively correlates with the temperature cooling indices (TN10p and TX10p).
  • The influence of atmospheric circulation patterns on extreme temperature is more significant than extreme precipitation. In addition to the high correlation between CDD and ENSO, the top five correlations between atmospheric circulation patterns and extreme climate indices that passed the significance test were extreme temperature indices.

Author Contributions

Writing—original draft preparation, gormal analysis, W.Y.; conceptualization, methodology, Y.H.; language polishing, Y.C.; writing-reviewing, X.Q.; writing—reviewing, X.C. All authors have read and agreed to the published version of the manuscript.

Funding

This research was funded by the National Natural Science Foundation of China (41961044).

Informed Consent Statement

Informed consent was obtained from all subjects involved in the study.

Acknowledgments

This research was funded by the National Natural Science Foundation of China (41961044). The authors are grateful to Cai Ya for correcting grammatical and spelling mistakes.

Conflicts of Interest

The authors declare no conflict of interest.

References

  1. Shi, X.Y.; Chen, J.; Gu, L.; Xu, C.Y.; Chen, H.; Zhang, L.P. Impacts and socioeconomic exposures of global extreme precipitation events in 1.5 and 2.0 degrees C warmer climates. Sci. Total Environ. 2021, 766, 142655–142668. [Google Scholar] [CrossRef]
  2. Wallace, J.M.; Held, I.M.; Thompson, D.W.J.; Trenberth, K.E.; Walsh, J.E. Global Warming and Winter Weather. Science 2014, 343, 729–730. [Google Scholar] [CrossRef]
  3. Liu, Y.; Geng, X.; Hao, Z.X.; Zheng, J.Y. Changes in Climate Extremes in Central Asia under 1.5 and 2 degrees C Global Warming and their Impacts on Agricultural Productions. Atmosphere 2020, 11, 1076. [Google Scholar] [CrossRef]
  4. Paparrizos, S.; Matzarakis, A. Assessment of future climate change impacts on the hydrological regime of selected Greek areas with different climate conditions. Hydrol. Res. 2017, 48, 1327–1342. [Google Scholar] [CrossRef]
  5. Solecki, W.; Grimm, N.; Marcotullio, P.; Boone, C.; Lobo, J.; Luque, A.; Romero-Lankao, P.; Young, A.; Zimmerman, R.; Breitzer, R.; et al. Extreme events and climate adaptation-mitigation linkages: Understanding low-carbon transitions in the era of global urbanization. Wiley Interdiscip. Rev.-Clim. Chang. 2019, 10, 616–648. [Google Scholar] [CrossRef]
  6. Sad, H.P.; Kumar, P.; Panda, S.K. Doppler weather radar data assimilation at convective-allowing grid spacing for predicting an extreme weather event in Southern India. Int. J. Remote Sens. 2021, 42, 3681–3707. [Google Scholar] [CrossRef]
  7. Fathian, F.; Ghadami, M.; Haghighi, P.; Amini, M.; Naderi, S.; Ghaedi, Z. Assessment of changes in climate extremes of temperature and precipitation over Iran. Theor. Appl. Climatol. 2020, 141, 1119–1133. [Google Scholar] [CrossRef]
  8. Jiang, D.J.; Zhang, H.; Zhang, Y.; Wang, K. Interannual variability and correlation of vegetation cover and precipitation in Eastern China. Theor. Appl. Climatol. 2014, 118, 93–105. [Google Scholar] [CrossRef]
  9. Xiong, J.N.; Yong, Z.W.; Wang, Z.G.; Cheng, W.M.; Li, Y.; Zhang, H.; Ye, C.C.; Yang, Y.M. Spatial and Temporal Patterns of the Extreme Precipitation across the Tibetan Plateau (1986–2015). Water 2019, 11, 1453. [Google Scholar] [CrossRef] [Green Version]
  10. Yao, J.Q.; Chen, Y.N.; Zhao, Y.; Mao, W.Y.; Xu, X.B.; Liu, Y.; Yang, Q. Response of vegetation NDVI to climatic extremes in the arid region of Central Asia: A case study in Xinjiang, China. Theor. Appl. Climatol. 2018, 131, 1503–1515. [Google Scholar] [CrossRef]
  11. Jenkins, K.; Warren, R. Drought-Damage Functions for the Estimation of Drought Costs under Future Projections of Climate Change. J. Extrem. Events 2015, 2, 29–45. [Google Scholar] [CrossRef] [Green Version]
  12. Wang, X.X.; Jiang, D.B.; Lang, X.M. Future extreme climate changes linked to global warming intensity. Sci. Bull. 2017, 62, 1673–1680. [Google Scholar] [CrossRef] [Green Version]
  13. Gujree, I.; Wani, I.; Muslim, M.; Farooq, M.; Meraj, G. Evaluating the variability and trends in extreme climate events in the Kashmir Valley using PRECIS RCM simulations. Modeling Earth Syst. Environ. 2017, 3, 1647–1662. [Google Scholar] [CrossRef]
  14. Alexander, L.V.; Zhang, X.; Peterson, T.C.; Caesar, J.; Gleason, B.; Tank, A.; Haylock, M.; Collins, D.; Trewin, B.; Rahimzadeh, F.; et al. Global observed changes in daily climate extremes of temperature and precipitation. J. Geophys. Res.-Atmos. 2006, 111, 1–22. [Google Scholar] [CrossRef] [Green Version]
  15. Groisman, P.Y.; Knight, R.W.; Easterling, D.R.; Karl, T.R.; Hegerl, G.C.; Razuvaev, V.A.N. Trends in intense precipitation in the climate record. J. Clim. 2005, 18, 1326–1350. [Google Scholar] [CrossRef]
  16. Westra, S.; Alexander, L.V.; Zwiers, F.W. Global Increasing Trends in Annual Maximum Daily Precipitation. J. Clim. 2013, 26, 3904–3918. [Google Scholar] [CrossRef] [Green Version]
  17. Donat, M.G.; Alexander, L.V.; Yang, H.; Durre, I.; Vose, R.; Dunn, R.J.H.; Willett, K.M.; Aguilar, E.; Brunet, M.; Caesar, J.; et al. Updated analyses of temperature and precipitation extreme indices since the beginning of the twentieth century: The HadEX2 dataset. J. Geophys. Res.-Atmos. 2013, 118, 2098–2118. [Google Scholar] [CrossRef]
  18. Bagtasa, G. 118-year climate and extreme weather events of Metropolitan Manila in the Philippines. Int. J. Climatol. 2020, 40, 1228–1240. [Google Scholar] [CrossRef]
  19. Saha, U.; Singh, T.; Sharma, P.; Das Gupta, M.; Prasad, V.S. Deciphering the extreme rainfall scenario over Indian landmass using satellite observations, reanalysis and model forecast: Case studies. Atmos. Res. 2020, 240, 104943–104961. [Google Scholar] [CrossRef]
  20. Zhu, Y. Temporal and Spatial Trends of Extreme Temperature and Precipitation in Coastal Areas of Mainland China and Their Effects on Vegetation. Master’s Thesis, East China Normal University, Shanghai, China, 2019. [Google Scholar]
  21. Zhao, C.-Y.; Wang, Y.; Zhou, X.-Y.; Cui, Y.; Liu, Y.-L.; Shi, D.-M.; Yu, H.-M.; Liu, Y.-Y. Changes in Climatic Factors and Extreme Climate Events in Northeast China during 1961–2010. Adv. Clim. Chang. Res. 2013, 4, 92–102. [Google Scholar]
  22. Cao, Q.; Hao, Z.C.; Fu, X.J.; Hao, J.; Lu, C.Y. Analysis of Spatial-Temporal Changes of Extreme Climatic Elements in China from 1960 to 2017. Yellow River 2020, 42, 11–17. [Google Scholar] [CrossRef]
  23. Lu, S.; Hu, Z.Y.; Wang, B.P.; Qin, P.; Wang, L. Spatio-temporal Patterns of Extreme Precipitation Events over China in Recent 56 Years. Plateau Meteorol. 2020, 39, 683–693. [Google Scholar] [CrossRef]
  24. Chen, X.R.; Yang, Y.; He, J.N.; Qi, X.; Wu, Z.F.; Du, H.B. Spatio-temporal Change of Persistent Extreme Precipitation and the Associated Circulation Causes Over China in the Last 60 Years. Resour. Environ. Yangtze Basin 2020, 29, 2068–2081. [Google Scholar] [CrossRef]
  25. Li, Y.E.; Zhang, W.Y.; Chen, S.N.; Han, F.R. Characteristics and Causes of Extreme Precipitation in Southwestern Hubei During 2008–2017. J. Arid. Meteorol. 2019, 37, 875–884. [Google Scholar] [CrossRef]
  26. Chu, Q.C. Roles of Moisture Sources and Transport in Precipitation Variabilities during the Flood Season over East China and Related Climate Dynamics. Ph.D. Thesis, Lanzhou University, Lan Zhou, China, 2020. [Google Scholar]
  27. Chen, X.H.; Zhang, X.Z.; Zhang, X.P.; Long, X.Y. Long-term Variation of Regional Extreme Precipitation in Jiangnan Area and Its Possible Cause. Resour. Environ. Yangtze Basin 2020, 29, 1757–1767. [Google Scholar] [CrossRef]
  28. Han, D.D. Changes of Vegetation and Its response to Extreme Climate in the Loess Plateau. Master’s Thesis, Chinese Academy of Sciences, Beijing, China, 2020. [Google Scholar]
  29. Jiang, S.S.; Chen, X.; Smettem, K.; Wang, T.J. Climate and land use influences on changing spatiotemporal patterns of mountain vegetation cover in southwest China. Ecol. Indic. 2021, 121, 456–475. [Google Scholar] [CrossRef]
  30. Yu, Y.H.; Wang, J.L.; Cheng, F.; Deng, H.; Chen, S. Drought monitoring in Yunnan Province based on a TRMM precipitation product. Nat. Hazards 2020, 104, 2369–2387. [Google Scholar] [CrossRef]
  31. Xu, Y.B.; Lei, Q.L.; Zhou, J.G.; Zhang, Y.T.; Wu, S.X.; Zhai, L.M.; Wang, H.Y.; Li, Y.; Liu, H.B. Study on the change characteristics of extreme climate indices from 1960 to 2015 in yunnan province, China. Chin. J. Agric. Resour. Reg. Plan. 2020, 41, 15–27. [Google Scholar] [CrossRef]
  32. Cao, Y.; Wang, J.; Zhang, L.; Qi, N.; Duan, Q.C. Temporal and spatial variation analysis of extreme precipitation at central area of Yunnan Province. Yangtze River 2017, 48, 50–55. [Google Scholar] [CrossRef]
  33. Duan, X.; Tao, Y. The climate change of yunnan over the last 50 years. J. Trop. Meteorol. 2012, 28, 243–250. [Google Scholar] [CrossRef]
  34. Zheng, J.Y.; Yin, Y.H.; Li, B.Y. A New Scheme for Climate Regionalization in China. Acta Geogr. Sin. 2010, 65, 3–12. [Google Scholar]
  35. Liu, Z.H.; Li, L.T.; McVicar, T.R.; Van Niel, T.G.; Yang, Q.K.; Li, R. Introduction of the professional interpolation software for meteorology Data ANUSPLINN2-100. Meteorol. Mon. 2008, 2, 92–100. [Google Scholar]
  36. dos Santos, C.A.C.; Neale, C.M.U.; Rao, T.V.R.; da Silva, B.B. Trends in indices for extremes in daily temperature and precipitation over Utah, USA. Int. J. Climatol. 2011, 31, 1813–1822. [Google Scholar] [CrossRef]
  37. Shi, J.; Cui, L.L.; Wen, K.M.; Tian, Z.; Wei, P.P.; Zhang, B.W. Trends in the consecutive days of temperature and precipitation extremes in China during 1961–2015. Environ. Res. 2018, 161, 381–391. [Google Scholar] [CrossRef] [PubMed]
  38. Ruiz-Alvarez, O.; Singh, V.P.; Enciso-Medina, J.; Ontiveros-Capurata, R.E.; dos Santos, C.A.C. Observed trends in daily temperature extreme indices in Aguascalientes, Mexico. Theor. Appl. Climatol. 2020, 142, 1425–1445. [Google Scholar] [CrossRef]
  39. Zhao, A.Z.; Zhang, A.B.; Liu, X.F.; Cao, S. Spatiotemporal changes of normalized difference vegetation index (NDVI) and response to climate extremes and ecological restoration in the Loess Plateau, China. Theor. Appl. Climatol. 2018, 132, 555–567. [Google Scholar] [CrossRef]
  40. Tong, S.Q.; Li, X.Q.; Zhang, J.Q.; Bao, Y.H.; Bao, Y.B.; Na, L.; Si, A.L. Spatial and temporal variability in extreme temperature and precipitation events in Inner Mongolia (China) during 1960–2017. Sci. Total Environ. 2019, 649, 75–89. [Google Scholar] [CrossRef] [PubMed]
  41. Li, C.L.; Wang, J.; Hu, R.C.; Yin, S.; Bao, Y.H.; Ayal, D.Y. Relationship between vegetation change and extreme climate indices on the Inner Mongolia Plateau, China, from 1982 to 2013. Ecol. Indic. 2018, 89, 101–109. [Google Scholar] [CrossRef]
  42. May, R.M. Thresholds and breakpoints in ecosystems with a multiplicity of stable states. Nature 1977, 269, 471–477. [Google Scholar] [CrossRef]
  43. Zhang, D.F.; Gao, X.J. Climate change of the 21st century over China from the ensemble of RegCM4 simulations. Chin. Sci. Bull. Chin. 2020, 65, 2516–2526. [Google Scholar] [CrossRef]
  44. Chen, W.; Dong, B.W. Projected near-term changes in temperature extremes over China in the mid-twenty-first century and underlying physical processes. Clim. Dyn. 2021, 56, 1879–1894. [Google Scholar] [CrossRef]
  45. Zhao, N.; Chen, M. A Comprehensive Study of Spatiotemporal Variations in Temperature Extremes across China during 1960-2018. Sustainability 2021, 13, 3807. [Google Scholar] [CrossRef]
  46. Ossola, A.; Jenerette, G.D.; McGrath, A.; Chow, W.; Hughes, L.; Leishman, M.R. Small vegetated patches greatly reduce urban surface temperature during a summer heatwave in Adelaide, Australia. Landsc. Urban Plan. 2021, 209, 46–75. [Google Scholar] [CrossRef]
  47. Mohan, S.; Clarke, R.M.; Chadee, X.T. Variations in extreme temperature and precipitation for a Caribbean island: Barbados (1969–2017). Theor. Appl. Climatol. 2020, 140, 1277–1290. [Google Scholar] [CrossRef]
  48. Yu, H.Y.; Liu, P.; Zhang, Y. The combined effects of ENSO and Arctic Oscillation on wintertime fog days in eastern China. Theor. Appl. Climatol. 2021, 144, 1233–1251. [Google Scholar] [CrossRef]
  49. Yang, W.C.; Jin, F.M.; Si, Y.J.; Li, Z. Runoff change controlled by combined effects of multiple environmental factors in a headwater catchment with cold and arid climate in northwest China. Sci. Total Environ. 2021, 756, 143955–143985. [Google Scholar] [CrossRef]
  50. Liu, X.W.; Xu, Z.X.; Peng, D.Z.; Wu, G.C. Influences of the North Atlantic Oscillation on extreme temperature during the cold period in China. Int. J. Climatol. 2019, 39, 43–49. [Google Scholar] [CrossRef] [Green Version]
  51. Lai, W.L.; Wang, H.R.; Zhang, J. Comprehensive assessment of drought from 1960 to 2013 in China based on different perspectives. Theor. Appl. Climatol. 2018, 134, 585–594. [Google Scholar] [CrossRef]
  52. Gobiet, A.; Kotlarski, S.; Beniston, M.; Heinrich, G.; Rajczak, J.; Stoffel, M. 21st century climate change in the European Alps—A review. Sci. Total Environ. 2014, 493, 1138–1151. [Google Scholar] [CrossRef]
  53. Yang, Y.Q.; Jun, Z.; Sui, X.; He, X. Study of the spatial connection between urbanization and the ecosystem-A case study of Central Yunnan (China). PLoS ONE 2020, 15, e0238192. [Google Scholar] [CrossRef]
  54. Tao, W.K.; Li, X.W.; Khain, A.; Matsui, T.; Lang, S.; Simpson, J. Role of atmospheric aerosol concentration on deep convective precipitation: Cloud-resolving model simulations. J. Geophys. Res. -Atmos. 2007, 112, 8728–8745. [Google Scholar] [CrossRef] [Green Version]
  55. Cao, Q.; Jiang, B.; Shen, X.; Lin, W.; Chen, J. Microphysics effects of anthropogenic aerosols on urban heavy precipitation over the Pearl River Delta, China. Atmos. Res. 2021, 253, 478–493. [Google Scholar] [CrossRef]
  56. Subba, T.; Gogoi, M.M.; Pathak, B.; Bhuyan, P.K.; Babu, S.S. Recent trend in the global distribution of aerosol direct radiative forcing from satellite measurements. Atmos. Sci. Lett. 2020, 21, 2873–2895. [Google Scholar] [CrossRef]
  57. Wang, W.G.; Shao, Q.X.; Yang, T.; Peng, S.Z.; Yu, Z.B.; Taylor, J.; Xing, W.Q.; Zhao, C.P.; Sun, F.C. Changes in daily temperature and precipitation extremes in the Yellow River Basin, China. Stoch. Environ. Res. Risk Assess. 2013, 27, 401–421. [Google Scholar] [CrossRef]
  58. Allan, R.P.; Soden, B.J. Atmospheric warming and the amplification of precipitation extremes. Science 2008, 321, 1481–1484. [Google Scholar] [CrossRef] [PubMed] [Green Version]
  59. Knapp, A.K.; Beier, C.; Briske, D.D.; Classen, A.T.; Luo, Y.; Reichstein, M.; Smith, M.D.; Smith, S.D.; Bell, J.E.; Fay, P.A.; et al. Consequences of More Extreme Precipitation Regimes for Terrestrial Ecosystems. Bioscience 2008, 58, 811–821. [Google Scholar] [CrossRef]
  60. Micu, D.M.; Amihaesei, V.A.; Milian, N.; Cheval, S. Recent changes in temperature and precipitation indices in the Southern Carpathians, Romania (1961–2018). Theor. Appl. Climatol. 2021, 144, 691–710. [Google Scholar] [CrossRef]
  61. Guo, Q.K.; Cheng, S.Y.; Qin, W.; Ning, D.H.; Shan, Z.J.; Yin, Z. Vertical variation and temporal trends of extreme precipitation indices in a complex topographical watershed in the Hengduan Mountain Region, China. Int. J. Climatol. 2020, 40, 3250–3267. [Google Scholar] [CrossRef]
  62. Zhang, Q.; Xiao, M.Z.; Li, J.F.; Singh, V.P.; Wang, Z.Z. Topography-based spatial patterns of precipitation extremes in the Poyang Lake basin, China: Changing properties and causes. J. Hydrol. 2014, 512, 229–239. [Google Scholar] [CrossRef]
  63. Marshall, G.J.; Jylha, K.; Kivinen, S.; Laapas, M.; Dyrrdal, A.V. The role of atmospheric circulation patterns in driving recent changes in indices of extreme seasonal precipitation across Arctic Fennoscandia. Clim. Chang. 2020, 162, 741–759. [Google Scholar] [CrossRef]
  64. Shi, J.; Cui, L.L.; Wang, J.B.; Du, H.Q.; Wen, K.M. Changes in the temperature and precipitation extremes in China during 1961-2015. Quat. Int. 2019, 527, 64–78. [Google Scholar] [CrossRef]
  65. Li, C.Y.; Yang, H.; Zhao, J.J. Combinational anomalies of atmospheric circulation system and occurrences of extreme weather/climate events. Trans. Atmos. Sci. 2019, 42, 321–333. [Google Scholar] [CrossRef]
  66. Yao, Y.; Luo, D.H. An Asymmetric Spatiotemporal Connection between the Euro-Atlantic Blocking within the NAO Life Cycle and European Climates. Adv. Atmos. Sci. 2018, 35, 796–812. [Google Scholar] [CrossRef]
  67. Wazneh, H.; Gachon, P.; Laprise, R.; de Vernal, A.; Tremblay, B. Atmospheric blocking events in the North Atlantic: Trends and links to climate anomalies and teleconnections. Clim. Dyn. 2020, 21, e975–e987. [Google Scholar] [CrossRef]
  68. Quiquet, A.; Dumas, C. The GRISLI-LSCE contribution to the Ice Sheet Model Intercomparison Project for phase 6 of the Coupled Model Intercomparison Project (ISMIP6)—Part 1: Projections of the Greenland ice sheet evolution by the end of the 21st century. Cryosphere 2021, 15, 1015–1030. [Google Scholar] [CrossRef]
  69. Yoon, J.H.; Wang, S.Y.S.; Gillies, R.R.; Kravitz, B.; Hipps, L.; Rasch, P.J. Increasing water cycle extremes in California and in relation to ENSO cycle under global warming. Nat. Commun. 2015, 6, 8657–8663. [Google Scholar] [CrossRef] [PubMed] [Green Version]
  70. Zheng, Y.J.; Zhang, Q.; Luo, M.; Sun, P.; Singh, V.P. Wintertime precipitation in eastern China and relation to the Madden-Julian oscillation: Spatiotemporal properties, impacts and causes. J. Hydrol. 2020, 582, 124477–124495. [Google Scholar] [CrossRef]
  71. Zhang, J.; Sheng, Z.; Ma, Y.T.; He, Y.; Zuo, X.J.; He, M.Y. Analysis of the Positive Arctic Oscillation Index Event and Its Influence in the Winter and Spring of 2019/2020. Front. Earth Sci. 2021, 8, 580601–580633. [Google Scholar] [CrossRef]
  72. Zuo, J.Q.; Ren, H.L.; Li, W.J. Contrasting Impacts of the Arctic Oscillation on Surface Air Temperature Anomalies in Southern China between Early and Middle-to-Late Winter. J. Clim. 2015, 28, 4015–4026. [Google Scholar] [CrossRef]
  73. Chen, D.; Sun, J.Q.; Gao, Y. Effects of AO on the interdecadal oscillating relationship between the ENSO and East Asian winter monsoon. Int. J. Climatol. 2020, 40, 4374–4383. [Google Scholar] [CrossRef]
Figure 1. Distribution of meteorological stations and terrain features in Yunnan, China. Notes: Region I–IV represent central, northeast, northwest, southwest, and southeast Yunnan, respectively.
Atmosphere 12 01136 g001
Figure 2. Changes of annual extreme temperature indices in Yunnan during 1960−2019. Notes: The annual values of these extreme temperature indices are calculated by averaging 120 weather stations for the same year.
Atmosphere 12 01136 g002
Figure 3. Spatial distribution of extreme temperature indices variation trend in Yunnan. Notes: The red triangles indicate that the trend coefficient of the weather station is less than 0. The blue triangles indicate that the trend coefficient of the weather station is greater than 0. The solid black circles indicate that the trend coefficient of the weather station is 0. The hollow black circle indicates that the trend coefficient of the meteorological station passes the significance test of p = 0.05. Space filling was carried out through ANUSPLIN method.
Atmosphere 12 01136 g003aAtmosphere 12 01136 g003bAtmosphere 12 01136 g003c
Figure 4. Changes in annual extreme precipitation indices in Yunnan during 1960−2019. Notes: The annual values of these extreme temperature indices are calculated by averaging 120 meteorological stations for the same year.
Atmosphere 12 01136 g004
Figure 5. Spatial distribution of extreme precipitation indices variation trend in Yunnan. Space filling was carried out through ANUSPLIN method.
Atmosphere 12 01136 g005aAtmosphere 12 01136 g005b
Figure 6. The cross-correlation indices of extreme climate indices. Notes: Red represents positive correlation, blue represents negative correlation. The darker the color, the greater the correlation coefficient. The “×” indicates that their correlation coefficient fails the significance test (p < 0.05).
Atmosphere 12 01136 g006
Figure 7. Spatial distribution of the correlation between extreme climate indices and general circulation patterns in Yunnan. Notes: PC represents a positive correlation and NC represents a negative correlation. p < 0.05 indicates that the correlation passes the significance test of p = 0.05.
Atmosphere 12 01136 g007aAtmosphere 12 01136 g007b
Table 1. Definition of Extreme precipitation and temperature indices.
SequenceIndicesDescriptive NameDefinitionsUnit
1TX10pCold daytimesCount of days where TX < 10th percentile% of days
2TN10pCold nightsCount of days where TN < 10th percentile% of days
3TX90pWarm daytimesCount of days where TX > 90th percentile% of days
4TN90pWarm nightsCount of days where TN > 90th percentile% of days
5FD0Frost daysAnnual count when daily minimum temperature < 0 °Cdays
6ID0Frozen daysAnnual count when daily maximum temperature < 0 °Cdays
7SU25Summer daysAnnual count when daily maximum temperature > 25 °Cdays
8TR20Number of tropical nights Annual count of days in which Tmin > 20 °Cdays
9TXxMax TmaxThe maximum daily maximum temperature per month°C
10TNxMax TminThe maximum daily minimum temperature per month°C
11TXnMin TmaxThe minimum daily maximum temperature per month°C
12TNnMin TminThe minimum daily minimum temperature per month°C
13WSDIDuration of warm periods Annual count of days with at least six consecutive days in which Tmax > 90 percentiledays
14CSDIDuration of cold periods Annual count of days with at least six consecutive days in which Tmin < 10 percentiledays
15GSLLength of growing seasonThe daily average temperature first appeared at least 6 consecutive days > 5 °Cdays
16DTRDiurnal temperature rangeMean value of the difference between TX and TN°C
17R × 1 dayMaximum one-day precipitationMaximum daily precipitation per monthmm
18R × 5 dayMaximum one-day precipitationMaximum precipitation for five consecutive days per monthmm
19R95pVery wet days Annual total precipitation when daily precipitation > 95th percentilemm
20R99pExtremely wet daysAnnual total precipitation when daily precipitation > 99th percentilemm
21SDIISimple daily intensity indexAnnual total precipitation divided by the number of wet days in a yearmm/days
22PRCPTOTAnnual total wet- day precipitationAnnual total precipitation in wet days (RR ≥1 mm)mm
23CDDConsecutive dry daysMaximum number of consecutive days when RR < 1 mmdays
24CWDConsecutive wet days Maximum number of consecutive days when RR ≥ 1 mmdays
25R10 mmNumber of days above 10 mm Annual count of days when precipitation ≥ 10 mmdays
26R20 mmNumber of days above 20 mmAnnual count of days when precipitation ≥ 20 mmdays
27R25 mmNumber of days above 25 mmAnnual count of days when precipitation ≥ 25 mmdays
Notes: Series 1–16 refer to extreme temperature indices. Among them, 1–4 refer to the relative temperature indices, 5–8 refer to the absolute temperature indices, 9–12 refer to the extremal temperature indices, and 13–16 refer to other temperature indices. Series 17–27 refer to the extreme precipitation indices, respectively. Among them, 13–23 refer to the precipitation indices, and 24–27 refer to the daily precipitation indices. The unit “days” is abbreviated to “d”, and the unit” % of days” is abbreviated to “%” in the following text.
Table 2. Trends of extreme climate changes in different subregions of Yunnan during 1960–2019. (units/annual).
IndicesYunnanRegion IRegion IIRegion IIIRegion IVRegion V
TX10p−0.20 **−0.14 **−0.24 **−0.21 **−0.24 **−0.20 **
TN10p−0.40 **−0.40 **−0.31 **−0.31 *−0.55 **−0.34 *
TX90p0.48 **0.51 **0.48 **0.33 **0.54 **0.40 **
TN90p0.45 **0.44 **0.38 **0.29 **0.51 **0.52 **
FD0−0.23 **−0.40 **−0.29 **−0.20 **−0.09 **−0.05 **
ID0−0.01 **0.00 −0.02 −0.04 0.00 0.00
SU251.07 **1.00 **0.82 **0.68 **1.33 **1.26 **
TR200.52 **0.14 **0.25 **0.33 **0.88 **1.12 **
TXx0.04 **0.04 **0.03 **0.04 **0.03 **0.04 **
TNx0.03 **0.02 **0.02 **0.02 **0.03 **0.04 **
TXn−0.01 −0.01 **0.02 0.020.03 0.02
TNn0.04 **0.05 **0.03 **0.03 *0.05 **0.04 *
WSDI0.30 **0.26 **0.21 **0.23 **0.23 **0.22 **
CSDI−0.17 **−0.13 **−0.10 **−0.12 **−0.28 **−0.16 **
GSL0.04 0.01 **0.17 **0.020.00−0.06
DTR−0.03 −0.21 **−0.01 **−0.01 **0.000.00
R × 1 day0.02 0.08 **0.01 0.02 −0.06 0.02
R × 5 day−0.22 −0.15 **−0.32 *0.10 −0.40 *−0.15
R95p0.00 0.09 **−0.66 1.41 −1.18 0.42
R99p0.04 0.16 **−0.10 0.52 −0.63 0.24
SDII0.00 0.01 **0.00 0.02 *0.00 0.02 **
CDD0.15 0.03 **0.50 **0.05 0.21 −0.08
CWD−0.06 **−0.03 **−0.03 *−0.04 **−0.11 **−0.05 **
PRCPTOT−2.48 *−1.78 **−2.31 *1.08 −5.12 **−1.96
R10 mm−0.08 −0.07 **−0.08 0.04 −0.13 *−0.06
R20 mm−0.03 −0.01 **−0.04 0.04 −0.08 *−0.01
R25 mm−0.02 −0.01 **−0.02 0.03 −0.06 *−0.01
Notes: * stands for passing the significance test with p < 0.05. ** stands for passing the significance test with p < 0.01. Regions I–V represent central, northwest, northeast, southwest, and southeast Yunnan, respectively.
Table 3. Correlation coefficient between the linear trends in extreme temperature indices and geographical parameters in Yunnan.
IndicesLongitudeLatitudeAltitudeIndicesLongitudeLatitudeAltitude
TX10p0.000.000.00R × 1 day−0.047 **0.02−0.24 **
TN10p0.000.000.00R × 5 day−0.061 **−0.01−0.22 **
TX90p0.000.000.00R95p−0.044 **−0.02−0.201 **
TN90p0.000.000.00R99p−0.02−0.01−0.12 **
FD00.00170.64 **0.71 **SDII−0.081 **−0.034 *−0.23 **
ID00.049 **0.032 *0.19 **PRCPTOT−0.077 **−0.069 **−0.26 **
SU25−0.13 **−0.021−0.78 **CDD0.00−0.037 *0.072 **
TR20−0.20 **0.103 **−0.75 **CWD−0.081 **−0.068 **−0.11 **
TXx−0.106 **0.11 **−0.79 **R10 mm−0.083 **−0.078 **−0.23 **
TNx−0.11 **0.089 **−0.87 **R20 mm−0.068 **−0.067 **−0.24 **
TXn−0.15 **−0.10 **−0.502 **R25 mm−0.064 **−0.06 **−0.25 **
TNn−0.066 **−0.083 **−0.76 **
WSDI0.0061−0.0270.012
CSDI−0.01−0.01−0.11 **
GSL−0.01−0.061 **−0.52 **
DTR−0.077 **−0.047 **0.16 **
Notes: * stands for passing the significance test with p < 0.05. ** stands for passing the significance test with p < 0.01. The above indices were obtained by correlation analysis based on the data of 120 meteorological stations and geographical location factors (longitude, latitude, and altitude) in Yunnan from 1960 to 2019.
Table 4. The average trend coefficients of 27 extreme climate indices at different elevations.
IndicesIIIIIIIVIndicesI IIIIIIV
TX10p−0.210−0.227−0.275−0.376R × 1 day−0.466−0.1020.3380.010
TN10p−0.418−0.435−0.436−0.412R × 5 day−0.953−1.051−1.405−1.883
TX90p0.4690.5030.5190.481R95P0.0450.0600.9780.010
TN90p0.4610.4770.4530.454R99p0.9100.012−0.018−0.414
FD0−0.082−0.361−0.833−1.311SDII0.021−0.023−0.038−0.044
ID0−0.023−0.081−0.139−0.276PRCPTOT−9.448−9.208−8.91312.631
SU251.3411.3561.0700.122CDD−0.1490.5060.6710.854
TR200.2940.3030.3090.242CWD−0.109−0.098−0.093−0.128
TXx0.0480.0530.0650.086R10 mm−0.314−0.285−0.296−0.373
TNx0.0320.0320.0320.034R20 mm−0.117−0.180−0.191−0.317
TXn0.0580.0570.0650.073R25 mm−0.102−0.153−0.146−0.261
TNn0.0540.0500.0470.050
WSDI0.2740.2970.3070.243
CSDI−0.242−0.169−0.131−0.115
GSL0.0120.1500.6340.929
DTR0.0040.0180.0330.027
Notes: I–IV represents the four elevation ranges of 76–1448 m, 1448–2112 m, 2112–3026 m, and 3026–5832 m. Only those grid points that passed the significance test were used to average the trend for each elevation interval.
Table 5. Correlation coefficient between extreme climate indices at different time scales (monthly, quarterly, and annually) and general circulation patterns in Yunnan.
Lag MonthsIndicesTX10pTN10PTX90pTN90pTXxTNxTXnTNnDTRR × 1 dayR × 5 day
0ENSO0.25 **0.07−0.17 **−0.06−0.04−0.03−0.096 *−0.04−0.060.010.01
AO0.050.06−0.03−0.08−0.010.000.000.010.020.00−0.01
NAO0.14 **0.07−0.13 **−0.13 **−0.20 **−0.27 **−0.27 **−0.26 **0.20 **−0.21 **−0.19 **
1ENSO0.070.05−0.17 **−0.11 *−0.06−0.06−0.04−0.040.010.000.00
AO0.060.08−0.05−0.11 *−0.02−0.02−0.010.000.030.00−0.01
NAO0.12 **0.05−0.19 **−0.15 **−0.30 **−0.298 **−0.28 **−0.26 **0.11 *−0.17 **−0.16 **
2ENSO0.01−0.02−0.030.04−0.04−0.02−0.03−0.03−0.010.040.03
AO0.070.10 *−0.05−0.12 **−0.03−0.03−0.02−0.020.03−0.01−0.02
NAO0.040.05−0.09 *−0.06−0.30 **−0.19 **−0.22 **−0.19 **0.04−0.11 *−0.1 *
3ENSO0.02−0.04−0.070.03−0.05−0.02−0.04−0.02−0.040.010.00
AO0.070.11 *−0.06−0.12 *−0.04−0.04−0.03−0.020.03−0.01−0.02
NAO0.09 *0.05−0.10 *−0.04−0.20 **−0.08−0.12 *−0.08−0.08−0.01−0.02
SeasonIndicesTX10pTN10PTX90pTN90pTXxTNxTXnTNnDTRR × 1 dayR × 5 day
SpringENSO0.260.090.01−0.05−0.07−0.09−0.11−0.09−0.170.080.01
AO−0.260.070.06−0.030.10−0.090.290.050.41 *−0.35 *−0.25
NAO0.190.20−0.22−0.28−0.24−0.26−0.13−0.19−0.080.040.02
SummerENSO0.160.15−0.28−0.37 *−0.27−0.41 *−0.05−0.01−0.080.260.35 *
AO0.150.280.010.000.030.04−0.10−0.160.06−0.03−0.01
NAO0.240.40 *−0.36 *−0.51 **−0.30 *−0.52 **−0.13−0.28−0.010.210.26
AutumnENSO0.14−0.19−0.30−0.16−0.29−0.210.020.04−0.280.200.19
AO0.010.080.00−0.27−0.12−0.17−0.010.080.29−0.04−0.07
NAO0.13−0.15−0.16−0.14−0.19−0.220.000.12−0.110.070.16
WinterENSO0.42 **0.24−0.260.02−0.28−0.09−0.34 *−0.11−0.50 **0.32 *0.40 *
AO0.22−0.02−0.18−0.02−0.26−0.09−0.240.01−0.210.280.24
NAO0.33 *0.18−0.160.11−0.120.11−0.05 **−0.19−0.40 **0.30 *0.40 **
Indices (Annual)ENSOAONAOIndicesENSOAONAO
TX10p0.040.32 0.43 **R × 1 day0.16 −0.03 −0.06
TN10p0.110.27 0.36 *R × 5 day0.09 −0.08 0.00
TX90p−0.01−0.21 −0.39 *R95p−0.02 −0.07 −0.02
TN90p−0.02−0.21 −0.38 *R99p0.110.00 0.02
FD00.000.11 0.31 SDII−0.02−0.21 −0.16
ID0−0.17 0.12 0.22 PRCPTOT−0.03 0.04 0.18
SU250.01 −0.24 −0.37 *CDD−0.43 **−0.23 −0.19
TR200.00 −0.24 −0.36 *CWD0.07 −0.03 0.17
TXx0.18−0.15 −0.26 R10 mm−0.04 0.03 0.18
TNx0.20−0.15 −0.25 R20 mm−0.07 −0.04 0.07
TXn−0.14−0.28 −0.48**R25 mm−0.05 −0.07 0.03
TNn0.00−0.08 −0.29
WSDI−0.04 −0.19 −0.28
CSDI−0.090.10 0.21
GSL−0.09−0.03 −0.17
DTR0.13−0.20 −0.22
Notes: * stands for passing the significance test with p < 0.05. ** stands for passing the significance test with p < 0.01. These data describe the correlation between the circulation patterns and the mean extreme climate indices of 120 meteorological stations in Yunnan Province.
Publisher’s Note: MDPI stays neutral with regard to jurisdictional claims in published maps and institutional affiliations.

