A Synoptic Scale Perspective on Greenland Ice Core δ18O Variability and Related Teleconnection Patterns


1
Helmholtz Center for Polar and Marine Research, Paleoclimate Dynamics Group, Alfred Wegener Institute, 27570 Bremerhaven, Germany
2
Department of Environmental Physics & MARUM, University of Bremen, 28359 Bremen, Germany
*
Author to whom correspondence should be addressed.
Atmosphere 2021, 12(3), 294; https://doi.org/10.3390/atmos12030294
Submission received: 19 December 2020
/
Revised: 17 February 2021
/
Accepted: 19 February 2021
/
Published: 25 February 2021
(This article belongs to the Section Climatology)
Abstract
:The variability of stable oxygen isotope ratios (δ18O) from Greenland ice cores is commonly linked to changes in local climate and associated teleconnection patterns. In this respect, in this study we investigate ice core δ18O variability from a synoptic scale perspective to assess the potential of such records as proxies for extreme climate variability and associated weather patterns. We show that positive (negative) δ18O anomalies in three southern and central Greenland ice cores are associated with relatively high (low) Rossby Wave Breaking (RWB) activity in the North Atlantic region. Both cyclonic and anticyclonic RWB patterns associated with high δ18O show filaments of strong moisture transport from the Atlantic Ocean towards Greenland. During such events, warm and wet conditions are recorded over southern, western and central part of Greenland. In the same time the cyclonic and anticyclonic RWB patterns show enhanced southward advection of cold polar air masses on their eastern side, leading to extreme cold conditions over Europe. The association between high δ18O winters in Greenland ice cores and extremely cold winters over Europe is partly explained by the modulation of the RWB frequency by the tropical Atlantic sea surface temperature forcing, as shown in recent modeling studies. We argue that δ18O from Greenland ice cores can be used as a proxy for RWB activity in the Atlantic European region and associated extreme weather and climate anomalies.
1. Introduction
The growing number of high temporal resolution ice cores from the Greenland ice sheet now gives valuable information on climate variations from seasonal to multidecadal or even longer time scales [1]. Oxygen isotope concentration in ice cores, commonly expressed as δ18O, is one of the primary parameters for determining the rate and magnitude of past climate changes. Commonly, the Greenland ice core δ18O variability is related to changes in local parameters, especially temperature, and related atmospheric and oceanic anomaly patterns. The signature of climate modes, like the North Atlantic Oscillation (NAO) or the Atlantic Multidecadal Oscillation (AMO) is clearly imprinted in Greenland ice core records [2]. Other studies [3,4] identified strong links between atmospheric weather regimes and Greenland δ18O variability on interannual to decadal time scales. In this study, we look for the links between statistics of synoptic scale patterns and Greenland ice core δ18O in order to have a complementary, physically based, interpretation of ice core δ18O variability and its relationship with extreme weather and climate anomaly patterns.
δ18O variability is intimately related to moisture transport [2]. During their path to polar regions, water vapor masses undergo an isotopic distillation with the preferential loss of heavy isotopes into the rain and snowfall, controlled by the condensation temperature [4]. The ice core δ18O records, commonly interpreted in terms of local temperature changes, are also known to depend by other processes, such as evaporation conditions in the source region or air mass trajectories [4].
The transport of moisture to the Arctic region is strongly connected to the mid-latitude atmospheric dynamics [5,6]. Recent studies [5,7] show that the mean flow plays a secondary role in the poleward moisture transport relative to the transient flow. These studies, combined, highlight the importance of synoptic scale activity for the Arctic water vapor transport (WVT) variability. Overall, extreme WVT into the Arctic region is associated with blocking-like atmospheric circulation patterns [8], which are closely related to Rossby wave breaking (RWB) [9]. RWB, commonly defined as the large-scale, irreversible overturning of potential vorticity contours near the tropopause level, can lead to large-scale atmospheric circulation anomalies with significant impact on synoptic-scale patterns [10]. Persistent wave-breaking events are associated with atmospheric blocking [11]. Depending on the direction of the overturning RWB can be divided into a cyclonic (CWB) and anticyclonic (AWB) events. The CWB events occur preferentially on the poleward side of the jet stream, whereas AWB events are usually recorded on the equatorward side. During winter, relatively high frequencies of CWB (AWB) events are recorded over Greenland (Eastern Atlantic and western Europe) [11].
Recent observational and model data analysis [2] reveals that the North Atlantic RWB events are associated with significant precipitation δ18O anomalies in the Arctic region, particularly in the western and central Greenland. Moreover, it has been suggested that central Greenland ice core records could be a good proxy for the frequency of North Atlantic RWB and associated extreme cold weather over Europe [2].
In this respect, in the current study we investigate the links between the variability of three southern and central Greenland δ18O ice core records and atmospheric circulation, from a synoptic scale perspective. We show that, during the observational period, δ18O variability in these records is linked to changes in the frequency of the North Atlantic RWB and related Northern Hemisphere extreme climate anomalies. Based on these links we argue that such records, which go back in time hundreds to thousands of years or more, give valuable information about the North Atlantic RWB variability and related weather and climate extremes during the past.
2. Data and Methods
Ice cores, drilled in medium to high accumulation areas of the Greenland ice sheet, provide stable isotope records with seasonal resolution [1,12]. The advantage of having seasonally resolved δ18O data is the ability to disentangle the climate signals in the δ18O records, which are specific for each season. Previous studies show that Greenland δ18O variability is strongly related to large-scale atmospheric circulation patterns, in particular with the NAO during winter, especially in southern and central Greenland [1]. Therefore, in this study, we used the time series of the stacked (averaged) winter δ18O recorded at DYE-3 (65.18° N, 43.82° W), Crete (71.12° N: 37.32° W) and Grip (72.58° N, 37.64° W), described in [1]. This time series, which covers the period 553 to 1973, was retrieved from the environmental data base PANGAEA (www.pangaea.de; accessed on 15 October 2020) [12]. Because we focus on decadal to multidecadal time scales most of the statistical analysis during observational period are based on linear detrended and smoothed, i.e., 5-year running mean, ice core δ18O time series.
The vertically integrated water vapor transport (WVT) is defined as:
q is the specific humidity, u(v) zonal (meridional) component of the horizontal wind, g gravity and ps surface pressure. stands for water vapor transport vector while is the unit vector in the zonal (meridional) direction. The computation is based on data retrieved from the 20th Century Reanalysis (20CRV2c) database [13]. This data set covers the period 1851 to 2014 [13].
RWB frequency is calculated based on the methodology described in [11] using daily geopotential height field at 500 mb (Z500) retrieved from 20CRv2c database [13] interpolated on a 2.5° lat × 2.5° lon regular grid. A short description of the algorithm to calculate frequency of RWB is given in the following. First, the bidimensional blocking index developed in [14] is calculated. For each grid point within 35° N–75° N latitudinal interval the northern (GHGN) and southern (GHGS) gradients are calculated. A 15° latitudinal interval is used to calculate both GHGN and GHGS. The grid points for which GHGS > 0 and GHGN < (−10 m/deg.lat) are considered to be blocked. Using the zonal gradient of Z500 measured 7.5° south of the blocked grid point, we compute the wave breaking index (WBI) defined in [11] to distinguish between anticyclonic blocking events (Z500 decreasing eastward) and cyclonic blocking events (Z500 increasing eastward). The maps of the CWB and AWB frequency are calculated for each winter from 1851 to 1973 and used in a composite analysis to derive the anomaly patterns associated with high or low δ18O in our ice core record.
The monthly sea surface temperature (SST) data set COBE-SST [15] is used to look for SST anomaly patterns associated with ice core δ18O anomalies during winter. The winter SST is calculated as the average of December, January and February (DJF) monthly means. The analysis is performed for 1891 to 1973, which is the common period for ice core δ18O and SST data.
The field of the frequency of cold nights (TN10p), defined as the number of days in a winter with minimum daily temperature (TN) lower than the 10th local percentile, was retrieved from the HADEX3 data set [16]. We used TN10p winter data for the period 1901 to 1973.
Climate anomaly patterns associated with ice core δ18O presented in this study are derived through composite analysis. First, we remove the linear trend from the climatic fields. Then the composite (average) maps corresponding to high and, respectively, low δ18O winters are calculated. A high (low) δ18O winter is associated with a value higher (lower) than 0.75 (−0.75) standard deviation of the linear detrended and smoothed ice core δ18O time series. Since the patterns are largely symmetric, we present the difference between the composites corresponding to high and low δ18O winters. The significance of difference between the high and low composites is calculated using a simple t-test [17]. Probability density functions of daily WVT are calculated using the R [18] package stats (function density).
3. Results
3.1. Sensitivity of Ice Core δ18O to Extreme Water Vapor Transport
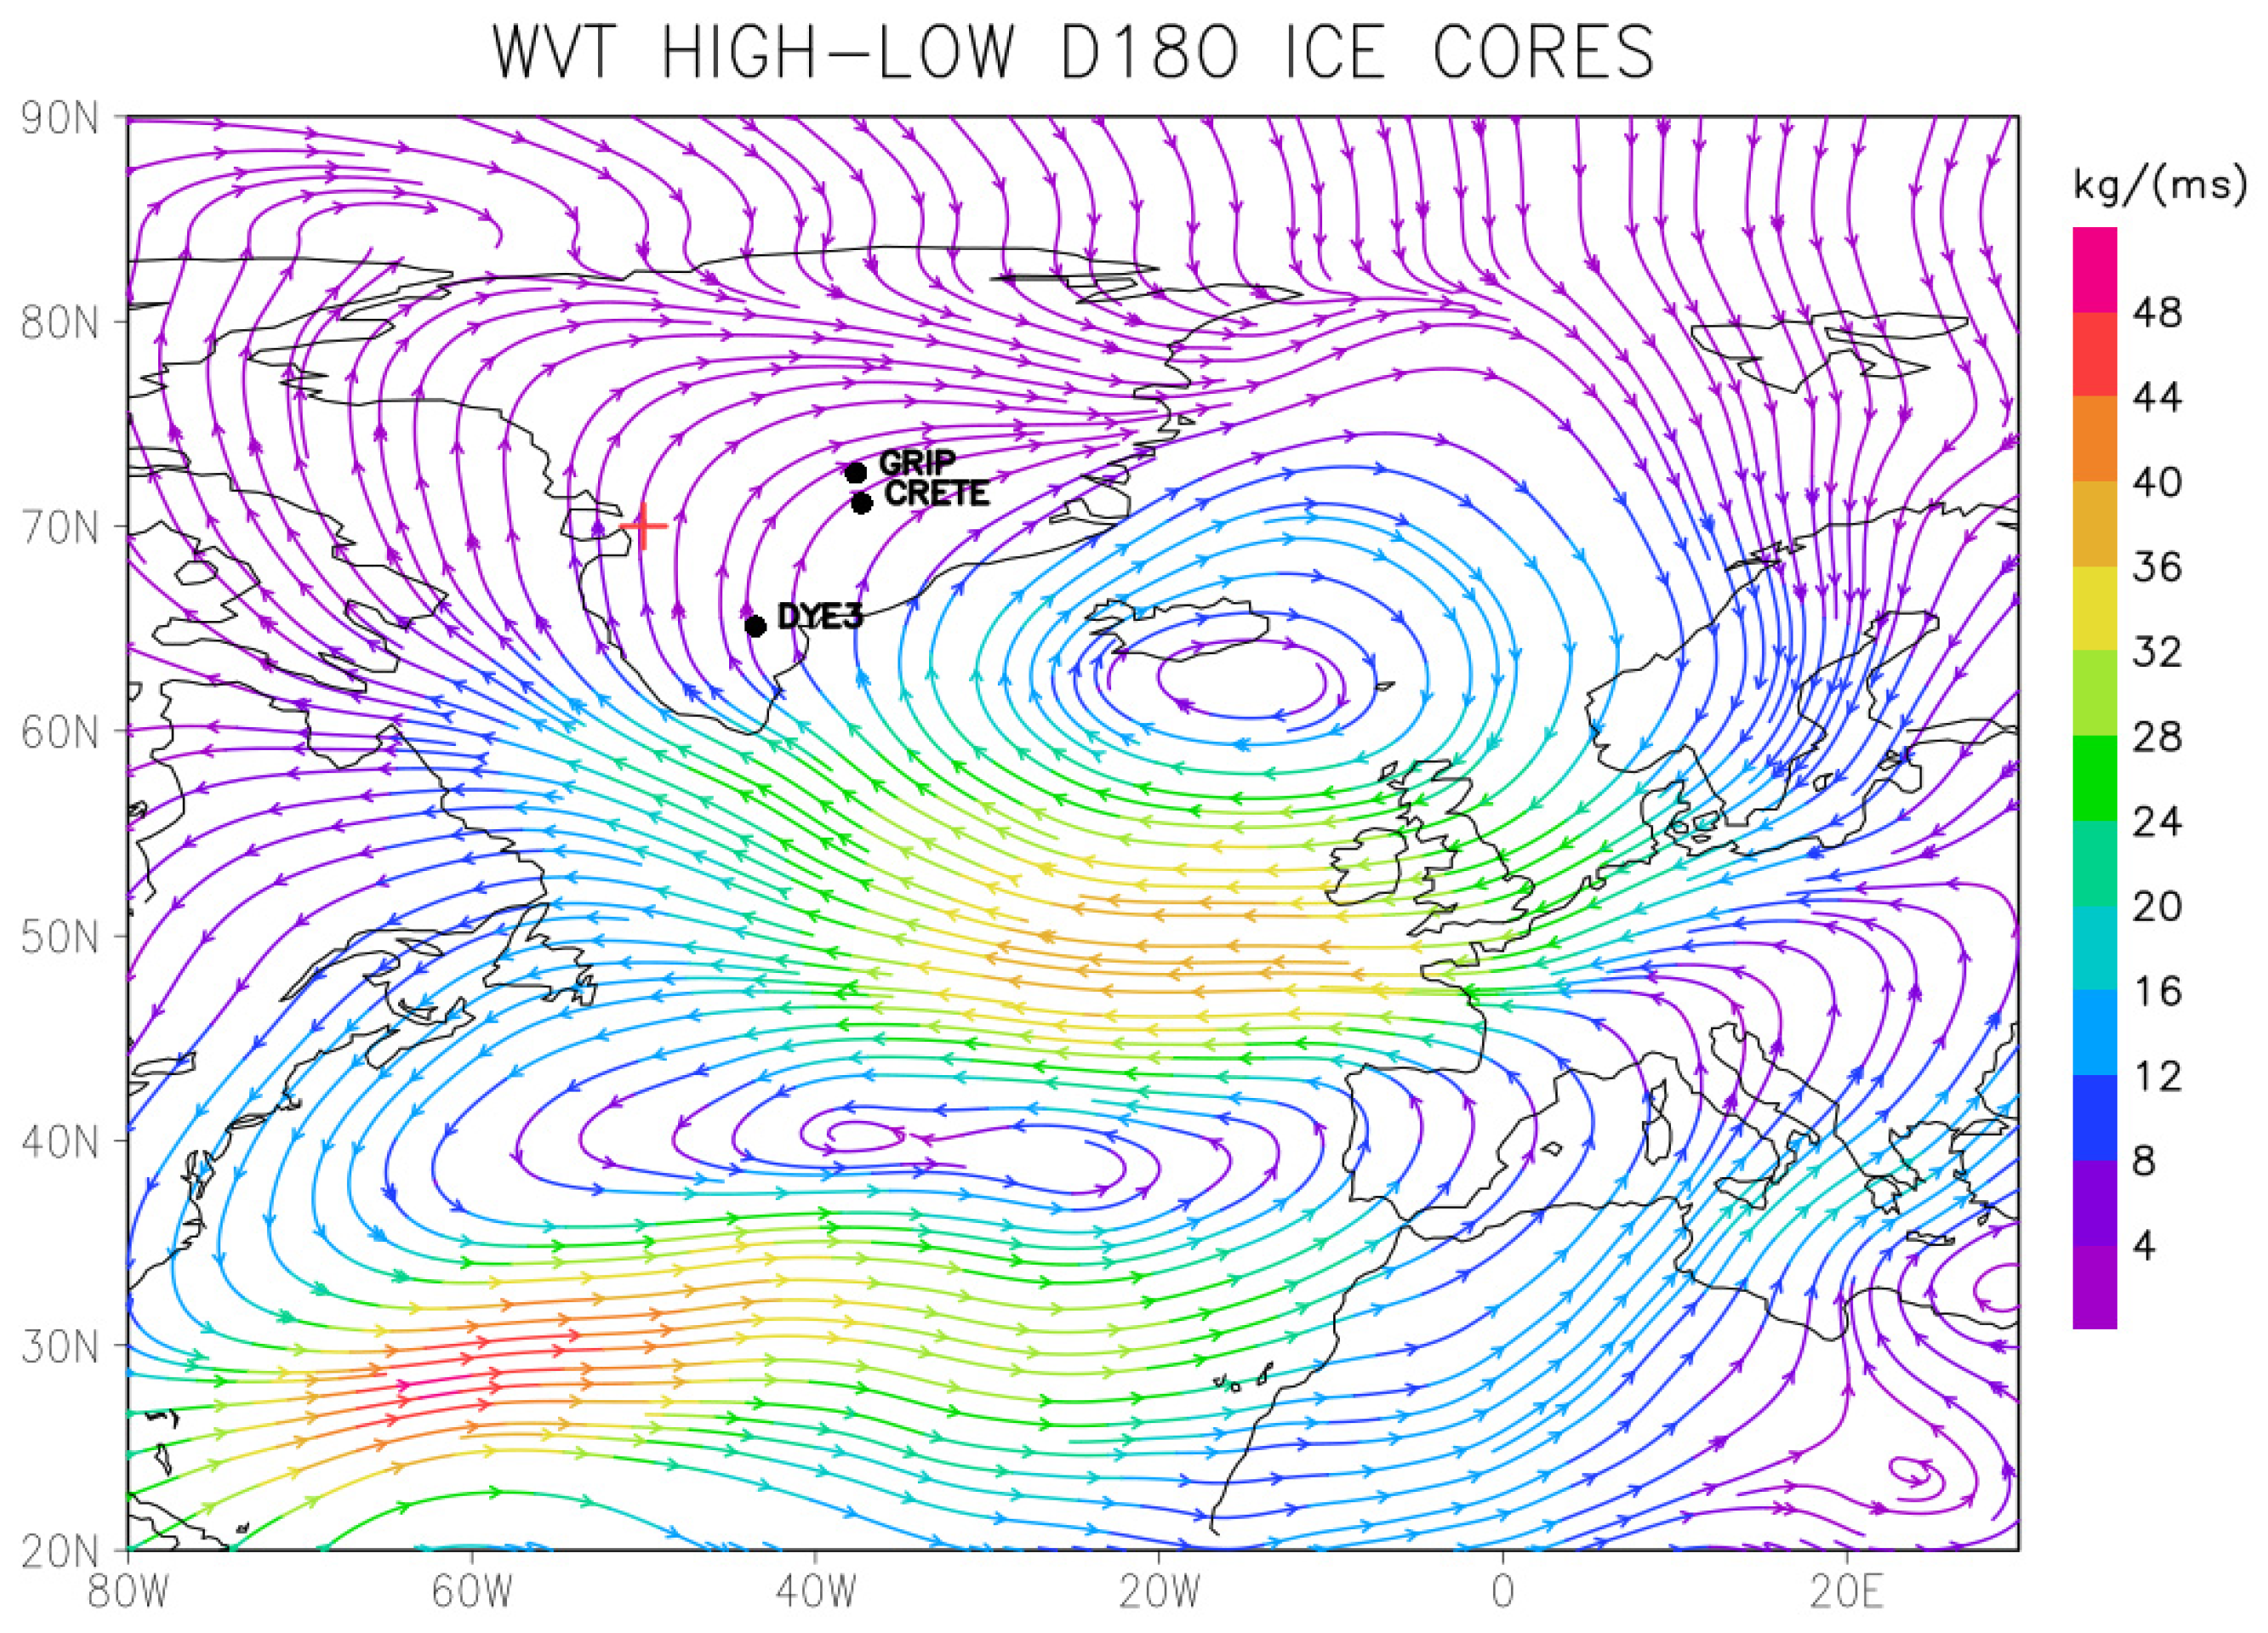
δ18O variability in Greenland ice core records is strongly related to changes in the winter mean water vapor transport [2,4]. The map of the difference between the composite corresponding to high and low ice core δ18O winters shows a large-scale anticyclonic anomalous WVT gyre centered over the Iceland region (Figure 1). The meridional WVT over western Greenland increases significantly during high relative to low ice core δ18O winters (Figure 1). Such a WVT pattern is consistent with anomalous warm and wet conditions over southern, western and central Greenland, and therefore with positive precipitation δ18O anomalies in this region [2].
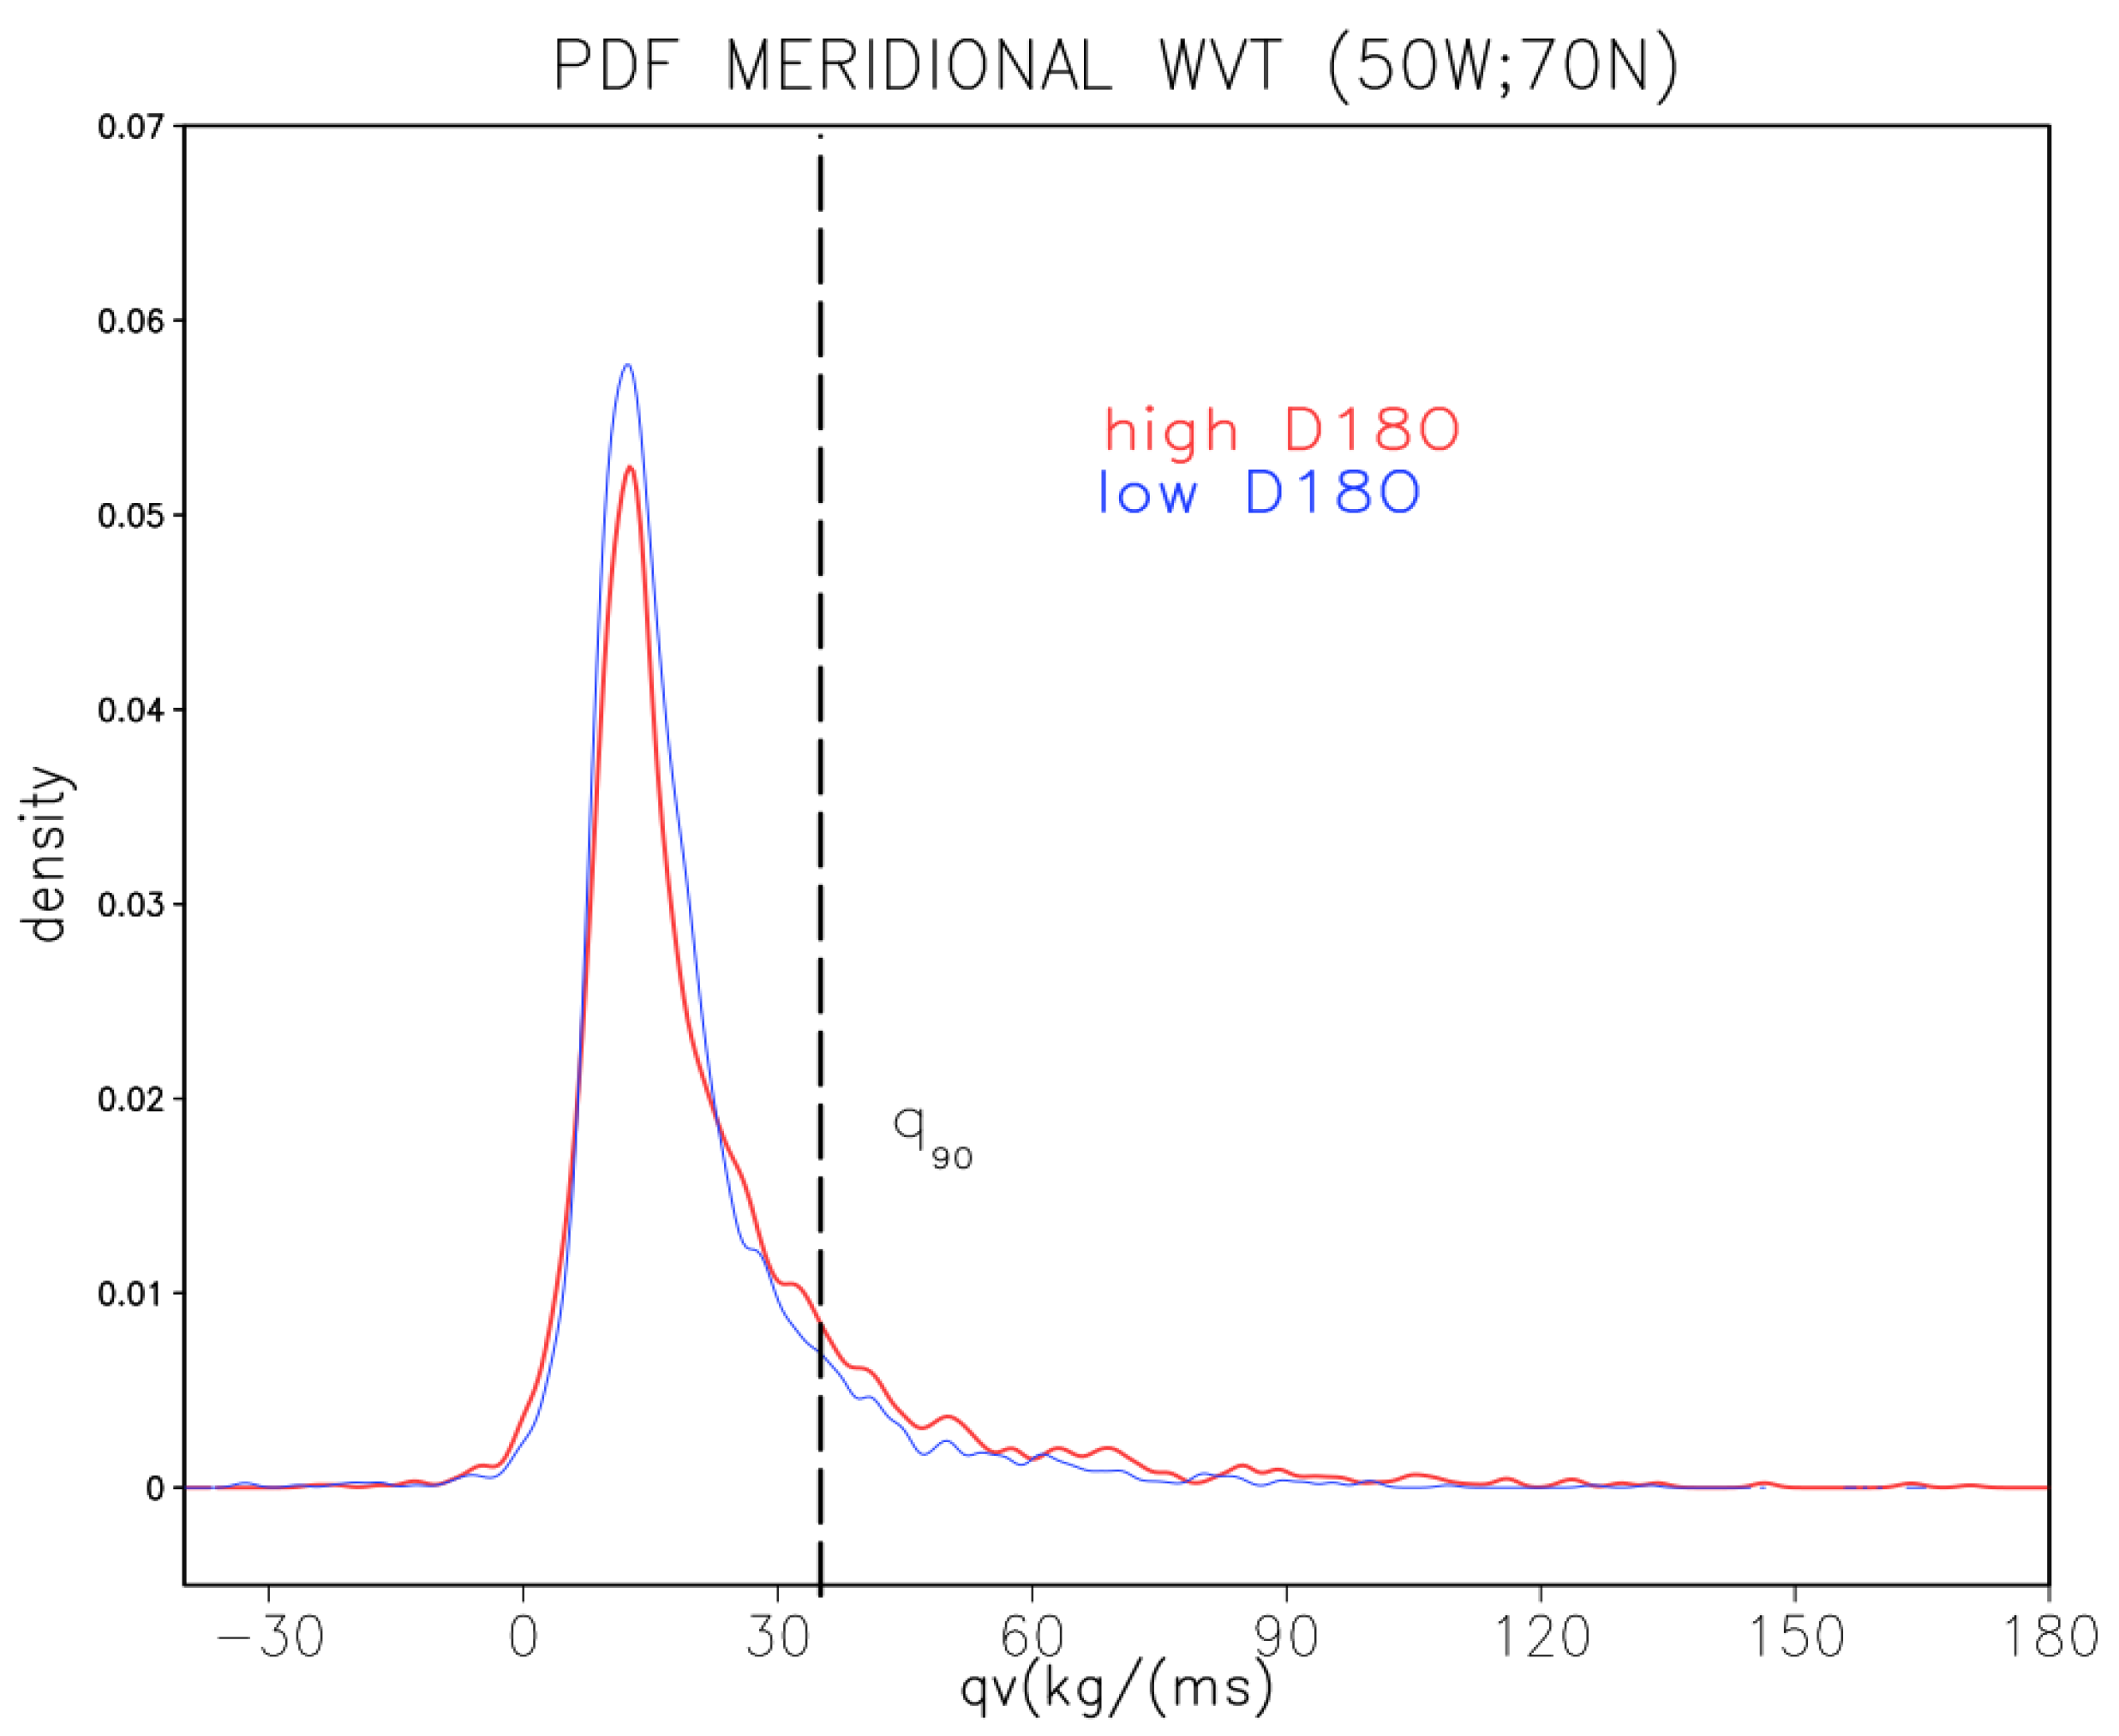
A large part of moisture transport into the Arctic region is due to extreme WVT events, which are strongly related to synoptic scale atmospheric circulation patterns [5,7]. As an example, we first investigate the probability distribution functions of daily meridional WVT in the grid point (50° W; 70° N), for high and low ice core δ18O winters for the period 1851 to 1973. Here, the anomalous WVT associated with ice core δ18O is dominated by the meridional component (Figure 1). The goal is to emphasize the sensitivity of the ice core δ18O records to the extreme meridional WVT variations. A significant increase (≪0.001, based on two samples Kolmogorov and Smirnov test) in the frequency of extreme meridional moisture transport days is recorded during high relative to low ice core δ18O winters (Figure 2). The difference of the 90th percentile of the two distributions is significantly higher than the difference of the corresponding means. This emphasizes the sensitivity of ice core δ18O records to changes in the right tail of the distribution function of meridional WVT in this grid point.
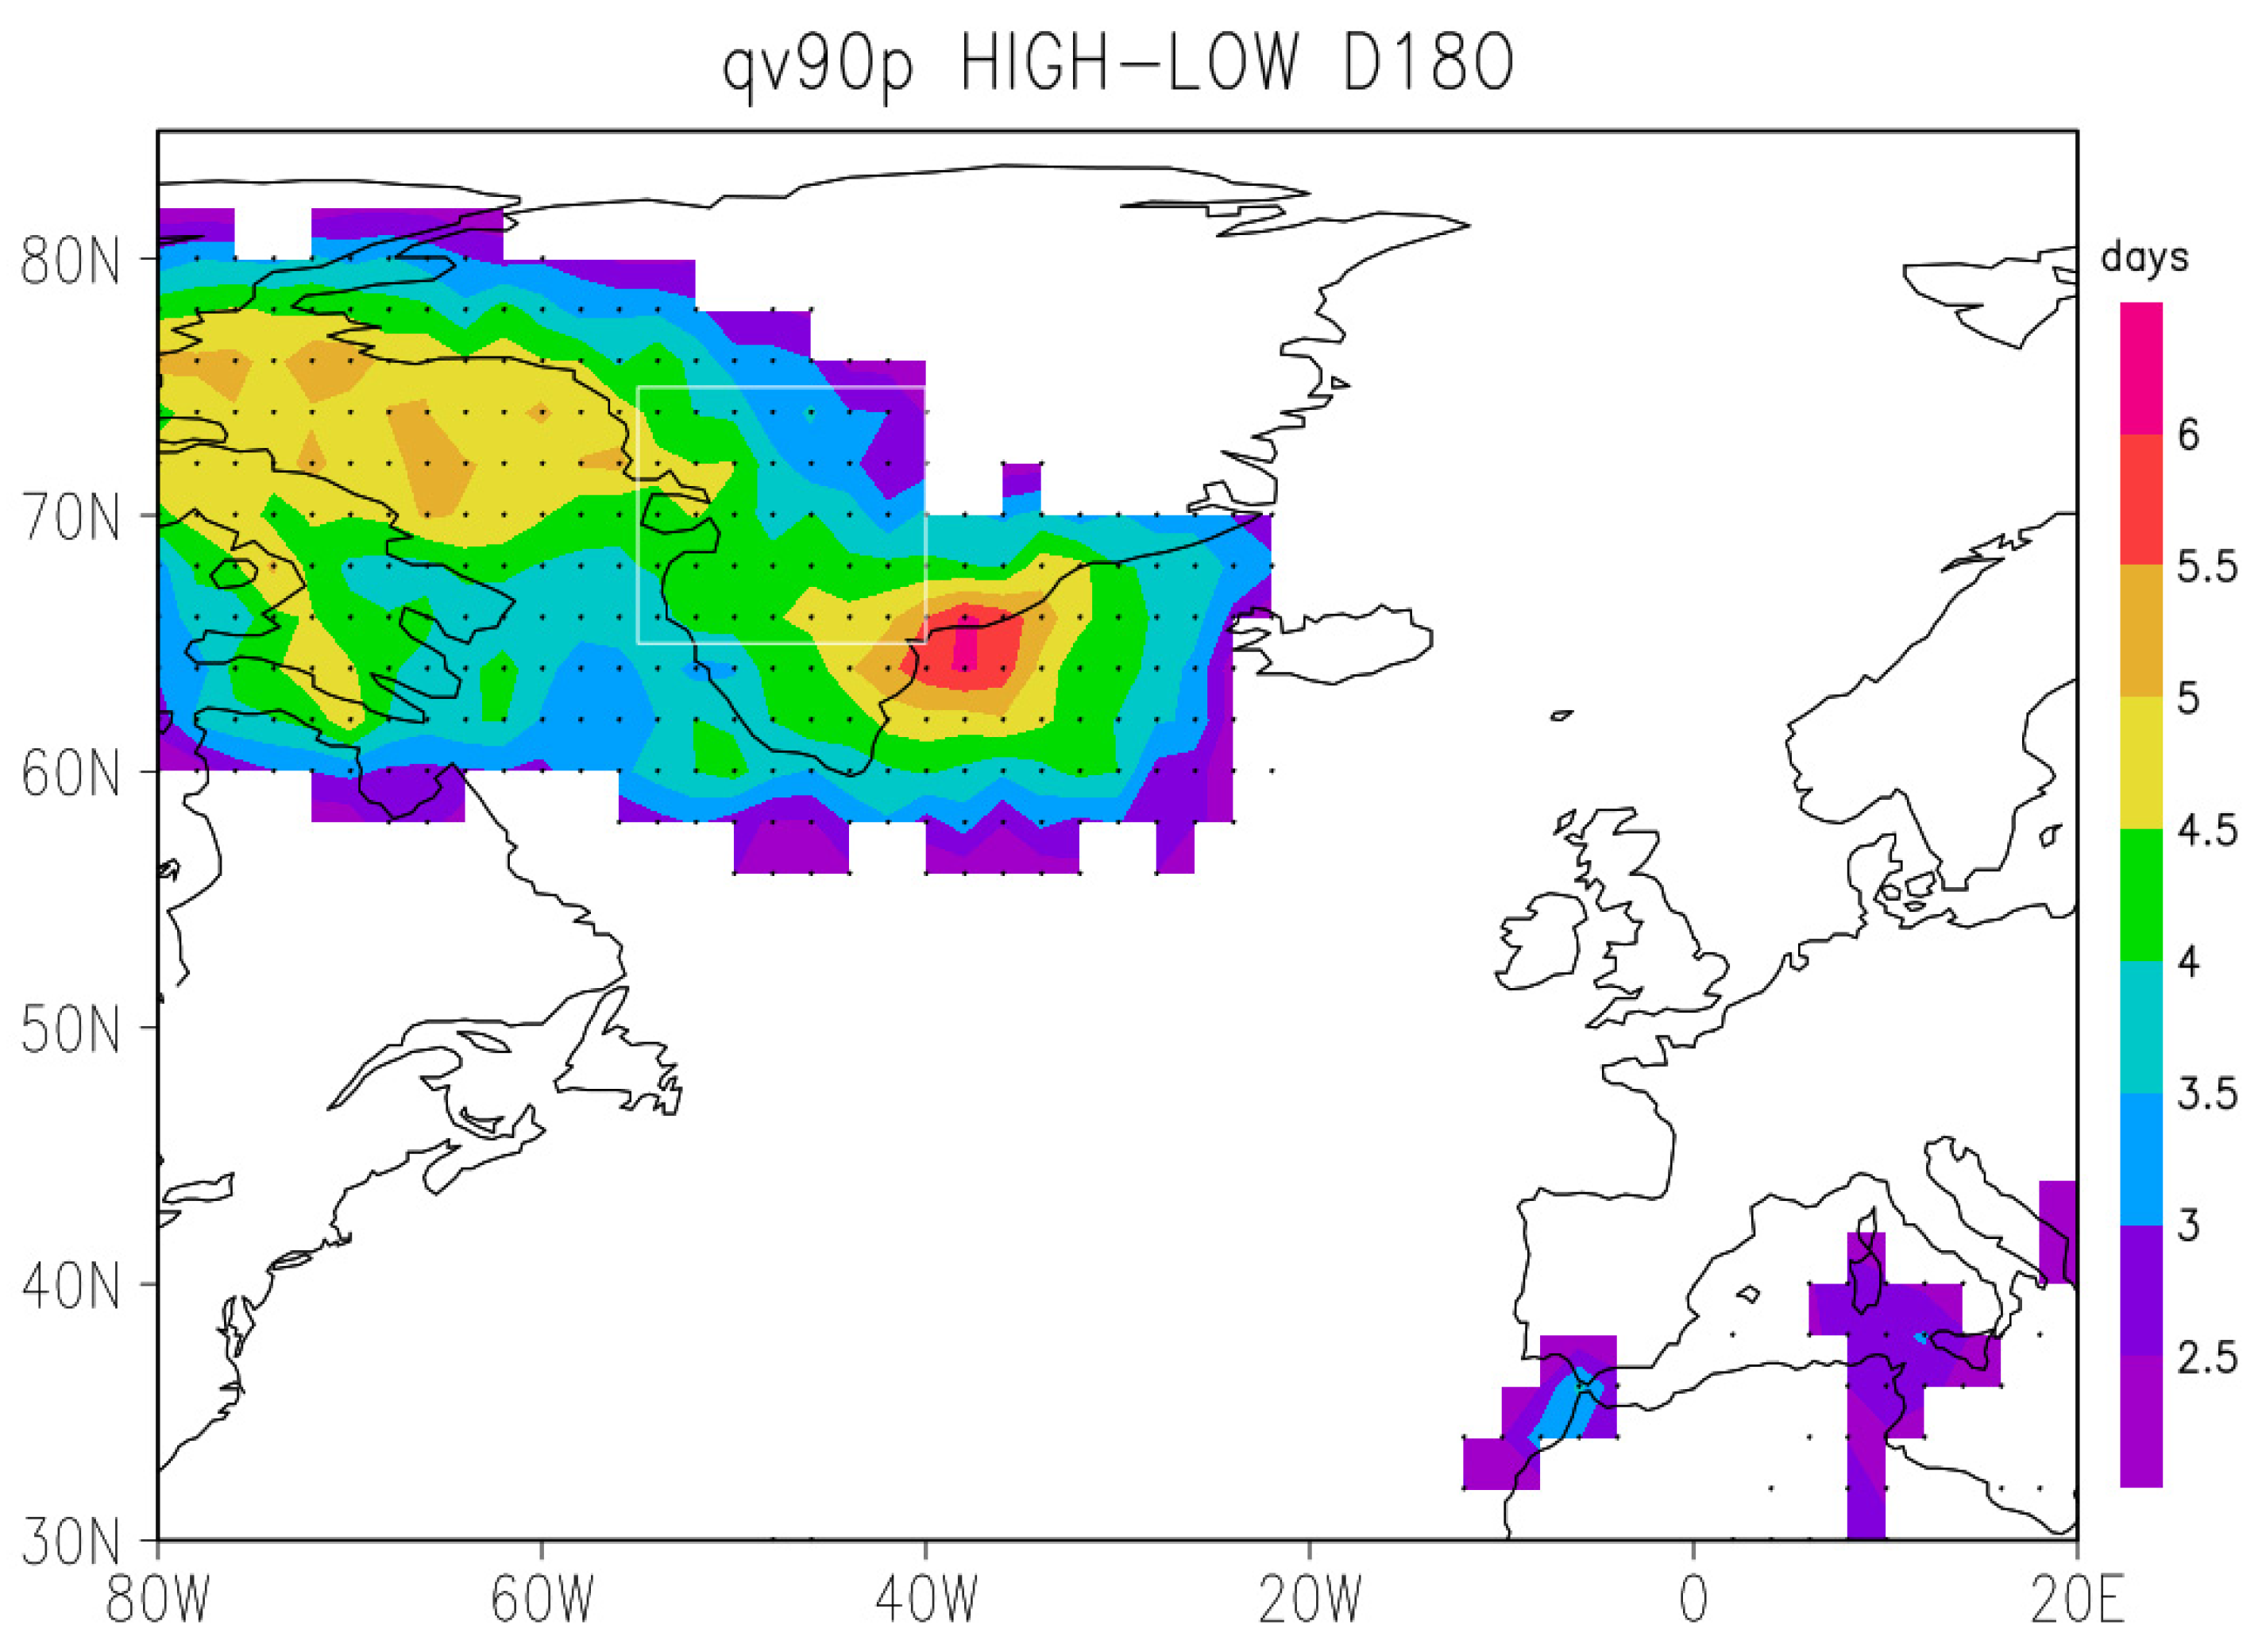
Significant differences in the tail of the probability distribution functions of daily meridional WVT for high and low ice core δ18O winters are identified for most of the western Greenland grid points (not shown). As a measure of extreme meridional WVT activity, we define the qv90p index, as the number of days in a winter with meridional WVT higher than the 90th local percentile. A similar index, i.e., TX90p, was defined to characterize extreme high temperature variability [19]. The qv90p index is calculated for each grid point for all winters covering the 1851 to 1973 period. A composite analysis reveals a significant increase in the frequency of extreme meridional WVT days during high relative to low ice core δ18O winters over western Greenland (Figure 3), consistent with the corresponding anomalous seasonal WVT pattern (Figure 1). Based on Figure 3, we define an index as the average of qv90p for all grid points within (65° N–75° N; 55° W–40° W) (Figure 3, rectangle box). This index captures the variability of extreme meridional WVT over western Greenland during 1851 to 1973 period. The results remain qualitatively the same for small changes in the index area.
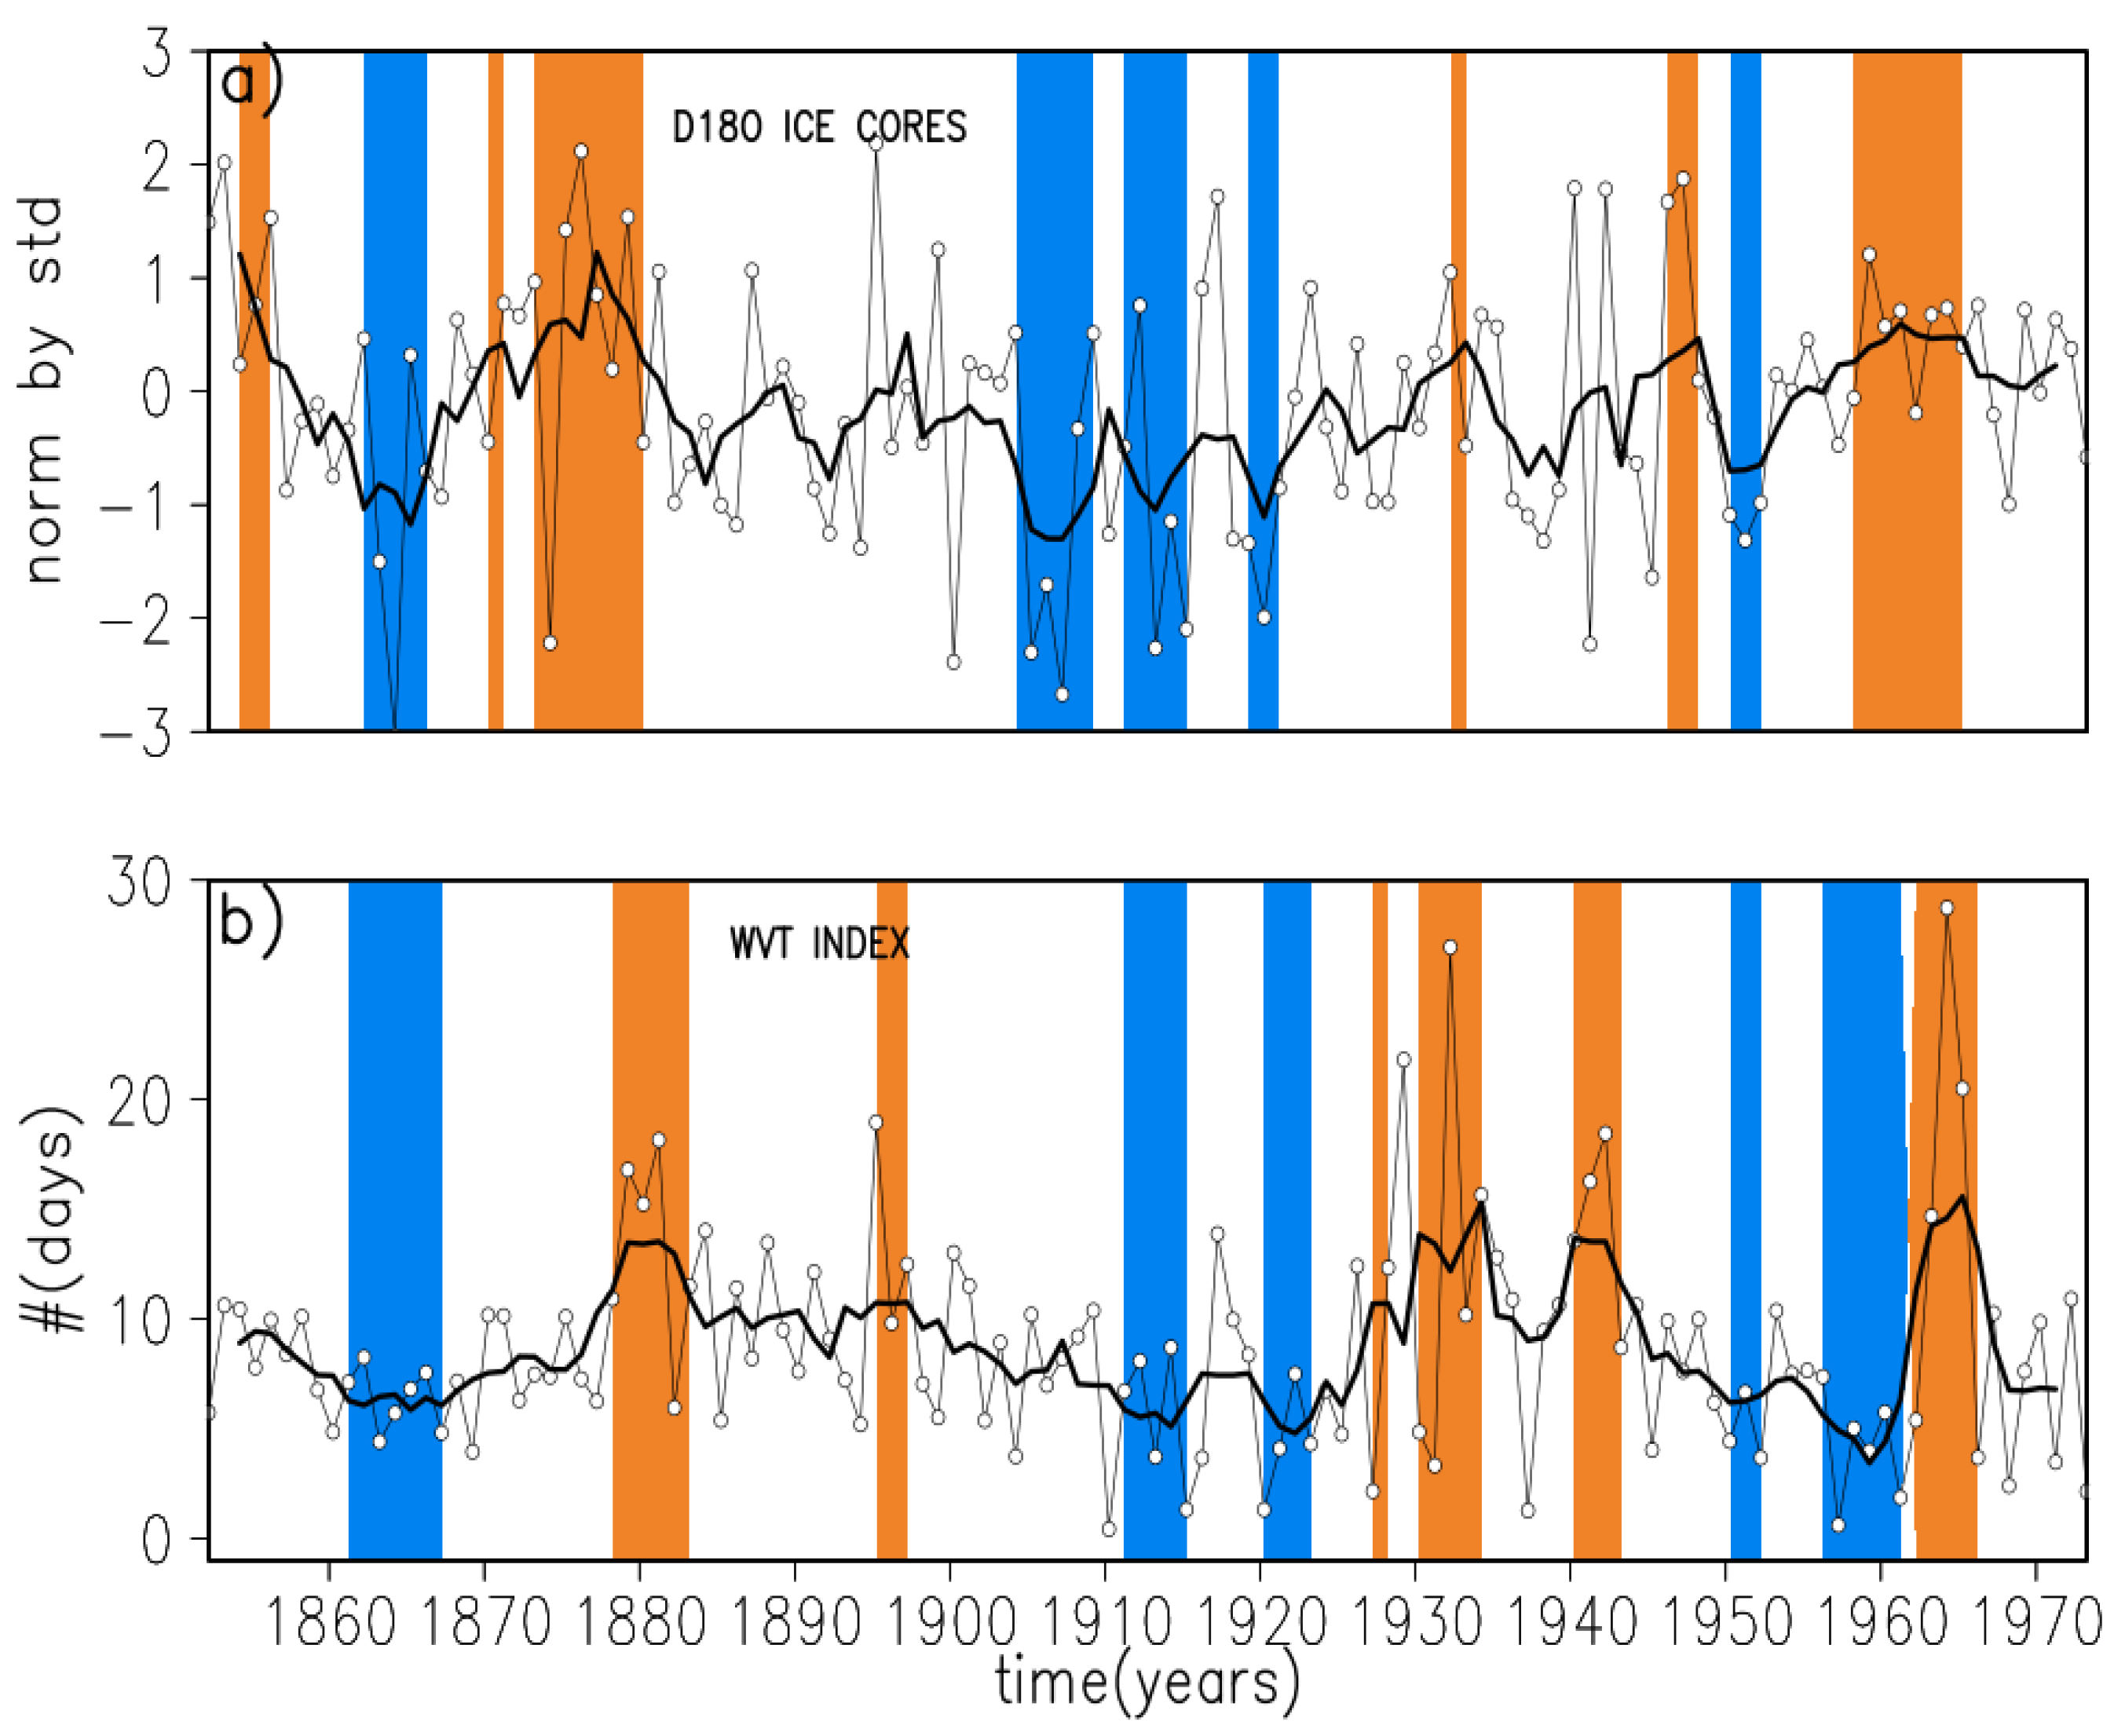
The time series of the ice core δ18O (Figure 4a) and extreme WVT index (Figure 4b) shows coherent decadal variations during the 1851 to 1973 period. Note that the linear trend was removed from both time series to minimize possible influence of the recent global warming signal. The ice core δ18O shows pronounced maxima in 1880s, 1930s and 1965s (Figure 4a, solid line). The extreme WVT index shows also a significant increase during these periods (Figure 4b). Furthermore, both δ18O and WVT index show low values during 1865s, 1910s and 1950s (Figure 4b, solid line). However, significant interannual variability is recorded in both indices (Figure 4). Extreme high (low) values of both indices are recorded during 1879, 1881, 1895, 1917, 1932, 1940, 1942 and 1964 (1863, 1910, 1913, 1915, 1920, 1927, 1937, 1945, 1950, 1952 and 1968). Note the high frequency of extreme WVT events during 1962/63, a winter characterized by extreme cold conditions over Europe [20].
The links between ice core δ18O and frequency of extreme moisture transport events (Figure 4), could be explained using different paradigms, like teleconnection patterns or weather regimes. Here, we focus on the synoptic scale process, in particular on RWB, to explain these links.
3.2. Relationship to Rossby Wave Breaking
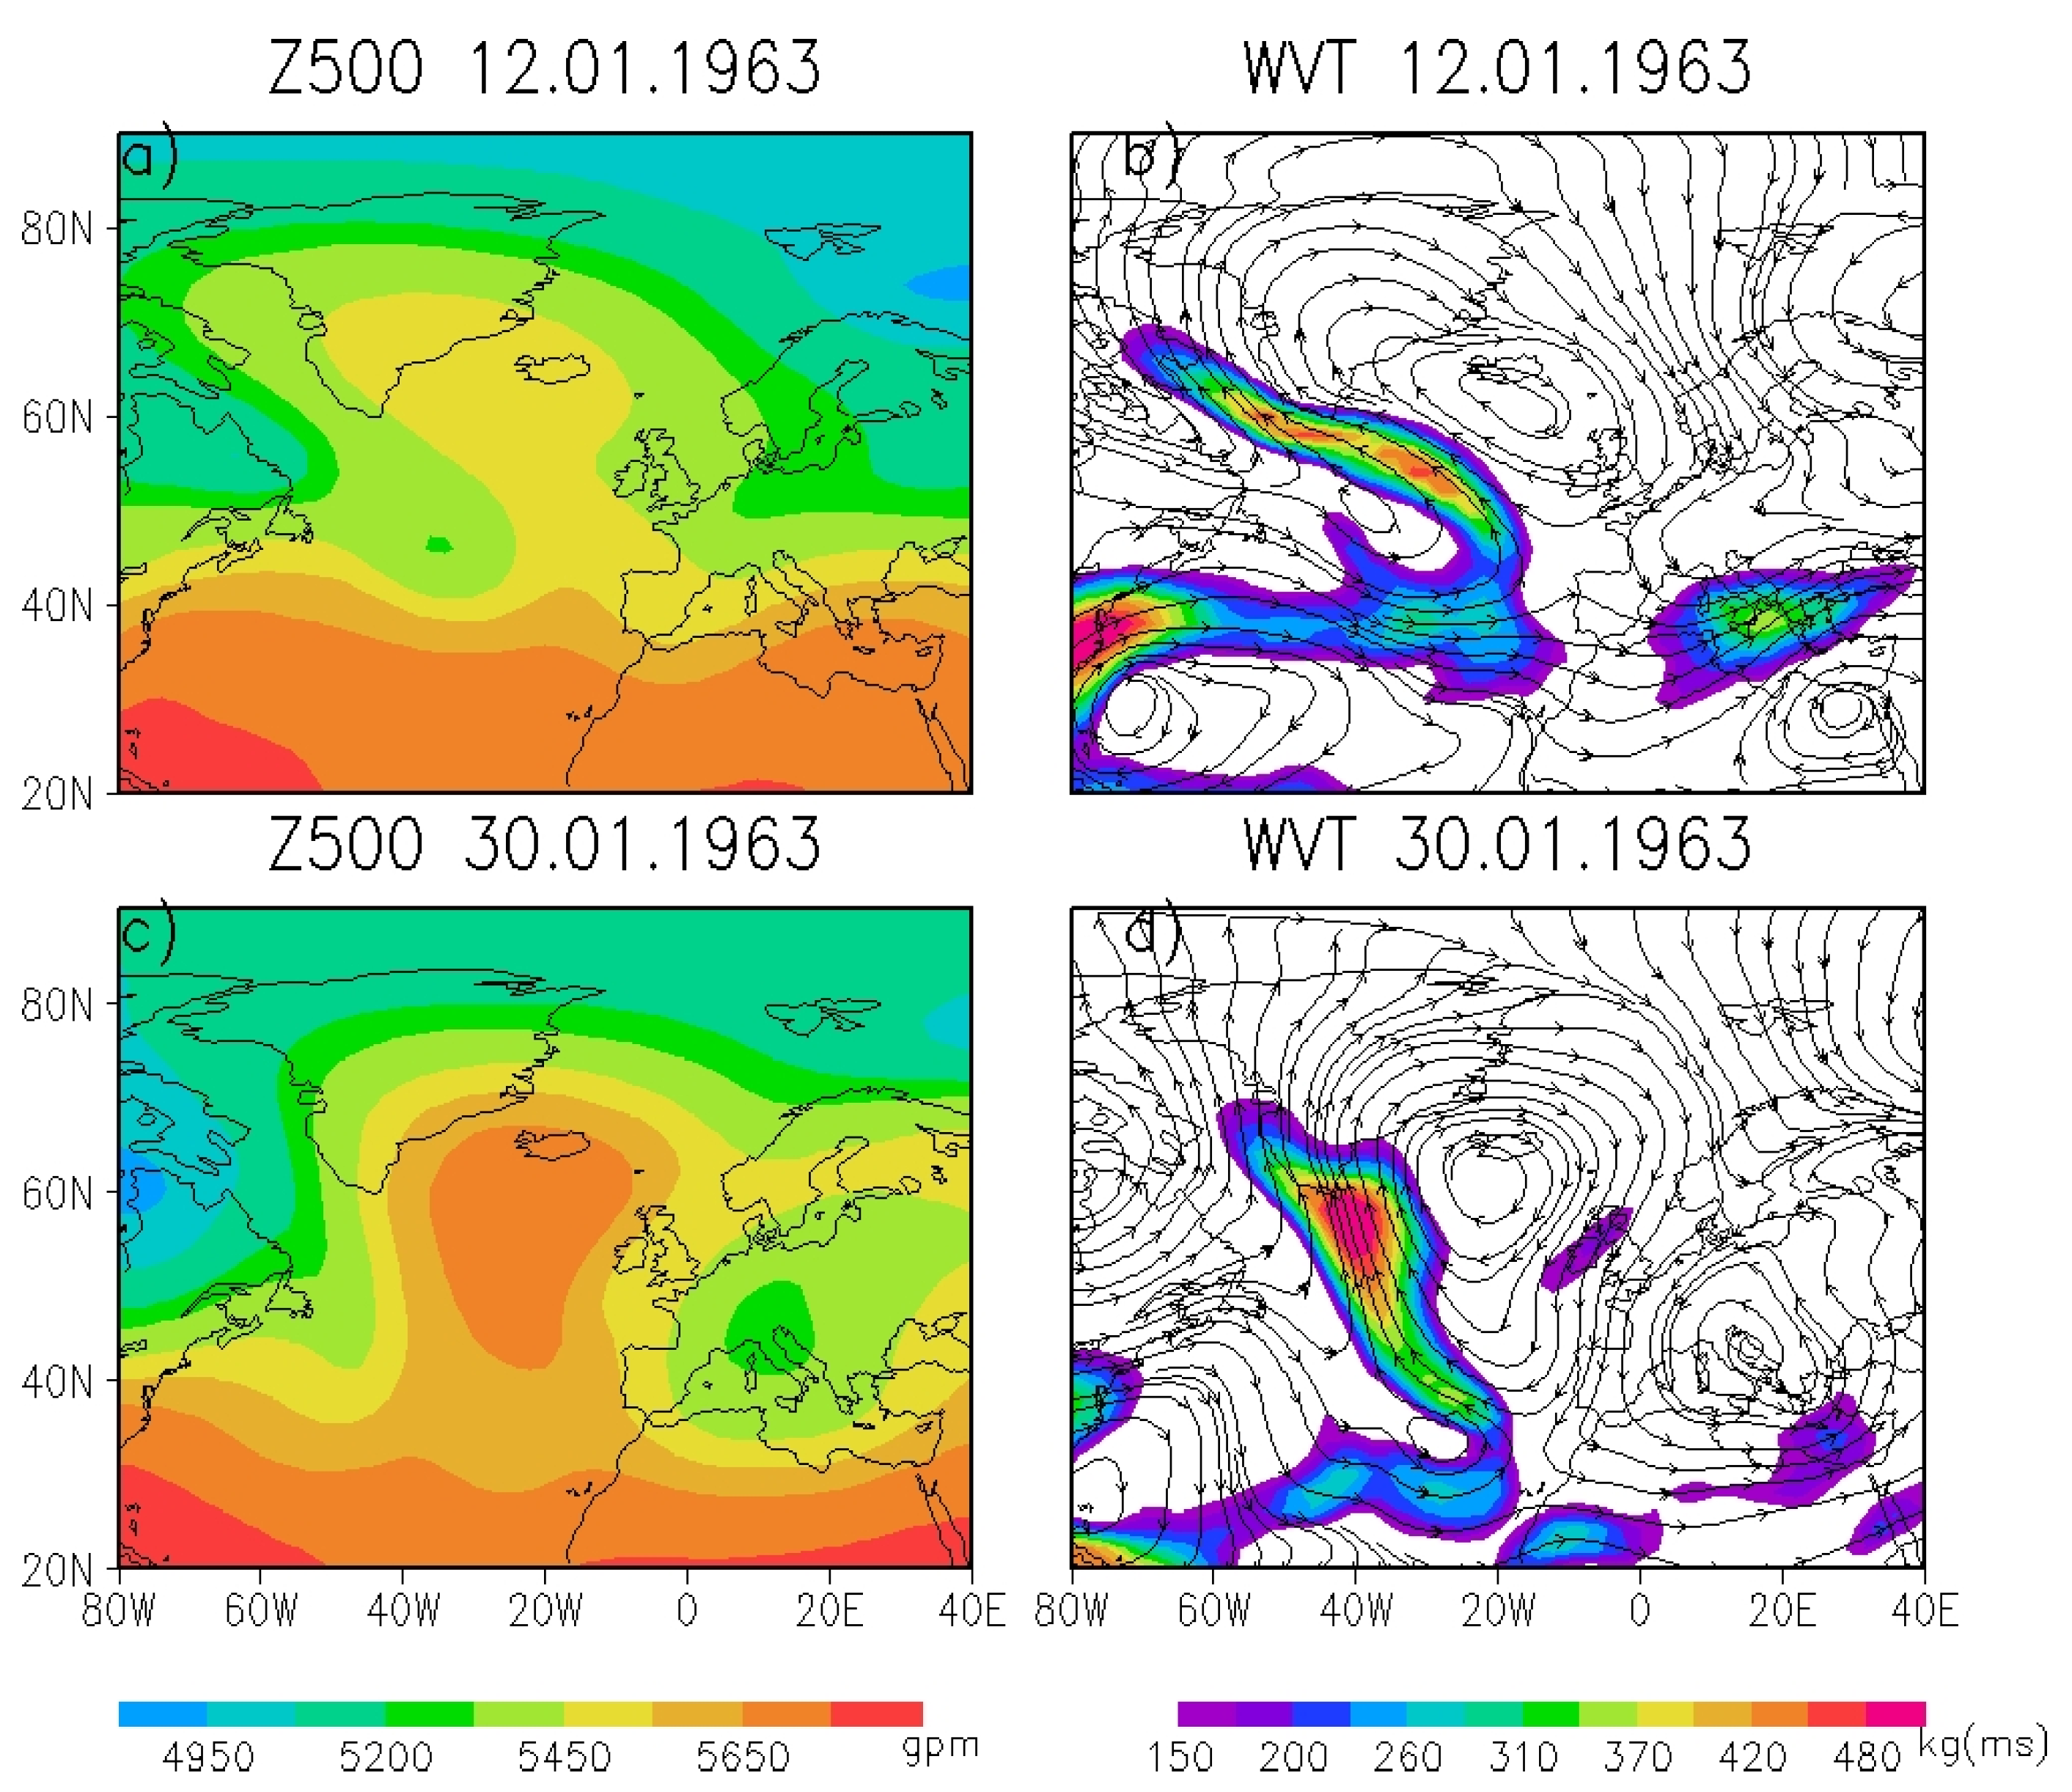
Extreme moisture transport into the Arctic is strongly related to cyclonic and anticyclonic Rossby wave breaking [5]. To better understand the statistical relationships between ice core δ18O and RWB, we analyze the atmospheric circulation for the CWB event from 12 January 1963 and the AWB event from 30 January 1963 (Figure 5). In the first case, a pronounced ridge is recorded in the North Atlantic region (Figure 5a). The axis of this ridge is tilted from southeast to northwest, which is the signature of a CWB event [5]. On the western side of this ridge, a filament of high WVT, reaching northwestern Greenland, is recorded (Figure 5b). The Z500 pattern for the 30 January 1963 AWB event (Figure 5c) shows also a ridge structure in the North Atlantic, with the axis slightly tilted from the southwest to the northeast. In addition, in this case, a filament of high WVT towards western Greenland is recorded (Figure 5d). Such events are related to positive temperature and precipitation δ18O anomalies over Greenland. The WVT patterns (Figure 5) associated with these RWB events have the imprint of the atmospheric rivers in the western Atlantic. It was shown that atmospheric rivers significantly impact Greenland both in winter and summer [7].
To assess statistically these links, we calculate the difference between the composite maps of the frequency of RWB corresponding to high and low ice core δ18O winters. The frequency of CWB (AWB) is significantly higher over Greenland (North Sea) region during high relative to low ice core δ18O winters (Figure 6a,b). A similar composite analysis based on the extreme moisture transport index, defined above, reveals similar CWB and AWB patterns (Figure 6c,d). This confirms the sensitivity of ice core δ18O anomalies to changes in the extreme meridional water vapor transport in the western Greenland as shown in Figure 3.
The CWB (Figure 6a) and AWB (Figure 6b) patterns are consistent with the blocking pattern associated with stable isotope ice core variability from the central Greenland [2]. Increased blocking frequency in a region stretching from Greenland to northwestern Europe during warm relative to cold conditions in central Greenland is due to increased frequency of both CWB and AWB. Greenland (European) blocking is associated mainly with CWB (AWB) events [11]. Previous studies [2,21] show that positive temperature and precipitation δ18O anomalies in western and central Greenland are associated with enhanced blocking activity in the entire North Atlantic region.
Various internal and external forcings were related to Greenland δ18O ice core variability [4]. Here, we focus on the role of tropical Atlantic SST anomalies on δ18O variability in our record through modulation of RWB activity in the North Atlantic region.
3.3. Teleconnections with Sea Surface Temperature Anomalies
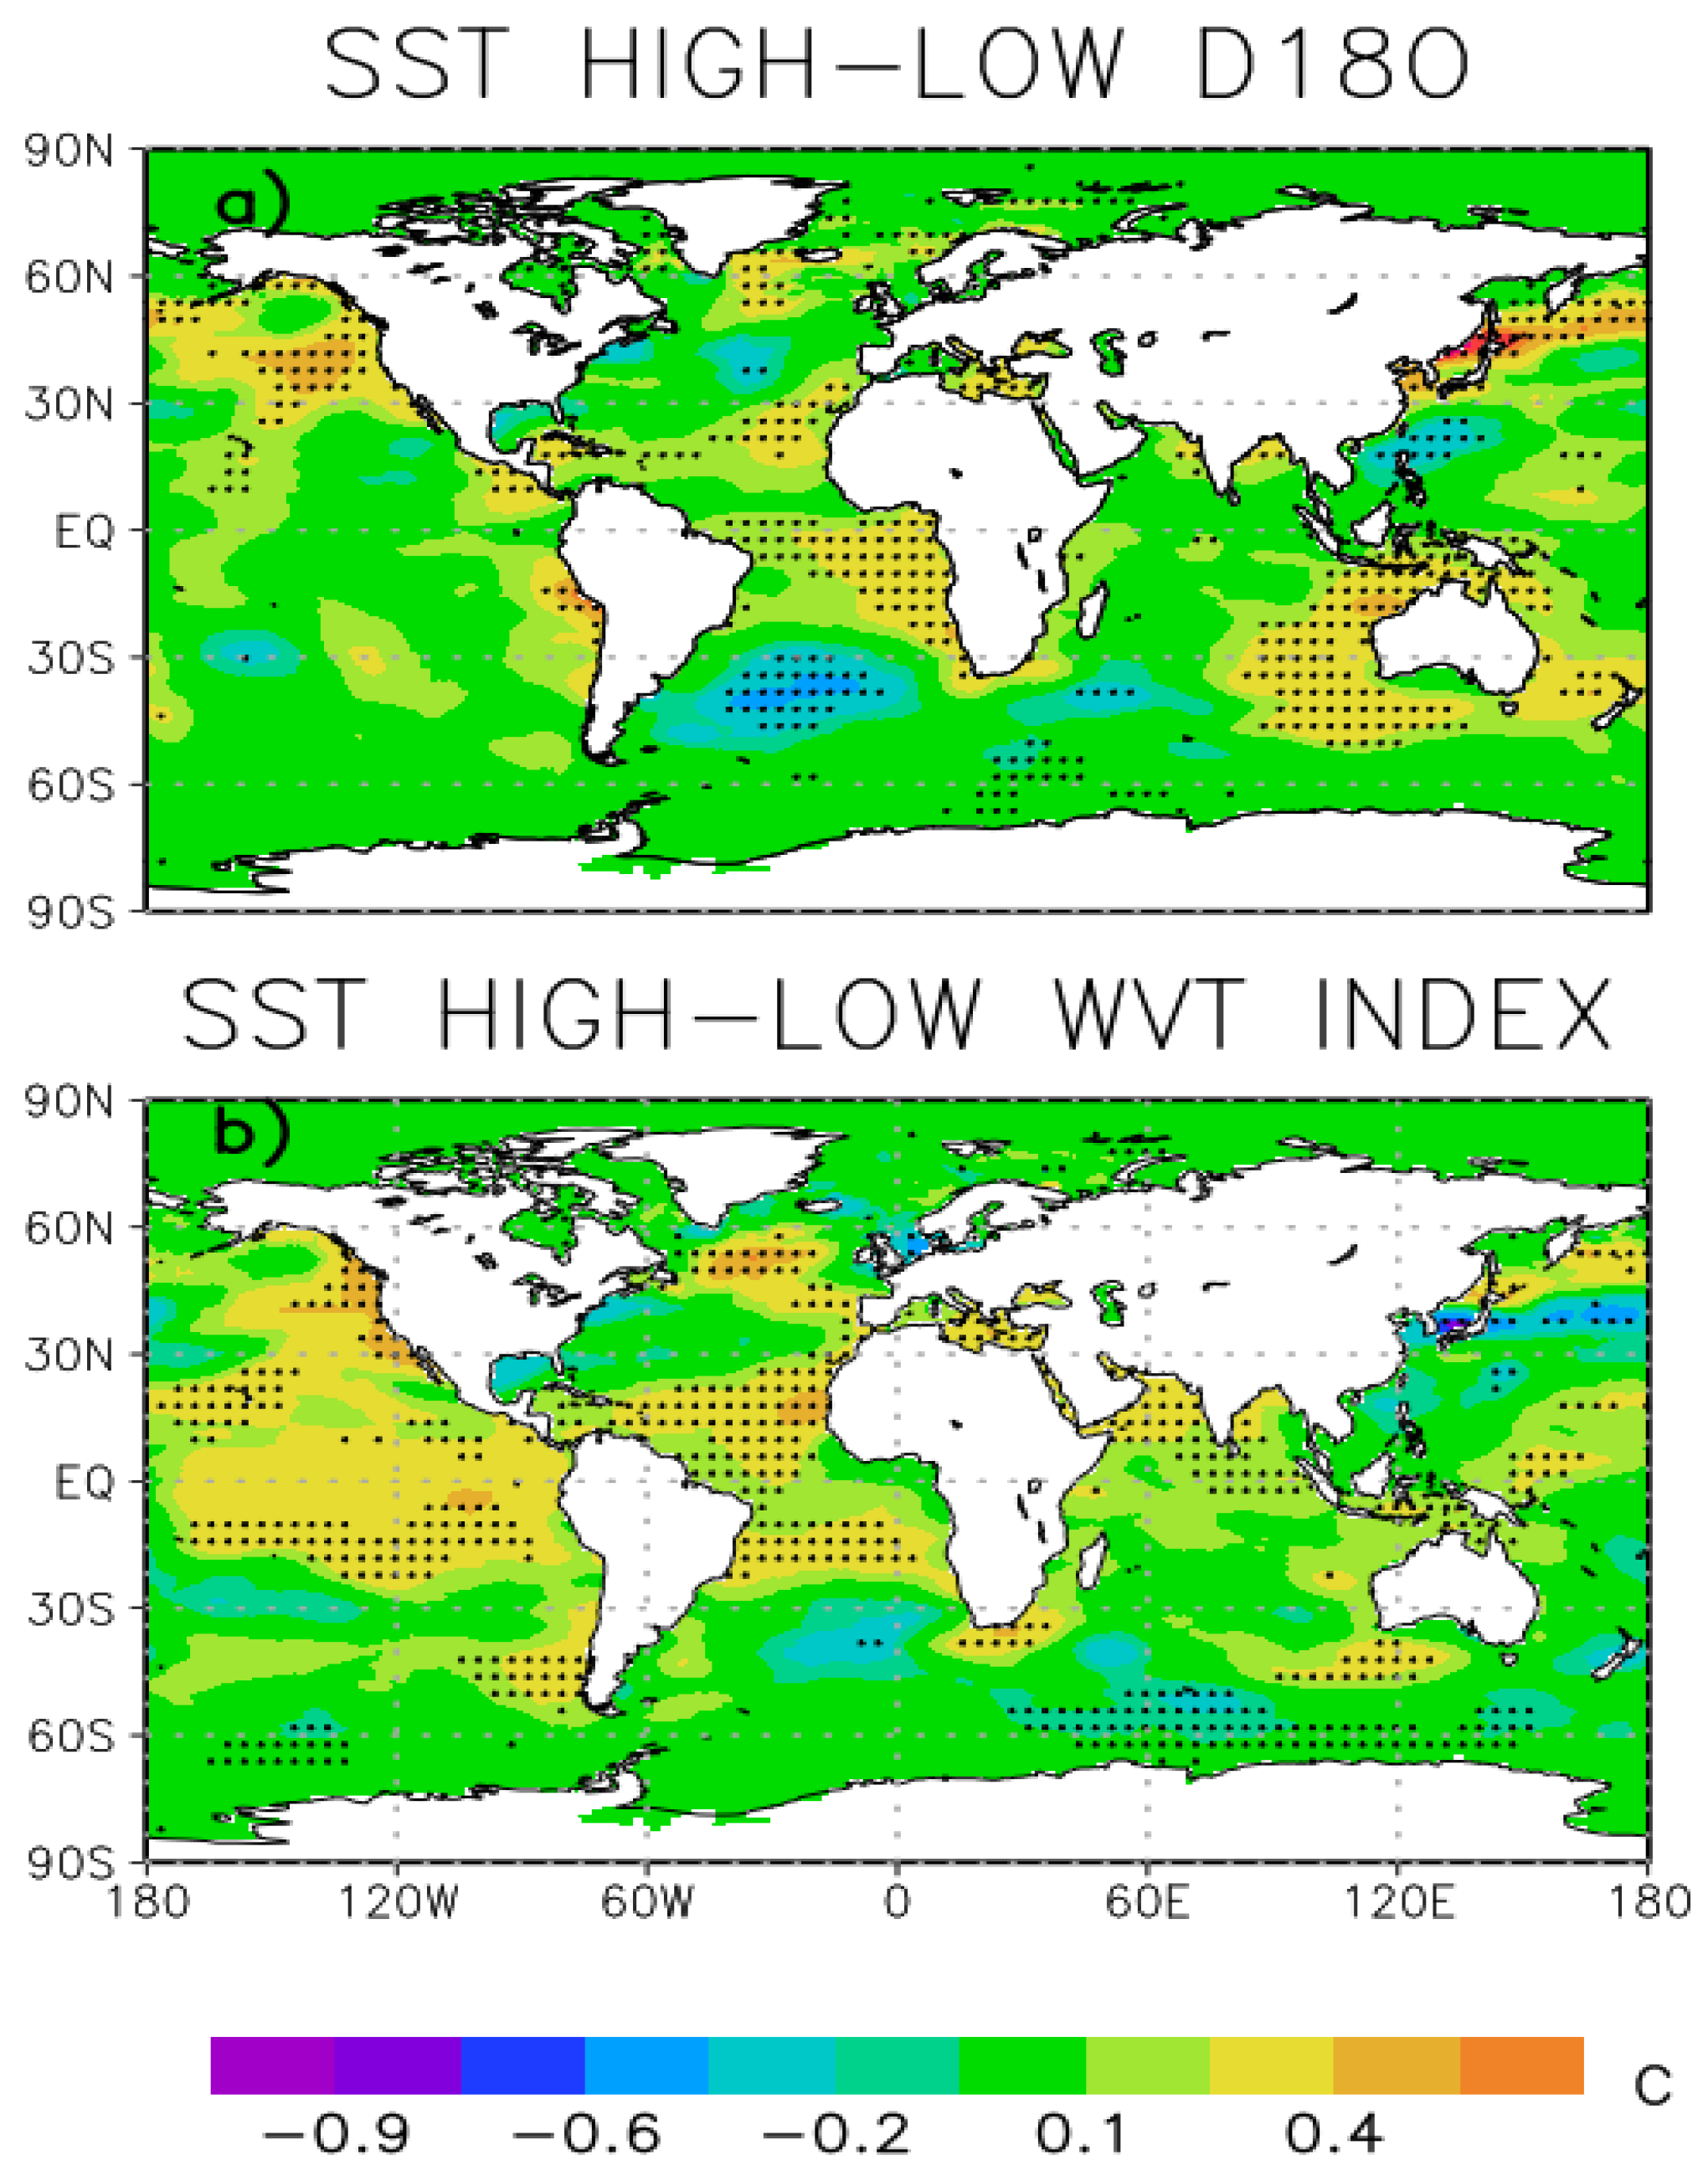
Recent studies [22,23] show strong connections between the North Atlantic blocking and the associated RWB and tropical Atlantic SST anomalies at interannual to decadal time scales. Positive SST anomalies in the tropical Atlantic region are associated with more frequent blocking in the North Atlantic region and extreme cold winters over Europe [23]. Furthermore, more frequent CWB in Greenland region is recorded during positive SST anomalies in the tropical Atlantic [22]. Consistent with these studies, a significant increase of tropical Atlantic SST during high relative to low δ18O ice core winters is recorded (Figure 7a). Significant positive SST anomalies are recorded also south of Greenland, as well as in several regions from the Indian and Pacific oceans (Figure 7a). In the North Atlantic, the SST patterns associated with ice core δ18O and extreme WVT index (Figure 7) show similar spatial structures. Similar links with tropical Atlantic were identified for a northern Greenland δ18O ice core record [24]. The SST patterns presented in Figure 7 resemble also the SST pattern associated with the negative phase of the NAO, when warm and wet conditions are recorded in southern western and central Greenland [4].
3.4. Teleconnections with Extreme Low Temperatures
Blocking and RWB frequency variability in the North Atlantic region is also associated with specific patterns in climate extreme indices over Europe [23]. Here, we look for the links between the southern and central Greenland ice core δ18O stacked record and anomalies in the frequency of cold climate extremes, i.e., TN10p index [19]. Since the period of analysis is relatively short, i.e., only 73 years, the composites are based on linear detrended data, without applying the 5-year running mean filter. Therefore, the TN10p anomaly patterns are associated with both interannual and decadal ice core δ18O and WVT index variability. The patterns based on smoothed data (not shown) are noisy probably due to reduced number of independent samples.
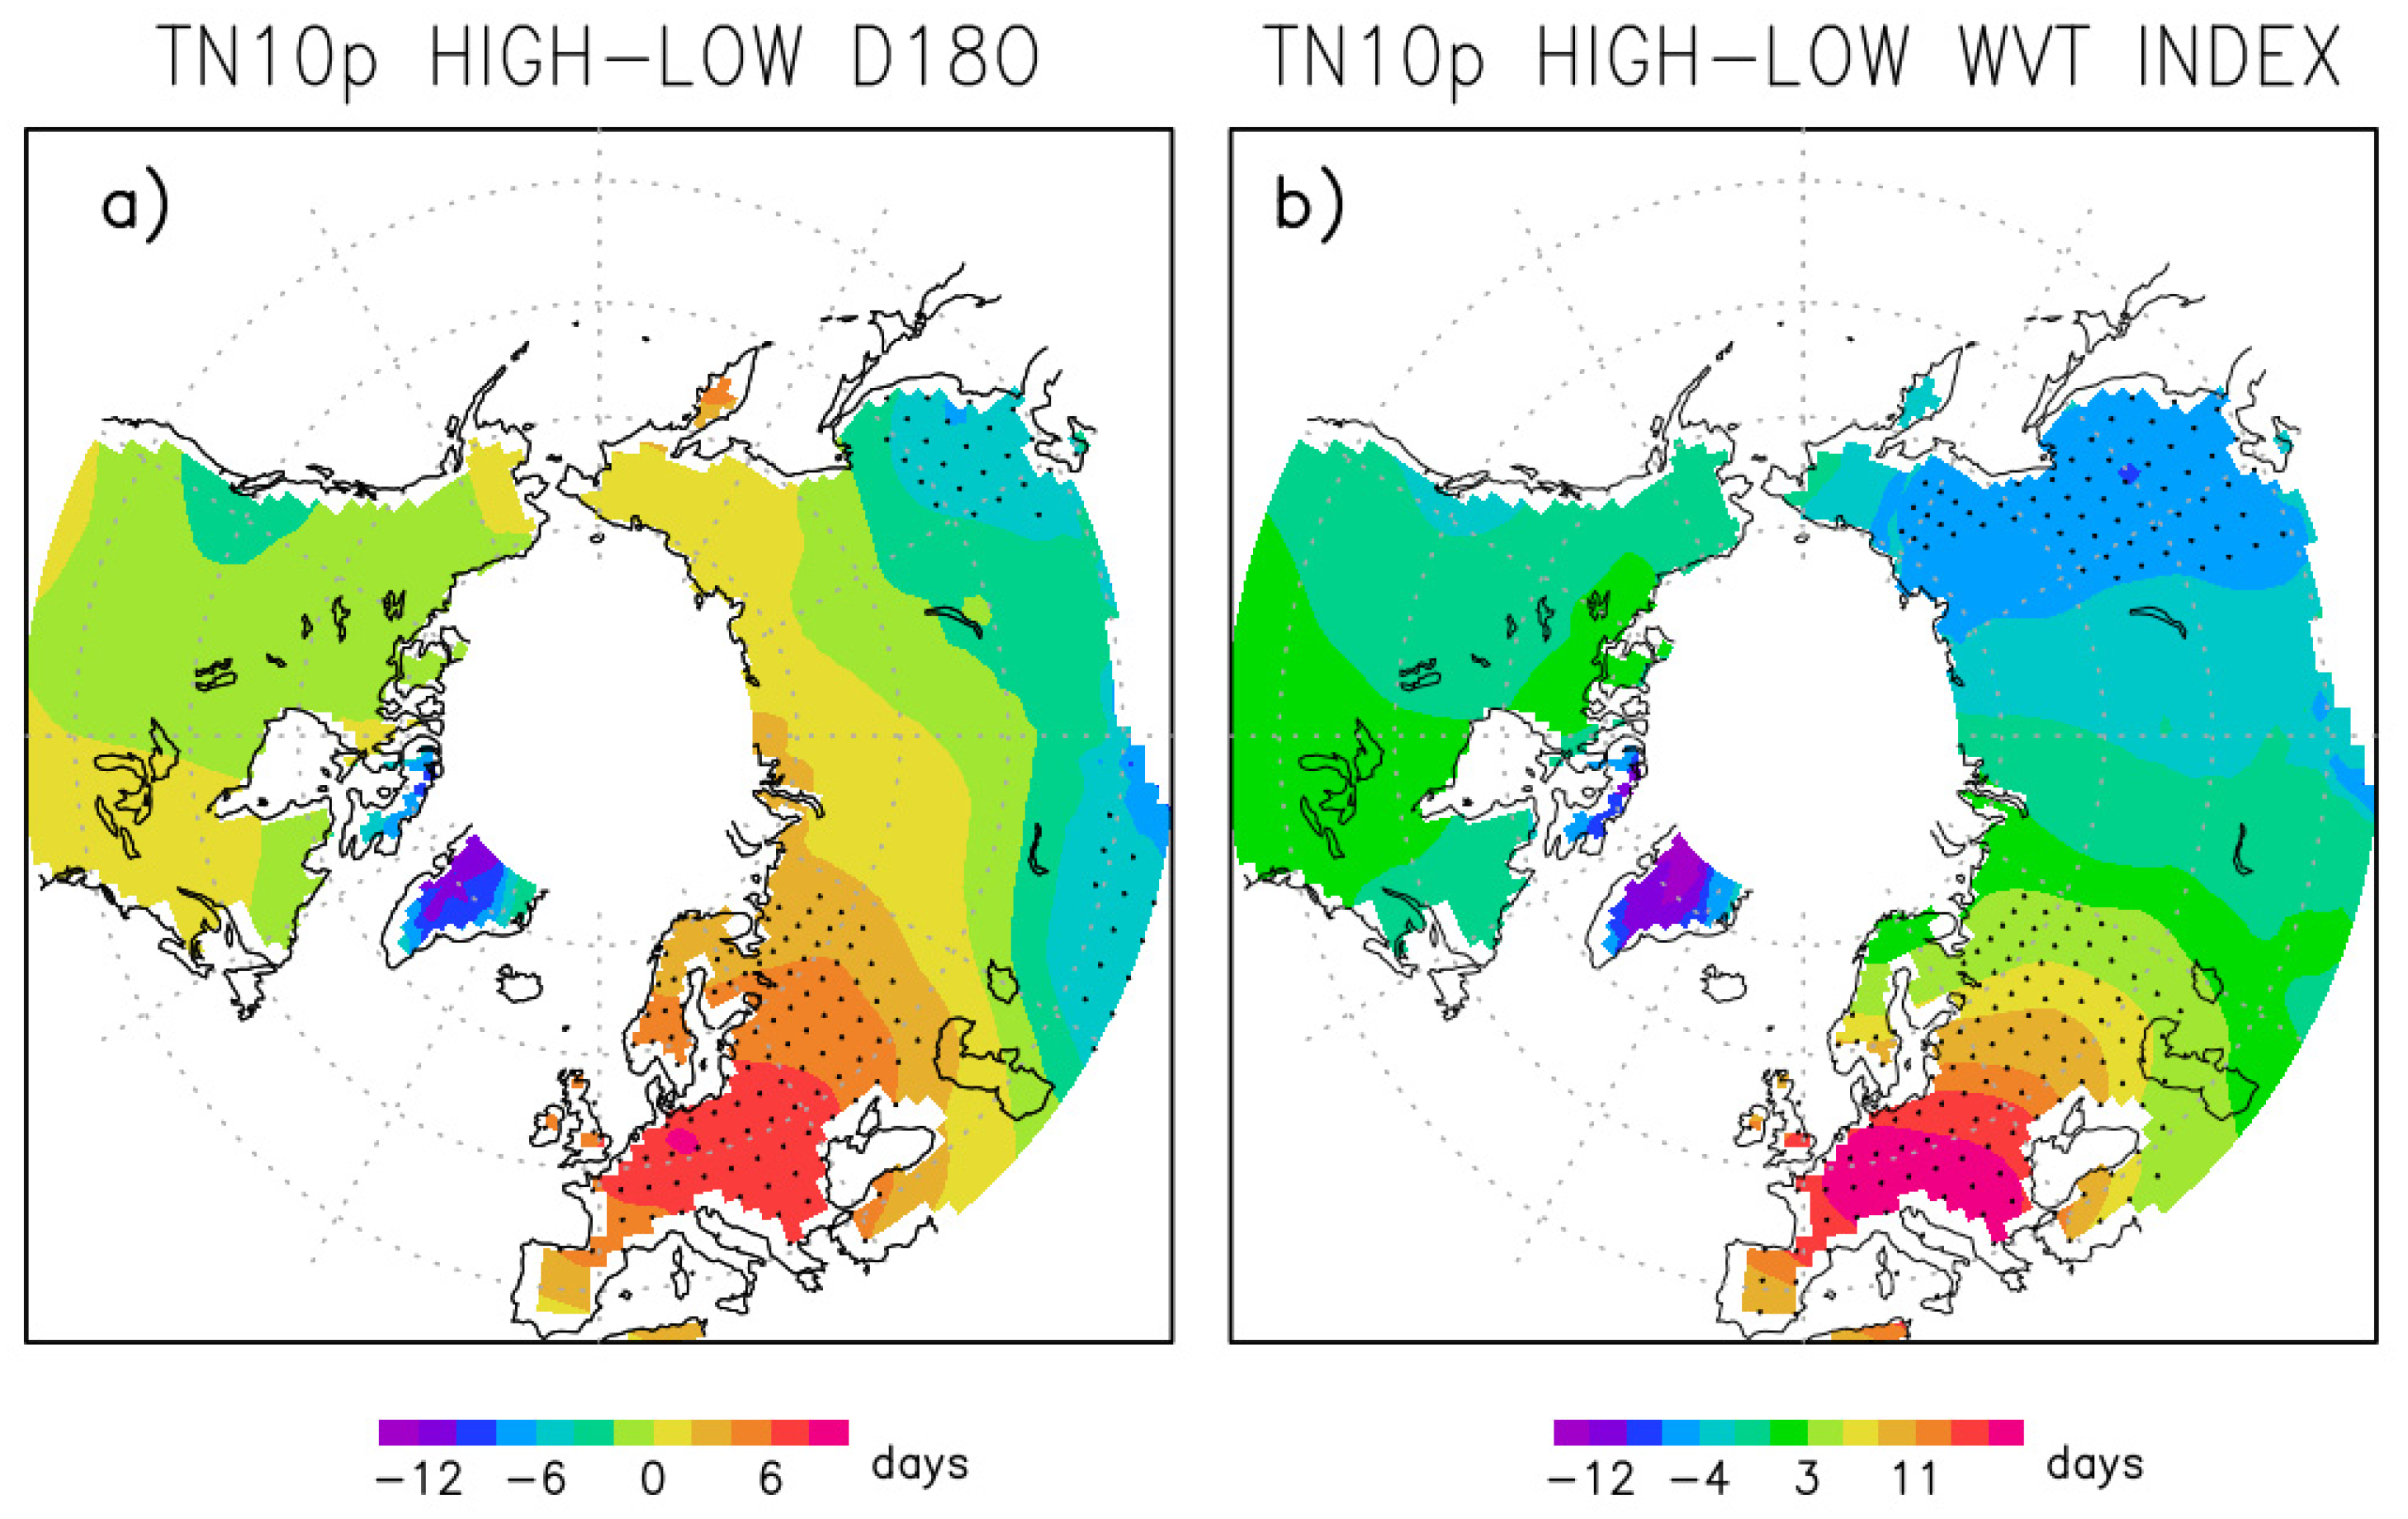
The composite map of winter TN10p indices associated with central Greenland δ18O ice cores (Figure 8a) shows coherent large-scale structures. Significant positive anomalies are recorded over central and southern Europe, while negative anomalies, prevail over southern Asia. A similar pattern is associated with extreme WVT index variability (Figure 8b). Over the North America both patterns show non-significant TN10p anomalies. A previous study [2] reported in-phase variations between central Greenland stable isotope anomalies and TN10p over Europe, which is consistent with TN10p pattern represented in Figure 8a. Similar patterns are obtained for other cold climate extreme indices, like FD (frequency of frost days) and ID (frequency of ice days) (not shown). The links presented in this section could be useful for interpretation of past δ18O ice core variations in terms of extreme weather and climate changes.
3.5. Ice Core δ18O Variability during the Last Millennia
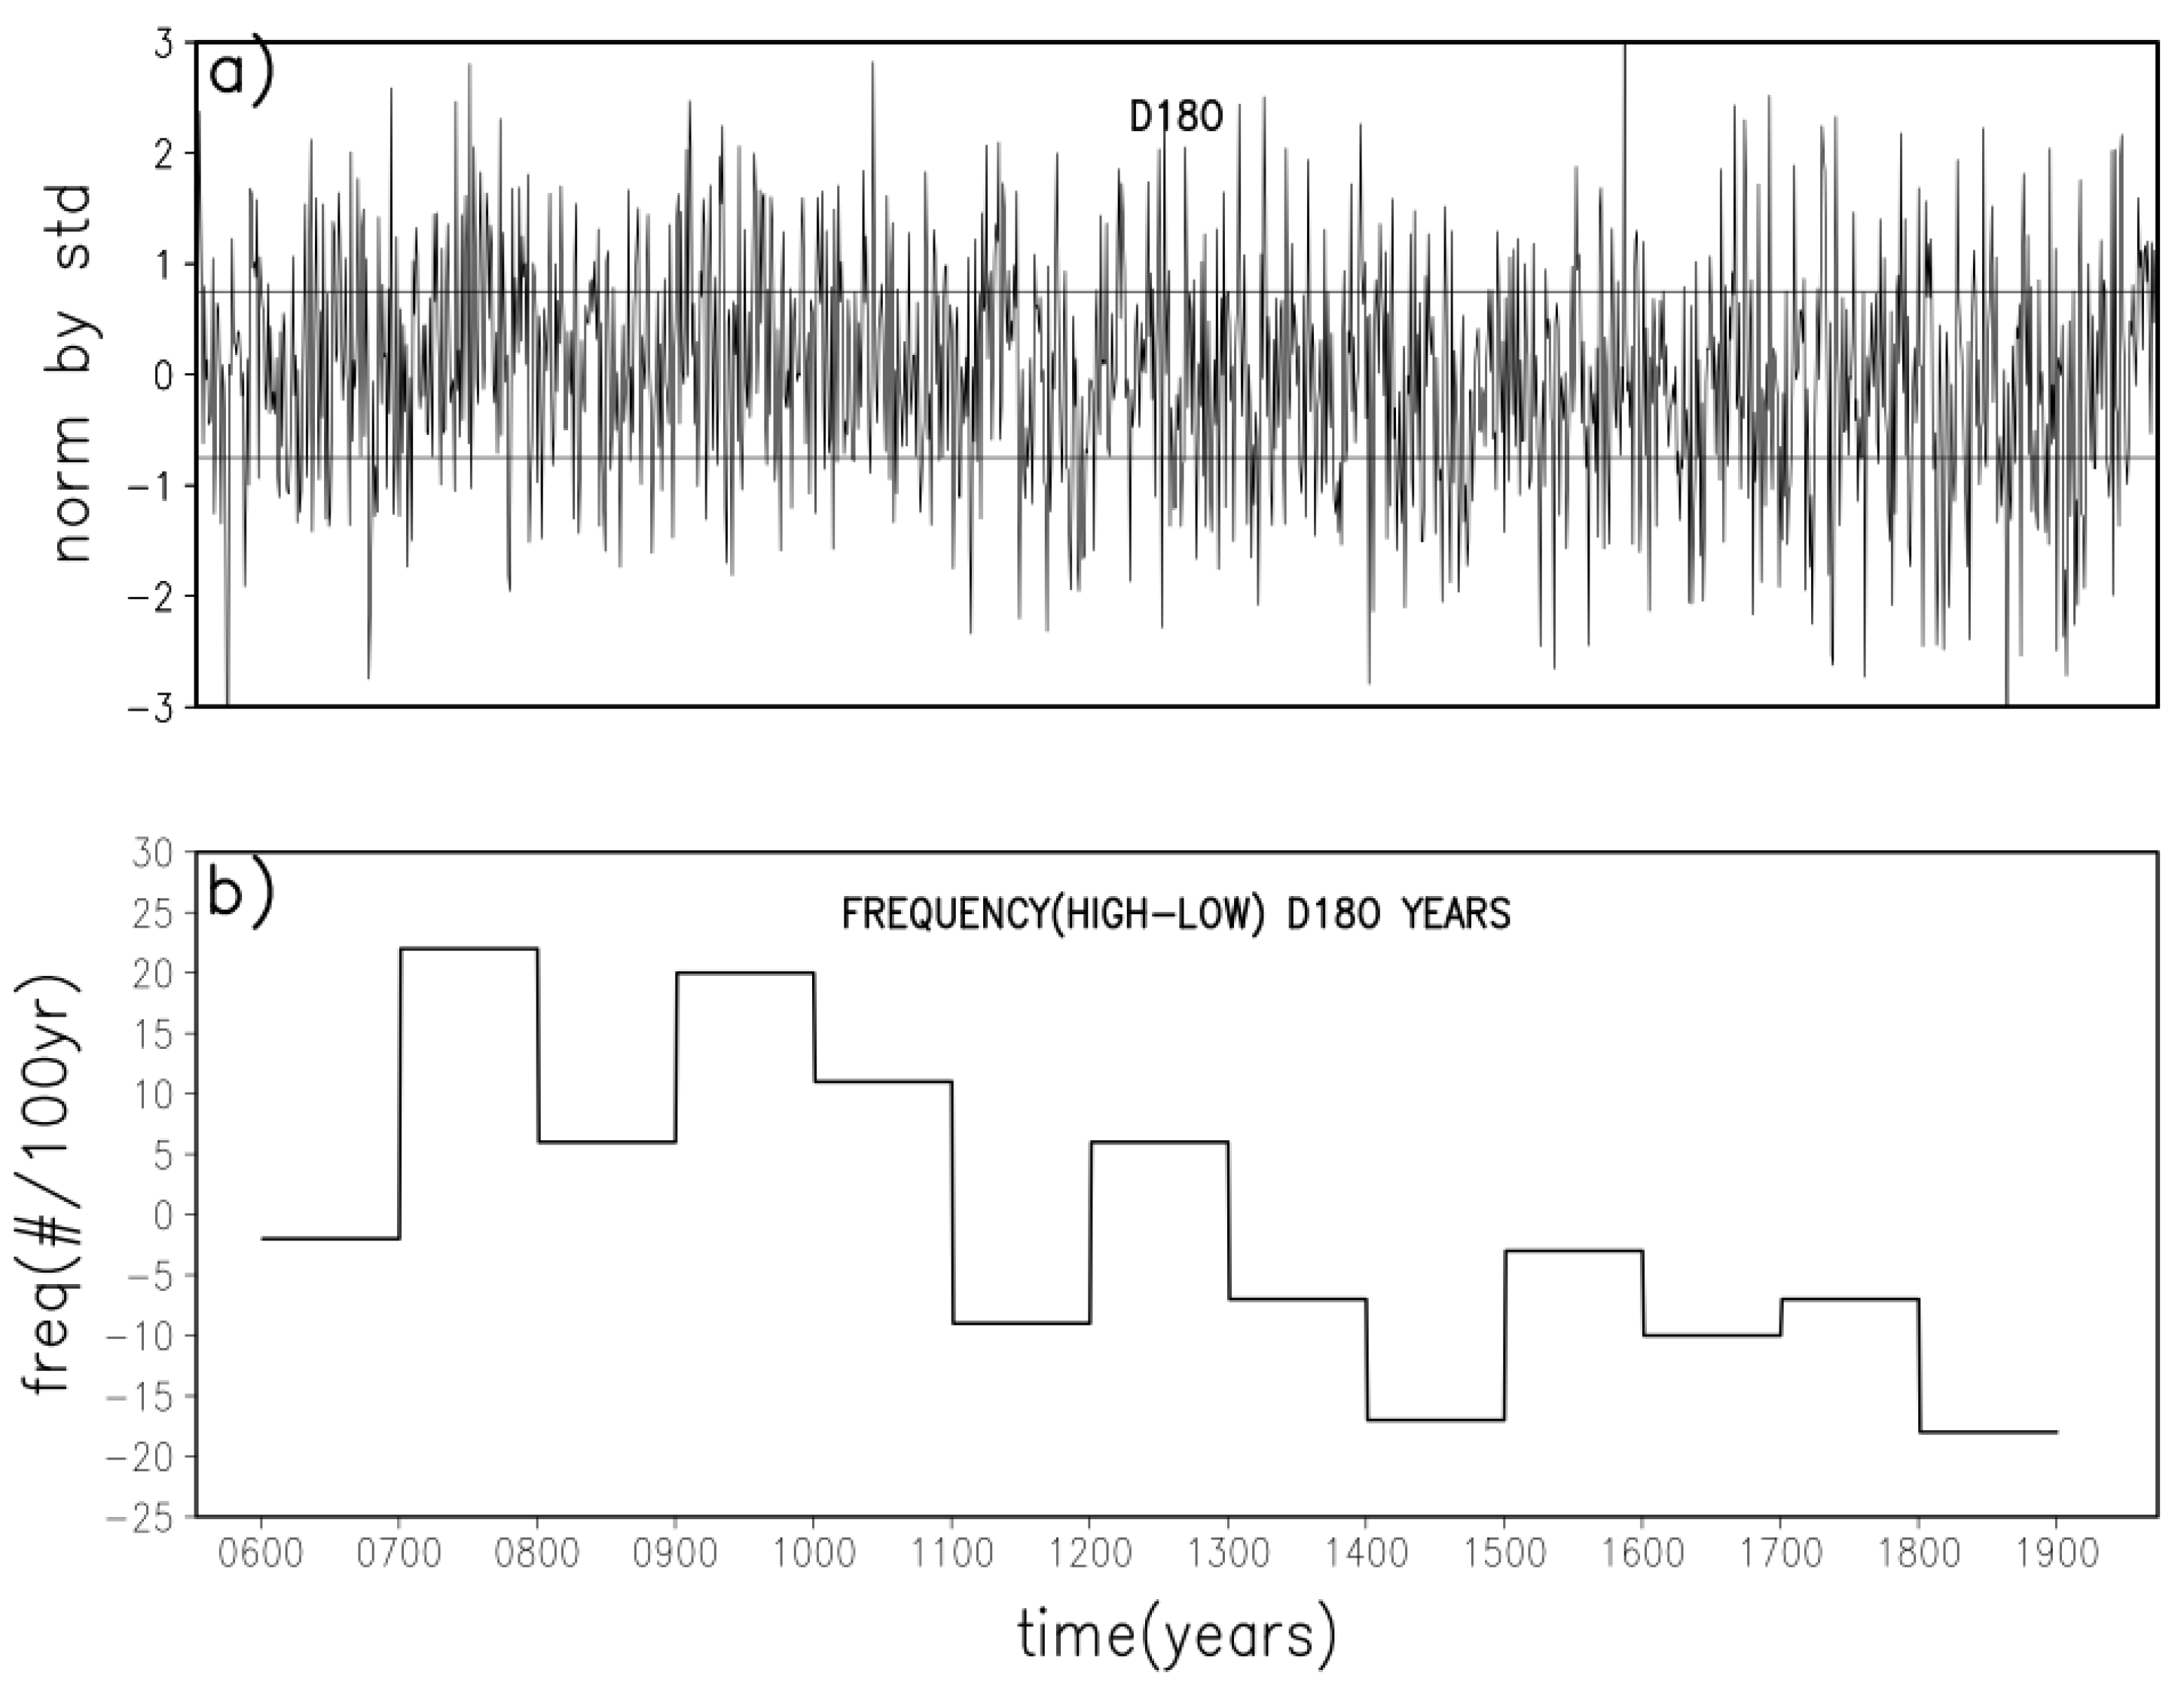
The original time series of δ18O [12] (Figure 9a), which has annual resolution, shows a long-term decreasing trend until the beginning of the 20th century. Similar trends are indicated by various proxy temperatures from the Atlantic sector of the Arctic region [25]. High (low) δ18O winters, like those recorded in, 1880s, 1930s and 1965s (1865s, 1910s and 1950s) occurred frequently since the year 553 (Figure 9a). To better emphasize the variability of ice core δ18O during the last millennia we calculate the difference between the frequency of high and, respectively, low δ18O winters in 100-year bins covering the period 601 to 1900 (Figure 9b). The frequency of high relative to low δ18O winters is generally higher at the beginning of the period (7th–10th centuries), then showed a general decreasing trend (Figure 9b). The minimum was reached in the 19th century before the pronounced global temperature increase during the last century. In addition to this general decreasing trend, rapid century scale fluctuations are observed. In particular, the highest frequency of high (low) relative to low (high) δ18O winters is recorded during 701–800 (1801–1900) (Figure 9b). In addition, during 1401–1500, a period characterized by relatively low global temperature [26], low δ18O winters appear more frequent than high δ18O winters (Figure 9b).
According to our interpretation, CWB and AWB events occur with higher probability during years characterized by high relative to low δ18O in this ice core record.Assuming that ice core δ18O and RWB variability links are independent on timescale, the decreasing trend in the frequency of high relative to low δ18O years (Figure 9b) could be associated with a continuous decrease in the frequency of AWB and CWB events in the North Atlantic until the beginning of the 20th century. Furthermore, we suggest that the frequency of the AWB and CWB events was the highest (lowest) during 701–800 (1801–1900) (Figure 9b).
4. Discussion and Conclusions
Extreme water vapor transport represents a significant part of total water transport towards the Arctic region [5,7]. Here, we show that the variability in the frequency of extreme meridional water vapor transport events towards western Greenland is well recorded in δ18O from southern and central Greenland ice cores. These extreme water vapor transport events are associated both with cyclonic and anticyclonic RWB in the North Atlantic region. On the western side of the RWB pattern a filament of increased moisture transport occurs, leading to moist and warm conditions in southern, western and central Greenland, i.e., more positive δ18O in ice core records. This is consistent with previous studies [1], which report a significant negative correlation between the NAO, which is negatively correlated with RWB activity in the North Atlantic [10], and southern and central Greenland ice core δ18O. The increase in the frequency of cold events over Europe during high ice core δ18O winters is related to the increase in the frequency of cold polar air advected towards south on the eastern part of the RWB pattern.
The variability of Greenland δ18O ice core records was related to the main modes of climate variability, like the NAO or AMO) [1,2]. Both NAO and AMO modulate the RWB activity in the North Atlantic region [22], and therefore, their signature should be identified both in Greenland δ18O ice core and frequency of extreme cold events over Europe records. The magnitude of the CWB-related WVT is largely a function of the background moisture gradient. During the positive phase of the AMO moisture availability is enhanced due to large-scale positive temperature anomalies over the entire North Atlantic. In the same time, tropical Atlantic forcing associated with positive AMO phase induces more frequent CWB events in the North Atlantic region [22]. The increase in both moisture availability as well as increase in CWB frequency during positive AMO phase is consistent with widespread positive δ18O anomalies over Greenland. This mechanism could explain, from a synoptic scale perspective, how the AMO signal is recorded in Greenland ice cores as noted in recent studies [2]. This is consistent with previous studies [27] showing that negative (positive) phase of the NAO prevails during positive (negative) AMO phase.
We have shown that a strong connection exists between extreme meridional water vapor transport in western Greenland, which is partly controlled by RWB activity, and tropical Atlantic SST. Several mechanisms were proposed to explain the link between tropical Atlantic SST anomalies with RWB and associated blocking activity in the North Atlantic region. Numerical experiments [28] show that the atmospheric response to tropical Atlantic SST forcing shared many features with the linear model of [29], where an off-equatorial heating produces a stationary wave to the northwestern and southwestern side of the heating source. Model simulations reveal a similar response of the atmosphere to AMO related SST forcing [22]. They show that during the positive AMO phase, higher tropical Atlantic SSTs enhance convection and precipitation north of the equator. The enhanced convection leads to an upper-level anticyclonic circulation, which shifts the jet maximum to the south. The increase in negative barotropic horizontal wind shear leads to an increase in cyclonic wave breaking frequency in the Greenland region. This is consistent with an increase in the frequency of extreme cold events over Europe during increase extreme moisture transport in western Greenland as shown in this study.
Our study opens the possibility for reconstructing past changes in the frequencies of weather and climate extremes based on Arctic δ18O ice cores. The relationships presented here could also be helpful to put the increase in frequency and intensity of Greenland blocking and associated moisture transport during the last decades [30] into a long-term perspective. Although our results are based on a single stacked ice core δ18O record, other Arctic ice cores could be sensitive to the variation in the frequency of extreme moisture transport events, and used as proxies for past extreme variability. Furthermore, isotope enabled model simulations [4,24] and could be used to test the robustness of the patterns presented in this study and get insight into the physical processes behind.
Recent modeling studies [10] identified significant low-frequency variability in wintertime planetary wave breaking frequency. They show that wave-breaking indices are better indicators of destructive windstorm episodes and the interpretation is more physically based than in a purely NAO-based approach. In the same line, our results suggest that a wave-breaking approach give us a better physically based explanation of the relationship between low-frequency variability of extreme low temperatures over Europe, Greenland stable oxygen isotope ice core records and tropical Atlantic SST than the traditional approach based on teleconnection patterns. The links between climate extremes and proxy data, as presented in this and other studies [2], could complement and support the model-based conclusions related to the low-frequency variability of weather and climate extreme events and their links with atmospheric circulation dynamical processes.
Author Contributions
Conceptualization, N.R., M.I. and G.L.; methodology, N.R. and M.I.; formal analysis, N.R.; investigation, N.R. and M.I.; writing—original draft preparation, N.R. and M.I.; writing—review and editing, N.R., M.I. and G.L.; visualization, N.R. All authors have read and agreed to the published version of the manuscript.
Funding
This study was funded through the joint program “Changing Earth—Sustaining our Future” (PoF IV) program of the AWI. Funding by the AWI Strategy Fund Project—PalEX and by the Helmholtz Climate Initiative—REKLIM are gratefully acknowledged.
Institutional Review Board Statement
Not applicable.
Informed Consent Statement
Not applicable.
Data Availability Statement
The data that support the findings of this study are openly available. The relevant papers associated with these datasets are referred in the text.
Acknowledgments
We acknowledge the use of all data sets cited in this paper and would also like to thank all the authors for making them free for scientific research. We would also like to acknowledge the anonymous reviewers for their time and effort in examining this manuscript. Their comments made this manuscript a stronger contribution.
Conflicts of Interest
The authors declare no conflict of interest. The funders had no role in the design of the study; in the collection, analyses, or interpretation of data; in the writing of the manuscript, or in the decision to publish the results.
References
- Vinther, B.M.; Jones, P.D.; Briffa, K.R.; Clausen, H.B.; Andersen, K.K.; Dahl-Jensen, D.; Johnsen, S.J. Climatic signals in multiple highly resolved stable isotope records from Greenland. Q. Sci. Rev. 2010, 29, 522–538. [Google Scholar] [CrossRef]
- Rimbu, N.; Lohmann, G.; Werner, M.; Ionita, M. Links between central Greenland stable isotopes, blocking and extreme climate variability over Europe at decadal to multidecadal time scales. Clim. Dyn. 2017, 49, 649–663. [Google Scholar] [CrossRef] [Green Version]
- Rimbu, N.; Lohmann, G. Decadal Variability in a Central Greenland High-Resolution Deuterium Isotope Record and Its Relationship to the Frequency of Daily Atmospheric Circulation Patterns from the North Atlantic Region. J. Clim. 2010, 23, 4608–4618. [Google Scholar] [CrossRef] [Green Version]
- Ortega, P.; Swingedouw, D.; Masson-Delmotte, M.; Risi, C.; Vinther, B.; Yiou, P.; Vautard, R.; Yoshimura, K. Characterizing atmospheric circulation signals in Greenland ice cores: Insights from a weather regime approach. Clim. Dyn. 2014, 43, 2585–2605. [Google Scholar] [CrossRef]
- Liu, C.; Barnes, E.A. Extreme moisture transport into the Arctic linked to Rossby wave breaking. J. Geophys. Res. Atmos. 2015, 120, 3774–3788. [Google Scholar] [CrossRef]
- Neff, W.; Compo, G.P.; Ralph, F.M.; Shupe, M.D. Continental heat anomalies and the extreme melting of the Greenland ice surface in 2012 and 1889. J. Geophys. Res. Atmos. 2014, 119, 6520–6536. [Google Scholar] [CrossRef]
- Newman, M.G.; Kiladis, N.; Weickmann, K.M.; Ralph, F.M.; Sardeshmukh, P.D. Relative contributions of synoptic and low-frequency eddies to time-mean atmospheric moisture transport, including the role of atmospheric rivers. J. Clim. 2012, 25, 7341–7361. [Google Scholar] [CrossRef]
- Woods, C.; Caballero, R.; Svensson, G. Large-scale circulation associated with moisture intrusions into the Arctic during winter. Geophys. Res. Lett. 2013, 40, 4717–4721. [Google Scholar] [CrossRef]
- Pelly, J.; Hoskins, B. A new perspective on blocking. J. Atmos. Sci. 2003, 60, 743–755. [Google Scholar] [CrossRef]
- Messori, G.; Davini, P.; Alvarez-Castro, M.C.; Pausata, F.S.R.; Yiou, P.; Caballero, R. On the low-frequency variability of wintertime Euro-Atlantic planetary wave-breaking. Clim. Dyn. 2019, 52, 2431–2450. [Google Scholar] [CrossRef] [Green Version]
- Davini, P.; Cagnazzo, C.; Gualdi, S.; Navarra, A. Bidimensional diagnostics, variability, and trends of Northern Hemisphere blocking. J. Clim. 2012, 25, 6496–6509. [Google Scholar] [CrossRef]
- Vinther, B.M.; Jones, P.D.; Briffa, K.R.; Clausen, H.B.; Dahl-Jensen, D.; Johnsen, S. DYE-3, GRIP, Crete winter season δ18O average. PANGAEA 2010. [Google Scholar] [CrossRef]
- Compo, G.P.; Whitaker, J.S.; Sardesmukh, P.D.; Matsui, N.; Allan, R.J.; Yin, X.; Gleason, B.E.; Vose, R.-S.; Rutledge, G.; Bassemoulin, P.; et al. The Twentieth Century Reanalysis Project. Q. J. R. Meteorol. Soc. 2011, 137, 1–28. [Google Scholar] [CrossRef]
- Scherrer, S.C.; Croci-Maspoli, M.; Schwierz, C.; Appenzeller, C. Two-dimensional indices of atmospheric blocking and their statistical relationship with winter climate patterns in the EuroAtlantic region. Int. J. Climatol. 2006, 26, 233–249. [Google Scholar] [CrossRef]
- Hirahara, S.; Ishii, M.; Fukuda, Y. Centennial-scale sea surface temperature analysis and its uncertainty. J. Clim. 2014, 27, 57–75. [Google Scholar] [CrossRef]
- Dunn, R.J.H.; Alexander, L.; Donat, M.; Zhang, X.; Bador, M.; Herold, N.; Lippmann, T.; Allan, R.J.; Aguilar, E.; Aziz, A.; et al. Development of an Updated Global Land In Situ-Based Data Set of Temperature and Precipitation Extremes: HadEX3. J. Geophy. Res. Atm. 2020, 125, e2019JD032263. [Google Scholar] [CrossRef]
- Von Storch, H.; Zwiers, F. Statistical Analysis in Climate Research; Cambridge University Press: Cambridge, UK, 1999. [Google Scholar] [CrossRef] [Green Version]
- R Core Team R: A Language and Environment for Statistical Computing; R Foundation for Statistical Computing: Vienna, Austria, 2014; Available online: http://www.R-project.org/ (accessed on 10 October 2020).
- Zhang, X.; Alexander, L.; Hegerl, G.C.; Jones, P.; Klein Tank, A.; Peterson, T.C.; Trewin, B.; Zwiers, F.W. Indices for monitoring changes in extremes based on daily temperature and precipitation data. WCG 2011, 2, 851–870. [Google Scholar] [CrossRef]
- Greatchbach, R.J.; Gollan, G.; Jung, T.; Kunz, T. Tropical origin of the severe European winter of 1962/63. Q. J. R. Meteorol. Soc. 2015, 141, 153–165. [Google Scholar] [CrossRef]
- Rimbu, N.; Lohmann, G. Winter and summer blocking variability in the North Atlantic region. Evidence from long-term observational and proxy data from southwestern Greenland. Clim. Past 2011, 7, 543–555. [Google Scholar] [CrossRef] [Green Version]
- Davini, P.; von Hardenberg, J.; Corti, S. Tropical origin for the impacts of the Atlantic Multidecadal variability on the Euro-Atlantic climate. Environ. Res. Lett. 2015, 10. [Google Scholar] [CrossRef]
- Rimbu, N.; Lohmann, G.; Ionita, M. Interannual to multidecadal Euro-Atlantic blocking variability during winter and its relationship with extreme low temperatures in Europe. J. Geopys. Res. Atmos. 2014, 119, 13621–13636. [Google Scholar] [CrossRef] [Green Version]
- Masson-Delmotte, V.; Steen-Larsen, H.C.; Ortega, P.; Swingedouw, D.; Popp, T.; Vinther, B.M.; Oerter, H.; Sveinbjornsdottir, A.E.; Gudlaugsdottir, H.; Box, J.E.; et al. Recent changes in northwest Greenland climate documented by NEEM shallow ice core data and simulations, and implications for past temperature reconstructions. Cryosphere 2015, 9, 1481–1504. [Google Scholar] [CrossRef] [Green Version]
- Nicolle, M.; Massei, N.; Colin, C.; de Vernal, A.; Colin, C.; Divine, D.; Werner, J.P.; Hormes, A.; Korhola, A.; Linderholm, H.W. Climate variability in the subarctic area for the last 2 millennia. Clim. Past 2018, 14, 101–116. [Google Scholar] [CrossRef] [Green Version]
- PAGES 2K Consortium. A global multiproxy database for temperature reconstructions of the Common Era. Sci. Data 2017, 4. [Google Scholar] [CrossRef]
- Peings, Y.; Magnusdottir, G. Forcing of the wintertime atmospheric circulation by the multidecadal fluctuations of the North Atlantic ocean. Environ. Res. Lett. 2014, 9, 034018. [Google Scholar] [CrossRef]
- Sutton, R.T.; Hodson, D.L. Climate response to basin-scale warming and cooling of the North Atlantic Ocean. J. Clim. 2007, 20, 891–907. [Google Scholar] [CrossRef]
- Gill, A. Some simple solutions for heat-induced tropical circulation. Q. J. R. Meteorol. Soc. 1980, 106, 447–462. [Google Scholar] [CrossRef]
- Barett, S.B.; Henderson, G.R.; McDonell, E.; Henry, M.; Mote, T. Extreme Greenland blocking and high latitude moisture transport. Atmos. Sci. Lett. 2020, e1002. [Google Scholar] [CrossRef]
Figure 1.
The difference between composite map of vertically integrated water vapor transport (WVT) for high and low ice core δ18O winters during 1851 to 1973 (see text for details). Colors indicate the magnitude of the WVT anomalies in kg/(ms) while arrows its direction. The red plus sign indicates the grid point used to calculate the probability distribution of daily meridional WVT and the black dots depict the ice core sites.

Figure 2.
The probability density function of daily meridional water vapor transport at (50° W, 70° N) for high (red) and low (blue) ice core δ18O winters during 1851 to 1973. Dotted vertical line depicts the 90th percentile of the all winter day meridional WVT distribution.
Figure 2.
The probability density function of daily meridional water vapor transport at (50° W, 70° N) for high (red) and low (blue) ice core δ18O winters during 1851 to 1973. Dotted vertical line depicts the 90th percentile of the all winter day meridional WVT distribution.

Figure 3.
The difference between composite map of the qv90p index (see text for definition) for high and low ice core δ18O winters during 1851 to 1973. Only positive values higher than 2 days are shown. Regions where the difference is significant at the 90% level are dotted. Units: days. The rectangle box depicts index area (see text for details).

Figure 4.
(a) Greenland ice core δ18O time series and (b) time series of the western Greenland extreme meridional WVT index (see text for definition) for 1851/52 to 1972/73 winters. Time intervals when the values in the smoothed time series (thick lines) are higher (lower) than 0.75 (−0.75) corresponding standard deviations are highlighted in orange (blue).

Figure 5.
(a) 500 hPa geopotential height and (b) vertically integrated water vapor transport during 12 January 1963 when a CWB event occurred in the North Atlantic region. In (b), color represents the magnitude of WVT higher than 150kg/(ms) and arrows its direction; (c,d), as in (a,b), but for 30 January 1963, when an AWB event was recorded in the North Atlantic region. Units gpm and kg/(ms).

Figure 6.
The difference between composite maps of (a) CWB and (b) AWB frequency of high and, respectively, low ice core δ18O winters; (c,d), as in (a,b), but for extreme WVT index (see text for definition). Regions where the differences are significant at the 90% level or higher are dotted. Units: days.

Figure 7.
(a) The difference between composite maps of SST associated with high and, respectively, low ice core δ18O winters (b) as in (a) but for the extreme WVT index (see text for definition). Regions where the differences are significant at the 90% level are dotted. Units: °C.
Figure 7.
(a) The difference between composite maps of SST associated with high and, respectively, low ice core δ18O winters (b) as in (a) but for the extreme WVT index (see text for definition). Regions where the differences are significant at the 90% level are dotted. Units: °C.

Figure 8.
(a) The difference between composite maps of frequency of cold nights (TN10p) associated with high and, respectively, low ice core δ18O winters (b), as in (a), but for extreme WVT index (see text for definition). Regions where the differences are significant at the 90% level are dotted. Units: days.

Figure 9.
(a) The time series of normalized winter Greenland ice core δ18O used in this study (see text for details) and (b) the difference between the number of years characterized by high (>0.75) and, respectively, low (<(−0.75)) ice core d δ18O in 100-year bins from the year 601 to the year 1900.

Publisher’s Note: MDPI stays neutral with regard to jurisdictional claims in published maps and institutional affiliations. |
© 2021 by the authors. Licensee MDPI, Basel, Switzerland. This article is an open access article distributed under the terms and conditions of the Creative Commons Attribution (CC BY) license (http://creativecommons.org/licenses/by/4.0/).
Share and Cite
MDPI and ACS Style
Rimbu, N.; Ionita, M.; Lohmann, G. A Synoptic Scale Perspective on Greenland Ice Core δ18O Variability and Related Teleconnection Patterns. Atmosphere 2021, 12, 294. https://doi.org/10.3390/atmos12030294
AMA Style
Rimbu N, Ionita M, Lohmann G. A Synoptic Scale Perspective on Greenland Ice Core δ18O Variability and Related Teleconnection Patterns. Atmosphere. 2021; 12(3):294. https://doi.org/10.3390/atmos12030294
Chicago/Turabian StyleRimbu, Norel, Monica Ionita, and Gerrit Lohmann. 2021. "A Synoptic Scale Perspective on Greenland Ice Core δ18O Variability and Related Teleconnection Patterns" Atmosphere 12, no. 3: 294. https://doi.org/10.3390/atmos12030294
Note that from the first issue of 2016, this journal uses article numbers instead of page numbers. See further details here.