Changes in the Seasonality of Ethiopian Highlands Climate and Implications for Crop Growth


1
Agriculture Department, University of Bahir Dar, Bahir Dar, Ethiopia
2
Physics Department, University of Puerto Rico, Mayaguez, PR 00681, USA
3
Geography Department, University of Zululand, KwaDlangezwa 3886, South Africa
*
Author to whom correspondence should be addressed.
Atmosphere 2020, 11(9), 892; https://doi.org/10.3390/atmos11090892
Submission received: 16 June 2020
/
Revised: 6 July 2020
/
Accepted: 6 July 2020
/
Published: 24 August 2020
(This article belongs to the Special Issue Plant Adaptation to Global Climate Change)
Abstract
:Rain-fed agriculture in North-West (NW) Ethiopia is seasonally modulated, and our objective is to isolate past and future trends that influence crop growth. Statistical methods are applied to gauge-interpolated, reanalysis, and satellite data to evaluate changes in the annual cycle and long-term trends. The June to September wet season has lengthened due to the earlier arrival and later departure of rains. Meteorological composites relate this spreading to local southerly winds and a dry-south/wet-north humidity dipole. At the regional scale, an axis of convection over the Rift Valley (35E) is formed by westerly waves on 15S and an anticyclone over Asia 30N. Coupled Model Intercomparsion Project (CMIP5) Hadley2 data assimilated by the Inter-Sectoral Impact Model Intercomparision Project (ISIMIP) hydrological models are used to evaluate projected soil moisture and potential evaporation over the 21st century. May and October soil moisture is predicted to increase in the future, but trends are weak. In contrast, the potential evaporation is rising and may put stress on the land and water resources. A lengthening of the growing season could benefit crop yields across the NW Ethiopian highlands.
1. Background
The effects of rising temperature and changing precipitation affect ecosystems, biodiversity, and people. In both developed and developing countries, climate impacts are reverberating through the economy, from fluctuating water availability to sea-level rise and extreme weather impacts, to coastal erosion and tourism [1] and to disease and pests. Climate change could translate into reduced agricultural performance in Africa where warming of 1 °C in the 20th century and lengthy droughts in recent decades have undermined progress [2,3,4].
Soil moisture deficits and crop failure undermine livelihoods and need to be offset by local knowledge to enable adaptation [5]. Seasonal precipitation (hereafter ‘P’) can be forecast to maintain crop yields—with parallel efforts in institutional capacity building and resource management [6,7,8], but Ethiopia’s rainfall occurs before ‘maturity’ of the El Nino Southern Oscillation and Indian Ocean Dipole, making long-range forecasts less skillful [9]. Understanding changes in the onset and cessation of the growing season could assist coping strategies, particularly if locally tailored to production risks.
World opinion is rightfully pessimistic on the impacts of climate change, but some places may see less harmful trends that could be translated into opportunities. Our study on the NW Ethiopian highlands crop growing season will address the following questions:
- 1.
- What temporal and spatial hydro-climate change has occurred in the 20th century and is projected for the 21st century?
- 2.
- How will changes in the hydro-climate affect the onset and cessation of the crop growing season?
In NW Ethiopia, the months February–May have high evaporation losses and soil moisture deficit, while the months October–January have cold temperatures. These two factors limit the crop growing season for short-cycle crops [10,11,12,13]. Could future climate extend the length of growing season, thus improving yields from rain-fed agriculture?
2. Concepts and Methods
We first analyze Empirical Orthogonal Functions (EOF) for cenTrends P [14] via covariance matrix and time scores. This delineates a ‘NW Ethiopia highlands’ study area: 8.5–13 N, 35–39.5 E with 1st mode loading pattern covering 73% of variance. We employ statistical techniques to identify the mean annual cycle, measures of association that account for lags between air and land, and linear regression for trends and dispersion [15,16,17,18]. Table 1 summarizes the methods of analysis; acronyms are defined following acknowledgements.
Atmospheric convection initiates a cascading water cycle of runoff and infiltration that is offset by desiccation due to net radiation and turbulent flux. As our focus is on crop growth, we distinguish between transpiration of moisture via latent heat flux (LHF) and moisture lost by soil via potential evaporation (hereafter ‘E’). E can be calculated from station data, measured by A-pan, estimated by satellite, or modeled via sensible heat flux (hereafter ‘SHF’) [19,20]. We compared the annual cycle of SHF with A-pan data and found a r2 = 0.95, while other proxies such as temperature and LHF exhibited weak relationship and were screened out. The resultant water budget over time produces soil moisture residuals that accumulate to sustain crop growth [19].
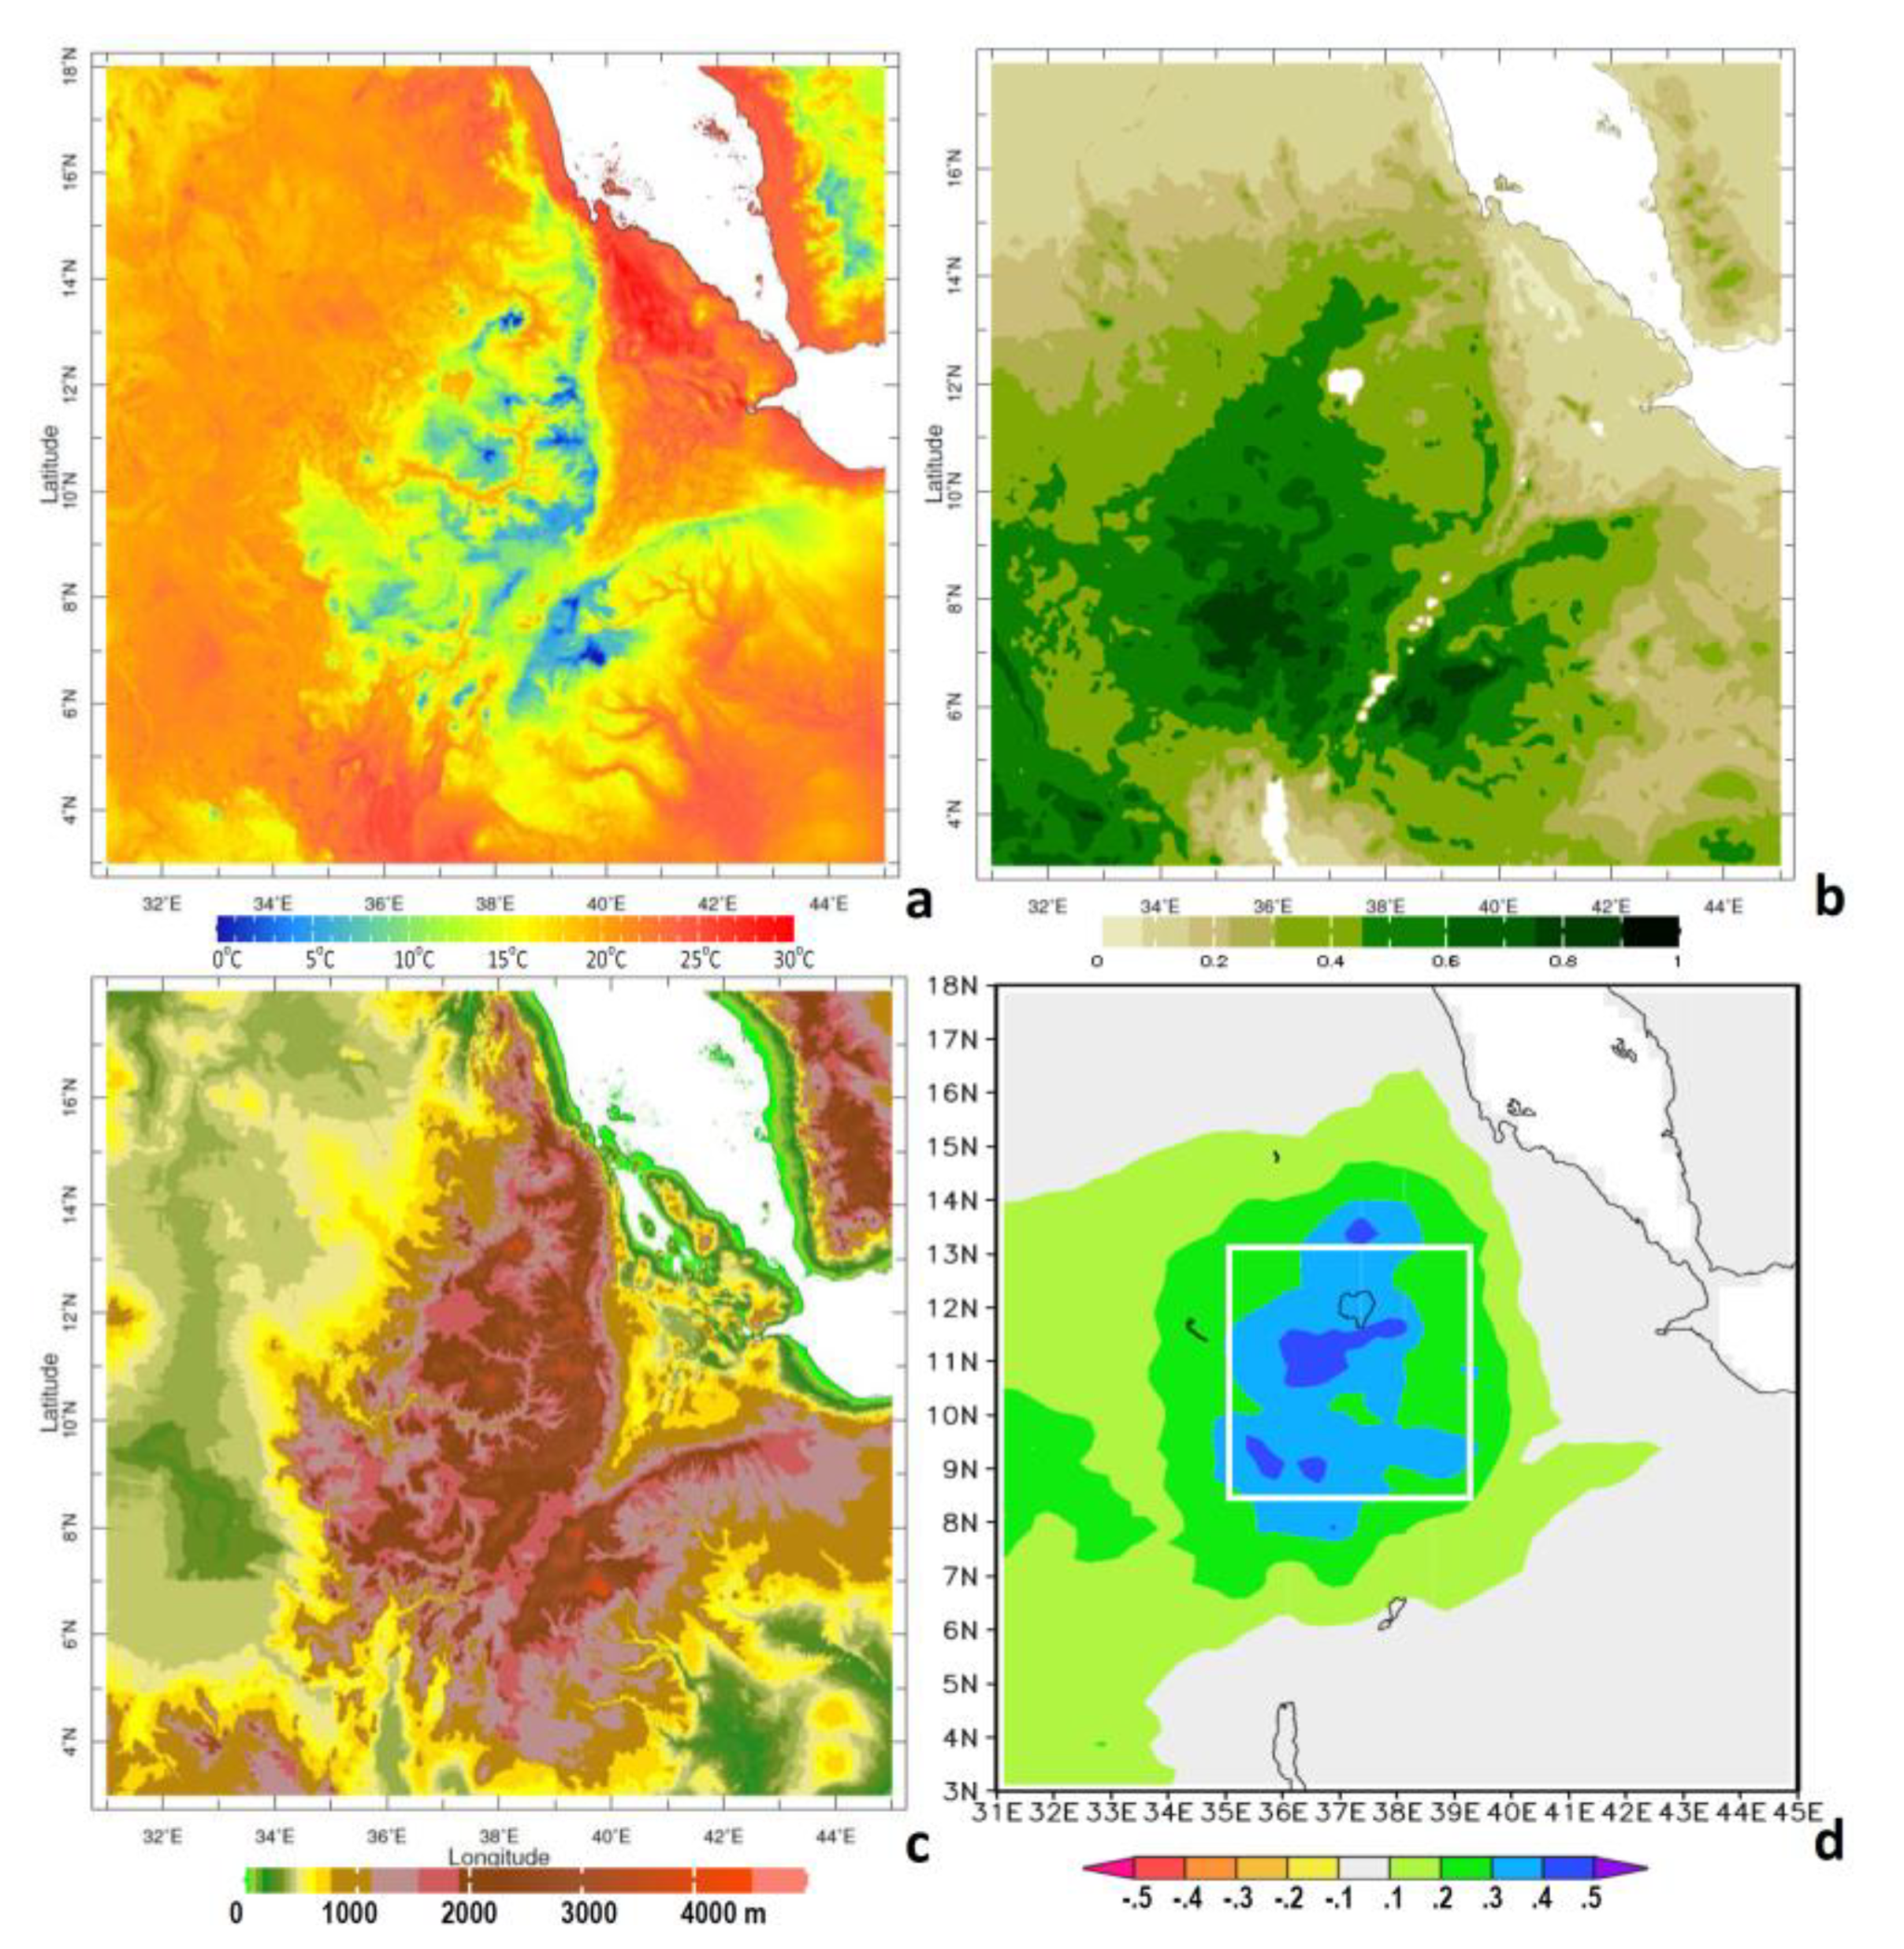
Coupled hydrological models estimate the soil moisture fraction in the upper meter (hereafter ‘S’) via theassimilation of in situ and satellite measurements. These include passive and active microwave radiance and gravity anomalies [21,22], and vegetation color fraction (NDVI). The NDVI represents photosynthetic activity and is used to constrain reanalysis LHF and monitor crop condition [23,24,25,26,27,28,29,30,31,32]. The majority of Ethiopia’s highlands have an NDVI vegetation fraction > 0.4 (Figure 1) and a mean annual cycle close to soil moisture.
Reanalysis data from NCEP2, ECMWF, and FLDAS (cf. acronym table after Section 4) form an integral part of our study on the evolving atmospheric boundary layer and hydrology [33,34,35,36] over the NW Ethiopia highlands [37,38]. We compared multi-station averages with reanalyses and found statistically significant correlations; yet the main reason for parameter choices was due to their availability in the most recent version, underpinned by satellite technology and sophisticated data assimilation. We calculate mean annual cycle percentiles for daily Chirps P [39] and ECMWF LHF and E. To understand seasonal shifts, we use the gauge-interpolated cenTrends P from 1900 to 2018 and calculate percentage contributions in April–May (early), July–August (narrow), October–November (late), and early + late (wide). Then, we rank those percentages in recent decades (Table 2) and form composite difference fields using NCEP2 reanalysis wind and humidity, and NOAA satellite net outgoing long-wave radiation (OLR), to determine the regional forcing of convection.
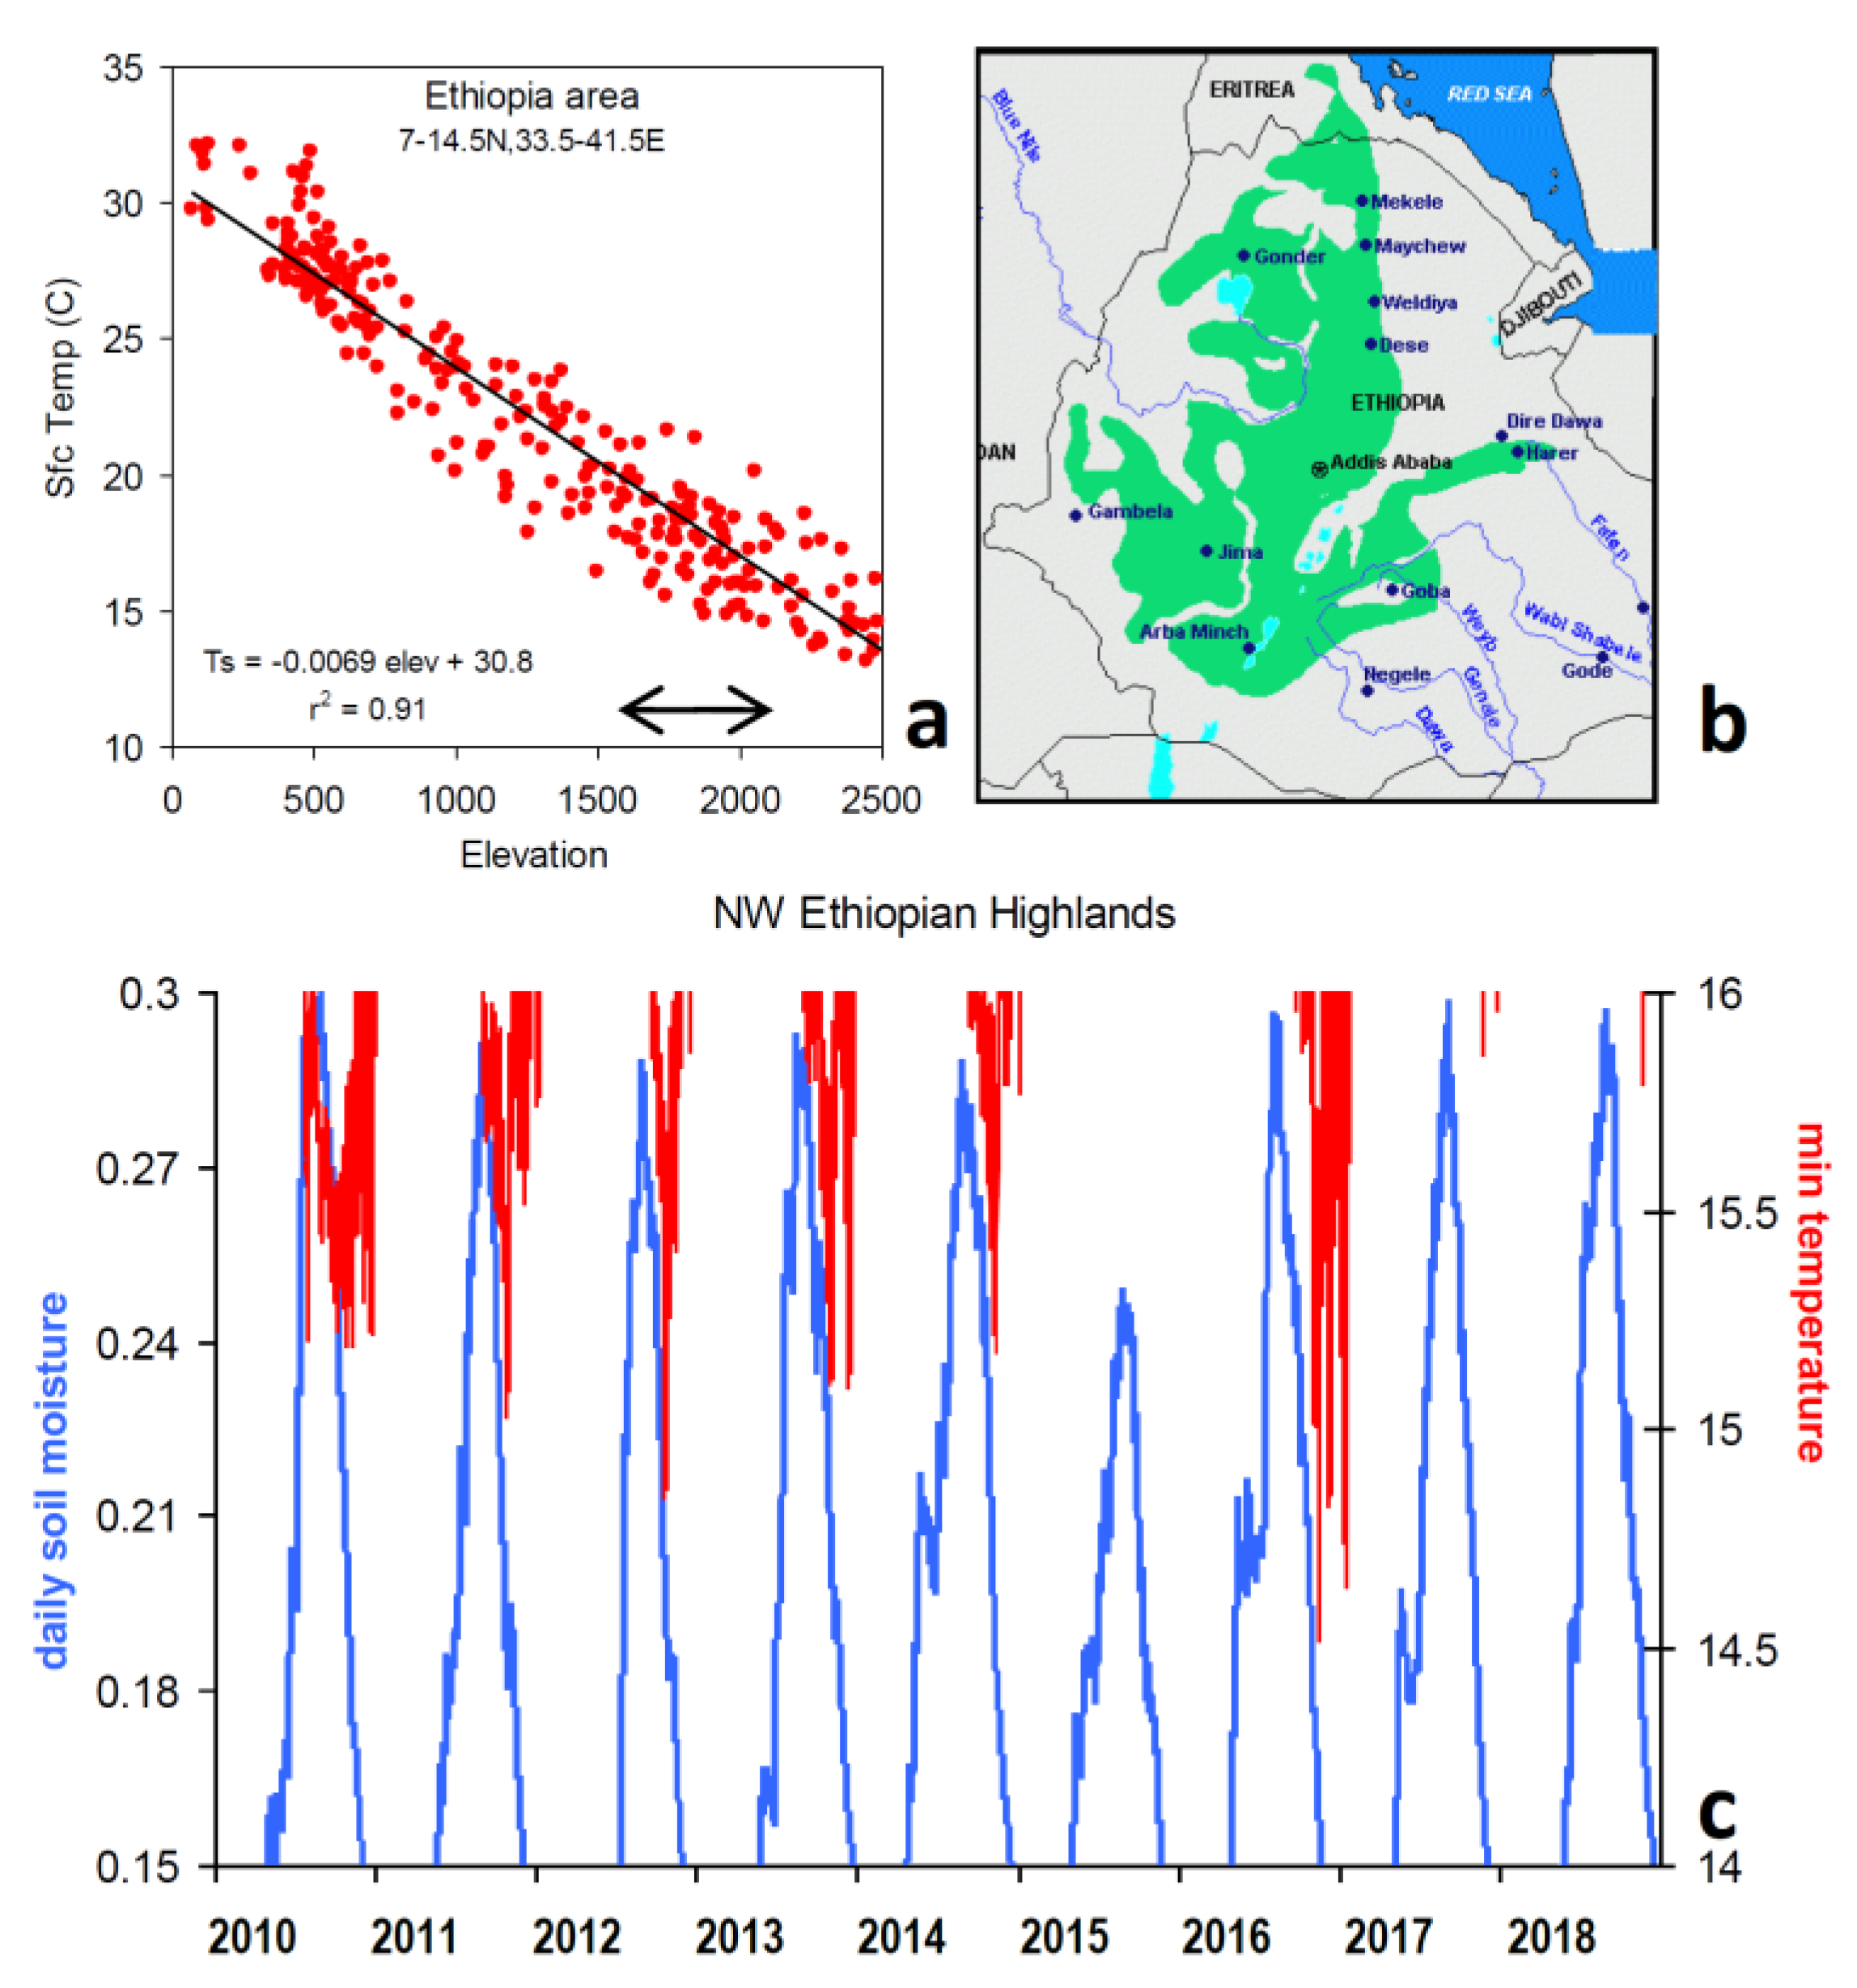
Many of the climate factors that govern our ability to extract resources are seasonal, and thus, we seek ways to determine the annual onset and cessation of crop growing. Most short-cycle crops (e.g., teff) require a length of growing period (LGP) > 100 days [40,41,42,43,44,45]. At higher elevations in the tropics, the temperature (hereafter ‘T’) may drop below thresholds (16 °C) that support crop growth, even if soil moisture is available [46]. Figure 1a illustrates cool nocturnal T over the highlands; crop growth tends to slow in October. Crop models use S that depend on cumulative P minus E, conditioned by T and infiltration rates [47,48,49]. Crop growth is predicted when P accumulates > ½ E, or when S reaches a critical value. Here, we define LGP as the time when area-average S > 15% with T > 16 °C (see Appendix A Figure A2c).
To quantify climate change, we first compare the mean annual cycle of reference P and SHF with all available CMIP5 models (Appendix A Table A1 and Table A2) [50,51,52]. We determined the Hadley2 model [53] as optimal and analyze E and S via ISIMIP ‘glowb’ and ‘watergap’ hydrology [54]. Using continuous bias-corrected Hadley2-ISIMIP (Inter-Sectoral Impact Model Intercomparision Project) projected time series with rcp6 scenario [55], we calculate the linear trends and signal-to-noise ratio [56] via the r2 value and analyze annual cycle differences in past (1900–2000) and future eras (2001–2100). Although much of the analysis uses monthly data, the LGP is detected from daily data.
3. Results
3.1. Historical Trends
The background information reviewed earlier (Figure 1a–d) identified the complex topography of the NW Ethiopian highlands, and climatic responses in T and vegetation that point to orographic rainfall. Most crop production (cf. Appendix A Figure A2b) occurs in the eastern side of our index area, e.g., along 38E, where the NDVI fraction is approximately 0.4. Annual cycle terciles from daily P–E are considered (Figure 2a) based on the area averages of 1980–2018. Surplus conditions begin on day 123-154-190 and end on 285-266-243 (wet-mean-dry). Hence, the season of surplus is 112 days with a tercile range of 162–53. The P–E curve is relatively symmetrical with a crest at the end of July. Upper tercile flood spikes > 10 mm/day extend two months (July–August) and contribute millions of cubic meters to the Blue Nile catchment. The P–E > 0 in dry years is too short for crop production, and the upper–lower spread exceeds 5 mm/day from May through August. Thus, the beginning of the planting cycle is a stressful time for soil moisture and farming practice.
The ECMWF LHF is a useful proxy for vegetation fraction, which satellite NDVI cannot provide at daily intervals due to cloud cover. Its annual cycle terciles in the NW Ethiopian highlands (Figure 2b) exhibit a gradual rise to a plateau in September (approximately day 260), followed by a rapid decline at the end of the year. This asymmetry is quite different than rainfall. Of particular interest is the wide spread between upper and lower terciles in April–May (approximately days 100–130), and limited spread in early July (approximately day 180) and after the peak. Years with low LHF correspond with low NDVI and poor crop yields, and vice versa.
The annual cycle of P–E, LHF, and NDVI guide crop management, but only P has long-term records for analysis of past trends. In Figure 2c, the percentage contribution of sub-seasonal rainfall over the 20th century is calculated. Mean values are: 13% early (April–May), 47% mid (July–August), 7% late (October–November). Linear trends in each sub-season demonstrate that ‘late’ is becoming prevalent +0.021% yr−1, followed by ‘wide’ +0.018% yr−1 (e.g., early + late), which reduces ‘narrow’ to0.015% yr−1, leaving ‘early’ unchanged + 0.003% yr−1. Thus, we see more wet spells at the end of season and ask: what underlies this tendency?
3.2. Composite Analysis
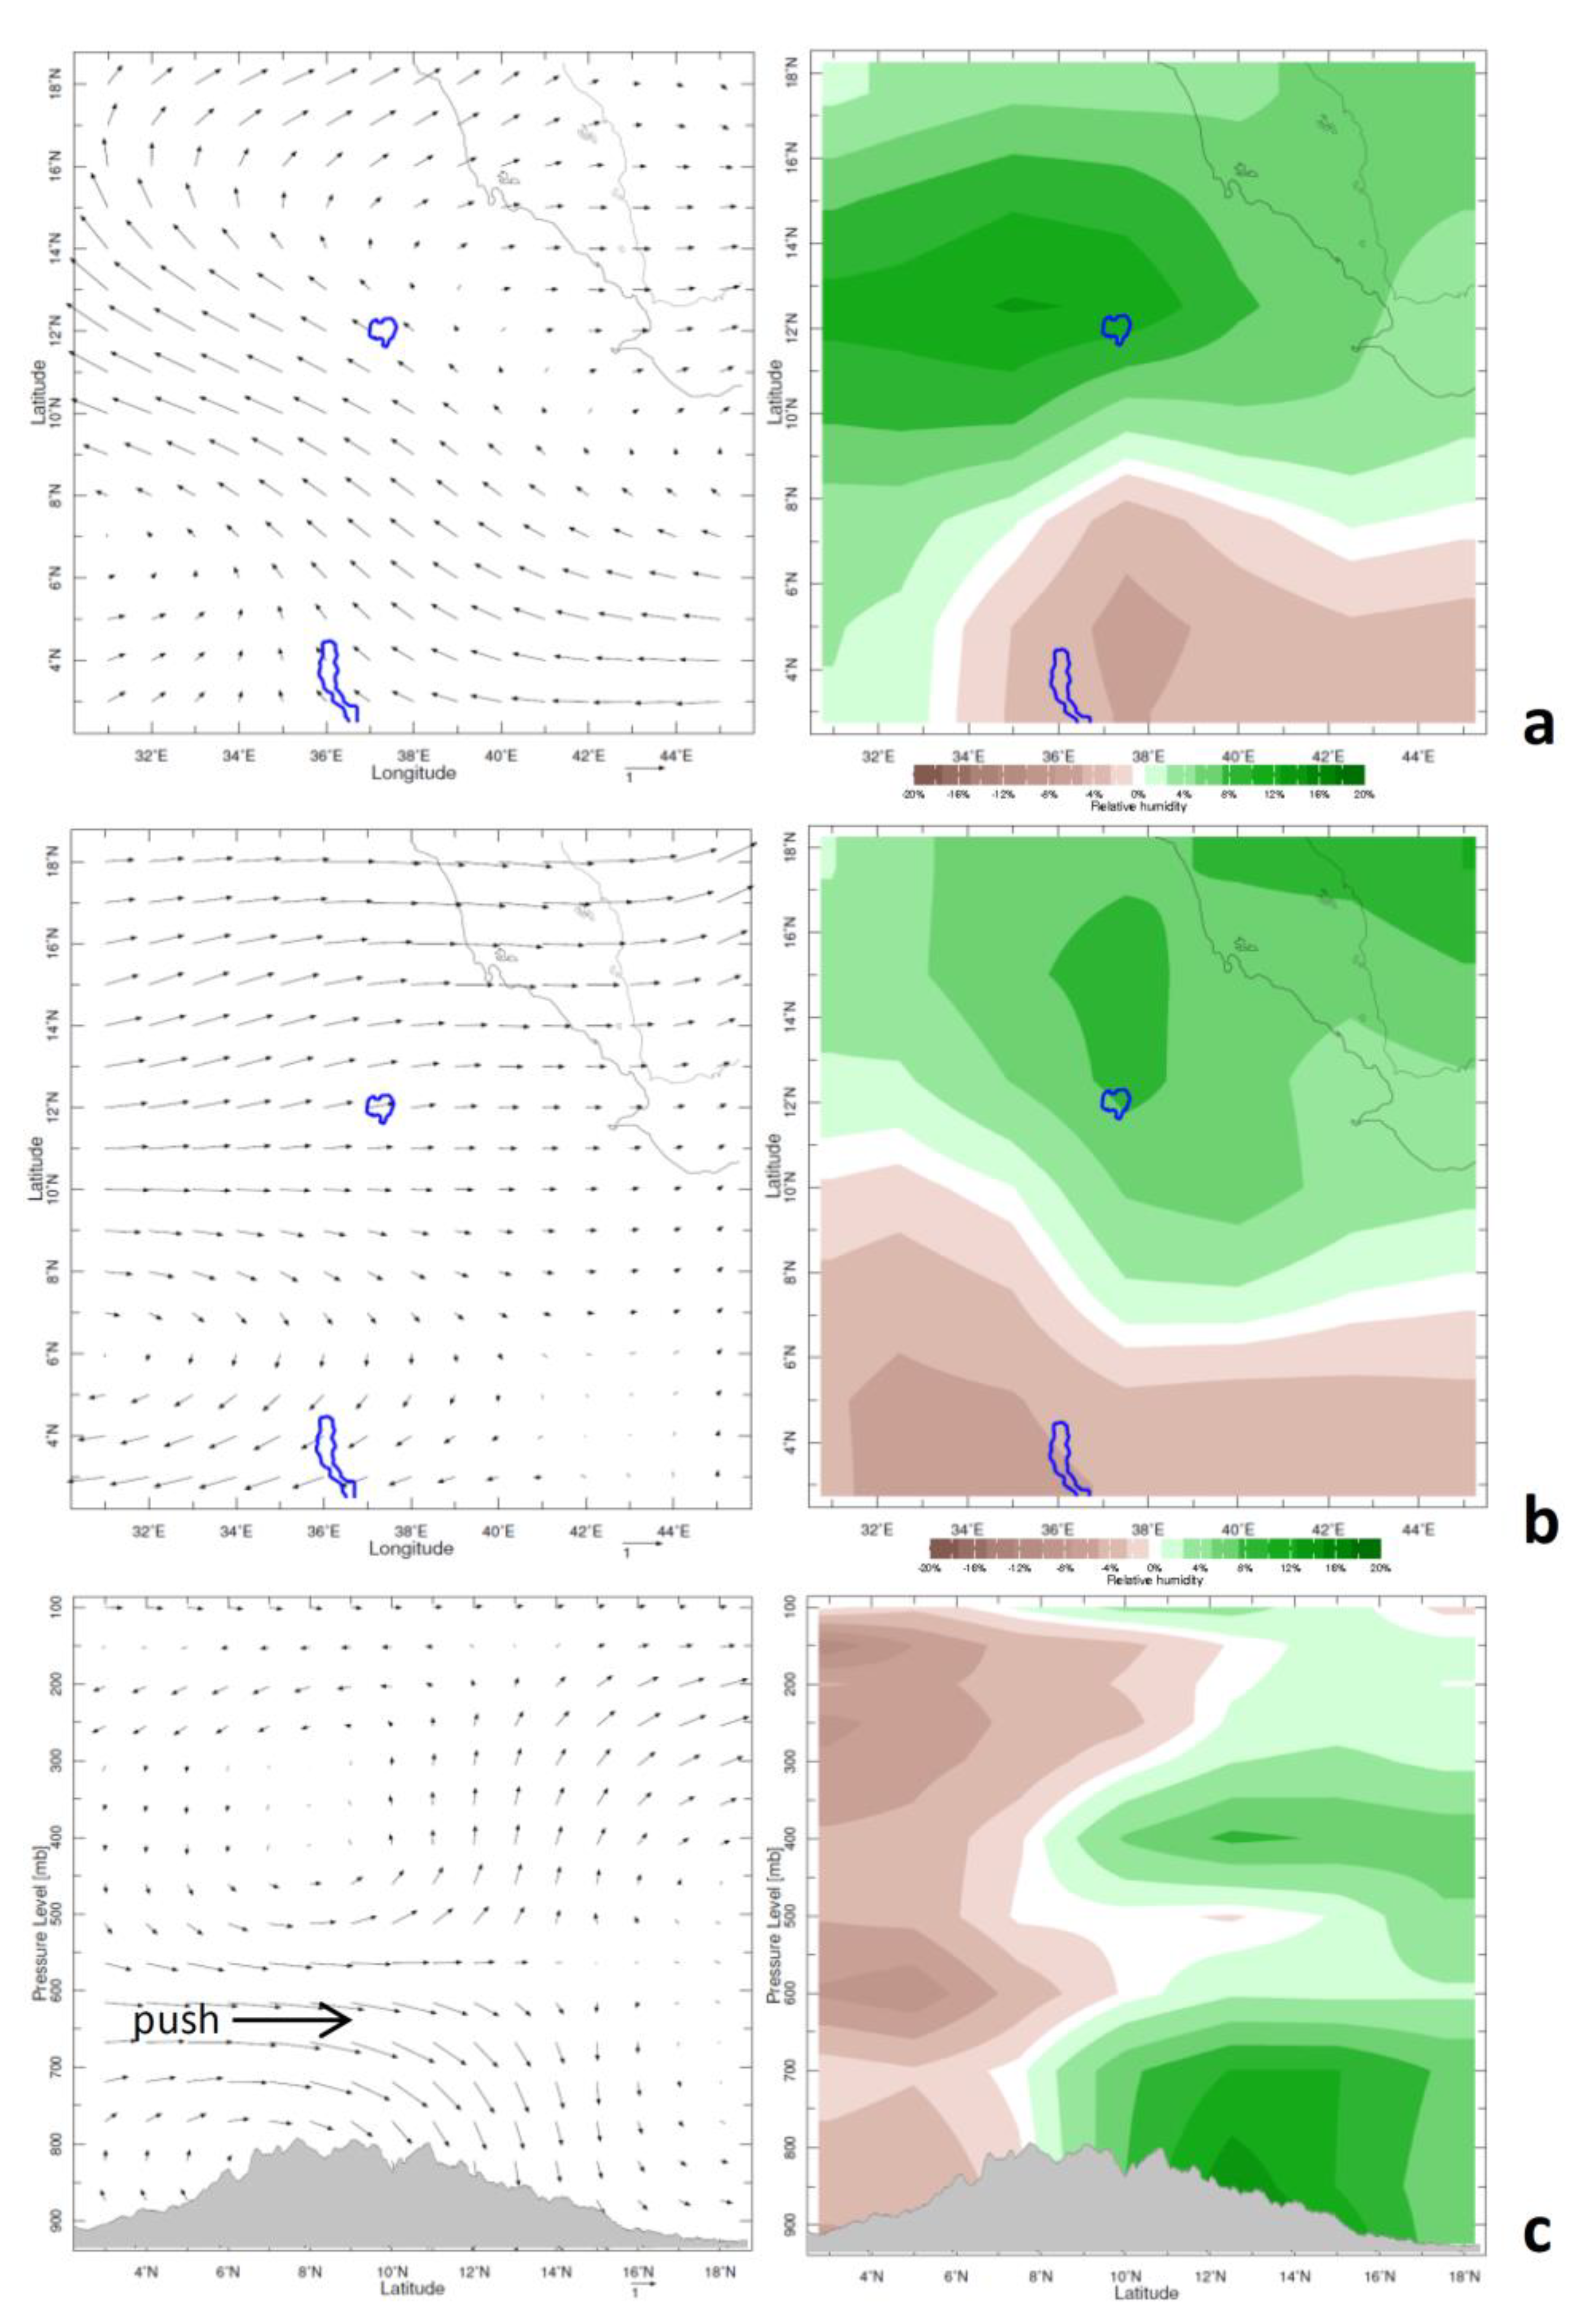
To understand the meteorology behind the seasonal changes, we conduct a composite difference analysis (Figure 3a–c) after ranking of ‘early’, ‘late’, and ‘narrow’ and subtracting the five least from the five most. The early composite illustrates that SE wind anomalies from the Turkana Valley push moisture northwestward from Kenya, creating a local humidity dipole. In contrast, the late composite features W wind anomalies from southern Sudan that push moisture northeastward. Again, there is a local humidity dipole corresponding with the source sink. For the narrow composite, we analyze a vertical section and find an S wind anomaly in the 700–600 hPa layer with dry conditions in low latitudes (Kenya). Moisture differences are positive over northern Ethiopia and in the layer 400 hPa. Thus, equatorial convection is ‘pushed’ northward to the Blue Nile catchment. Yet, [57] find little coherent response of the equatorial trough to global warming.
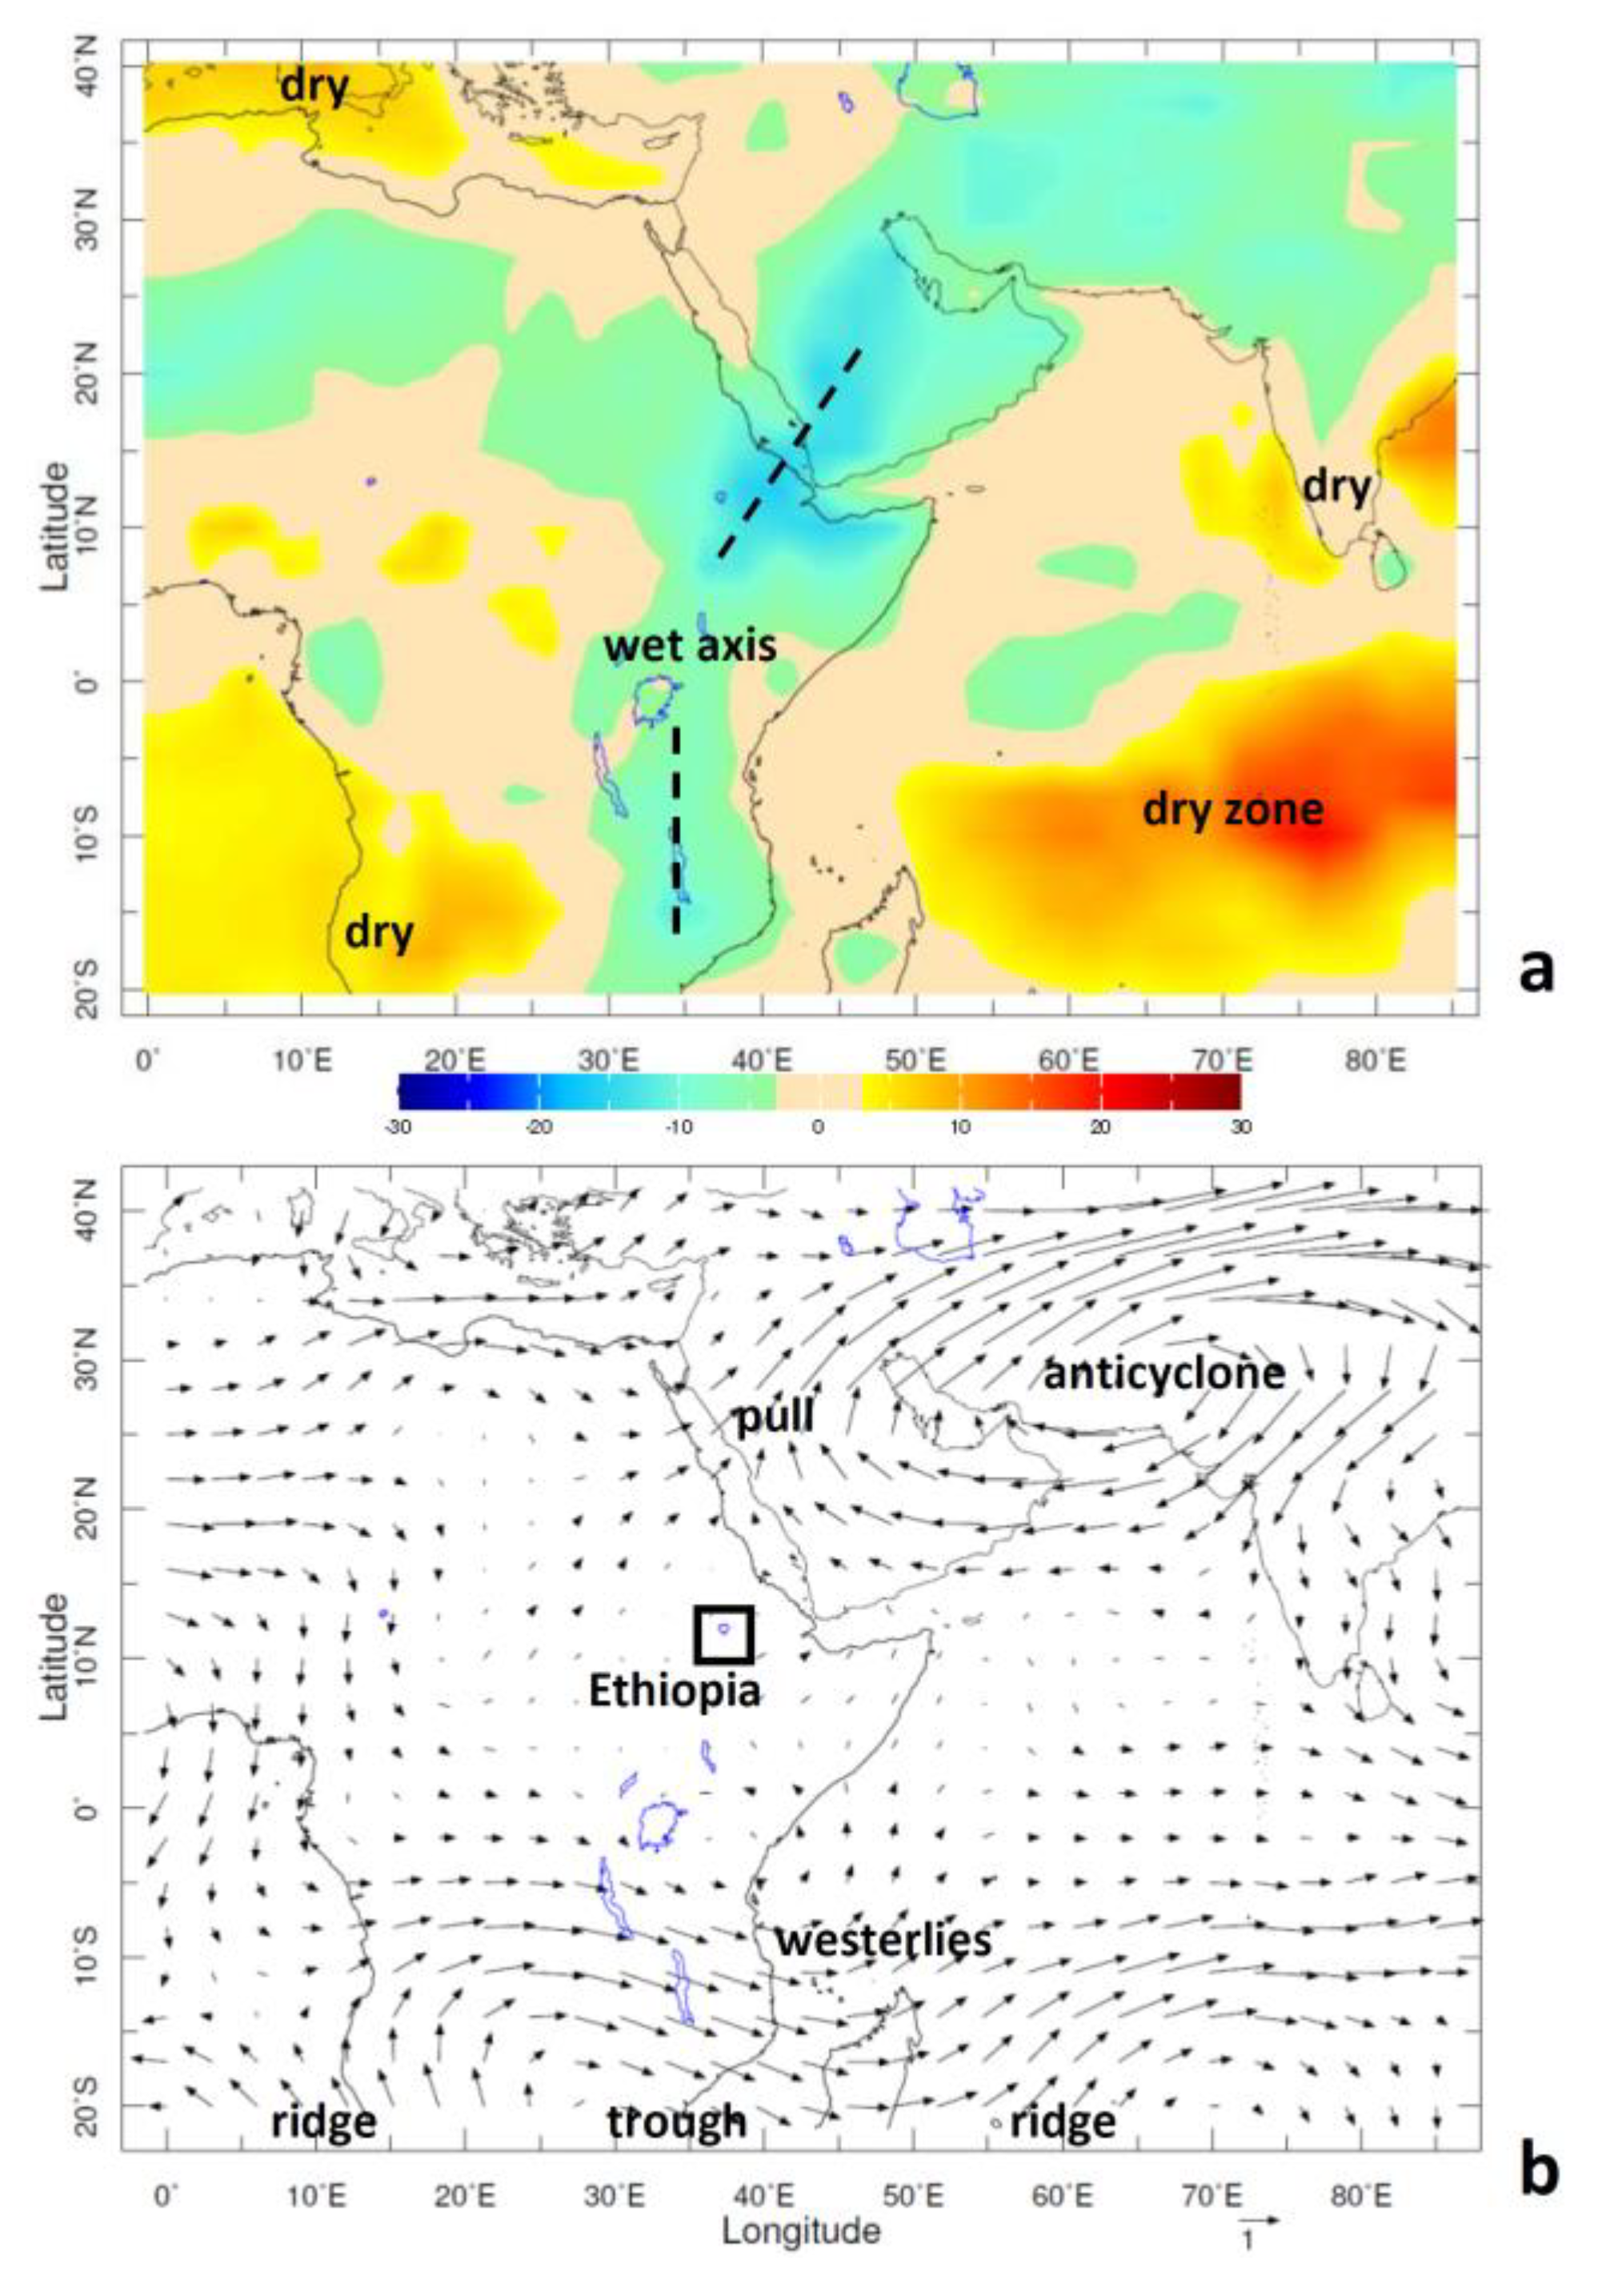
The ‘wide’ composite differences have mid-latitude influence that require analysis at a larger space scale. Later, we show that CMIP5 hydrological projections support the ‘wide’ scenario, so here, we establish the underlying process. Figure 4a illustrates that convective differences (−netOLR) over Ethiopia extend southward over the African Rift Valley (35E) and northeastward over the Arabian Peninsula. There are dry zones over the south Indian Ocean [58], Kalahari, and the Mediterraean (+netOLR). Tropospheric wind differences (Figure 4b) are almost absent in the tropics, but there is westerly flow in the southern sub-tropics and a deep anticyclone over southern Asia. The westerly flow along 15S has ridge 10E/trough 35E/ridge 60E features that indicate how anomalies in the sub-tropics lengthen the crop growing season over the NW Ethopian highlands.
3.3. Annual Cycle
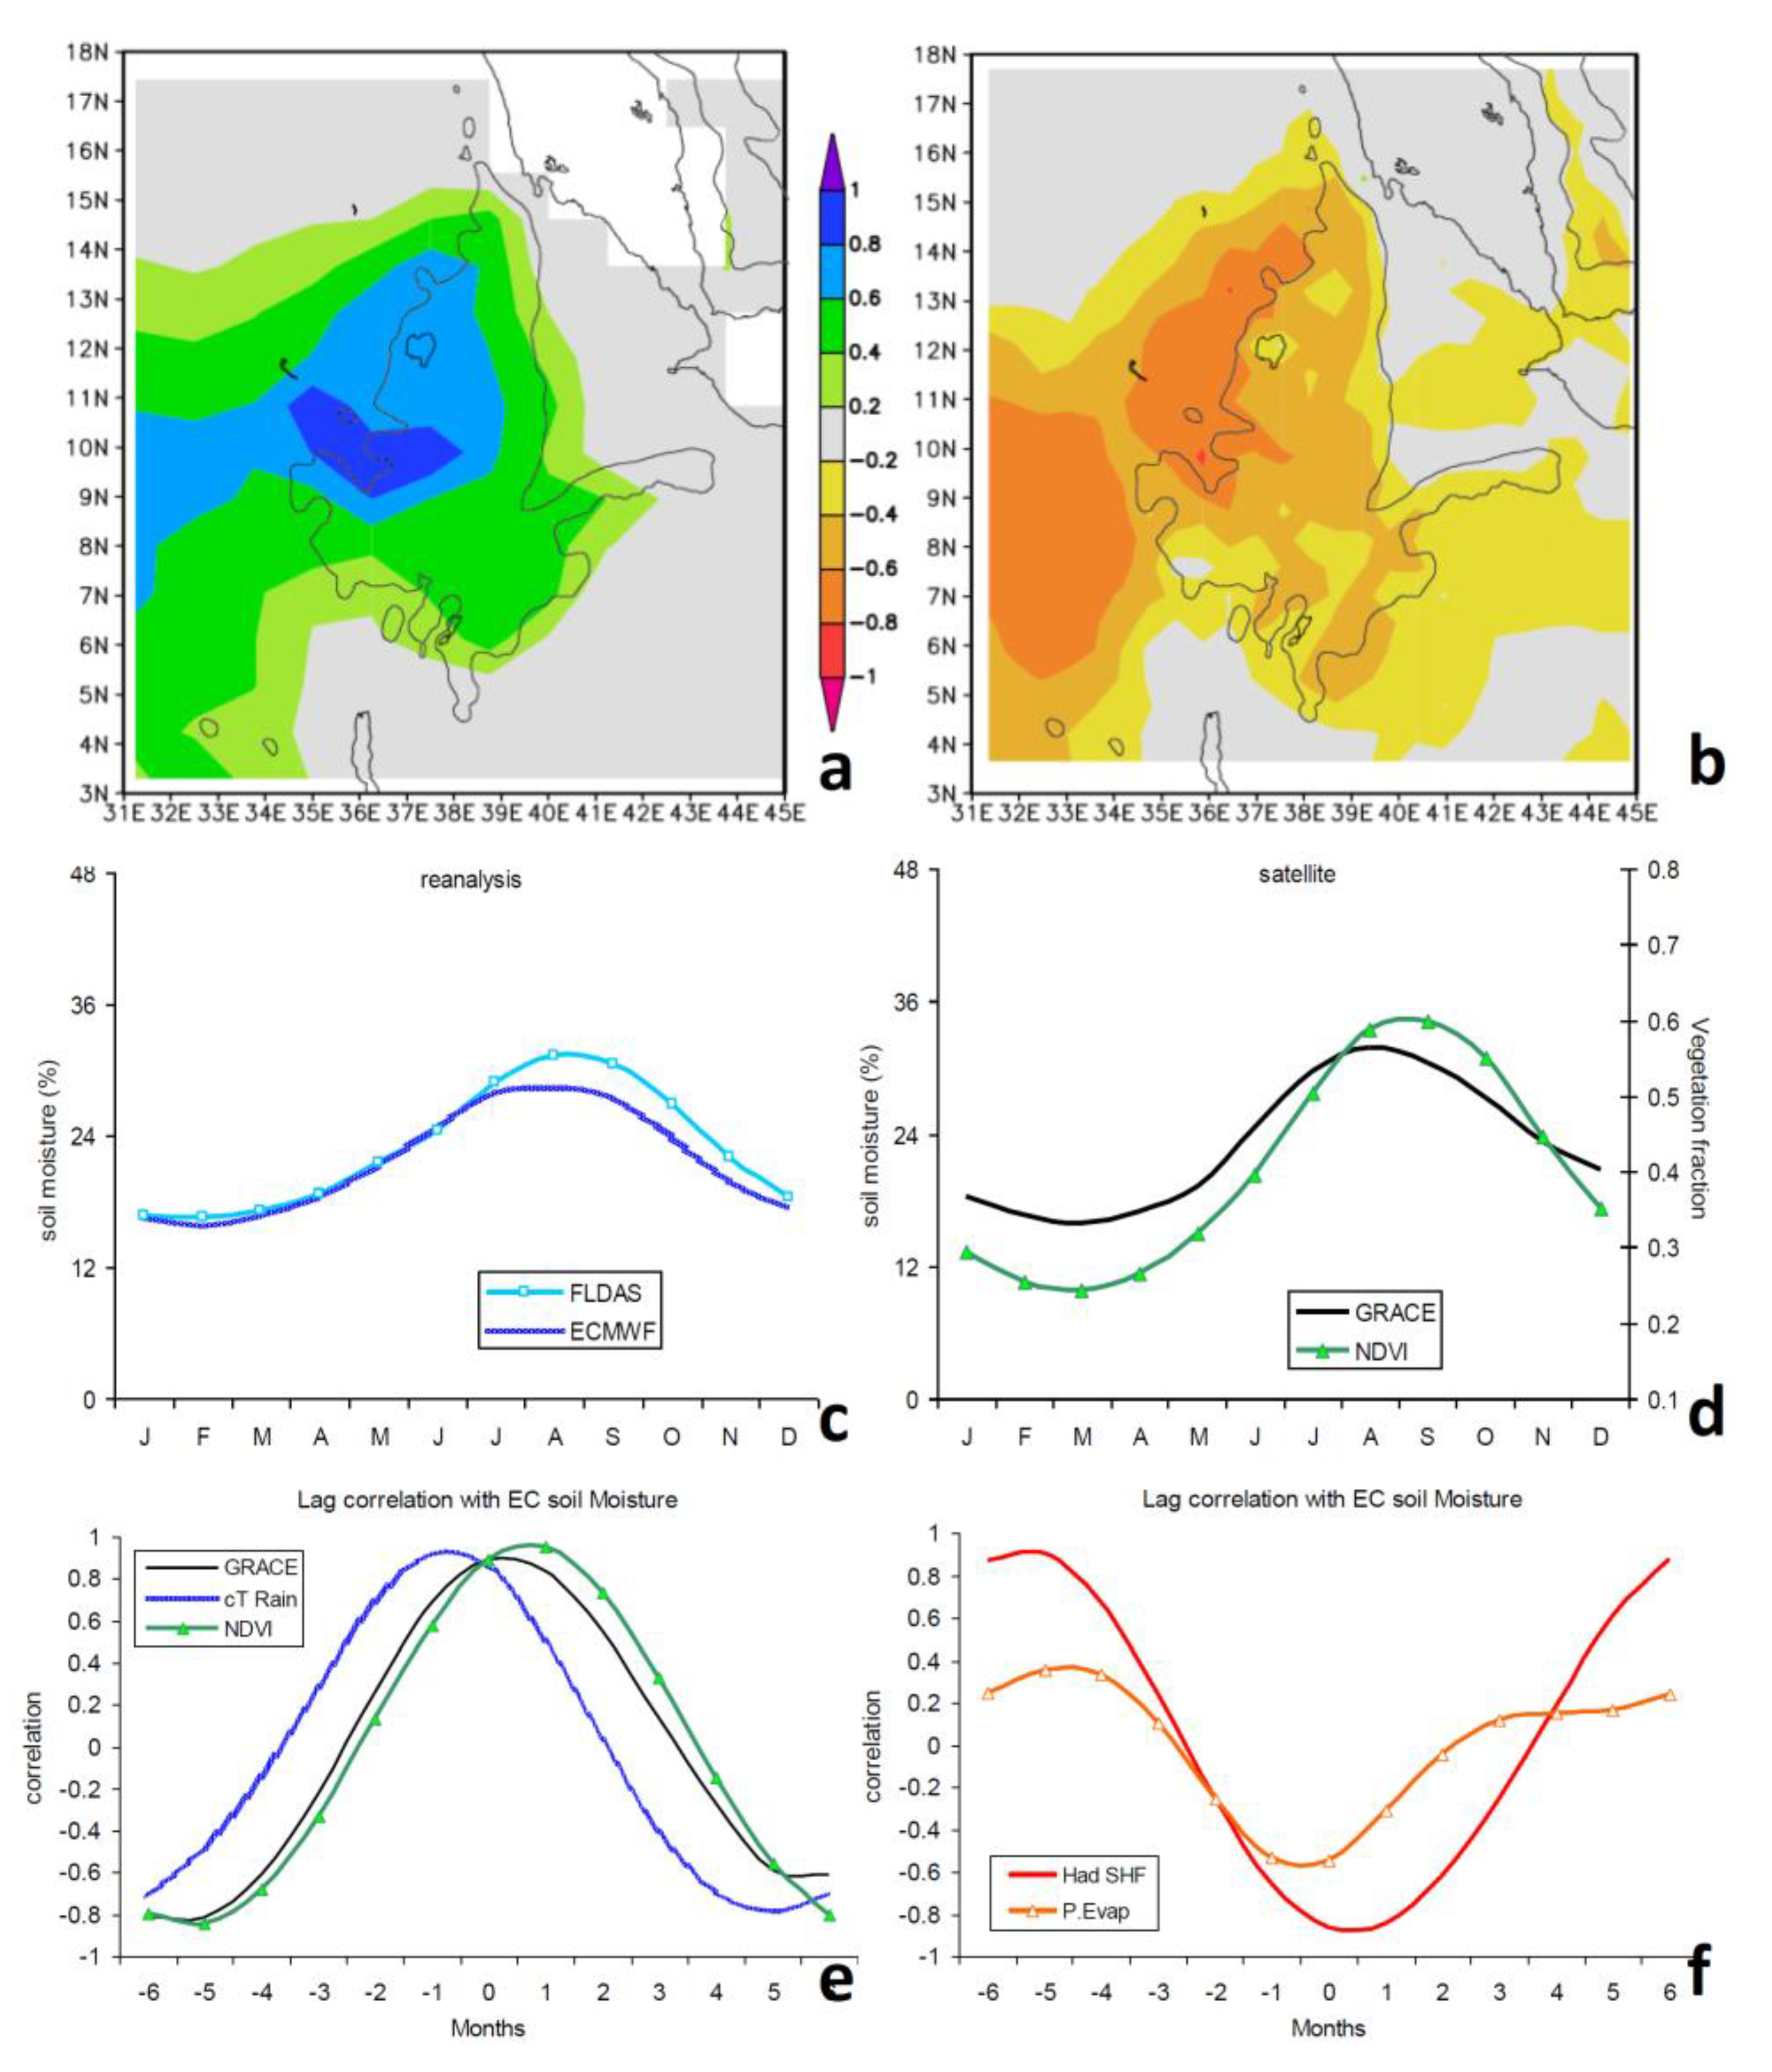
We consider the 1st EOF loading patterns for S and E in Figure 5a,b. There is a center of action over the NW Ethiopian highlands and a sympathetic zone over the White Nile Valley approximately 9N, 33E which identify a unimodal climate. The annual cycle of E reaches an apex in February–April. The mean annual cycle of reanalysis and satellite soil moisture and NDVI in Figure 5c,d reveal that the ECMWF is slightly below FLDAS, which tends to peak later (Sep 31%). The GRACE satellite exhibits dry (March 16%) to wet (August 32%) changes that are relatively sinusoidal. Lag correlations with respect to continuous monthly ECMWF soil moisture (Figure 5e,f) show that P leads by one month and vegetation lags by one month, as expected. Thus, grazing pastures and crops reach peak conditions in September–October. The lag correlation of E is markedly negative and symmetric about zero. The Hadley2 model SHF relates negatively to S in a manner consistent with the reanalysis of E. These serve as references for model projections.
3.4. Hadley2 Projections
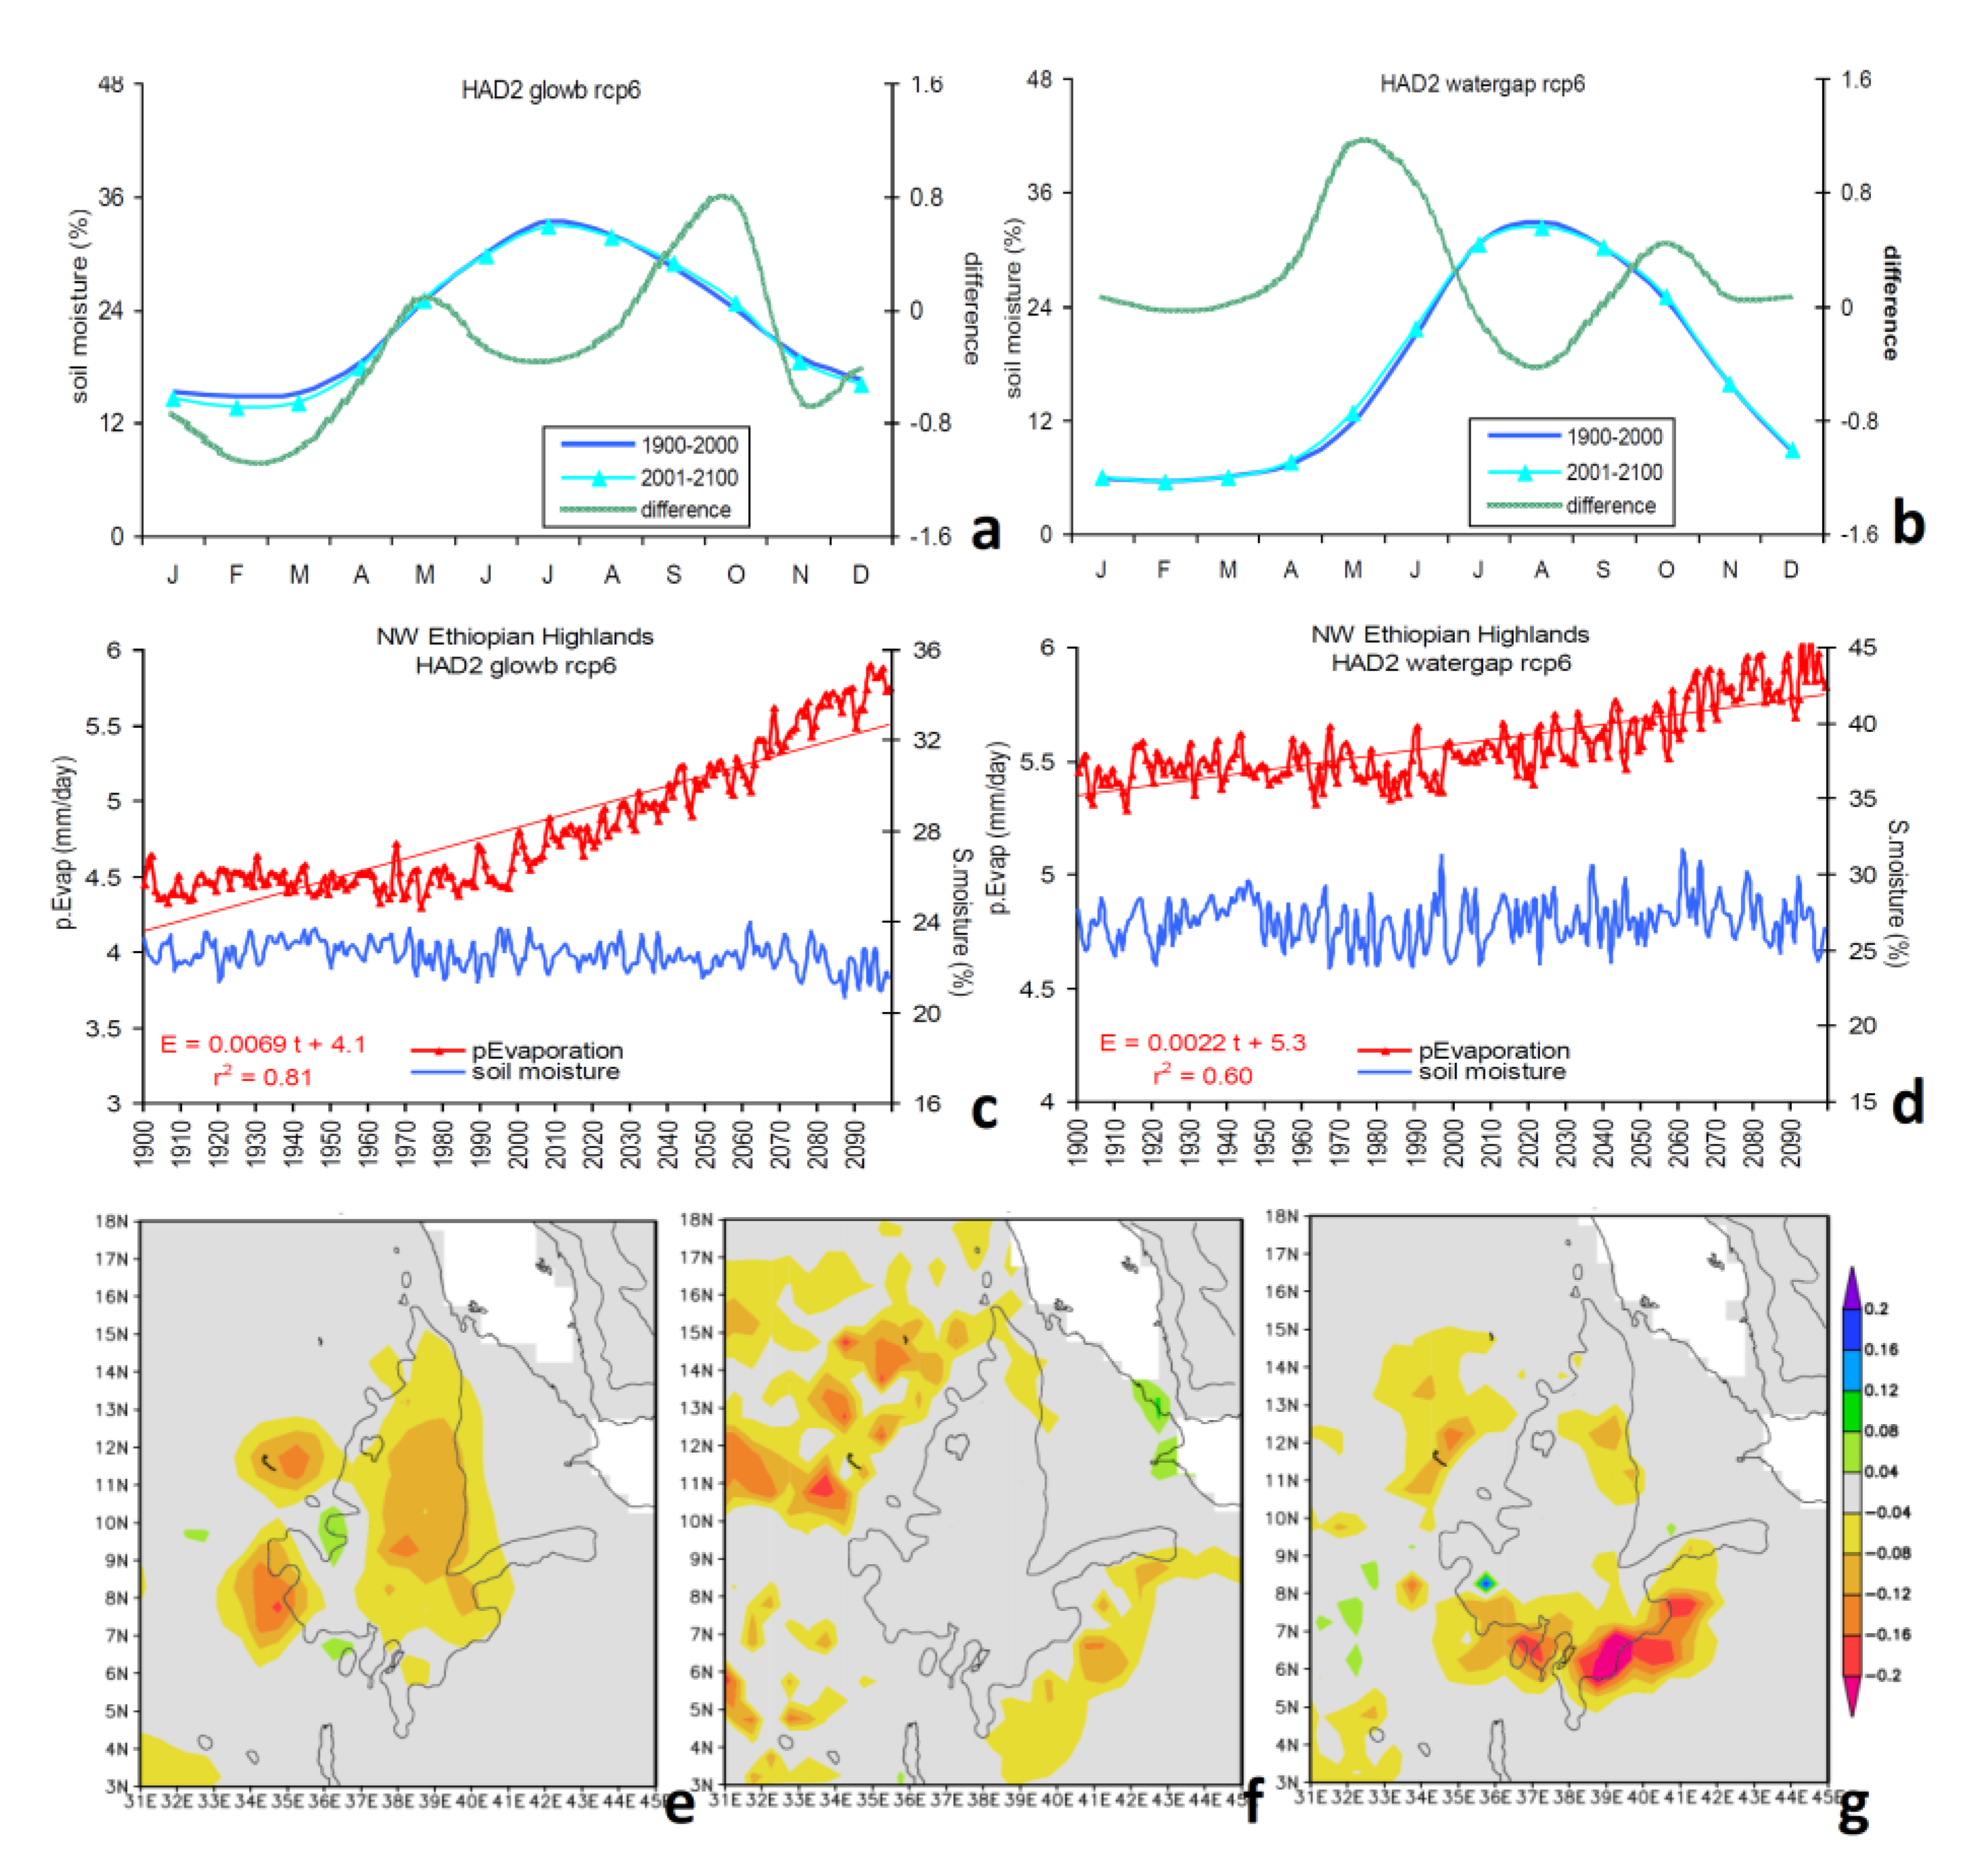
The Hadley2-rcp6 ISIMIP mean annual cycle of soil moisture is given Figure 6a,b. The seasonal range is lower in glowb than watergap: 13% in February–March to 33% in August–September. Both simulations over-deplete S from November–March, but infiltration is near observed from May–August. Changes from the past (1900–2000) to the future (2001–2100) are generally < 1% and retain a unimodal structure consistent with other work [59,60,61,62,63]. There is a seasonal widening of S projected in the future, during May in watergap (1.1%) and during October in glowb (0.7%).
The long-term trend of the Hadley2-rcp6 ISIMIP annual S is slightly downward, with greater multi-year fluctuation in watergap than glowb (Figure 6c,d). Drought conditions may increase slightly during the 21st century. Projected E has a desiccating trend (+0.0022 to +0.0069 mm day−1/yr) and significant signal-to-noise ratio r2 = 0.60–0.81. Trends in E are initially flat and only become steep in the 21st century, suggesting dependence on the scenario employed. Mapping the past trends (Figure 6e–g), we find that the ECMWF soil moisture is slightly downward over the 20th century around the edges of the Blue Nile catchment < −0.1% yr−1. Both projections show little future trend over the highlands, but the surrounding lowlands become desiccated. While minor adjustments may be needed in agricultural practice and water management to cope with fluctuating soil moisture, greater evaporation will stress the land and reservoirs.
3.5. LGP Outcome
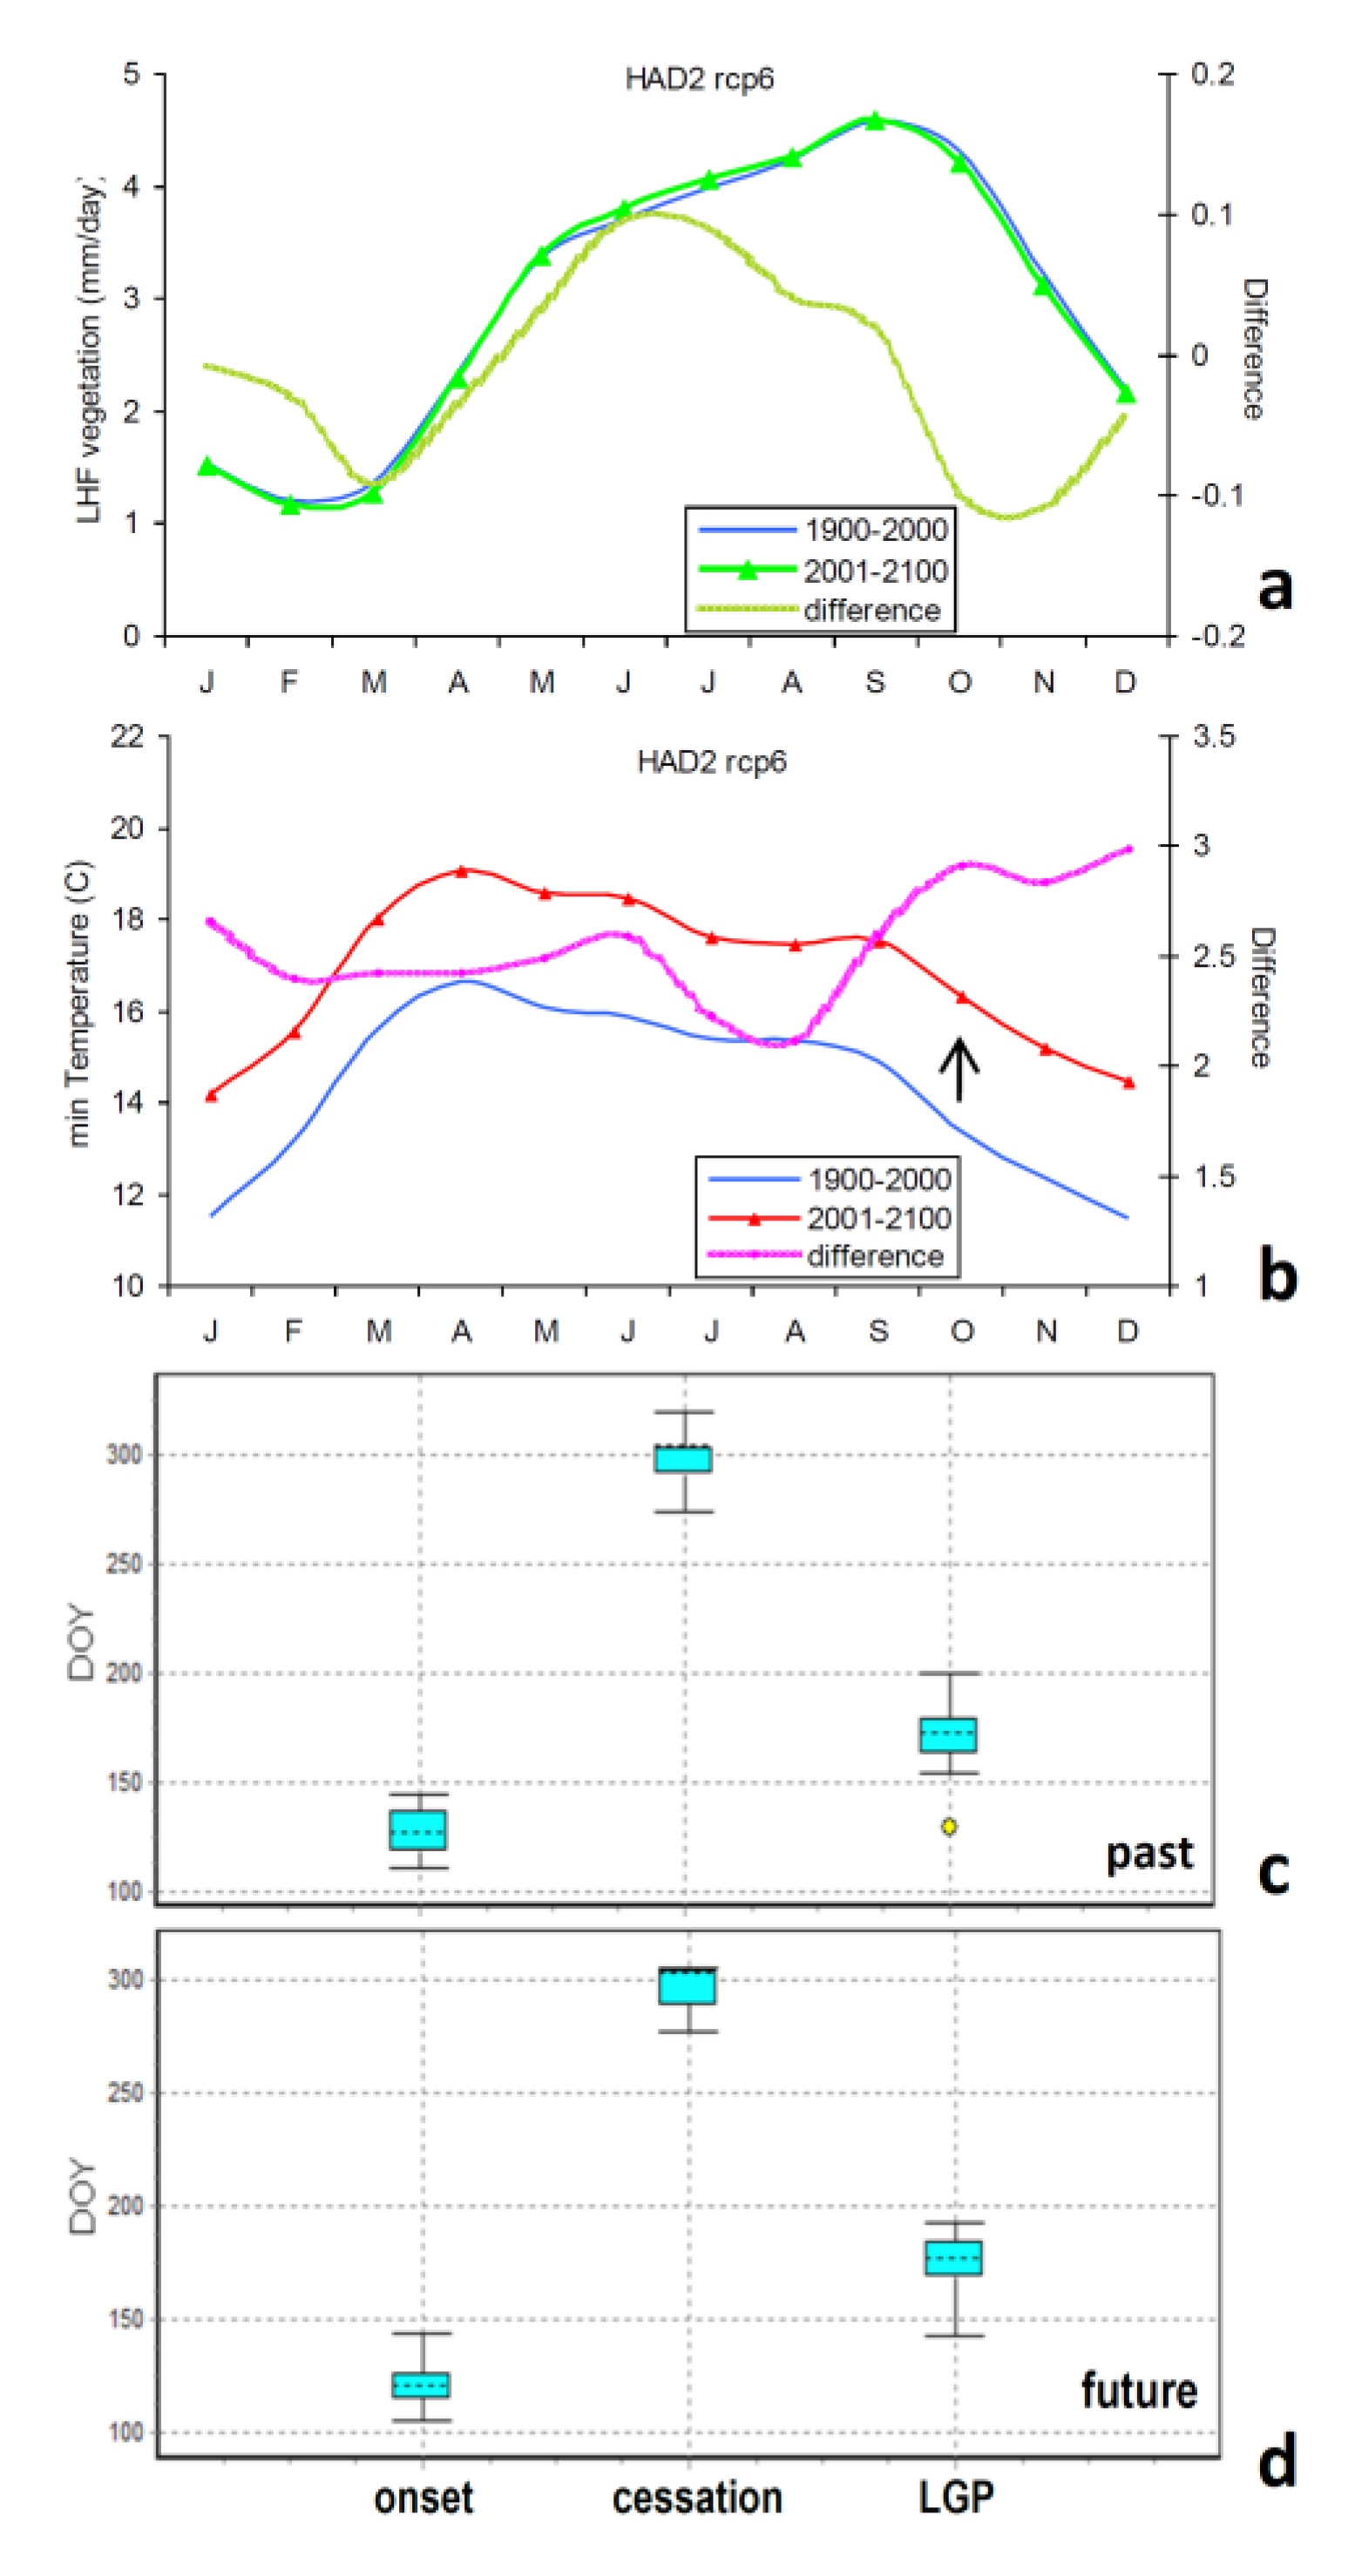
The LHF annual cycle from Hadley2 rcp6 projection (Figure 7a) has an asymmetrical shape close to NDVI and ECMWF (cf. Figure 2c or Figure 5d). It rises gradually in May–August and reaches a peak in September–October, when crops are harvested. Differences in the future are positive for June–July and otherwise slightly negative. Long-term LHF trends have a small signal-to-noise ratio of approximately 2%. In contrast, we find a considerable increase of minimum T (>2 °C) from the 20th to the 21st century in the Hadley2 rcp6 projection, which is evenly distributed across the annual cycle (Figure 7b). The cool temperatures of October will gradually recede, leaving soil moisture depletion to end the farming season.
Comparing past and future LGP (Figure 7c,d), we determined that the median onset was earlier: day 140 to 138 (trend −0.026 day/yr), cessation was later: day 315 to 317 (+0.035 day/yr), and duration lengthened 175 to 179 days (trend +0.023 day/yr) and exhibited a median range 168–185 days. Appendix A Figure A2c is an example of LGP constraints imposed by daily S and T over the past decade. Variations in duration S > 15% and peak S are evident; in some years, T causes early cessation.
With a longer growing season and adequate minimum temperatures, crop production could shift from temperate to sub-tropical varieties. Alternatively, farming efforts could move gradually upslope to preserve current conditions (−0.7 °C/100 m elevation, Appendix A Figure A2a,b). In any case, the LGP will exceed the 120 days needed for short-cycle crops.
4. Discussion and Conclusions
We have compared hydro-climate change in the 20th century and projections in the 21st century [64], particularly with regard to the seasonal onset and cessation of conditions favoring crop phenology in the NW Ethiopian highlands. Statistical methods were applied to gauge-interpolated, reanalysis, and satellite data to detect the LGP annual cycle. We are motivated to offset climate impacts with more knowledge on cropping cycles that lead to adaptation strategies. Trends in sub-seasonal rainfall over the 20th century show a ‘late’ season rise +0.021%yr−1, meaning that conditions favoring crop growth will extend into October. Lag correlations with soil moisture show that P leads by one month and vegetation lags by one month, and that SHF and LHF are valuable proxies via ECMWF reanalysis and Hadley2 model simulation.
To understand the meteorology behind the seasonal changes, we conducted a composite difference analysis. The ‘late’ composite featured W wind anomalies from southern Sudan that push moisture northeastward from the White Nile to the Blue Nile catchment. Sub-tropical troughs to the north and south that create a meridional axis of convection (–netOLR) that lengthens the crop growing season over the NW Ethopian highlands.
CMIP5 bias-corrected Hadley2 data assimilated by ISIMIP hydrological models gave insights on the unimodal annual cycle of soil moisture in past and future eras. The annual cycle amplitude for S saw a low-point of 13% in February–March and a high point of 33% in August–September. Both hydrology simulations over-deplete S from November–March, but fractional increases in May–August were near observed. The future ‘widening’ of S was 1.1% during May in watergap and 0.7% during October in glowb.
Projections of both E and S show little future trend over the highlands, but the surrounding lowlands become desiccated. While only minor adjustments are needed in agricultural practice and water management to cope with fluctuating soil moisture, more effort is essential to control stresses from evaporation.
A longer growing season is likely given the rising minimum temperatures in October. Crop production could shift from temperate to sub-tropical varieties, or farming efforts could move gradually upslope to preserve current conditions. Our results show that the LGP will increase from 175–179 days, which is more than adequate for short-cycle crops. Farming efforts could utilize earlier planting and later harvesting with future LGP suitable for longer-cycle crops or double cropping, and they could also employ seasonal forecasts to reduce the risks of climate variability. In a doubled CO2 future, the number of frost days will decline to zero, meaning that pests and disease may disturb food production.
Author Contributions
This paper is based on the PhD of the first author G.B.T., and was re-analyzed and re-written by the second author M.R.J., who supervised the original thesis. All authors have read and agreed to the published version of the manuscript.
Funding
This research received no external funding.
Acknowledgments
This work is an extension of a PhD thesis by the first author. The second author recognizes ongoing support from the SA Department of Education.
Conflicts of Interest
The authors declare no conflict of interest.
Glossary
| cenTrends | centennial trends (precipitation) |
| Chirps2 | satellite-gauge blended rainfall product |
| CMIP5 | coupled model intercomparison project v5 |
| E | potential evaporation (p.Evap) |
| ECMWF | European community medium-range weather forecasts |
| EOF | Empirical Orthogonal Function |
| FLDAS | FEWS land data assimilation system |
| glowb | hydrological model (ISIMIP) |
| GRACE | gravity recovery climate experiment (satellite soil moisture) |
| Hadley2-rcp6 | Hadley v2 coupled model with +6 W/m2 scenario |
| ISIMIP | inter-sectoral impact hydrological model intercomparison project |
| LGP | length of (crop) growing period |
| LHF | latent heat flux (vegetation proxy) |
| NCEP2 | national lefts for environmental prediction reanalysis v2 |
| NDVI | normalized difference vegetation index (colour fraction) |
| NW | northwest |
| OLR | (net) outgoing long-wave radiation |
| P | precipitation |
| S | soil moisture (0–1 m) |
| SHF | sensible heat flux |
| T | temperature |
| watergap | hydrological model (ISIMIP) |
Appendix A

Table A1.
Evaluation of NW-Ethiopia highlands CMIP5 model rainfall with gauge-interpolated reference [65] 1981–2010. Correlation of mean annual cycle, Jun.–Sep. seasonal difference between observation and model, model mean mid-summer rain rate (mm/day) and phase/amplitude ‘fit’ of annual cycle.
Table A1.
Evaluation of NW-Ethiopia highlands CMIP5 model rainfall with gauge-interpolated reference [65] 1981–2010. Correlation of mean annual cycle, Jun.–Sep. seasonal difference between observation and model, model mean mid-summer rain rate (mm/day) and phase/amplitude ‘fit’ of annual cycle.
| No | Model | Rain Correlation | Jun.–Sep. Difference | Jul.–Aug. Value | Annual Cycle |
|---|---|---|---|---|---|
| 1 | bcc-csm1-1 | 0.65 | −3.2 | 3.8 | poor |
| 2 | bcc-csm1-1-m | 0.90 | −1.4 | 6.3 | poor |
| 3 | CCSM4 | 0.76 | −2.0 | 4.3 | poor |
| 4 | CESM1-CAM5 | 0.75 | −0.9 | 5.7 | poor |
| 5 | CSIRO-Mk3-6-0 | 0.91 | −1.1 | 8.8 | moderate |
| 6 | FIO-ESM | 0.80 | −2.1 | 4.6 | poor |
| 7 | GFDL-CM3 | 0.87 | −1.5 | 6.2 | poor |
| 8 | GFDL-ESM2G | 0.86 | −0.3 | 6.7 | moderate |
| 9 | GFDL-ESM2M | 0.87 | −0.5 | 6.4 | moderate |
| 10 | GISS-E2-H_p1 | 0.96 | −5.3 | 3.2 | poor |
| 11 | GISS-E2-H_p2 | 0.96 | −5.5 | 2.8 | poor |
| 12 | GISS-E2-H_p3 | 0.96 | −4.7 | 4.0 | poor |
| 13 | GISS-E2-R_p1 | 0.97 | −5.6 | 2.5 | poor |
| 14 | GISS-E2-R_p2 | 0.97 | −5.7 | 2.6 | poor |
| 15 | GISS-E2-R_p3 | 0.96 | −5.3 | 2.7 | poor |
| 16 | HadGEM2-AO | 0.96 | −0.4 | 8.1 | high |
| 17 | HadGEM2-ES | 0.97 | −0.5 | 8.0 | high |
| 18 | IPSL-CM5A-LR | 0.89 | −2.7 | 6.3 | poor |
| 19 | IPSL-CM5A-MR | 0.90 | −3.3 | 5.3 | poor |
| 20 | MIROC5 | 0.98 | 6.5 | 16.1 | poor |
| 21 | MIROC-ESM | 0.86 | −0.5 | 7.3 | high |
| 22 | MIROC-ESM-CHEM | 0.88 | −0.5 | 7.4 | high |
| 23 | MRI-CGCM3 | 0.93 | −2.5 | 6.0 | moderate |
| 24 | NorESM1-M | 0.66 | −2.7 | 3.4 | poor |
| 25 | NorESM1-ME | 0.62 | −2.3 | 3.3 | poor |
Table A2.
Evaluation of NW-Ethiopia highlands CMIP5 model sensible heat flux (SHF) with ECMWF reanalysis 1981–2010. Correlation of mean annual cycle, Feb.–Apr. seasonal difference between observation and model (mm/day), and phase/amplitude ‘fit’ of annual cycle.
Table A2.
Evaluation of NW-Ethiopia highlands CMIP5 model sensible heat flux (SHF) with ECMWF reanalysis 1981–2010. Correlation of mean annual cycle, Feb.–Apr. seasonal difference between observation and model (mm/day), and phase/amplitude ‘fit’ of annual cycle.
| No | Models | SHF Correlation | Feb.–Apr. Difference | Annual Cycle |
|---|---|---|---|---|
| 1 | bcc-csm1-1-m | 0.79 | 0.46 | moderate |
| 2 | bcc-csm1-1 | 0.73 | 0.72 | poor |
| 3 | CCSM4 | 0.96 | 0.63 | high |
| 4 | CESM1-CAM5 | 0.78 | 0.06 | moderate |
| 5 | CSIRO-Mk3-6-0 | 0.79 | 1.04 | poor |
| 6 | FIO-ESM | 0.95 | 0.81 | high |
| 7 | GFDL-CM3 | 0.92 | 1.26 | poor |
| 8 | GFDL-ESM2G | 0.9 | 0.92 | moderate |
| 9 | GFDL-ESM2M | 0.92 | 0.88 | moderate |
| 10 | GISS-E2-H_p1 | 0.95 | 1.48 | poor |
| 11 | GISS-E2-H_p2 | 0.96 | 1.32 | poor |
| 12 | GISS-E2-H_p3 | 0.97 | 1.21 | poor |
| 13 | GISS-E2-R_p1 | 0.95 | 1.29 | poor |
| 14 | GISS-E2-R_p2 | 0.97 | 1.11 | poor |
| 15 | GISS-E2-R_p3 | 0.97 | 1.04 | moderate |
| 16 | HadGEM2-AO | 0.93 | 0.34 | high |
| 17 | HadGEM2-ES | 0.96 | 0.24 | very high |
| 18 | IPSL-CM5A-LR | 0.87 | 1.52 | poor |
| 19 | IPSL-CM5A-MR | 0.74 | 1.34 | poor |
| 20 | MIROC5 | 0.95 | −0.95 | moderate |
| 21 | MIROC-ESM | 0.87 | 0.11 | moderate |
| 22 | MIROC-ESM-CHEM | 0.85 | 0.05 | moderate |
| 23 | MRI-CGCM3 | 0.8 | 0.31 | moderate |
| 24 | NorESM1-M | 0.95 | 0.58 | high |
| 25 | NorESM1-ME | 0.91 | 0.44 | high |
Table A3.
Statistical significance of soil moisture trends per month in the NW-Ethiopian highlands, based on HadGEM2-ES rcp6 projection 1981–2100 and ISIMIP hydrological output, where bold values are significant. Temporal correlation indicating slope of regression line, where negative = drying, and p-value with respect to 119 degrees of freedom.
| N = 119 | Glowb | Watergap | ||
|---|---|---|---|---|
| Months | Time Cor. | p-Value | Time Cor. | p-Value |
| Jan | −0.25 | 0.01 | 0.12 | 0.18 |
| Feb | −0.28 | 0.00 | 0.12 | 0.19 |
| Mar | −0.19 | 0.03 | 0.12 | 0.21 |
| Apr | −0.06 | 0.49 | 0.14 | 0.12 |
| May | −0.08 | 0.38 | 0.12 | 0.21 |
| Jun | 0.13 | 0.17 | 0.36 | 0.00 |
| Jul | −0.43 | 0.00 | −0.07 | 0.42 |
| Aug | −0.19 | 0.03 | −0.42 | 0.00 |
| Sep | 0.15 | 0.11 | −0.10 | 0.26 |
| Oct | 0.17 | 0.06 | 0.05 | 0.57 |
| Nov | −0.27 | 0.00 | −0.02 | 0.82 |
| Dec | −0.23 | 0.01 | −0.03 | 0.77 |
Figure A1.
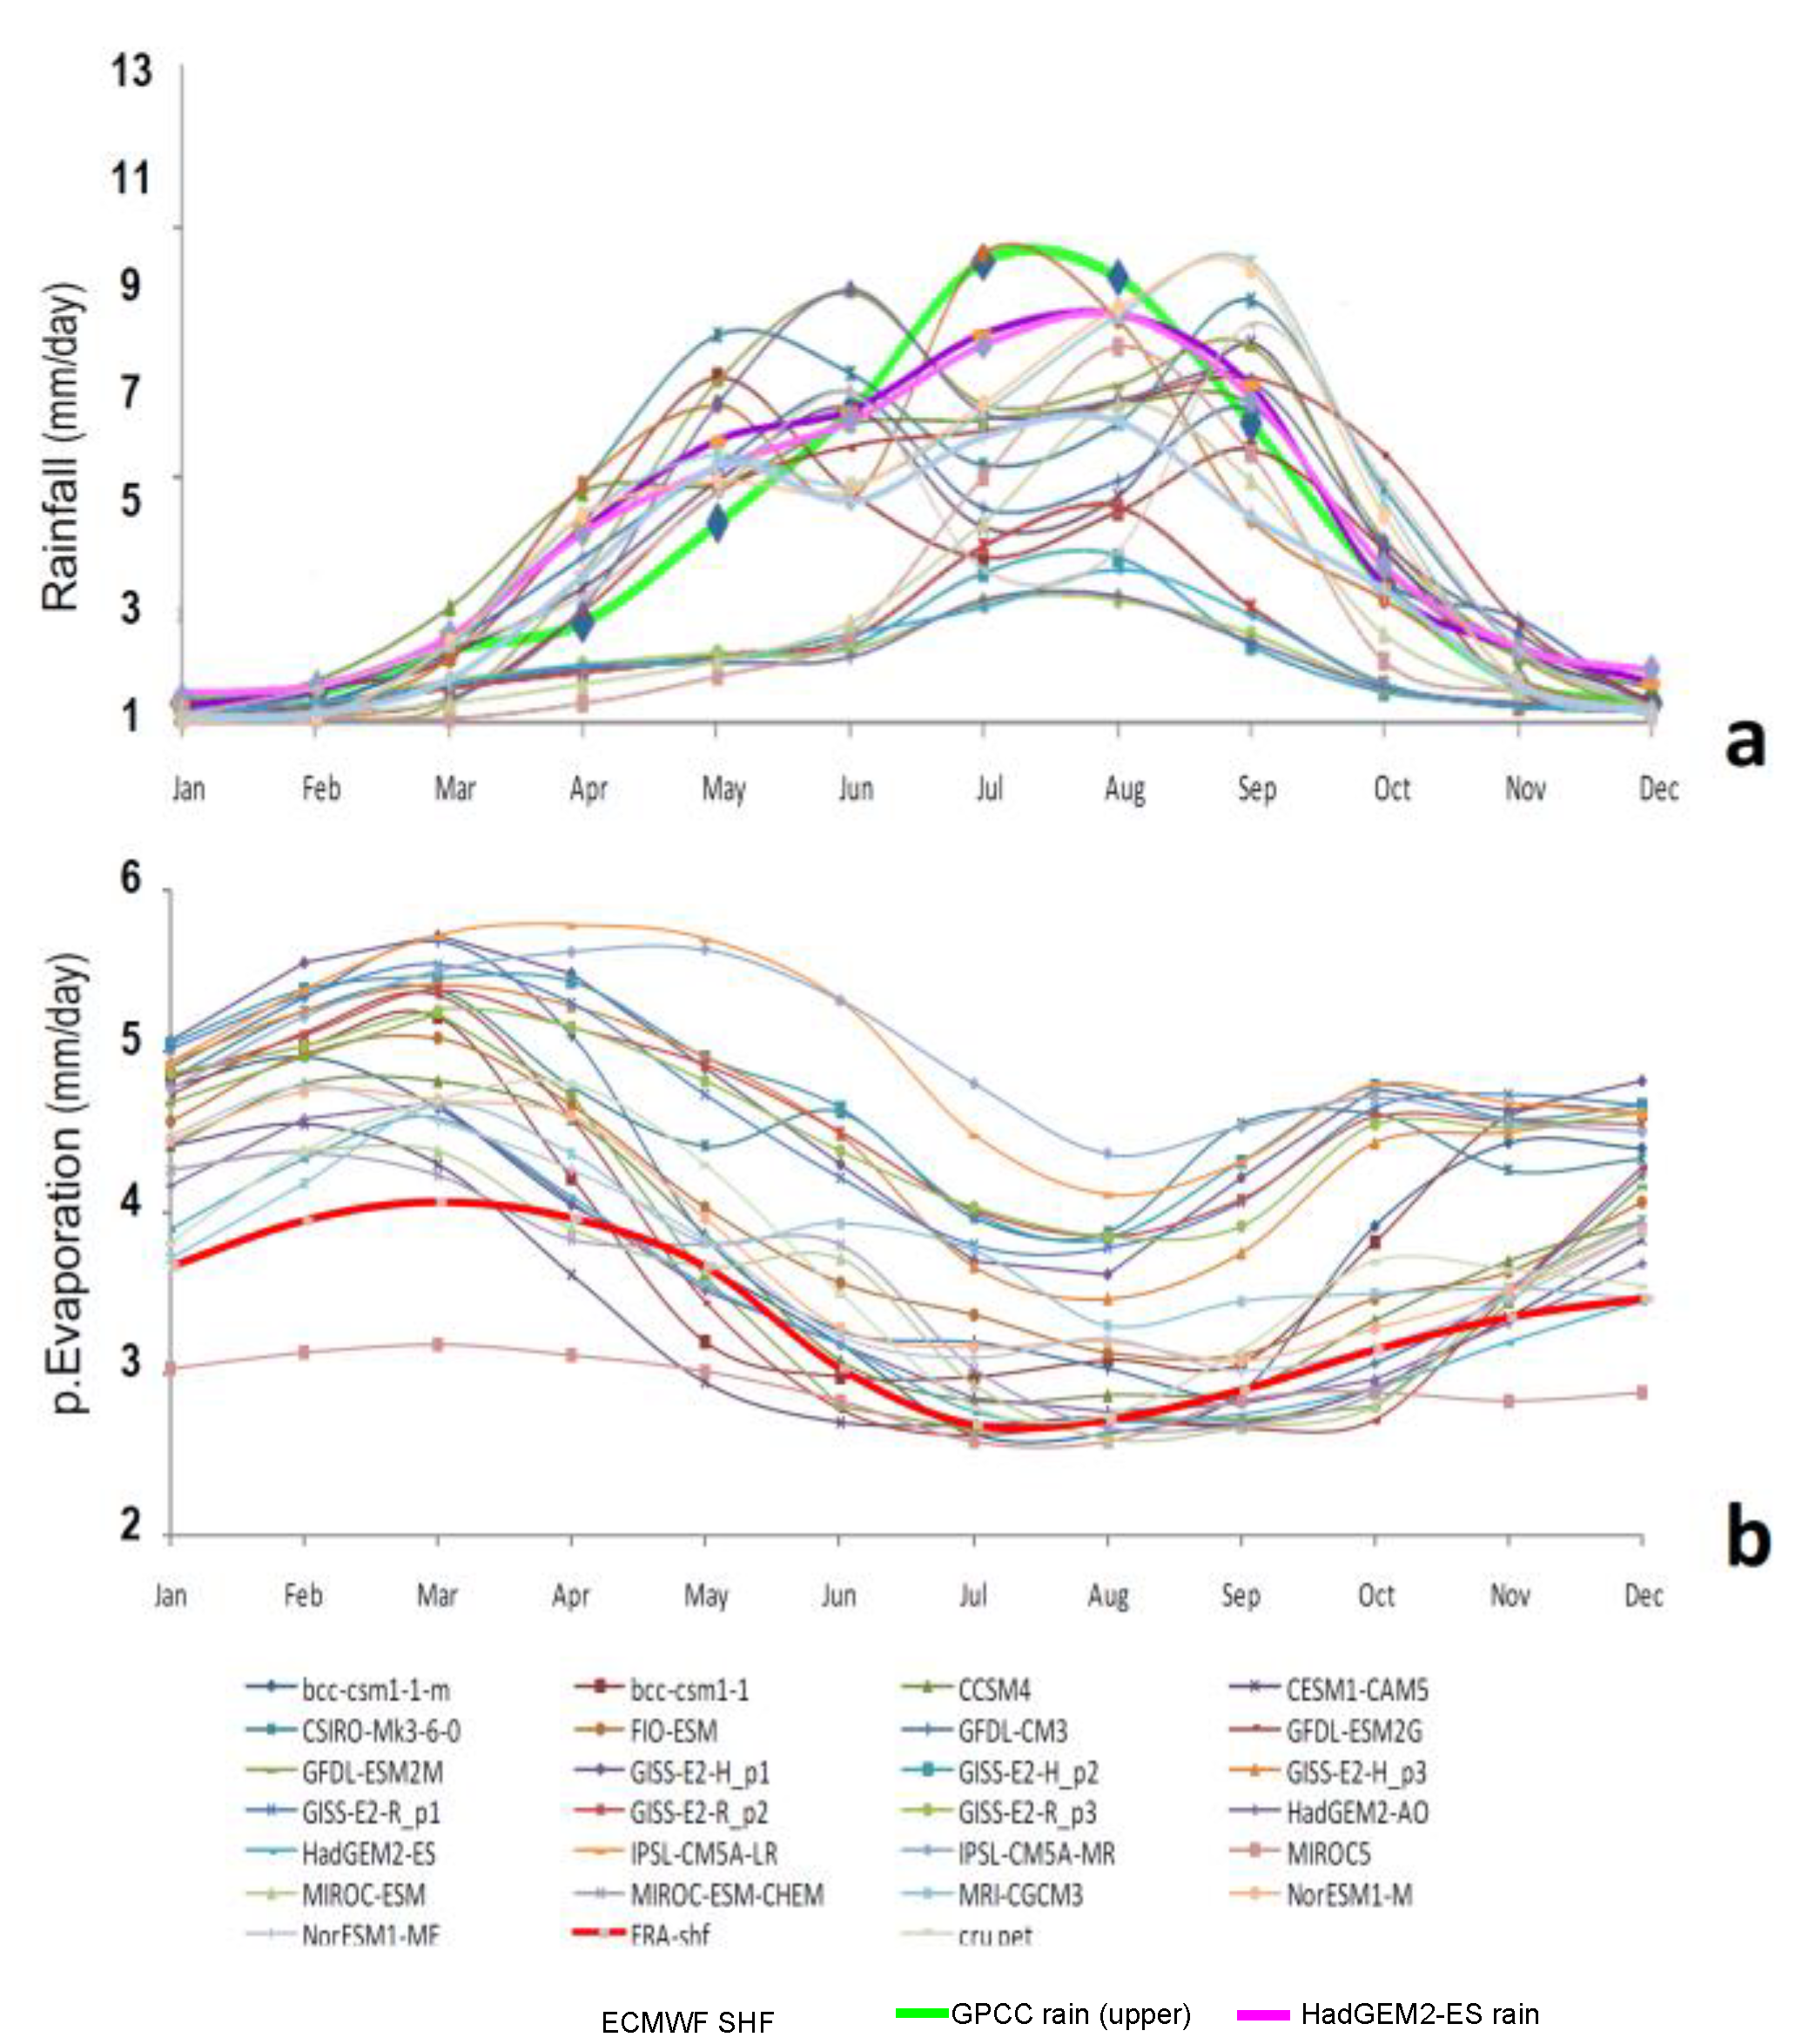
Mean annual cycle of NW Ethiopian highlands area-averaged (a) P and (b) E derived from SHF; comparing all 25 CMIP5 simulations with observation/reanalysis reference (bold green upper, bold red lower) 1981–2010. HadGEM2-ES rainfall (upper) is bold pink.
Figure A1.
Mean annual cycle of NW Ethiopian highlands area-averaged (a) P and (b) E derived from SHF; comparing all 25 CMIP5 simulations with observation/reanalysis reference (bold green upper, bold red lower) 1981–2010. HadGEM2-ES rainfall (upper) is bold pink.

Figure A2.
(a) Scatterplot of elevation vs. Jul.–Oct. surface T across Ethiopia, arrow highlights the most suitable range, (b) main crop-growing areas (green shaded). (c) Example of LGP constraints imposed by thresholds of daily soil moisture and minimum T. Note the drought in 2015 and higher T in 2017–2018. The min. T is trimmed above 16C to indicate no threshold exceedance.

References
- Adenew, B. Climate Change and Policy Process in Ethiopia: Preliminary Review Results; Ethiopian Economics Association: Addis Ababa, Ethiopia, 2010. [Google Scholar]
- Degefu, W.; Glantz, M. (Eds.) Some aspects of meteorological drought in Ethiopia. In Drought and Hunger in Africa: Denying Famine a Future; Cambridge University Press: Cambridge, UK, 1987; pp. 23–36. [Google Scholar]
- Davidson, O.; Halsnaes, K.; Huq, S.; Kok, M.; Metz, B.; Sokona, Y.; Verhagen, J. The development and climate nexus: The case of sub-Saharan Africa. Clim. Policy 2003, 3, S97–S113. [Google Scholar] [CrossRef]
- Adem, A.; Bewket, W. A Climate Change Country Assessment: Report for Ethiopia. Forum for Environment (ECSNCC); Epsilon International R&D: Addis Ababa, Ethiopia, 2011. [Google Scholar]
- Cheung, W.H.; Senay, G.B.; Singh, A. Trends and spatial distribution of annual and seasonal rainfall in Ethiopia. Int. J. Climatol. 2008, 28, 1723–1734. [Google Scholar] [CrossRef]
- Segele, Z.T.; Lamb, P.J. Characterization and variability of JJAS rainy season over Ethiopia. Meteorol. Atmos. Phys. 2005, 89, 153–180. [Google Scholar] [CrossRef]
- Bewket, W. Rainfall Variability and Crop Production in Ethiopia: Case Study in the Amhara Region. In Proceedings of the 16th International Conference of Ethiopian Studies, Norway, 2009. Available online: http://hpccc.gov.in/PDF/Agriculture/Rainfall%20Variability%20and%20Crop%20production%20in%20Ethiopia%20Case%20study%20in%20the%20Amhara%20Region.pdf (accessed on 16 June 2020).
- Ayalew, D.; Tesfaye, K.; Mamo, G.; Yitaferu, B.; Bayu, W. Variability of rainfall and its current trend in Amhara region, Ethiopia. Afr. J. Agric. Res. 2012, 7, 1475–1486. [Google Scholar] [CrossRef]
- Shi, L.; Hendon, H.; Alves, O.; Luo, J.-J.; Balmaseda, M.; Anderson, D.L.T. How Predictable is the Indian Ocean Dipole? Mon. Weather Rev. 2012, 140, 3867–3884. [Google Scholar] [CrossRef]
- Henricksen, B.L.; Durkin, J.W. Moisture Availability, Cropping Period and the Prospects for Early Warning of Famine in Ethiopia; ILCA: Addis Ababa, Ethiopia, 1987. [Google Scholar]
- Belay, S. Agroclimatic analysis in relation to crop production. In Proceedings of the Ethiopian Agricultural Research Organization of Ethiopia, Bahir Dar, Ethiopia, 23 January 2001. [Google Scholar]
- Mersha, E. Agroclimatic classification of Ethiopia. Ethiop. J. Nat. Resour. 2005, 2, 137–154. [Google Scholar]
- Tesfaye, M. Water Balance Applications in the Identification and Analysis of Agricultural Droughts in South Wollo Zone, Ethiopia. Ph.D. Thesis, Andhra University, Visakhapatnam, India, 2014. [Google Scholar]
- Funk, C.; Nicholson, S.; Landsfeld, M.; Klotter, D.; Peterson, P.; Harrison, L. The centennial trends greater horn of Africa precipitation dataset. Sci. Data 2015, 2, 150050. [Google Scholar] [CrossRef]
- Agnew, C.T.; Chappel, A. Drought in the Sahel. GeoJournal 1999, 48, 299–311. [Google Scholar] [CrossRef]
- Cherkos, T. Intensity–Duration–Frequency Relationships for Northern Ethiopia Rainfall. Master’s Thesis, Addis Ababa University, Addis Ababa, Ethiopia, 2002. [Google Scholar]
- Jain, S.K.; Kumar, V. Trend analysis of rainfall and temperature data for India. Curr. Sci. 2012, 102, 37–49. [Google Scholar]
- Hemerance, M.A. Addressing Climate Variability in Agricultural Land Evaluation. Case Study for Crop Production in Far North Cameroon. Master’s Thesis, Ghent University, Brussels, Belgium, 2013. [Google Scholar]
- Allen, R.G.; Pereira, L.S.; Raes, D.; Smith, M. Crop evapotranspiration: A guideline for computing crop water requirements. In FAO Irrigation and Drainage Paper 56; FAO Water Resources, Development and Management Service: Rome, Italy, 1998; ISBN 92-5-104219-5. [Google Scholar]
- Kebede, B. Analysis of the Variability of Rainfall Distribution and Evapotranispiration over Eastern Amahara Region. Master’s Thesis, Arba Minch University, Arba Minch, Ethiopia, 2009. [Google Scholar]
- Tapley, B.D.; Bettadpur, S.; Ries, J.C.; Thompson, P.F.; Watkins, M.M. GRACE measurements of mass variability in the earth system. Science 2004, 305, 503–505. [Google Scholar] [CrossRef] [Green Version]
- Liu, Y.Y.; Parinussa, R.; Dorigo, W.; de Jeu, R.; Wagner, W.; van Dijk, A.; McCabe, M.; Evans, J. Developing an improved soil moisture dataset by blending passive and active microwave satellite-based retrievals. Hydrol. Earth Sys. Sci. 2011, 15, 425–436. [Google Scholar] [CrossRef] [Green Version]
- Crippen, R.E. Calculating the vegetation index faster. Remote Sens. Environ. 1990, 34, 71–73. [Google Scholar] [CrossRef]
- Ji, L.; Peters, A.J. Assessing vegetation response to drought in the northern Great Plains using vegetation and drought indices. Remote Sens. Environ. 2003, 87, 85–98. [Google Scholar] [CrossRef]
- Tucker, C.J.; Pinzon, J.E.; Brown, M.E.; Slayback, D.; Pak, E.W.; Mahoney, R.; Vermote, E.; Saleous, N. An extended AVHRR 8-km NDVI dataset compatible with MODIS and SPOT vegetation. Int. J. Remote Sens. 2005, 26, 4485–4498. [Google Scholar] [CrossRef]
- Kaicun, W.K.; Pucai, W.; Zhanqing, L.; Cribb, M.; Michael, S. A simple method to estimate actual evapotranspiration from a combination of net radiation, vegetation index, and temperature. J. Geophys. Res. 2007, 112, D15107. [Google Scholar] [CrossRef]
- United Nations International Strategy for Disaster Reduction. Drought risk reduction framework and practices: Contributing to the implementation of the Kyoto framework for action. In International Strategy for Disaster Risk; UNISDR: Geneva, Switzerland, 2009. [Google Scholar]
- Mekuria, E. Spatial and Temporal Analysis of Recent Drought Years Using Vegetation Temperature Condition index, Case of Somali Regional State. Master’s Thesis, Arba Minch University, Arba Minch, Ethiopia, 2012. [Google Scholar]
- Yohannes, Z. Estimation of teff yield using remote sensing and GIS techniques in Tigray region, Northern Ethiopia. In Proceedings of the Research Application Summary, 3rd RU-Forum Biennial Meeting, Entebbe, Uganda, 24–28 September 2012. [Google Scholar]
- Tadesse, T.; Demisse, G.B.; Zaitchik, B.; Dinku, T. Satellite-based hybrid drought monitoring tool for prediction of vegetation condition in Eastern Africa: A case study for Ethiopia. Water Resour. Res. 2014, 50, 2176–2190. [Google Scholar] [CrossRef]
- Dodamani, B.M.; Anoop, R.; Mahajan, D.R. Agricultural drought modeling using remote sensing. Int. J Environ. Sci. Dev. 2015, 6, 326. [Google Scholar] [CrossRef]
- Hundera, H.; Berhan, B.; Bewuket, W. Remote sensing and GIS based agricultural drought risk assessment in east Shewa zone, central Rift Valley region of Ethiopia. J. Environ. Earth Sci. 2016, 6, 48–54. [Google Scholar]
- Kanamitsu, M.; Ebisuzaki, W.; Woollen, J.; Yang, S.; Hnilo, J.J.; Fiorino, M.; Potter, G.L. NCEP–DOE AMIP reanalysis R2. Bull. Am. Meteorol. Soc. 2002, 83, 1631–1644. [Google Scholar] [CrossRef]
- Oleson, K.W.; Niu, G.Y.; Yang, Z.L.; Lawrence, D.M.; Thornton, P.E.; Lawrence, P.J.; Stöckli, R.; Dickinson, R.E.; Bonan, G.B.; Levis, S.; et al. Improvements to the community land model and their impact on the hydrological cycle. J. Geophys. Res. 2008, 113, G01021. [Google Scholar] [CrossRef]
- Dee, D.P.; Uppala, S.M.; Simmons, A.J.; Berrisford, P.; Poli, P.; Kobayashi, S.; Andrae, U.; Balmaseda, M.A.; Balsamo, G.; Bauer, D.P.; et al. The ERA-Interim reanalysis: Configuration and performance of the data assimilation system. Q. J. Roy. Meteorol. Soc. 2011, 137, 553–597. [Google Scholar] [CrossRef]
- McNally, A.; Arsenault, K.; Kumar, S.; Shukla, S.; Peterson, P.; Wang, S.; Funk, C.; Peters-Lidard, C.D.; Verdin, J.P. A land data assimilation system for sub-Saharan Africa food and water security applications (FLDAS). Sci. Data 2017, 4, 170012. [Google Scholar] [CrossRef] [PubMed] [Green Version]
- Dinku, T.; Connor, S.J.; Ceccato, P.; Ropelewski, C.F. Comparison of global gridded precipitation products over a mountainous region of Africa. Int. J. Climatol. 2008, 28, 1627–1638. [Google Scholar] [CrossRef]
- Diro, G.T.; Black, E.; Grimes, D.I.F. Seasonal forecasting of Ethiopian spring rains. Meteorol. Appl. 2009, 15, 73–83. [Google Scholar] [CrossRef]
- Funk, C.C.; Peterson, P.J.; Landsfeld, M.F.; Pedreros, D.H.; Verdin, J.P.; Rowland, J.D.; Romero, B.E.; Husak, G.J.; Michaelsen, J.C.; Verdin, A.P. A quasi-global precipitation time series for drought monitoring. US Geological. Surv. Data Ser. 2014, 832, 1–4. [Google Scholar] [CrossRef]
- Masresha, E. Growing season belts of Ethiopia. In Proceedings of the National Workshop on Agrometeorology and GIS, EIAR, Addis Ababa, Ethiopia, 7–11 July 2003; pp. 35–36. [Google Scholar]
- Araya, S.D.; Keesstra, L.; Stroosnijder, L. A new agro-climatic classification for crop suitability zoning in northern semi-arid Ethiopia. Agricul. For. Meteorol. 2010, 150, 1057–1064. [Google Scholar] [CrossRef]
- Yemenu, F.; Chemeda, D. Climate resources analysis for use of planning in crop production and rainfall water management in the central highlands of Ethiopia, the case of Bishoftu district, Oromia region, Hydrol. Earth Syst. Sci. Discuss 2010, 7, 3733–3763. [Google Scholar] [CrossRef] [Green Version]
- Dereje, G.; Eshetu, A. Crops and Agro-Ecological Zones of Ethiopia; Ethiopian Institute of Agricultural Research: Addis Ababa, Ethiopia, 2011.
- Gebremichael, A.; Quraishi, S.; Mamo, G. Analysis of seasonal rainfall variability for agricultural water resource management in southern region, Ethiopia. J. Nat. Sci. Res. 2014, 4, 2224–3186. [Google Scholar]
- Sawa, B.A.; Adebayo, A.A.; Bwala, A.A. Dynamics of hydrological growing aeason at Kano as evidence of climate change. Asian J. Agric. Sci. 2014, 62, 75–78. [Google Scholar] [CrossRef]
- Thornton, P.K.; Jones, P.G.; Owiyo, T. Mapping Climate Vulnerability and Poverty in Africa, Report to the Department of International Development; UN: Nairobi, Kenya, 2006; 171p. [Google Scholar]
- Ati, O.F.; Stigter, C.J.; Olandipo, E.O. A Comparison of methods to determine the onset of the growing season in northern Nigeria. Int. J. Climatol. 2002, 22, 732–742. [Google Scholar] [CrossRef]
- Nata, T. Surface water potential of the Hantebet Basin, Tigray, Northern Ethiopia. Agric. Eng. Int. CIGRE J. 2006, 8, 5–10. [Google Scholar]
- Kebede, K.; Bekelle, E. Tillage effect on soil water storage and wheat yield on the vertisols of north central highlands of Ethiopia. Ethiop. J. Environ. Stud. Manag. 2008, 1, 49–55. [Google Scholar] [CrossRef]
- Taylor, K.E.; Stouffer, R.J.; Meehl, G.A. An overview of CMIP5 and the experiment design. Bull. Am. Met. Soc. 2012, 93, 485–498. [Google Scholar] [CrossRef] [Green Version]
- Intergovernmental Panel on Climate Change. Climate Change 2014: Synthesis Report. Contribution of Working Group I Fifth Assessment Report; Pachauri, M., Ed.; IPCC: Geneva, Switzerland, 2014; p. 151. [Google Scholar]
- Bhattacharjee, P.S.; Zaitchik, B.F. Perspectives on CMIP5 model performance in the Nile River head waters regions. Int. J. Climatol. 2015, 35, 4262–4275. [Google Scholar] [CrossRef] [Green Version]
- Jones, C.; Hughes, J.K.; Bellouin, N.; Hardiman, S.C.; Jones, G.S.; Knight, J.; Liddicoat, S.; O’connor, F.M.; Andres, R.J.; Bell, C.; et al. The HadGEM2-ES implementation of CMIP5 centennial simulations. Geosci. Model Dev. 2011, 4, 543–570. [Google Scholar] [CrossRef] [Green Version]
- Frieler, K.; Lange, S.; Piontek, F.; Reyer, C.P.; Schewe, J.; Warszawski, L.; Zhao, F.; Chini, L.; Denvil, S.; Emanuel, K.; et al. Assessing the impacts of 1.5 °C global warming—Simulation protocol of the Inter-Sectoral Impact Model Intercomparison Project ISIMIP2b. Geosci. Model Dev. 2018, 10, 4321–4345. [Google Scholar] [CrossRef] [Green Version]
- Van Vuuren, D.P.; Edmonds, J.; Kainuma, M.; Riahi, K.; Thomson, A.; Hibbard, K.; Hurtt, G.C.; Kram, T.; Krey, V.; Lamarque, J.F.; et al. The representative concentration pathways: An overview. Clim. Chang. 2011, 109, 5–31. [Google Scholar] [CrossRef]
- Reda, D.T.; Engida, A.N.; Asfaw, D.H.; Hamdi, R. Analysis of precipitation based on ensembles of regional climate model simulations and observational databases over Ethiopia for the period 1989–2008. Int. J. Climatol. 2015, 35, 948–971. [Google Scholar] [CrossRef]
- Byrne, M.P.; Pendergrass, A.G.; Rapp, A.D.; Wodzicki, K.R. Response of the intertropical convergence zone to climate change: Location, width, and strength. Curr. Clim. Chang. Rep. 2018, 4, 355–370. [Google Scholar] [CrossRef] [Green Version]
- Shanko, D.; Chamberlain, P. The effects of the southwest Indian ocean tropical cyclones on Ethiopian drought. Int. J. Climatol. 1998, 18, 1373–1388. [Google Scholar] [CrossRef]
- Seleshi, Y.; Zanke, U. Recent changes in rainfall and rainy days in Ethiopia. Int. J. Climatol. 2004, 24, 973–983. [Google Scholar] [CrossRef]
- Conway, D.; Schipper, E.L.F. Adaptation to climate change in Africa: Challenges and opportunities. Glob. Environ. Chang. 2011, 21, 227–237. [Google Scholar] [CrossRef]
- Jury, M.R. Ethiopian highlands crop-climate prediction 1979–2009. J. Appl. Meteorol. Climatol. 2013, 52, 1116–1126. [Google Scholar] [CrossRef]
- Jury, M.R. Statistical evaluation of CMIP5 climate change model simulations for the Ethiopian highlands. Int. J. Climatol. 2015, 35, 37–44. [Google Scholar] [CrossRef]
- Ethiopian Panel on Climate Change (EPCC). First Assessment Report, Working Group I Physical Science Basis; Ethiopian Academy of Sciences: Addis Ababa, Ethiopia, 2015. [Google Scholar]
- Jury, M.R.; Funk, C. Climatic trends over Ethiopia: Regional signals and drivers. Int. J. Climatol. 2013, 33, 1924–1935. [Google Scholar] [CrossRef]
- Harris, I.; Jones, P.D.; Osborn, T.J.; Lister, D.H. Updated high-resolution grids of monthly climatic observations the CRU4 Dataset. Int. J. Climatol. 2014, 34, 623–642. [Google Scholar] [CrossRef] [Green Version]
Figure 1.
(a) Mean nocturnal land surface T and (b) NDVI vegetation color fraction of the Ethiopian highlands averaged 2000–2014. (c) Topographic map of the study area and (d) Empirical Orthogonal Functions (EOF) loading pattern of cenTrends 1st mode P and box for the extraction of time series.
Figure 1.
(a) Mean nocturnal land surface T and (b) NDVI vegetation color fraction of the Ethiopian highlands averaged 2000–2014. (c) Topographic map of the study area and (d) Empirical Orthogonal Functions (EOF) loading pattern of cenTrends 1st mode P and box for the extraction of time series.

Figure 2.
Annual cycle terciles from daily data 1980–2018: (a) Seasonal precipitation (P) minus E and (b) ECMWF LHF ‘vegetation’ proxy. (c) Seasonal contributions of cenTrends P over the 20th century, where late = Oct–Nov, early = Apr.–May, wide = early + late, narrow = Jul.–Aug. only. All time series averaged in the study area: 8.5–13° N, 35–39.5° E.

Figure 3.
Composite differences of 5-most minus 5-least seasons 925–700 hPa circulation (left) and humidity: (a) ‘Early’ (Apr.–May), (b) ‘Late’ (Oct.–Nov.). (c) Meridional circulation and humidity in N-S vertical section with topography for 5-most minus 5-least ‘Narrow’ (Jul.–Aug.) seasons.
Figure 3.
Composite differences of 5-most minus 5-least seasons 925–700 hPa circulation (left) and humidity: (a) ‘Early’ (Apr.–May), (b) ‘Late’ (Oct.–Nov.). (c) Meridional circulation and humidity in N-S vertical section with topography for 5-most minus 5-least ‘Narrow’ (Jul.–Aug.) seasons.

Figure 4.
Composite differences of 5-most minus 5-least ‘Wide’ seasons: (a) satellite net outgoing long-wave radiation (OLR) and (b) 1000–100 hPa tropospheric circulation vectors with key features, and an index box.
Figure 4.
Composite differences of 5-most minus 5-least ‘Wide’ seasons: (a) satellite net outgoing long-wave radiation (OLR) and (b) 1000–100 hPa tropospheric circulation vectors with key features, and an index box.

Figure 5.
EOF loading patterns of 1st mode ECMWF reanalysis: (a) S and (b) SHF, identifying zones with unimodal climate. Mean annual cycle of area-averaged: (c) reanalysis S and (d) satellite S and vegetation NDVI. Lag-correlation of reanalysis S with variables from the NW Ethiopia area: (e) cenTrends P, satellite S and NDVI, and (f) Hadley2-rcp6 SHF and ECMWF E. Negative months refer to variable leading S.

Figure 6.
Hadley2-rcp6 annual cycle of S in past, future, and difference: (a) glowb and (b) watergap. Hadley2-rcp6 projected time series of annual S and E from (c) glowb and (d) watergap, and E slope (mm day−1/yr) and r2 fit; scales vary slightly. S trend maps for Jul–Oct wet season: (e) ECMWF past (1900–2018), (f) glowb future (2001–2100), and (g) watergap future (% yr−1). 1500 m elevation contour delineates the highlands.

Figure 7.
Hadley2-rcp6 annual cycle in past, future, and difference: (a) LHF vegetation, and (b) minimum T, the arrow points to warming in October. Box and whisker plot of onset, cessation, and LGP of (c) past and (d) future era: (dashed: median, box: 25/75th percentile, whisker: 10/90th percentile, o: extreme value).

Table 1.
Sequence of methods applied. CMIP5: Coupled Model Intercomparsion Project.
| Scope | Methods and Variables | |
|---|---|---|
| 1 | Determination of homogenous study area | EOF cluster analysis of cenTrends precipitation (P): 8.5–13 N, 35–39.5 E |
| 2 | Evaluate potential evaporation (E) | Comparison of observed, reanalysis, model-simulated sensible heat flux (SHF) |
| 3 | CMIP5 model validation and selection | Apply criteria to determine annual cycle bias in P, SHF as proxy for E |
| 4 | Soil moisture fraction (S) | Compare P–E, latent heat flux (LHF) and NDVI with S |
| 5 | Collection of optimal time series | Area-average NW Ethiopian highlands: P, E, S, T; 8.5–13 N, 35–39.5 E |
| 6 | Characterization of annual cycle | Calculate annual cycle and percentiles for P, E, S, T, LHF; determine shift/width |
| 7 | Meteorological forcing of annual cycle | Composite analysis of reanalysis fields for early-late, wide-narrow LGP |
| 8 | Analysis of climate trends | Statistical regression slope and significance; seasonal changes for P, E, S |
| 9 | Assess LGP and impact of climate change | Onset and cessation in past (1900–2000) and future (2001–2100) |
Table 2.
Categorization of sub-seasonal rainfall percentages (yellow-least, blue-most).
| LEAST | Early | LEAST | Late | LEAST | Wide | LEAST | Narrow |
|---|---|---|---|---|---|---|---|
| 2003 | 0.06 | 1984 | 0.03 | 2003 | 0.09 | 2014 | 0.38 |
| 1990 | 0.08 | 1995 | 0.03 | 1990 | 0.11 | 1997 | 0.39 |
| 2002 | 0.08 | 1990 | 0.03 | 2002 | 0.12 | 2019 | 0.39 |
| 2009 | 0.08 | 2003 | 0.03 | 2012 | 0.13 | 2015 | 0.40 |
| 1988 | 0.09 | 1991 | 0.04 | 1986 | 0.14 | 1987 | 0.41 |
| 2012 | 0.09 | 2010 | 0.04 | 1991 | 0.15 | 1993 | 0.42 |
| Apr.–May | Oct.–Nov. | Early + late | Jul.–Aug. | ||||
| 1996 | 0.18 | 1982 | 0.11 | 2008 | 0.26 | 1994 | 0.50 |
| 1993 | 0.19 | 2019 | 0.12 | 1987 | 0.26 | 2013 | 0.51 |
| 1987 | 0.19 | 2000 | 0.12 | 2016 | 0.27 | 2009 | 0.52 |
| 2008 | 0.19 | 1992 | 0.13 | 2000 | 0.27 | 2012 | 0.52 |
| 2016 | 0.20 | 1999 | 0.13 | 2014 | 0.29 | 1981 | 0.52 |
| 2014 | 0.20 | 1997 | 0.16 | 1997 | 0.32 | 1990 | 0.54 |
| MOST | early | MOST | late | MOST | wide | MOST | narrow |
© 2020 by the authors. Licensee MDPI, Basel, Switzerland. This article is an open access article distributed under the terms and conditions of the Creative Commons Attribution (CC BY) license (http://creativecommons.org/licenses/by/4.0/).
Share and Cite
MDPI and ACS Style
Tarkegn, G.B.; Jury, M.R. Changes in the Seasonality of Ethiopian Highlands Climate and Implications for Crop Growth. Atmosphere 2020, 11, 892. https://doi.org/10.3390/atmos11090892
AMA Style
Tarkegn GB, Jury MR. Changes in the Seasonality of Ethiopian Highlands Climate and Implications for Crop Growth. Atmosphere. 2020; 11(9):892. https://doi.org/10.3390/atmos11090892
Chicago/Turabian StyleTarkegn, Gashaw Bimrew, and Mark R. Jury. 2020. "Changes in the Seasonality of Ethiopian Highlands Climate and Implications for Crop Growth" Atmosphere 11, no. 9: 892. https://doi.org/10.3390/atmos11090892
Note that from the first issue of 2016, this journal uses article numbers instead of page numbers. See further details here.