Article

Trends in Atmospheric Humidity and Temperature above Dome C, Antarctica Evaluated from Observations and Reanalyses

1
Centre National de Recherches Météorologiques (CNRM), Université de Toulouse, Météo-France, CNRS, 31057 Toulouse, France
2
ENEA, Lungotevere Thaon di Revel, 76-00196 Roma, Italy
3
Laboratoire d’Aérologie, Université de Toulouse, CNRS, UPS, 31400 Toulouse, France
4
Department of Geography & Spatial Sciences, University of Delaware, Newark, DE 19716, USA
*
Author to whom correspondence should be addressed.
Atmosphere 2020, 11(8), 836; https://doi.org/10.3390/atmos11080836
Submission received: 2 July 2020 / Revised: 31 July 2020 / Accepted: 6 August 2020 / Published: 7 August 2020
(This article belongs to the Special Issue Atmospheric Processes Shaping Polar Climate)

Abstract

:
The time evolution of humidity and temperature above Dome C (Antarctica) has been investigated by considering data from (1) meteorological radiosondes (2005–2017), (2) the microwave radiometer HAMSTRAD (2012–2017), (3) four modern meteorological reanalyses (1980–2017) and (4) the southern annular mode (SAM) index (1980–2017). From these observations (2005–2017), a significant moistening trend (0.08 ± 0.06 kg m−2 dec−1) is associated with a significant warming trend (1.08 ± 0.55 K dec−1) in summer. Conversely, a significant drying trend of −0.04 ± 0.03 kg m−2 dec−1 (−0.05 ± 0.03 kg m−2 dec−1) is associated with a significant cooling trend of −2.4 ± 1.2 K dec−1 (−5.1 ± 2.0 K dec−1) in autumn (winter), with no significant trends in the spring. We demonstrate that 1) the trends identified in the radiosondes (2005–2017) are also present in the reanalyses and 2) the multidecadal variability of integrated water vapor and near-surface temperature (1980–2017) is strongly influenced by variability in the SAM index for all seasons but spring. Our study suggests that the decadal trends observed in humidity and near-surface temperature at Dome C (2005–2017) reflect the multidecadal variability of the atmosphere, and are not indicative of long-term trends that may be related to global climate change.

1. Introduction

The evolution of the Antarctic climate during the second half of the 20th century and the beginning of the 21st century has been intensively investigated, because it directly affects the Antarctic region and indirectly influences the Earth’s geo-biophysical system. Based on surface observations, space-borne measurements, meteorological analyses and reanalyses, and climate model output, two essential points can be drawn. (1) One of the largest and most rapid warmings recorded on Earth is occurring over the Antarctic Peninsula (Western Antarctica), with values of ~0.5 °C dec−1 since 1950 [1], although the absence of warming during the early 21st century seems consistent with the natural variability of the atmosphere [2,3]. (2) Over the Antarctic Plateau (Eastern Antarctica), the temperature trends depend upon the season, with significant cooling in autumn and significant warming in spring [4]. More generally, temperature trends over Antarctica have been linked to changes in the tropics and extra-tropics (see e.g., [5,6]), including the influence of the southern annular mode (SAM, [7]). The asymmetrical response of temperature trends between Eastern and Western Antarctica is not only a consequence of the Transantarctic Mountain ridge separating the Antarctic Plateau in the East (mean altitude ~3000 m) from the Antarctic Peninsula and Amundsen Sea basin in the West [8], but is also due to seasonal variations in teleconnections. For example, in summer and autumn, a positive trend in the SAM index with a strengthening of the westerlies produces an East Antarctic cooling while, in the West Antarctic, warming is most likely due to zonally asymmetric circulation changes forced by the tropics [4,5]. In winter, a negative SAM trend is consistent with an East Antarctic tropospheric warming [9]. Surface cooling and/or warming have non-negligible impacts on several processes occurring in Antarctica including ocean warming [10], glacial retreat [11] and ozone depletion [12]. Although the mass balance of the East Antarctic ice sheet from 1992 to 2017 is highly uncertain [13], it is possible that Antarctica will experience an overall, irreversible loss of ice shelves by 2070, with a resulting contribution of a 0.6 to 3.0 m to sea level rise by 2300 under high greenhouse gases (GHGs) emission scenarios [14].
One important aspect of Antarctic climate change is the evolution of water vapor (H2O), a major GHG that greatly influences the radiative balance of the Earth’s climate system. Since Antarctica is one of the driest and coldest regions of the Earth [15], any change in temperature variability will dramatically affect atmospheric humidity, cloud occurrence [16,17,18], ice crystal presence [19,20,21] and supercooled liquid water cloud properties [22,23], thereby influencing the Antarctic radiative balance. Decadal trends computed on yearly-averaged, near-surface temperature and humidity observed by radiosonde from 2005 to 2018 at the South Pole showed a general warming of 1.1 K dec−1 and a general moistening of 0.007 g kg−1 dec−1 [24], with a warming trend occurring in all seasons. This warming at South Pole was also detected in surface station data, where a statistically significant increase in surface air temperature of 0.61 ± 0.34 °C dec−1 was observed over the three last decades [25].
To study the evolution of atmospheric humidity and its link to temperature variability, we have focused our study on the Antarctic Plateau, at Concordia, the Franco-Italian Dome C station (75°06′ S, 123°21′ E, 3233 m above mean sea level, amsl), where remotely-sensed and in situ observations are available since the beginning of the 21st century. We use measurements of precipitable water (i.e., vertically-Integrated Water Vapor or IWV) and of 10-m temperature from the H2O Antarctica Microwave Stratospheric and Tropospheric Radiometers (HAMSTRAD) installed in 2009 and providing continuous observations since 2012. We also consider the daily operational temperature and water vapor radiosonde profiles available since 2005. Long-term trends in IWV and near-surface temperature were also investigated from 1980 to 2017, using reanalyses from the European Centre for Medium-Range Weather Forecasts (ECMWF) global atmospheric interim reanalysis (ERA-Interim; [26]) and its updated version (ERA5; [27]), along with the National Aeronautics and Space Administration (NASA) Modern-Era Retrospective analysis for Research and Applications, version 2 (MERRA2; [28]), and the Japanese Re-Analyses (JRA-55; [29]). In order to interpret both IWV and near-surface temperature decadal trends, we have also considered the SAM index time evolution from 1980 to 2017, following the methodology outlined by Marshall [30]. The aims of this study are: (1) determine whether the decadal trends observed in the beginning of the 21st century are consistent with the ones calculated based on the reanalyses; and (2) assess whether the observed decadal trends in the 21st century are related to the long-term secular trends of the atmosphere, or simply reflect the multidecadal variability of the atmosphere.
This article presents the Dome C data sets and the methodology used to calculate decadal and multidecadal trends and variability in Section 2. The results detailing (1) the time evolution and decadal trends of IWV, temperature and H2O vertical profiles based on observations from 2005 to 2017, and (2) the multidecadal trends and variability of IWV, near-surface temperature and the SAM index from the reanalyses are described in Section 3. Multidecadal trends in the reanalyses and radiosondes, and related variability, are discussed in Section 4. Finally, our conclusions are given in Section 5.

2. Data and Method

In order to study the time evolution of IWV, temperature and H2O over Dome C, we employed observations made by (1) the microwave radiometer HAMSTRAD installed in 2009 operating at 60 and 183 GHz [31], which provides temperature vertical profiles and IWV with 7-min time resolution from 2012 to 2017; and (2) the meteorological radiosondes launched every day at 12:00 UTC, to obtain temperature and H2O vertical profiles (from which IWV was computed) from 2005 to 2017. An overview describing the temperature and H2O vertical profiles, as well as the IWV measured by HAMSTRAD and radiosondes at Dome C, shows that HAMSTRAD IWV estimates (1) are of excellent quality, with a Pearson linear correlation coefficient R against radiosonde IWV higher than 0.98; and (2) are wetter than radiosondes in 2010–2014 by about 12% (from 0.035 kg m−2 in winters (June, July, August—JJA) to 0.092 kg m−2 in summers (December, January, February–DJF)) [32]. It has also been shown that radiosonde observations tend to be biased cold and dry in dry and cold environments [33]. In order to assess the trends and the correlation of some parameters (H2O and temperature) along the vertical, we have systematically interpolated each individual radiosonde profile to the 38 HAMSTRAD retrieval vertical levels between 10 and 10,000 m above ground level (see [31]). Below 1000 m, the levels are at: 10, 30, 50, 75, 100, 125, 150, 200, 250, 325, 400, 475, 550, 625, 700, 800, 900 and 1000 m. Note that all the results presented in the following section will be provided at these heights above ground level.
Meteorological reanalyses of IWV and near-surface temperature were evaluated from: ERA-Interim (ERA-Int; [26]), ERA5 [27], MERRA2 [28] and JRA-55 [29]. ERA-Int, ERA5 and MERRA2 provided 2-m temperatures whilst JRA-55 only provided surface temperature. The data sets span either 1980–2016 (ERA-Int) or 1980–2017 (ERA5, MERRA2 and JRA-55). The reanalysis outputs are selected at the node closest to the Dome C station, at a distance of 14.6 km for ERA-Int, 11.4 km for ERA5, 12.6 km for MERRA2 and 26.3 km for JRA-55.
The SAM is the leading mode of variability in Southern Hemisphere atmospheric circulation on month-to-month and interannual timescales. The phase of the SAM is determined by the position of the westerly winds that surround the Antarctic continent, and the occurrence of high or low pressure over Southern Australia. SAM variability has a large impact on Antarctic surface temperatures, ocean circulation, and many other aspects of the Southern Hemisphere climate (see e.g., [9]). Therefore, we can expect that the trends in humidity above Dome C are influenced by the trends in SAM. In our study, the SAM index has been computed according to [30].
The calculation of the linear trends in IWV, near-surface temperature and SAM index and their associated (±1σ) standard deviations [34], were performed for different periods, due to data availability: HAMSTRAD observations over 2012–2017, radiosonde observations over 2012–2017 and 2005–2017 and reanalyses and the SAM index over 1980–2017. In order to obtain trends that can be quantitatively compared, at least in the 21st century, we have considered decadal trends for the entire article.
To calculate decadal trends, the observed, linear, yearly trends evaluated over the periods 2005–2017 or 2012–2017 have been multiplied by a factor 10 to attain decadal trends in IWV (kg m−2 dec−1) and in 10-m temperature (K dec−1) as seasonal or annual averages (Section 3.2). Then, in order to highlight the multidecadal variability of IWV, near-surface temperature, and the SAM index over the 38-year period, we used a 10-year moving window, within which we calculated the linear decadal trends and their associated (±1σ) errors, from 1980 to 2017, as seasonal and annual averages (Section 3.3). Finally, we assumed that a decadal trend is statistically significant when, in absolute value, it is greater than its 1-σ error (Section 3.2 and Section 3.3).
Section 3.2 presents the observed decadal trends in temperature and water vapor in the early 21st century. Section 3.3 considers both the multidecadal trends and variability in near-surface temperature and IWV from reanalyses and in the SAM index over 1980–2017, to be compared with the decadal trends in Section 3.2, and to assess whether the observed decadal trends in the 21st century are related to the long-term trends of the atmosphere, or simply reflect the multidecadal variability of the atmosphere.

3. Results

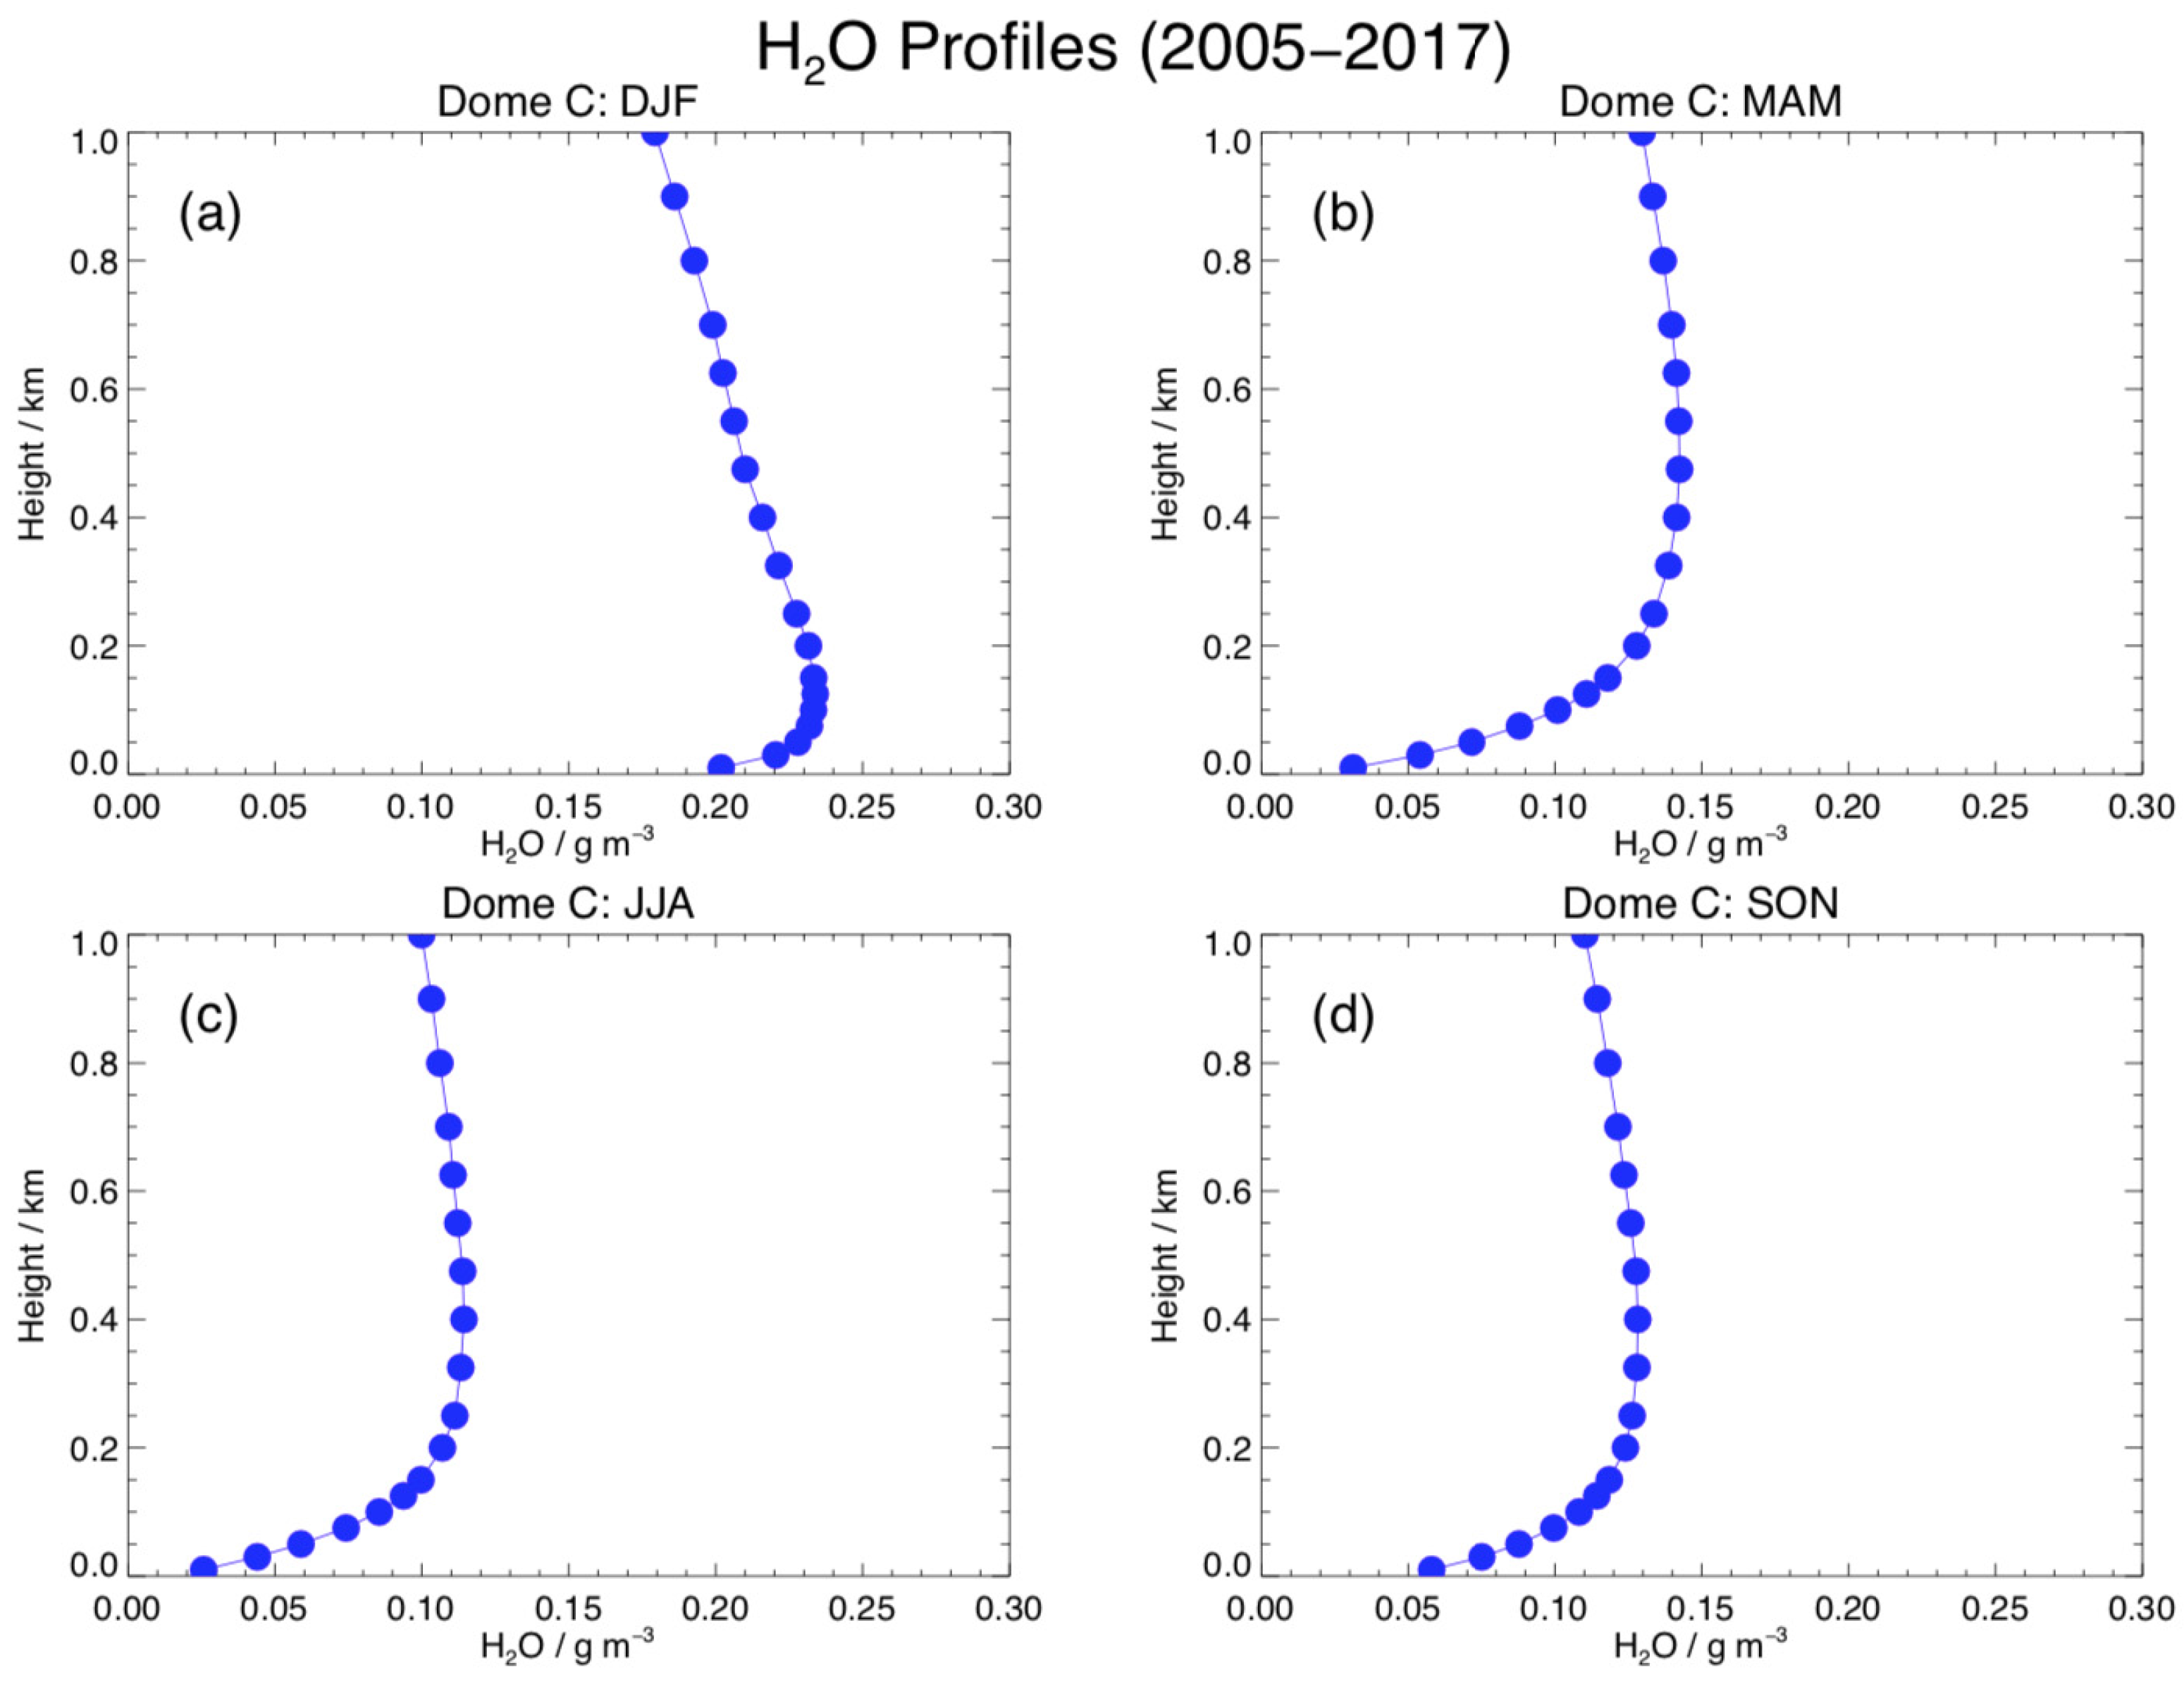
3.1. Seasonal Variations of IWV, Temperature and H2O from 2005–2017

We first calculate the decadal trends in humidity and temperature using the available observational data sets at Dome C. The daily-averaged IWV from HAMSTRAD and radiosondes over the period 2009–2017 and 2005–2017, respectively, are presented in Figure 1. Similarly, the daily-averaged 10-m temperatures from HAMSTRAD and radiosondes over the period 2009–2017 and 2005–2017, respectively, are shown in Figure 2.
Over the periods considered, the annual cycle indicates a dry (~0.1 kg m−2) and cold (~205 K) winter in JJA, followed by a moist (~0.6–0.8 kg m−2) and warm (~250 K) summer in DJF, consistent with numerous studies (e.g., [15,35]). In summertime, the atmosphere can be very humid, with observed IWV reaching daily averages greater than 1.0 kg m−2, and sometimes as high as 1.7 kg m−2, such as in 2010–2011, 2013–2014 and 2016–2017. The atmosphere was also observed to be occasionally quite warm (~255 K), such as in 2010–2011 and 2013–2014. We note that (1) the IWV intra-seasonal variability is much greater in summer (standard deviation of ±0.5 kg m−2) than in winter (±0.2 kg m−2); and (2) the temperature intra-seasonal variability is greater in winter (±10 K) than in summer (±5 K). The intra-seasonal changes in temperature and H2O at 10 m were consistent with each other seasonally (i.e., the lowest and highest variability was observed on the same season for both variables). However, the 10-m temperature and IWV did not demonstrate this consistency as the intra-seasonal variability of IWV is mainly governed by the H2O variability around 100–200 m, where the maximum in water vapor occurs. The annual cycle of IWV is highly correlated to that of temperature, which is not surprising since [36] already underlined the high correlation coefficient between H2O and temperature below 800 m altitude, with R varying from 0.70 to 0.95, depending on the season considered. On average, the atmosphere is slightly wetter in HAMSTRAD observations than in the radiosonde data by 0.05–0.10 kg m−2 (8–15%). This difference in the observations is related to the well-documented dry bias of the radiosondes already observed and commented on in [33]. Note that this bias has not been removed in the present study. The high variability in the summertime IWV can be partially caused by the long-range transport of warm and wet air masses originating from the mid-latitudes, which is more frequent in summer than in winter [21]. In Antarctica, near-surface observations of temperature and water vapor are more accessible than vertical profiles. It is thus crucial to verify whether the time evolution of IWV can be derived from the time evolution of near-surface temperature and/or water vapor.
In order to lessen the intra-seasonal variability of the data, we seasonally-averaged the radiosonde observations from 2005–2017. For each of the four seasons, we calculated the vertical profile of the linear Pearson correlation coefficient R between the time series of seasonally averaged IWV and either temperature (RT-IWV) (Figure 3) or H2O (RH2O-IWV) (Figure 4) from the radiosonde data. On average, from 100 to 1000 m, RT-IWV is constant with height, with maxima in autumn (March, April, May—MAM) and winter (JJA) ranging from 0.90–0.95, and minima in spring (September, October, November—SON) and summer (DJF) ranging from 0.75–0.85. In summer, there is not much variation in RT-IWV in the lowest kilometer of the atmosphere with values between 0.67 and 0.8. However, below 100 m, RT-IWV decreases to ~0.70 at the lowest observational level (10 m) in all seasons but spring (~0.60).
On average, from 100 to 1000 m, the correlation coefficient RH2O-IWV (Figure 4) ranges between 0.85–1.0 with the highest values (>0.95) in winter above 400 m, and in spring between 100 and 200 m. Consistent with RT-IWV, RH2O-IWV tends to decrease from 100–200 m to 10 m, with much lower correlations at 10 m than those of RT-IWV except in summer (0.90): 0.75 in autumn, 0.45 in spring and 0.35 in winter. The fact that the correlation between IWV and H2O at 10 m is so weak is mostly due to the vertical distribution of H2O (Figure 5) in this region, where there are very low amounts of H2O near the surface. Firstly, at Dome C, the vertical distribution of H2O does not peak at the surface, but around 100–200 m in all seasons, and then dramatically decreases to 10 m (Figure 5). The planetary boundary layer is clearly identified in the seasonally averaged temperature profiles from the surface to about 100–200 m (Figure 6), with greater thermal stratification in winter (18 K/200 m) than in summer (3 K/200 m). Secondly, although summertime H2O at 10 m is close to maximum (~0.20 g m−3), for all other seasons the atmosphere is very dehydrated with 10-m H2O of 0.02–0.06 g m−3, or roughly 50–70% less than the peak value. This is consistent with a surface layer (Figure 6) that is much colder in winter (216 K) than in summer (241 K). Consequently, and contrarily to what is usually utilized in the tropics, the trend in 10-m H2O in the Eastern Plateau of Antarctica at Dome C cannot be considered as a good proxy for the variation of IWV in the atmosphere. The near-surface measurement of water vapor is thus of limited interest in the region when studying the water cycle. In contrast, the saturation vapor pressure increases with temperature, and thus the water-holding capacity of air correlates with temperature (see e.g., [36]). Combining this thermodynamic relationship between H2O and temperature with the RT-IWV values at 10 m that are, on average, higher than the RH2O-IWV values at 10 m, it can be seen that the near-surface temperature can be considered as a better proxy of the time evolution of IWV in the Dome C atmosphere than the near-surface water vapor.

3.2. Decadal Trends of IWV, Temperature and H2O in the Early 21st Century

3.2.1. Decadal Trends of IWV and 10-m Temperature

For Table 1, we have calculated the linear decadal trends in IWV (kg m−2 dec−1) and 10-m temperature (K dec−1) from HAMSTRAD observations over the period 2012–2017, and from radiosonde observations over the periods 2012–2017, to align with HAMSTRAD data availability, and 2005–2017, for the entire radiosonde record. The decadal trends in humidity above Dome C in the beginning of the 21st century demonstrate strong seasonality. In all periods and datasets considered, the atmosphere moistens in summer and spring, while it dries in winter and autumn, although the trends are not always statistically significant. The moistening trend is larger in summer (0.04–0.09 kg m−2 dec−1) than in spring (0.01–0.02 kg m−2 dec−1) within both observational datasets. The moistening trend is only significant in summer for the radiosonde data over the period 2005–2017 (0.08 ± 0.06 kg m−2 dec−1). The drying trend is of the same order of magnitude in winter and autumn (from −0.04 to −0.08 kg m−2 dec−1) in both datasets, but is only significant in the radiosonde data in winter (−0.05 ± 0.03 kg m−2 dec−1) and autumn (−0.04 ± 0.03 kg m−2 dec−1) from 2005–2017, and in autumn only (−0.08 ± 0.07 kg m−2 dec−1) from 2012–2017. Note that, in the HAMSTRAD data set, no significant moistening or drying trend is found, probably due to 1) the short period under consideration (6 years) producing a 1-σ error much larger than those in the data with longer time period (13 years); and 2) for the 6-year time period, a 1-σ error in the IWV measurements that is 1–2 times larger in the HAMSTRAD data than in the radiosonde observations. If we now consider the annual average IWV (column labelled as ‘Year’ in Table 1), the linear trends are only significant in the radiosonde data over the shortest period 2012–2017: −0.07 ± 0.05 kg m−2 dec−1.
As expected from the high correlation between temperature and humidity (see previous section), the decadal trends in temperature above Dome C in the beginning of the 21st century are also seasonally-dependent (Table 1). For all periods and datasets evaluated, a warming trend is observed in summer whereas a cooling trend is found in winter and autumn. In spring, the radiosonde observations show a cooling trend (−0.30 ± 1.35 K dec−1 in 2005–2017 and −1.99 ± 3.24 K dec−1 in 2012–2017), and thus disagree with HAMSTRAD, which shows a warming trend (2.69 ± 11.42 K dec−1). However, none of these trends are significant. The summer warming trend (0.8–8.7 K dec−1) is greater in the HAMSTRAD data than in the radiosonde data by a factor 2–8, but is only significant in the radiosonde data sets over the period 2005–2017 (1.08 ± 0.55 K dec−1). The cooling trend is 1.2–4 times greater in autumn and winter over the 2012–2017 period than over the 2005–2017 period: in autumn, from −2.4 K dec−1 in 2005–2017 to −3.2 to −10.0 K dec−1 in 2012–2017 and, in winter, from −5.1 K dec−1 in 2005–2017 to −7.1 to −9.9 K dec−1 in 2012–2017. The radiosonde data always indicate significant cooling, regardless of the analysis period considered in autumn (−2.43 ± 1.16 K dec−1 in 2005–2017 and −10.03 ± 1.30 K dec−1 in 2012–2017) and in winter (−5.06 ± 1.99 K dec−1 in 2005–2017 and −9.88 ± 3.70 K dec−1 in 2012–2017) whilst, in HAMSTRAD, only the winter season yields a significant cooling trend (−7.10 ± 3.15 K dec−1 in 2012–2017). If we now consider annual averages (column labelled as ‘Year’ in Table 1), all the data show a significant linear trend but not of the same sign. A warming trend is identified in the HAMSTRAD data (1.33 ± 0.96 K dec−1), while a cooling trend is calculated from radiosondes over both 2012–2017 and 2005–2017: −2.65 ± 0.72 and −1.80 ± 1.54 K dec−1, respectively. The fact that HAMSTRAD and radiosonde trends are opposite over the same period (2012–2017) might be a consequence of the much larger summer warming trend in HAMSTRAD than in the radiosondes (a factor ~10), combined with the much larger autumn cooling trend in the radiosondes than in HAMSTRAD (a factor ~3). This discrepancy calls for further investigation into the sensitivity and variability of the two data sources in the future.
To summarize, over 2005–2017, the radiosonde observations at Dome C show a drying trend of the atmosphere with a cooling trend in winter and autumn, and a moistening trend of the atmosphere combined with a warming trend in summer. All trends in these three seasons are statistically significant. However, in spring, no significant trends were found. The trend significance increases with the length of the period considered. In HAMSTRAD, over 2012–2017, a significant cooling trend was only found in winter. Compared with the trends obtained at the South Pole station [24] in 2005–2018, we note that those obtained at Dome C: 1) agree with South Pole trends in summer highlighting a warming trend (1.3 K dec−1) at the surface and a moistening trend (0.02 g kg−1 dec−1) for heights below 5 km but 2) disagree in autumn and winter, since a warming (0.6 and 1.5 K dec−1, respectively) and moistening trend (<0.02 g kg−1 dec−1) for heights below 5 km were observed at South Pole, whereas the opposite was seen in the Dome C data. For the trend in annual averages, only radiosonde data averaged over 2012–2017 show significant cooling and drying of the atmosphere.

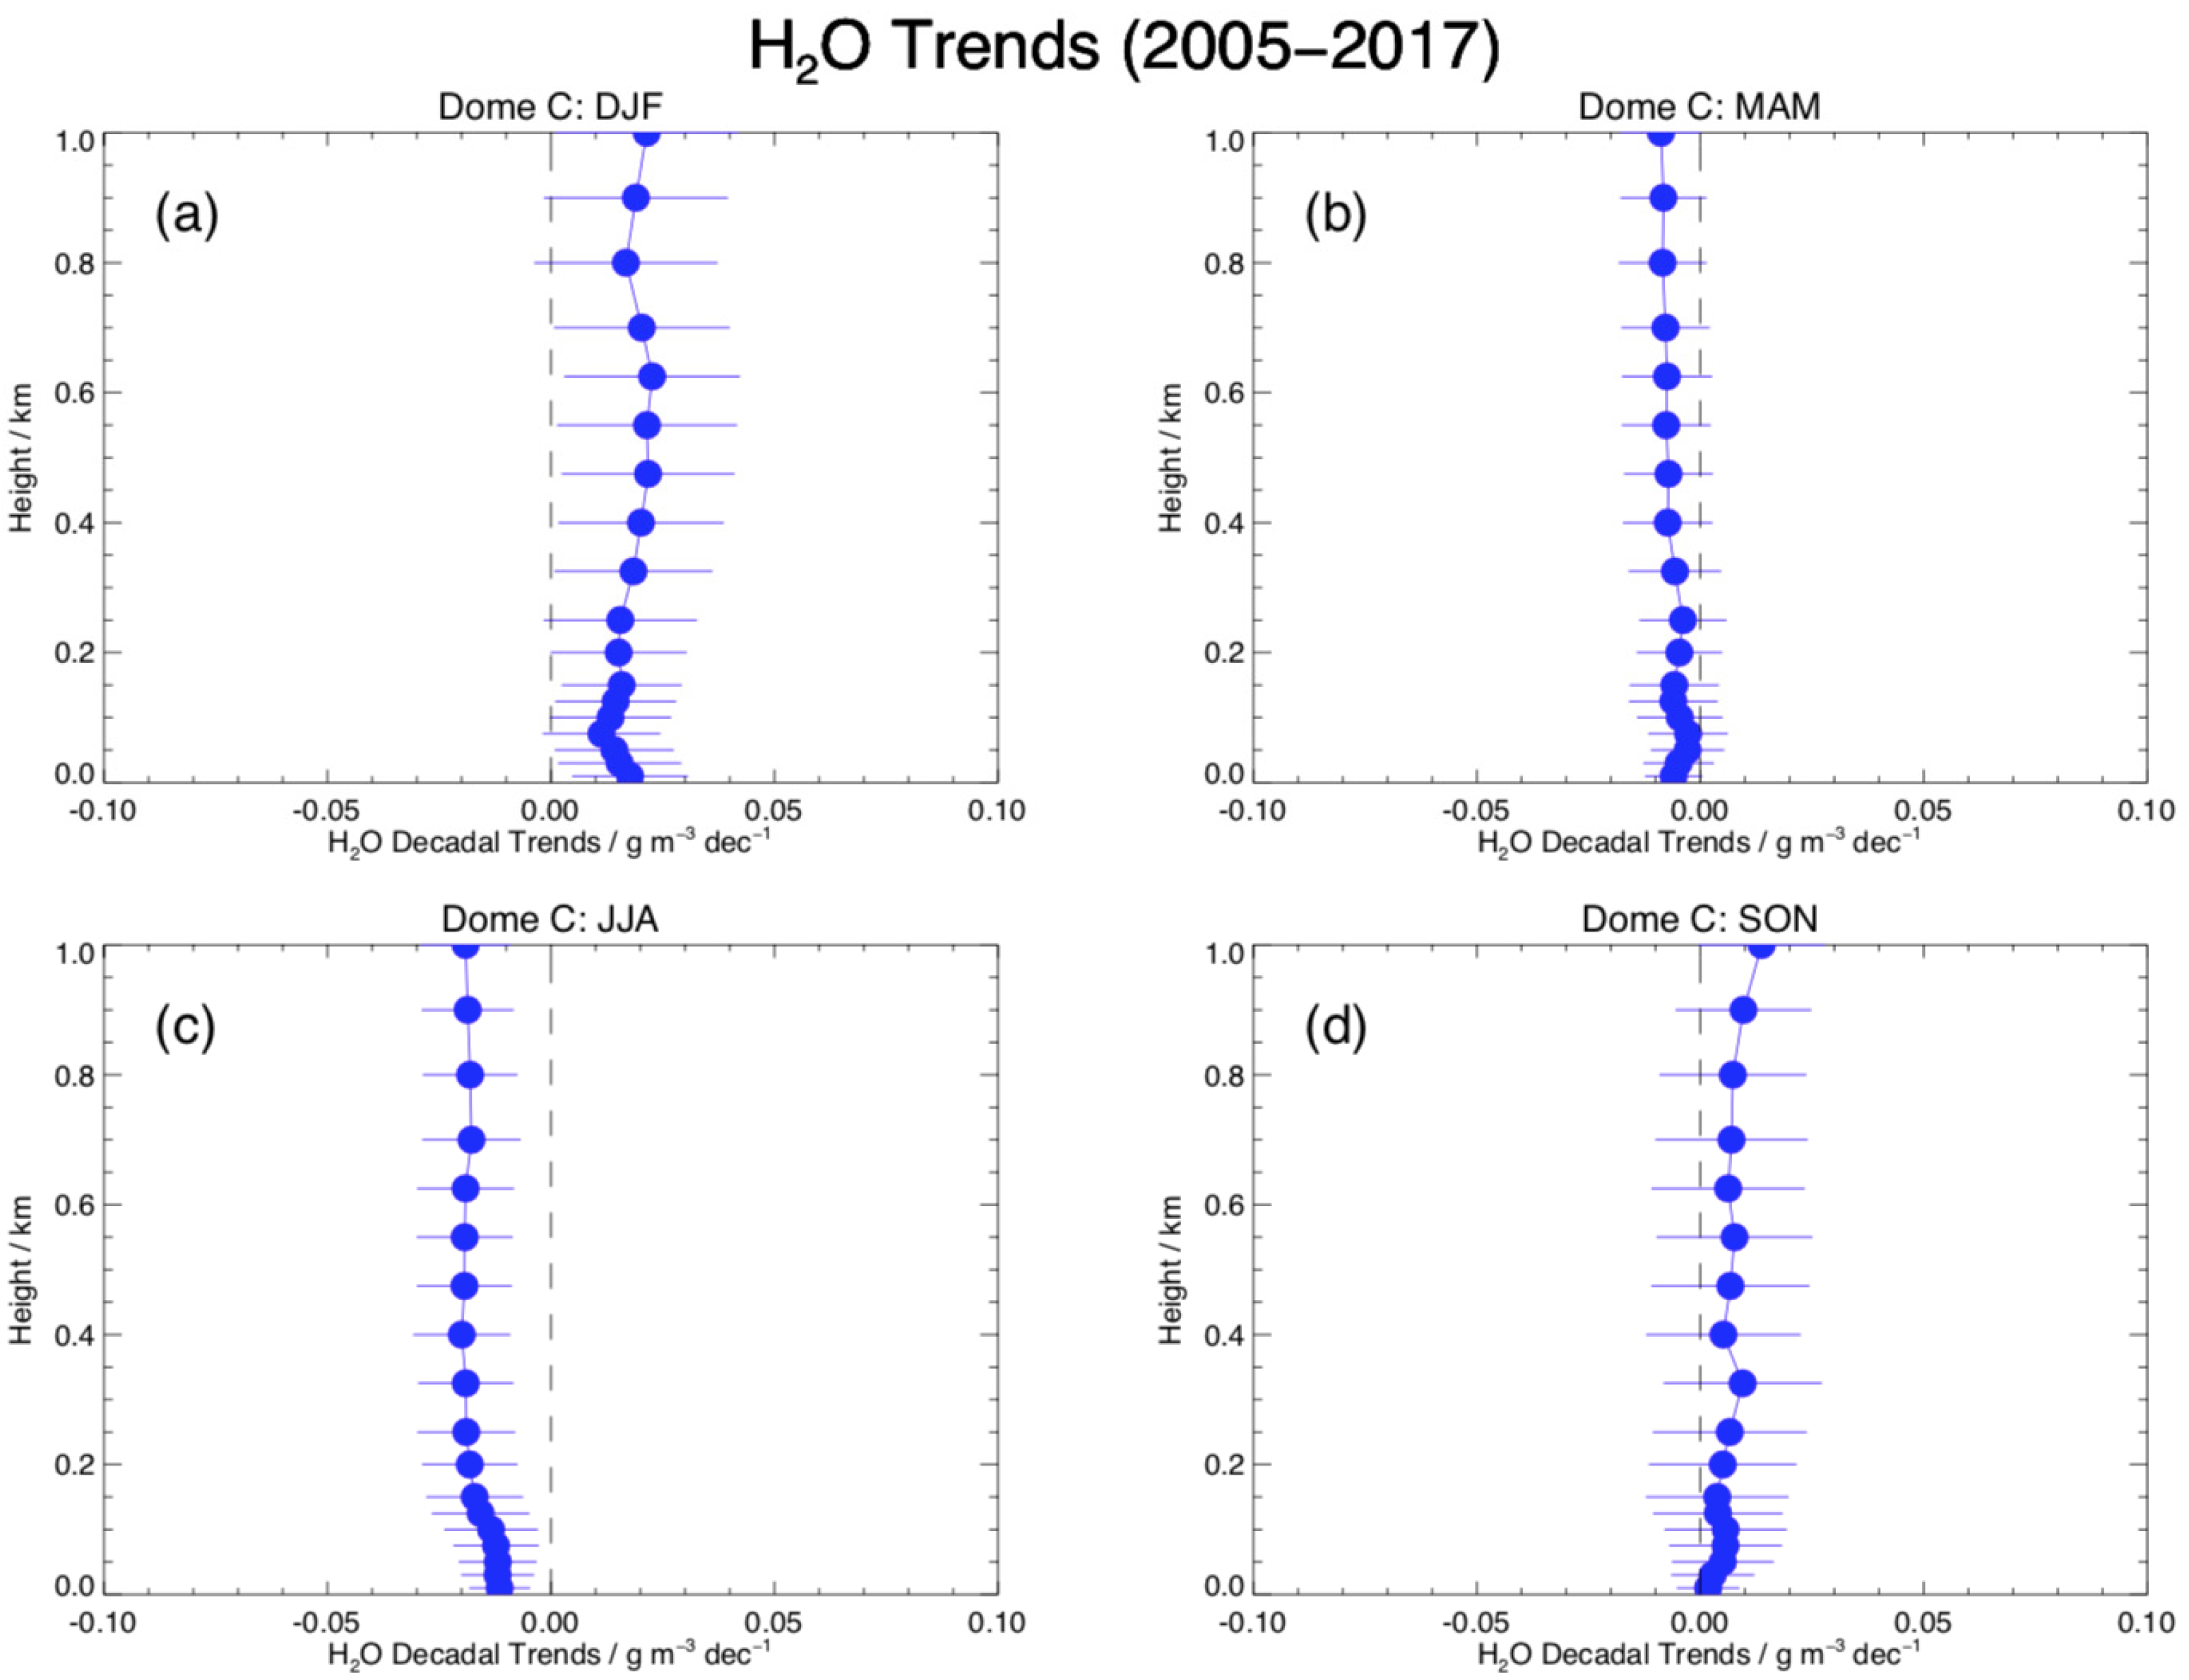
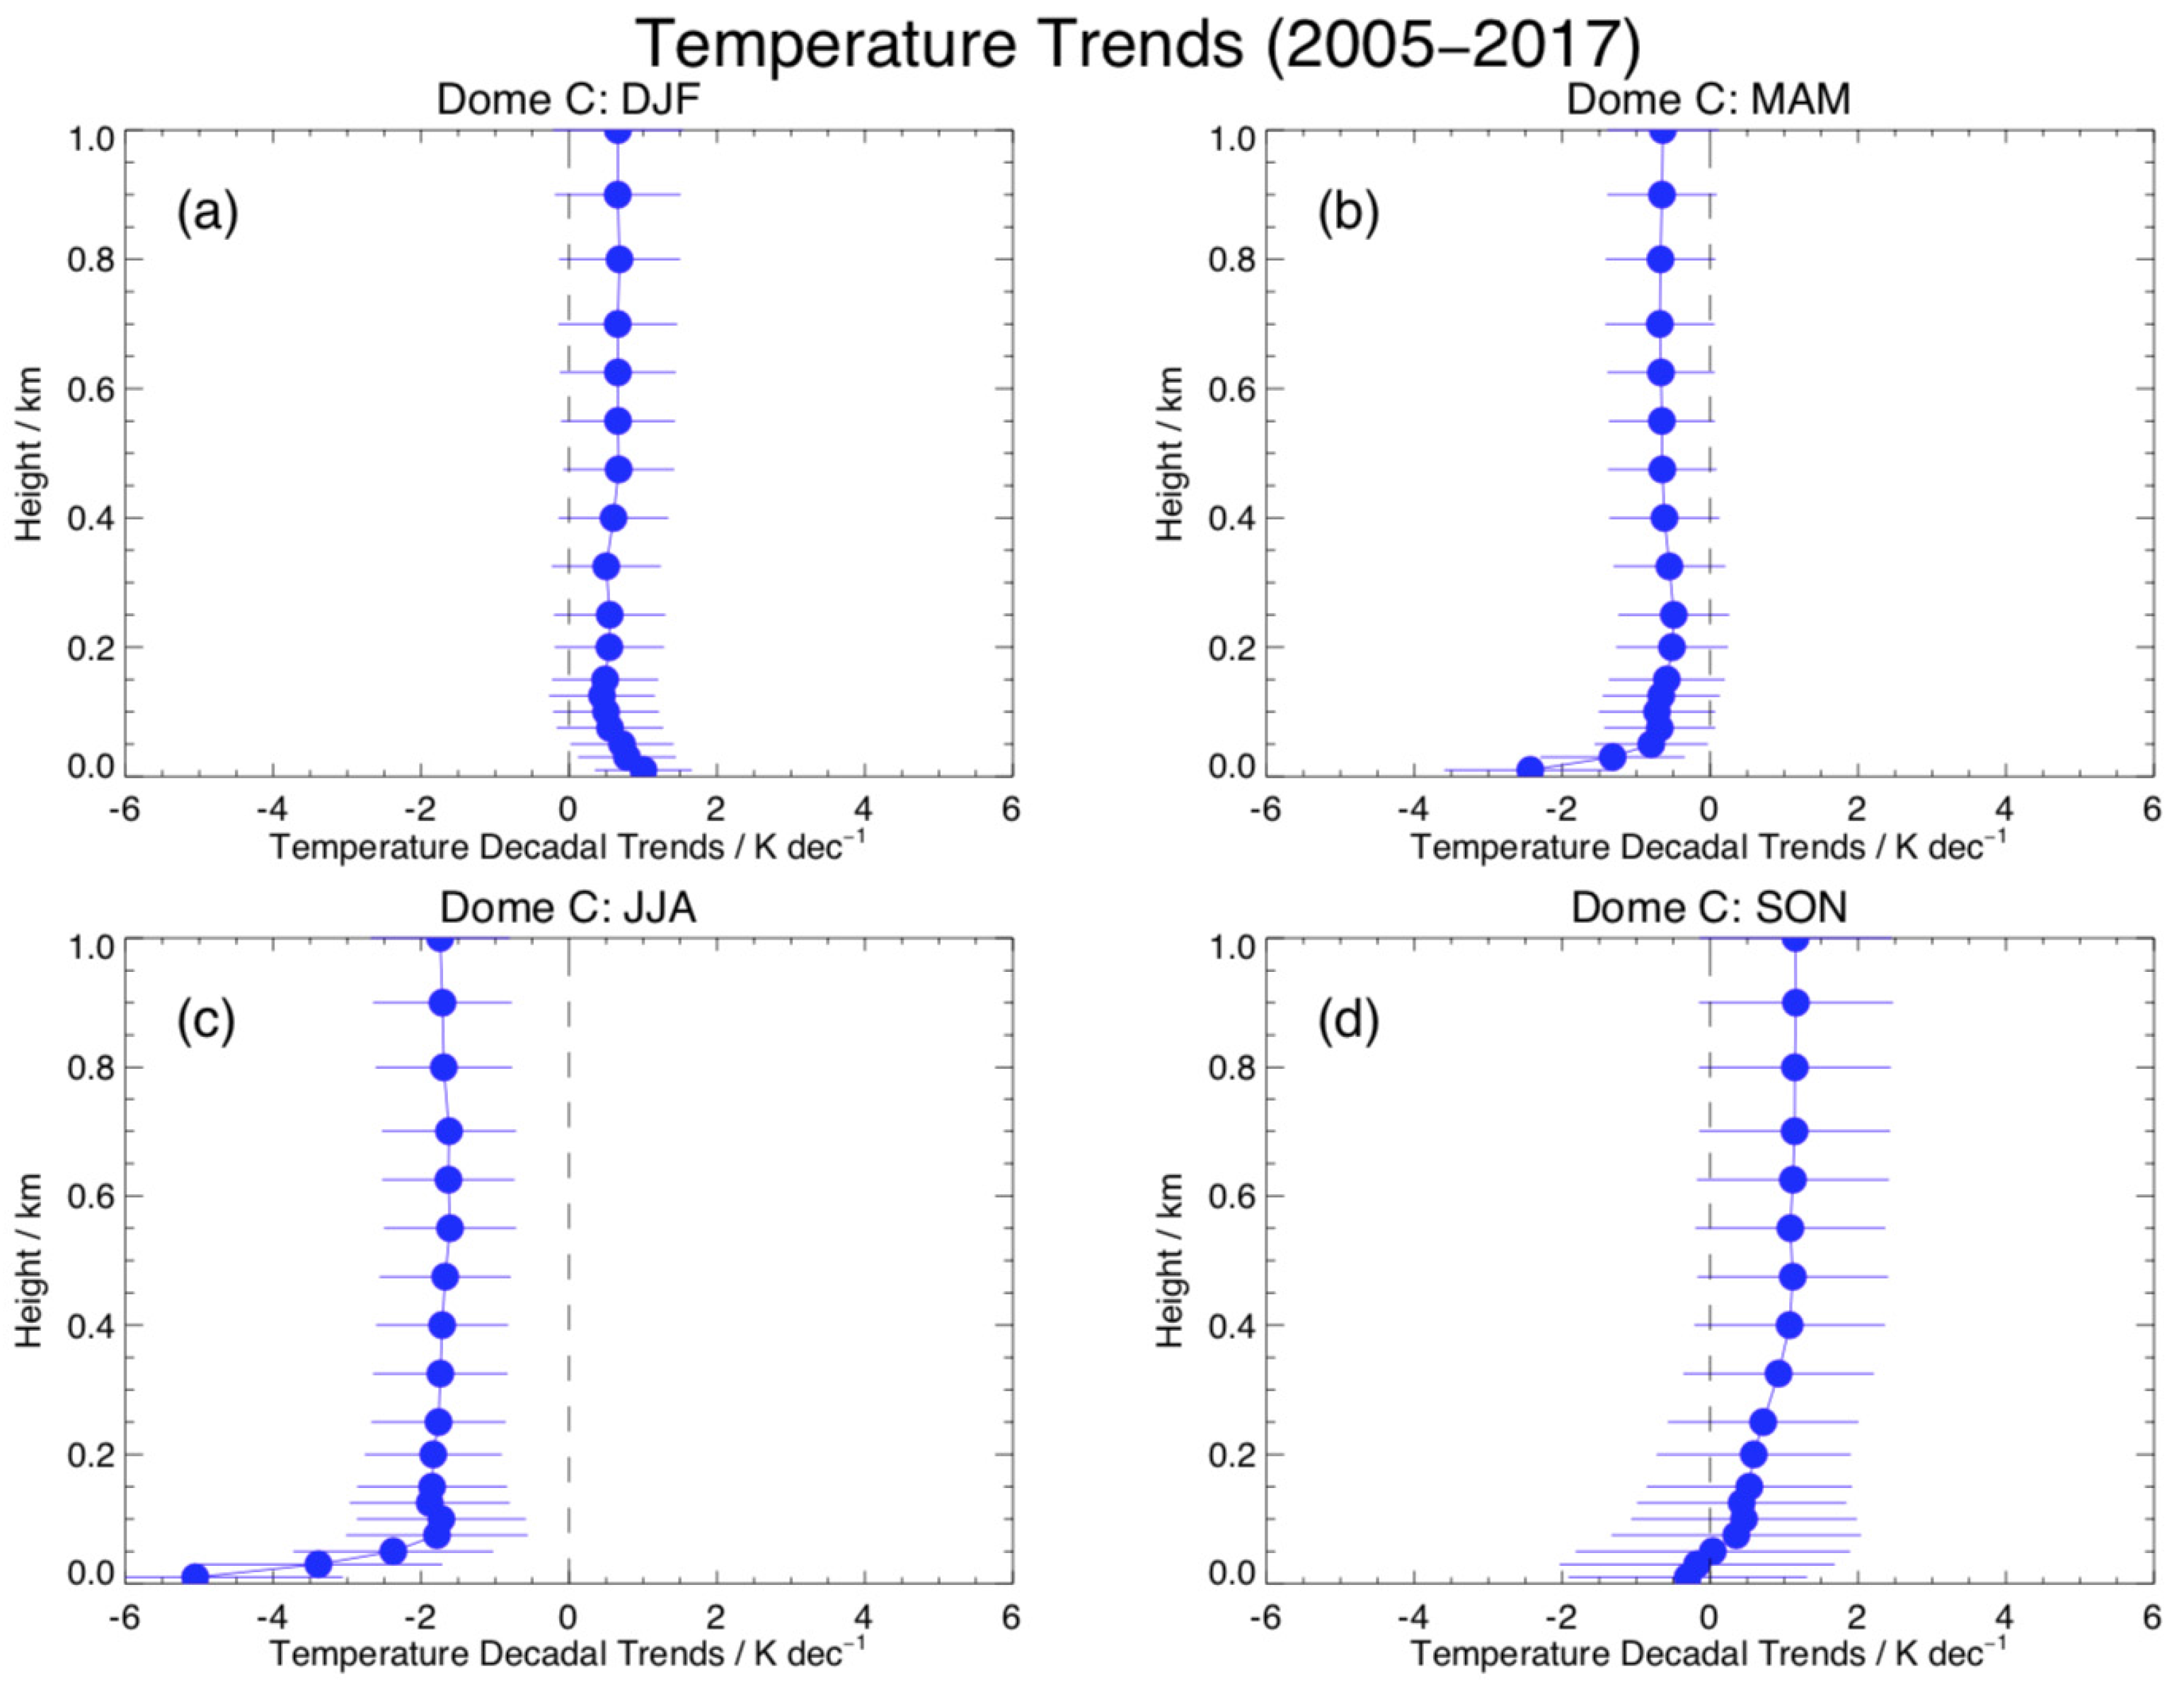
3.2.2. Decadal Trends in H2O and Temperature Profiles

The decadal trends in H2O and temperature seasonal averages as a function of height above the surface have been explored using the radiosonde observations from 2005–2017 (Figure 7 and Figure 8, respectively). Note that, in contrast to IWV, the vertical distribution of the HAMSTRAD temperature (0–10 km) and absolute humidity (0–4 km) is subject to known biases [32] that prevent the calculation of trends along the vertical for HAMSTRAD. Consistent with the results obtained for IWV, the H2O decadal trends (Figure 7) exhibit: (1) significant drying in winter (−0.20 ± 0.10 g m−3 dec−1) with a less intense trend in autumn (−0.10 ± 0.10 g m−3 dec−1), and (2) significant moistening in summer (+0.15–0.20 ± 0.10 g m−3 dec−1), although it is less intense in spring (about +0.05 ± 0.10 g m−3 dec−1). Note that, below 100 m, the absolute trends in H2O are weaker than those above 100 m, regardless of season.
The decadal trends in temperature (Figure 8) below 100 m mimic the trends observed at 10 m (Table 1) in all seasons except spring, although the changes are larger closer to the surface than at 100 m. There is warming in summer, cooling in autumn and winter, and either cooling or warming in spring below or above 100 m, respectively. Above 100 m, the decadal trends appear to be constant along the vertical for all seasons. In summer, above 100 m, an insignificant warming of 0.50 ± 0.75 K dec−1 is observed whilst, below 100 m, the warming is significant (1.00–0.80 ± 0.75 K dec−1). In winter, the cooling observed above 100 m is significant (−1.80 ± 0.80 K dec−1), as is the cooling below (−2.0 to −5.0 ± 0.80 K dec−1). In autumn, above 100 m, there is cooling (−0.75 ± 0.75 K dec−1), but only the change below 100 m is significant (from −0.80 to −2.50 ± 0.75 K dec−1). In spring, above 100 m, there is an insignificant warming (0.5–1.0 ± 1.2 K dec−1) whilst below 100 m, there is insignificant cooling −0.5 to 0.0 ± 1.2 K dec−1). Note that analysis of the near-surface (2-m) temperature from the Automated Weather System (AWS) at Dome C (not shown) confirms the results obtained with the radiosondes at 10 m with warming in DJF (1.9 ± 0.7 K dec−1) and SON (0.9 ± 1.0 K dec−1), and cooling in JJA (−2.9 ± 1.7 K dec−1) and MAM (−0.9 ± 1.1 K dec−1).
If we combine the trends obtained at 10 m, along the vertical, and integrated along the vertical, we can state that, over the period 2005–2017, above Dome C: (1) a significant moistening trend associated with a warming trend is calculated in summer; (2) a significant drying trend associated with a significant cooling trend is calculated in autumn and winter; and (3) neither significant moistening/drying nor significant warming/cooling trends are demonstrated in spring. Significant variations in the vertical distribution of temperature and associated decadal trends below 1000 m are well correlated with the transition altitude (100–200 m) between the planetary boundary layer and the free troposphere.

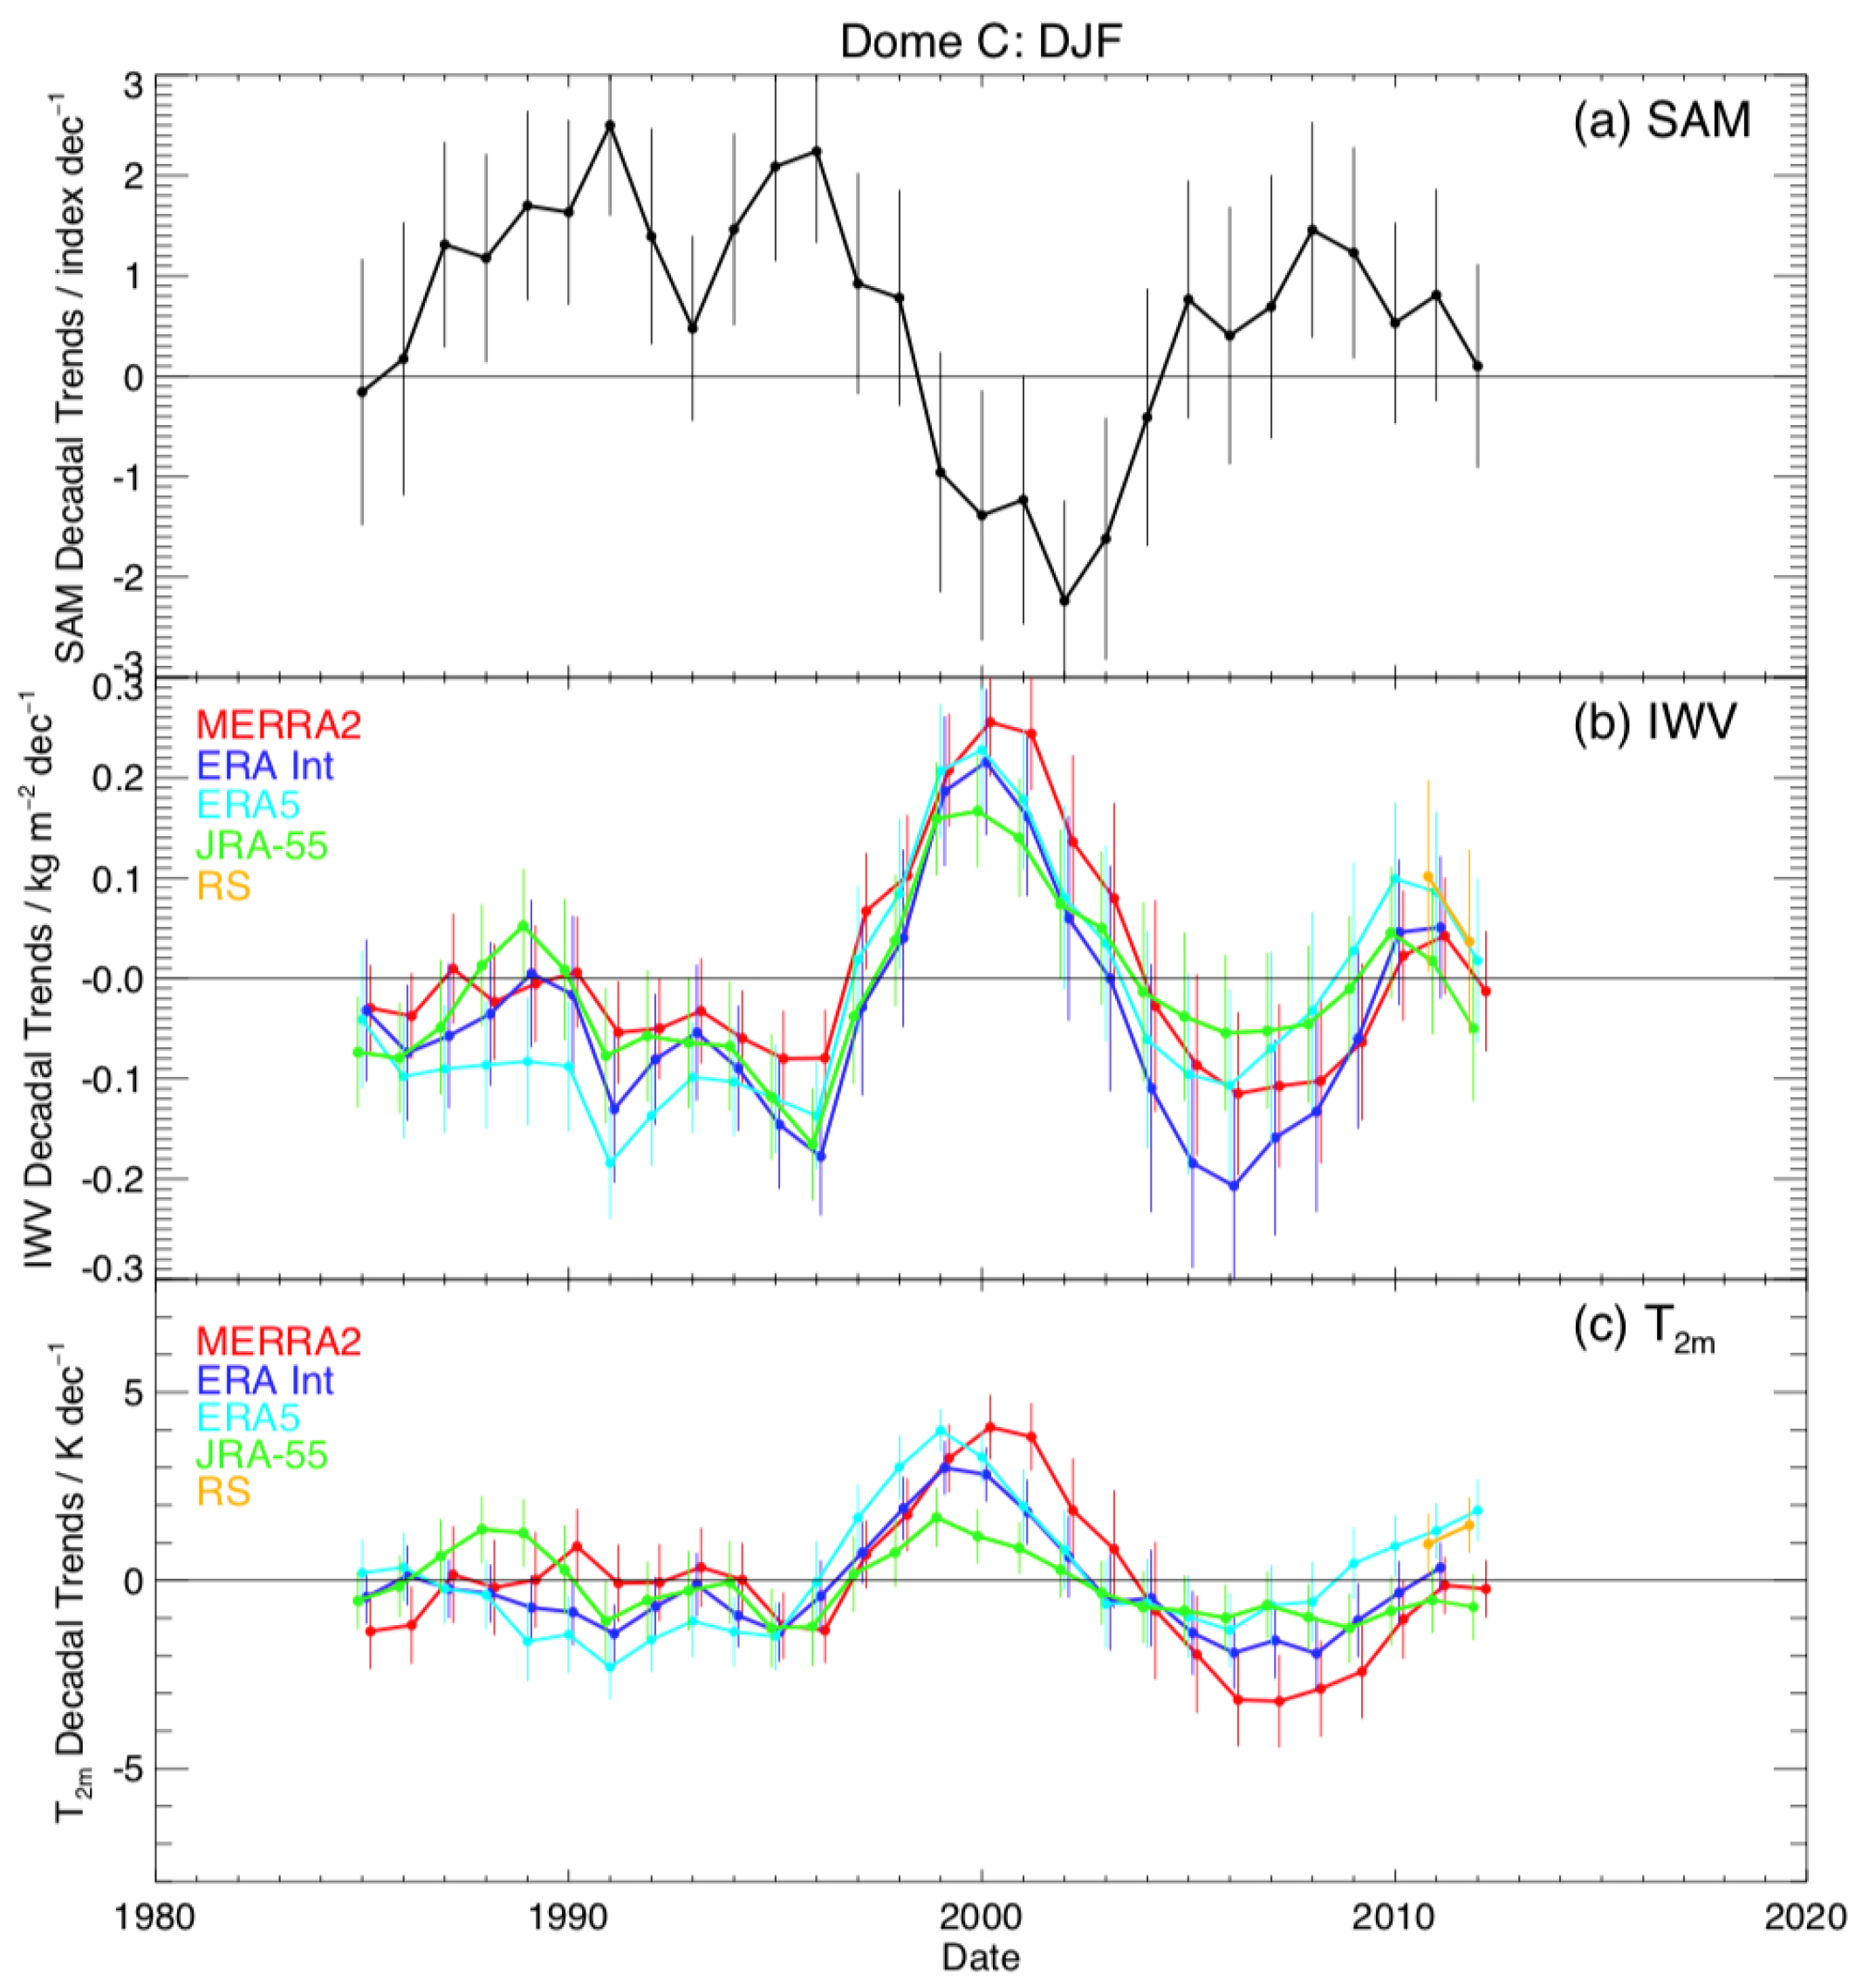
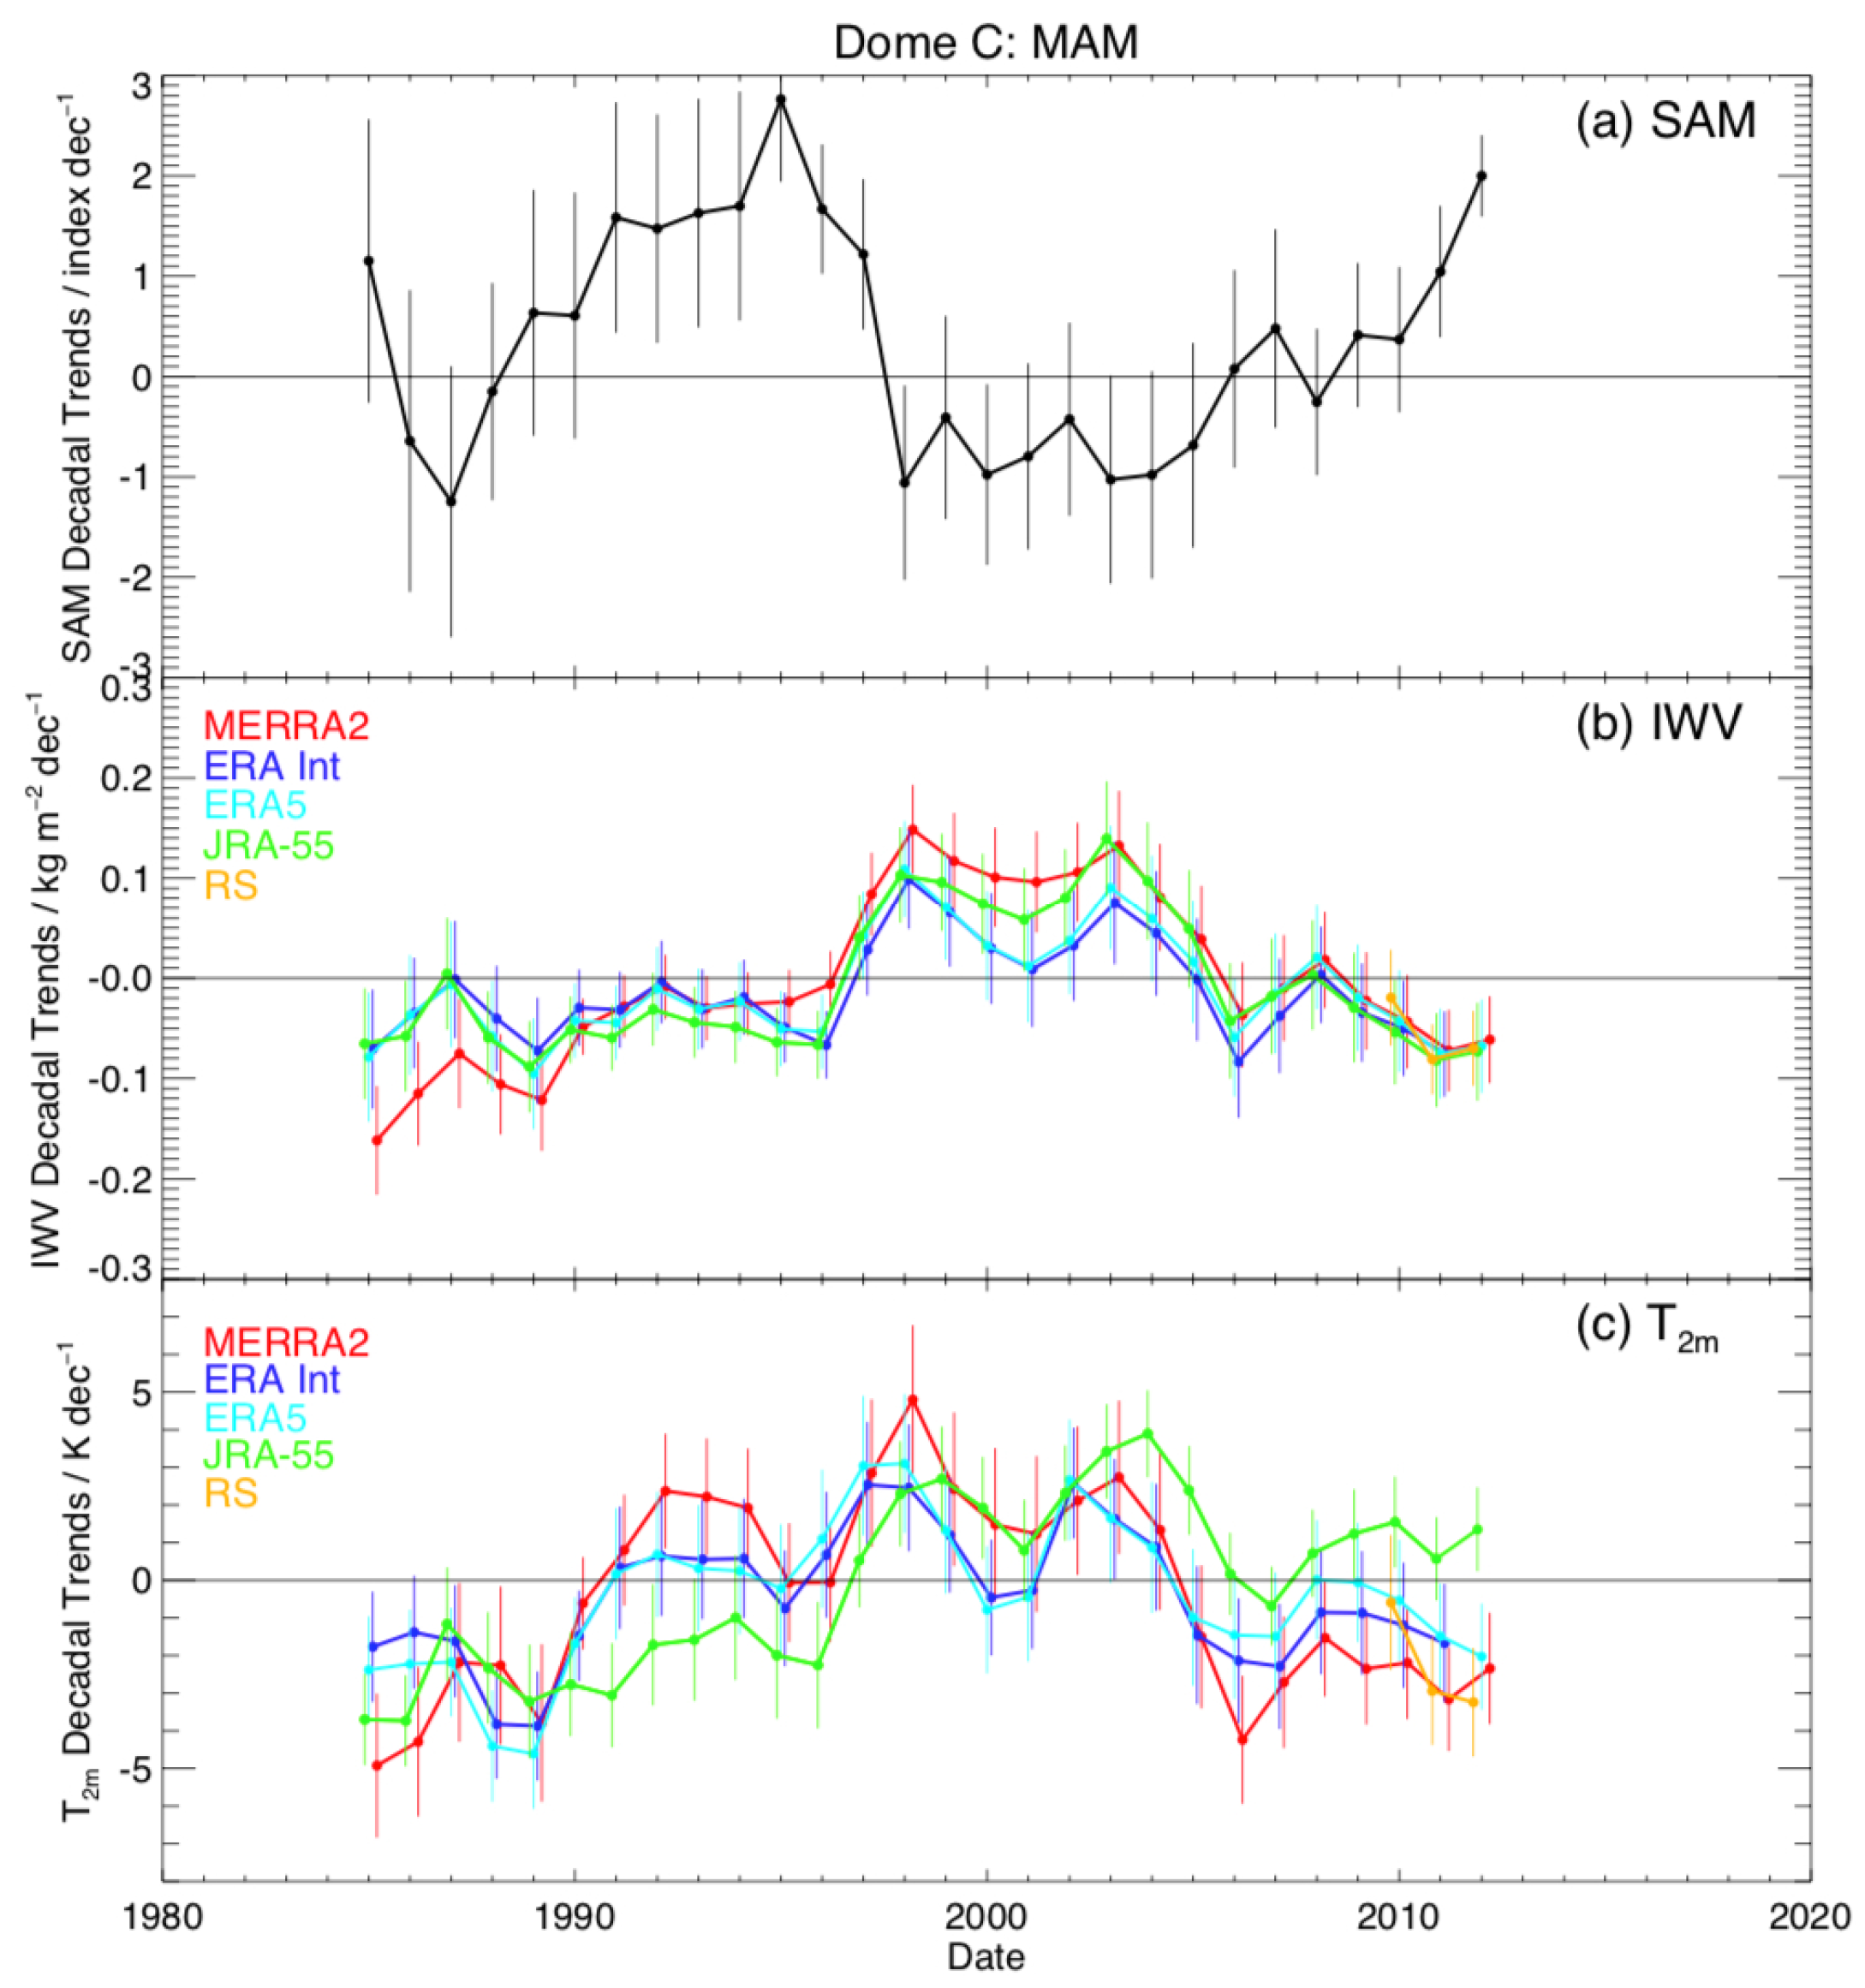
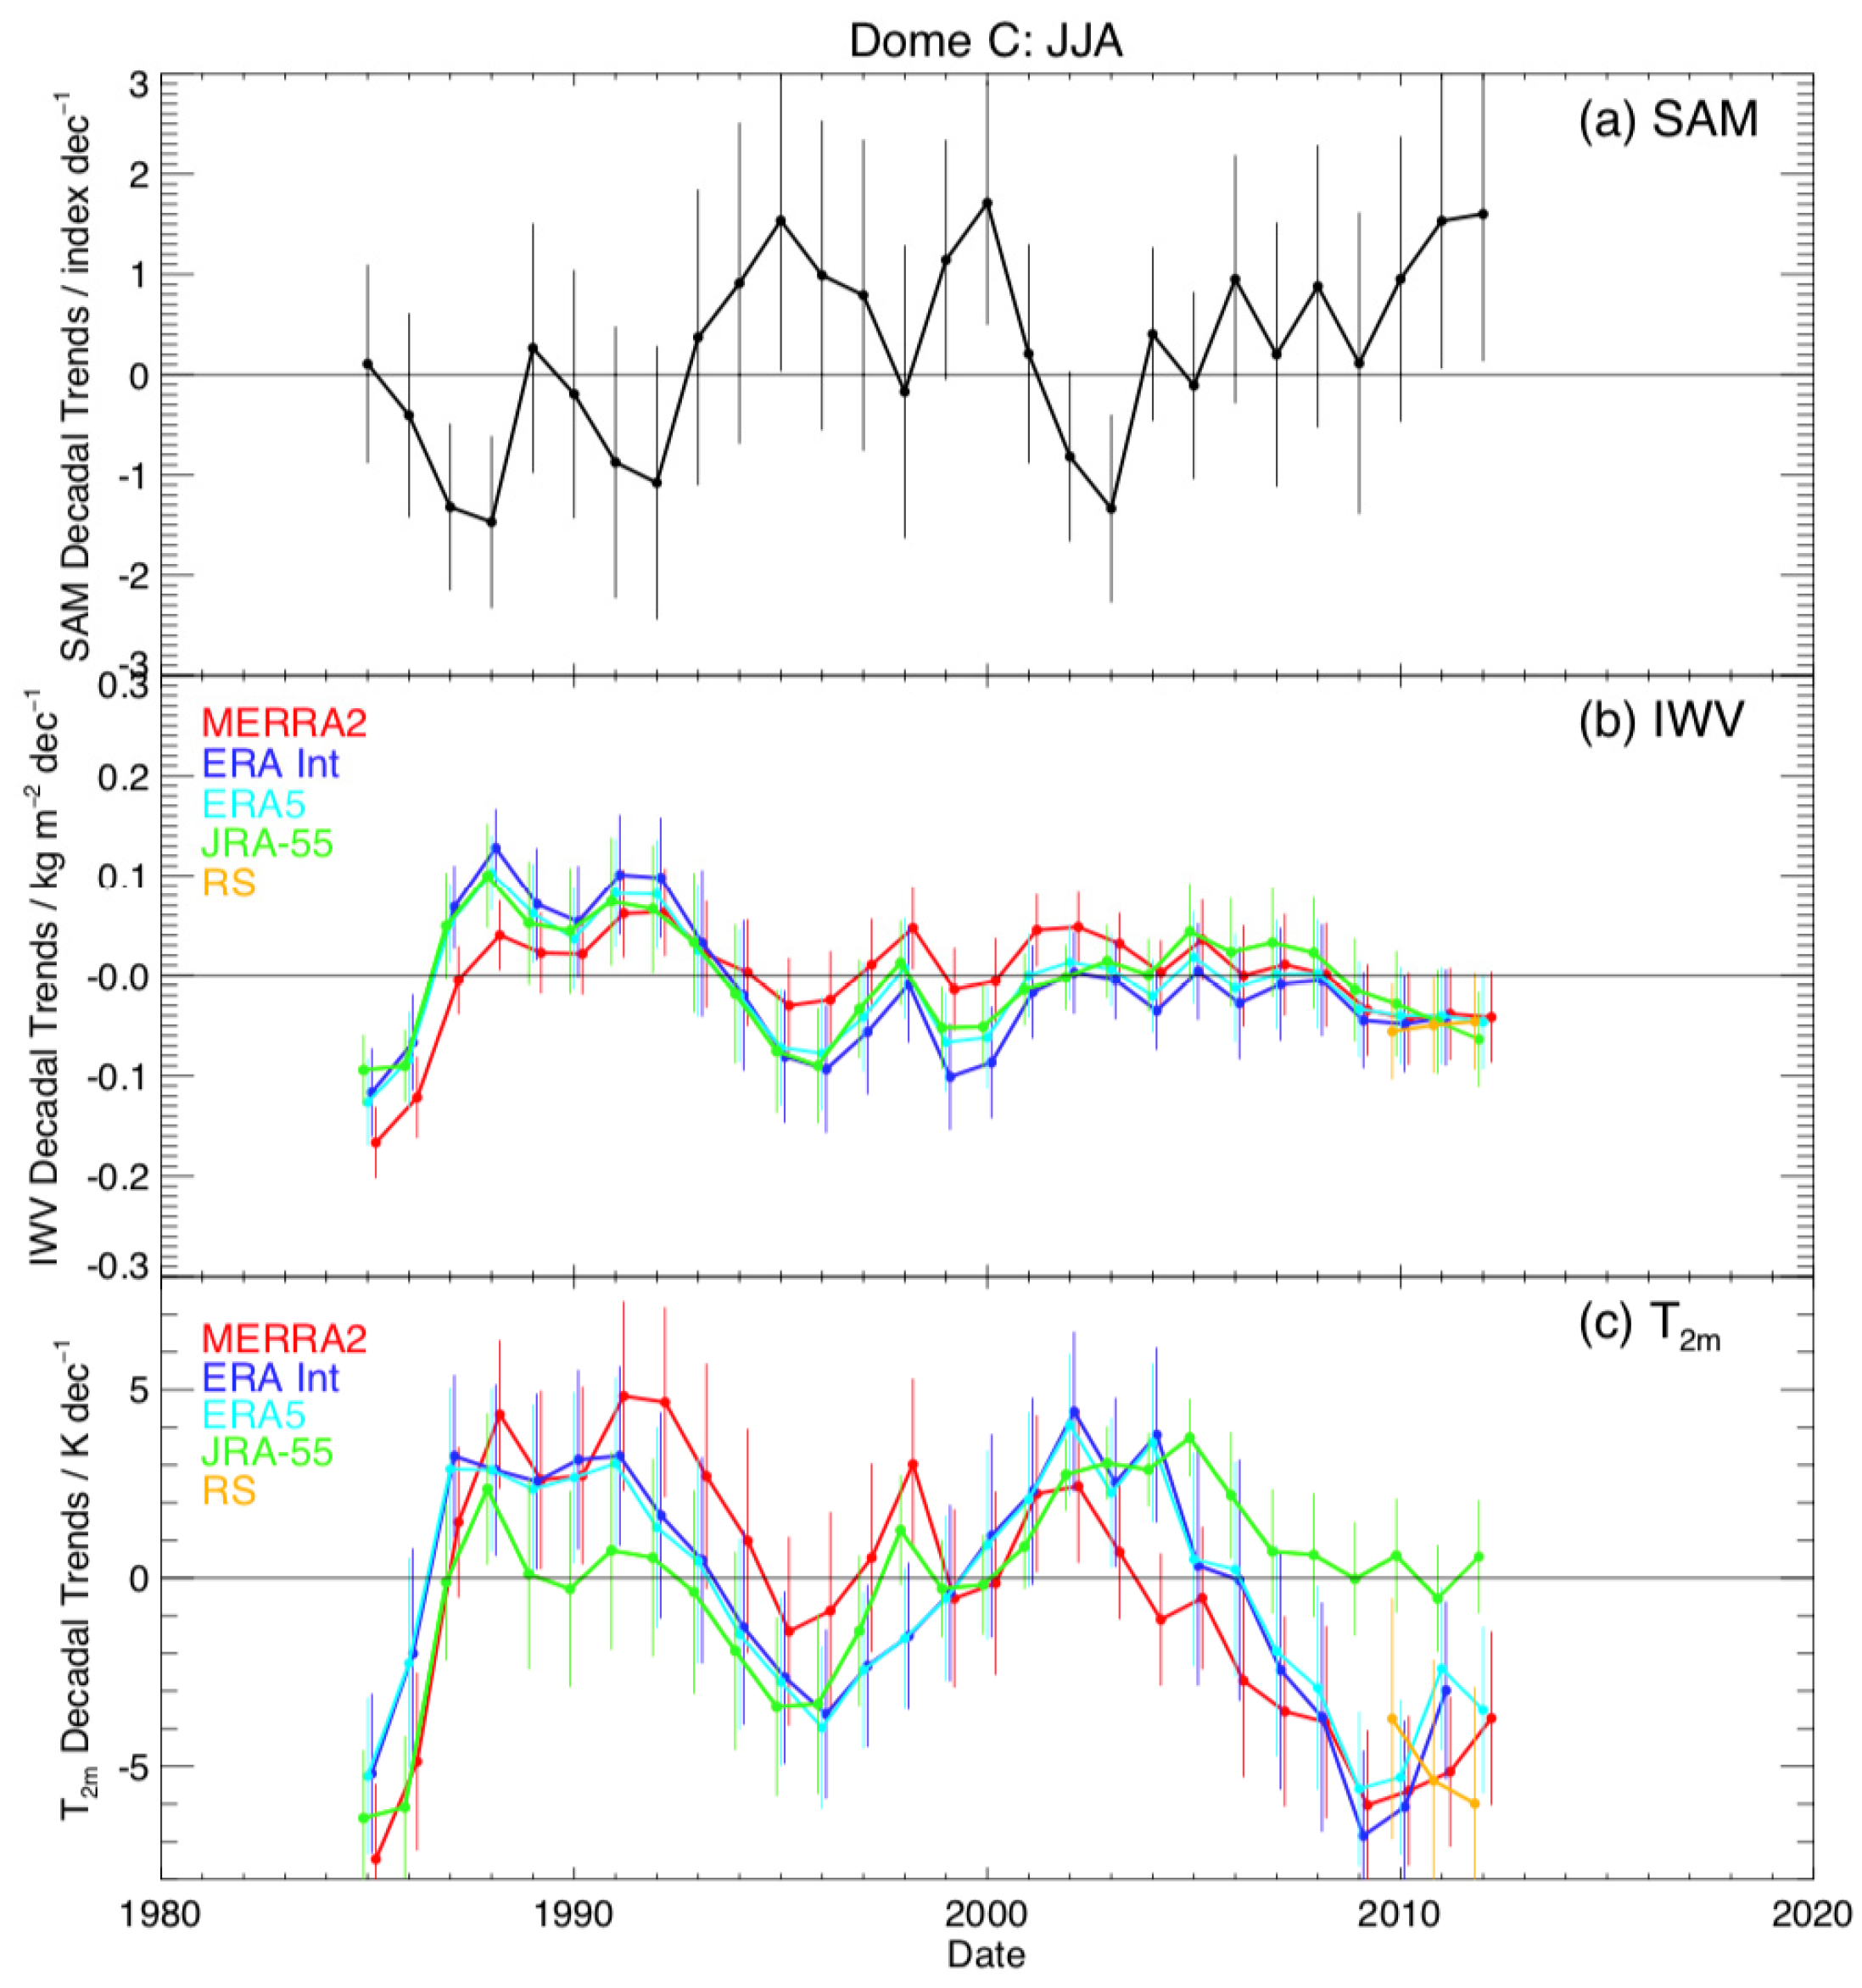
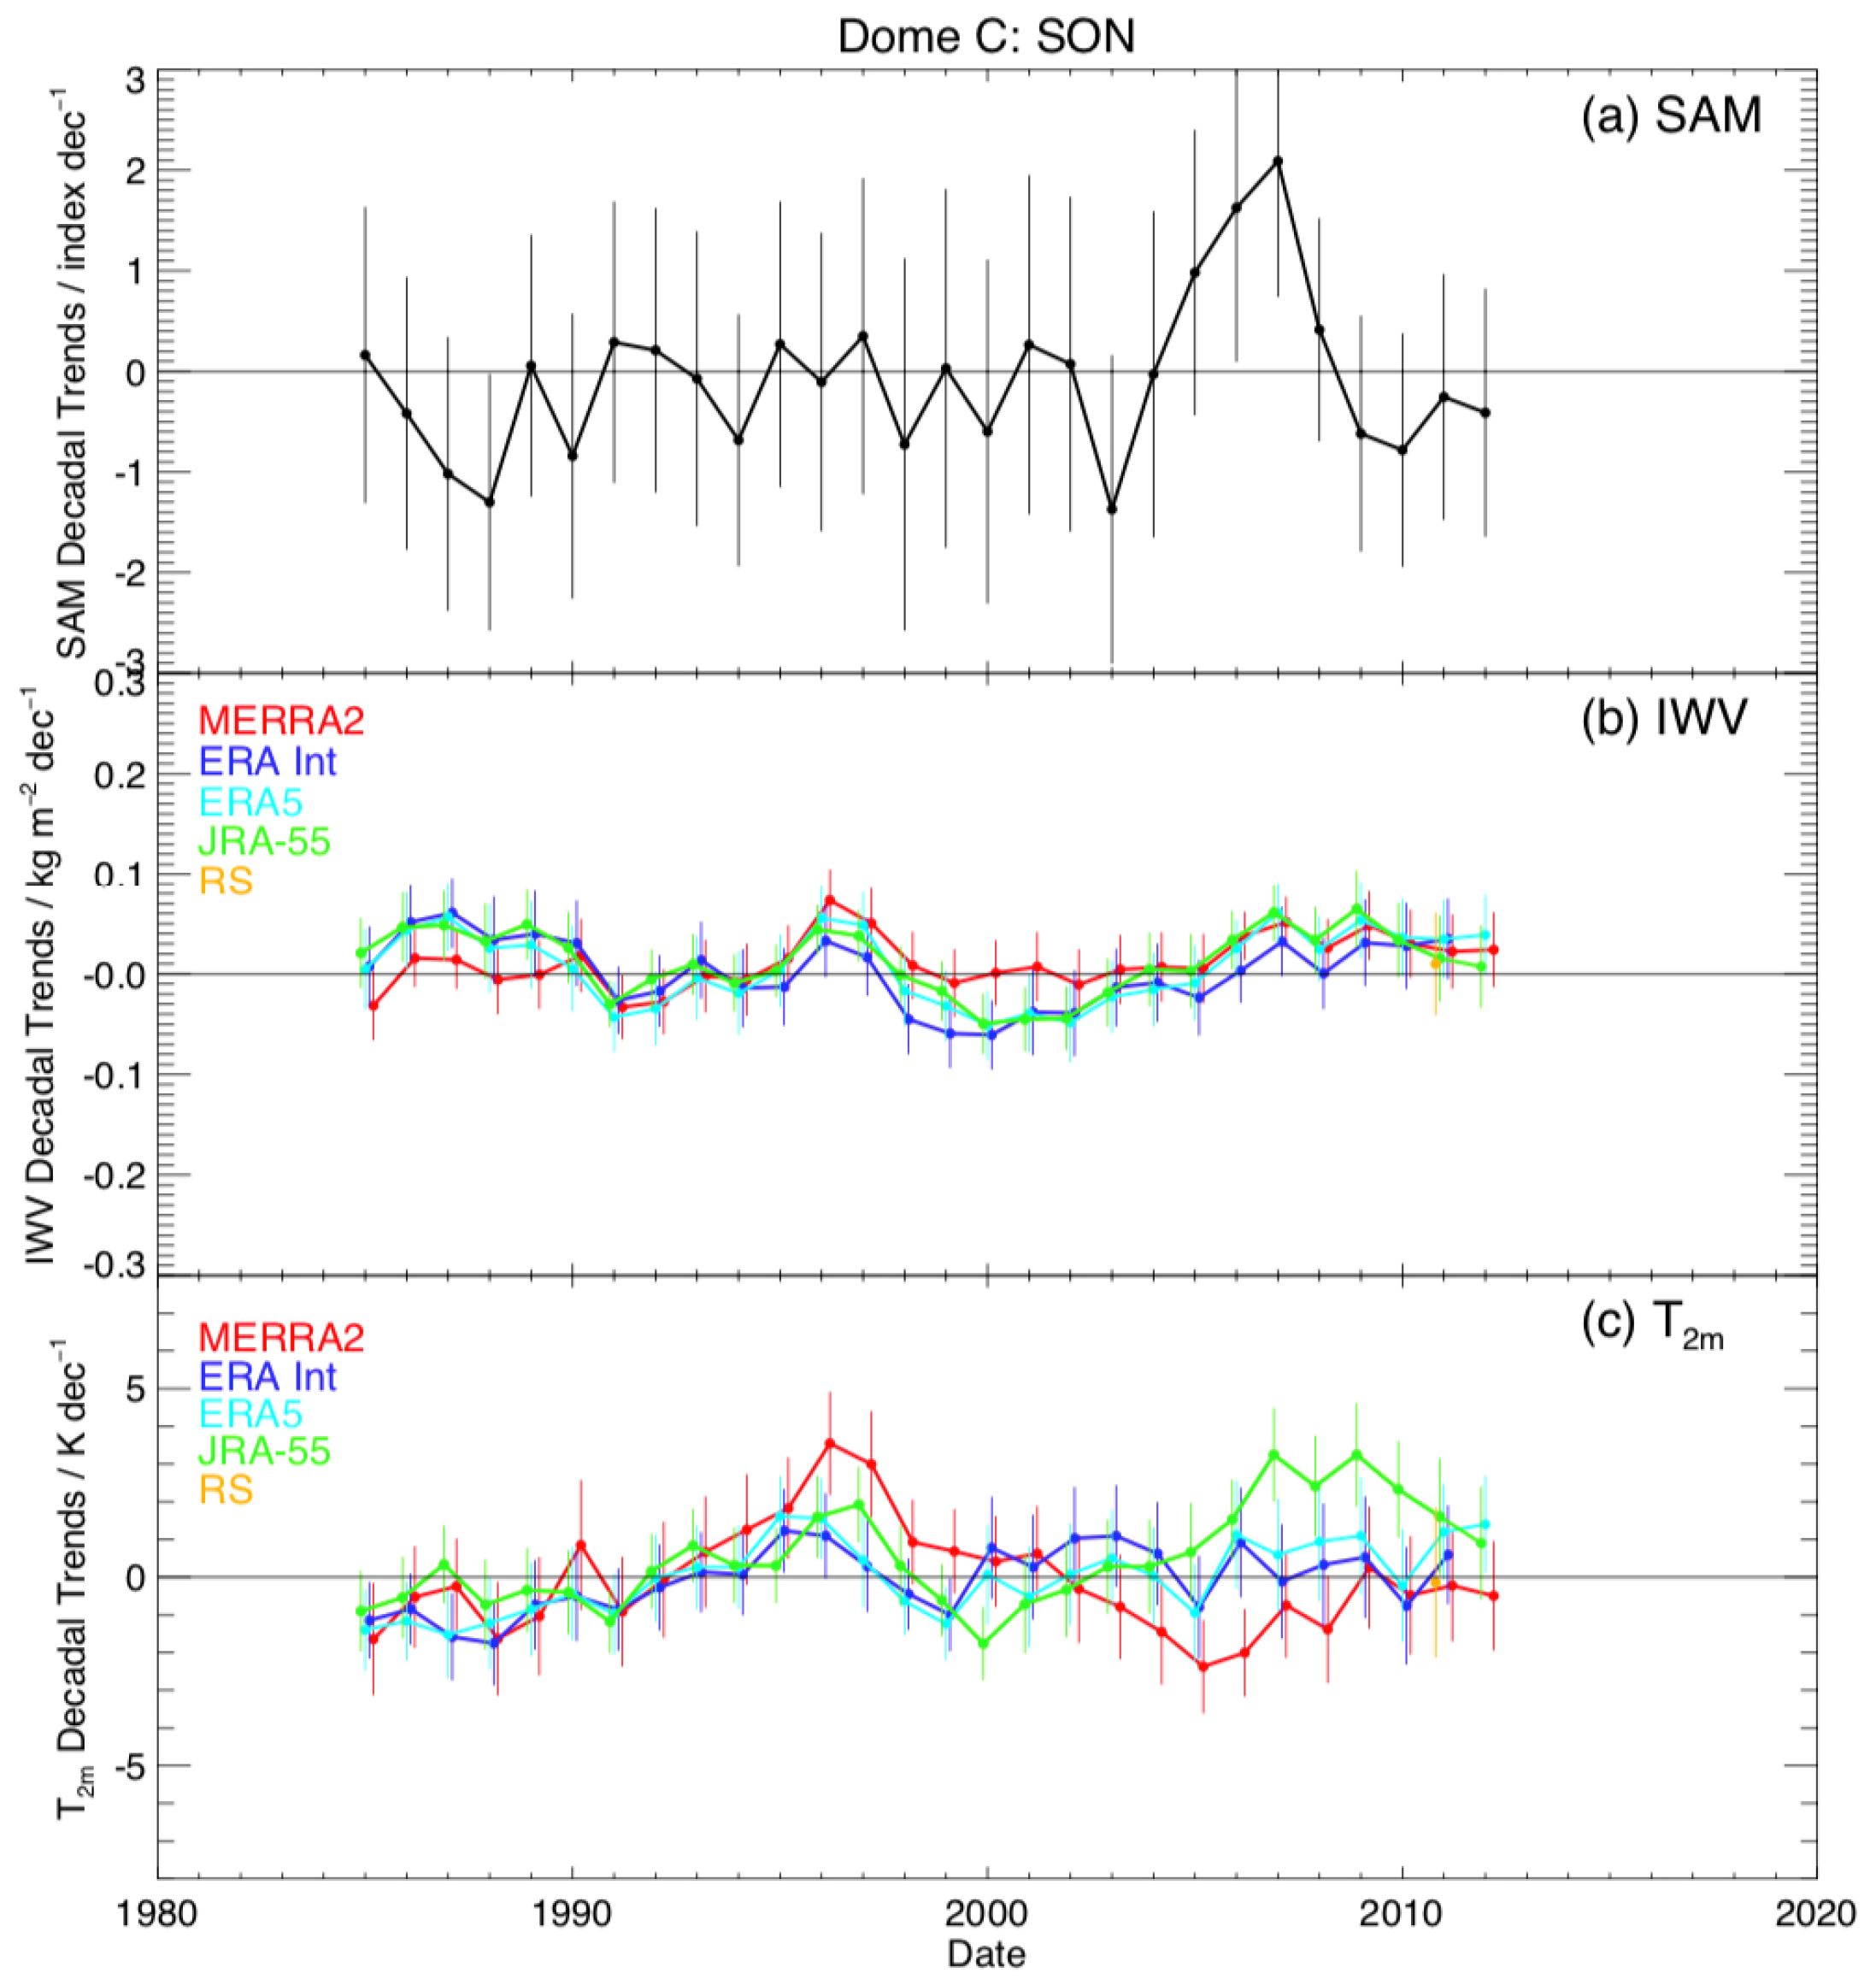
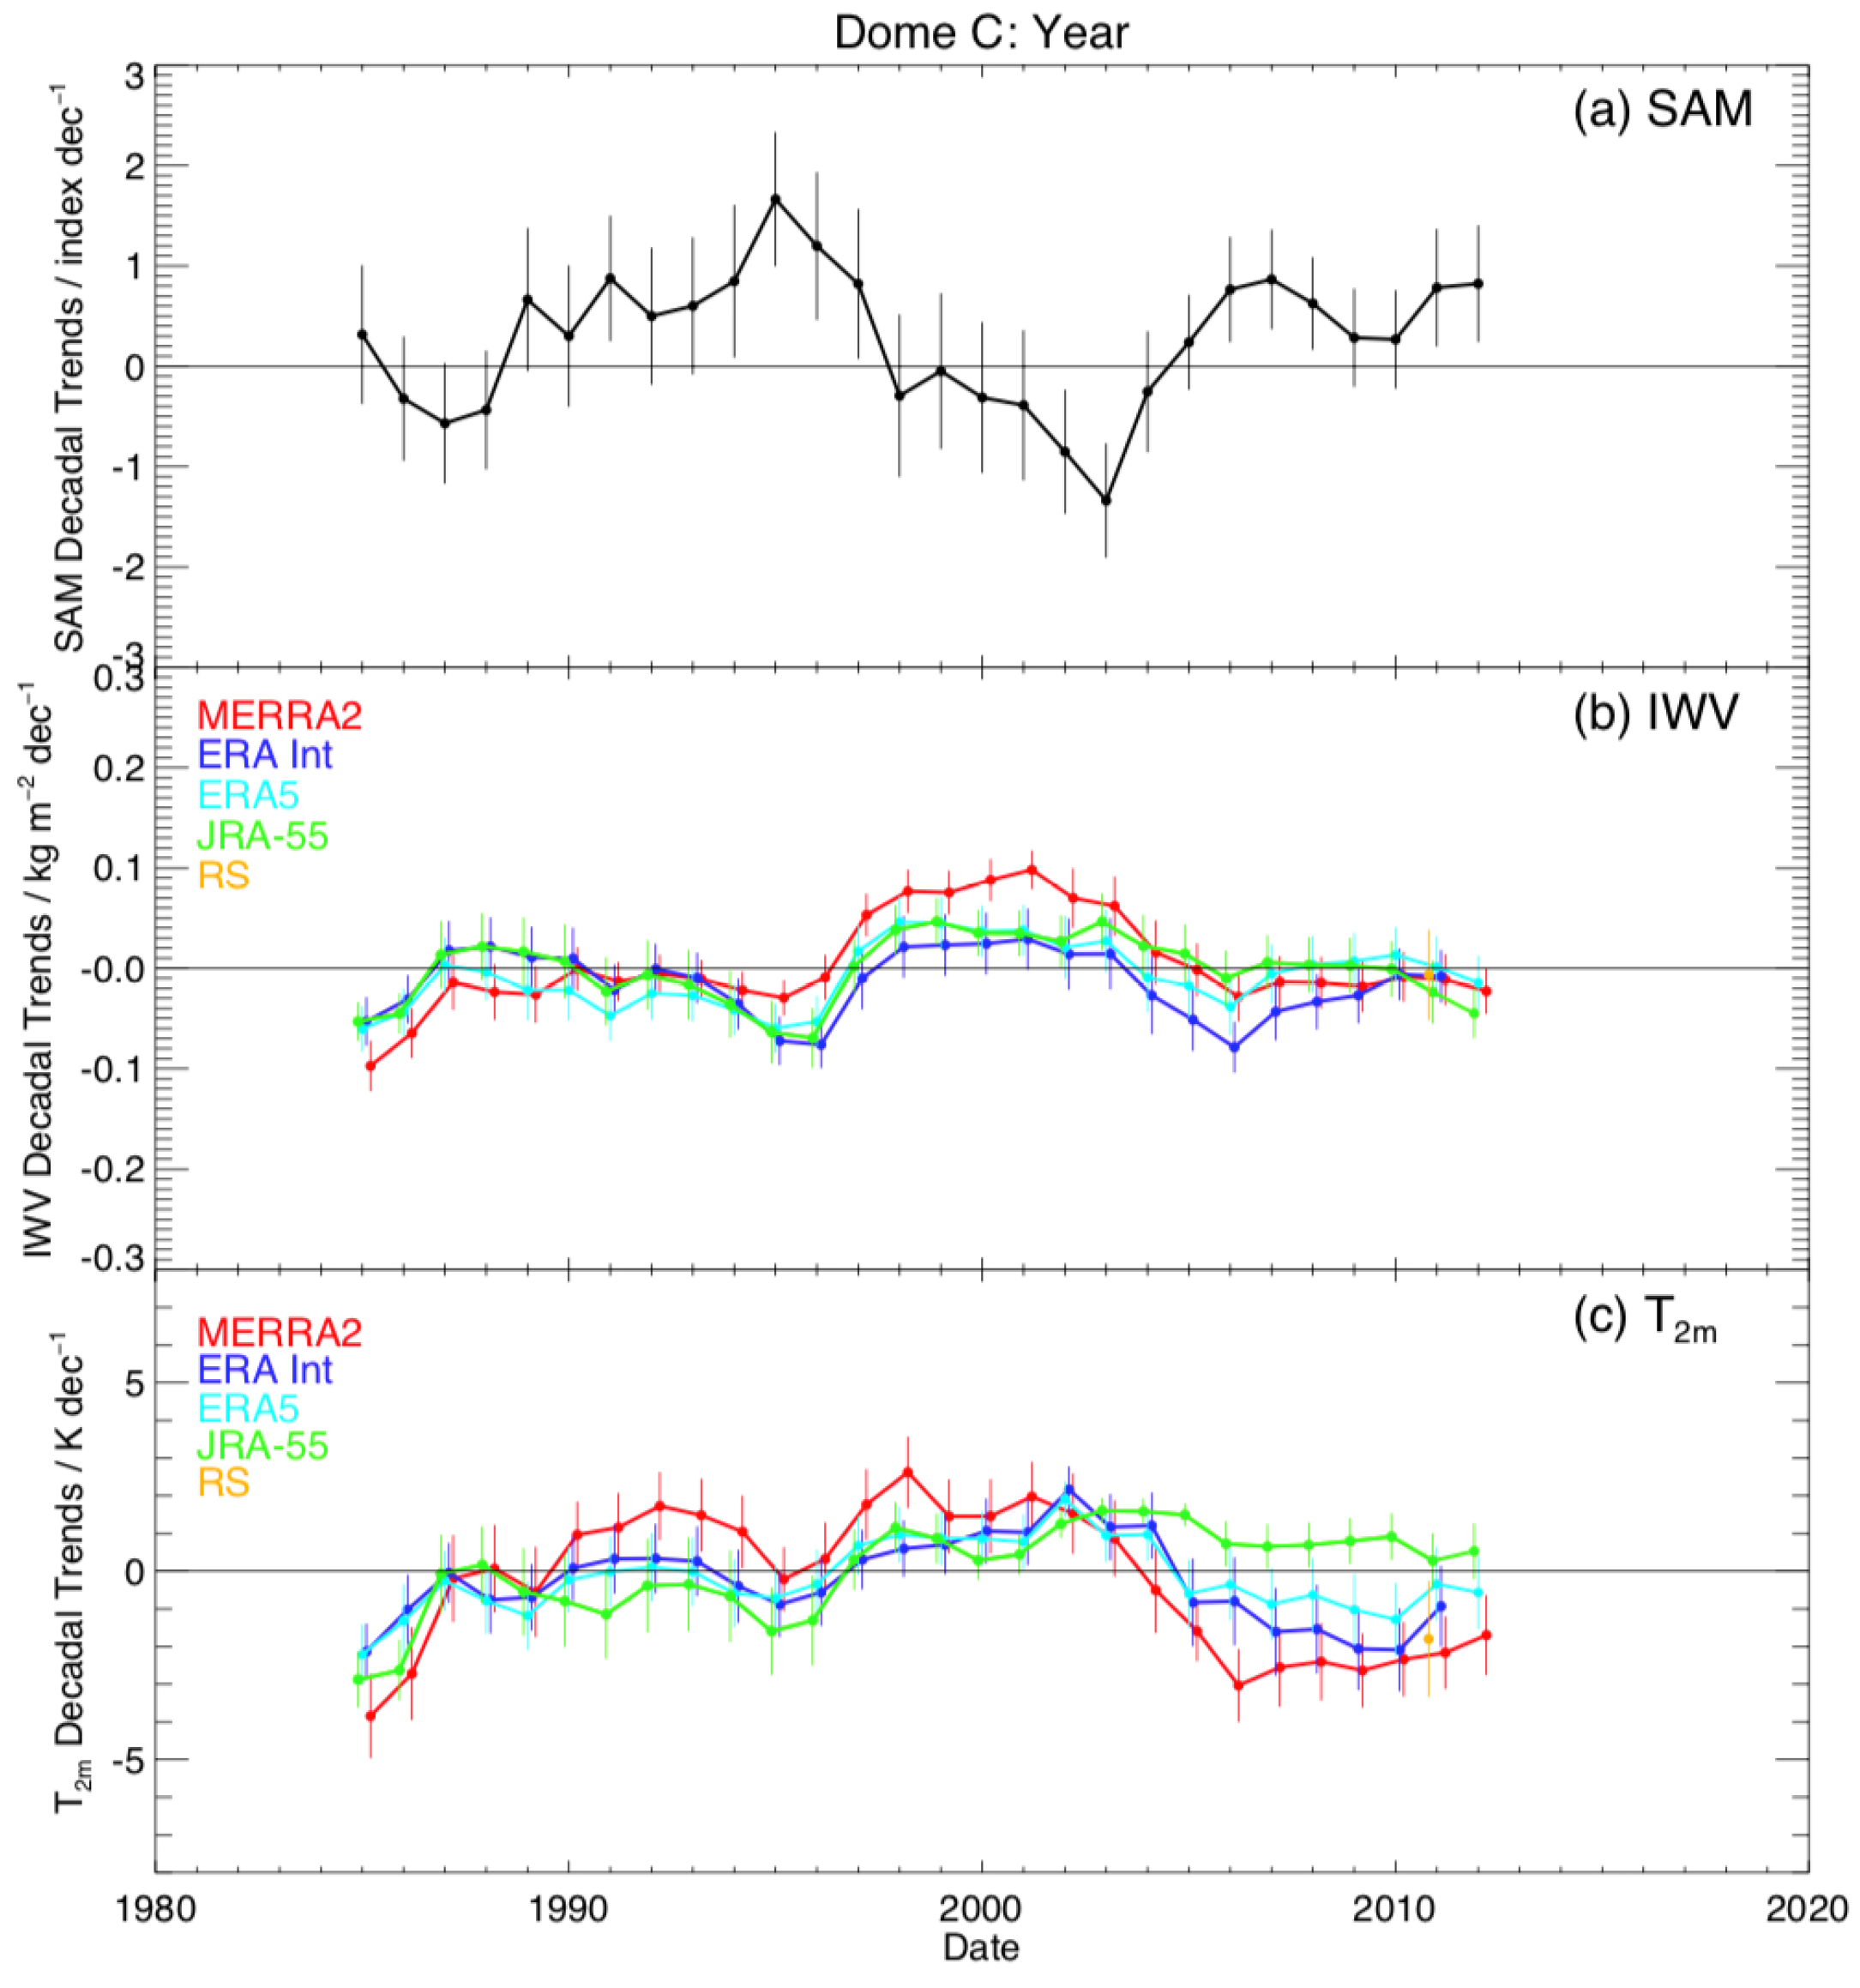
3.3. Multidecadal Trend and Variability of IWV, Near-Surface Temperature and SAM Index since the End of the 20th Century

In this section, we analyze the multidecadal trends and variability of IWV, near-surface temperature and SAM index over the period 1980–2017 in order to determine whether the decadal trends observed using the radiosondes in the early 21st century are due to a long-term, multidecadal change in atmospheric properties or simply reflect its multidecadal variability above Dome C.

3.3.1. Multidecadal Trends over Dome C

The long-term trends in seasonal and annual IWV, near-surface temperature and SAM index [30] over the period 1980–2017 are presented in Table 2, for each of the datasets considered (MERRA2, ERA-Int, ERA5 and JRA-55).
In summer, ERA-Int and JRA−55 reanalyses show significant cooling (−0.15 ± 0.14 and −0.16 ± 0.11 K dec−1, respectively) and drying (−0.035 ± 0.011 and −0.010 ± 0.009 kg m−2 dec−1, respectively). In contrast, the ERA5 data set shows significant drying (−0.017 ± 0.010 kg m−2 dec−1) and warming (0.21 ± 0.15 K dec−1). Only MERRA2 exhibits a significant moistening trend over the 38-year period (0.012 ± 0.009 kg m−2 dec−1). The SAM index trend, although positive, is not significant. In autumn, only ERA-Int indicates significant drying (−0.008 ± 0.007 kg m−2 dec−1). In winter, significant drying is found in ERA-Int, ERA5 and JRA-55 (from −0.009 to −0.015 ± 0.006/0.007 kg m−2 dec−1), while a significant cooling trend is found in MERRA2, ERA-Int and ERA5 (from −0.41 to −0.63 ± 0.35/0.39 K dec−1); the SAM index trend is found to be significantly positive (0.20 ± 0.14 index dec−1) for the same period. In spring, a significant moistening occurs in MERRA2 and JRA-55 reanalyses (0.007 ± 0.004 and 0.008 ± 0.004 kg m−2 dec−1, respectively), whilst a warming trend is identified (0.40 ± 0.17 K dec−1) only for JRA-55, with no significant trends in the SAM index. In the annual averages, ERA-Int and ERA5 show significant cooling (−0.19 ± 0.15 and −0.15 ± 0.13 K dec−1, respectively) and drying (−0.015 ± 0.004 and −0.008 ± 0.004 kg m−2 dec−1, respectively), whilst MERRA2 displays significant moistening (0.005 ± 0.004 kg m−2 dec−1) associated with cooling (−0.19 ± 0.17 K dec−1). In the JRA-55 and SAM index data sets, no significant trends are found.
In summary, over the period 1980–2017, the only significant cooling and drying trends at Dome C associated with a significant positive trend in the SAM index occur in winter, in the ERA-Int and ERA5 reanalyses.

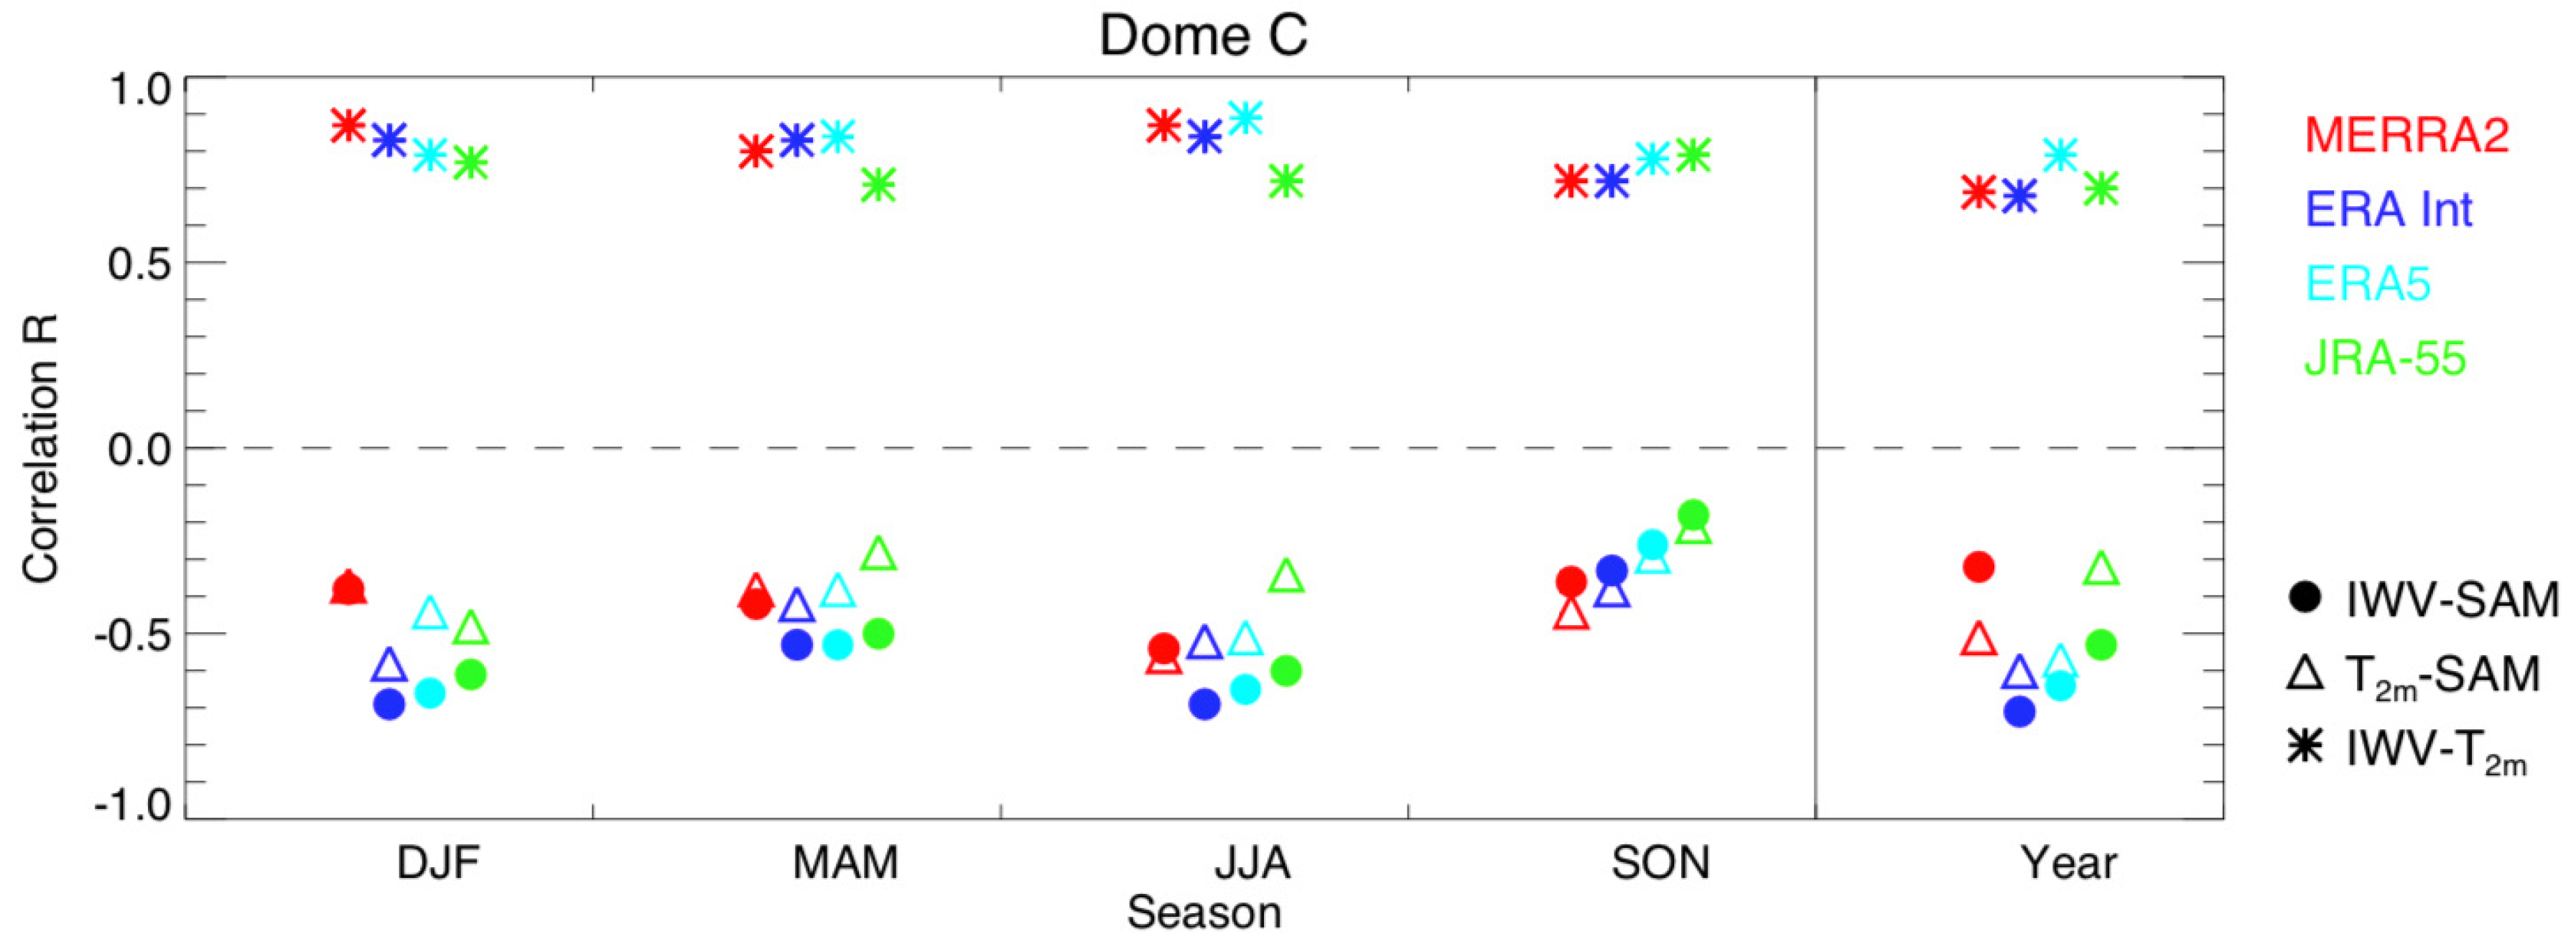
3.3.2. Multidecadal Variability over Dome C

The multidecadal variability in the SAM index, as well as in the IWV and near-surface temperature, calculated using a 10-year moving window on the four reanalyses (ERA-Int, ERA5, MERRA2, and JRA-55) above Dome C for 1980–2017, are presented in Figure 9, Figure 10, Figure 11, Figure 12 and Figure 13 as seasonal and annual averages, respectively (see also Section 2). The 10-year running trend algorithm is also applied to the radiosonde observations, though it only provides 1–3 points for the period, depending on the season considered. The radiosonde trends are of similar magnitude to those derived in Section 3.2.1. In the following, each 10-year window will be referred to by its center. For instance, the date of 1985 will correspond to the 1980–1990 period. The linear Pearson correlation coefficients between IWV and near-surface temperature (RIWV-T), IWV and the SAM index (RIWV-SAM), and near-surface temperature and the SAM index (RT-SAM) calculated from the four reanalysis and radiosonde datasets, as seasonal or annual averages, are presented in Figure 14.
In summer (DJF), the IWV multidecadal variability from 1980 to 2017 is far from being uniform (Figure 9b), with alternating drying and moistening periods. In 1980–1989, only ERA5 shows a significant drying trend of about −0.08 ± 0.06 kg m−2 dec−1. A drying period also occurs from 1990–1999, reaching a minimum for the four reanalyses in 1996 (namely 1991–2001): −0.18 ± 0.05 kg m−2 dec−1 for ERA-Int and JRA−55, −0.15 ± 0.05 kg m−2 dec−1 for ERA5, and −0.08 ± 0.05 kg m−2 dec−1 for MERRA2. A large moistening trend follows in 1997–2003 with a maximum in 2000: 0.25 ± 0.05 kg m−2 dec−1 for MERRA2, 0.20 ± 0.05 kg m−2 dec−1 for ERA-Int and ERA5, and 0.15 ± 0.05 kg m−2 dec−1 for JRA-55. Then a new drying period is observed from 2003–2004 to 2010 with a minimum in 2006: −0.20 ± 0.10 kg m−2 dec−1 for ERA-Int, −0.12 ± 0.08 kg m−2 dec−1 for MERRA and ERA5, and −0.06 ± 0.08 kg m−2 dec−1 (insignificant) for JRA-55. After 2010, only the ERA5 moistening trend is significant (0.100 ± 0.080 kg m−2 dec−1), and consistent with the radiosonde observations (0.102 ± 0.096 kg m−2 dec−1).
The summer near-surface temperature multidecadal variability from 1980 to 2017 (Figure 9c) follows the trend in humidity, confirming the relationship between these two variables, as previously described. Significant cooling is observed in the four reanalyses in 1995 (−1.2 ± 0.5 K dec−1), and in 2006–2008 (−3.0 ± 1.0 K dec−1 in MERRA2, −2.0 ± 0.8 K dec−1 in ERA-Int and −1.0 ± 0.8 K dec−1 in JRA-55). A long warming trend is calculated in 1998–2002, with maxima of 4.0 ± 1.0 K dec−1 in 2000 for MERRA2, 2.8 ± 0.8 K dec−1 in 1999 for ERA-Int and 1.5 ± 0.8 K dec−1 in 1999 for JRA-55. After 2010, only ERA5 shows a significant tendency to warm the atmosphere of about 1.5–1.8 ± 0.8 K dec−1, consistent with the radiosonde decadal trends: 1.0 ± 0.8 K dec−1 in 2011 and 1.5 ± 0.8 K dec−1 in 2012.
The summer SAM index multidecadal variability from 1980 to 2017 (Figure 9a) is, on average, significantly positive in 1987–1998, significantly negative in 2000–2003, and positive after, but only significant in 2008–2009. Positive (negative) phases of the SAM index trends are associated with drying and cooling (moistening and cooling) periods, as quantified by the Pearson correlation coefficients shown on Figure 14. In DJF, RIWV-T is greater than 0.75 in the reanalyses (up to 0.87 in MERRA2) confirming previous studies (e.g., [36]). The multidecadal variability of the SAM index is anticorrelated with that of IWV from the reanalyses (RIWV-SAM = −0.7 in ERA-Int, −0.67 in ERA5, −0.65 in JRA-55 and −0.4 in MERRA2). The correlation between the SAM multidecadal variability and that of near-surface temperature (RT-SAM) is also negative: ERA-Int (−0.6) and JRA-55 (−0.5) than for ERA5 (−0.45) and MERRA2 (−0.4).
In autumn (MAM), the IWV multidecadal variability shows 3 main periods (Figure 10b): (1) drying in 1985–1996, (2) moistening in 1997–2005, and 3) drying in 2006–2012. The four reanalyses agree on average to within 0.05 kg m−2 dec−1 except in 1985–1987 when the drying trend is more intense in MERRA2 (−0.15 ± 0.05 kg m−2 dec−1) than in ERA-Int, ERA5 and JRA-55 (−0.08 ± 0.05 kg m−2 dec−1). The drying trend is significant in 1989 (−0.09 to −0.11 ± 0.05 kg m−2 dec−1) and 2011–2012 (−0.07 ± 0.05 kg m−2 dec−1), and the moistening trend is significant in 1998 and 2003 (0.10–0.12 ± 0.05 kg m−2 dec−1). The drying in 2011–2012 is also captured by the radiosondes (−0.04 ± 0.03 kg m−2 dec−1).
Although the autumn near-surface temperature multidecadal variability (Figure 10c) mimics that of IWV, the spread within the four reanalyses (2–3 K dec−1 on average) prevents clear identification of periods of warming and cooling. The only period when the four reanalyses show a consistent view of the atmosphere is over 1985–1990 (cooling of −3.0 to −5.0 ± 1.0 K dec−1) and over 1995–2005 (warming of 0.0 to 5.0 ± 1.0 K dec−1). In 2010–2012, the radiosondes, MERRA2, ERA-Int and ERA5 all indicate a cooling trend of −1.0 to −3.0 ± 1.0 K dec−1, whilst JRA-55 tends to show an insignificant warming trend of 1.0 ± 1.0 K dec−1.
The autumn SAM index multidecadal variability (Figure 10a) is anti-correlated with that of IWV (Figure 14), but is significant only in 1991–1997 (about 1.5 ± 1.0 index dec−1) and 2011–2012 (about 1.5 ± 0.8 index dec−1). RIWV-T is on average slightly lower in autumn than in summer (Figure 14) with values ranging from 0.70 to 0.83 in the reanalyses (0.83 in ERA5). As in the summer, RIWV-SAM is, in absolute value, slightly lower (from −0.45 in MERRA2 to −0.55 in ERA-Int and ERA5) than RIWV-T. The correlation between multidecadal variability in SAM index and near-surface temperature (RT-SAM) is slightly weaker than RIWV-SAM for ERA-Int, ERA5, MERRA2 (−0.4) and JRA-55 (−0.3).
In winter (JJA), the IWV multidecadal variability from the four reanalyses (Figure 11b) agrees to within 0.05 kg m−2 dec−1, showing several moistening/drying periods: 1) drying in 1985–1986 (−0.15 ± 0.05 kg m−2 dec−1), 1995–1996 (−0.05 ± 0.05 kg m−2 dec−1), 1999–2000 (−0.05 ± 0.05 kg m−2 dec−1) and 2010–2012 (−0.06 ± 0.05 kg m−2 dec−1); and 2) moistening in 1988–1992 (0.08 ± 0.05 kg m−2 dec−1). The drying trend in 2010–2012 is also captured by the radiosondes (−0.05 ± 0.03 kg m−2 dec−1).
The winter near-surface temperature multidecadal variability from the four reanalyses (Figure 11c) agrees to within 3–5 K dec−1 with 3 significant cooling periods in 1985–1986 (−5.0 ± 1.5 K dec−1), 1995–1996 (−3.0 ± 1.5 K dec−1), and 2007–2012 (−6.0 ± 1.5 K dec−1, although the JRA-55 data set does not exhibit any trends), and one significant warming period in 2002 (3.0 ± 1.5 K dec−1). In 2010–2012, the radiosondes agree with MERRA2, ERA-Int and ERA5 on the occurrence of a cooling trend of −5.0 ± 3.0 K dec−1.
The winter SAM index multidecadal variability (Figure 11a) is anticorrelated to that of IWV with positive trends in 1987–1988, 2000 and 2011–2012, and negative trends in 2003. In JJA, RIWV-T is, on average, the largest of the four seasons, with values reaching up to 0.89 in ERA5 (Figure 14). The anticorrelation between IWV and SAM index multidecadal variability (Figure 14) is highlighted by large values (in absolute value) of RIWV-SAM: from −0.55 in MERRA2 to −0.70 in ERA-Int. As in the other seasons studied, RT-SAM is lower, in absolute value, than RIWV-SAM: from −0.4 in JRA-55 to −0.6 in MERRA2.
In spring (SON), the IWV multidecadal variability (Figure 12b) is weak (±0.05 kg m−2 dec−1) in all datasets, showing a weak moistening trend (0.05 ± 0.03 kg m−2 dec−1) before 1990 and after 2005, brief moistening in 1996, and a drying trend (−0.05 ± 0.03 kg m−2 dec−1) around 2000 with successful tests of significance in JRA-55, ERA-Int and ERA5 over all periods and in MERRA2 only in 1996 and after 2005. The radiosonde data set does not exhibit any significant trend in 2010–2012.
The spring near-surface temperature multidecadal variability (Figure 12c) is consistently weak within all the data sets prior to 1995, except for a slight, significant cooling trend observed in ERA-Int and ERA5 in 1987–1988 (−1.8 ± 1.5 K dec−1). After 1995, the four reanalyses diverge to within 3.0–5.0 K dec−1, without demonstrating any general trend (cooling/warming) in this period, except in 1996, when a significant warming trend is calculated, of 1.5 ± 1.0 K dec−1 (ERA-Int, ERA5 and JRA-55) to 3.0 ± 1.5 K dec−1 (MERRA2). The temperature trends in the radiosondes in 2011 and 2012 are all insignificant.
The spring SAM index multidecadal variability (Figure 12a) does not show any significant values, except in 1988 (−1.3 ± 1.2 index dec−1) and in 2006–2007 (2.1 ± 1.5 index dec−1), producing weak correlations (Figure 14) in RIWV-SAM (from −0.20 in JRA-55 to −0.35 in MERRA2) and in RT-SAM (from −0.25 in JRA-55 to −0.45 in MERRA2). In this particular season, RIWV-T is, on average, weaker than in all the other seasons: from 0.7 in ERA-Int and MERRA2 to 0.8 in JRA-55.
If we now consider the annual average IWV multidecadal variability (Figure 13b), three periods of significant drying can be detected in 1985 (−0.06 to −0.10 ± 0.03 kg m−2 dec−1), 1995 (−0.03 to −0.08 ± 0.03 kg m−2 dec−1) and 2006 (−0.07 to −0.01 ± 0.03 kg m−2 dec−1) and one single period of moistening in 1998–2002 (from 0.03 to 0.09 ± 0.03 kg m−2 dec−1). In 2010, the absence of any significant trend is confirmed by the radiosondes.
The annually-averaged near-surface temperature multidecadal variability from the four reanalyses (Figure 13c) is consistent to within 2–3 K dec−1 from 1985 to 2002, showing a significant cooling trend in 1985 (from −2.0 to −4.0 ± 0.8 K dec−1) and a significant warming trend in 2000 (from 0.5 to 1.5 ± 0.8 K dec−1). After 2002, the trends from the four reanalyses diverge from −3.5 ± 0.8 K dec−1 in MERRA2 to 0.8 ± 0.5 K dec−1 in JRA-55, with ERA-Int and ERA5 being consistent with the radiosondes (about −2.0 ± 0.8 K dec−1).
The annual average SAM index multidecadal variability (Figure 13a) shows significant values in 1995 (1.6 ± 0.6 index dec−1), 2003 (−1.4 ± 0.5 index dec−1) and after 2006 (0.9 ± 0.6 index dec−1). This tends to produce correlations (Figure 14) in RIWV-SAM from −0.3 in MERRA2 to −0.7 in ERA-Int and in RT-SAM from −0.3 in JRA-55 to −0.65 in ERA-Int. On average, RIWV-T ranges from 0.7 in ERA-Int and MERRA2 to 0.8 in ERA5.

4. Discussion

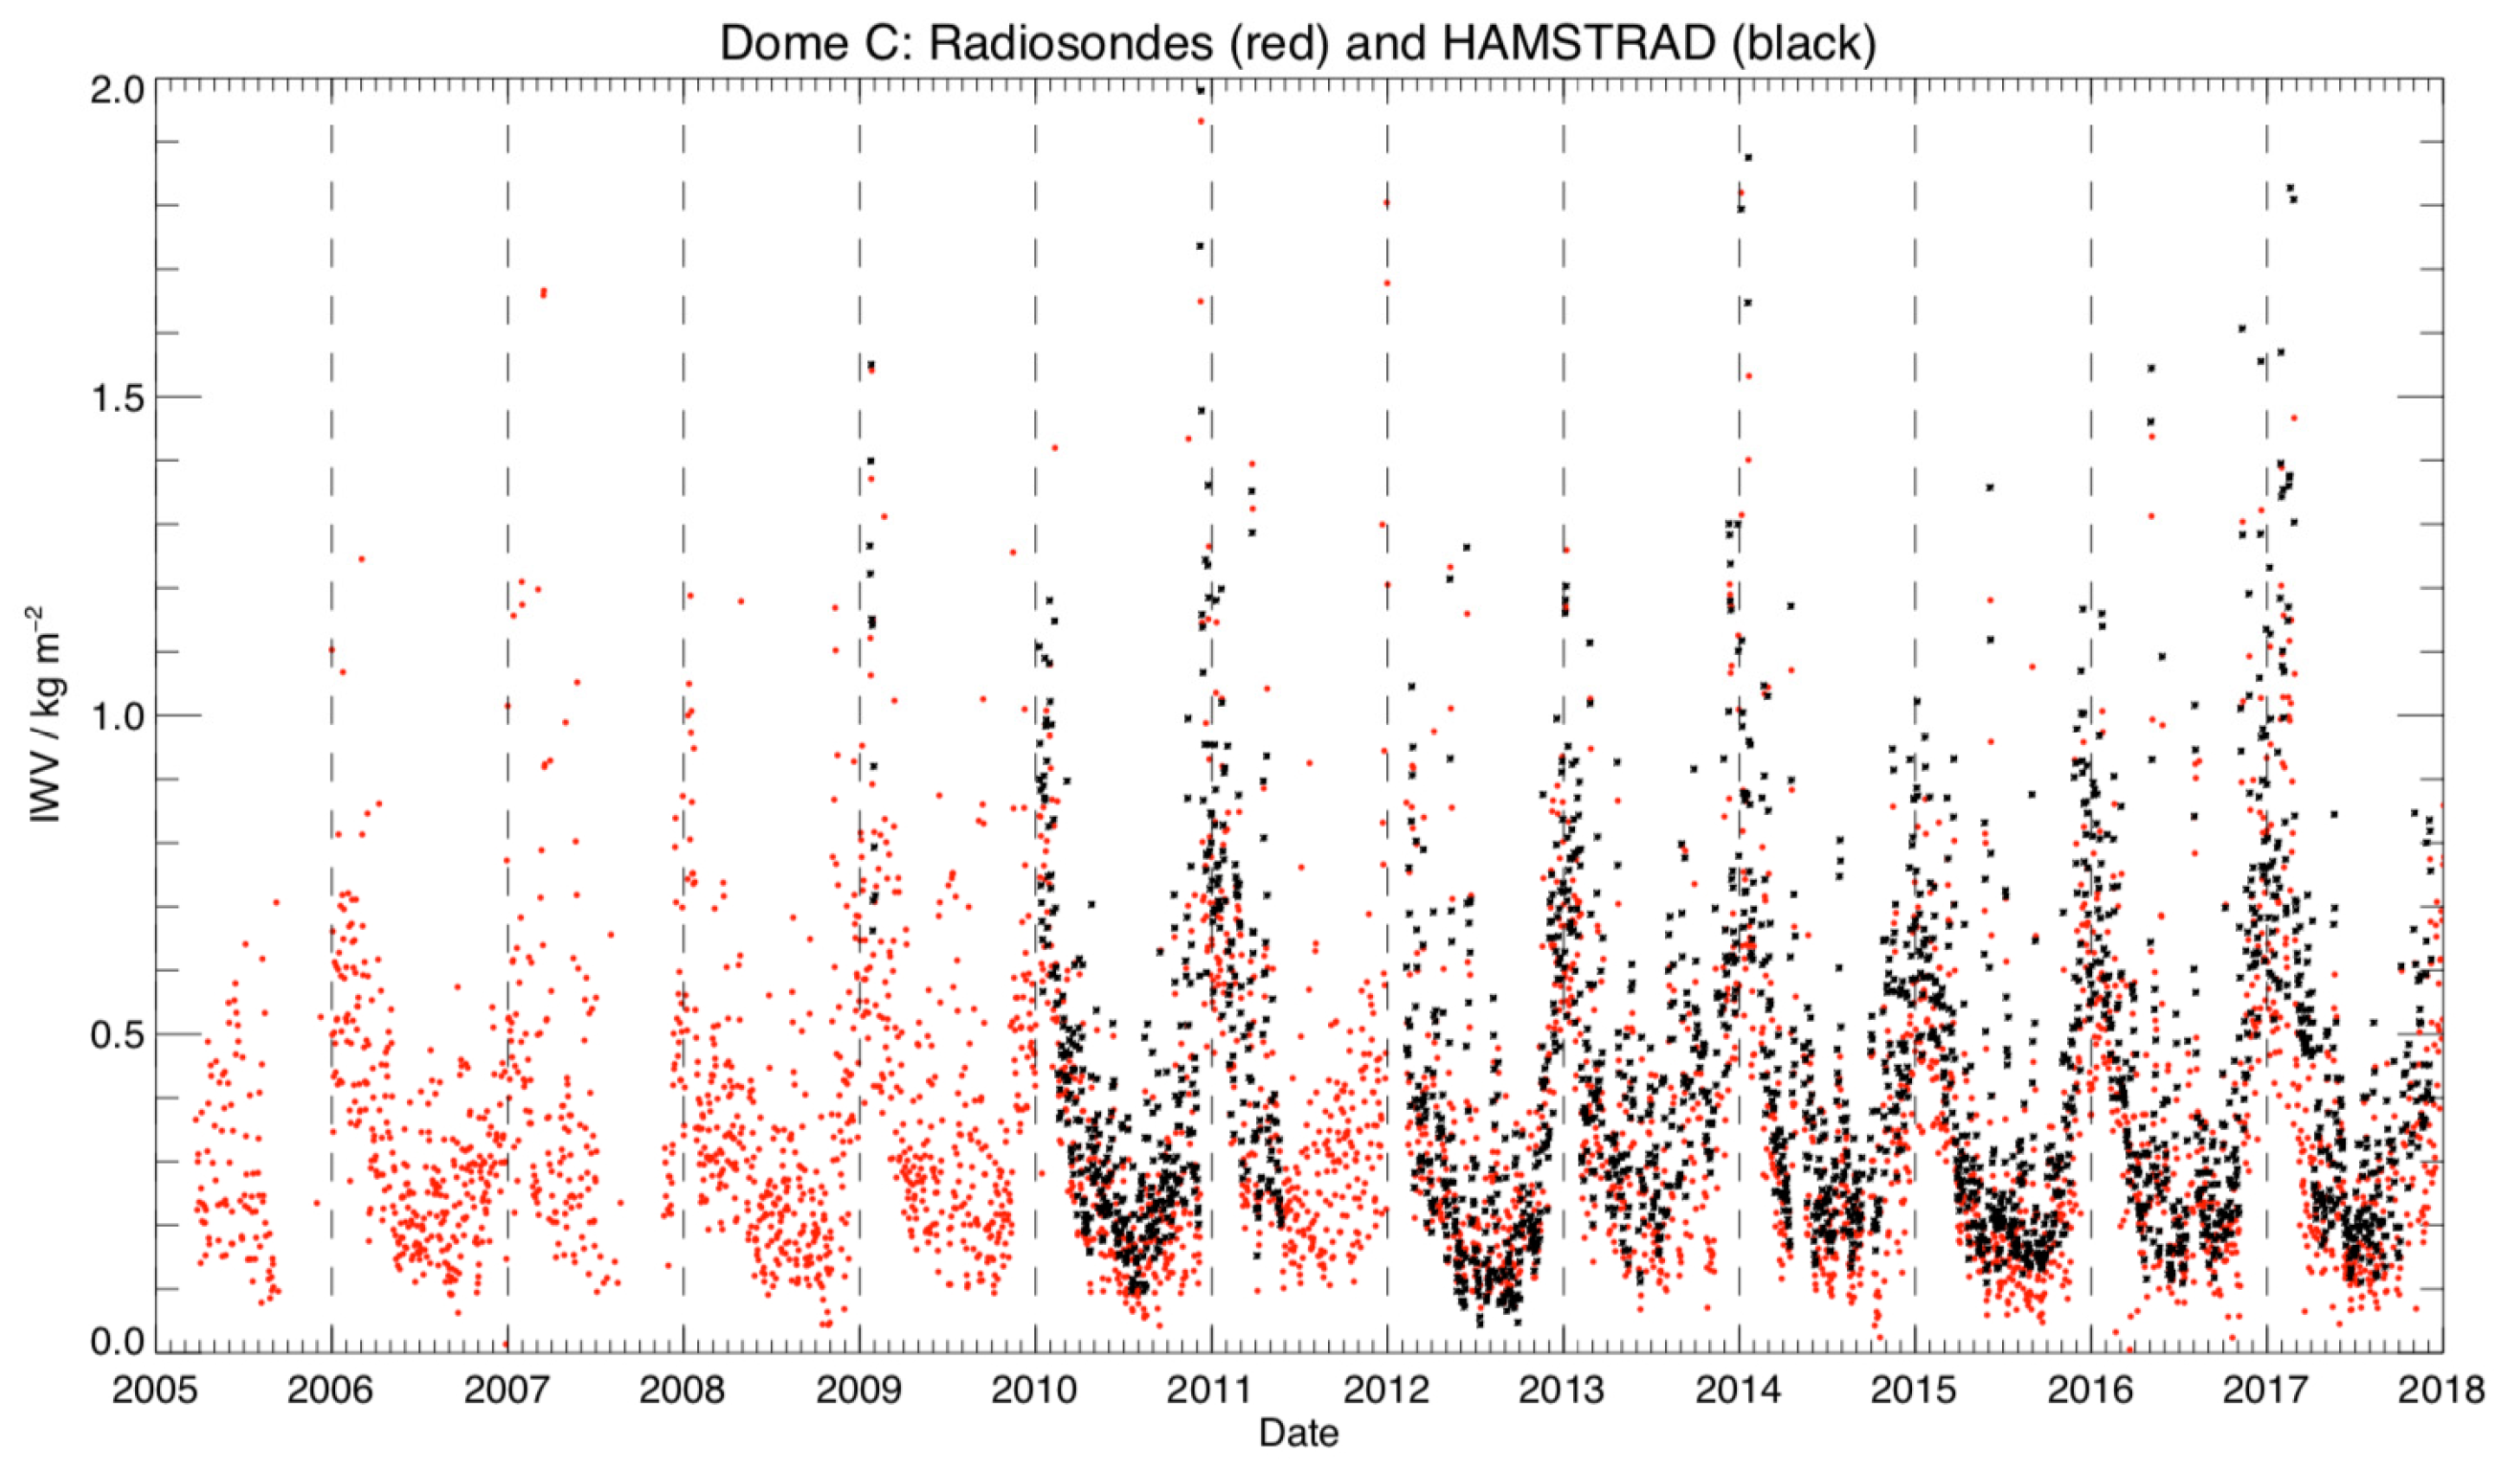
4.1. Assimilation of Radiosondes

The assimilation of Dome C radiosonde observations starting in 2005 by the reanalyses may have caused some marked discontinuity in the IWV and near-surface temperature decadal trends. In IWV, if we except the season of DJF when ERA-Int shows much drier trends in 2006 (−0.20 ± 0.05 kg m−2 dec−1) than all the other reanalyses (−0.05 to −0.10 ± 0.05 kg m−2 dec−1), all the data sets exhibit a consistent behavior within ±0.05 kg m−2 dec−1 in MAM, ±0.03 kg m−2 dec−1 in JJA and SON, and ±0.02 kg m−2 dec−1 in the annual average. On average, no discontinuity can be observed in the time series of IWV trends within the four data sets. However, we note that the spread among the four reanalysis datasets is reduced over the last decade of the analysis. The assimilation of the radiosonde data at Dome C is starting to impact the decadal trend calculation starting in 2000, with decadal trends from 2010 fully benefitting from radiosonde data. That is to say that the 2000–2010 period can be regarded as a progressive transition from zero-radiosonde data to fully-incorporated radiosonde data at Dome C, which corresponds to the progressive reduction in the spread between the reanalyses. Such a behavior is not observed in near-surface temperature decadal trends.
In near-surface temperature, the JRA-55 data set obviously departs from the other data sets starting in 2005 for most seasons and in the annual average, with trends 1 to 5 K dec−1 greater than the trends calculated with the other datasets. The largest difference is found in JJA: 0.0 ± 1.5 K dec−1 in JRA-55 and about −5.0 ± 1.5 K dec−1 for the other datasets. At the present stage, we cannot attribute the cause of this difference to the use or not of the radiosondes from Dome C in the data assimiliation system of JRA-55 since the Japanese system relies on the same radiosonde data base as ERA5 [29]. Finally, we must note that JRA-55 provides surface air temperature although the other reanalysis data sets provide 2-m temperature, which may potentially impact the trend calculation.

4.2. Decadal Trends

Based on reconstructed reanalyses of near-surface temperatures from 1958 to 2012, warming trends of about 0.1 K dec−1 calculated by [4] in the Eastern Antarctic Plateau were not statistically significant in summer, winter and as annual averages. In their study, in spring, the long-term trend was statistically significant at 0.2–0.3 K dec−1 whilst, in autumn, a not statistically significant cooling trend of about −0.1 K dec−1 was derived. A cooling trend in autumn is also found in our study, but is not statistically significant. The main difference appears to be in winter, when, in our study, the multidecadal trends from the four reanalyses are all negative although, over 1958–2012 [4], they are positive underlining the impact of the selection of the analysis period on the sign and magnitude of multidecadal trends. We also recall (see Section 3.2.1) that winter decadal trends in temperature were observed to be significantly negative at 10 m at Dome C (−5.1 ± 2.0 K dec−1 over 2005–2017) and positive at South Pole for heights below 5 km (1.5 K dec−1 over 2005–2018). At the South Pole, a warming trend occurs in all seasons and in all analysis periods: from climate model experiments over 1989–2018 [25] and from surface air temperature over 1979–2016 and 1999–2016 [6]. Based on the ERA5 data set from 2005 to 2017, we calculated that the winter decadal trend in 2-m temperature is significantly negative at Dome C (−4.0 ± 1.5 K dec−1) whilst, at the South Pole, it is positive (not significant, 0.5 ± 1.0 K dec−1), confirming the observational studies at the two sites. The correlation coefficient between the SAM index and the 2-m temperature over 2005–2017 at South Pole and Dome C was found to be of the same order of magnitude: about −0.5. At the Vostok station, the station of the Eastern Antarctic Plateau the closest to Dome C, the trends are, on the other hand, strongly dependent on the season and on the period considered. In summer, trends are negative (not significant) in [25] of −0.13 ± 0.72 °C dec−1 over 1989–2018 and are positive in [6] of about 0.1 °C dec−1 over 1979–2016 and about 0.2 °C dec−1 over 1999–2016. In winter, a positive trend (not significant) of 0.08 ± 1.01 °C dec−1 is calculated over 1989–2018 in [25], whilst both a positive trend of about +0.1 °C dec−1 over 1979–2016 and a negative trend of about −0.2 °C dec−1 over 1999–2016 are found in [6]. The link between the multidecadal variability of the SAM index and the near-surface temperature over Antarctica has already been presented by [4], based on a reconstruction of Antarctic monthly mean near-surface temperatures from reanalyses spanning 1958–2012. The Pearson linear coefficient correlation (RT-SAM) is shown to be statistically significant and less (in absolute value) than −0.6 in the vicinity of the Dome C station. More precisely, in summer and autumn, RT-SAM appears to be less than −0.7, whilst, in winter and spring and as an annual average, it is around −0.6. These results, over a period 20 years longer than the period selected in our study, are consistent with our findings above Dome C, although 1) they are smaller by −0.1 to −0.2 (more anticorrelated) than our correlation coefficients; and 2) their winter correlation coefficient is greater by 0.1 to 0.2 (reduced anticorrelation) than our winter results. A positive SAM index is usually associated with low temperatures for the East Antarctic Plateau, which is attributed to 1) reduced meridional heat exchange within the troposphere, and 2) reduced downward turbulent heat fluxes near the ice sheet’s surface [37]. The IWV and near-surface temperature multidecadal variability can also be indirectly influenced by 1) the southern Baroclinic Annular Mode (BAM); 2) the Pacific-South American (PSA) patterns [38]; and 3) the tropically-forced variability induced by El Niño–Southern Oscillation (ENSO) since, in summer and winter, the SAM trends have been shown to be more closely linked to long-term trends in tropical Pacific sea surface temperatures [9].
To summarize, from the multidecadal variability of IWV and near-surface temperature based on the four reanalyses above Dome C and of the SAM index since 1980, we demonstrated that the summer moistening/warming trends and the autumn and winter drying/cooling trends observed in the beginning of the 21st century by the radiosondes agreed with the reanalyses. We also showed that these trends were not systematically found since the end of the 20th century. Instead, periods of moistening/warming alternated with periods of drying/cooling whatever the season considered, and even in the annual averages. The multidecadal variability in IWV and near-surface temperature was clearly anticorrelated with that in the SAM index for all seasons but spring (SON). The anticorrelation with the SAM index was stronger for IWV than for temperature. This is probably due to the fact that IWV is more representative of the whole atmosphere than near-surface temperature. Finally, our study suggests that the decadal trends observed at Dome C since the beginning of the 21st century in humidity and near-surface temperature as seasonal averages simply reflect the multidecadal variability of the atmosphere, and are not due to long-term trends of atmosphere properties.

5. Conclusions

Decadal trends in atmospheric humidity (IWV and H2O profiles) and near-surface temperature (surface/2-m/10-m temperature and profiles) above Dome C (Antarctica) have been evaluated using 1) observations performed at the site (radiosondes and HAMSTRAD) in the beginning of the 21st century (2005–2017 and 2012–2017, respectively); and 2) reanalyses since the end of the 20th century (1980–2017), including the ERA-Int, ERA5, MERRA2 and JRA-55 data sets.
Observations show a clear seasonal cycle in both IWV and 10-m temperature with minima in winter (JJA) and maxima in summer (DJF). The linear Pearson correlation coefficient R between IWV and 10-m temperature or 10-m H2O shows that, on average, the time evolution of IWV is more related to the time evolution of 10-m temperature than to that of 10-m H2O. This is due to 1) the thermodynamic relationship between H2O and temperature; and 2) the vertical profile of H2O that does not peak at the surface but around 100–200 m, and dramatically decreases below this layer down to 10 m. As a consequence, the time evolution of 10-m temperature can be considered a better proxy than the time evolution of 10-m water vapor for tropospheric humidity above Dome C.
The decadal trends in IWV, as well as temperature and H2O at various heights, from the observations performed at Dome C since the beginning of the 21st century (2005–2017 in radiosondes and 2012–2017 in HAMSTRAD), show three main features. 1) In summer, significant moistening (0.08 ± 0.06 kg m−2 dec−1) is associated with significant warming (1.08 ± 0.55 K dec−1). 2) In autumn and winter, significant drying (−0.04 and −0.05 ± 0.03 kg m−2 dec−1, respectively) is associated with significant cooling (−2.4 ± 1.2 and −5.1 ± 2.0 K dec−1, respectively). 3) In spring, we did not observe any significant moistening/drying trend associated with significant warming/cooling trend.
Finally, we investigated, based on seasonal and annual averages, the multidecadal trends and variability of IWV, near-surface temperature and SAM index over the much longer period 1980–2017, above Dome C, utilizing the four reanalyses. Our study showed that the summer moistening/warming trends and the autumn and winter drying/cooling trends observed in the beginning of the 21st century with the radiosondes 1) agreed with the reanalyses, but 2) were not consistently present at the end of the 20th century. Instead, periods of moistening/warming alternated with periods of drying/cooling in seasonal and annual averages. The SAM index multidecadal variability was clearly anticorrelated to those in IWV and near-surface temperature (R varying from −0.5 to −0.75 and from −0.30 to −0.60, respectively) for all the seasons but spring (SON), with a larger anticorrelation for IWV than for temperature. Finally, our study suggests that the decadal trends observed in humidity and near-surface temperature at Dome C since the beginning of the 21st century simply reflect the multidecadal variability of the atmosphere and, thus, are not indicative of the secular atmospheric trends that may be related to global climate change.

Author Contributions

Conceptualization, P.R. and R.R.; methodology, P.R.; software, P.R.; validation, P.R. and P.G.; formal analysis, P.R.; investigation, P.R., P.G., R.R., P.D. and D.E.V.; resources, P.R.; data curation, P.R., P.G. and R.R.; writing—original draft preparation, P.R.; writing—review and editing, P.R., P.G., R.R., P.D. and D.E.V.; visualization, P.R.; supervision, P.R.; project administration, P.R.; funding acquisition, P.R. and P.G. All authors have read and agreed to the published version of the manuscript.

Funding

This research received no external funding.

Acknowledgments

There are no real or perceived financial conflicts of interests for any author. The HAMSTRAD project is funded by the Institut polaire français Paul-Emile Victor (IPEV), the Institut National des Sciences de l’Univers (INSU)/Centre National de la Recherche Scientifique (CNRS), Météo-France and the Centre National d’Etudes Spatiales (CNES). The Concordia station is jointly operated by IPEV and the Italian Programma Nazionale Ricerche in Antartide (PNRA). We would like to thank all the winterover personnel who worked at Dome C on HAMSTRAD, and Routine Meteorological Observations (RMO). We have used ERA-Interim data from https://apps.ecmwf.int/datasets/data/interim-full-daily; ERA5 data from https://cds.climate.copernicus.eu/cdsapp#!/dataset/reanalysis-era5-single-levels-monthly-means?tab ± overview; MERRA2 data from https://gmao.gsfc.nasa.gov/reanalysis/MERRA-2/data_access; JRA-55 data from http://jra.kishou.go.jp/JRA-55/index-en.html. The SAM index was retrieved from https://legacy.bas.ac.uk/met/gjma/sam.html. Radiosondes are available from http://www.climantartide.it. AWS data are available from http://www.climantartide.it/dataaccess/aws/index.php?lang = it&aws = Concordia HAMSTRAD data are available at http://www.cnrm.meteo.fr/spip.php?article961&lang = en. We would like to thank the three anonymous reviewers for their beneficial comments.

Conflicts of Interest

The authors declare no conflict of interest.

References

  1. Turner, J.; Lachlan-Cope, T.A.; Colwell, S.; Marshall, G.J.; Connolley, W.M. Significant Warming of the Antarctic Winter Troposphere. Science 2006, 311, 1914–1917. [Google Scholar] [CrossRef] [PubMed]
  2. Turner, J.; Lu, H.; White, I.; King, J.C.; Phillips, T.; Scott Hosking, J.; Bracegirdle, T.J.; Marshall, G.J.; Mulvaney, R.; Deb, P. Absence of 21st century warming on Antarctic Peninsula consistent with natural variability. Nature 2016, 535, 411–415. [Google Scholar] [CrossRef] [PubMed] [Green Version]
  3. Oliva, M.; Navarro, F.; Hrbáčekc, F.; Hernández, A.; Nývlt, D.; Pereira, P.; Ruiz-Fernández, J.; Trigo, R.M. Recent regional climate cooling on the Antarctic Peninsula and associated impacts on the cryosphere. Sci. Total Environ. 2017, 580, 210–223. [Google Scholar] [CrossRef] [PubMed]
  4. Nicolas, J.P.; Bromwich, D.H. New reconstruction of Antarctic near-surface temperatures: Multidecadal trends and reliability of global reanalyses. J. Clim. 2014, 27, 8070–8093. [Google Scholar] [CrossRef]
  5. Clem, K.R.; Renwick, J.A.; McGregor, J. Autumn cooling of western East Antarctica linked to the tropical Pacific. J. Geophys. Res. Atmos. 2018, 123, 89–107. [Google Scholar] [CrossRef]
  6. Jones, M.E.; Bromwich, D.H.; Nicolas, J.P.; Carrasco, J.; Plavcová, E.; Zou, X.; Wang, S.H. Sixty years of widespread warming in the southern mid- and high-latitudes (1957–2016). J. Clim. 2019, 32, 6875–6898. [Google Scholar] [CrossRef] [Green Version]
  7. Thompson, D.W.J.; Solomon, S. Interpretation of recent Southern Hemisphere climate change. Science 2002, 296, 895–899. [Google Scholar] [CrossRef] [Green Version]
  8. Smith, K.L.; Polvani, L.M. Spatial patterns of recent Antarctic surface temperature trends and the importance of natural variability: Lessons from multiple reconstructions and the CMIP5 models. Clim. Dyn. 2017, 48, 2653–2670. [Google Scholar] [CrossRef]
  9. Ding, Q.; Steig, E.J.; Battisti, D.S.; Wallace, J.M. Influence of the tropics on the Southern Annular Mode. J. Clim. 2012, 25, 6330–6348. [Google Scholar] [CrossRef]
  10. Li, X.; Holland, D.M.; Gerber, E.P.; Yoo, C. Impacts of the north and tropical Atlantic Ocean on the Antarctic Peninsula and sea ice. Nature 2014, 505, 538. [Google Scholar] [CrossRef]
  11. Cook, A.J.; Holland, P.R.; Meredith, M.P.; Murray, T.; Luckman, A.; Vaughan, D.G. Ocean forcing of glacier retreat in the western Antarctic Peninsula. Science 2016, 353, 283–286. [Google Scholar] [CrossRef] [PubMed] [Green Version]
  12. Yang, J.; Bao, Q.; Ji, D.Y.; Gong, D.Y.; Mao, R.; Zhang, Z.Y.; Kim, S.-J. Simulation and causes of eastern Antarctica surface cooling related to ozone depletion during austral summer in FGOALS-s2. Adv. Atmos. Sci. 2014, 31, 1147–1156. [Google Scholar] [CrossRef]
  13. Shepherd, A.; Ivins, E.; Rignot, E.; Smith, B.; van den Broeke, M.; Velicogna, I.; Whitehouse, P.; Briggs, K.; Joughin, I.; Krinner, G.; et al. Mass balance of the Antarctic Ice Sheet from 1992 to 2017. Nature 2018, 556, 219–222. [Google Scholar]
  14. Rintoul, S.R.; Chown, S.L.; DeConto, R.M.; England, M.H.; Fricker, H.A.; Masson-Delmotte, V.; Naish, T.; Siegert, M.J.; Xavier, J.C. Choosing the future of Antarctica. Nature 2018, 558, 233–241. [Google Scholar] [CrossRef]
  15. Tomasi, C.; Petkov, B.H.; Benedetti, E. Annual cycles of pressure, temperature, absolute humidity and precipitable water from the radiosoundings performed at Dome C, Antarctica, over the 2005–2009 period. Antarct. Sci. 2012, 24, 637–658. [Google Scholar] [CrossRef]
  16. Lubin, D.; Chen, B.; Bromwich, D.H.; Somerville, R.C.; Lee, W.H.; Hines, K.M. The Impact of Antarctic Cloud Radiative Properties on a GCM Climate Simulation. J. Clim. 1998, 11, 447–462. [Google Scholar] [CrossRef] [Green Version]
  17. Adhikari, L.; Wang, Z.; Deng, M. Seasonal variations of Antarctic clouds observed by CloudSat and CALIPSO satellites. J. Geophys. Res. Atmos. 2012, 117, D04202. [Google Scholar] [CrossRef] [Green Version]
  18. Palchetti, L.; Bianchini, G.; Di Natale, G.; Del Guasta, M. Far infrared radiative properties of water vapor and clouds in Antarctica. Bull. Am. Meteorol. Soc. 2015, 96, 1505–1518. [Google Scholar] [CrossRef]
  19. Walden, V.P.; Warren, S.G.; Tuttle, E. Atmospheric ice crystals over the Antarctic Plateau in winter. J. Appl. Meteorol. 2003, 42, 1391–1405. [Google Scholar] [CrossRef]
  20. Lawson, R.P.; Baker, B.A.; Zmarzly, P.; O’Connor, D.; Mo, Q.; Gayet, J.F.; Shcherbakov, V. Microphysical and optical properties of atmospheric ice crystals at South Pole Station. J. Appl. Meteorol. 2006, 45, 1505–1524. [Google Scholar] [CrossRef]
  21. Ricaud, P.; Bazile, E.; del Guasta, M.; Lanconelli, C.; Grigioni, P.; Mahjoub, A. Genesis of diamond dust, ice fog and thick cloud episodes observed and modelled above Dome C, Antarctica. Atmos. Chem. Phys. 2017, 17, 5221–5237. [Google Scholar] [CrossRef] [Green Version]
  22. Listowski, C.; Delanoë, J.; Kirchgaessner, A.; Lachlan-Cope, T.; King, J. Antarctic clouds, supercooled liquid water and mixed-phase investigated with DARDAR: Geographical and seasonal variations. Atmos. Chem. Phys. 2019, 19, 6771–6808. [Google Scholar] [CrossRef] [Green Version]
  23. Ricaud, P.; Del Guasta, M.; Bazile, E.; Azouz, N.; Lupi, A.; Durand, P.; Attié, J.-L.; Veron, D.; Guidard, V.; Grigioni, P. Supercooled liquid water cloud observed, analysed, and modelled at the top of the planetary boundary layer above Dome C, Antarctica. Atmos. Chem. Phys. 2020, 20, 4167–4191. [Google Scholar] [CrossRef] [Green Version]
  24. Xu, M.; Li, Y.; Yang, Q.; Gao, A.E.; Han, B.; Yang, Y.; Yu, L.; Wang, L. Radiosonde-Observed Vertical Profiles and Increasing Trends of Temperature and Humidity during 2005–2018 at the South Pole. Atmosphere 2019, 10, 365. [Google Scholar] [CrossRef] [Green Version]
  25. Clem, K.R.; Fogt, R.L.; Turner, J.; Lintner, B.R.; Marshall, G.J.; Miller, J.R.; Renwick, J.A. Record warming at the South Pole during the past three decades. Nat. Clim. Chang. 2020, 10, 762–770. [Google Scholar] [CrossRef]
  26. Dee, D.P.; Uppala, S.M.; Simmons, A.J.; Berrisford, P.; Poli, P.; Kobayashi, S.; Andrae, U.; Balmaseda, M.A.; Balsamo, G.; Bauer, D.P.; et al. The ERA-Interim reanalysis: Configuration and performance of the data assimilation system. Q. J. R. Meteorol. Soc. 2011, 137, 553–597. [Google Scholar] [CrossRef]
  27. Hersbach, H.; Bell, B.; Berrisford, P.; Hirahara, S.; Horányi, A.; Muñoz-Sabater, J.; Nicolas, J.; Peubey, C.; Radu, R.; Schepers, D.; et al. The ERA5 global reanalysis. Q. J. R. Meteorol. Soc. 2020, 146, 1999–2049. [Google Scholar] [CrossRef]
  28. Gelaro, R.; McCarty, W.; Suárez, M.J.; Todling, R.; Molod, A.; Takacs, L.; Randles, C.; Darmenov, A.; Bosilovich, M.G.; Reichle, R.H.; et al. The modern-era retrospective analysis for research and applications, version 2 (MERRA-2). J. Clim. 2017, 30, 5419–5454. [Google Scholar] [CrossRef]
  29. Kobayashi, S.; Ota, Y.; Harada, Y.; Ebita, A.; Moriya, M.; Onoda, H.; Onogi, K.; Kamahori, H.; Kobayashi, C.; Endo, H.; et al. The JRA-55 reanalysis: General specifications and basic characteristics. J. Meteorol. Soc. Jpn. Ser. II 2015, 93, 5–48. [Google Scholar] [CrossRef] [Green Version]
  30. Marshall, G.J. Trends in the Southern Annular Mode from observations and reanalyses. J. Clim. 2003, 16, 4134–4143. [Google Scholar] [CrossRef]
  31. Ricaud, P.; Gabard, B.; Derrien, S.; Chaboureau, J.-P.; Rose, T.; Mombauer, A.; Czekala, H. HAMSTRAD-Tropo, A 183-GHz Radiometer Dedicated to Sound Tropospheric Water Vapor Over Concordia Station, Antarctica. IEEE Trans. Geosci. Remote Sens. 2010, 48, 1365–1380. [Google Scholar] [CrossRef]
  32. Ricaud, P.; Grigioni, P.; Zbinden, R.; Attié, J.-L.; Genoni, L.; Galeandro, A.; Moggio, L.; Montaguti, S.; Petenko, I.; Legovini, P. Review of tropospheric temperature, absolute humidity and integrated water vapour from the HAMSTRAD radiometer installed at Dome C, Antarctica, 2009–2014. Antarct. Sci. 2015, 27, 598–616. [Google Scholar] [CrossRef] [Green Version]
  33. Miloshevich, L.M.; Vömel, H.; Whiteman, D.N.; Leblanc, T. Accuracy assessment and corrections of Vaisala RS92 radiosonde water vapour measurements. J. Geophys. Res. Atmos. 2009, 114, D11305. [Google Scholar] [CrossRef] [Green Version]
  34. Press, W.H.; Flannery, B.P.; Teukolsky, S.A.; Vetterling, W.T. Numerical Recipes in C: The Art of Scientific Computing, 2nd ed.; Cambridge University: Cambridge, UK, 1992. [Google Scholar]
  35. Tomasi, C.; Petkov, B.; Benedetti, E.; Valenziano, L.; Vitale, V. Analysis of a 4 year radiosonde dataset at Dome C for characterizing temperature and moisture conditions of the Antarctic atmosphere. J. Geophys. Res. Atmos. 2011, 116, D15304. [Google Scholar] [CrossRef] [Green Version]
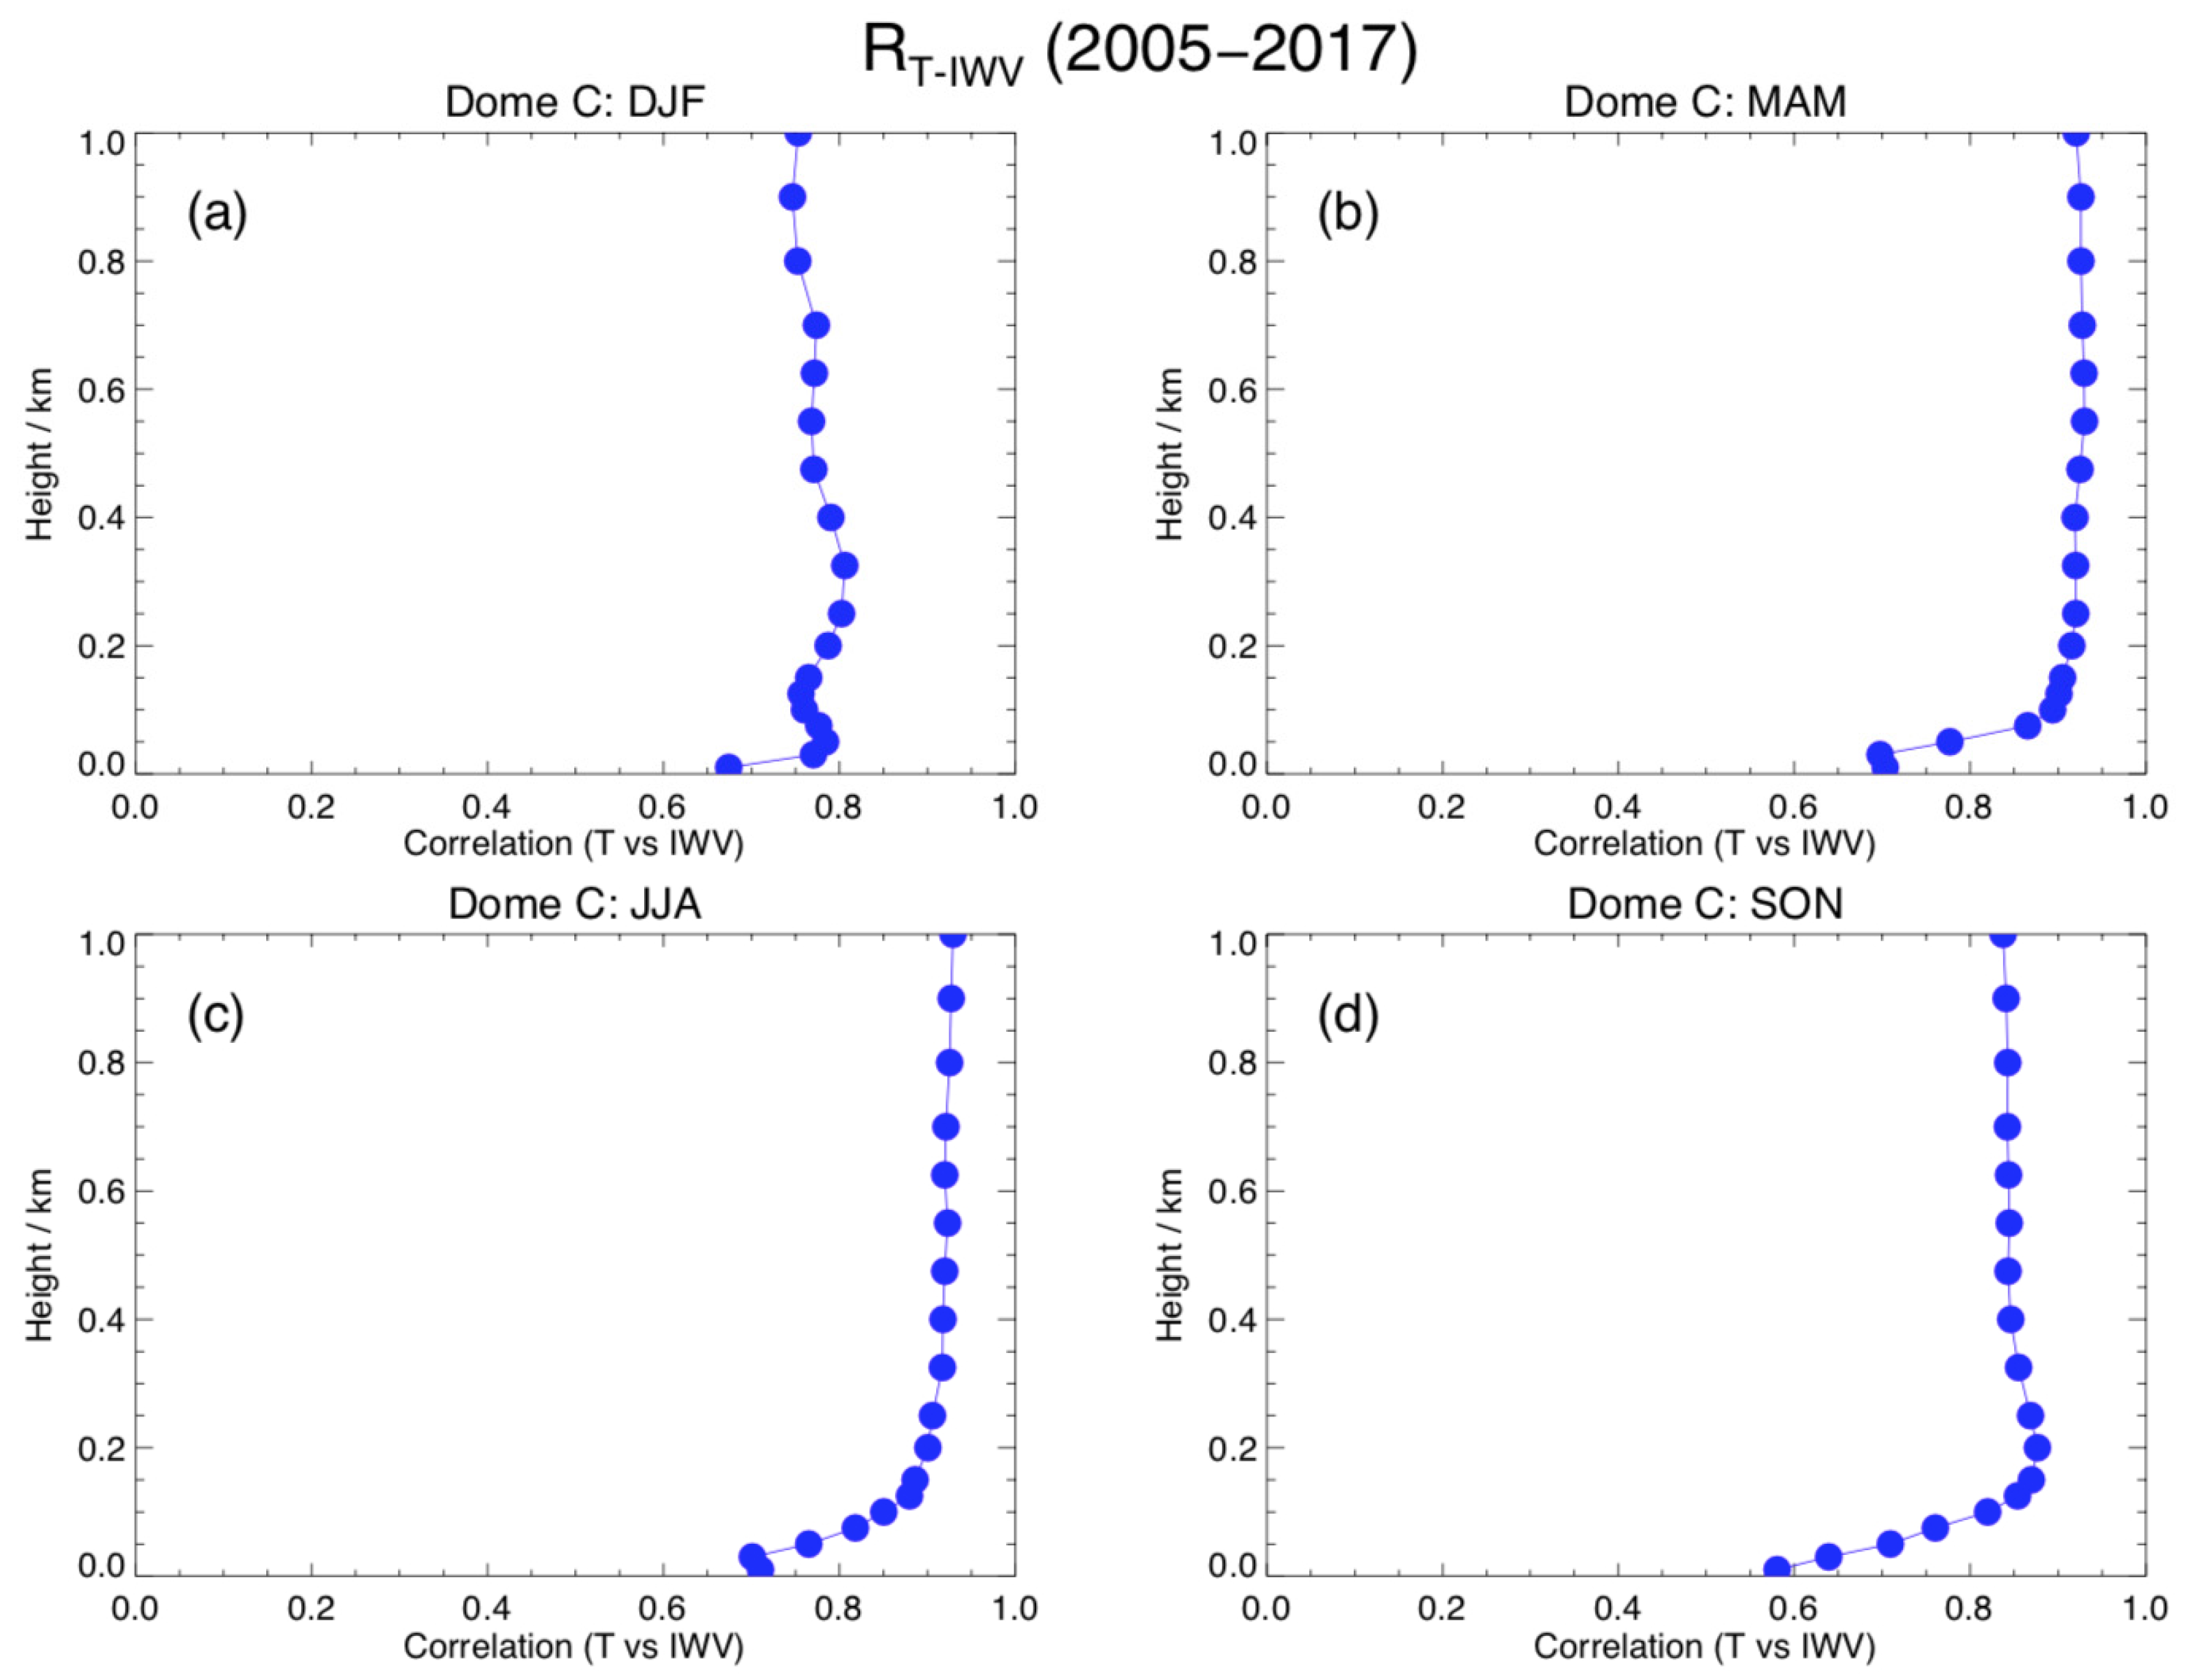
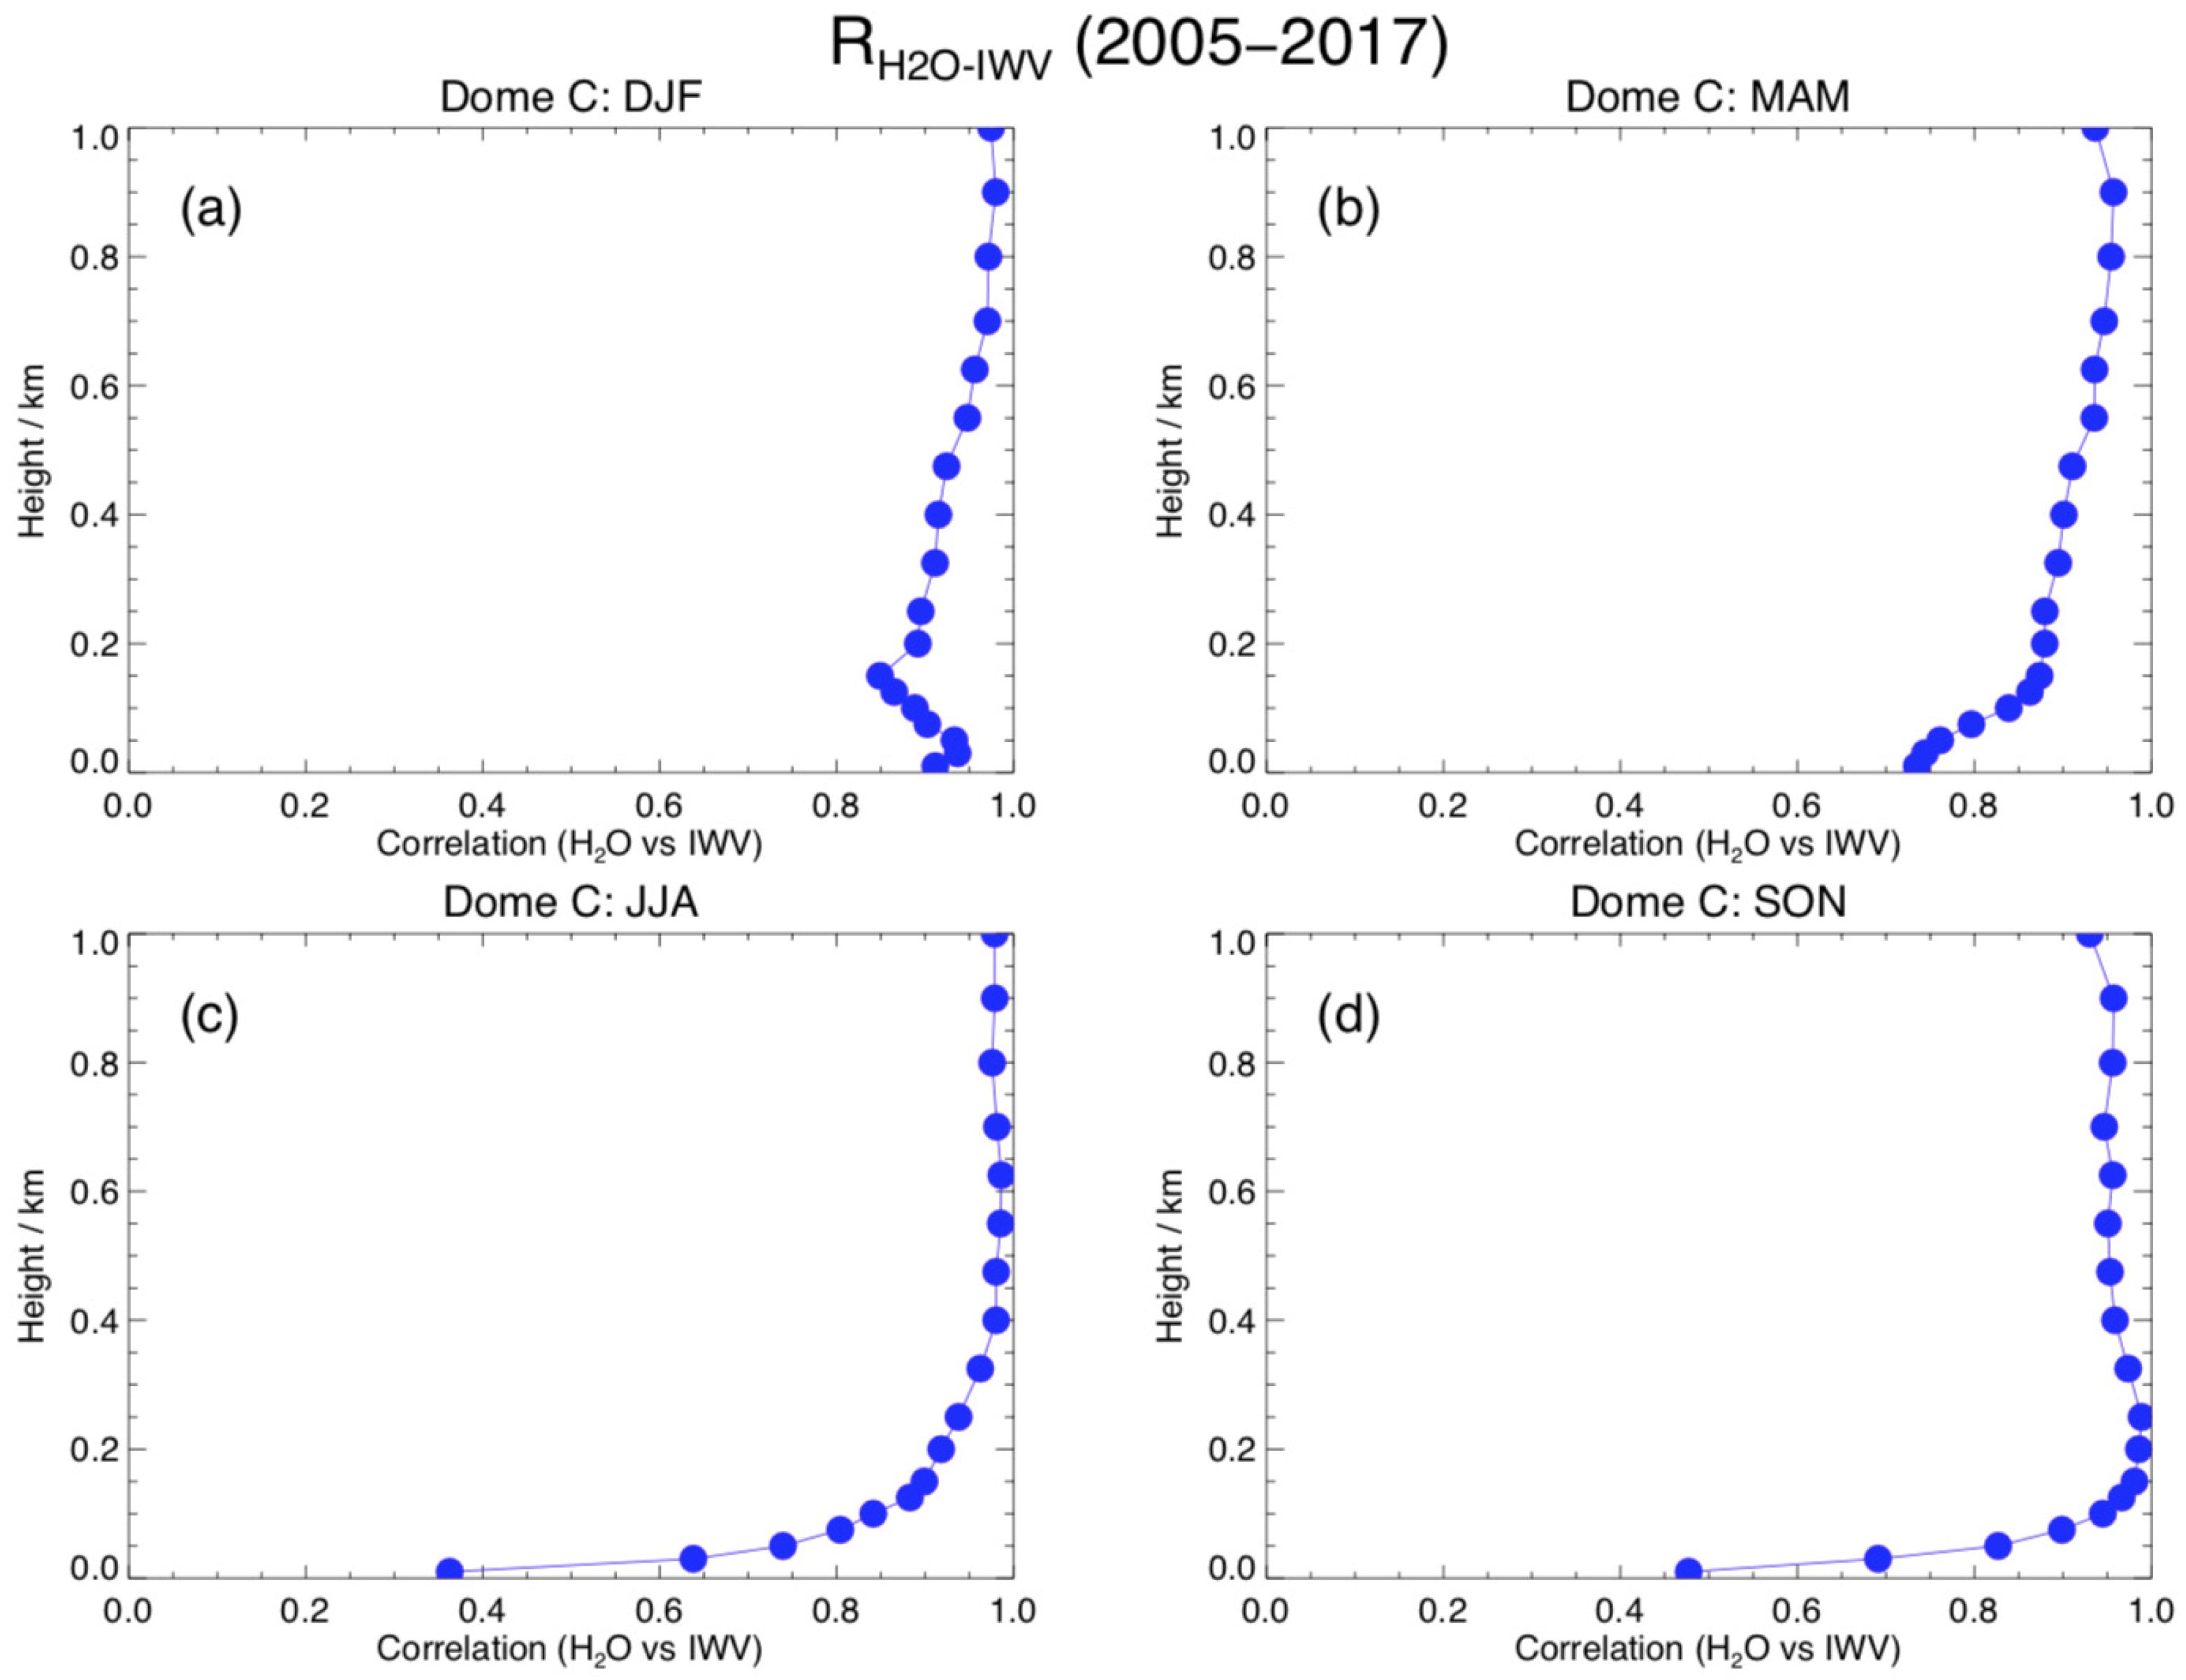
  36. Ricaud, P.; Carminati, F.; Courcoux, Y.; Pellegrini, A.; Attié, J.-L.; El Amraoui, L.; Abida, R.; Genthon, C.; August, T.; Warner, J. Statistical Analyses and Correlation between Tropospheric Temperature and Humidity at Dome C, Antarctica. Antarct. Sci. 2014, 26, 290–308. [Google Scholar] [CrossRef]
  37. Van den Broeke, M.R.; van Lipzig, N.P.M. Changes in Antarctic temperature, wind and precipitation in response to the Antarctic Oscillation. Ann. Glaciol. 2004, 39, 119–126. [Google Scholar] [CrossRef] [Green Version]
  38. Marshall, G.J.; Thompson, D.W.J. The signatures of large-scale patterns of atmospheric variability in Antarctic surface temperatures. J. Geophys. Res. Atmos. 2016, 121, 3276–3289. [Google Scholar] [CrossRef] [Green Version]
Figure 1. Time evolution of daily-averaged IWV (kg m−2) measured at Dome C from 2005 to 2017 by the radiosondes (red filled circles) and from 2009 to 2017 by H2O Antarctica Microwave Stratospheric and Tropospheric Radiometers (HAMSTRAD) (black stars).
Atmosphere 11 00836 g001
Figure 2. Time evolution of daily-averaged 10-m temperature (K) measured at Dome C from 2005 to 2017 by the radiosondes (red filled circles) and from 2009 to 2017 by HAMSTRAD (black stars).
Atmosphere 11 00836 g002
Figure 3. Vertical profile of the linear Pearson correlation coefficient RT-IWV between IWV and temperature (T) from radiosondes at Dome C, over the period 2005–2017 in (a) DJF; (b) MAM; (c) JJA; and (d) SON.
Atmosphere 11 00836 g003
Figure 4. Vertical profile of the linear Pearson correlation coefficient RH2O-IWV between IWV and water vapor (H2O) from radiosondes at Dome C, over the period 2005–2017 in (a) DJF; (b) MAM; (c) JJA; and (d) SON.
Atmosphere 11 00836 g004
Figure 5. Mean profile of water vapor (H2O) from radiosondes at Dome C, over the period 2005–2017 in (a) DJF; (b) MAM; (c) JJA; and (d) SON.
Atmosphere 11 00836 g005
Figure 6. Mean profile of temperature from radiosondes at Dome C, over the period 2005–2017 in (a) DJF; (b) MAM; (c) JJA; and (d) SON.
Atmosphere 11 00836 g006
Figure 7. Mean profile of the decadal linear trends in water vapor (H2O) at Dome C from radiosondes over the period 2005–2017 in: (a) DJF; (b) MAM; (c) JJA; and (d) SON. Horizontal bars represent 1-σ error.
Atmosphere 11 00836 g007
Figure 8. Mean profile of the decadal linear trends in temperature at Dome C from radiosondes over the period 2005–2017 in: (a) DJF; (b) MAM; (c) JJA; and (d) SON. Horizontal bars represent 1-σ error.
Atmosphere 11 00836 g008
Figure 9. Multidecadal variability of the 10-year trends of (a) the SAM index, (b) the IWV and (c) the near-surface temperature (T2m) from the MERRA2 (red), ERA interim (dark blue), ERA5 (light blue) and JRA-55 (green) reanalyses above Dome C from 1980 to 2017 in summer (DJF). Superimposed are the 10-year trends of the IWV (b) and the 10-m temperature (c) from the radiosonde data set (orange) from 2005 to 2017. Vertical bars represent 1-σ error.
Atmosphere 11 00836 g009
Figure 10. Multidecadal variability of the 10-year trends of (a) the SAM index, (b) the IWV and (c) the near-surface temperature (T2m) from the MERRA2 (red), ERA interim (dark blue), ERA5 (light blue) and JRA-55 (green) reanalyses above Dome C from 1980 to 2017 in autumn (MAM). Superimposed are the 10-year trends of the IWV (b) and the 10-m temperature (c) from the radiosonde data set (orange) from 2005 to 2017. Vertical bars represent 1-σ error.
Atmosphere 11 00836 g010
Figure 11. Multidecadal variability of the 10-year trends of (a) the SAM index, (b) the IWV and (c) the near-surface temperature (T2m) from the MERRA2 (red), ERA interim (dark blue), ERA5 (light blue) and JRA-55 (green) reanalyses above Dome C from 1980 to 2017 in winter (JJA). Superimposed are the 10-year trends of the IWV (b) and the 10-m temperature (c) from the radiosonde data set (orange) from 2005 to 2017. Vertical bars represent 1-σ error.
Atmosphere 11 00836 g011
Figure 12. Multidecadal variability of the 10-year trends of (a) the SAM index, (b) the IWV and (c) the near-surface temperature (T2m) from the MERRA2 (red), ERA interim (dark blue), ERA5 (light blue) and JRA-55 (green) reanalyses above Dome C from 1980 to 2017 in spring (SON). Superimposed are the 10-year trends of the IWV (b) and the 10-m temperature (c) from the radiosonde data set (orange) from 2005 to 2017. Vertical bars represent 1-σ error.
Atmosphere 11 00836 g012
Figure 13. Multidecadal variability of the 10-year trends of (a) the SAM index, (b) the IWV and (c) the near-surface temperature (T2m) from the MERRA2 (red), ERA interim (dark blue), ERA5 (light blue) and JRA-55 (green) reanalyses above Dome C from 1980 to 2017 as annual averages. Superimposed are the 10-year trends of the IWV (b) and the 10-m temperature (c) from the radiosonde data set (orange) from 2005 to 2017. Vertical bars represent 1-σ error.
Atmosphere 11 00836 g013
Figure 14. Linear Pearson correlation coefficient R between IWV and SAM index (filled circles), near-surface temperature and SAM index (triangles) and IWV and near-surface temperature (stars) for the MERRA2 (red), ERA Int (dark blue), ERA5 (light blue) and JRA-55 (green) data sets at Dome C, over the period 1980–2017, for the four seasons (DJF, MAM, JJA and SON), and as annual averages (Year).
Atmosphere 11 00836 g014
Table 1. Decadal trends in IWV (kg m−2 dec−1) and in 10-m temperature (K dec−1) along with 1-σ error for HAMSTRAD (‘HAMS’) and radiosondes (‘RS’), based either on seasonally-or annually-averaged data over 2012–2017, and over 2005–2017 for radiosondes only. Significant trends are highlighted in green.
Data Sets Summer
(DJF)
Autumn
(MAM)
Winter
(JJA)
Spring
(SON)
Year
IWV
HAMS 2012–20170.09 ± 0.22−0.05 ± 0.07−0.04 ± 0.090.02 ± 0.280.04 ± 0.06
RS 2012–20170.04 ± 0.17−0.08 ± 0.07−0.06 ± 0.080.01 ± 0.12−0.07 ± 0.05
RS 2005–20170.08 ± 0.06−0.04 ± 0.03−0.05 ± 0.030.01 ± 0.04−0.01 ± 0.04
10-m Temperature
HAMS 2012–20178.68 ± 8.77−3.18 ± 3.66−7.10 ± 3.152.69 ± 11.421.33 ± 0.96
RS 2012–20170.79 ± 1.00−10.03 ± 1.30−9.88 ± 3.70−1.99 ± 3.24−2.65 ± 0.72
RS 2005–20171.08 ± 0.55−2.43 ± 1.16−5.06 ± 1.99−0.30 ± 1.35−1.80 ± 1.54
Table 2. Multidecadal trends in IWV (kg m−2 dec−1) and near-surface temperature (K dec−1) from the 4 data sets (MERRA2, ERA Interim (ERA-Int), ERA5 and JRA-55) and in SAM index (index dec−1) from [30] along with 1-σ error over the 38-year period (1980–2017), based either on seasonal or annual averages. Significant multidecadal trends are highlighted in green.
Data SetsSummer
(DJF)
Autumn
(MAM)
Winter
(JJA)
Spring
(SON)
Year
IWV
MERRA20.012 ± 0.0090.006 ± 0.008−0.004 ± 0.0060.007 ± 0.0040.005 ± 0.004
ERA-Int−0.035 ± 0.011−0.008 ± 0.007−0.015 ± 0.007−0.001 ± 0.005−0.015 ± 0.004
ERA5−0.017 ± 0.010−0.007 ± 0.007−0.014 ± 0.0070.003 ± 0.005−0.008 ± 0.004
JRA−55−0.010 ± 0.009−0.001 ± 0.007−0.009 ± 0.0060.008 ± 0.004−0.003 ± 0.004
Near-Surface Temperature
MERRA20.07 ± 0.16−0.11 ± 0.25−0.56 ± 0.35−0.15 ± 0.19−0.19 ± 0.17
ERA-Int−0.15 ± 0.14−0.20 ± 0.24−0.41 ± 0.390.01 ± 0.20−0.19 ± 0.15
ERA50.21 ± 0.15−0.24 ± 0.24−0.63 ± 0.360.06 ± 0.20−0.15 ± 0.13
JRA-55−0.16 ± 0.110.09 ± 0.24−0.08 ± 0.290.40 ± 0.170.06 ± 0.14
SAM Index
SAM0.08 ± 0.13−0.09 ± 0.090.20 ± 0.140.08 ± 0.120.04 ± 0.08

