Dust Deposition on the Gulf of California Caused by Santa Ana Winds
by
 , and
, and
Christian A. Álvarez
1,* ,
,
José N. Carbajal
1,
Luis F. Pineda-Martínez
2,
José Tuxpan
1 and
David E. Flores
3 1
División de Geociencias Aplicadas, Instituto Potosino de Investigación Científica y Tecnológica, A.C., 2055 Camino a la Presa San José, 78216 San Luis Potosí, Mexico
2
Unidad de Ciencias Sociales, Universidad Autónoma de Zacatecas, 108 Calzada Universidad, 98066 Zacatecas, Zacatecas, Mexico
3
Instituto de Ingeniería, Universidad Autónoma de Baja California, Blvd. Benito Juárez, Calle de la Normal s/n, Col. Insurgentes Este, Mexicali, 21280 Baja California, Mexico
*
Author to whom correspondence should be addressed.
Atmosphere 2020, 11(3), 275; https://doi.org/10.3390/atmos11030275
Submission received: 16 February 2020
/
Revised: 3 March 2020
/
Accepted: 6 March 2020
/
Published: 10 March 2020
(This article belongs to the Special Issue Emissions, Transport and Fate of Pollutants in the Atmosphere)
Abstract
:Numerical simulations revealed a profound interaction between the severe dust storm of 2007 caused by Santa Ana winds and the Gulf of California. The weather research and forecasting model coupled with a chemistry module (WRF-CHEM) and the hybrid single-particle Lagrangian integrated trajectory model (HYSPLIT) allowed for the estimation of the meteorological and dynamic aspects of the event and the dust deposition on the surface waters of the Gulf of California caused by the erosion and entrainment of dust particles from the surrounding desert regions. The dust emission rates from three chosen areas (Altar desert, Sonora coast, and a region between these two zones) and their contribution to dust deposition over the Gulf of California were analyzed. The Altar Desert had the highest dust emission rates and the highest contribution to dust deposition over the Gulf of California, i.e., it has the most critical influence with 96,879 tons of emission and 43,539 tons of dust deposition in the gulf. An increase of chlorophyll-a concentrations is observed coinciding with areas of high dust deposition in the northern and western coast of the gulf. This kind of event could have a significant positive influence over the mineralization and productivity processes in the Gulf of California, despite the soil loss in the eroded regions.
1. Introduction
Every year, dust storms take place in the arid and semi-arid regions of the world [1]. The drylands such as northwest China, southwest Asia, Australia, Africa, South America, and the southwestern U.S. are some of the familiar places where these events develop. An estimated 2000 teragrams of dust per year are generated worldwide, caused naturally or anthropogenically induced [2]. Sahara dust storms are the largest source of atmospheric dust, reaching Northern Europe and contributing to around 50% of the total registered dust [1,3]. Anthropogenic actions such as land clearing and unfortunate agricultural activities have a direct relation to the increase of the frequency and magnitude of dust storms [4]. Sparse vegetation in arid and semi-arid regions produce vulnerability in the soil for wind erosion, allowing the formation of dust storms [5]. Dust storms have a direct impact on human health, even being able to influence the climatic patterns and energy balance of the earth system [1,6].
In northwestern Mexico, the dust storms are associated principally to the Santa Ana Winds. Every year, during autumn and winter, Northwestern Mexico and Southwestern U.S. are affected by them [7]. According to [8], around 20 events occur per year (on average) with a mean duration of 1.5 days, being able to modify significantly atmospheric variables like temperature and humidity. Santa Ana winds belong to a kind of föehn flux [9]. These winds come from arid lands with high temperatures and low humidity and propagate perpendicular to the coast of California and Baja California [10]. In some cases, they could produce strong gusts, allowing them to start fires and dust storms, which bring high economic losses [11].
Santa Ana winds are the result of the combination between specific synoptic conditions and topography [12]. The two central systems involved are the high-pressure system above the Great Basin in the USA, along with a low-pressure system in California or Baja California [8]. The anticyclonic winds are redirected towards the southern California coast and accelerated by the Sierra Nevada [13], similar to the Berg winds where an anticyclone inland produces a strong outflow forced to interact with topography reaching a wind speed high enough to transport dust [14]. The hot and dry components of the offshore winds come from the Great Basin and the Mojave Desert through mountains to Southern California [10], and by process of warming through adiabatic compression as the mass of air descends the topographic slopes. The heating mechanism of Santa Ana winds results from the compression suffered during the descent of wind from the Great Basin Desert (at higher altitude) to the California coast (at lower altitude) [11].
Densely populated urban areas such as Los Angeles and San Diego in the USA and Tijuana, Mexicali, and Ensenada in Mexico are affected during Santa Ana winds events. In October 2003, Santa Ana winds caused over 12 major fires, burning 3000 km2 by November [11], with an estimated damage cost of $2 billion [15]. Another event that occurred in October 2007 was a particularly intense event causing several dust storms and wildfires that burned 2092.22 km2 [16]. Despite the adverse effects on the population, the oceanic thermal and biological response to Santa Ana winds also has been documented [17,18]. Positive effects through upwelling filaments caused by Santa Ana winds in Northern Baja California, where the cold temperatures of deeper water reach the surface, were exposed by [19]. Upwelling has been considered the central controller on high levels of primary production [20]. Santa Ana winds events caused changes in the concentration of chlorophyll-a during this kind of event on the coastal waters of the Pacific Ocean [21]. The frequency of dust storms in northwestern Mexico leads to the transport of large amounts of dust that could fertilize the ocean surface during the winter season [22].
The Gulf of California is one of the most productive and marginal seas in the world [23], which has led to many research works. The observed existence of blooms in the Gulf of California suggests the existence of mineralization processes [24,25,26]. Aeolian dust has been considered as the primary source of iron in the open ocean, which is essential for all organisms [27]. According to [28], iron is essential since many metabolic functions including nitrogen fixation would not be possible without iron (Fe). A strong association between a dust storm and anomalously high biological production in the Arabia Sea has been reported [26]. Some authors have discussed the influence of atmospheric dust on the productivity of the Gulf of California. Through a study of the atmospheric iron contribution and dissolved Fe [28], the importance of aeolian Fe by changing the productivity of the Gulf of California and the role of the desertic areas surrounding was considered. The atmospheric iron fluxes in the Gulf of California were studied and the source of this contribution discussed [29]. The particle fluxes in the Gulf of California were studied, resulting in a season and annual variability due to changes in wind direction by climate forcing [30]. The areas with the best conditions through a spatial-temporal analysis of wind conditions and soil vulnerability to wind erosion were evaluated in order to propose the best sources areas to transport atmospheric dust in the Gulf of California [31].
This research work aims to analyze the severe dust storm of 2007 caused by Santa Ana winds. Their meteorological and dynamical aspects are examined using the WRF-Chem Model. Dust storm simulation of these events has been done in the past, finding high dust concentrations over the Pacific Ocean and the Gulf of California [32,33]. It is worth investigating the dust concentration distribution and its interaction with the Gulf of California during a Santa Ana winds event because of the possible biological repercussions. An estimation of dust deposition within the Gulf was performed. The results and their possible role in the mineralization of the Gulf are discussed.
2. Study Area
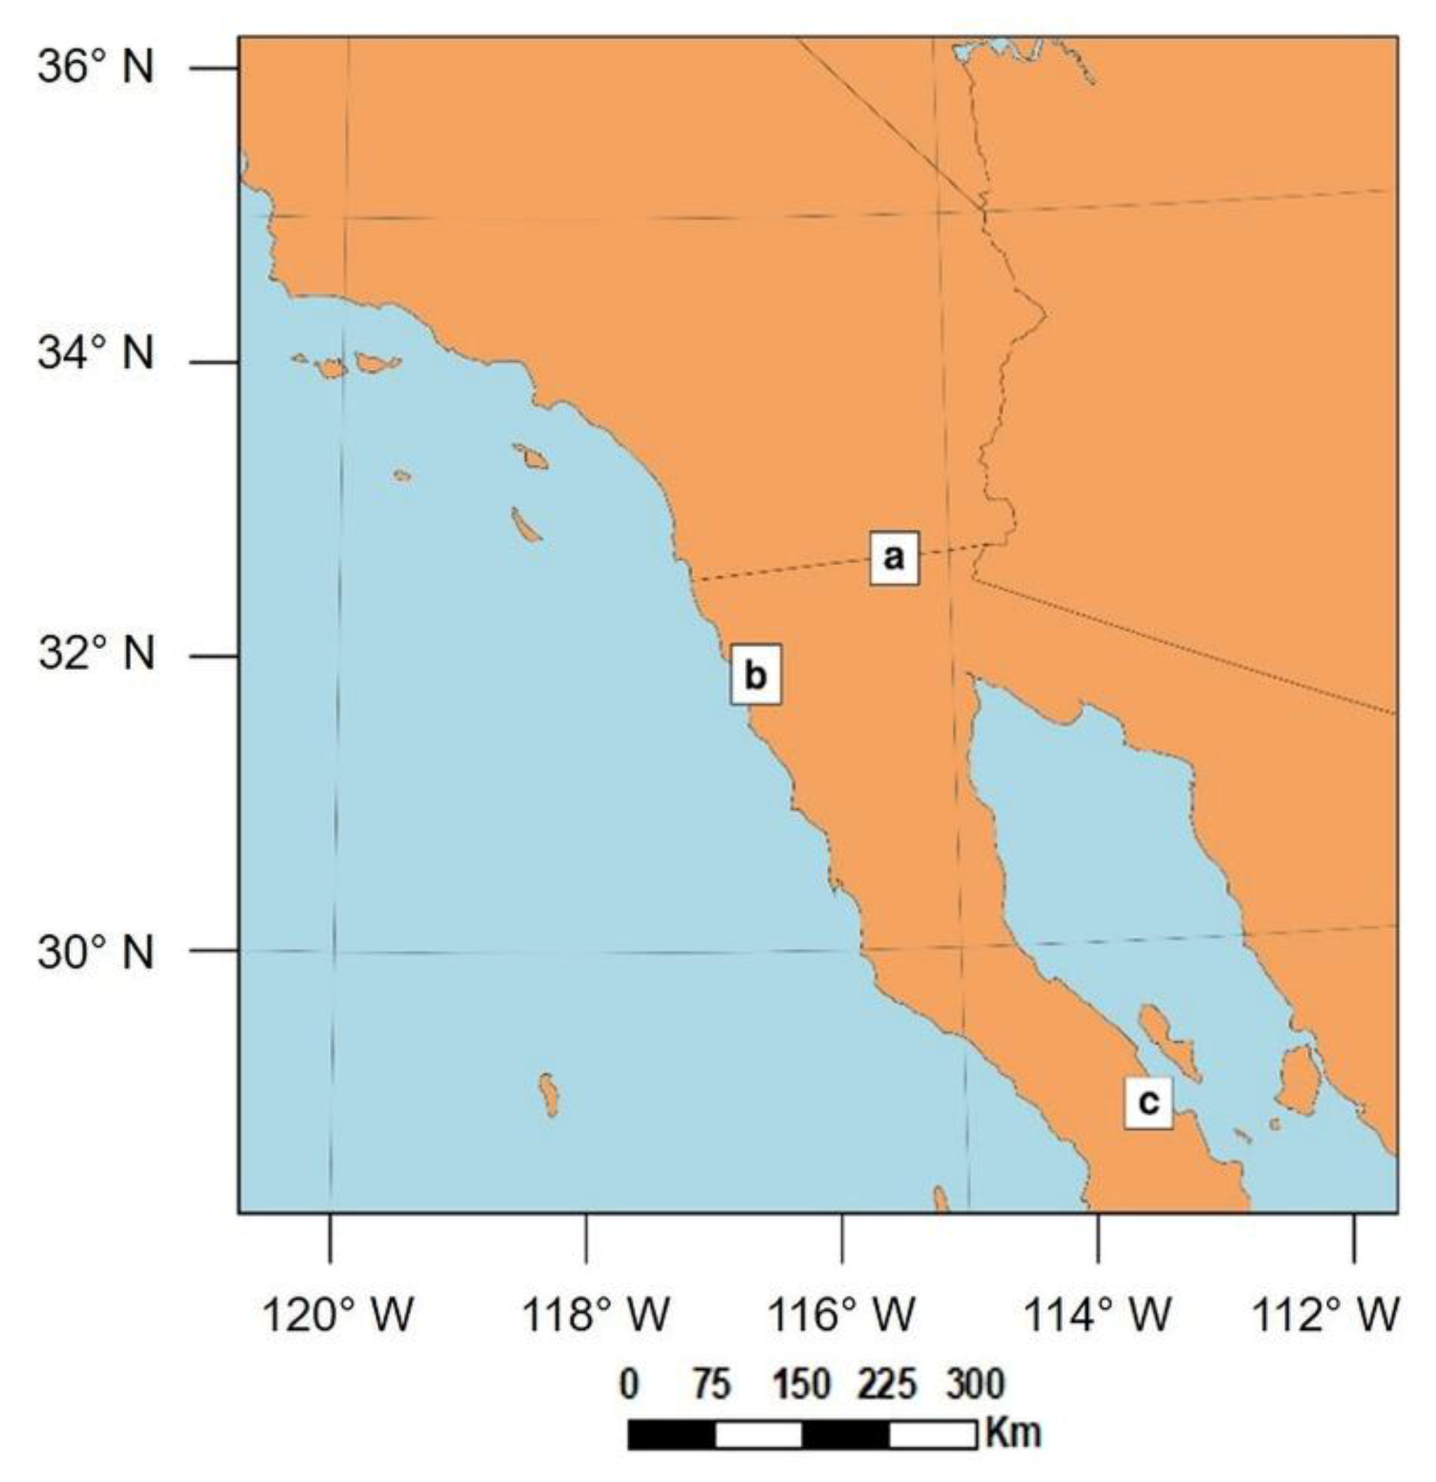
The study area is located in Northwestern Mexico (North of Peninsula of Baja California, Gulf of California, and Sonora) and includes the Southwestern USA Figure 1. The Great Desert of Altar and the Pinacate Desert at the north of the Gulf of California, are the largest active dune field in North America [34], with dunes of 200 m of height. The presence of alluvium and plains characterizes the west coast of Sonora [35].
Dry and arid conditions determine the climate of the study area where predominate the arid, semi-dry, desert with temperate zones and warm desert [38]. The land use and the vegetation cover correspond to vegetation from arid lands. There are different types of scrub with most dominanct being microphyllous scrub [36]. For the Great Desert of Altar, the vegetation is for sandy desert and barren areas. On the west coast of Sonora, most of the vegetation cover is microphyllous scrub, with some areas covered by sarcocaulescent desert shrubs, xerophile mezquital, as well as induced and cultivated pastures [36].
The Gulf of California is located in the northwestern part of Mexico. It is classified as a marginal sea and considered the only evaporation basin in the Pacific Ocean [39]. The length of the gulf reaches approximately 1000 km, with an average width of 150 km. The Pacific Ocean and the wind regime present in the region influence the thermodynamics and seasonal circulation in the Gulf of California [40]. There is a difference in the physical properties of water in the gulf, depending on the region. The north region contains high surface salinity with temperatures varying between 10 °C and 32 °C in winter and summer, respectively [41]. The temperatures in the central part of the gulf are 16°C during winter and 31°C in summertime [42], with low surface salinity caused by a flowing stream over the east coast in a northwest direction [43]. During the summer season, most of the rain over the Sonoran Desert comes from humidity generated in the Gulf of California [44]. During the winter, surface winds prevail from the north, while in summer, surface winds blow from the south [45].
Description of the Event
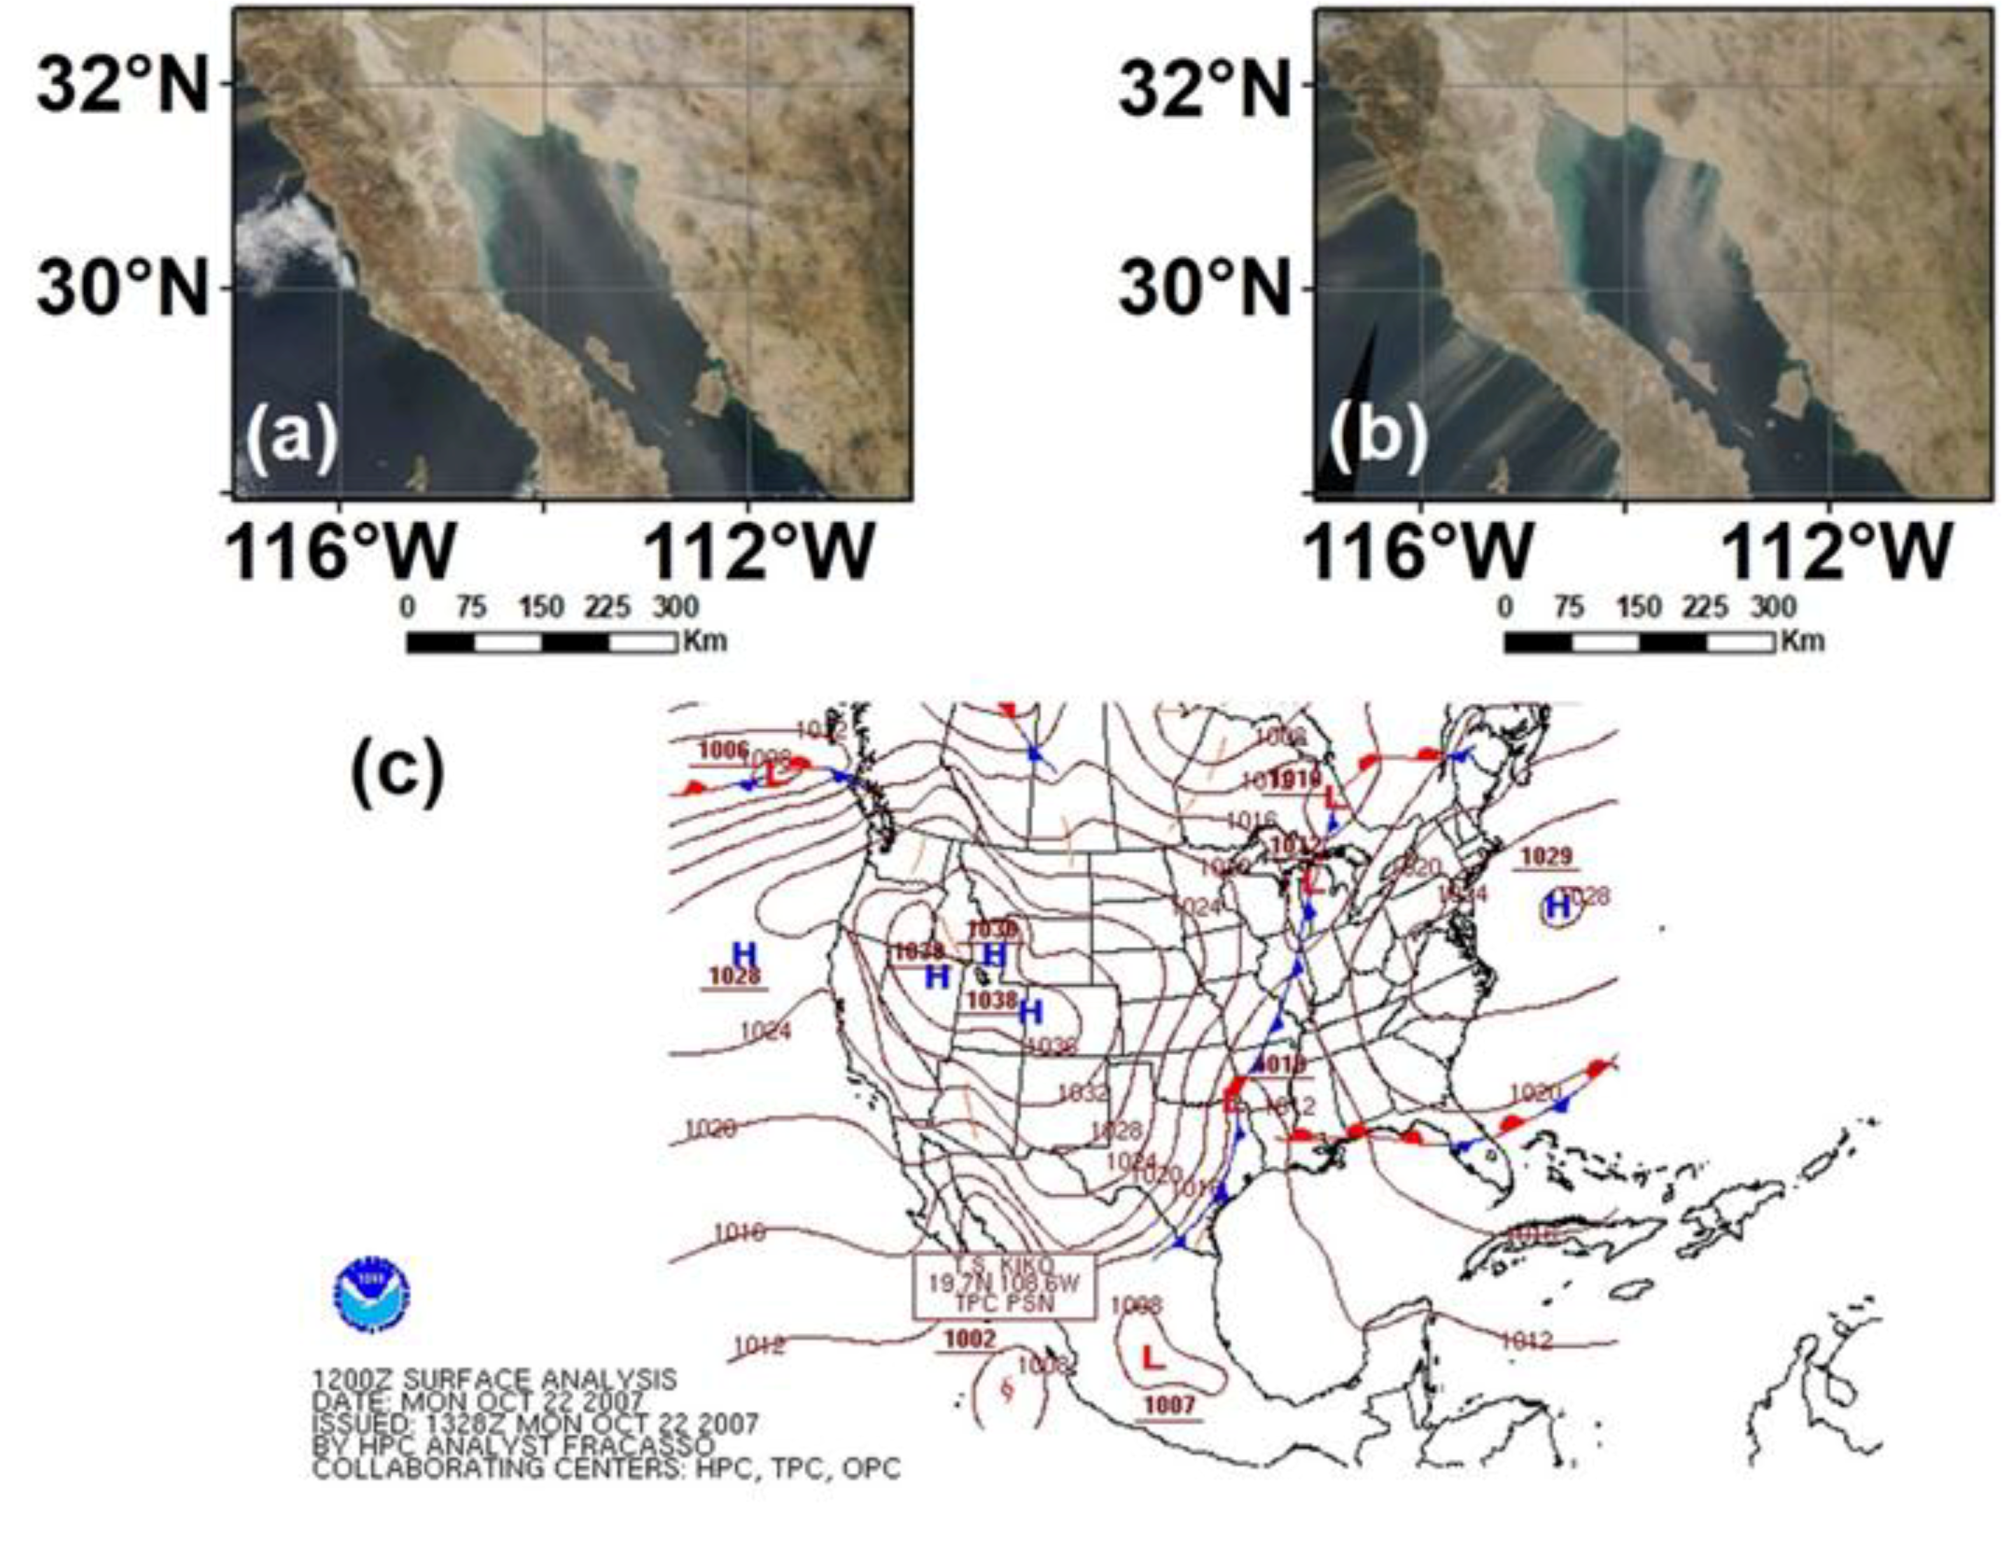
On October 21 2007, several fires and dust emissions devasted important areas of California and deteriorated the air quality of vast zones of California and Mexico. Dust emissions continued until October 23, while some fires were contained until November (Figure 2a,b) [16]. From October 21 to October 23, a high-pressure system was located above the Great Basin Desert along with a low-pressure system at the south of the Baja California Peninsula, giving the formation and intensification of Santa Ana Winds. The high-pressure system at surface levels was initially in the Pacific Ocean, and then it moved inland to east on October 21. When the high-pressure system reached the Great Basin, the anticyclonic flow caused geostrophic winds from the northeast, flowing perpendicularly to the coast of California and Baja California, and they were forced to interact with topographic features like the Sierra Nevada. These geostrophic winds knowns as Santa Ana winds started several fires and significant dust emissions. On October 22, the synoptic conditions are the typical conditions for the formation of Santa Ana winds [8,10], with a high-pressure system above the Great Basin (see Figure 2c). Along with this high-pressure system, the tropical storm Kiko at the south of the Baja California peninsula caused a strong pressure gradient along the coast. On October 24, the high-pressure system above the Great Basin moves to the east, and the tropical storm moves to southwest, weakening the pressure gradient along the coast and decreasing the intensity of Santa Ana winds to finally change the wind direction to the south as the previous conditions before the event [33].
3. Methodology
The weather research and forecasting (WRF) model is a numerical weather prediction and atmospheric simulation system designed for both research and operational applications [46]. There exist several WRF-related systems, each of them with specific characteristics. One of these options is the WRF coupled with chemistry (WRF-Chem). This model simulates the emission, transport, mixing, and chemical transformation of trace gases and aerosols simultaneously with meteorology [47]. In this study, the WRF-Chem model was used to simulate the meteorology conditions and dust emissions over the Gulf of California from October 21 to October 23, 2007. The domain configuration used was a single domain of 100 ×100 grid points, with 9 km of resolution centered on 32.21° N, 116.08° W (Figure 1) and a time step of 54 s (see Figure 3). The model ran with National Centers for Environmental Prediction Final Analysis (NCEP FNL) operational model global tropospheric analyses [48] data with a 1° grid-scale and 6 hourly output. Static data selected were provided by the USGS, with 33 categories of land use and a topography resolution of 30 s. The vertical grid was composed of 29 sigma levels from the surface to ~10 km using a smaller spacing in the low levels. The total time simulation, embraces from Oct 19, 2007 to Oct 24, 2007, including the spin-up time.
The physical parameterizations used were: WRF Single-moment 3 for microphysics [49], Dudhia and RRTM scheme for shortwave and longwave radiation [50,51], Pleim-Xiu scheme for surface layer [52], land surface options [53], and Kain–Fritsch scheme for cumulus parameterization [54] (see Table 1). The chemical options used were: the Shao2011 dust emission scheme [55], along with GOCART simple module, which considers total dust as 5 dust bins with size diameters of 0–2 µm, 2–3.6 µm, 3.6–6 µm, 6–12 µm, and 12–20 µm. Several sensitivity experiments allowed determining the applied physical and chemical options. The results obtained come from the combination of the schemes mentioned above. WRF-Chem simulations were validated using data from three of the nearest meteorological stations (Figure 1). Statistical estimators as RMSE and bias were calculated (Table 2). The model reproduces wind speed high-frequency oscillations adequately during Santa Ana winds event. Although underestimation is observed in the crests with observed data in Ensenada and Bahía de los Ángeles, wind speed is adequately modeled in Mexicali, which is the nearest station to the dust emission areas analyzed. The wind speed variable has a direct impact in the dust emission rate. The temperature oscillations and tendencies are well represented, although underestimation in observed in the temperature peaks during the analyzed days. An overestimation of relative humidity simulated in the west Peninsula of Baja California is shown by the high RMSE in Bahía de los Ángeles and Ensenada. However, the relative humidity in Mexicali is adequately simulated by the model.
High concentrations of PM10 were recorded in the urban area of Tijuana, reaching 800 µg/m3 on October 21 and 970 µg/m3 on October 22. Although the chosen scheme is one of the most accurate because of its physical approach, some inconsistencies are observed between the modeled and the recorded concentrations since the maximum PM10 concentration modeled is 632 µg/m3. This can be explained by the underestimation of wind speed on the west side of Baja California and the emission of aerosol because of wildfires, which could influence the observed PM10 concentrations in southern California and northern Baja California, and this is not considered by the dust emission scheme. However, this influence could be very little or inexistent in the atmosphere over the Gulf of California because the wind direction in the wildfires area was toward the Pacific Ocean.
In addition to the WRF-Chem simulations, the hybrid single-particle Lagrangian integrated trajectory (HYSPLIT) Model was used for a more in-depth analysis of the dust simulations. This model is a complete system for computing simple air parcel trajectories, as well as complex transport, dispersion, chemical transformation, and deposition simulations [56]. The model calculation method is a hybrid between the Lagrangian approach and the Eulerian methodology, allowing to calculate trajectories (single or multiple), wet and dry deposition, resuspension, and air concentrations among others. In this case, the WRF-Chem model outputs were used in the initialization of the HYSPLIT model. The results were then post-processed for its interpretation.
3.1. Dust Deposition Estimation Methodology
The methodology to estimate the amount of mass deposited is described in the following. In order to get an estimation of the quantity of dust deposited on the Gulf of California, a methodology was proposed using Lagrange trajectories and dust emission output of WRF-CHEM simulations. After the WRF-CHEM simulation, the output is used as an input data for HYSPLIT taking the advantage of the vertical and horizontal spatial resolution of the input data for calculating forward trajectories with a time step of 10 min. Particle emission experiments were carried out in different coastal zones. In each zone, there were 10,000 homogeneously distributed particles. Through trajectories simulations of particles using HYSPLIT and post-processing, it was possible to estimate the percentage of emitted particles that fall in the Gulf of California. The trajectory simulations duration is 12 h, giving final deposition positions. The particles emitted belong to the initial instant of the simulation. However, a simulation of continuous emission of particles was not carried out. The distribution of trajectories of the first 10,000 particles represents the distribution of trajectories of all particles emitted over 12 h, and they have the same final percentage of particles deposited in the gulf. In other words, the spatial distribution of the initial 10,000 particles is representative of the distribution at other time steps for 12 h. For a specific emission zone, WRF-CHEM dust emission output allows calculating the total emission of dust mass. The same percentage of the 10,000 particles that fall on the waters of the gulf is applied to the total dust mass emitted in the 12-h simulation. In this way, the dust mass deposited in the Gulf of California is obtained. From October 21 at 12:00 UTC until October 23 at 24:00 UTC, five 12-h periods were simulated, and each simulation began with the emission of 10,000 particles following the same methodology.
The principal assumption to calculate the mass of dust deposited is that in 12 h, the particles emitted in each time step follow similar paths. The deposition of particles on the waters of the Gulf of California is then estimated simply by multiplying the percentage of the deposited mass of the particles emitted in the first time step by the number of time steps in the 12 h. The aim is now to justify this assumption. The 12 h was divided into two experiments of 6 h each, that is, in each experiment, there was an emission of particles in the first time step, the amount of total mass deposited was estimated for these particles and multiplied by the number of time steps in 6 h. In the experiment of the first 6 h, the amount of dust emitted was about 12951 tons, and the amount deposited was approximately 7915 tons. This represented 61% of the total issued. In the second 6 h, the total amount of dust emitted was 25,147 tons, and the amount of dust deposited on the gulf was 15,704 tons, that is, 62%. Adding the results of the two 6-h periods results in a total dust emission of 38,098 tons and a total deposited of 23,620 tons. These data compared to the 12-h experiment (38,097 tons emitted and 23,285 deposited) are quite similar, and they suggest that the assumption of similar trajectories for 12 h is acceptable at first approximation.
4. Results
4.1. Temperature and Wind
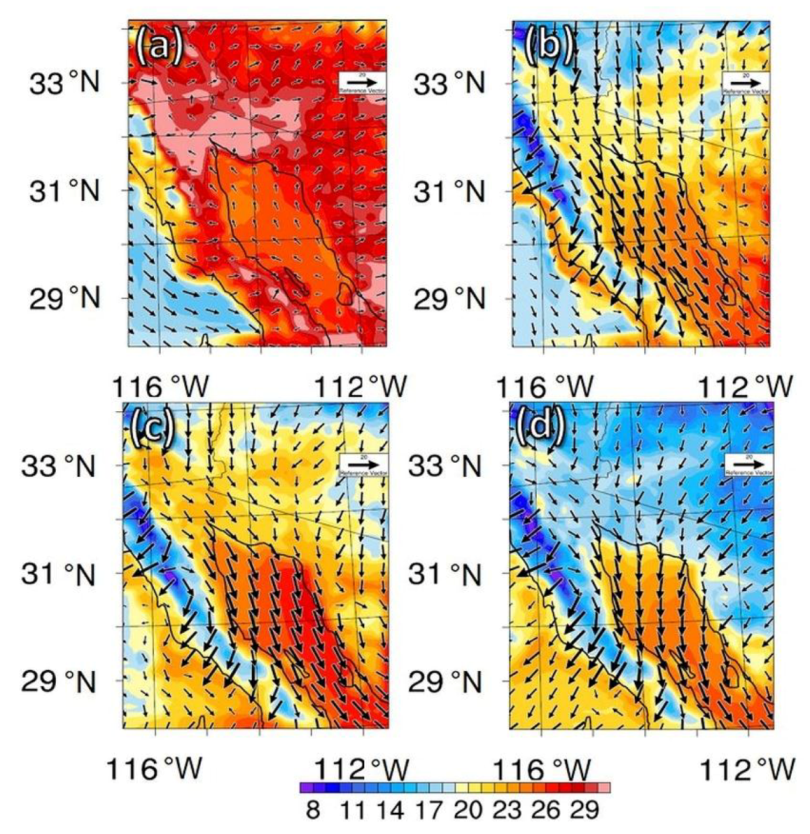
During the first hours of October 21, the wind direction was northern over the Gulf of California (Figure 4a). The modeled wind speed was between 1 m/s and 6 m/s. At 7:00 UTC, wind direction changed to the southeast, and by 17:00 UTC, the wind over the Gulf of California was southeast (Figure 4b). The wind speed increases from 2.5 m/s to 17.0 m/s between 9:00 UTC and 21:00 UTC of October 21, reaching a peak of 18.5 m/s at 2:00 UTC of October 22 (Figure 4c). The low-temperature oscillation (from 23°C to 26°C), modeled during the most intense Santa Ana winds days, night, and day revealed the high heat capacity of the Gulf of California. This allows maintaining a temperature contrast between the cold temperatures inland at the north and the warm temperature over the Gulf of California (Figure 4d). The contrast was 8 °C in some periods. This temperature contrast increases the pressure gradient extending from high-pressure inland at the north, to low pressure in the Gulf of California, and the wind speed has an increase as a response. Wind speed over the Desert of Altar was able to erode the soil and transport it over the Gulf of California.
4.2. Relative Humidity
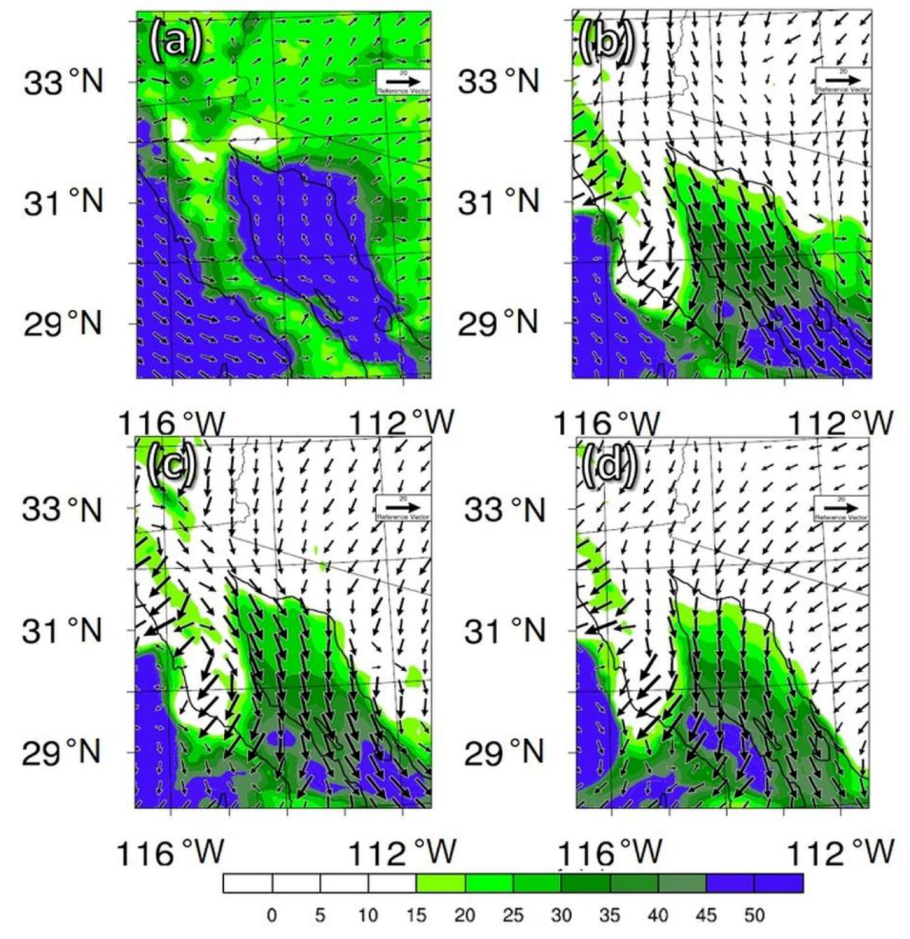
The modeled relative humidity for California varied between 25% and 40% while in the Gulf of California, was higher than 60% (Figure 5a). With the arrival of Santa Ana winds, at approximately 12:00 UTC on October 21, the humidity on the mainland was reduced to 10% - 15%, while the southward flow of the winds reduced the relative humidity over the Gulf of California, at 00:00 UTC on October 22, the relative humidity reached a minimum value of about 15 % (Figure 5b). In most of the mainland, the relative humidity reached values less than 15%, in Sonora’s west coast, relative humidity reached lower values than 15%, and in the Gulf of California, low relative humidity values reached their maximum extent (Figure 5c). More specifically, at the beginning of October 21, weak winds transported humidity from the Gulf to the coast, reaching a peak of 50%, between 15:00 UTC and 22:00 UTC on October 21, relative humidity decreases from 48% to 11% and decreasing to 6% at 4:00 UTC on October 22. The wind conditions caused a low relative humidity to the Gulf of California, with a notable reduction to values between 15% and 30%. By the end of October 23, it starts a slow humidity recuperation over the Gulf because of decreasing wind speed (Figure 5d).
4.3. Dust Concentrations
Figure 6 describes the average dust concentrations simulated over the northern part of the Gulf of California and its oscillation during the Santa Ana wind event. Before the event, the average dust concentrations simulated were insignificant, but throughout October 21, the average concentrations grew dramatically to more than 6000 µg/m3 and remained very high until October 24. It is shown below that the distribution of the dust concentration had a considerable variation both spatially and temporarily over the Gulf of California.
Initially, dust emissions were irrelevant in the entire domain (Figure 7a). Significant dust emission starts at the northern side of the Desert of Altar when wind direction turns to south at 07:00 UTC on October 21 and one hour after, wind speed increase to 8 m/s over the Desert of Altar causing the start of erosion, emitting concentrations above 3000 µg/m3. Wind intensification between 9:00 UTC and 19:00 UTC on October 21 with southeast direction transport substantial quantities of dust over the Gulf of California. At 00:00 UTC on October 22, the dust emission produced dust concentrations of more than 10,500 µg/m3 (Figure 7b). Dust concentration reach values above 10,000 µg/m3 on Sonora’s coast, and 8000 µg/m3 above the Gulf of California. The mean dust concentration above the Gulf of California at the first hours of October 21 is low, under 100. Between the 18:00 UTC and 22:00 UTC on October 21, the mean concentration has a sharp increase in reaching about 6550 µg/m3. Dust concentrations remained very high in coastal areas on the mainland side on October 23 and 24 and generally high over the Gulf of California (Figure 7c,d). The most critical emission area the Desert of Altar on October 21. The wind speed reaches 10 m/s over the east coast of the Gulf of California (Sonora’s west coast) at 17:00 UTC. At 22:00 UTC the area of emission grows from the Desert of Altar to Guaymas. Figure 7 reveals that the wind can transport dust from the Sonora’s coast to the Pacific Ocean, crossing over the Gulf of California and the Peninsula of Baja California through elevations that allow it. Through October 23 and October 24, the mean dust concentration over the Gulf of California decreases slightly along with the wind speed reaching lower concentrations.
Since the intention is to investigate dust deposition on the Gulf of California, vertical dust concentration transects give relevant information on dust concentrations in the lower layers of the atmosphere. Three cross-sections and one along the gulf gives valuable information on the vertical distribution of dust (Figure 8a), and all suggest significant deposition of dust on the Gulf of California waters. In the vertical section along the Gulf of California (Figure 8b), concentrations of dust above 5000 µg/m3 can be observed, reaching almost 1 km in height. Figure 8c depicts that the source of dust is in the Desert of Altar on the mainland side of the gulf, along the coast of Sonora. The dust flux, emitted in the Altar desert, covers the entire northern part of the Gulf of California, and it leads to very high dust concentrations on the east side of the gulf with 6000 µg/m3 in the lower layers of the atmosphere. Throughout the three days considered in the analysis of the dust concentration, the contributions in the archipelago area were due primarily to dust from the Altar desert (Figure 8d) and then from desert areas in southern Sonora (Figure 8e). High wind speeds, between 10 m/s and 18 m/s, led to high dust concentrations of more than 6000 µg/m3 throughout the northern part of the Gulf of California and also further south along the yellow line vertical section (Figure 8f).
4.4. Estimation of Dust Deposition over Gulf of California
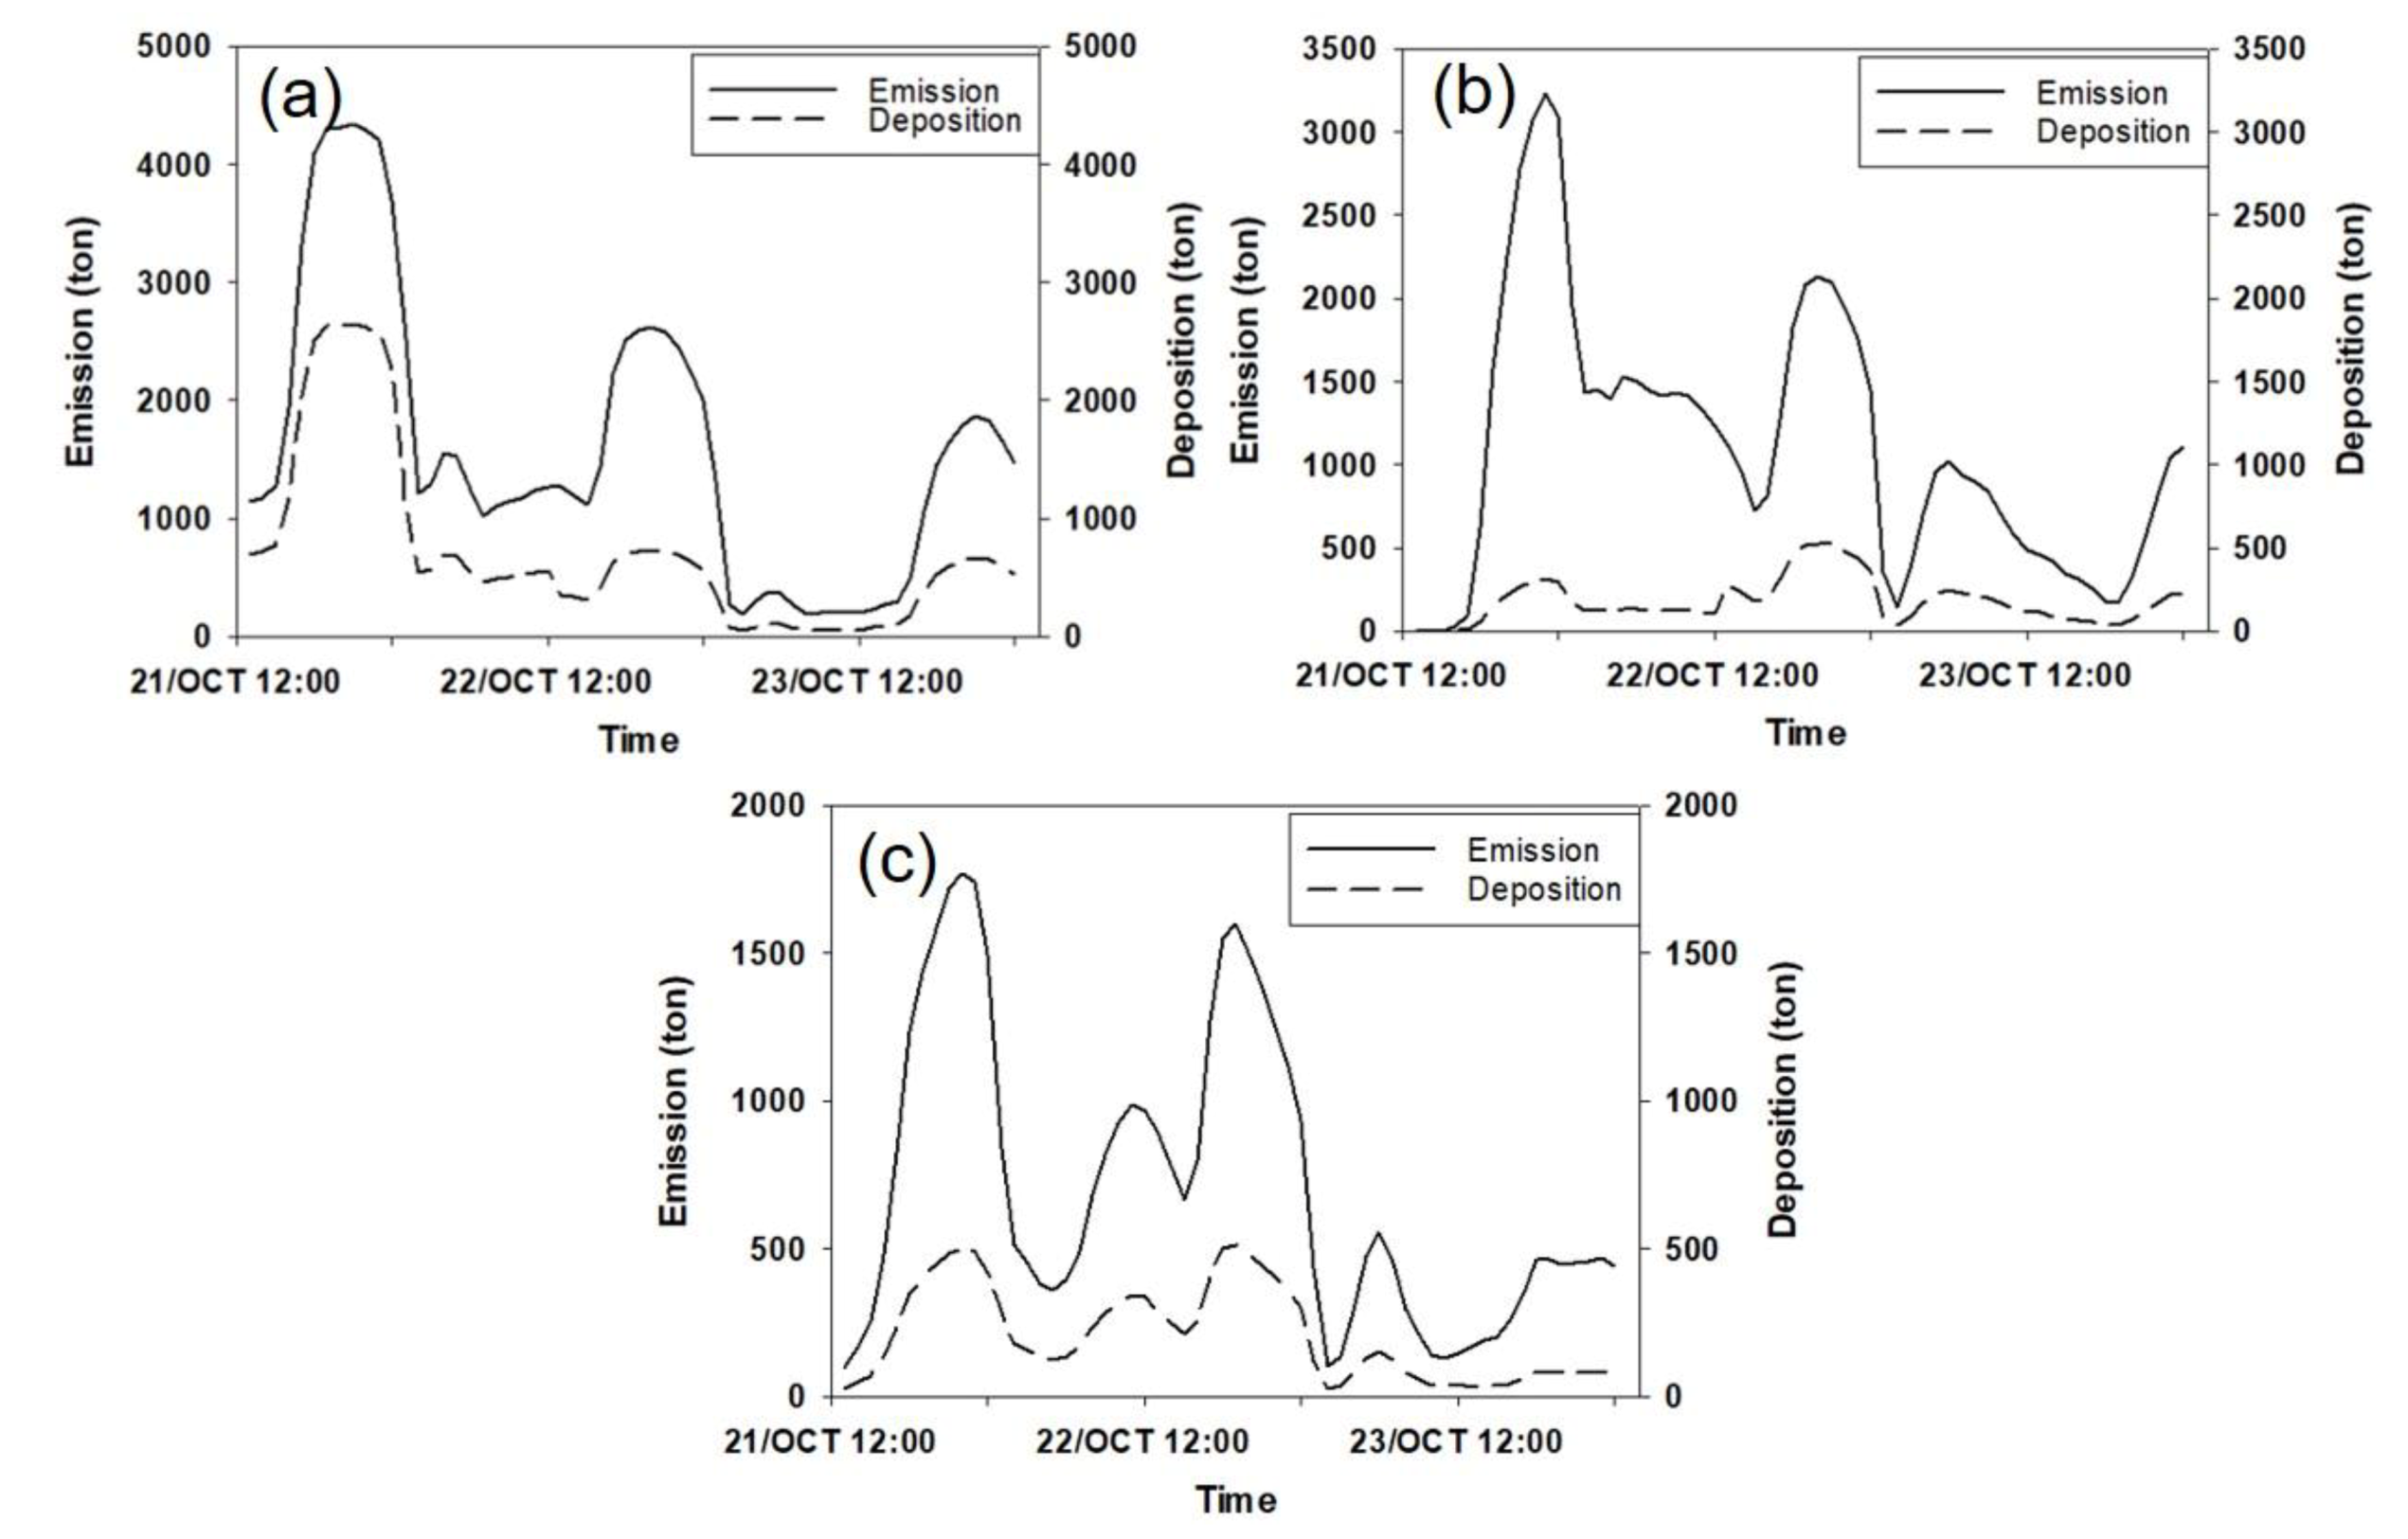
High dust concentrations in the atmosphere over the Gulf of California indicate that there might be a relevant interaction between the coastal regions and sea surface during dust storm events. The vertical sections (see Figure 8) suggest that a fraction of the dust emitted by the coasts in the northern part is deposited in the Gulf of California. Based on the dust emissions observed in Figure 2, three relevant emission zones can be distinguished: The Altar desert zone, the Sonoran Desert, and an intermediate zone between the two deserts. Section 3.1 describes the methodology for estimating dust deposition on the waters of the Gulf of California. The Altar desert has the highest rates of dust mass emission with values of the order of 4300 tons at each time step (Figure 9a). Since the percentage of deposited particles was 61%, the maximum rate calculated for the mass of dust that was deposited on the waters of the Gulf of California was around 2600 tons, in the simulation of the first 12 h. Two other peaks with emissions of approximately 2600 tons and 1950 tons occurred on October 22 and 23, respectively. In the area of the Sonora coast, emissions are lower, reaching a maximum emission rate of 3400 tons at approximately 24 h on October 21 (Figure 9b). The other observed peaks occur at similar times as in the Altar desert. The emissions that reach the gulf surface are substantially smaller. The area located between the Altar desert and the coast of Sonora emits smaller amounts of dust mass but shows similar emission peaks to the other two zones, with the maximum emission rate reaching an approximate value of 1750 tons (Figure 9c).
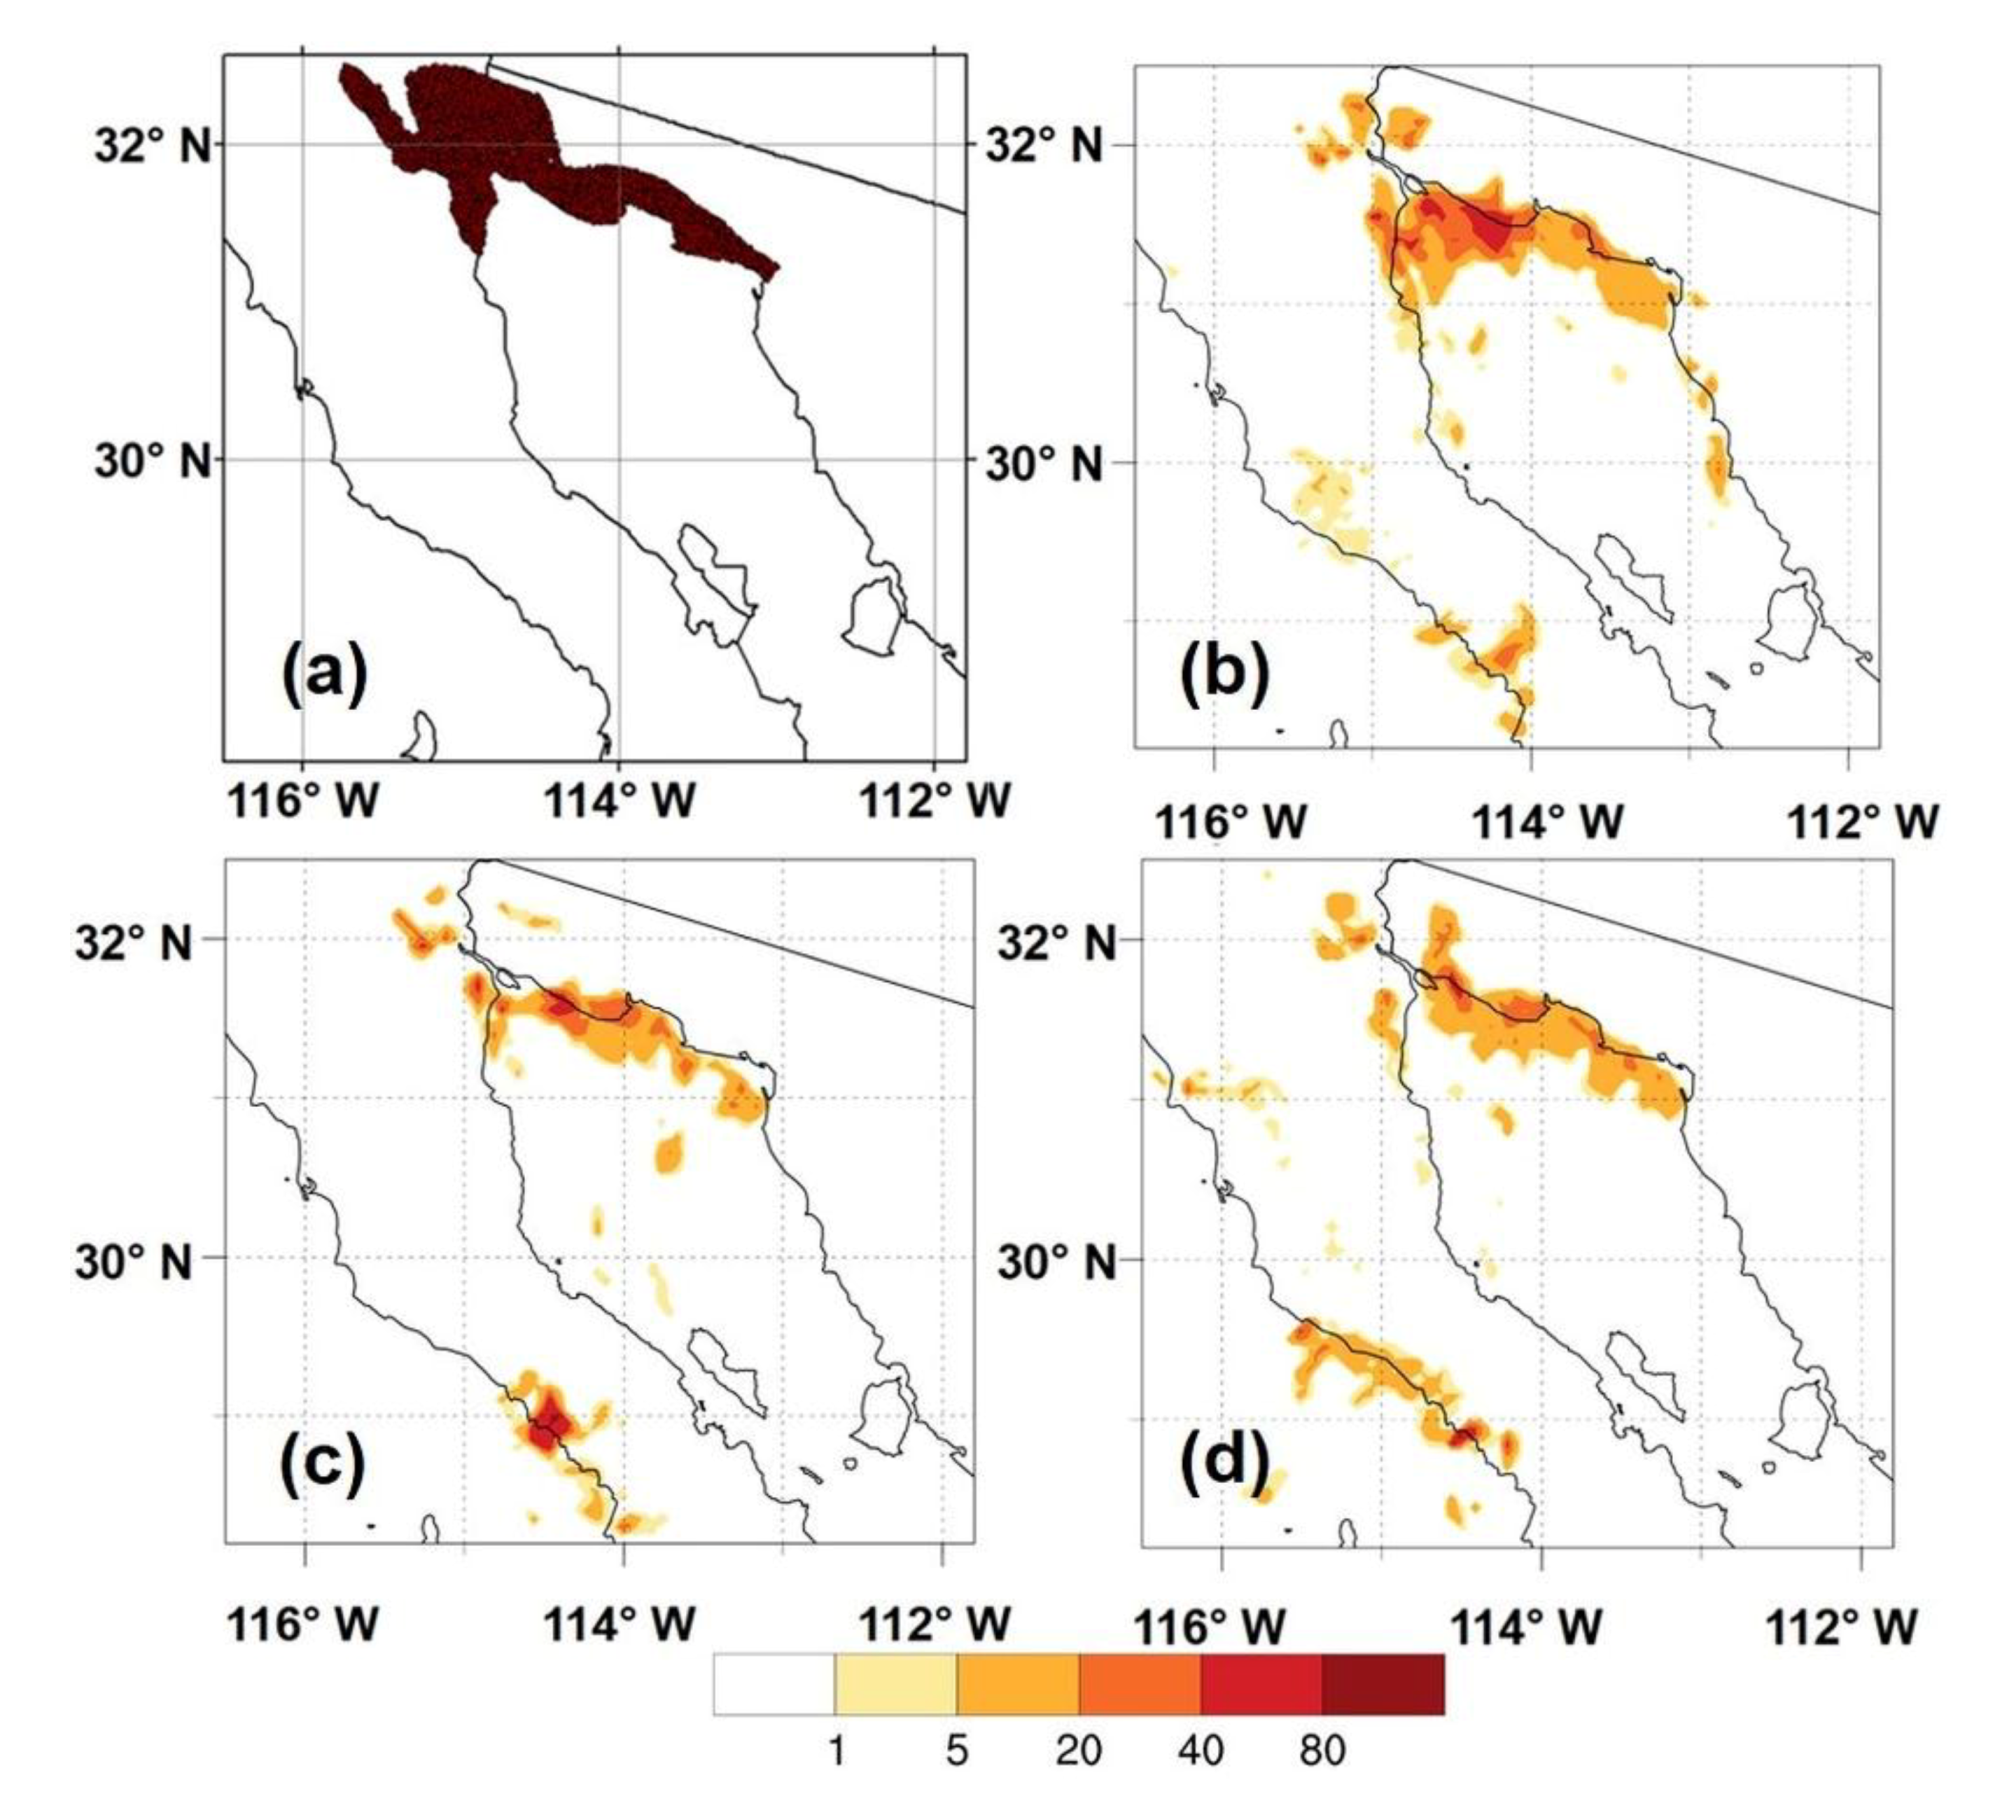
The Altar Desert area emitted the most considerable amount of dust of the three chosen areas (Table 3, case 1). This area emitted about 96879 tons of dust mass during the three days of the event. Note that in 12-h modeling, the dust mass deposition in the Gulf varied from the first 12 h on October 21 (23285 tons) to October 23 (5073 tons). From this amount, the estimation of dust deposited in the Gulf of California was approximately 43,539 tons. This represents about 45 % of the total dust mass emitted. While the percentage of deposited Lagrangian particles of the first experiment on October 21 at 12:00 UTC is 61 %, a decrease in the percentage is observed through the next experiments (Table 3 case 1). This could be explained by the wind intensification or wind direction that allowed emitted dust to reach areas beyond the Gulf of California, even crossing the Peninsula of California (Figure 10b–d). These particle distribution scenarios in the lower parts of the atmosphere (see Figure 8) and horizontal distributions in Figure 10, explain the deposition process on the surface of the Gulf of California. Distribution maps of each experiment were plotted to depict the particle quantity deposited in a grid resolution of 0.05 degrees (cases 1, 2, 3). The most relevant aspects of each case are shown. Although some experiments showed the deposition position of particles from the Altar Desert area further south in the Gulf of California, the particle deposition was mostly in the northern part of the Gulf (Figure 10). It is observed that a variable amount of particles can reach and cross the mountain ridge of the Peninsula of Baja California (Figure 10 and Figure 11).
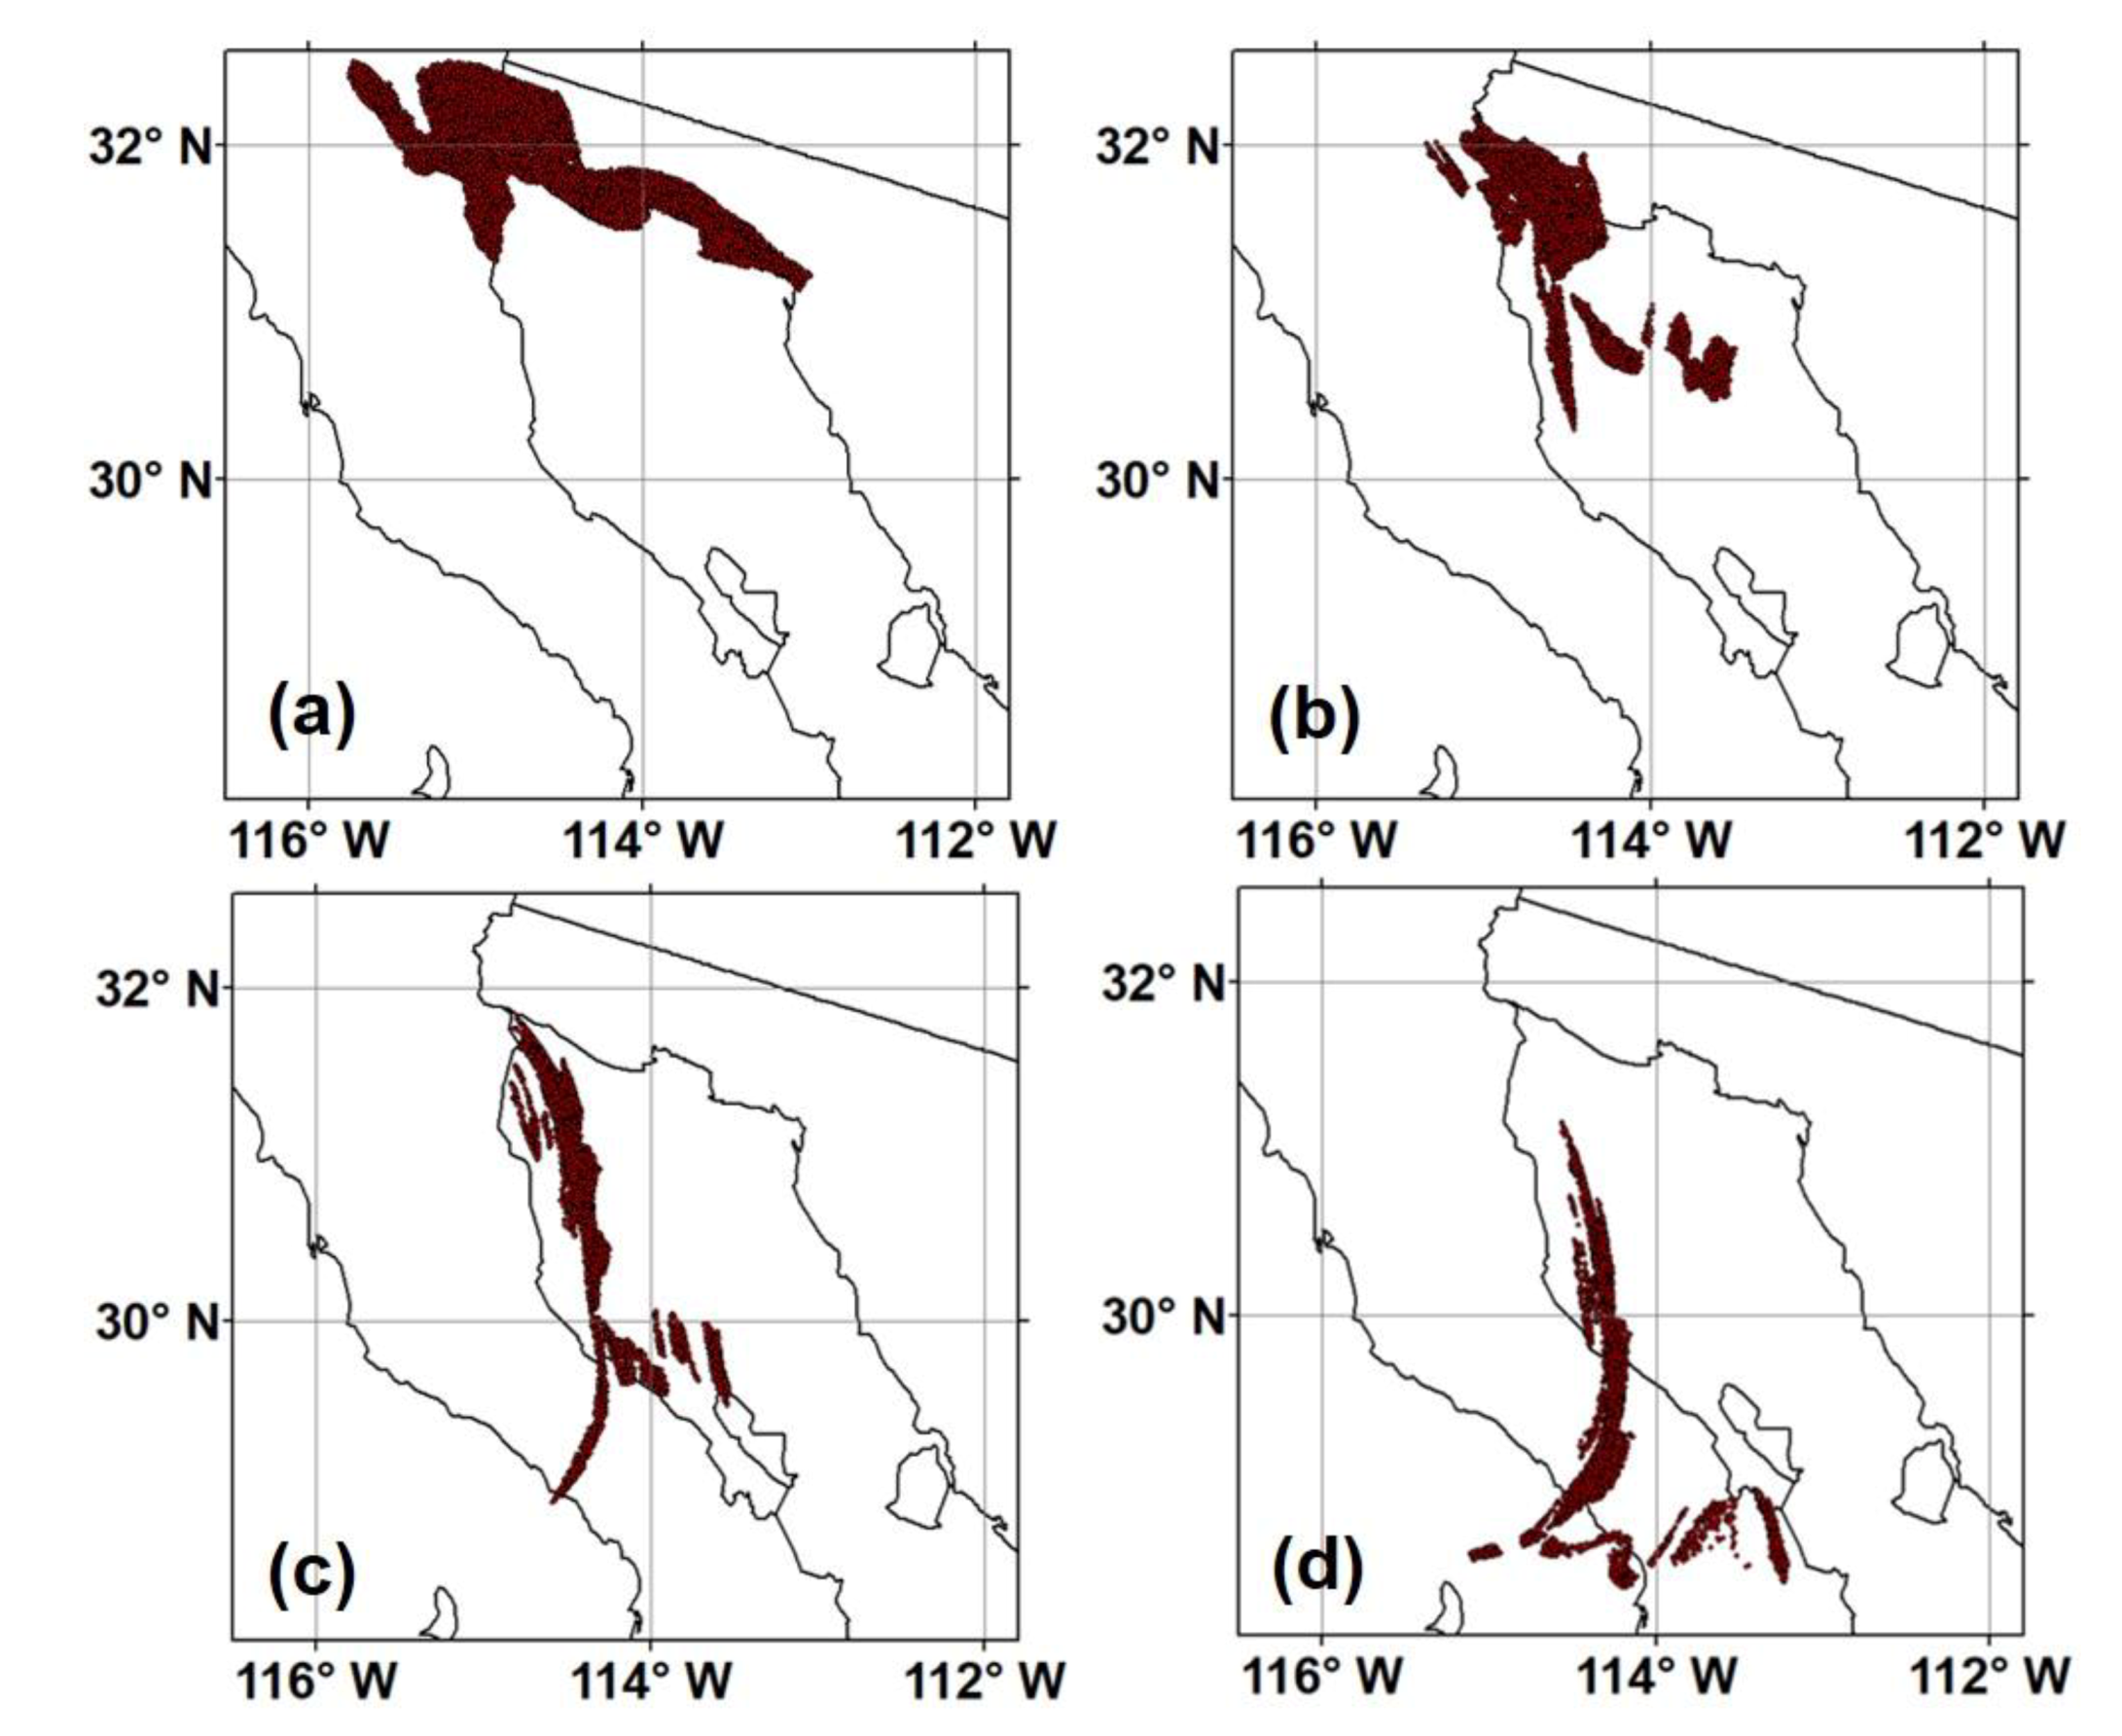
Figure 11 depicts a specific particle experiment in the Altar Desert Area lasting 12 hrs. The experiment begins at 12:00 UTC on October 22, where 10000 particles are in their initial positions (Figure 11a). At 14 h UTC, 68% of the particles continue to be transported while the rest have already been deposited (Figure 11b). At 16:00 UTC, more particles have been deposited, while 59% continue to be transported (Figure 11c). At 18:00 UTC, 54% continued to be transported by the wind, while 46% of the initial particles have been deposited or exited the domain (Figure 11d). After the 12 h of the experiment duration, every particle has been deposited or reached the domain boundaries.
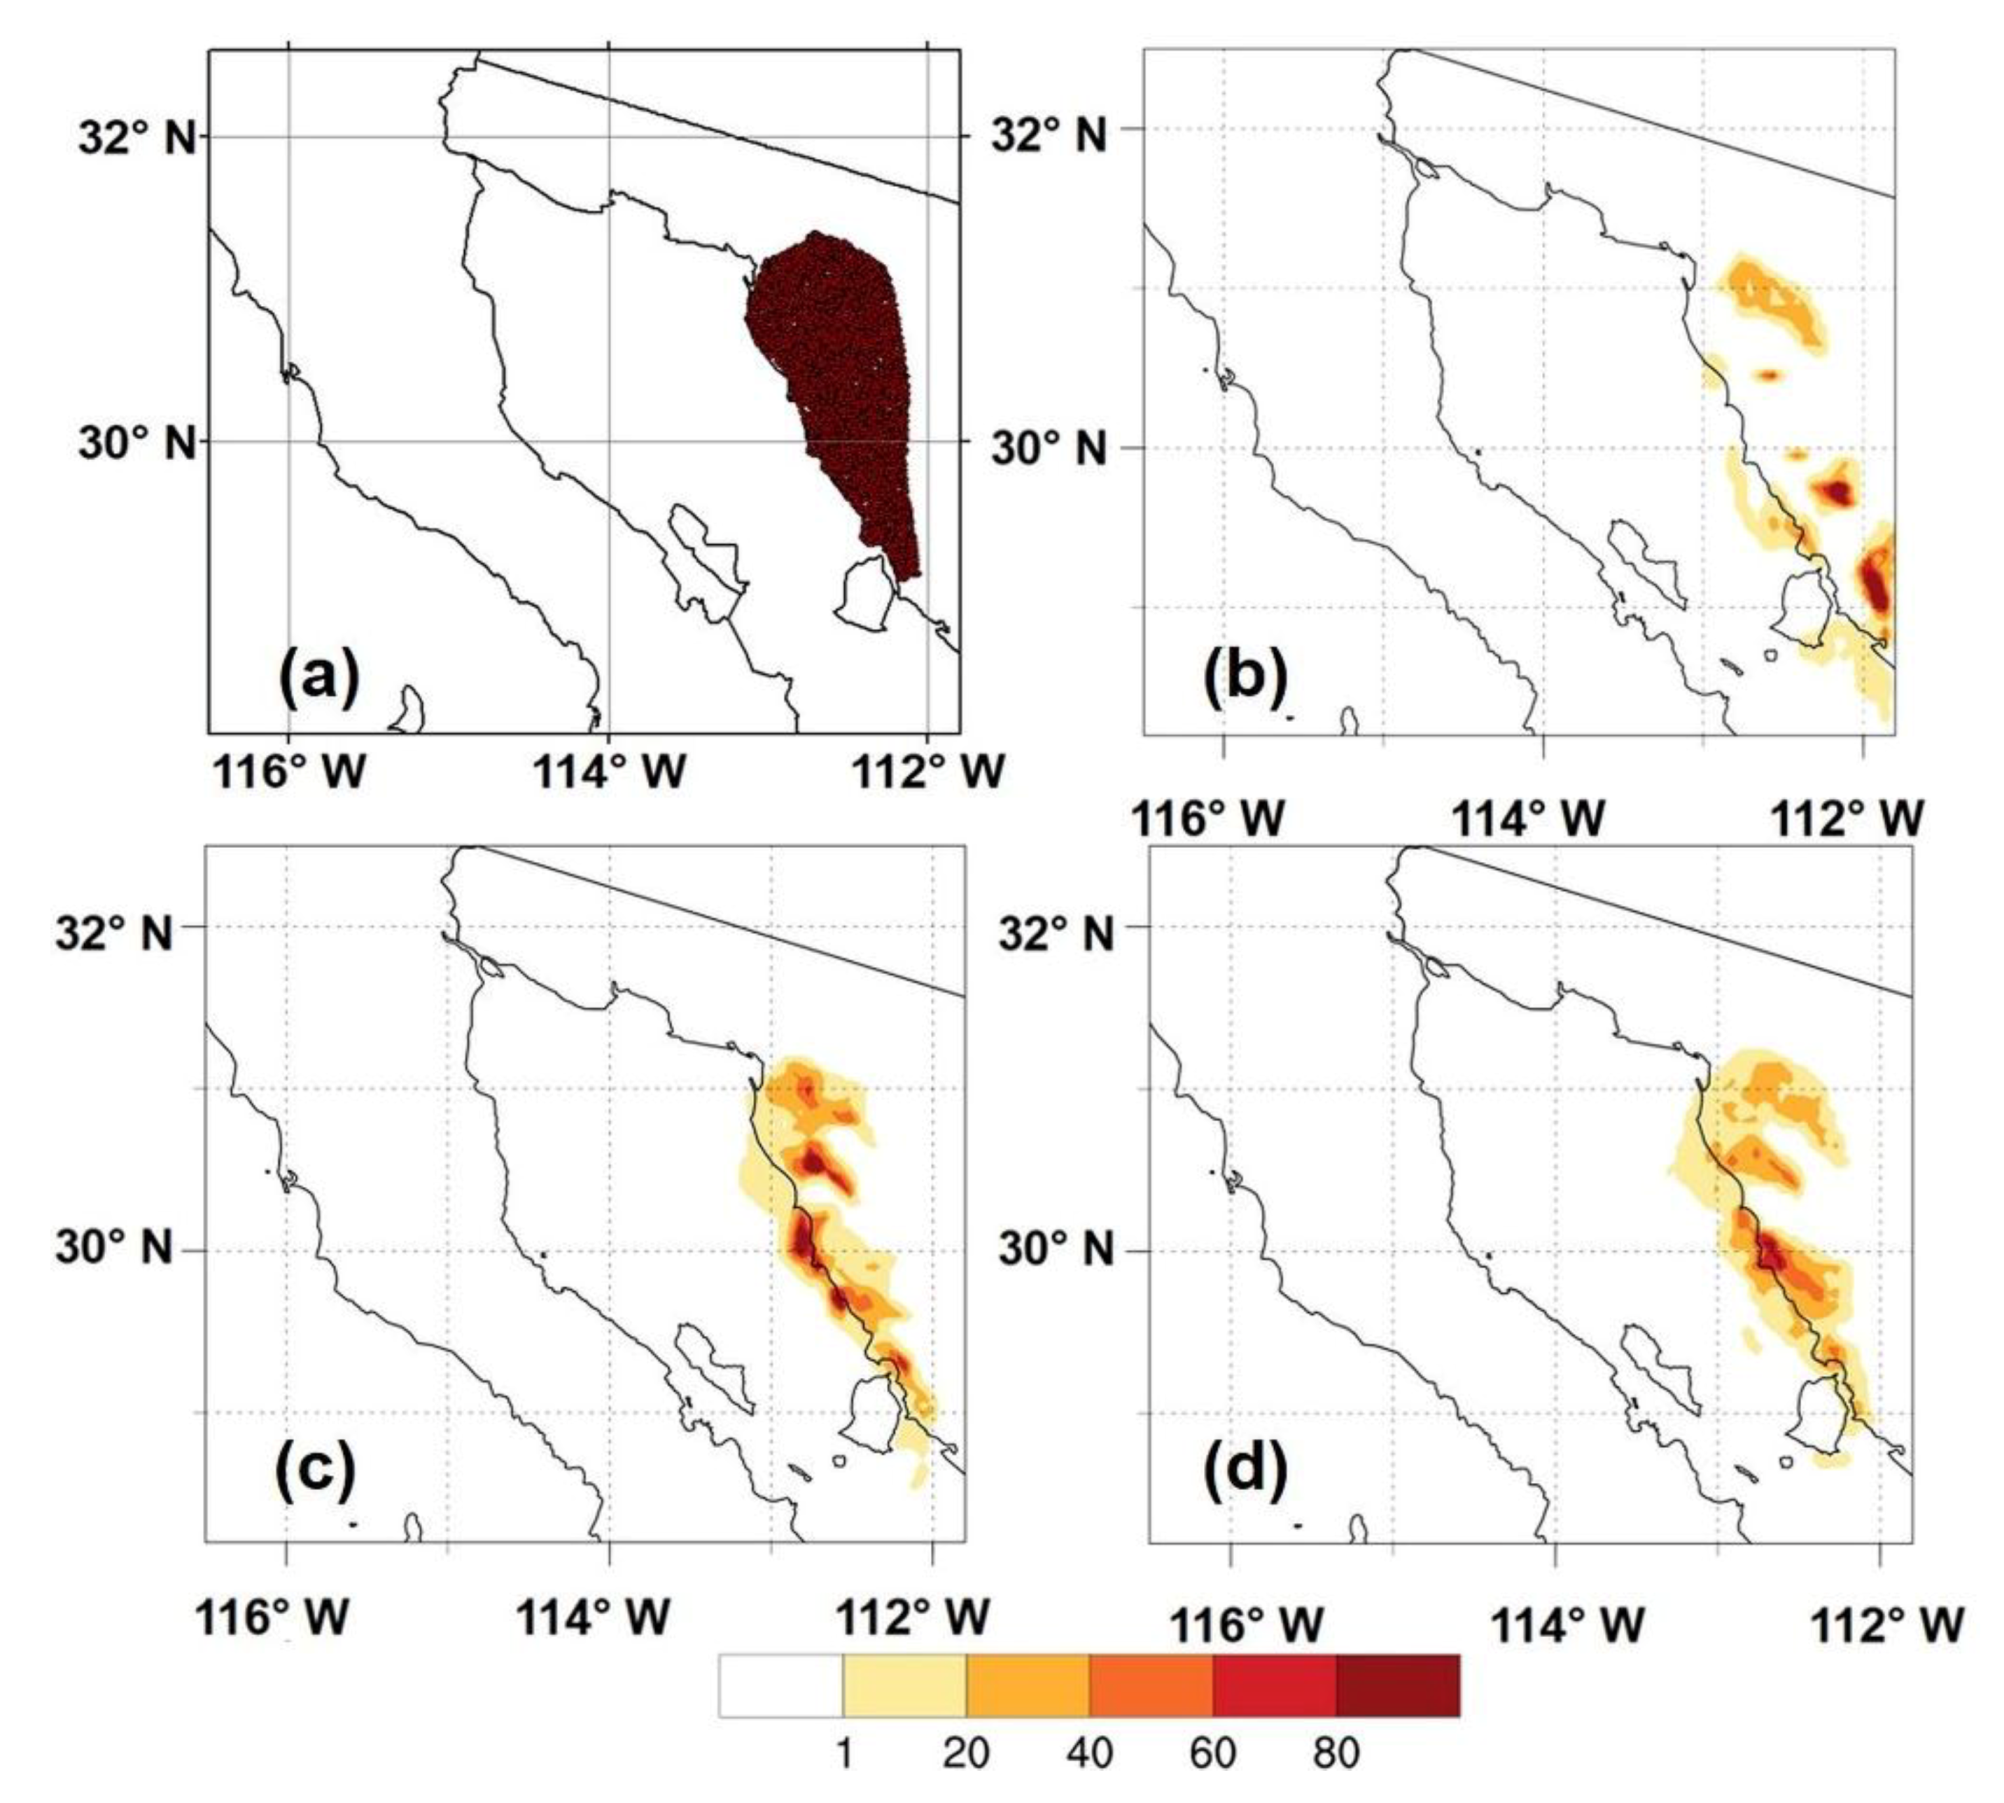
The Sonora coast area had a first significant increase in dust emission, reaching a peak of over 3000 tons on October 22 at 21:00 UTC (Figure 9b). The deposition percentage during the period from October 21, 12:00 UTC to October 22, 12:00 UTC was below 10%, giving a dust deposition of 3135 tons during these 24 h. In the next hours, although the dust emitted was less than the previous, the estimation of dust deposition in the gulf was higher since the wind direction was slightly offshore giving a higher percentage of Lagrangian particles deposited in waters of the Gulf of California (Figure 12 b–d). The Sonora coast area has the second-largest amount of emitted dust (Figure 9b). The dust emission of this area was about 66,362 tons during the event (Table 3 case 2). The estimation of dust deposition in the Gulf of California was approximately 10,777 tons. Most of the particles deposited on the sea surface were in the vicinity of the coast, near to initial positions inland.
The area of the third case had a substantial increase in dust emission that reached a peak of over 1700 tons on October 21 at 22:00 UTC (Figure 9c). A second and a third peak of dust emission (1000 tons and 1500 tons) appeared during October 22, with a significant amount of dust deposited on the surface of the Gulf of California. By the end of October 22 (36 h after the beginning of the simulation), the estimation of dust deposited in the gulf was about 10,747 tons. On October 23, a decrement in dust emission and dust deposition in the Gulf of California is observed, with an estimation of dust deposition in the gulf of 1325 tons during the day. The area limited between the Altar Desert, and the Sonora coast was chosen to estimate its contribution to dust deposition on waters of the gulf (Figure 13a). This area had a total emission of about 42,123 tons. The estimation of dust deposition in the Gulf of California was approximately 12,072 tons, which represents the fourth part of the emitted dust. During most of the event, the Lagrangian trajectories indicated that the percentage of deposited particles on the sea surface oscillated between 27% and 34%. Figure 13b, c depicted particles reaching deposition positions far from the emission area. Approximately a third part of the dust emitted by this area can deposit within the Gulf of California. The experiments at 12:00 UTC on October 21 and October 22 at 00:00 UTC shows particles reaching deposition positions far from the emission area (Figure 13b,c). The experiment at 00:00 UTC on October 22 shows how particles reach and deposit in southern parts of the gulf while another experiment (October 22 at 12:00) showed particle deposition near the coast, in the northern part of the gulf.
5. Discussion
The areas of dust emissions (Figure 10a, Figure 12a, and Figure 13a) are the desert regions that were proposed as the regions with the higher percentage of wind speed conditions able to erode in other study [31]. The aeolian dust sedimentation in the surface layers of the Gulf of California is difficult to estimate. Turbulence, seasonal upwelling, and circulation enhances water transport and mixing [57], which makes it very difficult to assume that the dust will stay and sediment precisely where it was deposited. Nevertheless, the emission of the coastal dust and its deposition on the surface waters of the Gulf of California can be discussed. The calculations carried out in this research work reveal that a considerable amount of dust could be deposited in the Gulf of California. The importance of this interaction is supported by studies in other parts of the world [26,27]. Biogenic sediment fluxes in the Gulf of California have been observed from fall to spring season, and even a secondary peak of lithogenic particle fluxes appears in winter [30]. This coincides with the season of prevailing winds from the north that are capable of transport dust from the desert coasts that surround the Gulf of California. However, the temperature decrease by cold fronts and strong winds from the northwest have been capable of producing an intense mixing with an increase of nutrients in the surface layer [57]. There is a disagreement about the influence of atmospheric dust deposited on the growth of organisms. Some studies results might suggest that physical forcing in the winter-spring period could have a more critical impact over the organism grow in the Gulf of California by cooling surface waters, by breaking of the thermocline [58], and by causing resuspension of sediments [57]. Estimates indicate that at least 43% of atmospheric particle flux contributes to the terrigenous material found in waters of the Gulf of California [30,59]. This atmospheric particle contribution with Fe content could change the general productivity in the northern part of the Gulf of California. High superficial dissolved Fe concentration linked to aeolian dust transport has been reported [29]. Another study has found that the Fe source could be linked to upwelling conditions and not to external dust [20]. According to [60], there could be an impoverishment in the surrounding desert soils from Baja California and aeolian Fe contribution could be from remote sources too. However, the presence of Fe bearing minerals like ilmenite, titanomagnetite, and magnetite have been observed in the Altar desert [61]. The intensity of dust storms can be very variable; particularly, each Santa Ana wind event is different whose scope sometimes covers up to the southern part of the Gulf of California. The inter-annual variability of dust storms has been observed in other parts of the world [62]. The process of mineralization by dust storms is then relevant since the Gulf of California is surrounded by desertic regions with potential dust emission [31,63]. Santa Ana winds contribution to the total annual input of dust, Fe, and Mn to the coastal waters of California has reached ∼ 15%, 20%, and 24%, respectively [64].
It is interesting to relate the processes of dust deposition on the waters of the Gulf of California with biological processes such as chlorophyll concentration. An increase in chlorophyll-a concentrations within the north and east coasts of the Gulf of California is observed on October 23, i.e., when the dust emissions towards the gulf ended (Figure 14b). These concentrations are compared with observed concentrations before the Santa Ana winds event on October 15 (Figure 14a). It is interesting to observe that high chlorophyll-a concentrations in Figure 14b coincide with high dust deposition areas within the gulf calculated in this research work (Figure 10, Figure 12, and Figure 13).
The results found here show that under the extreme conditions of October 2007, a considerable amount of dust traveled above the Gulf of California, and an important part is deposited. This kind of event causes an extreme erosion in northwestern Mexico and the soil loss under winds of this magnitude to represent a robust environmental impact over the coasts as an air quality and visibility reducer [65,66], and as a pathogen transport [67]. Despite the negative effect, this critical quantity of dust contributes directly to the mineralization of the Gulf of California and could be of importance to biological processes as it has been observed in the Gulf of California and other parts of the world.
6. Conclusions
This research work showed that the deterioration of air quality due to the Santa Ana winds is large in northwestern Mexico, showing further that huge amounts of dust can be deposited in the waters of the Gulf of California, and revealed the different sources of dust on the Mexican side. On October 21, 2007, synoptic conditions triggered the formation of the Santa Ana winds and its intensification, causing several dust storms in northwestern Mexico. The dust transport and the interaction with waters of the Gulf of California was the main objective of this research. There exists a possible mineralization process of the waters where the dust deposited. Simulations with the atmospheric model WRF-Chem 3.6.1 and the implementation of Lagrangian trajectories applying the HYSPLIT model allowed for an analysis of the event. The arrival of intense winds from the north brought cold and dry air from the desert. The wind speed over the coast of Sonora allowed the erosion and entrainment of dust particles from the desert regions that surround the Gulf of California. The most crucial emission area is the Altar desert, but the emission area grows through all the coast of Sonora. These regions represented a valuable source of dust and supported the areas proposed by other study as the more likely to have the wind speed needed to cause erosion [31]. During the dust storm, the mean dust concentration over the gulf reached a peak of about 6543 µg/m3 at the surface level. On the last hours of October 21, dust reached heights near to 1 km. Assumptions were made to estimate the dust deposition in the Gulf of California. Three cases with different emission areas were analyzed through Lagrangian simulations to estimate the magnitude of dust deposition in the gulf. The Altar Desert area (case 1) emitted about 96,879 tons of dust mass, of which 43,539 tons deposited in the waters of the gulf. Distribution maps suggest that most of the dust deposited in the gulf was near the northern coast. The Sonora coast area (case 2) emitted 66,362 tons of dust, while 10,777 tons reached the gulf and deposited there. Although a significant amount of the emitted dust deposited within the mainland coast of Sonora, the wind allows a significant amount of deposition in the gulf, near to the coast. A third case covers the area between the Altar desert area and the Sonora coast area. The emitted dust was 42,123 tons, and from these, 12,072 tons were deposited in the Gulf of California. A significant part of the emitted dust is deposited in the gulf near to emission zones and areas far away in the south. The calculations indicate that the dust emitted by the Altar desert area has the most critical influence on the Gulf of California. An increase of chlorophyll-a concentrations within the north and east coasts of the Gulf of California is observed by the end of the dust emissions on October 23. These high concentrations of chlorophyll-a coincide with the areas of high dust deposition estimated in this work. A concluding remark is that the significant dust deposition amount over the Gulf of California in this kind of event seems to have an impact on the mineralization and productivity in the Gulf of California that must be assessed. Events of this magnitude should have an abrupt influence over the Gulf of California conditions with positive biological consequences despite a large amount of soil loss in the desert regions surrounding the gulf.
Author Contributions
Conceptualization, J.N.C.; Data curation, J.T.; Formal analysis, C.A.Á. and D.E.F.; Investigation, C.A.Á.; Methodology, C.A.Á.; Software, J.T.; Supervision, J.N.C. and L.F.P.-M.; Visualization, C.A.Á. and D.E.F.; Writing – original draft, C.A.Á.; Writing – review & editing, J.N.C. and L.F.P.-M. All authors have read and agreed to the published version of the manuscript.
Funding
This work was funded by the National Council of Science and Technology (CONACYT) of Mexico (grant 590388).
Acknowledgments
We are very grateful with the National Council of Science and Technology (CONACYT) which founded this research.
Conflicts of Interest
The authors declare no conflict of interest.
References
- Middleton, N.J. Desert dust hazards: A global review. Aeolian Res. 2017, 24, 53–63. [Google Scholar] [CrossRef]
- Zommers, Z.; Singh, A. Introduction. In Reducing Disaster: Early Warning Systems for Climate Change; Springer: Berlin, Germany, 2014. [Google Scholar]
- Franzen, L.G.; Hjelmroos, M.; Kallberg, P.; Brorstrom-Lunden, E.; Juntto, S.; Savolainen, A.L. The ‘yellow snow’ episode of northern Fennoscandia, March 1991—A case study of long-distance transport of soil, pollen and stable organic com- pounds. Atmos. Environ. 1994, 28, 3587–3604. [Google Scholar] [CrossRef]
- Stefanski, R.; Sivakumar, M. Impacts of sand and dust storms on agriculture and potential agricultural applications of a SDSWS. Iop Conf. Ser. Earth Environ. Sci. 2009, 7, 012016. [Google Scholar] [CrossRef]
- Rennó NO Dust storm. In Encyclopedia of Natural Hazards; Encyclopedia of Earth Sciences Series; Springer: Dordrecht, The Netherlands, 2013. [Google Scholar]
- Shao, Y.; Wyrwoll, K.; Chappell, A.; Huang, J.; Lin, Z.; Mctainsh, G.H.; Mikami, M.; Tanaka, T.Y.; Wang, X.; Yoon, S. Dust cycle: An emerging core theme in Earth system science. Aeolian Res. 2011, 2. [Google Scholar] [CrossRef]
- Jones, C. Forecast Skill of Synoptic Conditions Associated with Santa Ana Winds in Southern California. Am. Meteorol. Soc. 2010, 138. [Google Scholar] [CrossRef] [Green Version]
- Raphael, M.N. The Santa Ana winds of California. Earth Interact. 2003, 7, 1–13. [Google Scholar] [CrossRef]
- Carpenter, F.A.; Gorthwaite, J.W. Memorandum on air drainage in the vicinity of the Corona district, California. Mon. Weather Rev. 1914, 42, 572–573. [Google Scholar] [CrossRef]
- Sommers, L. FM forecast variables related to Santa Ana wind occurrences. Mon. Weather Rev. 1978, 106. [Google Scholar] [CrossRef]
- Westerling, A.L.; Cayan, D.R.; Brown, T.J.; Hall, B.; Riddle, L.G. Climate, Santa Ana winds and autumn wildfires in Southern California. Eos Trans. Am. Geophys. Union 2004, 85, 289–300. [Google Scholar] [CrossRef]
- Yoshino, M.M. Climate in a Small Area: An. Introduction to Local Meteorology; University of Tokyo Press: Tokyo, Japan, 1975; p. 549. [Google Scholar]
- Jackson, P.; Mayr, G.; Vosper, S. Dynamically-driven winds. In Mountain Weather Research and Forecasting; Springer: Dordrecht, The Netherlands, 2013; pp. 121–218. [Google Scholar] [CrossRef]
- Goudie, A.S.; Middleton, N.J. Desert Dust in the Global System; Springer: Berlin/Heidelberg, Germany, 2006. [Google Scholar]
- Phuleria, H.C.; Fine, P.M.; Zhu, Y. Air quality impacts of the October 2003 Southern California wildfires. J. Geophys. Res. 2005, 110. [Google Scholar] [CrossRef] [Green Version]
- California Department of Forestry and Fire Protection, Governor’s Office of Emergency Services, United States Department of Agriculture. California Fire Siege 2007: An Overview. Sacramento, CA: California Dept. of Forestry and Fire Protection. 2008. Available online: https://scvhistory.com/scvhistory/files/lw3443/lw3443.pdf (accessed on 12 August 2019).
- Lynn, R.J.; Svejkovsky, J. Remotely Sensed Sea Surface Temperature Variability Off California During a “Santa Ana” Clearing. J. Geophys. Res. 1984, 89, 8151–8162. [Google Scholar] [CrossRef]
- Hu, H.; Liu, W.T. Oceanic thermal and biological responses to Santa Ana winds. Geophys. Res. Lett. 2003, 30, 10–13. [Google Scholar] [CrossRef] [Green Version]
- Trasviña, A.; Ortiz-figueroa, M.; Herrera, H.; Cos, M.A.; González, E. “Santa Ana” winds and upwelling filaments off Northern Baja California. Dyn. Atmos. Ocean. 2003, 37, 113–129. [Google Scholar] [CrossRef]
- Muñoz-Barbosa, A.; Segovia-Zavala, J.A.; Huerta-Diaz, M.A.; Delgadillo-Hinojosa, F.; Torres-Delgado, E.V.; Lares, M.L.; Gutiérrez-Galindo, E.A. Atmospheric iron fluxes in the northern region of the Gulf of California: Implications for primary production and potential Fe limitation. Deep-Sea Res. Part. I Oceanogr. Res. Pap. 2017, 129, 69–79. [Google Scholar] [CrossRef]
- Castro, R. Spatial influence and oceanic thermal response to Santa Ana events along the Baja California peninsula. Atmosfera 2006, 19, 195–211. [Google Scholar]
- Castro, R.; Pares, A.; Marinone, S. Evolución y extensión de los vientos Santa Ana de febrero de 2002 en el océano, frente a California y la Peninsula de Baja California. Cienc. Mar. 2003, 29, 275–281. [Google Scholar] [CrossRef] [Green Version]
- Álvarez-Borrego, S.; Lara-Lara, R. The physical environment and primary productivity of the Gulf of California. In the Gulf Peninsular Province of the Californias; American Association of Petroleum Geologists Mem: Tulsa, OK, USA, 1991; Volume 47, pp. 555–567. [Google Scholar]
- Alonso-Rodríguez, R.; Páez-Osuna, F. Nutrients, phytoplankton and harmful algal blooms in shrimp ponds: A review with special reference to the situation in the Gulf of California. Aquaculture 2003, 219, 317–336. [Google Scholar] [CrossRef]
- Beman, J.; Arrigo, K.; Matson, P. Agricultural Runoff Fuels Large Phytoplankton Blooms in Vulnerable Areas of the Ocean. Nature 2005, 434, 211–214. [Google Scholar] [CrossRef]
- Bali, K.; Mishra, A.K.; Singh, S.; Chandra, S.; Lehahn, Y. Impact of dust storm on phytoplankton bloom over the Arabian Sea: A case study during March 2012. Environ. Sci. Pollut. Res. 2019, 26, 11940–11950. [Google Scholar] [CrossRef]
- Jickells, T.D.; An, Z.S.; Andersen, K.K.; Baker, A.R.; Bergametti, C.; Brooks, N.; Torres, R. Global iron connections between desert dust, ocean biogeochemistry, and climate. Science 2005, 308, 67–71. [Google Scholar] [CrossRef] [PubMed] [Green Version]
- Segovia-Zavala, J.A.; Delgadillo-Hinojosa, F.; Lares-Reyes, M.L.; Huerta-Diaz, M.A.; Munoz-Barbosa, A.; Torres-Delgado, E.V. Atmospheric input and concentration of dissolved iron in the surface layer of the Gulf of California. Ciencias Marinas. 2009, 35, 75–90. [Google Scholar] [CrossRef] [Green Version]
- Wells, M.L.; Price, N.M.; Bruland, K.W. Iron chemistry in seawater and its relationship to phytoplankton: A workshop report. Mar. Chem. 1995, 48, 157–182. [Google Scholar] [CrossRef]
- Thunell, R. Seasonal and annual variability in particle fluxes in the Gulf of California: A response to climate change. Deep-Sea Res. 1998, 45, 2083–3059. [Google Scholar] [CrossRef]
- Morales-Acuña, E.J. Influencia de la variabilidad espacio-temporal del viento en el transporte de polvo hacia el Golfo de California. Master’s Thesis in Sciences, Instituto Politécnico Nacional, Ciudad de México, México, 2015. [Google Scholar]
- Álvarez, C. Vientos de Santa Ana y Tormentas de Polvo en el Noroeste de México. Master’s Thesis in Sciences, Instituto Potosíno de Investigación Científica y Tecnológica (IPICYT), San Luis Potosí, México, 2017. [Google Scholar]
- Álvarez, C.; Carbajal, N. Regions of influence and environmental effects of Santa Ana wind event. Air Qual. Atmos. Health 2019, 12, 1019–1034. [Google Scholar] [CrossRef]
- CONANP. Comisión Nacional de Áreas Naturales Protegidas. Reserva de la Biosfera El Pinacate y El Gran Desierto del Altar. Available online: http://www.conanp.gob.mx/conanp/dominios/pinacate1/ (accessed on 4 May 2019).
- INEGI. Características Edafológicas, Fisiográficas, Climáticas e Hidrográficas de México; Instituto Nacional de Estadística y Geografía: Aguascalientes, México, 2008. [Google Scholar]
- INEGI. Conjunto de Datos Vectoriales de Uso de Suelo y Vegetación. Escala 1:250 000. Serie VI (Capa Union)’, escala: 1:250 000, 1st ed.; Instituto Nacional de Estadística y Geografía: Aguascalientes, México, 2016. [Google Scholar]
- USGS. Enhanced Historical Land-Use and Land-Cover Data Sets of the U.S. Geological Survey; Digital Data Series 240; U.S. Geological Survey: Washington, DC, USA, 2006.
- García, E. Modificaciones al sistema de clasificación climática de Köppen, 5th ed.; Serie libros #6; Instituto de Geografía, UNAM: Mexico City, Mexico, 2004. [Google Scholar]
- Roden, G.I. Oceanographic and meteorological aspects of the Gulf of California. Pac. Sci. 1958, 12, 21–45. [Google Scholar]
- Beier, E.; Ripa, P. Seasonal gyres in the northern Gulf of California. J. Phys. Oceanogr. 1998, 29, 305–311. [Google Scholar] [CrossRef]
- Sverdrup, H.U. The Gulf of California: Preliminary discussion on the cruise of the E.W. Scripps in February and March. Proc. 6th Pac. Sci. Congr. 1939, 3, 161–166. [Google Scholar]
- Robles, J.M.; Marinone, S.G. Seasonal and interannual thermohaline variability in the Guaymas Basin in the Gulf of California. Cont. Shelf Res. 1987, 7, 715–733. [Google Scholar] [CrossRef]
- Roden, G.L. On sea level, temperature, and salinity variations in the tropical Pacific Ocean and on Pacific Ocean Islands. J. Geoph. Res. 1963, 68, 455–472. [Google Scholar] [CrossRef]
- Rasmussen, E.M. Atmospheric water vapor transport and the water balance of North America, 1, Characteristics of the water vapor flux field. Mon. Weather Rev. 1967, 95, 403–426. [Google Scholar] [CrossRef]
- Reyes, C.S.; Pavía, L.E.; Candela, P.J.; Troncoso, G.R. Estudio preliminar de las condiciones meteorológicas y cIimatológicas alrededor del Golfo de California. 1ra. Parte. Análisis sur del viento. Cienc. Mar. 1984, 10, 9–26. [Google Scholar]
- Skamarock, W.C.; Klemp, J.B.; Dudhia, J.; Gill, D.O.; Barker, D.; Duda, M.G.; Huang, X.Y.; Wang, W.; Powers, J.G. A description of the Advanced Research WRF Version 3. NCAR Technical Note NCAR/TN-475+STR; University Corporation for Atmospheric Research: Boulder, CO, USA, 2008. [Google Scholar] [CrossRef]
- Grell, G.A.; Peckham, S.E.; Schmitz, R.; McKeen, S.A.; Frost, G.; Skamarock, W.C.; Eder, B. Fully coupled “online” chemistry within the WRF model. Atmos. Environ. 2005, 39. [Google Scholar] [CrossRef]
- NCEP. National Centers for Environmental Prediction/National Weather Service/NOAA/U.S. Department of Commerce. updated daily. NCEP FNL Operational Model Global Tropospheric Analyses, continuing from July 1999. Research Data Archive at the National Center for Atmospheric Research, Computational and Information Systems Laboratory. 2000. Available online: https://rda.ucar.edu/datasets/ds083.2/ (accessed on 3 December 2016). [CrossRef]
- Hong, S.Y.; Dudhia, J.; Chen, S.H. A revised approach to ice microphysical processes for the bulk parameterization of clouds and precipitation. Mon. Weather Rev. 2004, 132. [Google Scholar] [CrossRef]
- Dudhia, J. Numerical study of convection observed during the winter monsoon experiment using a mesoscale two-dimensional model. J. Atmos. Sci. 1989, 46, 3077–3107. [Google Scholar] [CrossRef]
- Mlawer, E.J.; Taubman, S.J.; Brown, P.D.; Iacono, M.J.; Clough, S.A. Radiative transfer for inhomogeneous atmospheres: RRTM, a validated correlated-k model for the longwave. J. Geophys. Res. Atmos. 1997, 102, 16663–16682. [Google Scholar] [CrossRef] [Green Version]
- Pleim, J.E. A simple, efficient solution of flux–profile relationships in the atmospheric surface layer. J. Appl. Meteorol. Climatol. 2006, 45. [Google Scholar] [CrossRef]
- Pleim, J.E.; Xiu, A. Development of a Land Surface Model. Part II: Data Assimilation. J. Appl. Meteor. 2003, 42, 1811–1822. [Google Scholar] [CrossRef] [Green Version]
- Kain, J.S. The Kain–Fritsch convective parameterization: An update. J. Appl. Meteorol. 2004, 43. [Google Scholar] [CrossRef] [Green Version]
- Shao, Y.; Ishizuka, M.; Mikami, M.; Leys, J. Parameterization of size-resolved dust emission and validation with measurements. J. Geophys. Res. Atmos. 2011, 116. [Google Scholar] [CrossRef]
- Stein, A.F.; Draxler, R.R.; Rolph, G.D.; Stunder, J.B.; Cohen, M.D.; Ngan, F. NOAA’s HYSPLIT Atmospheric Transport and Dispersion Modeling System. Bull. Am. Meteorol. Soc. 2015, 96, 2059–2077. [Google Scholar] [CrossRef]
- Martínez-López, A.; Cervantes-Duarte, R.; Reyes-Salinas, A.; Valdez-Holguín, J.E. Cambio estacional de clorofila a en la Bahía de La Paz, B.C.S.; México. Hidrobiológica 2001, 11, 45–52. [Google Scholar]
- Thunell, R.; Pride, C.; Ziveri, P.; Muller-Karger, F.; Sancetta, C.; Murray, D. Plankton response to physical forcing in the Gulf of California. J. Plankton Res. 1996, 18, 2017–2026. [Google Scholar] [CrossRef]
- Delgadillo-Hinojosa, F. Biogeoquímica del Cadmio y Manganeso en el Golfo de California. Ph.D. Thesis, Universidad Autónoma de Baja California, Ensenada, ME, USA, 2000; 181p. [Google Scholar]
- Muñoz-Barbosa, A.; Huerta-Diaz, M.A. Trace metal enrichments in nearshore sediments and accumulation in mussels (Modiolus capax) along the eastern coast of Baja California, Mexico: Environmental status in 1995. Mar. Pollut. Bull. 2013, 77, 71–81. [Google Scholar] [CrossRef] [PubMed]
- Kasper-Zubillaga, J.J.; Acevedo-Vargas, B.; Bermea, O.M.; Zamora, G.O. Rare earth elements of the Altar Desert dune and coastal sands, Northwestern Mexico. Chem. Der Erde 2008, 68, 45–59. [Google Scholar] [CrossRef]
- Prospero, J.M.; Lamb, P.J. African droughts and dust transport to the Caribbean: Climate change implications. Science 2003, 302, 1024–1027. [Google Scholar] [CrossRef]
- Morales-Acuña, E.; Torres, C.R.; Delgadillo-Hinojosa, F.; Linero-Cueto, J.R.; Santamaría-del-ángel, E.; Castro, R. The Baja California Peninsula, a significant source of dust in Northwest Mexico. Atmosphere 2019, 10, 582. [Google Scholar] [CrossRef] [Green Version]
- Félix-Bermúdez, A.; Delgadillo-Hinojosa, F.; Huerta-Diaz, M.A.; Camacho-Ibar, V.; Torres-Delgado, E.V. Atmospheric Inputs of Iron and Manganese to Coastal Waters of the Southern California Current System: Seasonality, Santa Ana Winds, and Biogeochemical Implications. J. Geophys. Res. Ocean. 2017, 122, 9230–9254. [Google Scholar] [CrossRef]
- Chauhan, A.; de Azevedo, S.C.; Singh, R.P. Pronounced changes in air quality, atmospheric and meteorological parameters, and strong mixing of smoke associated with a dust event over Bakersfield, California. Environ. Earth Sci. 2018, 77, 1–12. [Google Scholar] [CrossRef] [Green Version]
- Bhattachan, A.; Okin, G.S.; Zhang, J.; Vimal, S.; Lettenmaier, D.P. Characterizing the Role of Wind and Dust in Traffic Accidents in California. Geo. Health 2019, 3, 328–336. [Google Scholar] [CrossRef] [Green Version]
- Colson, A.J.; Vredenburgh, L.; Guevara, R.E.; Rangel, N.P.; Kloock, C.T.; Lauer, A. Large-Scale Land Development, Fugitive Dust, and Increased Coccidioidomycosis Incidence in the Antelope Valley of California, 1999–2014. Mycopathologia 2017, 182, 439–458. [Google Scholar] [CrossRef] [PubMed]

Figure 2.
Moderate Resolution Spectroradiometer image (MODIS) from NASA’s Terra satellite. (a) Dust storms on 21 October 2007, (b) dust storms on 22 October 2007 in which is observed transported dust above the Gulf of California and (c) Surface level chart at 12:00 UTC on 22 October 2007 from the NOAA/National Weather Service.

Figure 3.
Domain Configuration. Nearest meteorological stations are also plotted: Ensenada (a) Mexicali (b) and Bahía de los Ángeles (c).
Figure 3.
Domain Configuration. Nearest meteorological stations are also plotted: Ensenada (a) Mexicali (b) and Bahía de los Ángeles (c).

Figure 4.
Temperature (°C) and wind vectors with a magnitude reference of 20 m/s at surface level in domain 1. (a) 00:00 UTC on October 21, (b) 17:00 UTC on October 21, (c) 02:00 UTC on October 22 and (d) 10:00 UTC on October 22.
Figure 4.
Temperature (°C) and wind vectors with a magnitude reference of 20 m/s at surface level in domain 1. (a) 00:00 UTC on October 21, (b) 17:00 UTC on October 21, (c) 02:00 UTC on October 22 and (d) 10:00 UTC on October 22.

Figure 5.
Relative humidity (%) and wind vectors with a magnitude reference of 20 m/s at surface level in domain 1. (a) 00:00 UTC on October 21, (b) 00:00 UTC on October 22, (c) 04:00 UTC on October 22 and (d) 22:00 UTC on October 22.
Figure 5.
Relative humidity (%) and wind vectors with a magnitude reference of 20 m/s at surface level in domain 1. (a) 00:00 UTC on October 21, (b) 00:00 UTC on October 22, (c) 04:00 UTC on October 22 and (d) 22:00 UTC on October 22.

Figure 6.
Time series of mean total dust concentration simulated in the 10 m above the north of the Gulf of California.
Figure 6.
Time series of mean total dust concentration simulated in the 10 m above the north of the Gulf of California.

Figure 7.
Dust concentration in the lowest layer of the atmosphere (µg/m3 ) and wind vectors with a magnitude reference of 20 m/s in domain 1. (a) 00:00 UTC on October 21, (b) 00:00 UTC on October 22, (c) 00:00 UTC on October 23 and (d) 00:00 UTC on October 24. Guaymas is represented by a green point.

Figure 8.
Cross sections of dust concentration (µg/m3) and wind vectors with a magnitude reference of 10 m/s at 22:00 UTC on October 21. (a) location of cross sections, (b) Cross section from north to south (black line), (c) Cross section from west to east (red line), (d) Cross section from west to east (orange line), (e) Cross section from west to east at 08:00 UTC on October 22 (orange line) and (f) Cross section from west to east (yellow line).

Figure 9.
Time series of dust emitted along with the dust deposition estimation in the Gulf of California in (a) Altar Desert area (b) Sonora coast area and (c) a delimited area between the Altar Desert and the Sonora coast area.
Figure 9.
Time series of dust emitted along with the dust deposition estimation in the Gulf of California in (a) Altar Desert area (b) Sonora coast area and (c) a delimited area between the Altar Desert and the Sonora coast area.

Figure 10.
(a) Initial positions of particles in Altar Desert area and distribution maps of number of deposited particles per grid point of experiments on (b) October 22 at 00:00 UTC, (c) October 22 at 12:00 UTC and (d) October 23 at 00:00. Grid of 0.05 degrees’ resolution.
Figure 10.
(a) Initial positions of particles in Altar Desert area and distribution maps of number of deposited particles per grid point of experiments on (b) October 22 at 00:00 UTC, (c) October 22 at 12:00 UTC and (d) October 23 at 00:00. Grid of 0.05 degrees’ resolution.

Figure 11.
Particles positions from Altar Desert area at different time steps on October 22, (a) 12:00 UTC, (b) 14:00 UTC, (c) 16:00 UTC and (d) 18:00 UTC.
Figure 11.
Particles positions from Altar Desert area at different time steps on October 22, (a) 12:00 UTC, (b) 14:00 UTC, (c) 16:00 UTC and (d) 18:00 UTC.

Figure 12.
(a) Initial positions of particles in Sonora coast area and distribution maps of deposited particles of experiments on (b) October 22 at 00:00 UTC, (c) October 22 at 12:00 UTC and (d) October 23 at 00:00.
Figure 12.
(a) Initial positions of particles in Sonora coast area and distribution maps of deposited particles of experiments on (b) October 22 at 00:00 UTC, (c) October 22 at 12:00 UTC and (d) October 23 at 00:00.

Figure 13.
(a) Initial positions of particles in the area between the Altar Desert and the Sonora coast area and distribution maps of deposited particles of experiments on (b) October 21 at 12:00 UTC, (c) October 22 at 00:00 UTC and (d) October 22 at 12:00.
Figure 13.
(a) Initial positions of particles in the area between the Altar Desert and the Sonora coast area and distribution maps of deposited particles of experiments on (b) October 21 at 12:00 UTC, (c) October 22 at 00:00 UTC and (d) October 22 at 12:00.

Figure 14.
Chlorophyll-a concentration in logarithm scale () from SeaWiFS (a) October 15 and (b) October 23. Images produced with the Giovanni online data system, developed and maintained by the NASA GES DISC featuring SeaWiFS project data.
Figure 14.
Chlorophyll-a concentration in logarithm scale () from SeaWiFS (a) October 15 and (b) October 23. Images produced with the Giovanni online data system, developed and maintained by the NASA GES DISC featuring SeaWiFS project data.


Table 1.
Physical and chemical configuration of WRF-CHEM.
| Description | Namelist Otions | Scheme/References |
|---|---|---|
| Microphysics | mp_physics = 3 | WRF Single moment 3 [49] |
| Shortwave radiation | ra_sw_physics = 1 | Dudhia [50] |
| Longwave radiation | ra_lw_physics = 1 | RRTM scheme [51] |
| Surface layer physics | sf_sfclay_physics = 7 | Pleim Xiu scheme [52] |
| Land surface model | sf_surface_physics = 7 | Pleim Xiu land surface model [53] |
| Cumulus parametrization | cu_physics = 1 | Kain–Fritsch scheme [54] |
| Dust scheme | dust_opt=4, dust_schme = 3 | Shao2011 dust emission scheme [55] |
Table 2.
Root Mean Square Error (RMSE) and bias calculated from WRF-Chem simulations and stations data along with the mean of observed data for meteorological variables: Temperature (T), Relative Humidity (RH) and Wind Speed.
Table 2.
Root Mean Square Error (RMSE) and bias calculated from WRF-Chem simulations and stations data along with the mean of observed data for meteorological variables: Temperature (T), Relative Humidity (RH) and Wind Speed.
| Station | RMSE | BIAS | MEAN | ||||||
|---|---|---|---|---|---|---|---|---|---|
| T (°C) | RH (%) | Wind Speed (m/s) | T | RH | Wind Speed | T (°C) | RH (%) | Wind Speed (m/s) | |
| Mexicali | 2.73 | 7.59 | 1.55 | −1.94 | 0.51 | 0.30 | 22.42 | 18.84 | 4.38 |
| Ensenada | 2.99 | 22.02 | 4.15 | −1.26 | −0.32 | −2.36 | 24.64 | 23.79 | 6.88 |
| Bahía de los Ángeles | 3.93 | 20.84 | 4.36 | −3.70 | 17.48 | 3.56 | 25.8 | 31.9 | 7.99 |
Table 3.
Results of estimation of dust deposition in the Gulf emitted by the areas of case 1 (Altar Desert) and case 2 (Sonora coast).
Table 3.
Results of estimation of dust deposition in the Gulf emitted by the areas of case 1 (Altar Desert) and case 2 (Sonora coast).
| Case 1 | |||
|---|---|---|---|
| Date | Particles Percentage Deposited in Gulf (%) | Dust Deposited in Gulf (ton) | Dust Emitted from the Area (ton) |
| 21/Oct 12:00 | 61 | 23,285 | 38,097 |
| 22/Oct 00:00 | 44 | 7248 | 16,317 |
| 22/Oct 12:00 | 28 | 6805 | 24,262 |
| 23/Oct 00:00 | 27 | 1128 | 4106 |
| 23/Oct 12:00 | 35 | 5073 | 14,097 |
| Total | 43,539 | 96,879 | |
| Case 2 | |||
| Date | Particles Percentage Deposited in Gulf (%) | Dust Deposited in Gulf (ton) | Dust Emitted from the Area (ton) |
| 21/Oct 12:00 | 9 | 1611 | 16,749 |
| 22/Oct 00:00 | 8 | 1524 | 17,517 |
| 22/Oct 12:00 | 24 | 4499 | 18,185 |
| 23/Oct 00:00 | 23 | 1904 | 7979 |
| 23/Oct 12:00 | 20 | 1239 | 5932 |
| Total | 10,777 | 66,362 | |
© 2020 by the authors. Licensee MDPI, Basel, Switzerland. This article is an open access article distributed under the terms and conditions of the Creative Commons Attribution (CC BY) license (http://creativecommons.org/licenses/by/4.0/).
Share and Cite
MDPI and ACS Style
Álvarez, C.A.; Carbajal, J.N.; Pineda-Martínez, L.F.; Tuxpan, J.; Flores, D.E. Dust Deposition on the Gulf of California Caused by Santa Ana Winds. Atmosphere 2020, 11, 275. https://doi.org/10.3390/atmos11030275
AMA Style
Álvarez CA, Carbajal JN, Pineda-Martínez LF, Tuxpan J, Flores DE. Dust Deposition on the Gulf of California Caused by Santa Ana Winds. Atmosphere. 2020; 11(3):275. https://doi.org/10.3390/atmos11030275
Chicago/Turabian StyleÁlvarez, Christian A., José N. Carbajal, Luis F. Pineda-Martínez, José Tuxpan, and David E. Flores. 2020. "Dust Deposition on the Gulf of California Caused by Santa Ana Winds" Atmosphere 11, no. 3: 275. https://doi.org/10.3390/atmos11030275
Note that from the first issue of 2016, this journal uses article numbers instead of page numbers. See further details here.