
Versatile Silver Nanoparticles-Based SERS Substrate with High Sensitivity and Stability
by
 , , ,
, , ,
Mimi Liu
1 ,
,
Anjuli Bhandari
2,
Mujtaba Ali Haqqani Mohammed
1,
Daniela R. Radu
1 and
Cheng-Yu Lai
1,* 1
Department of Mechanical and Materials Engineering, Florida International University, Miami, FL 33199, USA
2
Oak Ridge Institute for Science and Education (Current affiliation), Oak Ridge, TN 37831, USA
*
Author to whom correspondence should be addressed.
Appl. Nano 2021, 2(3), 242-256; https://doi.org/10.3390/applnano2030017
Submission received: 26 July 2021
/
Revised: 12 August 2021
/
Accepted: 13 August 2021
/
Published: 25 August 2021
(This article belongs to the Special Issue Polymer Nanocomposites with Different Types of Nanofillers and Advanced Properties for Several Applications)
Abstract
:Surface-enhanced Raman scattering has developed into a mature analytical technique useful in various applications; however, the reproducible fabrication of a portable SERS substrate with high sensitivity and good uniformity is still an ongoing pursuit. Reported herein is a rapid fabrication method of an inexpensive SERS substrate that enables sub-nanomolar detection of molecular analytes. The SERS substrate is obtained by application of silver nanoparticles (Ag NPs)-based ink in precisely design patterns with the aid of an in-house assembled printer equipped with a user-fillable pen. Finite-difference time-domain (FDTD) simulations show a 155-times Ag NP electric field enhancement for Ag nanoparticle pairs with particle spacing of 2 nm. By comparing the SERS performance of SERS substrate made with different support matrices and fabrication methods, the PET-printed substrate shows optimal performance, with an estimated sensitivity enhancement factor of 107. The quantitative analysis of rhodamine 6G absorbed on optimized SERS substrate exhibits a good linear relationship, with a correlation coefficient (R2) of 0.9998, between the SERS intensity at 610 cm−1 and the concentration in the range of 0.1 nM—1μM. The practical low limit detection of R6G is 10 pM. The optimized SERS substrates show good stability (at least one month) and have been effectively tested in the detection of cancer drugs, including doxorubicin and metvan.
1. Introduction
Surface-enhanced Raman scattering (SERS) has been extensively studied since discovering the ability of the nanostructured plasmonic metal surfaces to enhance the Raman scattering of molecules in contact or proximity to such metal surfaces. SERS effect was discovered by Fleischmann et al. in 1974 when an enhanced Raman signal was observed for the pyridine absorbed on the surface of a rough silver electrode [1]. In 1977, Jeanmaire et al. and Albrecht and Creighton verified Fleishman’s findings and proposed the hypothesis that the enhanced Raman intensity related to the strong electric field enhancement effect [2] or the formation of a molecule–metal complex [3]. Subsequently, Moskovits proposed that the enhanced Raman scattering of molecules adsorbed on the rough metal surface resulted from the localized surface plasmons in the nanostructured metallic surface [4]. Its unparalleled ability to probe trace analytes, combined with characteristics of non-destructive detection, minimum sample preparation process, high sensitivity, simultaneous analysis of different molecules, and quick readout, has brought about an explosion of SERS research in the following decades. The new types of enhancing materials were explored, and the development and implementation of SERS-related instrumentation was paralleled by deep investigations into the fundamental theory of SERS.
Enhancing materials have diversified from metallic nanostructures such as Au, Ag, and Cu to the hybrids of noble metals and semiconductors, such as silicon nanohybrid-based SERS substrate [5], Au NPs-graphene oxide hybrid film [6], ZnO and Au/Ag hybrids [7], and Ag-MoS2 hybrids [8]. Additionally, the support matrix has evolved from rigid substrates such as glass [9], silicon [10], and aluminum [11] to flexible substrates such as paper-based and plastic-based SERS substrates that are lightweight, portable, recyclable [12,13,14,15,16]. Furthermore, a variety of fabrication approaches have been explored including nanolithography [17,18,19], vapor deposition [12,13], self-assembly [20,21], template-based [11], and inkjet printing [12,22,23,24,25]. SERS, as a technique, overcame the inherent sensitivity limitation of normal Raman spectroscopy and enabled single-molecule detection [26,27,28,29], emerging as a critical spectroscopic technique in analytical chemistry, materials science, and environmental science [30,31,32,33,34,35,36,37].
The exact mechanism for the SERS effect is still a matter of debate; however, two primary mechanisms are generally accepted in most studies—one involving electric field enhancement (EM) and the other, chemical, or charge-transfer enhancement (CHEM). Typically, the EM mechanism is related to the enhanced electric field arising from the surface plasmon resonance (SPR) when the plasmonic substrate is irradiated with an incident laser. In metallic nanostructures, SPR can be localized to specific positions such as the nanoscale edge, tip, or crevices, called localized surface plasmon resonance (LSPR), inducing a large local field effect, thereby amplifying the electromagnetic field intensity in this region [33,37,38,39,40,41]. Moreover, the strong mutual excitation between the induced dipole of molecules and the dipole of the metallic nanoparticles resulted in Raman polarizability, in turn enhancing the electromagnetic field [40,41]. The SERS enhancement factor (EF) based on EM can reach 106–108.
In contrast, the chemical or charge-transfer enhancement (CHEM) originates from the modification of the analyte molecule polarizability when this molecule interacts with the nanostructured metal of the plasmonic substrate. This mechanism highly relies on the type of the analyte molecule [42,43,44,45].
Although SERS has developed into a mature sensing technique, the reproducible and scalable fabrication of effective SERS substrates with high sensitivity and good uniformity is still a desired target. In this work, a homogeneous, conductive, and printable Ag ink was prepared using synthesized Ag nanoparticles and utilized for SERS substrate preparation via printing with a piece of homemade printing equipment. Comparing the SERS performance of the SERS substrate fabricated using different support matrices by hand drawing and printing method resulted in the selection of the optimal SERS substrate (PET-print-based substrate). FDTD simulations were conducted to assess the effect of particles spacing on the electric field enhancement for pairs of Ag NPs with different spacings. The stability, reproducibility, and quantitative analysis of R6G adsorbed on the PET-print-based SERS substrates proved the stable, reproducible, sensitive properties of the established SERS approach. The qualitative analysis of commercially available doxorubicin and in-house prepared bis(4,7-dimethyl-1,10-phenanthroline) sulfatooxovanadium(IV) via the established SERS approach highly match the literature, validating the PET-printed Ag NP-based SERS substrates.
2. Materials and Methods
2.1. Materials
Poly(acrylic acid) with MW of 50,000 (25 wt% in water) and MW of 5000 (50 wt% in water) were purchased from Polysciences, Inc. Silver Nitrate (AgNO3, 99.9%), certified grade ethylene glycol, and methanol (CH3OH, 99.8%) were bought from Fisher Chemical. Diethanolamine (C4H11NO2, >99.0%), hydroxyethylcellulose (200–300 mPa-s, 2% in water) was purchased from Tokyo Chemical Industry Co., Ltd. (TCI) America, Portland, OR, USA. Rhodamine 6G (R6G, 99%) and doxorubicin hydrochloride salt (DOX, >99%) were purchased from ACROS Organics and LC Laboratories, respectively. Pure ethanol and ACS-grade nanopure water were bought from Decon lab and the Ricca chemical company. PET-based printed substrate (NoveleTM IJ-220) was purchased from NovaCentrix. All reagents used in this work were used as received without further purification.
2.2. Preparation of Ag Nanoparticles (NPs)
Ag NPs were prepared through a modified published procedure by Ahn et al. [46]. In a typical experiment, 0.09 mL of poly(acrylic acid) (25 wt% in water, MW = 50,000) and 0.18 mL of poly(acrylic acid) (50 wt% in water, MW = 5000) were loaded to a 100 mL Erlenmeyer flask containing 4 mL of diethanolamine and 5 mL of nanopure water, followed by stirring at room temperature for 2 h. Then, 2 mL of AgNO3 aqueous solution (1 g/mL) was added to the above solution, and the mixture was stirred at room temperature for another 22 h. The resulting dark brown solution was sonicated at 65 °C for 2 h for further particle growth and then cooled to room temperature naturally. Afterward, as a poor solvent for poly(acrylic acid) capped Ag NPs, ethanol (30 mL) was slowly added at a rate of 3 mL/min to precipitate the Ag NPs. The obtained product was purified three times with nanopure water (5 mL) to obtain a brown silver precipitate.
2.3. Preparation of Ag NPs Inks
A total of 0.82 mL of nanopure water, 0.52 g ethylene glycol, and 1.5 g obtained silver precipitate were mixed in a 50 mL beaker and then stirred overnight to form a uniform silver suspension. Afterward, an HEC solution was added to the silver suspension to make a brown mixture with a weight ratio of 3:100 [47]. The mixture was subsequently homogenized at 2000 rpm for 15 min to prepare a homogeneous printable silver ink. Herein, the HEC solution was prepared by dissolving 0.8 g hydroxyethyl cellulose in the mixture of 20 mL methanol and 20 mL nanopure water at 70 °C. The resulting transparent solution was filtered by a 3.1 μm filter.
2.4. FDTD Simulation
The FDTD simulation, using the Ansys Lumerical Photonics Simulations software, was utilized to investigate the electric field distribution of Ag NPs. The simulation region of a single Ag NP, 2–3 Ag NPs, and 4 Ag NPs was set to 200 nm × 200 nm × 200 nm, 400 nm × 400 nm × 400 nm, 500 nm × 500 nm × 500 nm, respectively, and the grid accuracy set to 1 nm × 1 nm × 1 nm. The source type herein adopted a total-field scattered-field (TSFT) source with a wavelength range of 200–700 nm, and the sphere structure was selected as the simulation structure of the silver nanoparticle. Furthermore, the source of the plane wave, the monitors of the frequency-domain profile, and power were input of this simulation to determine the electric field of Ag NPs.
2.5. Fabrication of Silver Nanoparticles Active Substrate
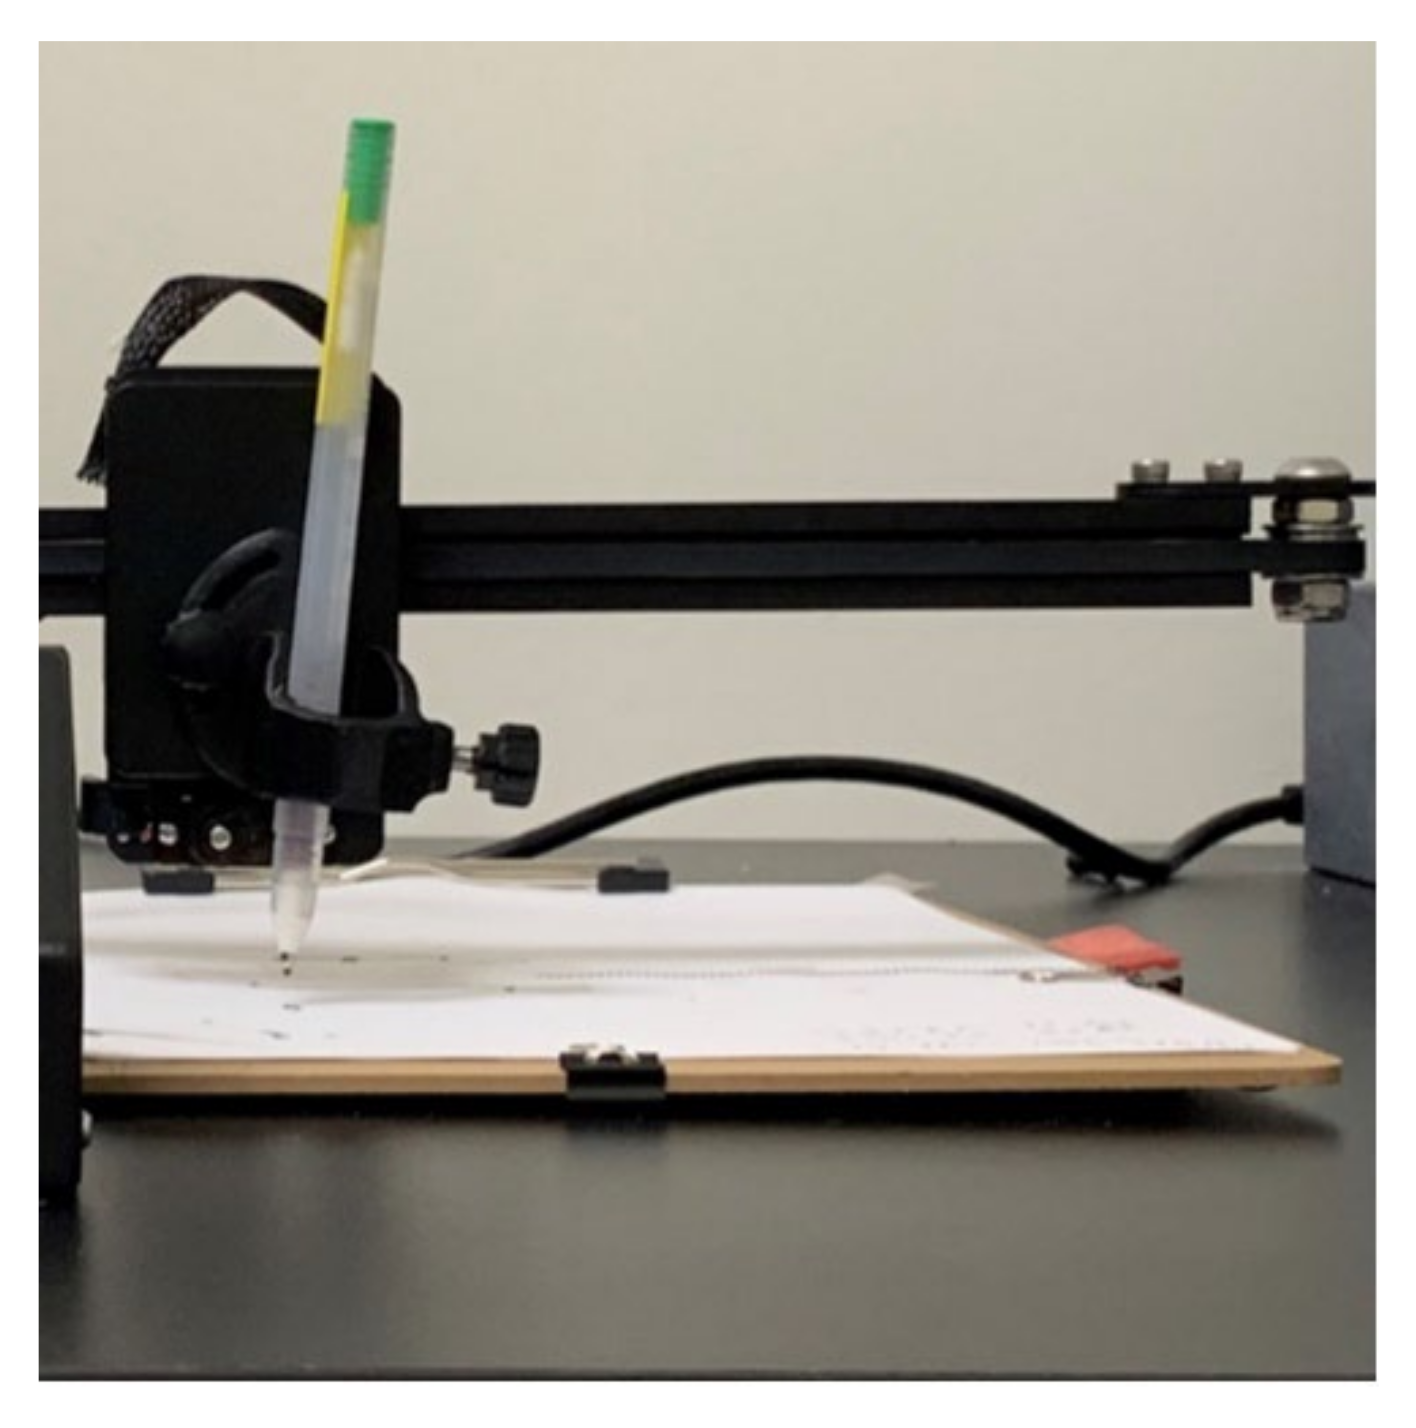
Two approaches were developed here to fabricate the SERS substrates, including direct printing and hand-drawn methods. Printing was accomplished using an in-house assembled printing machine equipped with a user fillable pen (Figure 1). For this procedure, 2 × 5 mm line patterns were designed through the equipment software and then Ag inks were patterned with a drawing speed of 800 mm/min on the selected flexible substrate. To investigate the influence of the uniformity of SERS substrate on the enhancement effect, silver inks were deposited on the flexible substrate by hand drawing (HD) to form SERS substrate with a SERS spot diameter of 5 mm.
2.6. SERS Measurement
To evaluate the influence of the support matrix on the SERS performance, 1 μM R6G aqueous solution (5 μL) were dropped on notebook-based paper, regular printer paper (office paper), and sticky-note-based paper, and PET-based SERS substrates fabricated by printing and hand-drawn methods and then dried at 65 °C in a drying oven for 5 min. Meanwhile, 5 μL of 0.1 M R6G aqueous solution was deposited on a clean glass slide and used as the reference substrate. The Raman spectra of each specimen were collected using a Raman spectrometer (WITec alpha 300) equipped with a 532 nm laser and a 600-groove mm−1 grating, wherein the Raman map (50 μm × 50 μm) consists of 900 pixels (30 points per line and 30 lines per image). To obtain an optimal Raman scattering signal without damaging the analyte molecules, the laser power was set as 0.1 mW, and the laser exposure time was 1 s for the SERS measurement. The enhancement factor (EF) of the fabricated SERS substrates were determined according to the following equation [14,48]:
Herein, R6G was employed as the probe molecule. ISERS and IRaman are the peak intensities at Raman mode at 610 cm−1 for R6G absorbed on SERS substrate and on the normal glass substrate, respectively. NSERS and NRaman represent the estimated number of R6G molecules illuminated by the laser on the surface of the SERS substrate and the normal glass substrate. The analyte molecules dropped on the substrate surface are generally assumed to form a monolayer that fully covers the surface of SERS substrate [14,49,50,51]; thus, the EF could be expressed in the following form:
where the MSERS and MRaman are the numbers of R6G molecules deposited onto the SERS substrate and a normal glass and are related to the concentration of R6G solution. The SSERS and SRaman are the surface areas of the R6G solution casting on the SERS substrate and normal glass, respectively. Alaser is the area of a laser spot. It is worth noting that the Raman signal of 0.1 M R6G solution was obtained by using 0.4 mW laser power and 1 s integration time. Based on the report by Viets and Hill, the SERS band intensity of characteristic Raman scattering is proportional to the laser power at low powers up to ~2.5 mW; therefore, the ISERS/IRaman in this study could be approximated as 4 times (0.4 mW/0.1 mW) of the calculated intensity ratio at 610 cm−1 [52].
After obtaining the optimal SERS substrate, 5 μL of R6G solutions with different concentrations were deposited on the optimal substrate to qualify R6G and investigate its limit of detection. Furthermore, the optimal SERS substrates were employed to investigate the commercially acquired doxorubicin and in-house-made metvan.
2.7. Characterization
X-ray diffraction (XRD) measurement was conducted on a Rigaku MiniFlex600 equipped with Cu Kα radiation (λ = 1.5405 Å) to investigate the crystal structure of Ag nanoparticles. WITec alpha 300 Raman spectroscopy equipped with Ar laser source (λ = 532 nm) was used to examine the SERS performance. A field emission scanning electron microscope with energy-dispersive X ray spectroscopy (SEM-EDS) (JEOL 6330F) was used to determine the morphology and size of the synthesized Ag nanoparticles. UV-Vis-NIR spectra of Ag nanoparticles were collected using a UV-3600 plus spectrophotometer (SHIMADZU). Finite-difference time-domain (FDTD) software (Ansys/Lumerical Inc.) was employed to simulate the electric field distribution for Ag NPs.
3. Results and Discussion
3.1. Characterization of Ag Nanoparticles
In the synthesis of Ag NPs, diethanolamine was employed as the reducing agent; the mechanism involves the conversion of the hydroxyl group of diethanolamine into an aldehyde group to reduce Ag+ cation to Ag0 [46,47,53]. The poly(acrylic acid) was used as a surface-capping agent that binds on the surface of Ag nanostructures to prevent their uncontrolled aggregation. It is worth noting that the polymeric modifiers also acted as a steric barrier, hindering access of the analyte to the SERS-active substrate, thus negatively impacting the sensitivity of the SERS measurement [54,55,56]. Additionally, the polymeric modifiers on the surface of metal nanostructures generate obvious background signals in the Raman spectrum. The background depends dramatically on carbon chain length, influencing the specificity of SERS measurement [55,57,58]. Thus, the selectivity and amount of capping agents have important roles in the SERS analysis.
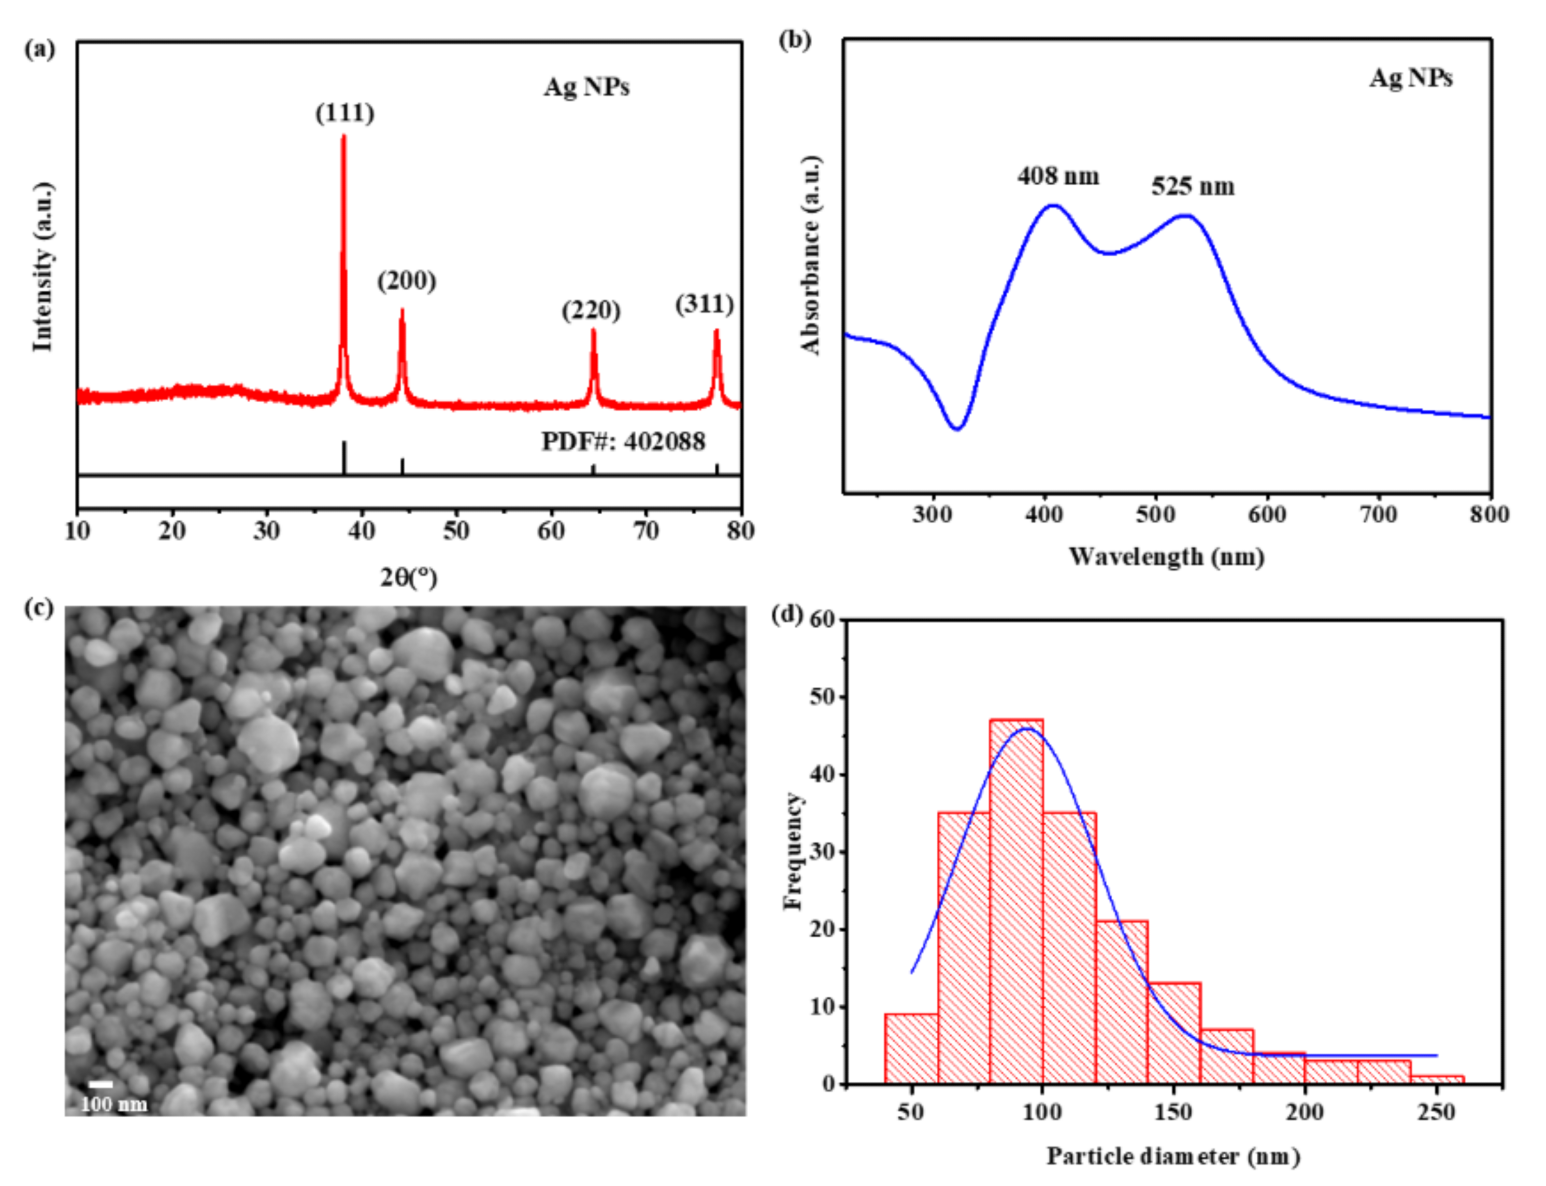
XRD analysis in Figure 2a confirms the synthesized Ag NPs possess face-centered cubic crystal structure (FCC) with a space group of Fm-3m and a lattice constant of a = 4.09 Å. UV-Vis spectrum and SEM (Figure 2b–d) were used to determine the optical properties and size distribution of Ag NPs. According to the literature, the UV-Vis absorption spectrum of Ag NPs is highly sensitive to the particle size [59,60,61,62], the shape of the NPs [60,63,64], and the dielectric properties of the surrounding media [61,65]. For instance, Paramelle et al. reported that the absorption maxima of Ag NPs redshifted from 395 nm to 491 nm when the diameter of Ag particle increased from 10 nm to 100 nm [62], and Cai et al. reported that the synthesized Ag nanospheres with non-uniform sizes presented two absorption bands at 425 nm and 635 nm [60]. In our study, the two broad absorption bands at 408 nm and 525 nm in Figure 2b could be ascribed to the non-uniform nanoparticle size and irregular morphology of Ag NPs. This is consistent with the SEM image and the size distribution histogram extracted from the SEM image, in Figure 2c and d, respectively, showing the investigated Ag NPs with different sizes, in a range of 30–260 nm, and irregular spherical morphology.
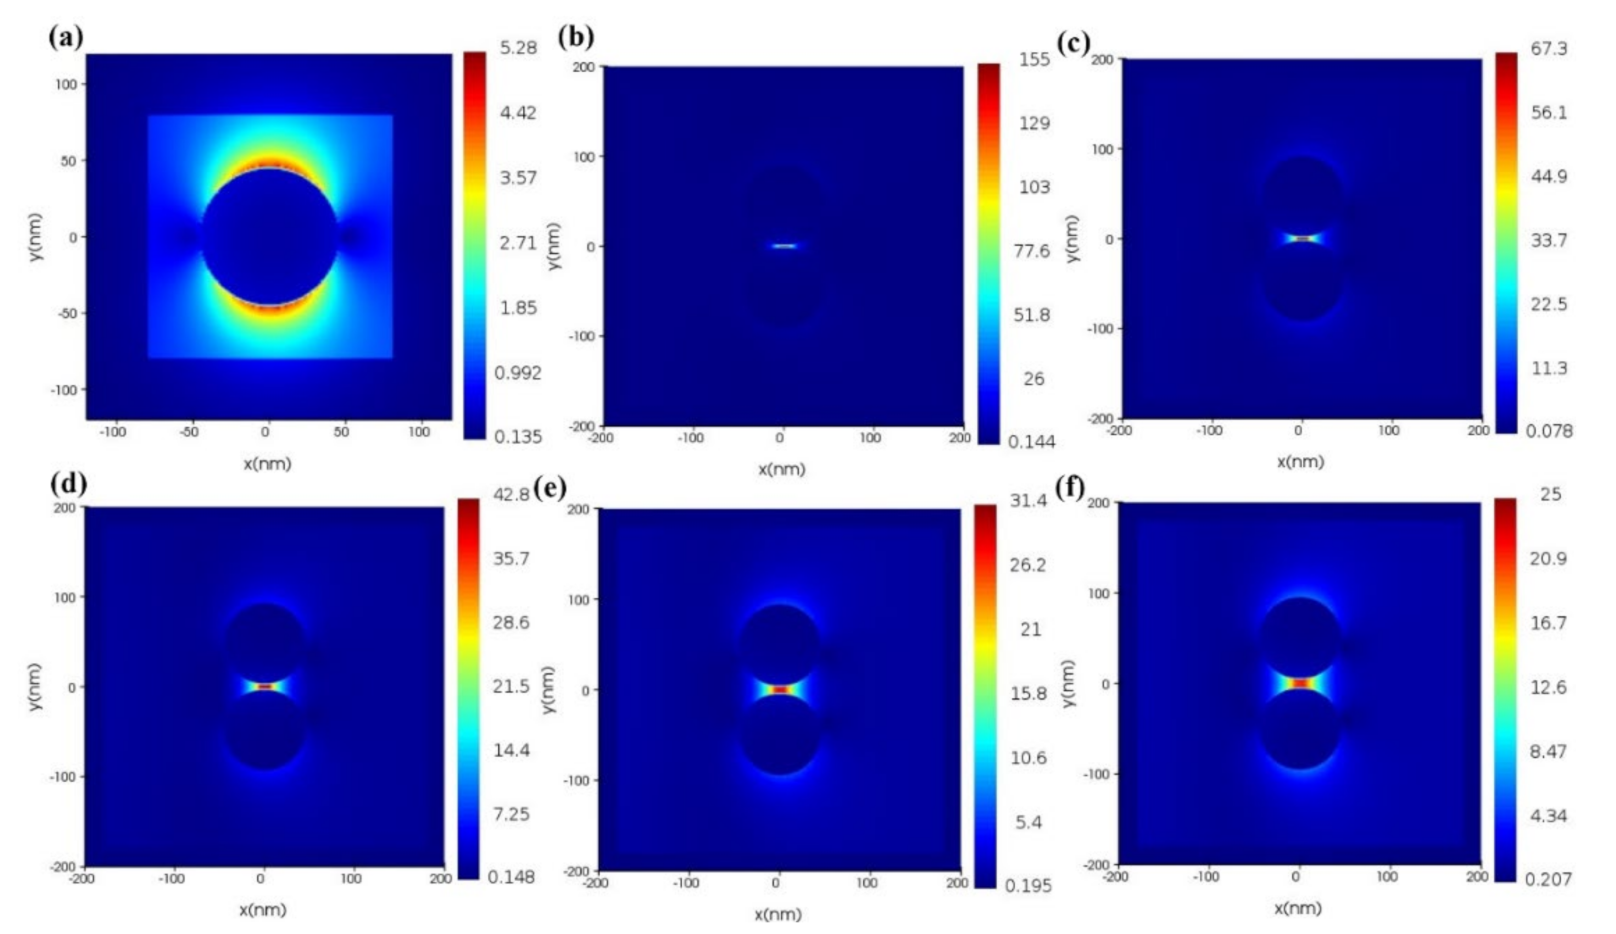
As the dominant diameter of Ag NPs is ~90 nm (Figure 2d), we set the radius of the Ag NPs as 45 nm to simulate the electric field distribution of Ag NPs. It has been reported that the electric field enhancement of double plasmonic nanoparticles was stronger than single nanoparticles, and the distance between nanoparticles affects the coupling electric field enhancement [35,66]. To determine the optimal nanoparticles spacing, double Ag NPs with an equal radius of 45 nm were subjected to the FDTD simulation to determine the distribution of the electric field of Ag NPs pair with different nanoparticle spacings. The injected light was polarized along the x-axis, and the refractive index was set as 1.0 for air. As shown in Figure 3, the particle coupling electric field enhancement at the wavelength of 532.6 nm increased from 25 to 155 times when reducing the nanoparticles spacing from 10 nm to 2 nm, matching previous reports [66,67,68,69,70,71]; therefore, the optimal nanoparticles spacing was 2 nm. It is widely accepted that the SERS enhancement could be approximated as |E|4/|E0|4; thus, the maximum SERS enhancement on the double Ag NPs herein could be calculated as 5.77*108 [39,72]. When the analyte molecule is located in these gaps, the intensity of its Raman signal will largely be enhanced due to the high electric field of this area. The absorption spectra of the Ag NPs with different NPs spacing (Figure S1) exhibits a blue shift with increasing nanoparticles spacing, in accordance with literature reports [66,68,73,74]. Estimating the space between two adjacent Ag NPs from the SEM image of PET-print-based SERS substrate in Figure S2a, we set up FDTD simulations at the wavelength of 532.6 nm for Ag NP structures containing single, 2, 3, and 4 NPs to investigate the location of hot spots, wherein the nanoparticle radius and spacing was set as 45 nm and 10 nm, respectively, as shown in Figure S2b–e, in which the hotspots are located in the bright red and blue area.
3.2. Substrate Selection
It is a fact that the substrate condition plays an important role in the SERS performances since the roughness and the absorption factor of the support matrix affect the number of analyte molecules retaining on the plasmonic nanoparticles; for instance, the traditional support matrix such as glass and silicon could not effectively retain the analyte solution onto the nanoparticles [75,76]. The most common and readily accessible support matrix of SERS substrate is paper, which possesses cellulose fibers inside, facilitating the flow of analyte solution through microfluidics [77,78]. PET is another type of promising substrate in SERS application due to its unique flexibility and transparency [15,16].
In addition to the influence of the support matrix, the fabrication technique also affects the uniformity of the SERS substrate surface and the reproducibility of the Raman signal, which, in turn, influences the SERS performance. Therefore, in this work, different types of support matrices such as office paper, notebook paper, sticky notes, and PET electric substrate coated with Ag inks using hand-drawn and inkjet printing were deposited with 1 μM R6G solution (5 μL) to investigate the SERS amplification induced by the substrate. The obtained SERS spectra of 1μM R6G on different SERS substrates and the Raman spectrum of 0.1 M R6G on bare glass are presented in Figure S3, where the characteristic Raman band is in good agreement with the literature [14,15,16,26].
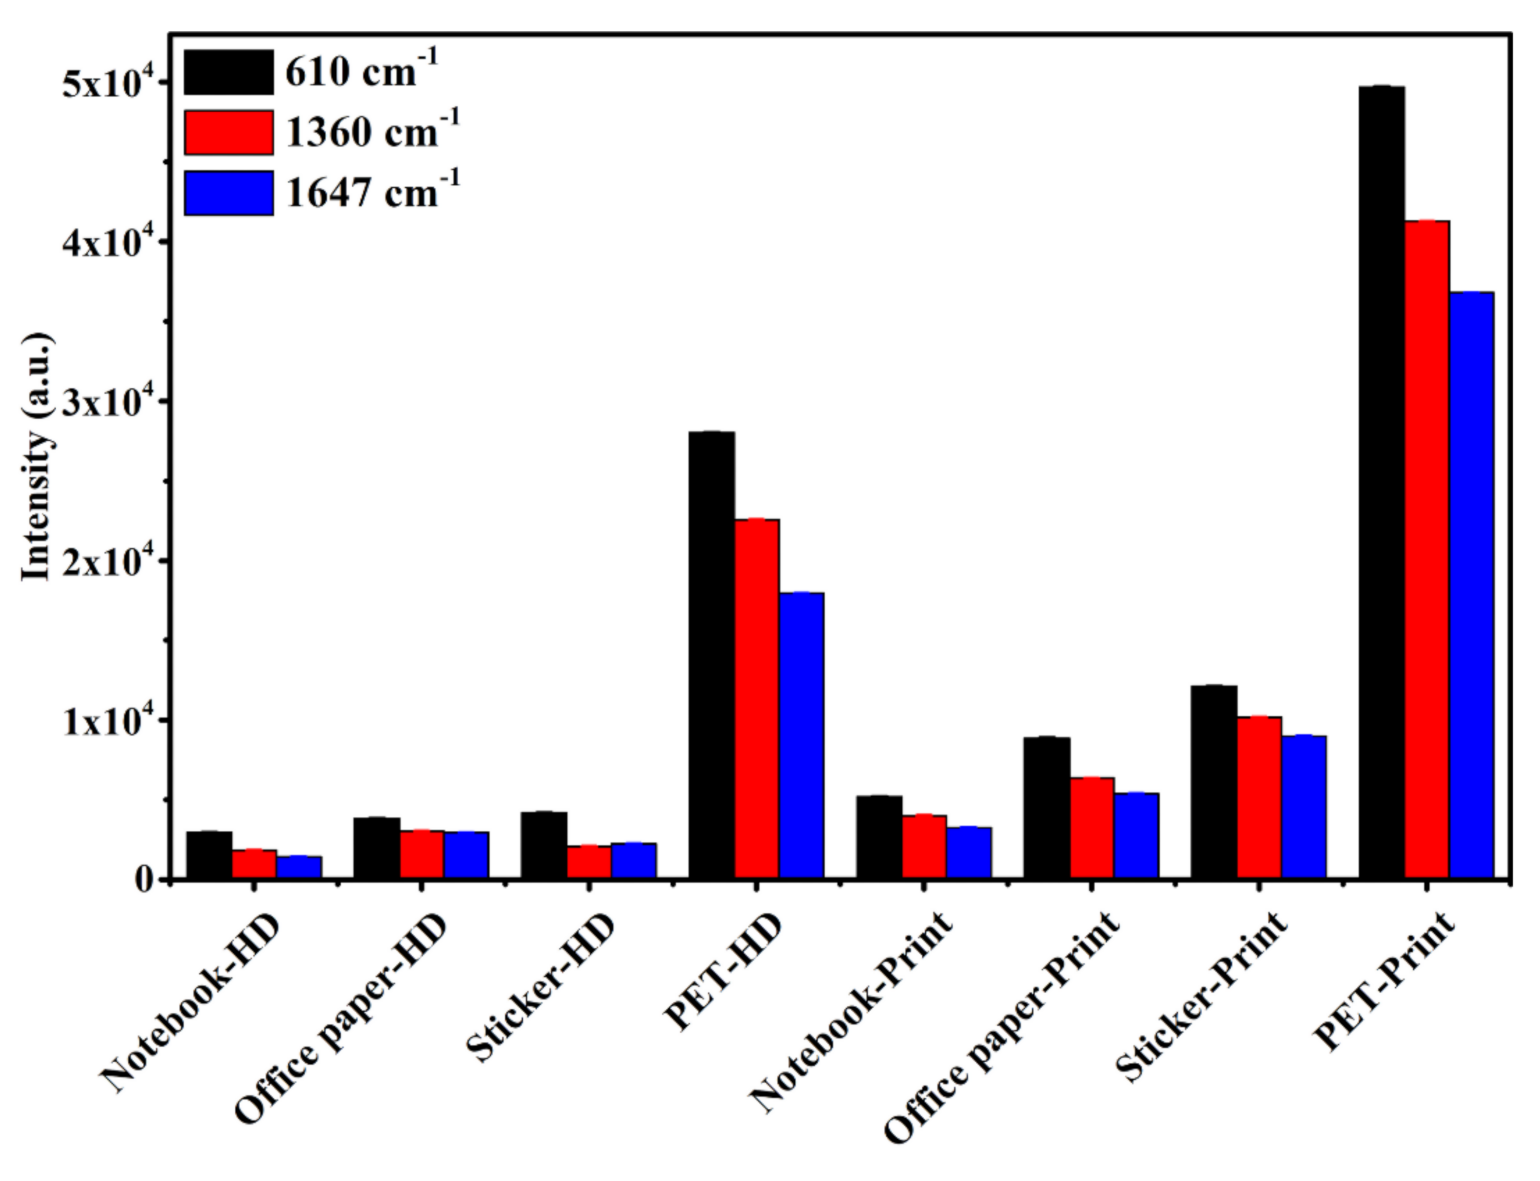
In Figure 4, a comparison of the SERS intensities at 610 cm−1, 1360 cm−1, and 1647 cm−1 of 1 μM R6G adsorbed on SERS substrate fabricated with different support matrix and different coating methods shows that PET-based SERS substrate made via printing method (PET-print-based SERS substrate) possesses the largest amplification effect, indicating the optimal SERS sensitivity of the PET-print-based SERS substrate. The calculated enhancement factor of PET-print-based SERS substrate could reach ~ 107, an improvement in the order of magnitude when compared to reported values of ~106, summarized in Table S1. Typically, SERS enhancement involves two multiplicative contributions—a major contribution of electromagnetic field enhancement and a smaller contribution of chemical enhancement, where the electromagnetic enhancement arises from localized surface plasmons being independent of the type of analyte molecule, whereas the chemical enhancement originates from the intermolecular and intramolecular electronic transition and highly rely on the kind of analyte molecule. The R6G molecule was employed as the probe molecule for substrate optimization study; thus, the electromagnetic field effect is the only one considered.
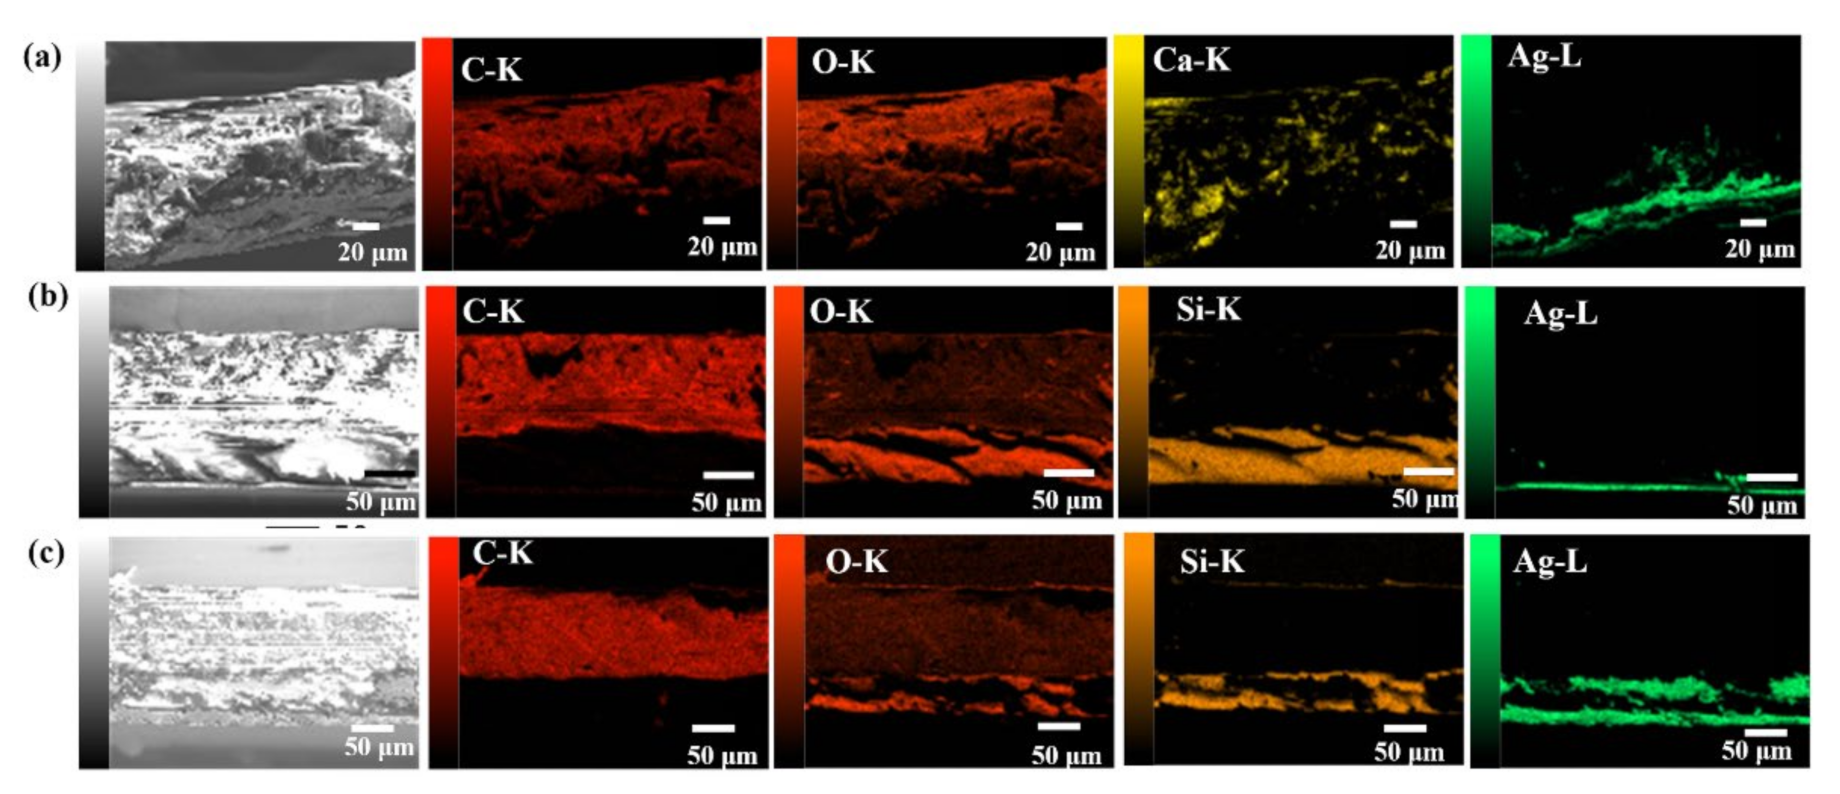
Earlier work has proved that the electric field enhancement distribution on the surface of SERS substrate is uneven, mainly concentrated in small spatial regions—namely, “hot spots,” which are ascribed to the nanogaps between plasmonic nanoparticles or between the nanoparticle and the surface. Therefore, the SERS enhancement varies dramatically as a function of the position, and ideally, the probe molecules should be placed inside the hot spots. Furthermore, Le Ru et al. reported that the SERS enhancement highly relies on the nanogap size where the SERS enhancement factor increased from ~5 × 10⁵ to ~3 × 10⁹ when reducing the gap size from 10 to 2 nm [69]. Therefore, in theory, a larger amount of Ag NPs on the surface of the matrix will generate smaller nanogap, resulting in a larger number of hot spots and ultimately enhancing the SERS performance. Consequently, the SERS sensitivity of the PET-based SERS substrate is effectively enhanced, compared to the paper-based SERS substrate, because most of the Ag NPs spread on the PET-based substrate remained on the PET surface, but the Ag NPs deposited on the paper matrix penetrated the cellulose fiber inside the paper resulting in a less amount of Ag NPs retained on the irregular surface of the paper matrix. This Ag distribution for the two substrates is shown in the SEM-EDS images in Figure 5, alongside the other elements in the composition of the substrates. Based on the investigation of SERS activity for paper-based SERS substrates, for the same amount of added plasmonic metal nanoparticles, the number of nanoparticles retaining on the substrate varies, depending on the diffusion and adsorption of the nanoparticles in different support matrices, which is essentially related to the unique 3D fiber network of the substrate [14]; thus, the notebook-based, office paper-based, and sticky note-based SERS substrates show different amplification effects.
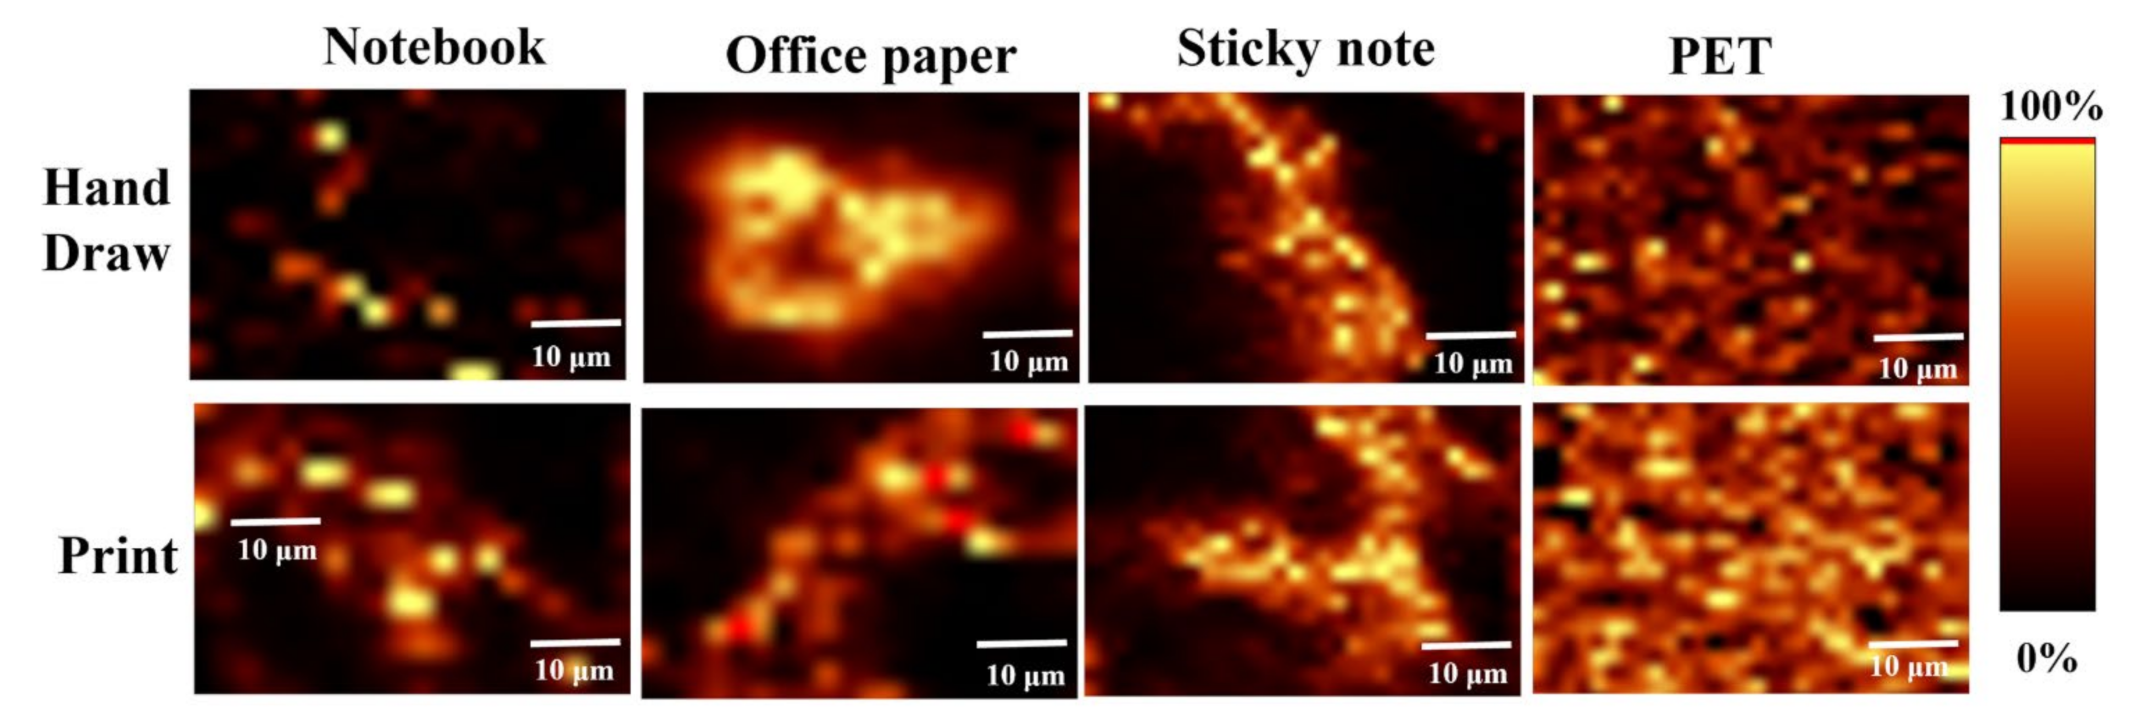
The different enhancement effects between the SERS substrates fabricated by hand drawing and the SERS substrates made by printing method could be explained by the uniformity variations of Ag NPs deposition on the surface of the support matrix. The SERS substrate fabricated by printing provides a highly uniform and fully covered Ag NPs layer and resulted in a high SERS signal, as shown in the SEM-EDS images in Figure 5. As displayed in Figure 6, the Raman map for the characteristic Raman band at 610 cm−1 collected from PET-based SERS substrate is more homogeneous than that of paper-based SERS substrates. Furthermore, the deposition uniformity of the hand-drawn PET-based SERS substrate, as determined by SERS mapping, is substantially inferior to the uniformity of PET-print-based SERS substrate. In conjunction with the SERS performance of different substrates in Figure 4, the PET-print-based substrate provides the highest sensitivity and great uniformity and therefore proves to be an optimal SERS substrate, as demonstrated in this work.
3.3. SERS Detection of R6G
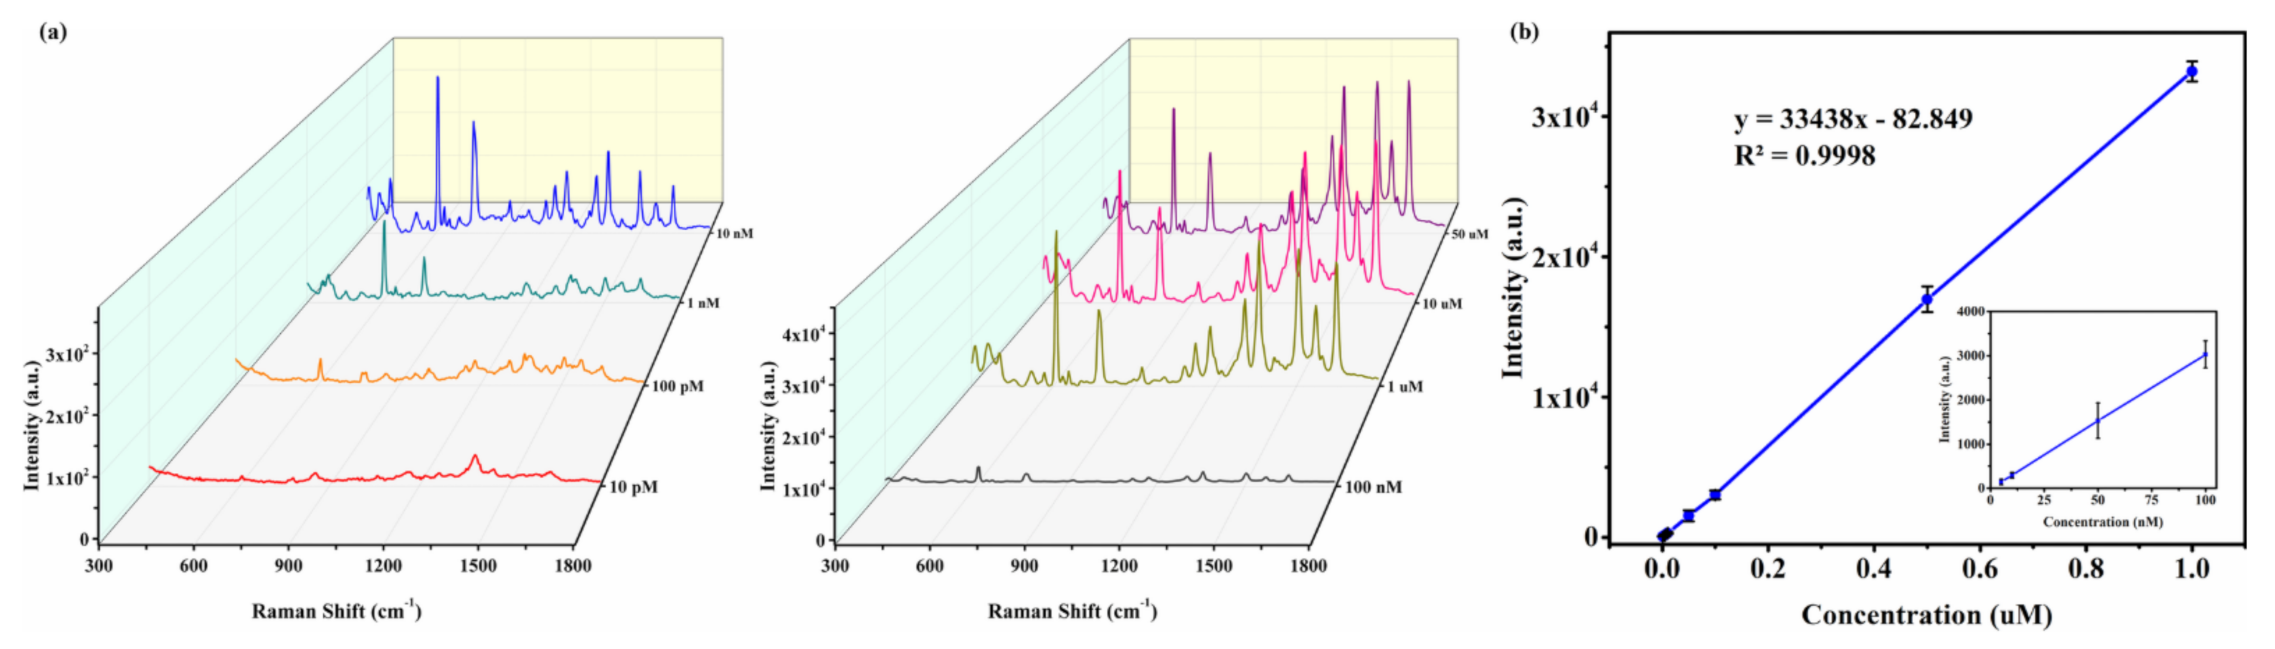
For this part of the study, 5 μL of R6G solutions with different concentrations were dropped on the PET-print-based SERS substrates to qualify the substrate for R6G detection. Under the optimized experimental conditions, Raman maps (50 μm × 50 μm) of R6G with various concentrations adsorbed on the PET-print-based SERS substrates were collected, and the Raman scattering at 610 cm−1 was used as the characteristic band to construct the calibration plot of R6G solutions. As shown in Figure 7a, the concentration-dependent SERS spectra of R6G presents that the SERS intensity rises as the concentration of R6G increases in the range of 10 Pm-1 μM. For R6G with concentrations higher than 1 μM, the increase in SERS intensity decreases because of the amount of R6G molecules oversaturated for the number of hot spots, wherein the excess R6G molecules could not efficiently be excited to contribute to the SERS signal [24,79]. Additionally, the PET-print-based SERS substrate has the capability to detect analytes concentrations as low as 10 pM, which we regard as the practical low limit of detection (LOD). The obtained SERS intensity is in good correlation with the corresponding concentration of R6G in the range of 0.1 nM–1 μM, which is well interpolated with a linear function Y = 33438X − 82.849 (R2 = 0.9998), as displayed in Figure 7b. The error bars represent the standard deviation obtained at six independent sites on the PET-print-based SERS substrate. The inset of Figure 7b displays the detailed linear relationship between SERS intensity and R6G concentrations in the range of 0.1 nM–0.1 μM.
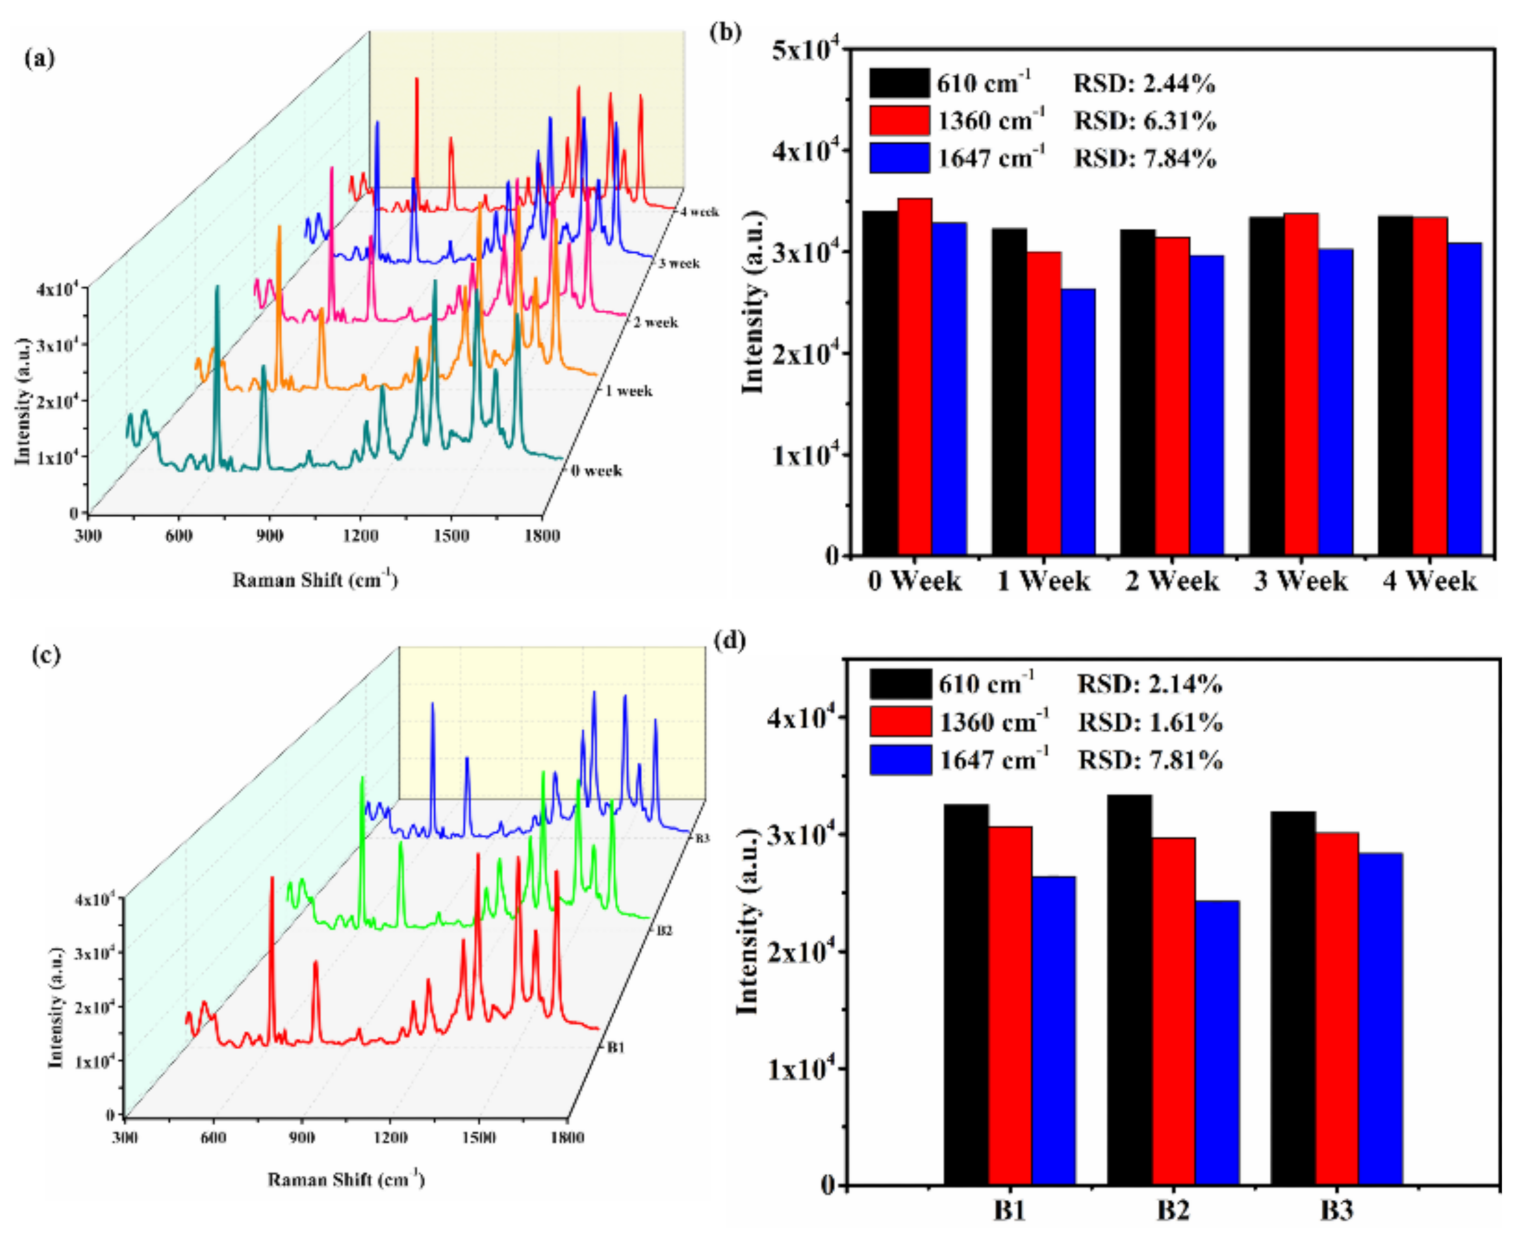
It is well known that the stability and reproducibility of the SERS substrate have important roles in evaluating its potential for scalable production. The stability of PET-print-based SERS substrate was systematically determined by using R6G (1 μM) as the probe molecule. The prepared SERS substrate with R6G was investigated over a period of one month, as shown in Figure 8a,b. The SERS spectra of R6G during one month are similar, and there is no obvious shift for the featured Raman band and significant intensity change; the SERS intensity values at 610, 1360, and 1647 cm−1 after one month were close to that obtained in freshly prepared SERS substrate. The relative stand deviation (RSD) was less than 5% for the Raman band at 610 cm−1, indicating the exceptional stability of the PET-print-based SERS substrate. It is worth noting that no special precautions were taken for the storage of the SERS substrate; they were stored at room temperature under ambient atmosphere.
The reproducibility of PET-print-based substrate was systematically studied by investigating the SERS performance of three different batches of Ag NPs inks. Figure 8d illustrates the SERS intensity at 610, 1360, and 1647 cm−1 of R6G adsorbed on three independent PET-print-based SERS substrates made from three different batches of Ag inks, showing similar behavior among the three batches; the calculated RSD was less than 5% for the Raman band at 610 cm−1. The corresponding Raman spectra are shown in Figure 8c.
Therefore, the fabricated PET-print-based SERS substrate possesses high detection sensitivity, long-term stability, and reliable reproducibility, being an ideal choice for SERS detection.
3.4. Application of the PET-Print-Based SERS Substrates for Detection of Cancer Drugs Doxorubicin and Metvan
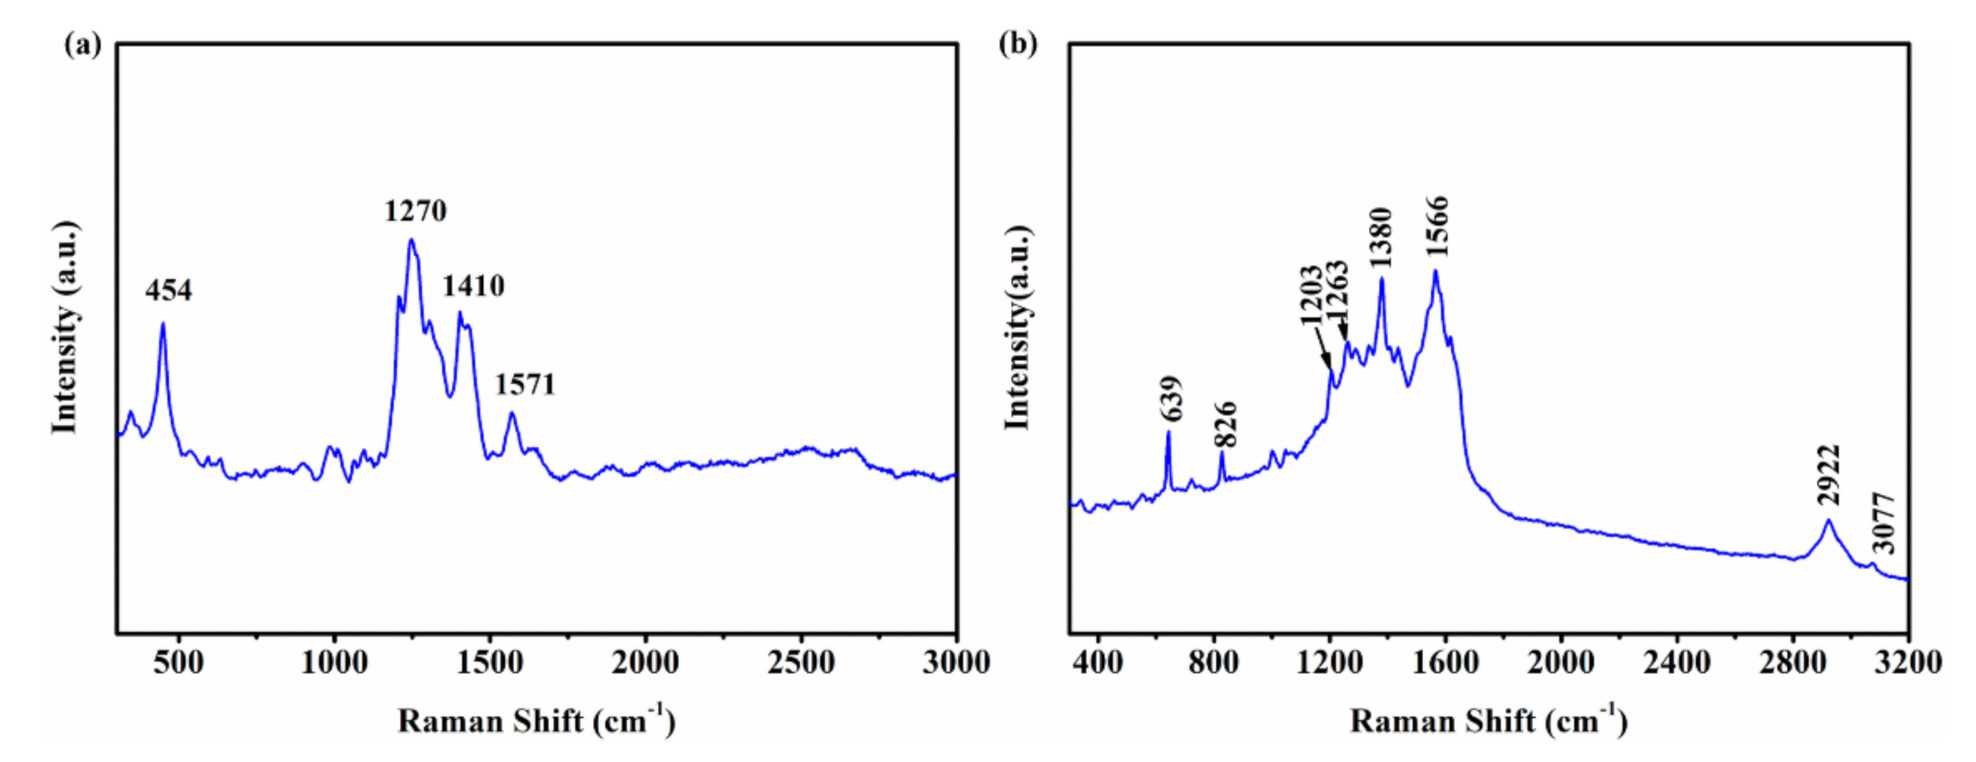
SERS has been extensively studied in the biomedical field, due to aforementioned advantages such as its ultrahigh surface sensitivity down to single-molecule level [27,28,29,30], fingerprint recognition capabilities [40,80], long-term stability due to the resistance to photobleaching and photodegradation [37], flexibility in fabrication, etc. For instance, SERS measurement was conducted on a blood plasma–doxorubicin–silver colloid system to detect doxorubicin (DOX) wherein a 488 nm laser was used as the excitation source [81]. Herein, we report the use of our optimized PET-print-based SERS substrate to detect the doxorubicin and metvan. The applied 532 nm laser power and integration time were 0.16 mW and 10 s, respectively. As shown in Figure 9a, the SERS spectrum of 10 μM DOX presents the characteristic bands at 454, 1270, 1410, and 1571 cm−1 corresponding to the in-plane bending of C = O, the stretching C-O vibration of the aromatic ring, and the ring-stretching vibration, respectively, in good agreement with previous reports [80,82].
Figure 9b displays the SERS spectrum of 10 μM metvan complex that was prepared in-house through a slightly modified procedure in the literature [83]. The featured Raman band at 639 and 826 cm−1 are attributed to the antisymmetric deformation mode of SO42− and stretching of the o-phenanthroline skeleton; the Raman scattering at 1203, 1263, 1566, 1624 cm−1 correspond to the stretching of the o-phenanthroline skeleton, whereas the peaks at 2922 and 3077 cm−1 could be assigned to the –CH3 stretching and aromatic =C–H stretching, respectively.
4. Conclusions
In summary, face-centered cubic (FCC) Ag NPs synthesized through a solution-phase method were used to prepare a printable Ag ink, which was subsequently loaded in a user-fillable pen and employed either by hand or by an in-house assembled printing machine to fabricate SERS substrates. By using an inexpensive PET substrate printed with the Ag NPs ink through a scalable method, we developed a highly sensitive, reproducible, and cost-effective method to detect any Raman active analyte on substrates with long-term stability. The FDTD simulations indicated that a 155-times maximum Ag NP electric field enhancement was achieved for Ag NPs pairs with a spacing of 2 nm. By comparing the SERS performance of the active SERS substrate made by different support matrices and fabrication methods, the PET-print-based substrate was identified as the optimal SERS support, possessing an estimated enhancement factor of ~107. With the highly uniform and reliable reproducibility of PET-print-based SERS substrate, a quantitative analysis of the R6G aqueous solution was performed via SERS measurements. A good linear relationship with a correlation coefficient (R2) of 0.9998 between the SERS intensity at 610 cm−1 and the R6G concentration in the range of 0.1 nM–1 μM was obtained. The practical low limit detection of R6G was identified in the picomolar range (10 pM). In addition, qualitative analysis of commercial DOX and laboratory-made metvan were investigated through the SERS approach established above, where the obtained Raman scattering spectra fully match the literature. Thus, the PET-print-based SERS substrate reported herein should pave the way for affordable and scalable SERS.
Supplementary Materials
The following are available online at https://www.mdpi.com/article/10.3390/applnano2030017/s1, Figure S1: FDTD-simulated absorption cross sections of single Ag NP with a radius of 45 nm and double Ag NPs with NP–NP spacing of 2, 4, 6, 8, and 10 nm, Figure S2: (a) SEM image of Ag nanoparticles on PET-print-based substrate; (b–e) FDTD-simulated electric field with the excitation wavelength of 532.6 nm for single Ag NP, 2 NPs, 3 NPs, and 4NPs, Figure S3: (a) SERS spectra of 1μM R6G on different SERS substrates; (b) Raman spectrum of 0.1 M R6G on bare glass, Table S1: Detection of R6G employing SERS-based approach.
Author Contributions
Conceptualization, M.L., C.-Y.L., D.R.R., and A.B.; methodology, M.L., C.-Y.L., M.A.H.M., and D.R.R.; validation, M.L., C.-Y.L., M.A.H.M., D.R.R., and A.B.; formal analysis, M.L., C.-Y.L., and M.A.H.M.; investigation, M.L. and M.A.H.M.; resources, C.-Y.L. and D.R.R.; data curation, M.L.; writing—original draft preparation, M.L.; writing—review and editing, C.-Y.L. and D.R.R.; supervision, C.-Y.L. and D.R.R.; project administration, C.-Y.L. and D.R.R.; funding acquisition, C.-Y.L. and D.R.R. All authors have read and agreed to the published version of the manuscript. A.B.’s contribution was in no part related to her current affiliation.
Funding
This research was funded by the US Office of Naval Research, Award N00014-20-1-2539, NASA Award 80NSSC10M0201, and US National Science Foundation Award NSF1924412.
Institutional Review Board Statement
Not applicable.
Informed Consent Statement
Not applicable.
Data Availability Statement
The data presented in this study are available on request from the authors.
Conflicts of Interest
The authors declare no conflict of interest. The funders had no role in the design of the study, in the collection, analyses, or interpretation of data, in the writing of the manuscript, or in the decision to publish the results.
References
- Fleischmann, M.; Hendra, P.J.; McQuillan, A.J. Raman spectra of pyridine adsorbed at a silver electrode. Chem. Phys. Lett. 1974, 26, 163–166. [Google Scholar] [CrossRef]
- Jeanmaire, D.L.; Van Duyne, R.P. Surface raman spectroelectrochemistry: Part I. Heterocyclic, aromatic, and aliphatic amines adsorbed on the anodized silver electrode. J. Electroanal. Chem. Interfacial Electrochem. 1977, 84, 1–20. [Google Scholar] [CrossRef]
- Albrecht, M.G.; Creighton, J.A. Anomalously intense Raman spectra of pyridine at a silver electrode. J. Am. Chem. Soc. 1977, 99, 5215–5217. [Google Scholar] [CrossRef]
- Moskovits, M. Surface roughness and the enhanced intensity of Raman scattering by molecules adsorbed on metals. J. Chem. Phys. 1978, 69, 4159–4161. [Google Scholar] [CrossRef]
- Wang, H.; Jiang, X.; Lee, S.-T.; He, Y. Silicon Nanohybrid-based Surface-enhanced Raman Scattering Sensors. Small 2014, 10, 4455–4468. [Google Scholar] [CrossRef] [PubMed]
- Zhao, Y.; Song, Y.; Zhang, Y.; Fan, Y.; Lai, K. Ultra sensitive detection of malachite green in fish muscle with gold nanoparticles and graphene oxide hybrid as a substrate for surface enhanced Raman scattering. J. Food Meas. Charact. 2020, 14, 658–667. [Google Scholar] [CrossRef]
- Jiao, T.; Kutsanedzie, F.Y.H.; Xu, J.; Viswadevarayalu, A.; Hassan, M.M.; Li, H.; Xu, Y.; Chen, Q. SERS-signal optimised AgNPs-plated-ZnO nanoflower-like structure synthesised for sensing applications. Phys. Lett. A 2019, 383, 1312–1317. [Google Scholar] [CrossRef]
- Li, J.; Zhang, W.; Lei, H.; Li, B. Ag nanowire/nanoparticle-decorated MoS2 monolayers for surface-enhanced Raman scattering applications. Nano Res. 2018, 11, 2181–2189. [Google Scholar] [CrossRef]
- Qu, L.-L.; Li, D.-W.; Xue, J.-Q.; Zhai, W.-L.; Fossey, J.S.; Long, Y.-T. Batch fabrication of disposable screen printed SERS arrays. Lab A Chip 2012, 12, 876–881. [Google Scholar] [CrossRef]
- Chiolerio, A.; Virga, A.; Pandolfi, P.; Martino, P.; Rivolo, P.; Geobaldo, F.; Giorgis, F. Direct patterning of silver particles on porous silicon by inkjet printing of a silver salt via in-situ reduction. Nanoscale Res. Lett. 2012, 7, 502. [Google Scholar] [CrossRef] [Green Version]
- Das, G.; Patra, N.; Gopalakrishanan, A.; Zaccaria, R.P.; Toma, A.; Thorat, S.; Di Fabrizio, E.; Diaspro, A.; Salerno, M. Surface enhanced Raman scattering substrate based on gold-coated anodic porous alumina template. Microelectron. Eng. 2012, 97, 383–386. [Google Scholar] [CrossRef] [Green Version]
- Abe, K.; Kotera, K.; Suzuki, K.; Citterio, D. Inkjet-printed paperfluidic immuno-chemical sensing device. Anal. Bioanal. Chem. 2010, 398, 885–893. [Google Scholar] [CrossRef] [PubMed]
- Keating, M.; Song, S.; Wei, G.; Graham, D.; Chen, Y.; Placido, F. Ordered Silver and Copper Nanorod Arrays for Enhanced Raman Scattering Created via Guided Oblique Angle Deposition on Polymer. J. Phys. Chem. C 2014, 118, 4878–4884. [Google Scholar] [CrossRef] [Green Version]
- Oliveira, M.J.; Quaresma, P.; de Almeida, M.P.; Araújo, A.; Pereira, E.; Fortunato, E.; Martins, R.; Franco, R.; Águas, H. Office paper decorated with silver nanostars—An alternative cost effective platform for trace analyte detection by SERS. Sci. Rep. 2017, 7, 2480. [Google Scholar] [CrossRef]
- Wu, W.; Liu, L.; Dai, Z.; Liu, J.; Yang, S.; Zhou, L.; Xiao, X.; Jiang, C.; Roy, V.A.L. Low-Cost, Disposable, Flexible and Highly Reproducible Screen Printed SERS Substrates for the Detection of Various Chemicals. Sci. Rep. 2015, 5, 10208. [Google Scholar] [CrossRef] [PubMed]
- Zuo, Z.; Zhu, K.; Gu, C.; Wen, Y.; Cui, G.; Qu, J. Transparent, flexible surface enhanced Raman scattering substrates based on Ag-coated structured PET (polyethylene terephthalate) for in-situ detection. Appl. Surf. Sci. 2016, 379, 66–72. [Google Scholar] [CrossRef]
- Brolo, A.G.; Arctander, E.; Gordon, R.; Leathem, B.; Kavanagh, K.L. Nanohole-Enhanced Raman Scattering. Nano Lett. 2004, 4, 2015–2018. [Google Scholar] [CrossRef] [Green Version]
- Hulteen, J.C.; Van Duyne, R.P. Nanosphere lithography: A materials general fabrication process for periodic particle array surfaces. J. Vac. Sci. Technol. A 1995, 13, 1553–1558. [Google Scholar] [CrossRef]
- Li, X.; Hu, H.; Li, D.; Shen, Z.; Xiong, Q.; Li, S.; Fan, H.J. Ordered Array of Gold Semishells on TiO2 Spheres: An Ultrasensitive and Recyclable SERS Substrate. ACS Appl. Mater. Interfaces 2012, 4, 2180–2185. [Google Scholar] [CrossRef]
- Fan, M.; Brolo, A.G. Silver nanoparticles self assembly as SERS substrates with near single molecule detection limit. Phys. Chem. Chem. Phys. 2009, 11, 7381–7389. [Google Scholar] [CrossRef]
- Khlebtsov, B.N.; Khanadeev, V.A.; Tsvetkov, M.Y.; Bagratashvili, V.N.; Khlebtsov, N.G. Surface-Enhanced Raman Scattering Substrates Based on Self-Assembled PEGylated Gold and Gold–Silver Core–Shell Nanorods. J. Phys. Chem. C 2013, 117, 23162–23171. [Google Scholar] [CrossRef]
- Kong, X.; Xi, Y.; LeDuff, P.; Li, E.; Liu, Y.; Cheng, L.-J.; Rorrer, G.L.; Tan, H.; Wang, A.X. Optofluidic sensing from inkjet-printed droplets: The enormous enhancement by evaporation-induced spontaneous flow on photonic crystal biosilica. Nanoscale 2016, 8, 17285–17294. [Google Scholar] [CrossRef] [Green Version]
- Li, L.; Yang, S.; Duan, J.; Huang, L.; Xiao, G. Fabrication and SERS performance of silver nanoarrays by inkjet printing silver nanoparticles ink on the gratings of compact disc recordable. Spectrochim. Acta Part. A Mol. Biomol. Spectrosc. 2020, 225, 117598. [Google Scholar] [CrossRef]
- Yang, Q.; Deng, M.; Li, H.; Li, M.; Zhang, C.; Shen, W.; Li, Y.; Guo, D.; Song, Y. Highly reproducible SERS arrays directly written by inkjet printing. Nanoscale 2015, 7, 421–425. [Google Scholar] [CrossRef] [PubMed]
- Yu, W.W.; White, I.M. Inkjet Printed Surface Enhanced Raman Spectroscopy Array on Cellulose Paper. Anal. Chem. 2010, 82, 9626–9630. [Google Scholar] [CrossRef] [Green Version]
- Ameer, F.S.; Pittman, C.U.; Zhang, D. Quantification of Resonance Raman Enhancement Factors for Rhodamine 6G (R6G) in Water and on Gold and Silver Nanoparticles: Implications for Single-Molecule R6G SERS. J. Phys. Chem. C 2013, 117, 27096–27104. [Google Scholar] [CrossRef]
- Kneipp, K.; Wang, Y.; Kneipp, H.; Perelman, L.T.; Itzkan, I.; Dasari, R.R.; Feld, M.S. Single Molecule Detection Using Surface-Enhanced Raman Scattering (SERS). Phys. Rev. Lett. 1997, 78, 1667–1670. [Google Scholar] [CrossRef] [Green Version]
- Nie, S.; Emory, S.R. Probing Single Molecules and Single Nanoparticles by Surface-Enhanced Raman Scattering. Science 1997, 275, 1102–1106. [Google Scholar] [CrossRef] [PubMed]
- Santos, V.O., Jr.; Leite, I.R.; Brolo, A.G.; Rubim, J.C. The electrochemical reduction of CO2 on a copper electrode in 1-n-butyl-3-methyl imidazolium tetrafluoroborate (BMI.BF4) monitored by surface-enhanced Raman scattering (SERS). J. Raman Spectrosc. 2016, 47, 674–680. [Google Scholar] [CrossRef]
- González-Solís, J.; Luévano-Colmenero, G.; Vargas-Mancilla, J. Surface enhanced Raman spectroscopy in breast cancer cells. Laser Ther. 2013, 22, 37–42. [Google Scholar] [CrossRef] [PubMed] [Green Version]
- Jiang, L.; Hassan, M.M.; Ali, S.; Li, H.; Sheng, R.; Chen, Q. Evolving trends in SERS-based techniques for food quality and safety: A review. Trends Food Sci. Technol. 2021, 112, 225–240. [Google Scholar] [CrossRef]
- Perumal, J.; Wang, Y.; Attia, A.B.E.; Dinish, U.S.; Olivo, M. Towards a point-of-care SERS sensor for biomedical and agri-food analysis applications: A review of recent advancements. Nanoscale 2021, 13, 553–580. [Google Scholar] [CrossRef]
- Saviñon-Flores, F.; Méndez, E.; López-Castaños, M.; Carabarin-Lima, A.; López-Castaños, K.A.; González-Fuentes, M.A.; Méndez-Albores, A. A Review on SERS-Based Detection of Human Virus Infections: Influenza and Coronavirus. Biosensors 2021, 11, 66. [Google Scholar] [CrossRef] [PubMed]
- Wang, P.; Sun, Y.; Li, X.; Wang, L.; Xu, Y.; He, L.; Li, G. Recent advances in dual recognition based surface enhanced Raman scattering for pathogenic bacteria detection: A review. Anal. Chim. Acta 2021, 1157, 338279. [Google Scholar] [CrossRef] [PubMed]
- Zhang, C.; You, T.; Yang, N.; Gao, Y.; Jiang, L.; Yin, P. Hydrophobic paper-based SERS platform for direct-droplet quantitative determination of melamine. Food Chem. 2019, 287, 363–368. [Google Scholar] [CrossRef] [PubMed]
- Zhang, D.; Pu, H.; Huang, L.; Sun, D.-W. Advances in flexible surface-enhanced Raman scattering (SERS) substrates for nondestructive food detection: Fundamentals and recent applications. Trends Food Sci. Technol. 2021, 109, 690–701. [Google Scholar] [CrossRef]
- Zong, C.; Xu, M.; Xu, L.-J.; Wei, T.; Ma, X.; Zheng, X.-S.; Hu, R.; Ren, B. Surface-Enhanced Raman Spectroscopy for Bioanalysis: Reliability and Challenges. Chem. Rev. 2018, 118, 4946–4980. [Google Scholar] [CrossRef]
- Kukushkin, V.I.; Van’kov, A.B.; Kukushkin, I.V. Long-range manifestation of surface-enhanced Raman scattering. JETP Lett. 2013, 98, 64–69. [Google Scholar] [CrossRef] [Green Version]
- Langer, J.; de Aberasturi, D.J.; Aizpurua, J.; Alvarez-Puebla, R.A.; Auguié, B.; Baumberg, J.J.; Bazan, G.C.; Bell, S.E.J.; Boisen, A.; Brolo, A.G.; et al. Present and Future of Surface-Enhanced Raman Scattering. ACS Nano 2020, 14, 28–117. [Google Scholar] [CrossRef] [PubMed] [Green Version]
- Pilot, R.; Signorini, R.; Durante, C.; Orian, L.; Bhamidipati, M.; Fabris, L. A Review on Surface-Enhanced Raman Scattering. Biosensors 2019, 9, 57. [Google Scholar] [CrossRef] [Green Version]
- Ding, S.-Y.; Yi, J.; Li, J.-F.; Ren, B.; Wu, D.-Y.; Panneerselvam, R.; Tian, Z.-Q. Nanostructure-based plasmon-enhanced Raman spectroscopy for surface analysis of materials. Nat. Rev. Mater. 2016, 1, 16021. [Google Scholar] [CrossRef]
- Chenal, C.; Birke, R.L.; Lombardi, J.R. Determination of the Degree of Charge-Transfer Contributions to Surface-Enhanced Raman Spectroscopy. ChemPhysChem 2008, 9, 1617–1623. [Google Scholar] [CrossRef]
- Jensen, L.; Zhao, L.L.; Autschbach, J.; Schatz, G.C. Theory and method for calculating resonance Raman scattering from resonance polarizability derivatives. J. Chem. Phys. 2005, 123, 174110. [Google Scholar] [CrossRef] [PubMed]
- Kneipp, K. Chemical Contribution to SERS Enhancement: An Experimental Study on a Series of Polymethine Dyes on Silver Nanoaggregates. J. Phys. Chem. C 2016, 120, 21076–21081. [Google Scholar] [CrossRef]
- Otto, A. The ‘chemical’ (electronic) contribution to surface-enhanced Raman scattering. J. Raman Spectrosc. 2005, 36, 497–509. [Google Scholar] [CrossRef]
- Ahn, B.Y.; Duoss, E.B.; Motala, M.J.; Guo, X.; Park, S.-I.; Xiong, Y.; Yoon, J.; Nuzzo, R.G.; Rogers, J.A.; Lewis, J.A. Omnidirectional Printing of Flexible, Stretchable, and Spanning Silver Microelectrodes. Science 2009, 323, 1590–1593. [Google Scholar] [CrossRef] [PubMed] [Green Version]
- Russo, A.; Ahn, B.Y.; Adams, J.J.; Duoss, E.B.; Bernhard, J.T.; Lewis, J.A. Pen-on-Paper Flexible Electronics. Adv. Mater. 2011, 23, 3426–3430. [Google Scholar] [CrossRef]
- Yu, W.W.; White, I.M. A simple filter-based approach to surface enhanced Raman spectroscopy for trace chemical detection. Analyst 2012, 137, 1168–1173. [Google Scholar] [CrossRef] [Green Version]
- Liu, Y.; Xu, S.; Li, H.; Jian, X.; Xu, W. Localized and propagating surface plasmon co-enhanced Raman spectroscopy based on evanescent field excitation. Chem. Commun. 2011, 47, 3784–3786. [Google Scholar] [CrossRef] [PubMed]
- Mohiddon, M.A.; Sangani, L.D.V.; Krishna, M.G. Scanning near field optical microscopy of gold nano-disc arrays fabricated by electron beam lithography and their application as surface enhanced Raman scattering substrates. Chem. Phys. Lett. 2013, 588, 160–166. [Google Scholar] [CrossRef]
- Wei, H.; McCarthy, A.; Song, J.; Zhou, W.; Vikesland, P.J. Quantitative SERS by hot spot normalization—Surface enhanced Rayleigh band intensity as an alternative evaluation parameter for SERS substrate performance. Faraday Discuss. 2017, 205, 491–504. [Google Scholar] [CrossRef]
- Viets, C.; Hill, W. Laser Power Effects in SERS Spectroscopy at Thin Metal Films. J. Phys. Chem. B 2001, 105, 6330–6336. [Google Scholar] [CrossRef]
- Dang, C.M.; Huynh, K.K.; Dang, D.M.T. Synthesis of Silver Nanoparticles Using Poly (acrylic acid) as a Capping Agent for Conductive Ink in Inkjet Printing Application. Biol. Chem. Res. 2019, 6, 111–119. [Google Scholar]
- Bonifacio, A.; van der Sneppen, L.; Gooijer, C.; van der Zwan, G. Citrate-Reduced Silver Hydrosol Modified with ω-Mercaptoalkanoic Acids Self-Assembled Monolayers as a Substrate for Surface-Enhanced Resonance Raman Scattering. A Study with Cytochrome c. Langmuir 2004, 20, 5858–5864. [Google Scholar] [CrossRef]
- Huo, C.; Han, W.; Tang, W.; Duan, X. Stable SERS substrate based on highly reflective metal liquid-like films wrapped hydrogels for direct determination of small molecules in a high protein matrix. Talanta 2021, 234, 122678. [Google Scholar] [CrossRef]
- Tycova, A.; Kleparnik, K.; Foret, F. Bi-Ligand Modification of Nanoparticles: An Effective Tool for Surface-Enhanced Raman Spectrometry in Salinated Environments. Nanomaterials 2019, 9, 1259. [Google Scholar] [CrossRef] [Green Version]
- Kennedy, B.J.; Spaeth, S.; Dickey, M.; Carron, K.T. Determination of the Distance Dependence and Experimental Effects for Modified SERS Substrates Based on Self-Assembled Monolayers Formed Using Alkanethiols. J. Phys. Chem. B 1999, 103, 3640–3646. [Google Scholar] [CrossRef]
- Levin, C.S.; Janesko, B.G.; Bardhan, R.; Scuseria, G.E.; Hartgerink, J.D.; Halas, N.J. Chain-Length-Dependent Vibrational Resonances in Alkanethiol Self-Assembled Monolayers Observed on Plasmonic Nanoparticle Substrates. Nano Lett. 2006, 6, 2617–2621. [Google Scholar] [CrossRef]
- Agnihotri, S.; Mukherji, S.; Mukherji, S. Size-controlled silver nanoparticles synthesized over the range 5–100 nm using the same protocol and their antibacterial efficacy. RSC Adv. 2014, 4, 3974–3983. [Google Scholar] [CrossRef] [Green Version]
- Cai, Y.; Piao, X.; Gao, W.; Zhang, Z.; Nie, E.; Sun, Z. Large-scale and facile synthesis of silver nanoparticles via a microwave method for a conductive pen. RSC Adv. 2017, 7, 34041–34048. [Google Scholar] [CrossRef] [Green Version]
- Mukherji, S.; Bharti, S.; Shukla, G.; Mukherji, S. Synthesis and characterization of size- and shape-controlled silver nanoparticles. Phys. Sci. Rev. 2019, 4, 20170082. [Google Scholar] [CrossRef]
- Paramelle, D.; Sadovoy, A.; Gorelik, S.; Free, P.; Hobley, J.; Fernig, D.G. A rapid method to estimate the concentration of citrate capped silver nanoparticles from UV-visible light spectra. Analyst 2014, 139, 4855–4861. [Google Scholar] [CrossRef] [PubMed]
- Raza, M.A.; Kanwal, Z.; Rauf, A.; Sabri, A.N.; Riaz, S.; Naseem, S. Size- and Shape-Dependent Antibacterial Studies of Silver Nanoparticles Synthesized by Wet Chemical Routes. Nanomaterials 2016, 6, 74. [Google Scholar] [CrossRef] [PubMed] [Green Version]
- Tanvi, T.; Mahajan, A.; Bedi, R.K.; Kumar, S.; Saxena, V.; Singh, A.; Aswal, D.K. Broadband enhancement in absorption cross-section of N719 dye using different anisotropic shaped single crystalline silver nanoparticles. RSC Adv. 2016, 6, 48064–48071. [Google Scholar] [CrossRef]
- Mulvaney, P. Surface Plasmon Spectroscopy of Nanosized Metal Particles. Langmuir 1996, 12, 788–800. [Google Scholar] [CrossRef]
- Cheng, L.; Zhu, G.; Liu, G.; Zhu, L. FDTD simulation of the optical properties for gold nanoparticles. Mater. Res. Express 2020, 7, 125009. [Google Scholar] [CrossRef]
- Huang, H.; Sivayoganathan, M.; Duley, W.W.; Zhou, Y. Efficient localized heating of silver nanoparticles by low-fluence femtosecond laser pulses. Appl. Surf. Sci. 2015, 331, 392–398. [Google Scholar] [CrossRef]
- Huang, Y.; Zhou, Q.; Hou, M.; Ma, L.; Zhang, Z. Nanogap effects on near- and far-field plasmonic behaviors of metallic nanoparticle dimers. Phys. Chem. Chem. Phys. 2015, 17, 29293–29298. [Google Scholar] [CrossRef]
- Le Ru, E.C.; Etchegoin, P.G. Principles of Surface-Enhanced Raman Spectroscopy: And Related Plasmonic Effects; Elsevier: Amsterdam, The Netherlands; Boston, MA, USA, 2009. [Google Scholar]
- McMahon, J.M.; Gray, S.K.; Schatz, G.C. Fundamental behavior of electric field enhancements in the gaps between closely spaced nanostructures. Phys. Rev. B 2011, 83, 115428. [Google Scholar] [CrossRef] [Green Version]
- McMahon, J.M.; Li, S.; Ausman, L.K.; Schatz, G.C. Modeling the Effect of Small Gaps in Surface-Enhanced Raman Spectroscopy. J. Phys. Chem. C 2012, 116, 1627–1637. [Google Scholar] [CrossRef]
- Yi, Z.; Yi, Y.; Luo, J.; Ye, X.; Wu, P.; Ji, X.; Jiang, X.; Yi, Y.; Tang, Y. Experimental and simulative study on surface enhanced Raman scattering of rhodamine 6G adsorbed on big bulk-nanocrystalline metal substrates. RSC Adv. 2015, 5, 1718–1729. [Google Scholar] [CrossRef]
- Fenta, A.; Mekonnen, A. Electromagnetic Simulation on Silver Nanoparticle Based Biosensors. Glob. Sci. J. 2020, 8, 228–243. [Google Scholar]
- Gui, K.; Zheng, J.; Wang, K.; Li, D.; Zhuang, S. FDTD Modelling of Silver Nanoparticles Embedded in Phase Separation Interface of H-PDLC. J. Nanomater. 2015, 2015, 298913. [Google Scholar] [CrossRef] [Green Version]
- Betz, J.F.; Yu, W.W.; Cheng, Y.; White, I.M.; Rubloff, G.W. Simple SERS substrates: Powerful, portable, and full of potential. Phys. Chem. Chem. Phys. 2014, 16, 2224–2239. [Google Scholar] [CrossRef] [PubMed]
- Le Ru, E.C.; Blackie, E.; Meyer, M.; Etchegoin, P.G. Surface Enhanced Raman Scattering Enhancement Factors: A Comprehensive Study. J. Phys. Chem. C 2007, 111, 13794–13803. [Google Scholar] [CrossRef]
- Fu, E.; Kauffman, P.; Lutz, B.; Yager, P. Chemical signal amplification in two-dimensional paper networks. Sens. Actuators B Chem. 2010, 149, 325–328. [Google Scholar] [CrossRef] [Green Version]
- Osborn, J.L.; Lutz, B.; Fu, E.; Kauffman, P.; Stevens, D.Y.; Yager, P. Microfluidics without pumps: Reinventing the T-sensor and H-filter in paper networks. Lab A Chip 2010, 10, 2659–2665. [Google Scholar] [CrossRef] [Green Version]
- Wang, Z.; Feng, L.; Xiao, D.; Li, N.; Li, Y.; Cao, D.; Shi, Z.; Cui, Z.; Lu, N. A silver nanoislands on silica spheres platform: Enriching trace amounts of analytes for ultrasensitive and reproducible SERS detection. Nanoscale 2017, 9, 16749–16754. [Google Scholar] [CrossRef]
- Gautier, J.; Munnier, E.; Douziech-Eyrolles, L.; Paillard, A.; Dubois, P.; Chourpa, I. SERS spectroscopic approach to study doxorubicin complexes with Fe2+ ions and drug release from SPION-based nanocarriers. Analyst 2013, 138, 7354–7361. [Google Scholar] [CrossRef]
- Eliasson, C.; Lorén, A.; Murty, K.V.G.K.; Josefson, M.; Käll, M.; Abrahamsson, J.; Abrahamsson, K. Multivariate evaluation of doxorubicin surface-enhanced Raman spectra. Spectrochim. Acta Part A Mol. Biomol. Spectrosc. 2001, 57, 1907–1915. [Google Scholar] [CrossRef]
- Olszówka, M.; Russo, R.; Mancini, G.; Cappelli, C. A computational approach to the resonance Raman spectrum of doxorubicin in aqueous solution. Theor. Chem. Acc. 2016, 135, 27. [Google Scholar] [CrossRef]
- Dong, Y.; Narla, R.K.; Sudbeck, E.; Uckun, F.M. Synthesis, X-ray structure, and anti-leukemic activity of oxovanadium(IV) complexes. J. Inorg. Biochem. 2000, 78, 321–330. [Google Scholar] [CrossRef]
Figure 1.
Printing pen system.

Figure 2.
(a) XRD pattern; (b) UV-Vis spectrum; (c) SEM image of the synthesized Ag NPs; (d) particle size distribution histogram determined from the SEM image.
Figure 2.
(a) XRD pattern; (b) UV-Vis spectrum; (c) SEM image of the synthesized Ag NPs; (d) particle size distribution histogram determined from the SEM image.

Figure 3.
(a) FDTD simulated electric field at the excitation wavelength of 532.6 nm for single Ag NP with a radius of 45 nm and (b–f) double Ag NPs with different gap distances of 2, 4, 6, 8, and 10 nm, respectively.
Figure 3.
(a) FDTD simulated electric field at the excitation wavelength of 532.6 nm for single Ag NP with a radius of 45 nm and (b–f) double Ag NPs with different gap distances of 2, 4, 6, 8, and 10 nm, respectively.

Figure 4.
SERS Performance of SERS Substrates prepared using different support matrices and fabrication methods. (Raman signals intensities of R6G at 610 cm−1, 1360 cm−1, and 1647 cm−1 versus different support matrix and fabrication methods. HD presents hand drawn).
Figure 4.
SERS Performance of SERS Substrates prepared using different support matrices and fabrication methods. (Raman signals intensities of R6G at 610 cm−1, 1360 cm−1, and 1647 cm−1 versus different support matrix and fabrication methods. HD presents hand drawn).

Figure 5.
SEM-EDS for cross section of (a) paper-print-based SERS substrate; (b) PET-print-based SERS substrate; (c) PET-HD-based SERS substrate.
Figure 5.
SEM-EDS for cross section of (a) paper-print-based SERS substrate; (b) PET-print-based SERS substrate; (c) PET-HD-based SERS substrate.

Figure 6.
Raman map for the characteristic Raman band at 610 cm−1 of R6G absorbed on different SERS substrates.
Figure 6.
Raman map for the characteristic Raman band at 610 cm−1 of R6G absorbed on different SERS substrates.

Figure 7.
(a) Concentration-dependent SERS spectra for R6G with different concentrations (10 pM–50 μM); (b) the corresponding linear relationship of SERS intensities at 610 cm−1 versus corresponding R6G concentrations.
Figure 7.
(a) Concentration-dependent SERS spectra for R6G with different concentrations (10 pM–50 μM); (b) the corresponding linear relationship of SERS intensities at 610 cm−1 versus corresponding R6G concentrations.

Figure 8.
(a) SERS spectra of R6G (1 μM) absorbed on PET-print-based SERS substrate with different storage times; (b) stability of PET-print-based SERS substrate. (Raman signals intensities of R6G at 610 cm−1, 1360 cm−1, and 1647 cm−1 versus stored time; (c) SERS spectra of R6G (1 μM) absorbed on PET-print-based SERS substrate fabricated using different batches of Ag inks; (d) reproducibility of PET-print-based SERS substrate. (Raman signals intensities of R6G at 610 cm−1, 1360 cm−1, and 1647 cm−1 versus batch number).

Figure 9.
(a) SERS spectra of DOX (10 μM); (b) SERS spectra of metvan (10 μM).

Publisher’s Note: MDPI stays neutral with regard to jurisdictional claims in published maps and institutional affiliations. |
© 2021 by the authors. Licensee MDPI, Basel, Switzerland. This article is an open access article distributed under the terms and conditions of the Creative Commons Attribution (CC BY) license (https://creativecommons.org/licenses/by/4.0/).
Share and Cite
MDPI and ACS Style
Liu, M.; Bhandari, A.; Haqqani Mohammed, M.A.; Radu, D.R.; Lai, C.-Y. Versatile Silver Nanoparticles-Based SERS Substrate with High Sensitivity and Stability. Appl. Nano 2021, 2, 242-256. https://doi.org/10.3390/applnano2030017
AMA Style
Liu M, Bhandari A, Haqqani Mohammed MA, Radu DR, Lai C-Y. Versatile Silver Nanoparticles-Based SERS Substrate with High Sensitivity and Stability. Applied Nano. 2021; 2(3):242-256. https://doi.org/10.3390/applnano2030017
Chicago/Turabian StyleLiu, Mimi, Anjuli Bhandari, Mujtaba Ali Haqqani Mohammed, Daniela R. Radu, and Cheng-Yu Lai. 2021. "Versatile Silver Nanoparticles-Based SERS Substrate with High Sensitivity and Stability" Applied Nano 2, no. 3: 242-256. https://doi.org/10.3390/applnano2030017