Psychophysiological Alteration After Virtual Reality Experiences Using Smartphone-Assisted Head Mount Displays: An EEG-Based Source Localization Study


Abstract
:1. Introduction
2. Methods
2.1. Participants
2.2. Simulator Sickness Questionnaire (SSQ)
2.3. VR Equipment and VR Video
2.4. EEG Data Acquisition and Analysis
2.5. Source Activity Analysis
2.6. Statistical Analysis
3. Results
4. Discussion
Author Contributions
Funding
Conflicts of Interest
References
- Jerald, J. The VR book: Human-centered design for virtual reality; Association for Computing Machinery and Morgan & Claypool: New York, NY, USA, 2015. [Google Scholar]
- Kang, C.-H. Flow of next generation broadcast video, Present and Future of VR contents. Korea Contents Association Review 2016, 14, 14–18. [Google Scholar] [CrossRef]
- Roettl, J.; Terlutter, R. The same video game in 2D, 3D or virtual reality—How does technology impact game evaluation and brand placements? PLoS ONE 2018, 13, e0200724. [Google Scholar] [CrossRef] [PubMed]
- Kolasinski, E.M. Simulator Sickness in Virtual Environments; Army Research Institute for the Behavioral and Social Sciences: Alexandria, VA, USA, 1995. [Google Scholar]
- Howard, I.P.; Rogers, B.J. Binocular vision and stereopsis; Oxford University Press: Oxford, UK, 1995. [Google Scholar]
- Lambooij, M.; Fortuin, M.; Heynderickx, I.; IJsselsteijn, W. Visual Discomfort and Visual Fatigue of Stereoscopic Displays: A Review. J. Imaging Sci. Technol. 2009, 53, 30201–30214. [Google Scholar] [CrossRef]
- Hoffman, D.M.; Girshick, A.R.; Akeley, K.; Banks, M.S. Vergence–accommodation conflicts hinder visual performance and cause visual fatigue. J. Vision 2008, 8, 33. [Google Scholar] [CrossRef] [PubMed]
- Cobb, S.V.; Nichols, S.; Ramsey, A.; Wilson, J.R. Virtual reality-induced symptoms and effects (VRISE). Presence 1999, 8, 169–186. [Google Scholar] [CrossRef]
- Wawrzyk, M.; Wesołowska, K.; Plechawska-Wójcik, M.; Szymczyk, T. Analysis of Brain Activity Changes Evoked by Virtual Reality Stimuli Based on EEG Spectral Analysis. A Preliminary Study. In Proceedings of the 39th International Conference on Information Systems Architecture and Technology, Nysa, Poland, 16–18 September 2018; pp. 222–231. [Google Scholar]
- Subasi, A. Automatic recognition of alertness level from EEG by using neural network and wavelet coefficients. Expert Syst. Appl. 2005, 28, 701–711. [Google Scholar] [CrossRef]
- Belyavin, A.; Wright, N.A. Changes in electrical activity of the brain with vigilance. Electroen. Clin. Neuro. 1987, 66, 137–144. [Google Scholar] [CrossRef]
- Slobounov, S.M.; Ray, W.; Johnson, B.; Slobounov, E.; Newell, K.M. Modulation of cortical activity in 2D versus 3D virtual reality environments: An EEG study. Int. J. Psychophysiol. 2015, 95, 254–260. [Google Scholar] [CrossRef] [PubMed]
- Li, H.-C.O.; Seo, J.; Kham, K.; Lee, S. Measurement of 3D Visual Fatigue Using Event-Related Potential (ERP): 3D Oddball Paradigm. In Proceedings of the 3DTV Conference: The True Vision—Capture, Transmission and Display of 3D Video, Istanbul, Turkey, 28–30 May 2008; pp. 213–216. [Google Scholar]
- Kim, Y.-J.; Lee, E.C. EEG Based Comparative Measurement of Visual Fatigue Caused by 2D and 3D Displays. In Proceedings of the International Conference on Human-Computer Interaction, Orlando, FL, USA, 9–14 July 2011; pp. 289–292. [Google Scholar]
- Clemente, M.; Rodríguez, A.; Rey, B.; Alcañiz, M. Assessment of the influence of navigation control and screen size on the sense of presence in virtual reality using EEG. Expert Syst. Appl. 2014, 41, 1584–1592. [Google Scholar] [CrossRef]
- Baumgartner, T.; Valko, L.; Esslen, M.; Jäncke, L. Neural Correlate of Spatial Presence in an Arousing and Noninteractive Virtual Reality: An EEG and Psychophysiology Study. Cyberpsychol. Behav. 2006, 9, 30–45. [Google Scholar] [CrossRef] [Green Version]
- Indovina, I.; Maffei, V.; Pauwels, K.; Macaluso, E.; Orban, G.A.; Lacquaniti, F. Simulated self-motion in a visual gravity field: sensitivity to vertical and horizontal heading in the human brain. Neuroimage 2013, 71, 114–124. [Google Scholar] [CrossRef]
- Aguirre, G.K.; Detre, J.A.; Alsop, D.C.; D’Esposito, M. The parahippocampus subserves topographical learning in man. Cereb. Cortex 1996, 6, 823–829. [Google Scholar] [CrossRef] [PubMed]
- Hartley, T.; Maguire, E.A.; Spiers, H.J.; Burgess, N. The Well-Worn Route and the Path Less Traveled: Distinct Neural Bases of Route Following and Wayfinding in Humans. Neuron 2003, 37, 877–888. [Google Scholar] [CrossRef] [Green Version]
- Hassabis, D.; Chu, C.; Rees, G.; Weiskopf, N.; Molyneux, P.D.; Maguire, E.A. Decoding Neuronal Ensembles in the Human Hippocampus. Curr. Biol. 2009, 19, 546–554. [Google Scholar] [CrossRef] [PubMed] [Green Version]
- Iaria, G.; Fox, C.J.; Chen, J.-K.; Petrides, M.; Barton, J.J.S. Detection of unexpected events during spatial navigation in humans: bottom-up attentional system and neural mechanisms. Eur. J. Neurosci. 2008, 27, 1017–1025. [Google Scholar] [CrossRef] [PubMed]
- Spiers, H.J.; Maguire, E.A. Thoughts, behaviour, and brain dynamics during navigation in the real world. Neuroimage 2006, 31, 1826–1840. [Google Scholar] [CrossRef] [PubMed]
- Wolbers, T.; Büchel, C. Dissociable Retrosplenial and Hippocampal Contributions to Successful Formation of Survey Representations. J. Neurosci. 2005, 25, 3333–3340. [Google Scholar] [CrossRef] [PubMed] [Green Version]
- Kennedy, R.S.; Lane, N.E.; Berbaum, K.S.; Lilienthal, M.G. Simulator Sickness Questionnaire: An Enhanced Method for Quantifying Simulator Sickness. Int. J. Aviat. Psychol. 1993, 3, 203–220. [Google Scholar] [CrossRef]
- Amazing People Compilation 360 VR 360. 2016. Video, 0:00–8:54, posted by Videos in 360 Virtual Reality videos, October 15. Available online: https://youtu.be/nJui9sOlb98 (accessed on 19 June 2019).
- Semlitsch, H.V.; Anderer, P.; Schuster, P.; Presslich, O. A Solution for Reliable and Valid Reduction of Ocular Artifacts Applied to the P300 ERP. Psychophysiology 1986, 23, 695–703. [Google Scholar] [CrossRef] [PubMed]
- Nolte, G.; Bai, O.; Wheaton, L.; Mari, Z.; Vorbach, S.; Hallett, M. Identifying true brain interaction from EEG data using the imaginary part of coherency. Clin. Neurophysiol. 2004, 115, 2292–2307. [Google Scholar] [CrossRef]
- van den Broek, S.P.; Reinders, F.; Donderwinkel, M.; Peters, M. Volume conduction effects in EEG and MEG. Electroen. Clin. Neuro. 1998, 106, 522–534. [Google Scholar] [CrossRef]
- Lange, D.H.; Inbar, G.F. A robust parametric estimator for single-trial movement related brain potentials. IEEE T. Biomed. Eng. 1996, 43, 341–347. [Google Scholar] [CrossRef]
- Lemm, S.; Curio, G.; Hlushchuk, Y.; Muller, K.-R. Enhancing the signal-to-noise ratio of ICA-based extracted ERPs. IEEE T. Biomed. Eng. 2006, 53, 601–607. [Google Scholar] [CrossRef]
- Pascual-Marqui, R.D. Standardized low-resolution brain electromagnetic tomography (sLORETA): technical details. Methods Find. Exp. Clin. Pharmacol. 2002, 24, 5–12. [Google Scholar] [PubMed]
- Lantz, G.; Michel, C.; Pascual-Marqui, R.; Spinelli, L.; Seeck, M.; Seri, S.; Landis, T.; Rosen, I. Extracranial localization of intracranial interictal epileptiform activity using LORETA (low resolution electromagnetic tomography). Electroen. Clin. Neuro. 1997, 102, 414–422. [Google Scholar] [CrossRef]
- Fuchs, M.; Kastner, J.; Wagner, M.; Hawes, S.; Ebersole, J.S. A standardized boundary element method volume conductor model. Clin. Neurophysiol. 2002, 113, 702–712. [Google Scholar] [CrossRef] [Green Version]
- Brett, M.; Johnsrude, I.S.; Owen, A.M. The problem of functional localization in the human brain. Nat. Rev. Neurosci. 2002, 3, 243–249. [Google Scholar] [CrossRef]
- Kim, S.; Kim, J.S.; Jin, M.J.; Im, C.H.; Lee, S.H. Dysfunctional frontal lobe activity during inhibitory tasks in individuals with childhood trauma: An event-related potential study. Neuroimage Clin. 2018, 17, 935–942. [Google Scholar] [CrossRef]
- Reason, J.T. Motion sickness adaptation: a neural mismatch model. J. R. Soc. Med. 1978, 71, 819–829. [Google Scholar] [CrossRef]
- Riccio, G.E.; Stoffregen, T.A. An ecological theory of motion sickness and postural instability. Ecol. Psychol. 1991, 3, 195–240. [Google Scholar] [CrossRef]
- Lin, C.-T.; Ko, L.-W.; Lin, Y.-H.; Jung, T.-P.; Liang, S.-F.; Hsiao, L.-S. EEG Activities of Dynamic Stimulation in VR Driving Motion Simulator. In Proceedings of the International Conference on Engineering Psychology and Cognitive Ergonomics, Beijing, China, 22–27 July 2007; pp. 551–560. [Google Scholar]
- Chuang, S.-W.; Chuang, C.-H.; Yu, Y.-H.; King, J.-T.; Lin, C.-T. EEG Alpha and Gamma Modulators Mediate Motion Sickness-Related Spectral Responses. Int. J. Neural Syst. 2016, 25, 1650007. [Google Scholar] [CrossRef] [PubMed]
- Laufs, H.; Kleinschmidt, A.; Beyerle, A.; Eger, E.; Salek-Haddadi, A.; Preibisch, C.; Krakow, K. EEG-correlated fMRI of human alpha activity. Neuroimage 2003, 19, 1463–1476. [Google Scholar] [CrossRef]
- Laufs, H.; Krakow, K.; Sterzer, P.; Eger, E.; Beyerle, A.; Salek-Haddadi, A.; Kleinschmidt, A. Electroencephalographic signatures of attentional and cognitive default modes in spontaneous brain activity fluctuations at rest. Proc. Natl. Acad. Sci. 2003, 100, 11053–11058. [Google Scholar] [CrossRef] [PubMed] [Green Version]
- Gamma, A.; Lehmann, D.; Frei, E.; Iwata, K.; Pascual-Marqui, R.D.; Vollenweider, F.X. Comparison of simultaneously recorded [H215O]-PET and LORETA during cognitive and pharmacological activation. Hum. Brain Mapp. 2004, 22, 83–96. [Google Scholar] [CrossRef] [PubMed]
- Chen, Y.-C.; Duann, J.-R.; Chuang, S.-W.; Lin, C.-L.; Ko, L.-W.; Jung, T.-P.; Lin, C.-T. Spatial and temporal EEG dynamics of motion sickness. Neuroimage 2010, 49, 2862–2870. [Google Scholar] [CrossRef]
- Chelen, W.E.; Kabrisky, M.; Rogers, S.K. Spectral analysis of the electroencephalographic response to motion sickness. Aviat. Space Environ. Med. 1993, 64, 24–29. [Google Scholar] [PubMed]
- Perani, D.; Fazio, F.; Borghese, N.A.; Tettamanti, M.; Ferrari, S.; Decety, J.; Gilardi, M.C. Different Brain Correlates for Watching Real and Virtual Hand Actions. Neuroimage 2001, 14, 749–758. [Google Scholar] [CrossRef] [Green Version]
- Haldane, M.; Cunningham, G.; Androutsos, C.; Frangou, S. Structural brain correlates of response inhibition in Bipolar Disorder I. J. Psychopharmacol. 2008, 22, 138–143. [Google Scholar] [CrossRef]
- Vanni, S.; Tanskanen, T.; Seppä, M.; Uutela, K.; Hari, R. Coinciding early activation of the human primary visual cortex and anteromedial cuneus. Proc. Natl. Acad. Sci. 2001, 98, 2776–2780. [Google Scholar] [CrossRef] [Green Version]
- Clemente, M.; Rey, B.; Rodríguez-Pujadas, A.; Barros-Loscertales, A.; Baños, R.M.; Botella, C.; Alcañiz, M.; Ávila, C. An fMRI Study to Analyze Neural Correlates of Presence during Virtual Reality Experiences. Interact. Comput. 2013, 26, 269–284. [Google Scholar] [CrossRef] [Green Version]
- Mishkin, M.; Ungerleider, L.G. Contribution of striate inputs to the visuospatial functions of parieto-preoccipital cortex in monkeys. Behav. Brain Res. 1982, 6, 57–77. [Google Scholar] [CrossRef]
- Shulman, G.L.; Fiez, J.A.; Corbetta, M.; Buckner, R.L.; Miezin, F.M.; Raichle, M.E.; Petersen, S.E. Common Blood Flow Changes across Visual Tasks: II. Decreases in Cerebral Cortex. J. Cognitive Neurosci. 1997, 9, 648–663. [Google Scholar] [CrossRef] [PubMed] [Green Version]
- Raichle, M.E.; MacLeod, A.M.; Snyder, A.Z.; Powers, W.J.; Gusnard, D.A.; Shulman, G.L. A default mode of brain function. Proc. Natl. Acad. Sci. 2001, 98, 676–682. [Google Scholar] [CrossRef] [PubMed] [Green Version]
- Davey, C.G.; Pujol, J.; Harrison, B.J. Mapping the self in the brain’s default mode network. Neuroimage 2016, 132, 390–397. [Google Scholar] [CrossRef] [PubMed]
- Ehrsson, H.H.; Spence, C.; Passingham, R.E. That’s My Hand! Activity in Premotor Cortex Reflects Feeling of Ownership of a Limb. Science 2004, 305, 875–877. [Google Scholar] [CrossRef] [PubMed]
- Petkova, V.I.; Björnsdotter, M.; Gentile, G.; Jonsson, T.; Li, T.-Q.; Ehrsson, H.H. From Part- to Whole-Body Ownership in the Multisensory Brain. Curr. Biol. 2011, 21, 1118–1122. [Google Scholar] [CrossRef] [Green Version]
- Ehrsson, H. The concept of body ownership and its relation to multisensory integration. In The New Handbook of Multisensory Processes; Stein, B.E., Ed.; MIT Press: Cambridge, MA, USA, 2012; pp. 775–792. [Google Scholar]
- Blanke, O.; Slater, M.; Serino, A. Behavioral, Neural, and Computational Principles of Bodily Self-Consciousness. Neuron 2015, 88, 145–166. [Google Scholar] [CrossRef] [Green Version]
- Guterstam, A.; Björnsdotter, M.; Bergouignan, L.; Gentile, G.; Li, T.-Q.; Ehrsson, H.H. Decoding illusory self-location from activity in the human hippocampus. Front. Hum. Neurosci. 2015, 9, 412. [Google Scholar] [CrossRef]
- Guterstam, A.; Björnsdotter, M.; Gentile, G.; Ehrsson, H.H. Posterior Cingulate Cortex Integrates the Senses of Self-Location and Body Ownership. Curr. Biol. 2015, 25, 1416–1425. [Google Scholar] [CrossRef] [Green Version]
- Nakao, T.; Radua, J.; Rubia, K.; Mataix-Cols, D. Gray Matter Volume Abnormalities in ADHD: Voxel-Based Meta-Analysis Exploring the Effects of Age and Stimulant Medication. Am. J. Psychiatry 2011, 168, 1154–1163. [Google Scholar] [CrossRef]
- Haznedar, M.M.; Buchsbaum, M.S.; Hazlett, E.A.; Shihabuddin, L.; New, A.; Siever, L.J. Cingulate gyrus volume and metabolism in the schizophrenia spectrum. Schizophr. Res. 2004, 71, 249–262. [Google Scholar] [CrossRef] [PubMed]
- Berman, M.G.; Peltier, S.; Nee, D.E.; Kross, E.; Deldin, P.J.; Jonides, J. Depression, rumination and the default network. Soc. Cogn. Affect Neur. 2011, 6, 548–555. [Google Scholar] [CrossRef] [PubMed]
- Bærentsen, K.B.; Stødkilde-Jørgensen, H.; Sommerlund, B.; Hartmann, T.; Damsgaard-Madsen, J.; Fosnæs, M.; Green, A.C. An investigation of brain processes supporting meditation. Cogn. Process. 2010, 11, 57–84. [Google Scholar] [CrossRef] [PubMed]
- Fox, K.C.; Dixon, M.L.; Nijeboer, S.; Girn, M.; Floman, J.L.; Lifshitz, M.; Ellamil, M.; Sedlmeier, P.; Christoff, K. Functional neuroanatomy of meditation: A review and meta-analysis of 78 functional neuroimaging investigations. Neurosci. Biobehav. Rev. 2016, 65, 208–228. [Google Scholar] [CrossRef] [PubMed] [Green Version]


| SSQ Score | Before VR | After VR | t | p |
|---|---|---|---|---|
| Mean ± SD | ||||
| Nausea | 16.218 ± 21.133 | 47.064 ± 31.684 | −5.877 | <0.001 |
| Oculomotor | 29.562 ± 23.750 | 67.715 ± 36.103 | −7.771 | <0.001 |
| Disorientation | 25.056 ± 35.517 | 101.152 ± 66.801 | −8.576 | <0.001 |
| Total | 12.332 ± 13.854 | 41.044 ± 24.779 | −8.904 | <0.001 |
| Before VR | After VR | t | p | |
|---|---|---|---|---|
| Mean ± SD | ||||
| Delta | ||||
| Anterior | 17.455 ± 6.010 | 17.261 ± 8.124 | 0.150 | 0.882 |
| Middle | 7.202 ± 3.145 | 7.212 ± 2.789 | −0.017 | 0.986 |
| Posterior | 8.844 ± 3.202 | 9.061 ± 3.608 | −0.637 | 0.529 |
| Global | 10.314 ± 3.320 | 10.463 ± 3.934 | −0.251 | 0.804 |
| Theta | ||||
| Anterior | 6.027 ± 2.612 | 7.017 ± 4.444 | −2.544 | 0.017 |
| Middle | 3.550 ± 1.762 | 4.076 ± 2.884 | −2.237 | 0.033 |
| Posterior | 4.312 ± 2.547 | 5.467 ± 4.779 | −2.661 | 0.013 |
| Global | 4.477 ± 2.234 | 5.380 ± 3.967 | −2.649 | 0.013 |
| Alpha1 | ||||
| Anterior | 3.976 ± 3.957 | 5.764 ± 7.507 | −2.559 | 0.016 |
| Middle | 2.703 ± 2.542 | 3.526 ± 3.453 | −3.409 | 0.002 * |
| Posterior | 5.689 ± 5.595 | 9.025 ± 10.547 | −3.106 | 0.004 * |
| Global | 4.097 ± 3.960 | 6.055 ± 6.942 | −3.103 | 0.004 * |
| Alpha2 | ||||
| Anterior | 4.533 ± 4.672 | 5.627 ± 5.697 | −2.991 | 0.006 * |
| Middle | 2.991 ± 2.684 | 3.420 ± 2.860 | −2.381 | 0.024 |
| Posterior | 7.695 ± 8.202 | 9.943 ± 9.856 | −3.248 | 0.003 * |
| Global | 4.999 ± 5.003 | 6.233 ± 5.951 | −3.233 | 0.003 * |
| Beta1 | ||||
| Anterior | 3.094 ± 1.358 | 3.158 ± 1.174 | −0.400 | 0.692 |
| Middle | 2.819 ± 1.592 | 2.534 ± 1.089 | 1.489 | 0.147 |
| Posterior | 3.331 ± 1.751 | 3.676 ± 1.704 | −2.441 | 0.021 |
| Global | 2.942 ± 1.263 | 3.063 ± 1.216 | −1.191 | 0.243 |
| Beta2 | ||||
| Anterior | 4.944 ± 4.066 | 4.708 ± 2.811 | 0.546 | 0.589 |
| Middle | 3.394 ± 2.580 | 2.927 ± 1.721 | 1.558 | 0.130 |
| Posterior | 2.301 ± 1.480 | 2.562 ± 1.384 | −1.732 | 0.094 |
| Global | 3.220 ± 1.754 | 3.181 ± 1.389 | 0.240 | 0.812 |
| Gamma | ||||
| Anterior | 5.145 ± 4.356 | 4.824 ± 3.459 | 0.517 | 0.609 |
| Middle | 3.868 ± 3.569 | 3.214 ± 2.584 | 1.432 | 0.163 |
| Posterior | 1.414 ± 1.439 | 1.532 ± 1.308 | −0.572 | 0.572 |
| Global | 3.058 ± 1.895 | 2.950 ± 1.614 | 0.381 | 0.706 |
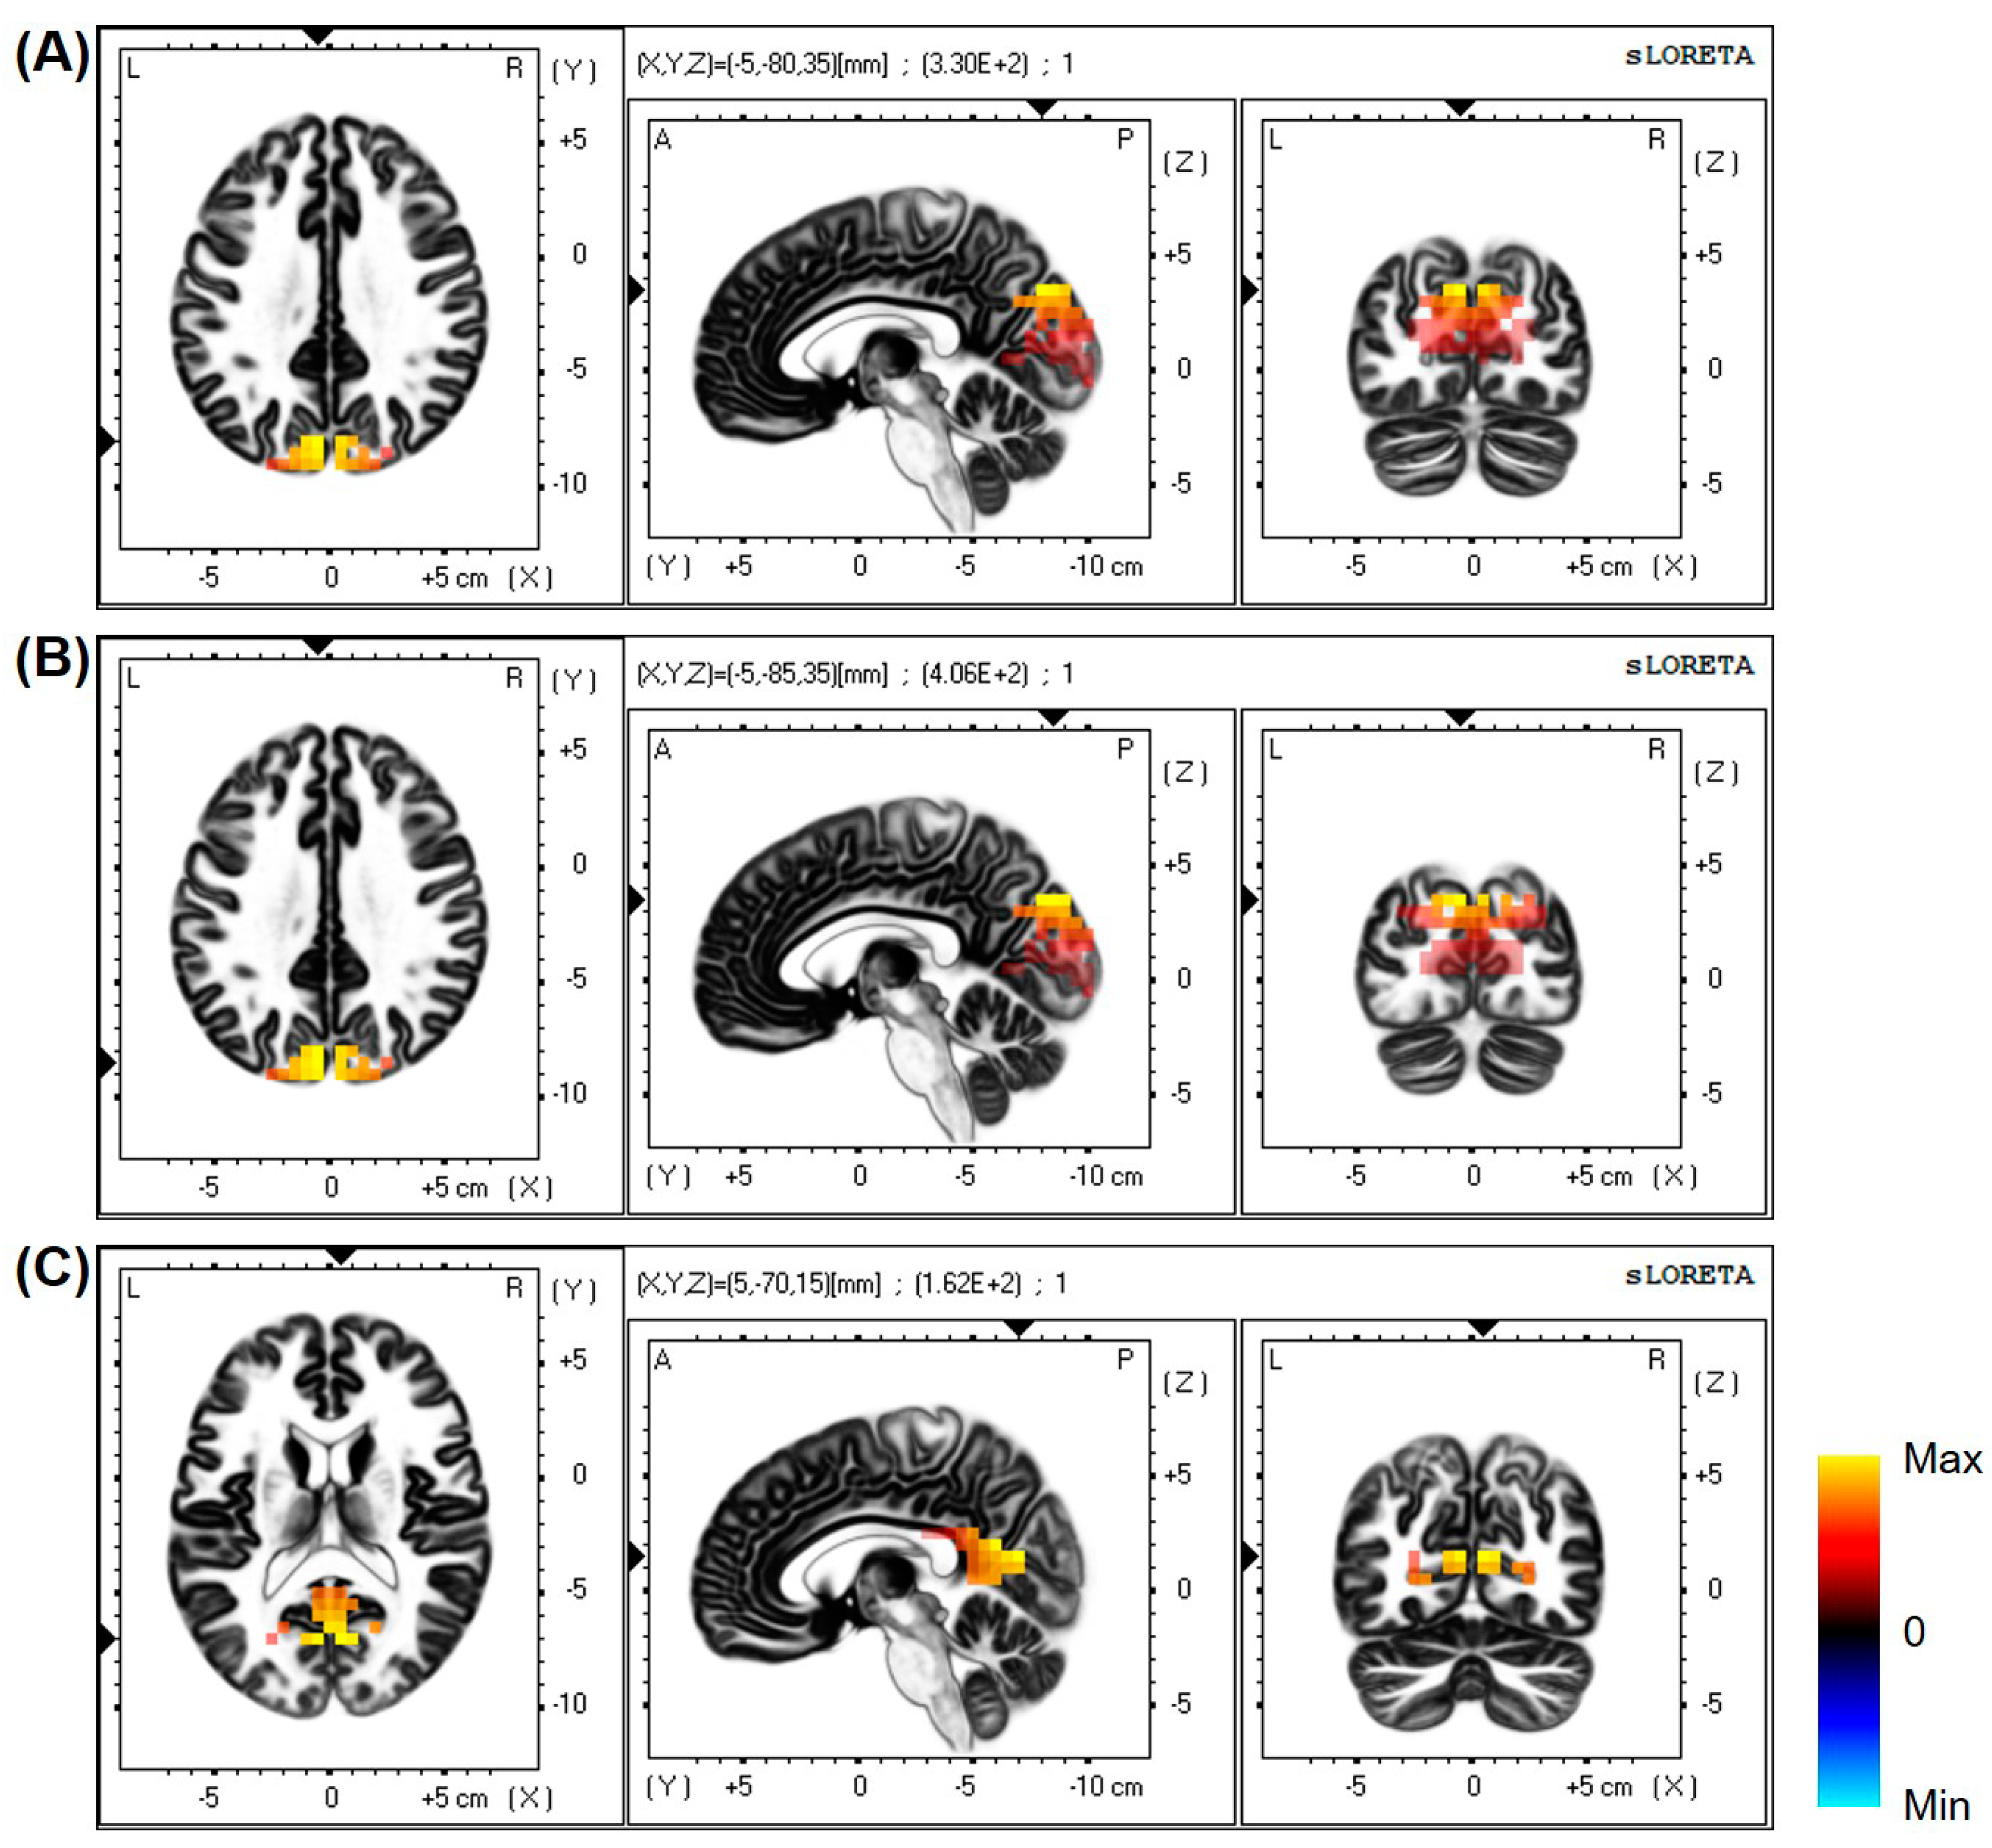
| Frequency Band and Brain Region | MNI Coordinate | Before VR | After VR | t | p |
|---|---|---|---|---|---|
| Mean ± SD | |||||
| Alpha1 and Cuneus | (−5, −80, 35) | 342.635 ± 236.021 | 515.076 ± 423.659 | −3.631 | <0.001 * |
| Alpha2 and Cuneus | (−5, −85, 35) | 590.988 ± 462.924 | 795.884 ± 683.322 | −3.657 | <0.001 * |
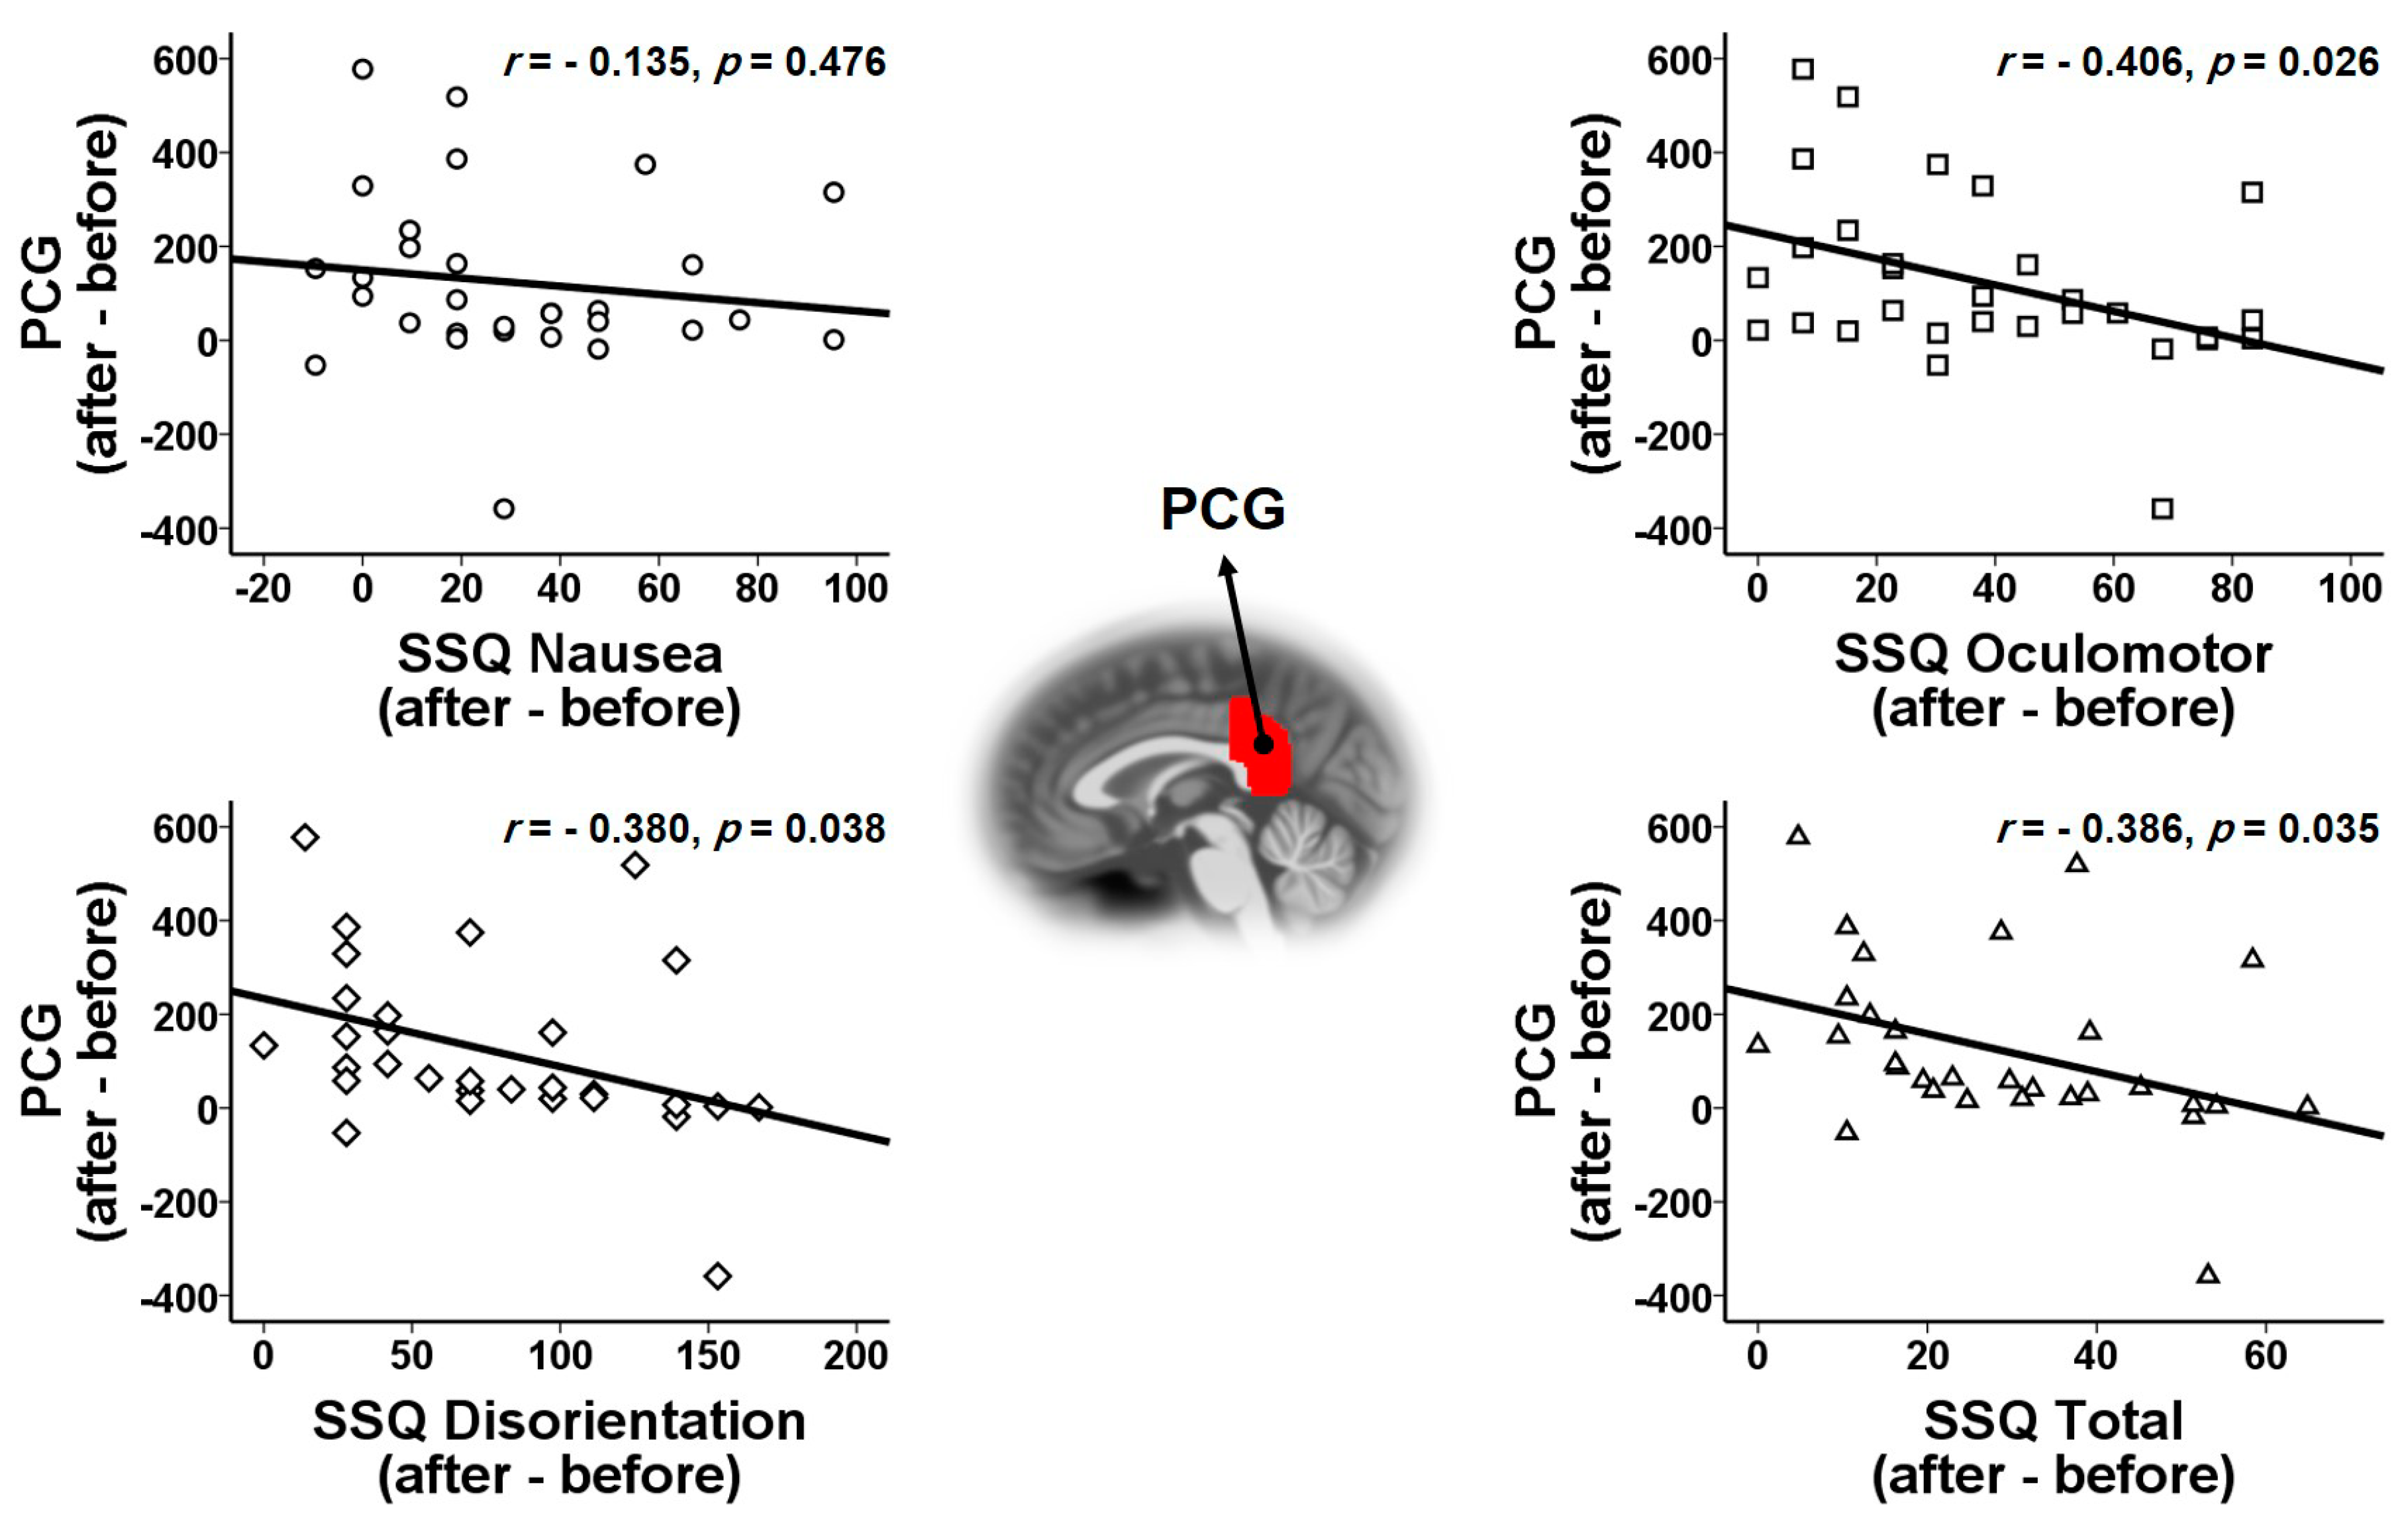
| Alpha2 and PCG | (5, −70, 15) | 370.731 ± 323.503 | 493.818 ± 442.367 | −3.633 | <0.001 * |
© 2019 by the authors. Licensee MDPI, Basel, Switzerland. This article is an open access article distributed under the terms and conditions of the Creative Commons Attribution (CC BY) license (http://creativecommons.org/licenses/by/4.0/).
Share and Cite
Kim, J.-Y.; Son, J.-B.; Leem, H.-S.; Lee, S.-H. Psychophysiological Alteration After Virtual Reality Experiences Using Smartphone-Assisted Head Mount Displays: An EEG-Based Source Localization Study. Appl. Sci. 2019, 9, 2501. https://doi.org/10.3390/app9122501
Kim J-Y, Son J-B, Leem H-S, Lee S-H. Psychophysiological Alteration After Virtual Reality Experiences Using Smartphone-Assisted Head Mount Displays: An EEG-Based Source Localization Study. Applied Sciences. 2019; 9(12):2501. https://doi.org/10.3390/app9122501
Chicago/Turabian StyleKim, Jeong-Youn, Jae-Beom Son, Hyun-Sung Leem, and Seung-Hwan Lee. 2019. "Psychophysiological Alteration After Virtual Reality Experiences Using Smartphone-Assisted Head Mount Displays: An EEG-Based Source Localization Study" Applied Sciences 9, no. 12: 2501. https://doi.org/10.3390/app9122501