Sustainable Italian Cities: The Added Value of Biomethane from Organic Waste


Department of Industrial Engineering, Information and Economics, University of L’Aquila, Via G. Gronchi 18, 67100 L’Aquila, Italy
*
Author to whom correspondence should be addressed.
Appl. Sci. 2019, 9(11), 2221; https://doi.org/10.3390/app9112221
Submission received: 22 April 2019
/
Revised: 24 May 2019
/
Accepted: 25 May 2019
/
Published: 30 May 2019
(This article belongs to the Special Issue State-of-the-Art and Applications of Renewable Energies in Europe)
Abstract
:This work focuses on the profitability of biomethane plants and the environmental benefits obtained recovering the organic fraction of municipal solid waste in Italy. The economic model is based on the calculations of the net present value, considering multiple capacities of biomethane production (ranging from 50 to 500 m3/h) and alternative scenarios based on the variation in subsidies, the selling price of biomethane, and the net revenues from the treatment of organic waste. The environmental analysis quantifies the reduction in greenhouse gas emissions obtained by natural gas vehicles fueled by biomethane. The economic and environmental results encourage energy change that can be achieved by municipalities that support the transformation of natural resources into green fuels. Across 15 Italian municipalities, the potential biomethane production varies from 80.4 million m3/year to 102.8 million m3/year, with an overall net present value ranging from 135 to 187 million €. In addition, the reduction in greenhouse gas emissions varies from 127 to 162 thousand-ton CO2eq/year. Both the economic and environmental results demonstrate that biomethane is a renewable resource with added value for municipalities.

1. Introduction
A sustainable society requires members to take responsibility for managing waste in order to prevent adverse impacts on public health and the environment [1,2]. In 2016, an estimated 1.6 billion tons of carbon dioxide-equivalent (CO2eq) greenhouse gas (GHG) emissions were generated from solid waste management, representing approximately 5% of the global emissions [3]. The integration of renewable energy resources and sustainable development is fundamental for future generations [4,5]. There is a high relationship between the concepts of the green economy and the circular economy (CE) [6]. The CE model involves numerous sectors and aims at reducing both virgin material inputs and waste outputs [7]. CE can be viewed as a model that seeks to achieve sustainability through a special focus on economic and environmental dimensions [8]. Waste management strategies have the final aim of reducing waste generation and maximizing the separate collected phase [9]. Additionally, the transformation of waste into energy supports the development of a CE model by closing the loop—not only in terms of materials, but also in terms of energy [10]. For this reason, CE practices are relevant for the implementation of the Sustainable Development Goals [11]. The organic fraction of municipal solid waste (OFMSW) is recognized as a sustainable resource for renewable energy production, and anaerobic digestion (AD) is considered the best technological method for this process [12], as it reduces the generation of waste and maximizes the recycling and recovery of waste, thus minimizing the use of landfills [13].
The biogas–biomethane chain provides a double advantage, as it simultaneously produces energy and recovers residues, reducing the amount of material destined for the landfill [14,15] (Figure 1). Biogas is the product of AD from several feedstocks. Biomethane, in contrast, is produced by biogas upgrading, which is a renewable energy source (RES) suitable for electricity and heat production, injection into the gas grid, and for use as fuel for transportation [16]. The technical standards necessary for using biomethane (as an alternative to natural gas) are specific to the final destination [17]. Hydrogen is a clean fuel with no harmful emissions, and can be applied in fuel cells to generate electricity [18]. Biomethane supports the decarbonization of the transport system, involving both private and public actors [19,20]. The integration of several types of RESs can help to achieve sustainability [21], and provides opportunities for additional sources of income [22,23].
Europe demonstrates a great potential for biogas [24], with an estimated production from collectible manures of 27 billion m3 biogas (16.1 billion m3 biomethane) in the European Union (EU) alone [25]. Research has also estimated a production value of 18 billion m3 biomethane, considering a moderate technology penetration scenario and a large share of this potential used in the transport sector [26].
It is expected that the global energy system will be decarbonized in order to meet the terms of the 2015 Paris Agreement. To this end, the European Commission has fixed targets and policy objectives for 2030, within the 2030 climate and energy framework, as follows: (i) at least 40% cuts in GHG emissions (from 1990 levels) and (ii) at least a 32% share of RES and a 32.5% improvement in energy efficiency [28]. The interconnection between renewable energy and energy efficiency was explored by the authors of [29]. A revised legislative proposal on waste was presented within the CE framework, recommending the following: (i) a common EU target for recycling of 65% of all municipal waste and (ii) a binding landfill cap of 10% municipal waste [30]. According to European legislation, the target shares of renewables in the transport sector (RES-T) will be fixed to 10% for all member states in 2020. The positive impact of biofuels on sustainable development was defined by the authors of [31]. In supporting this shift, however, government initiatives play a key role. Policies vary significantly in their tactics to promote the green energy transition in times of crisis, according to the specific aim pursued (i.e., profit, jobs, or EU targets) [32,33]. Sweden demonstrates best practice among member states in the development of green fuels [34], and some authors have focused their attention on the relationship between achieving regulatory compliance and improving biofuel sustainability [35]. In Sweden, public organizations make a significant contribution to the shift—some municipalities use environmentally friendly cars, Swedavia steers via a taxi queuing system, and Stockholm Public Transport procures biogas, matching the production of municipal wastewater treatment plants [19].
The development of CE models is verified by the recovery of some wastes that are perceived as resources and not only issues. Agricultural residues [36] and organic waste [37] are two such examples. Furthermore, some researchers have demonstrated that, while OFMSW management is complex, OFMSW can be valorized through transformation into biomethane [38]. The co-digestion of multiple feedstocks is technically feasible, and the best method for enhancing biogas production is to combine the potential results of biomethane with continuous AD testing [39]. Energy crops present a significant methane potential, and they have been widely used in biogas plants; however, their use may determine a change in land use, which would penalize agriculture [40]. The use of residual biomass achieves a better environmental performance than the use of dedicated biomass [41]. Within this context, Italy represents an interesting case study, because of its developed biogas market and its undeveloped biomethane market [27,42]. Years ago, the Italian Biogas Consortium elaborated a roadmap for the production of approximately 8 billion Nm3/year biomethane [43], and the Italian Biomethane Decree (signed 2 March 2018) aims at promoting the production of biomethane in order to increase the share of green fuels in the Italian transportation sector [44].
The novelty of this work is based on the following assumptions: (i) biomethane is a promising renewable resource that may support decarbonization in the transport sector; (ii) single cities can promote CE models to increase the sustainability of the energy sector; (iii) quantitative analyses may provide valuable information to investors and policymakers; (iv) Italy is a paradoxical case study, as it has all of the available input for a biomethane market, but the development of this market has not yet occurred; and (v) biomethane supports the interaction between renewable energy and waste management. Focusing on 15 Italian municipalities, the research uses both economic and environmental analyses to demonstrate the added value of biomethane from organic waste. The paper presents a comparative analysis of four scenarios, including the current one. Starting with the amount of OFMSW produced in each geographic entity, a strategic analysis is introduced to define the optimal plant size in order to manage these flows. The production decision is necessarily long-term, because the lifetime of a biomethane plant is 20 years [27,45], and the interaction between renewable energy and waste management seeks to achieve a CE model. Subsequently, an economic analysis based on discounted cash flow (DCF) is proposed, and the index of the reference is the net present value (NPV). Baseline and alternative case studies are constructed on the basis of the defined critical variables. The value of the subsidy is fixed by decree through the Certificates of Emission of Biofuel in Consumption (CIC) for the first 10 years, but their value is not known for the last 10 years. This variable, as well as the selling price of biomethane and the net revenues linked to the treatment of municipal waste, significantly influence the discounted cash inflows; thus, all of these variables are considered critical variables.
In addition, a joint implementation model between a biomethane producer and a methane distributor is also considered. The analysis initially elaborates the “As Is” scenario, and subsequently explores three “To Be” scenarios. Regarding the environmental analysis, the reduction of GHG emissions is estimated on the basis of the literature data on the use of green gas (BIO-CNG) as an alternative to compressed natural gas (CNG). The calculation of the reduction in GHG emissions through NGVs () also depends on the productivity of biomethane.
2. Literature Review
Generally, the biodegradable fraction of MSW varies from 30% to 65% [46], and OFMSW can be recovered from AD because of its high volatile solids [47]. AD supports the valorization of organic waste by generating biogas; for this reason, it is a valid option for the environmental management of MSW [48]. Using energy derived from biogas (as opposed to energy generated from fossil fuels) reduces CO2 emissions by 200 to 300 kgCO2/ton of biowaste [49]. Using energy derived from biomethane (BIO-CNG) follows the same approach, and its positive impact can be defined as follows:
- Reduced GHG emissions in vehicle power train systems of 119 gCO2eq/km, 151 gCO2eq/km, and 159 gCO2eq/km, relative to compressed natural gas (CNG), diesel, and petrol, respectively [50].
- GHG emissions from biomethane varying from −36 to 10 gCO2/MJ, all of which are lower than the 27 gCO2/MJ produced by a conventional biogas plant. This reduction is even more significant, considering the value of natural gas in Europe is equal to 72 gCO2/MJ [51].
- GHG emissions from biomethane production ranging from 45 to 68 gCO2eq/kWh, all of which are lower than the 124 gCO2eq/kWh, which is linked to the production of natural gas [52].
The economic perspective can be evaluated from several points of view (Table 1). Some studies have measured the cost of biomethane production, which varies from 0.54 to 0.73 €/m3 if it is injected into the gas grid or used as transportation fuel, respectively [17], and from 0.71 to 0.75 €/m3 if it is used for feedstock composition [53]. In particular, some authors have defined the cost of biogas production as mainly a function of the type of feedstock used (ranging from 0.38 to 0.56 €/m3) [54]. The substrate and size also influence the cost of biomethane, which is estimated to range from 0.5 $US/m3 (4.7 cent $US/kWh) to 1.5 $US/m3 (15 cent $US/kWh) [55].
Other research has compared the costs of biomethane and natural gas. Currently, subsidies are needed in order to promote the development of the biomethane market [56]. The carbon price plays a key role in the decarbonization of energy systems, and competitiveness can be reached when the price falls within the following values: 70 €/ton of CO2 [57] to 99 €/ton of CO2 [58]. However, these values are significantly lower than the ones registered in another work, which found the costs to range from 180 to 260 €/ton of CO2 [59]. Consequently, the analysis of biomethane plants is extremely complex, because multiple variables must be considered.
Some researchers have framed the difference between biogas and biomethane plants in terms of profitability. In fact, initially, several policymakers adopted subsidies only for the production of electricity from AD. Biomethane can be more convenient when there is both a high retail price and a low biogas upgrading cost [60]. Within existing biogas plants, the profitability of biomethane is typically reached when a centralized upgrading system is constructed. However, this is only valid when the biogas plants are in relatively close proximity to each other [45].
Finally, the profitability of biomethane plants has been investigated in several other works. In one study, the co-digestion of food waste and sewage sludge to produce biomethane was found to be financially feasible (NPV equal to 5667 K$US), while that of food waste and pig slurry was found to be unprofitable (NPV equal to −585 K$US) when no subsidies were provided [61]. Another study confirmed this result—NPV was found to vary from 89.8 M€ to 132.7 M€ when the organic waste had a consistent weight in the mix of waste recovered. However, if only pig slurry, manure residues, cattle slurry, milk processing waste, and slaughterhouse waste were used, the economic performance ranged from 0.49 M€ to 19.1 M€. The profitability was determined by the application of subsidies [62].
Plant size, in addition to subsidies and substrates, has also been shown to significantly influence financial feasibility. The minimum plant size in which profitability has been verified is 150 m3/h, using the OFMSW as a substrate. At this size, the NPV has been calculated as 616 K€ when biomethane is injected into the gas grid [63]. Considering a CIC value of approximately 375 € (about 0.305 €/m3) and a selling price of biomethane equal to 0.1722 €/m3, the NPV is 165 K€. However, when the selling prices of biomethane are 0.1384 €/m3 and 0.2397 €/m3, respectively, the NPV is instead equal to −341 K€ and 1174 K€, respectively. In contrast, if a mixed substrate (energy crops and manure residues) is used, the minimum plant size is 500 m3/h, but only when vehicle fuel is the final destination of the biomethane [64]. Italy has often been analyzed as a case study in the literature, because of its great potential. Some authors have measured the performance of the upgrading technology used, with the NPV shown to vary from 1498 to 3200 K€, and both the payback time (PBT) and discounted payback time (DPBT) varying from 3 to 5 years [65]. Other authors have evaluated a 250 m3/h plant as being profitable when organic waste is used, but not when by-products or mixed (by-products and energy crops) substrates are used. Here, the NPV has been shown to vary from −2412 to 2868 K€, with a DPBT of potentially less than 1 year [27].
3. Materials and Methods
The realization of a new plant requires environmental and economic goals to be achieved. This section begins by describing the current production of MSW in Italy (Section 3.1). It then presents the strategic analysis, in which a biomethane plant size is proposed for each municipality. This calculation depends on the quantity of feedstock that must be treated, and, consequently, alternative scenarios are considered (Section 3.2). While the first decree towards the development of biomethane was published in December 2013, a new policy framework was recently launched for the Italian territory; these policies are discussed in Section 3.3. The profitability analysis of biomethane plants is conducted according to the economic model proposed in Section 3.4. Finally, Section 3.5 presents the input assumptions defined in this work, and Section 3.6 concerns the environmental analysis.
3.1. Municipal Solid Waste
As part of its Circular Economy Action Plan, the European Commission adopted a package of legislative proposals on waste in December 2015. This package requires member states to take specific measures to prioritize prevention, re-use, and recycling, according to the waste hierarchy. Recycling targets for municipal waste are as follows: (i) 55% by 2025, (ii) 60% by 2030, and (iii) 65% by 2035 [66].
The Italian Institute for Environmental Protection and Research (ISPRA) acts under the vigilance and policy guidance of the Italian Ministry for the Environment and the Protection of Land and Sea. Based on the data provided by this institute [67], Italian waste generation amounted to 30,116.6 ktons in 2016 (+2% from 2015), with a separated collection rate of 52.5% (+5% from 2015) (Table 2). Within the separate collected waste of the MSW, the OFMSW assumed a predominant position, representing about 41.2% of this mix, followed by paper and cardboard (20.3%), glass (11.7%), and plastic (7.8%).
Moving from a national to more local perspectives, the present analysis concentrates on municipalities with populations greater than 200,000 (criteria fixed by ISPRA) (Figure 2). Table 3 presents the data for 15 municipalities that, in 2016, had a collective population of 9.9 million (16.4% of the Italian population) and produced 18.1% of the total national waste.
3.2. Definition of Plant Size
A strategy is a plan of action taken by decision makers to achieve a final goal. Section 2 underlined that plant size assumes a key role in the economic analysis. Decision makers aim at reducing the environmental damage produced by inadequate waste management, and, at the same time, maximizing economic opportunities. Underestimating plant size prevents a share of the collected waste from being recovered, and its transfer causes higher emissions in the transport phase. In addition, this choice is not coherent with the principles of self-sufficiency and proximity (Directive 2008/98/CE). Overestimating the plant size can lead to economic losses when plant saturation is not achieved; consequently, the benefits of economies of scale must be balanced [68].
Biomethane plant size (Sbiomethane) is defined according to three variables (see Equation (1)), namely: (i) the quantity of feedstock (QOFMSW), (ii) the unitary potential of biomethane (), and (iii) the number of operative hours (noh).
The amount of feedstock can be easily defined by the value reported in Table 3, but, at the same time, this table also reports different values for the separated collection rate (%SC). An increase in this last variable towards the final goal of 65% proposed by the European Commission also determines an increase in the collected OFMSW. The definition of the specific yields of SC for each fraction of waste was proposed by the authors of [69].
Four alternative scenarios are analyzed in this work, namely:
- Scenario “As Is”, in which QOFMSW is determined by the 2016 values.
- Scenario “To Be—65%SC”, in which the QOFMSW is calculated according to the recycling target of 65% and the %SC linked to the OFMSW is equal to the current mix.
- Scenario “To Be—65%SC 40%OFMSW”, in which the QOFMSW is defined according to the recycling target of 65% and the %SC of the OFMSW is equal to 40% (because this value is close to 41.2%, which was the 2016 average value %SC of the OFMSW in Italy). The percentage mix of separated waste is significantly diversified across the 15 municipalities, varying from 39.2% in the north to 45.7% in the south, and 41.7% in the central regions [67].
- Scenario “To Be—110 kg/inhabitant”, in which QOFMSW is evaluated as a function of the number of citizens. Some authors have assumed a yearly OFMSW production of 150 kg per inhabitant [70], considering good waste management practices. However, as discussed in Section 1, new policies that reduce the amount of waste generated also lower this value. A hypothetical reduction of 75% is considered, and, consequently, a yearly OFMSW production of approximately 110 kg per inhabitant is assumed.
For example, considering Torino as a case study, the QOFMSW is equal to 53,312 tons in the “As Is” scenario (Table 3). Considering that 427,741 tons of MSW equal to a SC of 65%, the amount of separated MSW is 278,032 tons.
Starting with this input, the QOFMSW is equal to 82,480 tons (i.e., almost 30% of 278,032 tons) and 111,213 tons (i.e., 40% of 278,032 tons) in the “To Be—65%SC” and “To Be—65%SC 40%OFMSW” scenarios, respectively. In fact, in the first situation, the %SC is approximately 30% (the 2016 value), while in the second situation it is 40%.
In these three scenarios, the amount of OFMSW production varies from 60 to 125 kg/inhabitant. Considering the current population of 886,837, the QOFMSW is equal to 97,552 tons (obtained by multiplying 886,837 inhabitants with 110 kg/inhabitant) in the “To Be—110 kg/inhabitant” scenario.
The biogas yield is mainly influenced by the specific nature of the OFMSW. The values of several feedstocks were proposed by the authors of [71]. Calculations of the biomethane yield typically assume a biogas composition of 60% methane, varying from 48 to 75 m3 biomethane/ton [72]; however, it was assumed to be equal to 78 m3 biomethane/ton by the authors of [73]. Considering the first industrial plant constructed in Italy, located in Montello (Bergamo), approximately 32 billion m3 biomethane are obtained by 600,000 tons of the OFMSW annually (approximately 55 m3 biomethane/ton) [74].
In addition, 100,000 tons/year of pig slurry is needed as feedstock for a 250 m3/h production capacity. The same result can be reached by 25,000 tons/year of the OFMSW or 18,000 tons/year of maize [67]. However, biogas and biomethane yields cannot be defined only as a function of the substrate. In fact, gas yields depend highly on the dry matter content, storage feedstock, and feedstock handling, and an exact estimate requires feedstock testing [75]. In this work, is assumed equal to 75 m3 biomethane/ton [55].
Regarding the third variable, the literature typically assigns a value of 8000 operative hours, or approximately 333 days [45].
3.3. Policy Framework
With the biomethane sector not fully developed, a new decree for biomethane production was published by Italy’s Economic Development Ministry (MISE) in March 2018. The decree provides for 4.7 billion € of incentives dedicated to plants, starting operations between 2018 and 2022 [44]. As advanced biofuels and biomethane have higher production costs than traditional fuels, the decree seeks to support biomethane producers with a premium to fill the cost gap. The incentives apply up to 1.1 billion m3 biomethane per year.
Transport fuel retailers have the obligation to sell a minimum amount of biofuel. This obligation can be satisfied in two ways, namely: (i) through selling the prescribed amount of biofuel in return for a corresponding amount of CICs, or (ii) through purchasing the obligation share of biofuels not injected into the market from producers or other obliged entities with a CIC surplus. A CIC is issued for each 10 GCal (single counting) of produced biomethane; considering that 1m3 CH4 is equal to 8121 kcal, a CIC corresponds to about 1231 m3 CH4. This calculation assumes that 1m3 CH4 equals 0.68 kg under normal conditions (standard temperature of 273.15 K and pressure of 101.325 kPa).
The revenues for advanced biomethane are generated from two main sources, namely:
- The payment of 375 € for a 10-year CIC; after this time, producers are only entitled to receive CICs at a price defined by the market. In addition, advanced biomethane, obtained by some substrates such as OFMSW, entitles producers to receive one CIC per 5 GCal (double counting).
- Selling produced biomethane at the average price, weighed against the quantities registered in the virtual trading point (PTV) during the month of the sale, reduced by 5%.
Finally, an additional premium is offered when the producer is also the distributor of the methane. In fact, in this scenario, the value of the guaranteed CICs is increased by 20%. Additional data regarding the permits/authorization were proposed by the authors of [65], and these aspects are consistent and equal for all plants, regardless of their location and size.
3.4. Economic Model
The DCF analysis is a method of evaluating a project using the concept of the time value of money. It uses an incremental approach that considers cash inflows and outflows, and applies a cost opportunity of capital to aggregate several cash flows. NPV, which is the financial index used in this work, is the sum of the present values of the individual cash flows [42].
The subsidies, sale of biomethane, sale of food-grade CO2 (through outsourcing), and the positive net income derived from treating the OFMSWs represent the revenue sources of a biomethane plant. Three phases typically characterize the biogas–biomethane chain, namely: (i) biogas production, (ii) upgrading, and (iii) compression and distribution. Investment, substrate, labor, transport, maintenance and overheads, depreciation for mechanical and electrical elements, electricity consumption, insurance, and the purchase of zeolite are the costs of a biomethane plant.
The following assumptions were used in this study:
- The end specifications of gas (such as composition and pressure) were adjusted to its final use.
- The CIC value was fixed for all 20 years. The lack of data did not permit us to conduct a statistical analysis of the CIC value. However, alternative values defined by the literature were used in addition to the baseline scenario.
- The selling price of biomethane was fixed for all 20 years. In reality, this price could vary each month; but again, the scarcity of the available data did not enable us to conduct a statistical analysis. Alternative values were considered in addition to the baseline scenario.
- The definition of an optimal size of biogas plant (Sbiogas) was chosen in order to maximize the grade of saturation in the upgrading phase (Qbiomethane ≈ ).
A sensitivity analysis was aimed at verifying the results and reducing the subjectivity of the formulated hypothesis [76]. The model is as follows:
3.5. Input Assumptions
The robustness of an economic analysis is determined by the choice of input variables. For this reason, this work opted to use the values reported in the literature (Table 4), and, regarding subsidies, followed the inputs reported in the decree. The opportunity cost of the capital measured the return of a project with the same risk level, and was assumed to be equal to 5%. The lifetime of the project was hypothesized to equal the period of the subsidies provided in the previous version of the decree, which was 20 years. Year 0 was fixed in 2018, and 6 months was defined as the construction time of the plant. A pressure swing adsorption (PSA) technique was considered in the upgrading phase. Regarding the unitary value of the subsidy (), the following value was used:
Concerning the selling price of biomethane (), some data were available (), namely: from 19.44 €/MWh (February 2019) to 27.78 €/MWh (July 2018) [43]. The conversion factor () was 1 m3 = 0.0105 MWh. The value used in this work was the average of the following:
The unitary investment cost of both the AD and the upgrading phases decreased with the increasing plant size. The biogas production varied from 5300 €/kW (for a 150 kW plant) to 4000 €/kW (for a 1500 kW plant). Biomethane production, in contrast, ranged from 6300 €/(m3/h) for a 50 m3/h plant, to 2250 €/(m3/h) for a 500 m3/h plant.
3.6. Environmental Analysis
Regarding the environment, the GHG emissions of the vehicle power train systems were recorded, from the “well to wheel.” Section 2 defined the reduction of GHG emissions as 119 gCO2-eq/km when BIO-CNG was used as an alternative to CNG. In fact, the actual GHG emissions when BIO-CNG was used were 5 gCO2-eq/km (GHGBIOCNG), relative to those from fossil fuels, which were 124 gCO2eq/km (GHGCNG) [50]. The environmental analysis is focused only on the reduction of GHG emissions obtained by the CNG vehicles fueled by biomethane, according to the authors of [19,50,51,55,63].
It was hypothesized that an NGV travelled 15,000 km per year () [63], and the reduction of GHG emissions of a NGV () could be estimated as 1785 kgCO2-eq/y. The number of NGVs fueled by BIO-CNG () was calculated as the ratio between the amount of produced biomethane () and the annual NGV consumption (. For example, a plant with a unitary capacity (1 m3/h) produced about 7760 m3 of biomethane, and, considering an annual methane consumption of 1100 m3 [27], about seven NGVs would be powered by BIO-CNG.
The environmental benefit of a biomethane plant was obtained by multiplying the unitary value of the emissions reduction with the number of NGVs. For example, the reduction of GHG emissions obtained by the NGVs fueled by biomethane () was found to be12.6 tCO2-eq/y in a plant of 1 m3/h.
4. Results
This section begins by identifying the criteria used to define the minimum plant size that can fulfil the profitability condition (i.e., NPV >0). Ten cases relating to plants of different sizes, ranging from 50 m3/h to 500 m3/h, are considered (Section 4.1). Following this, a sensitivity analysis is conducted to strengthen the obtained results (Section 4.2), and the scenario in which the biomethane producer is also the methane distributor of the methane is examined (Section 4.3). The potential productivity of biomethane and the associated profits are reported in Section 4.4 and Section 4.5, respectively. Also, alternative scenarios are proposed in Section 4.6.
4.1. Profitability Analysis of Biomethane Plants—Baseline Scenario
The profitability of the biomethane plants powered by OFMSW was confirmed in seven of out of the ten cases proposed in Figure 3. The NPV was positive for the 200 m3/h plant and greater than that of the 150 m3/h plant proposed in the literature. However, this result depended on the specific input data used (see Section 2).
Although the NPV measured the plant profitability, the index was not able to consider different size values. For this reason, considering the different plant capacities examined in this work, the ratio of NPV/size was useful for comparison. NPV/size was coherent with NPV, and was obtained by dividing this indicator with the plant size; thus, all of the case studies were homogeneous, because they were expressed in terms of € for m3/h.
The profits obtained were extremely consistent, varying from 2040 € for m3/h (200 m3/h plant), to 15,884 € for m3/h (500 m3/h plant). This was determined by two main variables, namely: (i) economies of scale and (ii) the structure of subsidies, which did not differentiate between plant size.
The use of OFMSW as a substrate determined the profitability of the biomethane plants because of the effect of double counting, in which the value of the corrective coefficient () is equal to 2. Subsidies played a key role in the discounted cash inflows (approximately 39%; Figure 4). As the MSW treatment is a paid service, its value exceeded the necessary costs for pre-treatment (equal to 21 €/ton; Table 4). The use of organic waste provided additional income to the biogas–biomethane plants, via a tariff paid for the treatment of waste; in fact, the tariff payment for the OFMSW treatment was paid to the plant owner by the local municipality [88,89]. The contribution of this net revenue was significant, representing approximately one quarter of the total (23%). Of course, willingness to pay for separate waste collection depends on both economic and non-economic motivations [90]. The sale of biomethane influenced about one fifth of the total (20%).
Regarding the discounted cash outflows, the percentage weight of the investment costs was significantly lower than that of the operative costs (15%). The investment costs consisted of both a loan capital share and a loan interest share, because it was hypothesized that these costs would be covered by third party funds. The costs were subdivided for a single phase of biomethane production as follows: (i) AD, (ii) upgrading, and (iii) compression and distribution. The following operative costs were analyzed: substrate, labor, transport, maintenance and overheads, depreciation for mechanical and electrical devices, electricity consumption, and insurance. Also, some items were specific to biogas production and upgrading. Among these, the maintenance and overhead costs (in particular during biogas production) were the most relevant (41%). The average values of the costs linked with several plant sizes are reported in Figure 4, with a null value for the substrate (Table 4). Starting with these items, the level cost for the production of 1 Nm3 of biomethane was obtained as the ratio between the sum of the discounted cash outflows and the biomethane production. Its value varied from 0.63 €/m3 (500 m3/h plant) to 1.16 €/m3 (50 m3/h plant). These values were greater than the values registered for the production of natural gas; for this reason, it would be necessary to apply a subsidy. This renewable resource is better able to tackle climate change than fossil fuels [76,91].
As payback time (PBT) is an inappropriate indicator for measuring the economic feasibility of a project, this work used discounted payback time (DPBT), which considers the real value of money. DPBT was less than 1 year in several plants (from 250 to 500 m3/h), and equal to 1 year in a 200 m3/h plant. These results were coherent with NPV, and were encouraged mainly for two reasons, namely: (i) the assumption of third party funding with investment costs spread over the debt period, and (ii) the lower weight of investment costs relative to operative costs. A main challenge of DPBT is that it does not take into account what happens after payback. Specifically, some cash flow values may be negative towards the end of the debt period, because the economic model assumes that the costs will increase during the period because of inflation, while the revenues will not be subjected to such variation.
4.2. Profitability Analysis of Biomethane Plants—Alternative Scenarios
The economic results obtained in the baseline scenario are linked to the input variable assumptions. All of the business plans demonstrate dynamic aspects, and, consequently, variability in the results is generally found. This issue is typically resolved through a sensitivity analysis conducted on the critical variables. The critical variables were defined according to the new version of the decree and the existing literature [63]. Optimistic (opt) and pessimistic (pes) scenarios were proposed for the three strategic variables, as follows:
- The CIC was not assumed to be fixed for the lifetime of the biomethane plant. After 10 years, the unitary value of the subsidy () was considered equal to 0.244 €/m3 with a CIC of 300 € (scenario ), and 0.406 €/m3 with a CIC of 500 € (scenario ).
- The selling price of the biomethane () was considered fixed for 20 years, but different in the two scenarios, namely: 0.20 €/m3 (scenario ) and 0.30 €/m3 (scenario ).
- The price paid for the MSW recovery was not the same for all of the municipalities, and the mix of OFMSW determined a different cost of treatment. The net revenues () were modified to 15 €/ton (scenario ) and 30 €/ton (scenario ).
Table 5 outlines the 60 alternative scenarios obtained by the combination of the ten plant sizes, three critical variables, and two estimates of value. The ratio between NPV and plant size is shown in Figure 5. NPV was chosen as a measurement because of its wide use for evaluating the profitability of biomethane plants [27,45,61,92,93].
The alternative scenarios strengthened the obtained results. NPV was always positive for a 250 m3/h plant, and this became the new minimum size, even considering the negative scenarios. In fact, for the negative scenarios (, , and ), the profitability of a 200 m3/h plant was not verified. However, economic feasibility was reached in a 150 m3/h plant in the scenario.
A probability value was not assigned to each scenario, and a comparison was not possible because the variation of critical variables was not uniform. Investors rely on the development of these scenarios, because varying assumptions with respect to the input data define economic performance. In particular, in our analysis, the minimum and maximum values were linked to the variation in net revenues from the OFMSW treatment. For example, in a 200 m3/h plant, the NPV varied from −4315 for m3/h (−4.3 K€ for m3/h) to 10,860 € for m3/h (10.9 K€ for m3/h). The structure of the subsidies, which remained consistent for all of the plant sizes, characterized these results. In fact, maximum profits were obtained with larger sizes of upgrading plants, but only when they operated at full saturation. For this reason, the definition of plant size must be linked to the number of substrates treated, and the opportunity to manage multiple substrates.
4.3. Joint Implementation between a Biomethane Producer and Methane Distributor
The new version of the decree recognizes a special premium for investors that both produce biomethane and distribute methane. In this scenario, the CIC value is increased by 20% for the first 10 years. Thus, the previous model was integrated as follows:
where pos = point of sale; = corrective coefficient (point of sale)= price of biomethane (point of sale); = investment cost (point of sale); and = operative cost (point of sale).
In the new decree, the unitary value of the subsidy increases by two corrective coefficients, as follows: the double counting () coefficient and the corrective coefficient ( equal to 1.2), because of the application of a distribution premium [44].
Consequently, this value is equal to 0.732 €/m3 for the first 10 years, after which it is assumed equal to 0.305 €/m3. The input data regarding the point of sale were chosen according to a report elaborated by the authors of [94]. The investment and operative costs of the distribution plant were assumed equal to 600,000 € ( for both 50 and 100 m3/h plants equal to 500,000 €) and 1680 €/(m3/h) (). The price to the final consumer of the natural gas (net value added tax and excise) replaced the selling price of biomethane, and was assumed equal to 0.529 €/m3 () in the Rpos scenario. However, in this case, a sensitivity analysis was also conducted. Two alternative scenarios were analyzed, in which ppos was assumed to be equal to 0.40 €/m3 (scenario ) and 0.60 €/m3 (scenario ) (Table 6).
This business model confirmed the trend of profitability proposed in the previous analysis. In particular, NPV was always positive for a 250 m3/h plant. In addition, a lower selling value of biomethane determined a negative NPV in a 200 m3/h plant (scenario ). However, the profitability was verified for a 150 m3/h plant, considering a greater selling value of biomethane (scenario ). The application of a premium determined an increase in revenues, which always exceeded the costs. This had the effect of increasing the economic performance. For example, in a 250 m3/h plant, NPV increased 1006 K€ in comparison to the baseline scenario, and 3648 K€ when the selling price of the biomethane was assumed to be equal to 0.60 €/m3. However, an opposite situation was verified in the scenario, with a decrease of NPV equal to 1401 K€. The DPBT was less than 1 year, in line with the previous results.
4.4. The Calculation of Potential Biomethane Productivity
Following the economic descriptions, this section provides details on potential biomethane productivity. Table 7 outlines the potential amount of the OFMSW to be treated, according to the four scenarios defined in Section 3.2.
As expected, the amount of OFMSW changed significantly across the four scenarios. Certainly, the values proposed in the “To Be” scenarios were greater than those of the “As Is” scenario (equal to 721 ktons). This means that a substantial amount of waste became unsorted waste and some entered landfills, violating the good practices of the waste hierarchy. In this way, these municipalities did not maximize the recycled/recovered quantity. Only Milano, Verona, Venezia, and Padova had a recycling rate greater than 55%; at the same time, this value was lower than 12% in Palermo, Messina, and Catania (see Table 2). For this reason, two scenarios, “To Be—65%SC” and “To Be—65%SC 40%OFMSW,” were constructed. The target recycling rate of 65% was fixed, and an increase in the sorted waste determined an increase of all of the components in this mix (e.g., the OFMSW, paper, glass, and plastic). The total amount of OFMSW in “To Be—65%SC” was 1164 ktons, which was lower than 1420 ktons (“To Be—65%SC 40%OFMSW”). In fact, the weight of the OFMSW in the collected waste mix in the “As Is” scenario was lower than 40% in all of the municipalities, varying from 17% in Messina to 39% in Padova. It was not possible to compare these two scenarios from an environmental perspective. However, the same cannot be said for the “To Be—110 kg/inhabitant” scenario (equal to 1091 ktons). In fact, another good practice of waste management is reducing generated waste. A defined value (in this case 110 kg/inhabitant) could counter this approach.
According to Equation (1), it was possible to calculate the potential biomethane productivity expressed in m3 per hour (Table 8). In this way, the value could be interpreted as the biomethane plant size.
4.5. Calculation of Potential Biomethane Profits—Baseline Scenario
The decisional criteria used in this work were as follows:
- A plant was built only if economic feasibility was reached, according to plant size. As demonstrated in Figure 3, a 200 kt plant was the minimum size.
- The pant size was defined according to Table 8, with allowance for a slight approximation by excess.
- The plant size varied from 200 kt to 500 kt, in multiples of 50 kt.
- The NPV obtained in the baseline scenario was considered the economic profit of reference.
Table 9 presents the number of biomethane plants, the definition of the plant size, and the calculation of the economic profit for each municipality. For example, there were four 500 m3/h plants and one 400 m3/h plant in Rome in the “As Is” scenario, and eight 500 m3/h plants constructed in two “To Be” scenarios. The main results are reported in Table 10. Fifteen municipalities could achieve profit in an “As Is” scenario characterized by eight 500 m3/h plants; two 250 m3/h plants; and one 200, 300, 350, 400, and 450 m3/h plant. This determined a biomethane productivity equal to 6200 m3/h; considering an operational period of 8000 h, the production of biomethane was equal to 49.6 million m3 (approximately 5% of the amount supported by incentives (1100 million m3)—see Section 3.3). The advantages of biomethane could be explained from an environmental perspective (about 78.1 thousand tons of CO2-eq were avoided annually, and, consequently, 1.6 million tons of CO2-eq were avoided over a period of 20 years) and an economic perspective (as the value of profits were 85 million € during the project lifetime).
The results of this work underline that biomethane plants support the attainment of several goals, as follows:
- The biomethane obtained by OFMSW transforms this waste into a resource. Several economic opportunities are generated and the profitability of plants undertaking this processing can reduce the tax bills paid by citizens. In fact, economic feasibility is also obtained when net revenues are reduced in the treatment of the OFMSW [27,61]. The final goal is to stimulate the citizens to separate waste in order to lower their waste collection bill. Should this occur, the revenues received by the municipalities would be reduced, and, consequently, the payments made by the municipalities to the OFMSW treatment plants would also be reduced.
- Biomethane produced by OFMSW increases the share of renewable energy in the transport sector. This goal is urgent. In fact, in a recent report issued by the European Commission, Italy was noted to have already achieved the EU target for renewables in the electricity sector, while being far from achieving their target in the transport sector. In addition, there is a serious delay regarding the national sub-target for advanced biofuels [94].
- Italy has a great number of NGVs (1,001,614 in 2016, about 77% of the European market) [97] and a developed biogas market. At the same time, the biomethane market is not well developed. NGVs can be fueled by this renewable resource and, in this way, the levels of imported gas can be lessened, reducing geopolitical risk [63,83]. In the “To Be—65%SC” scenario, the quantity of 85.2 million m3 of biomethane was able to fuel 77,455 NGVs. Considering that each NGV can travel 10,000 or 20,000 km, the number of NGVs changed to 116,712 and 58,356, respectively. Consequently, the number of NGVs fueled by biomethane changed as a function of both of the “To Be” scenarios and the number of km traveled. The values examined in this work ranged from 55,068 to 140,822 NGVs.
The analysis of this work was limited to 15 municipalities in Italy. There were 26 and 28 plants that were hypothesized in the “To Be—65%SC” and “To Be—65%SC 40%OFMSW” scenarios, respectively. The annual production of biomethane was found to vary from 85.2 to 102.8 million m3, equal to about 8% to 10% of the funds made available in the new version of the decree. The economic benefits were found to be extremely consistent, varying from 145 to 187 million €, with an annual reduction of GHG emissions ranging from 134 to 162 million kgCO2-eq.
4.6. Calculation of Potential Biomethane Profits—Alternative Scenarios
The decisional process was influenced by the definition of the minimum plant size. The economic results of the alternative scenarios reported in Table 5 underlined that this value varied from 150 to 200 m3/h plant. At the same time, the economic performance of the plants ranged significantly, as determined by the total economic benefits linked to the 15 municipalities. This work was based on two estimates. The first considered that citizens might be opposed to the realization of large plants; for this reason, the maximum size considered was 500 m3/h. The second concerned the assumption that the value of the potential feedstock would be calculated for each municipality. However, flows of waste coming from nearby cities could be managed for economic reasons, with respect to the environmental principle of proximity. Moreover, other substrates (as by-products for which double counting would apply) could be employed as a mix with OFMSW in these plants.
The legislation defines a premium for investors that both produce biomethane and distribute methane. Table 6 defined the minimum size as 200 m3/h, and the NPV increased at all of the sizes. Table 11 presents the calculations of the economic profit, and Figure 6 illustrates the economic benefits of the alternative scenarios. The premium provided for a methane distributor did not modify the biomethane productivity in several scenarios. Instead, the total economic benefits varied significantly.
5. Conclusions
This study began with some assumptions, and its final goal was to provide quantitative results. The literature review confirmed that biomethane is able to support the decarbonization of the transport sector, providing a CE model by which environmental and economic improvements are reached. While the role of cities is essential, a methodology was presented to policymakers based on the following steps: (i) the definition of the condition in which biomethane was profitable in the baseline scenario; (ii) the provision of alternative scenarios in which economic feasibility was demonstrated as a function of critical variables; (iii) the definition of the minimum biomethane plant size; (iv) the quantification of the biomethane potential as a function of future scenarios; and (v) the integration of the waste hierarchy into future choices, in order to support the integration of renewable energy management and waste management. Some results were obtained, but more analyses must be conducted. In particular, it would be extremely useful to analyze the specific context of a single municipality. At the same time, while Italy is an excellent case for research (as it is characterized by a large number of NGVs and a high amount of imported gas), this work proposed a model that could be applied in several contexts. Additionally, both the literature review and real experiences support the conclusion that Sweden represents the best-practice to follow. The definition of conditions in which biomethane is profitable represents a key element analyzed by investors. In addition, the literature also shows that the environmental impacts of organic waste recovered by the AD process that is upgraded in order to obtain biomethane represents a good option. The reduction of GHG emissions is extremely significant. Biomethane is a viable substitute for methane as a green fuel, and, in this way, NGVs can be fueled by a sustainable resource.
This work confirms that the recovery of biomethane from organic waste is profitable in plants at a minimum size of 200 m3/h. The new decree resolves some issues, and it defines the value of CICs. Subsidies account for approximately 40% of the discounted cash inflows, confirming their key role in determining the economic feasibility of plants. However, the same decree also has some issues. CICs are recognized only for the first 10 years of biomethane activity, and, after this date, their price is not guaranteed. In addition, corrective coefficients proposed to support the use of some substrates (see double counting) and the premium to realize new points of methane distribution are not provided after 10 years. Thus, there is a risk that the revenues will exceed the costs for the first period of activity, and the opposite situation may occur in the second period because of the inflation of operative costs. This aspect must be monitored.
Policymakers have great interest in the transport sector, because there is a serious risk that the European target will not be reached. The development of advanced biofuels is a sustainable choice. The reduction of GHG emissions obtained by NGVs fueled by green gas corresponds to 12.6 tCO2-eq for m3/h of biomethane capacity, annually. The profits derived from the application of biomethane plants are 408 K€ and 7942 K€ for 200 m3/h and 500 m3/h, respectively. DPBT is less than 1 year. Alternative scenarios are realized, considering variations in the CIC value after 10 years, the selling price of biomethane during the lifetime of the project, and the net revenues linked to the management of municipal waste. Also, a joint implementation model between a biomethane producer and methane distributor is proposed, with a significant increase of NPV equal to 1147 K€ and 10,473 K€ for 200 m3/h and 500 m3/h, respectively.
The final goal of this work was to define the potential economics of biomethane generated by managing the OFMSW in 15 Italian municipalities that, collectively, represent approximately 16.4% of the Italian population. Considering the future scenarios in which the separated rate collection will be fixed to 65%, the action plan obtained the following results: 80.4 to 102.8 million m3 of biomethane produced annually, 127 to 162 million kgCO2-eq avoided annually, and an NPV of 135 to 187 million € over the lifetime of the projects. This latter value rises to 183 to 234 million € when the biomethane producer is also the methane distributor. Economic opportunities and environmental improvements are translated into clean energy, which is produced internally and applied to the transport sector. Each municipality has this potential, and both material and energy perspectives are valorized, providing a clear opportunity for increased sustainability.
Author Contributions
Conceptualization, I.D.; methodology, I.D. and M.G.; validation, I.D. and M.G.; formal analysis, I.D.; data curation, F.C.; writing—(original draft preparation), I.D. and M.G.; writing (review and editing), I.D. and M.G.; visualization, I.D.; supervision, M.G.; project administration, I.D.
Funding
This research received no external funding.
Conflicts of Interest
The authors declare no conflict of interest.
Nomenclature and Abbreviations
| Nomenclature | |||
| AD | anaerobic digestion | OFMSW | organic fraction municipal solid waste |
| BIO-CNG | biomethane | PBT | payback time |
| CE | circular economy | optimistic scenario treatment of MSW | |
| CIC | certificates of emission of biofuel in consumption | pessimistic scenario treatment of MSW | |
| CNG | compressed natural gas | optimistic scenario point of sale | |
| CO2eq | carbon dioxide equivalent | pessimistic scenario point of sale | |
| DPBT | discounted payback time | optimistic scenario selling price biomethane | |
| EU | European Union | pessimistic scenario selling price | |
| GHG | greenhouse gas | biomethane | |
| GHGBIOCNG | emissions released by BIO-CNG | optimistic scenario subsidies 11th year | |
| GHGCNG | emissions released by CNG | pessimistic scenario subsidies 11th year | |
| MS | member state | RES | renewable energy source |
| MSW | municipal solid waste | RES-T | renewable energy source in the transport sector |
| NGV | natural gas vehicle | . | reduction of GHG operated by NGVs |
| NPV | net present value | %SC | separated collection rate |
| NPV/Size | ratio between NPV and biomethane plant size | ||
| Abbreviations | |||
| 1°s | biogas production | period of loan | |
| 2°s | Upgrading | number of operating hours | |
| 3°s | compression and distribution | number of operators | |
| corrective coefficient (double counting) | period of subsidies (biomethane) | ||
| depreciation fund (1°s) | discounted cash outflows | ||
| depreciation fund (2°s) | unitary potential of biomethane | ||
| electricity cost (1°s) | selling price of biomethane | ||
| electricity cost (2°s) | price of CIC (after 11th year) | ||
| unitary electricity consumption (1°s) | unitary price of CO2 | ||
| unitary electricity consumption (2°s) | price of compost | ||
| insurance cost (1°s) | percentage of depreciation fund | ||
| insurance cost (2°s) | unitary price of electricity | ||
| investment cost (digestate) | percentage of insurance cost | ||
| investment cost (distribution) | percentage of maintenance and overhead cost (1°s) | ||
| labor cost | percentage of maintenance and overhead cost (2°s) | ||
| unitary labor cost | price in the virtual trading point | ||
| loan capital share cost | percentage of taxes | ||
| loan interest share cost | unitary price of zeolite | ||
| unitary investment cost (1°s) | PTV | virtual trading point | |
| unitary investment cost (2°s) | R | opportunity cost | |
| maintenance and overhead cost (1°s) | recovery rate (biomethane) | ||
| maintenance and overhead cost (2°s) | recovery rate (CO2) | ||
| consumption of NGV | revenues by compost | ||
| operative cost (digestate) | interest rate on loan | ||
| operative cost (distribution) | revenues by selling CO2 | ||
| substrate cost | revenues by treatment of the OFMSW | ||
| unitary substrate cost | gross revenues by the OFMSW | ||
| cost of the OFMSW | revenues by selling biomethane | ||
| taxes cost | revenues by subsidies | ||
| transport cost of substrates | quantity of biogas | ||
| unitary transport cost of Substrate | nominal quantity of biogas | ||
| generic variable cost | quantity of biomethane | ||
| conversion factor (CO2) | quantity of CO2 | ||
| conversion factor (gas) | quantity of compost | ||
| CF | cash flow | nominal quantity of biomethane | |
| CIC | certificates of emission of biofuel in consumption | quantity of the OFMSW | |
| Dig | Digestate | quantity of zeolite | |
| DPBT | discounted payback time | plant size (biogas) | |
| discounted cash inflows | plant size (biomethane) | ||
| unitary subsidy (biomethane) | t | time of the cash flow | |
| Inf | rate of inflation | percentage of methane | |
| losses in the biogas system | percentage of carbon dioxide | ||
| losses in the upgrading system | percentage reduction of the price in the virtual trading point | ||
| n | lifetime of investment | ||
References
- Lupo, T.; Cusumano, M. Towards more equity concerning quality of Urban Waste Management services in the context of cities. J. Clean. Prod. 2018, 171, 1324–1341. [Google Scholar] [CrossRef]
- You, Z.; Zhang, S.; Kim, H.; Chiang, P.-C.; Sun, Y.; Guo, Z.; Xu, H. Effects of Corn Stover Pretreated with NaOH and CaO on Anaerobic Co-Digestion of Swine Manure and Corn Stover. Appl. Sci. 2018, 9, 123. [Google Scholar] [CrossRef]
- Kaza, S.; Yao, L.; Bhada-Tata, P.; Van Woerden, F. What a Waste 2.0: A Global Snapshot of Solid Waste Management to 2050; The World Bank: Washington, DC, USA, 2018; ISBN 978-1-4648-1329-0. [Google Scholar]
- Bortolini, M.; Gamberi, M.; Mora, C.; Pilati, F.; Regattieri, A. Design, prototyping, and assessment of a wastewater closed-loop recovery and purification system. Sustainability 2017, 9, 1938. [Google Scholar] [CrossRef]
- Arrhenius, K.; Fischer, A.; Büker, O. Methods for Sampling Biogas and Biomethane on Adsorbent Tubes after Collection in Gas Bags. Appl. Sci. 2019, 9, 1171. [Google Scholar] [CrossRef]
- D’Amato, D.; Droste, N.; Winkler, K.J.; Toppinen, A. Thinking green, circular or bio: Eliciting researchers’ perspectives on a sustainable economy with Q method. J. Clean. Prod. 2019, 230, 460–476. [Google Scholar] [CrossRef]
- Ardolino, F.; Arena, U. Biowaste-to-Biomethane: An LCA study on biogas and syngas roads. Waste Manag. 2019, 87, 441–453. [Google Scholar] [CrossRef] [PubMed]
- Ghisellini, P.; Cialani, C.; Ulgiati, S. A review on circular economy: The expected transition to a balanced interplay of environmental and economic systems. J. Clean. Prod. 2016, 114, 11–32. [Google Scholar] [CrossRef]
- Ingrao, C.; Faccilongo, N.; Di Gioia, L.; Messineo, A. Food waste recovery into energy in a circular economy perspective: A comprehensive review of aspects related to plant operation and environmental assessment. J. Clean. Prod. 2018, 184, 869–892. [Google Scholar] [CrossRef]
- Tomić, T.; Schneider, D.R. The role of energy from waste in circular economy and closing the loop concept—Energy analysis approach. Renew. Sustain. Energy Rev. 2018, 98, 268–287. [Google Scholar] [CrossRef]
- Schroeder, P.; Anggraeni, K.; Weber, U. The Relevance of Circular Economy Practices to the Sustainable Development Goals. J. Ind. Ecol. 2019, 23, 77–95. [Google Scholar] [CrossRef]
- Di Maria, F.; Sisani, F.; Norouzi, O.; Mersky, R.L. The effectiveness of anaerobic digestion of bio-waste in replacing primary energies: An EU28 case study. Renew. Sustain. Energy Rev. 2019, 108, 347–354. [Google Scholar] [CrossRef]
- Eriksson, M.; Strid, I.; Hansson, P.A. Carbon footprint of food waste management options in the waste hierarchy—A Swedish case study. J. Clean. Prod. 2015, 93, 115–125. [Google Scholar] [CrossRef]
- Lyng, K.A.; Stensgård, A.E.; Hanssen, O.J.; Modahl, I.S. Relation between greenhouse gas emissions and economic profit for different configurations of biogas value chains: A case study on different levels of sector integration. J. Clean. Prod. 2018, 182, 737–745. [Google Scholar] [CrossRef]
- Nelabhotla, A.; Dinamarca, C. Bioelectrochemical CO2 Reduction to Methane: MES Integration in Biogas Production Processes. Appl. Sci. 2019, 9, 1056. [Google Scholar] [CrossRef]
- Salman, C.A.; Naqvi, M.; Thorin, E.; Yan, J. Impact of retrofitting existing combined heat and power plant with polygeneration of biomethane: A comparative techno-economic analysis of integrating different gasifiers. Energy Convers. Manag. 2017, 152, 250–265. [Google Scholar] [CrossRef]
- Rotunno, P.; Lanzini, A.; Leone, P. Energy and economic analysis of a water scrubbing based biogas upgrading process for biomethane injection into the gas grid or use as transportation fuel. Renew. Energy 2017, 102, 417–432. [Google Scholar] [CrossRef]
- Hosseini, S.E.; Wahid, M.A. Hydrogen production from renewable and sustainable energy resources: Promising green energy carrier for clean development. Renew. Sustain. Energy Rev. 2016, 57, 850–866. [Google Scholar] [CrossRef]
- Ammenberg, J.; Anderberg, S.; Lönnqvist, T.; Grönkvist, S.; Sandberg, T. Biogas in the transport sector—actor and policy analysis focusing on the demand side in the Stockholm region. Resour. Conserv. Recycl. 2018, 129, 70–80. [Google Scholar] [CrossRef]
- Lönnqvist, T.; Grönkvist, S.; Sandberg, T. Forest-derived methane in the Swedish transport sector: A closing window? Energy Policy 2017, 105, 440–450. [Google Scholar] [CrossRef]
- Tian, Z.; Hao, Y.; Li, W.; Campana, P.E.; Li, H.; Jin, H. Integrating concentrating PVs in biogas upgrading. Energy Procedia 2018, 145, 598–603. [Google Scholar] [CrossRef]
- Hao, Y.; Li, W.; Tian, Z.; Campana, P.E.; Li, H.; Jin, H.; Yan, J. Integration of concentrating PVs in anaerobic digestion for biomethane production. Appl. Energy 2018, 231, 80–88. [Google Scholar] [CrossRef]
- Regattieri, A.; Bortolini, M.; Ferrari, E.; Gamberi, M.; Piana, F. Biogas micro-production from human organic waste—A research proposal. Sustainability 2018, 10, 330. [Google Scholar] [CrossRef]
- Scarlat, N.; Dallemand, J.F.; Fahl, F. Biogas: Developments and perspectives in Europe. Renew. Energy 2018, 129, 457–472. [Google Scholar] [CrossRef]
- Scarlat, N.; Fahl, F.; Dallemand, J.F.; Monforti, F.; Motola, V. A spatial analysis of biogas potential from manure in Europe. Renew. Sustain. Energy Rev. 2018, 94, 915–930. [Google Scholar] [CrossRef]
- Prussi, M.; Padella, M.; Conton, M.; Postma, E.D.; Lonza, L. Review of technologies for biomethane production and assessment of Eu transport share in 2030. J. Clean. Prod. 2019, 222, 565–572. [Google Scholar] [CrossRef]
- Ferella, F.; Cucchiella, F.; D’Adamo, I.; Gallucci, K. A techno-economic assessment of biogas upgrading in a developed market. J. Clean. Prod. 2019, 210, 945–957. [Google Scholar] [CrossRef]
- 2030 Climate & Energy Framework—Climate Action. Available online: https://ec.europa.eu/clima/policies/strategies/2030_en (accessed on 8 May 2019).
- Wu, B.; Zhang, X.; Bao, D.; Xu, Y.; Zhang, S.; Deng, L. Biomethane production system: Energetic analysis of various scenarios. Bioresour. Technol. 2016, 206, 155–163. [Google Scholar] [CrossRef]
- Waste Policy Review—Environment—European Commission. Available online: http://ec.europa.eu/environment/waste/target_review.htm (accessed on 8 May 2019).
- Okoro, O.; Sun, Z.; Birch, J. Prognostic Assessment of the Viability of Hydrothermal Liquefaction as a Post-Resource Recovery Step after Enhanced Biomethane Generation Using Co-Digestion Technologies. Appl. Sci. 2018, 8, 2290. [Google Scholar] [CrossRef]
- Falcone, P.M.; Morone, P.; Sica, E. Greening of the financial system and fuelling a sustainability transition. Technol. Forecast. Soc. Chang. 2018, 127, 23–37. [Google Scholar] [CrossRef]
- Falcone, P.M. Analysing stakeholders’ perspectives towards a socio-technical change: The energy transition journey in Gela Municipality. AIMS Energy 2018, 6, 645–657. [Google Scholar] [CrossRef]
- Martin, M.; Wetterlund, E.; Hackl, R.; Holmgren, K.M.; Peck, P. Assessing the aggregated environmental benefits from by-product and utility synergies in the Swedish biofuel industry. Biofuels 2017, 1–16. [Google Scholar] [CrossRef]
- Lazarevic, D.; Martin, M. Life cycle assessment calculative practices in the Swedish biofuel sector: Governing biofuel sustainability by standards and numbers. Bus. Strateg. Environ. 2018, 27, 1558–1568. [Google Scholar] [CrossRef]
- Caruso, C.M.; Braghieri, A.; Capece, A.; Napolitano, F.; Romano, P.; Galgano, F.; Altieri, G.; Genovese, F. Recent Updates on the Use of Agro-Food Waste for Biogas Production. Appl. Sci. 2019, 9, 1217. [Google Scholar] [CrossRef]
- Morales-Polo, C.; del Mar Cledera-Castro, M.; Moratilla Soria, B.Y. Reviewing the Anaerobic Digestion of Food Waste: From Waste Generation and Anaerobic Process to Its Perspectives. Appl. Sci. 2018, 8, 1804. [Google Scholar] [CrossRef]
- Sisto, R.; Sica, E.; Lombardi, M.; Prosperi, M. Organic fraction of municipal solid waste valorisation in southern Italy: The stakeholders’ contribution to a long-term strategy definition. J. Clean. Prod. 2017, 168, 302–310. [Google Scholar] [CrossRef]
- Valenti, F.; Porto, S.M.C.; Selvaggi, R.; Pecorino, B. Evaluation of biomethane potential from by-products and agricultural residues co-digestion in southern Italy. J. Environ. Manag. 2018, 223, 834–840. [Google Scholar] [CrossRef]
- Negri, M.; Bacenetti, J.; Brambilla, M.; Manfredini, A.; Cantore, A.; Bocchi, S. Biomethane production from different crop systems of cereals in Northern Italy. Biomass Bioenergy 2014, 63, 321–329. [Google Scholar] [CrossRef]
- Buratti, C.; Barbanera, M.; Fantozzi, F. Assessment of GHG emissions of biomethane from energy cereal crops in Umbria, Italy. Appl. Energy 2013, 108, 128–136. [Google Scholar] [CrossRef]
- Cucchiella, F.; D’Adamo, I.; Gastaldi, M. An economic analysis of biogas-biomethane chain from animal residues in Italy. J. Clean. Prod. 2019, 230, 888–897. [Google Scholar] [CrossRef]
- Bozzetto, S.; Curlisi, C.; Fabbri, C.; Pezzaglia, M.; Rossi, L.; Sibilla, F. The Development of Biomethane: A Sustainable Choice for the Economy and the Environment. Available online: https://www.consorziobiogas.it/pubblicazioni/ (accessed on 8 December 2018).
- MISE Interministerial Decree of 2 March 2018. Promotion of the Use of Biomethane and Other Advanced Biofuels in the Transportation Sector. Available online: http://www.sviluppoeconomico.gov.it/index.php/en/ (accessed on 9 October 2019).
- Budzianowski, W.M.; Budzianowska, D.A. Economic analysis of biomethane and bioelectricity generation from biogas using different support schemes and plant configurations. Energy 2015, 88, 658–666. [Google Scholar] [CrossRef]
- Stan, C.; Collaguazo, G.; Streche, C.; Apostol, T.; Cocarta, D.M. Pilot-scale anaerobic co-digestion of the OFMSW: Improving biogas production and startup. Sustainability 2018, 10, 1939. [Google Scholar] [CrossRef]
- Surra, E.; Bernardo, M.; Lapa, N.; Esteves, I.; Fonseca, I.; Mota, J.P. Maize cob waste pre-treatments to enhance biogas production through co-anaerobic digestion with OFMSW. Waste Manag. 2018, 72, 193–205. [Google Scholar] [CrossRef] [PubMed]
- Ge, X.; Matsumoto, T.; Keith, L.; Li, Y. Biogas energy production from tropical biomass wastes by anaerobic digestion. Bioresour. Technol. 2014, 169, 38–44. [Google Scholar] [CrossRef]
- Tyagi, V.K.; Fdez-Güelfo, L.A.; Zhou, Y.; Álvarez-Gallego, C.J.; Garcia, L.I.R.; Ng, W.J. Anaerobic co-digestion of organic fraction of municipal solid waste (OFMSW): Progress and challenges. Renew. Sustain. Energy Rev. 2018, 93, 380–399. [Google Scholar] [CrossRef]
- DENA The Role of Natural Gas and Biomethane in the Fuel Mix of the Future in Germany. Available online: https://www.dena.de/en/home/ (accessed on 5 January 2018).
- Valli, L.; Rossi, L.; Fabbri, C.; Sibilla, F.; Gattoni, P.; Dale, B.E.; Kim, S.; Ong, R.G.; Bozzetto, S. Greenhouse gas emissions of electricity and biomethane produced using the BiogasdonerightTM system: Four case studies from Italy. Biofuels Bioprod. Biorefin. 2017, 11, 847–860. [Google Scholar] [CrossRef]
- Adelt, M.; Wolf, D.; Vogel, A. LCA of biomethane. J. Nat. Gas Sci. Eng. 2011, 3, 646–650. [Google Scholar] [CrossRef]
- Arteconi, A.; Spitoni, M.; Polonara, F.; Spigarelli, F. The feasibility of liquefied biomethane as alternative fuel: A comparison between European and Chinese markets. Int. J. Ambient Energy 2017, 38, 481–488. [Google Scholar] [CrossRef]
- Billig, E.; Thraen, D. Renewable methane—A technology evaluation by multi-criteria decision making from a European perspective. Energy 2017, 139, 468–484. [Google Scholar] [CrossRef]
- IRENA. Biogas for Road Vehicles Technology Brief; IRENA: Abu Dhabi, UAE, 2017. [Google Scholar]
- Horschig, T.; Welfle, A.; Billig, E.; Thrän, D. From Paris agreement to business cases for upgraded biogas: Analysis of potential market uptake for biomethane plants in Germany using biogenic carbon capture and utilization technologies. Biomass Bioenergy 2019, 120, 313–323. [Google Scholar] [CrossRef]
- Patrizio, P.; Leduc, S.; Chinese, D.; Dotzauer, E.; Kraxner, F. Biomethane as transport fuel—A comparison with other biogas utilization pathways in northern Italy. Appl. Energy 2015, 157, 25–34. [Google Scholar] [CrossRef]
- Starr, K.; Ramirez, A.; Meerman, H.; Villalba, G.; Gabarrell, X. Explorative economic analysis of a novel biogas upgrading technology using carbon mineralization. A case study for Spain. Energy 2015, 79, 298–309. [Google Scholar] [CrossRef]
- Rajendran, K.; O’Gallachoir, B.; Murphy, J.D. The combined role of policy and incentives in promoting cost efficient decarbonisation of energy: A case study for biomethane. J. Clean. Prod. 2019, 219, 278–290. [Google Scholar] [CrossRef]
- Lee, D.H. Evaluation the financial feasibility of biogas upgrading to biomethane, heat, CHP and AwR. Int. J. Hydrog. Energy 2017, 42, 27718–27731. [Google Scholar] [CrossRef]
- Chan Gutiérrez, E.; Wall, D.M.; O’Shea, R.; Novelo, R.M.; Gómez, M.M.; Murphy, J.D. An economic and carbon analysis of biomethane production from food waste to be used as a transport fuel in Mexico. J. Clean. Prod. 2018, 196, 852–862. [Google Scholar] [CrossRef]
- O’Shea, R.; Wall, D.; Kilgallon, I.; Murphy, J.D. Assessment of the impact of incentives and of scale on the build order and location of biomethane facilities and the feedstock they utilise. Appl. Energy 2016, 182, 394–408. [Google Scholar] [CrossRef]
- Cucchiella, F.; D’Adamo, I.; Gastaldi, M.; Miliacca, M. A profitability analysis of small-scale plants for biomethane injection into the gas grid. J. Clean. Prod. 2018, 184, 179–187. [Google Scholar] [CrossRef]
- Cucchiella, F.; D’Adamo, I.; Gastaldi, M. Future trajectories of renewable energy consumption in the European Union. Resources 2018, 7, 10. [Google Scholar] [CrossRef]
- Barbera, E.; Menegon, S.; Banzato, D.; D’Alpaos, C.; Bertucco, A. From biogas to biomethane: A process simulation-based techno-economic comparison of different upgrading technologies in the Italian context. Renew. Energy 2019, 135, 663–673. [Google Scholar] [CrossRef]
- European Commission Circular Economy: New Rules Will Make EU the Global Front-Runner in Waste Management and Recycling. Available online: http://europa.eu/rapid/press-release_IP-18-3846_en.htm (accessed on 23 December 2018).
- ISPRA Urban Waste Report. Available online: http://www.isprambiente.gov.it/it (accessed on 9 October 2018).
- Lauer, M.; Hansen, J.K.; Lamers, P.; Thrän, D. Making money from waste: The economic viability of producing biogas and biomethane in the Idaho dairy industry. Appl. Energy 2018, 222, 621–636. [Google Scholar] [CrossRef]
- Rada, E.C.; Zatelli, C.; Cioca, L.I.; Torretta, V. Selective collection quality index for municipal solid waste management. Sustainability 2018, 10, 257. [Google Scholar] [CrossRef]
- Di Matteo, U.; Nastasi, B.; Albo, A.; Astiaso Garcia, D. Energy contribution of OFMSW (Organic Fraction of Municipal Solid Waste) to energy-environmental sustainability in urban areas at small scale. Energies 2017, 10, 229. [Google Scholar] [CrossRef]
- Chien Bong, C.P.; Ho, W.S.; Hashim, H.; Lim, J.S.; Ho, C.S.; Peng Tan, W.S.; Lee, C.T. Review on the renewable energy and solid waste management policies towards biogas development in Malaysia. Renew. Sustain. Energy Rev. 2017, 70, 988–998. [Google Scholar] [CrossRef]
- Browne, J.; Nizami, A.S.; Thamsiriroj, T.; Murphy, J.D. Assessing the cost of biofuel production with increasing penetration of the transport fuel market: A case study of gaseous biomethane in Ireland. Renew. Sustain. Energy Rev. 2011, 15, 4537–4547. [Google Scholar] [CrossRef]
- Li, Y.; Park, S.Y.; Zhu, J. Solid-state anaerobic digestion for methane production from organic waste. Renew. Sustain. Energy Rev. 2011, 15, 821–826. [Google Scholar] [CrossRef]
- Montello Spa Recycling of Organic Waste. Available online: http://www.montello-spa.it/ (accessed on 5 October 2018).
- Matheri, A.N.; Sethunya, V.L.; Belaid, M.; Muzenda, E. Analysis of the biogas productivity from dry anaerobic digestion of organic fraction of municipal solid waste. Renew. Sustain. Energy Rev. 2018, 81, 2328–2334. [Google Scholar] [CrossRef]
- De Clercq, D.; Wen, Z.; Fei, F. Economic performance evaluation of bio-waste treatment technology at the facility level. Resour. Conserv. Recycl. 2017, 116, 178–184. [Google Scholar] [CrossRef]
- Bortoluzzi, G.; Gatti, M.; Sogni, A.; Consonni, S. Biomethane production from agricultural resources in the Italian scenario: Techno-Economic analysis of water wash. Chem. Eng. Trans. 2014, 37, 259–264. [Google Scholar]
- Uusitalo, V.; Soukka, R.; Horttanainen, M.; Niskanen, A.; Havukainen, J. Economics and greenhouse gas balance of biogas use systems in the Finnish transportation sector. Renew. Energy 2013, 51, 132–140. [Google Scholar] [CrossRef]
- Hagman, L.; Blumenthal, A.; Eklund, M.; Svensson, N. The role of biogas solutions in sustainable biorefineries. J. Clean. Prod. 2018, 172, 3982–3989. [Google Scholar] [CrossRef] [Green Version]
- Smyth, B.M.; Smyth, H.; Murphy, J.D. Can grass biomethane be an economically viable biofuel for the farmer and the consumer? Biofuels Bioprod. Biorefin. 2010, 4, 519–537. [Google Scholar] [CrossRef]
- Ferella, F.; Puca, A.; Taglieri, G.; Rossi, L.; Gallucci, K. Separation of carbon dioxide for biogas upgrading to biomethane. J. Clean. Prod. 2017, 164, 1205–1218. [Google Scholar] [CrossRef]
- De Clercq, D.; Wen, Z.; Fan, F. Performance evaluation of restaurant food waste and biowaste to biogas pilot projects in China and implications for national policy. J. Environ. Manag. 2017, 189, 115–124. [Google Scholar] [CrossRef]
- Chinnici, G.; Selvaggi, R.; D’Amico, M.; Pecorino, B. Assessment of the potential energy supply and biomethane from the anaerobic digestion of agro-food feedstocks in Sicily. Renew. Sustain. Energy Rev. 2018, 82, 6–13. [Google Scholar] [CrossRef]
- Budzianowski, W.M.; Brodacka, M. Biomethane storage: Evaluation of technologies, end uses, business models, and sustainability. Energy Convers. Manag. 2017, 141, 254–273. [Google Scholar] [CrossRef]
- Sgroi, F.; Foderà, M.; Di Trapani, A.M.; Tudisca, S.; Testa, R. Cost-benefit analysis: A comparison between conventional and organic olive growing in the Mediterranean Area. Ecol. Eng. 2015, 82, 542–546. [Google Scholar] [CrossRef]
- Fu, Q.; Yan, H.; Shen, Y.; Qin, Y.; Zhang, D.; Zhou, Y. Optimal design and control of pressure swing adsorption process for N2/CH4 separation. J. Clean. Prod. 2018, 170, 704–714. [Google Scholar] [CrossRef]
- Morero, B.; Vicentin, R.; Campanella, E.A. Assessment of biogas production in Argentina from co-digestion of sludge and municipal solid waste. Waste Manag. 2017, 61, 195–205. [Google Scholar] [CrossRef]
- Riva, C.; Schievano, A.; D’Imporzano, G.; Adani, F. Production costs and operative margins in electric energy generation from biogas. Full-scale case studies in Italy. Waste Manag. 2014, 34, 1429–1435. [Google Scholar] [CrossRef]
- Schievano, A.; D’Imporzano, G.; Adani, F. Substituting energy crops with organic wastes and agro-industrial residues for biogas production. J. Environ. Manag. 2009, 90, 2537–2541. [Google Scholar] [CrossRef]
- Massarutto, A.; Marangon, F.; Troiano, S.; Favot, M. Moral duty, warm glow or self-interest? A choice experiment study on motivations for domestic garbage sorting in Italy. J. Clean. Prod. 2019, 208, 916–923. [Google Scholar] [CrossRef]
- Horschig, T.; Adams, P.W.R.; Gawel, E.; Thrän, D. How to decarbonize the natural gas sector: A dynamic simulation approach for the market development estimation of renewable gas in Germany. Appl. Energy 2018, 213, 555–572. [Google Scholar] [CrossRef]
- O’Shea, R.; Wall, D.M.; Kilgallon, I.; Browne, J.D.; Murphy, J.D. Assessing the total theoretical, and financially viable, resource of biomethane for injection to a natural gas network in a region. Appl. Energy 2017, 188, 237–256. [Google Scholar] [CrossRef]
- Gil-Carrera, L.; Browne, J.D.; Kilgallon, I.; Murphy, J.D. Feasibility study of an off-grid biomethane mobile solution for agri-waste. Appl. Energy 2019, 239, 471–481. [Google Scholar] [CrossRef]
- European Commission Subject: State Aid SA.48424 (2017/N)—Italy—Support Scheme for the Production and Distribution of Advanced Biomethane and Other Advanced Biofuels for Use in the Transport Sector; Europese Commission: Brussels, Belgium, 2017.
- Ardolino, F.; Parrillo, F.; Arena, U. Biowaste-to-biomethane or biowaste-to-energy? An LCA study on anaerobic digestion of organic waste. J. Clean. Prod. 2018, 174, 462–476. [Google Scholar] [CrossRef]
- Singlitico, A.; Goggins, J.; Monaghan, R.F.D. The role of life cycle assessment in the sustainable transition to a decarbonised gas network through green gas production. Renew. Sustain. Energy Rev. 2019, 99, 16–28. [Google Scholar] [CrossRef]
- European Biogas Association EBA Statistical Report 2017. Available online: http://european-biogas.eu/ (accessed on 23 December 2018).
Figure 1.
Map of the biogas–biomethane chain. Adapted from the literature [27].
Figure 1.
Map of the biogas–biomethane chain. Adapted from the literature [27].

Figure 2.
Map of 15 Italian municipalities.

Figure 3.
Profitability analysis of biomethane plants (thousand €)—baseline scenario. NPV—net present value.
Figure 3.
Profitability analysis of biomethane plants (thousand €)—baseline scenario. NPV—net present value.

Figure 4.
Distribution of discounted cash flows (%)—baseline scenario. OFMSW—organic fraction of municipal solid waste.
Figure 4.
Distribution of discounted cash flows (%)—baseline scenario. OFMSW—organic fraction of municipal solid waste.

Figure 5.
NPV/size (thousand € for m3/h)—baseline and alternative scenarios.

Figure 6.
Economic benefits (million €) in the 15 municipalities from managing the OFMSW—alternative scenario (joint implementation biomethane producer and methane distributor).
Figure 6.
Economic benefits (million €) in the 15 municipalities from managing the OFMSW—alternative scenario (joint implementation biomethane producer and methane distributor).


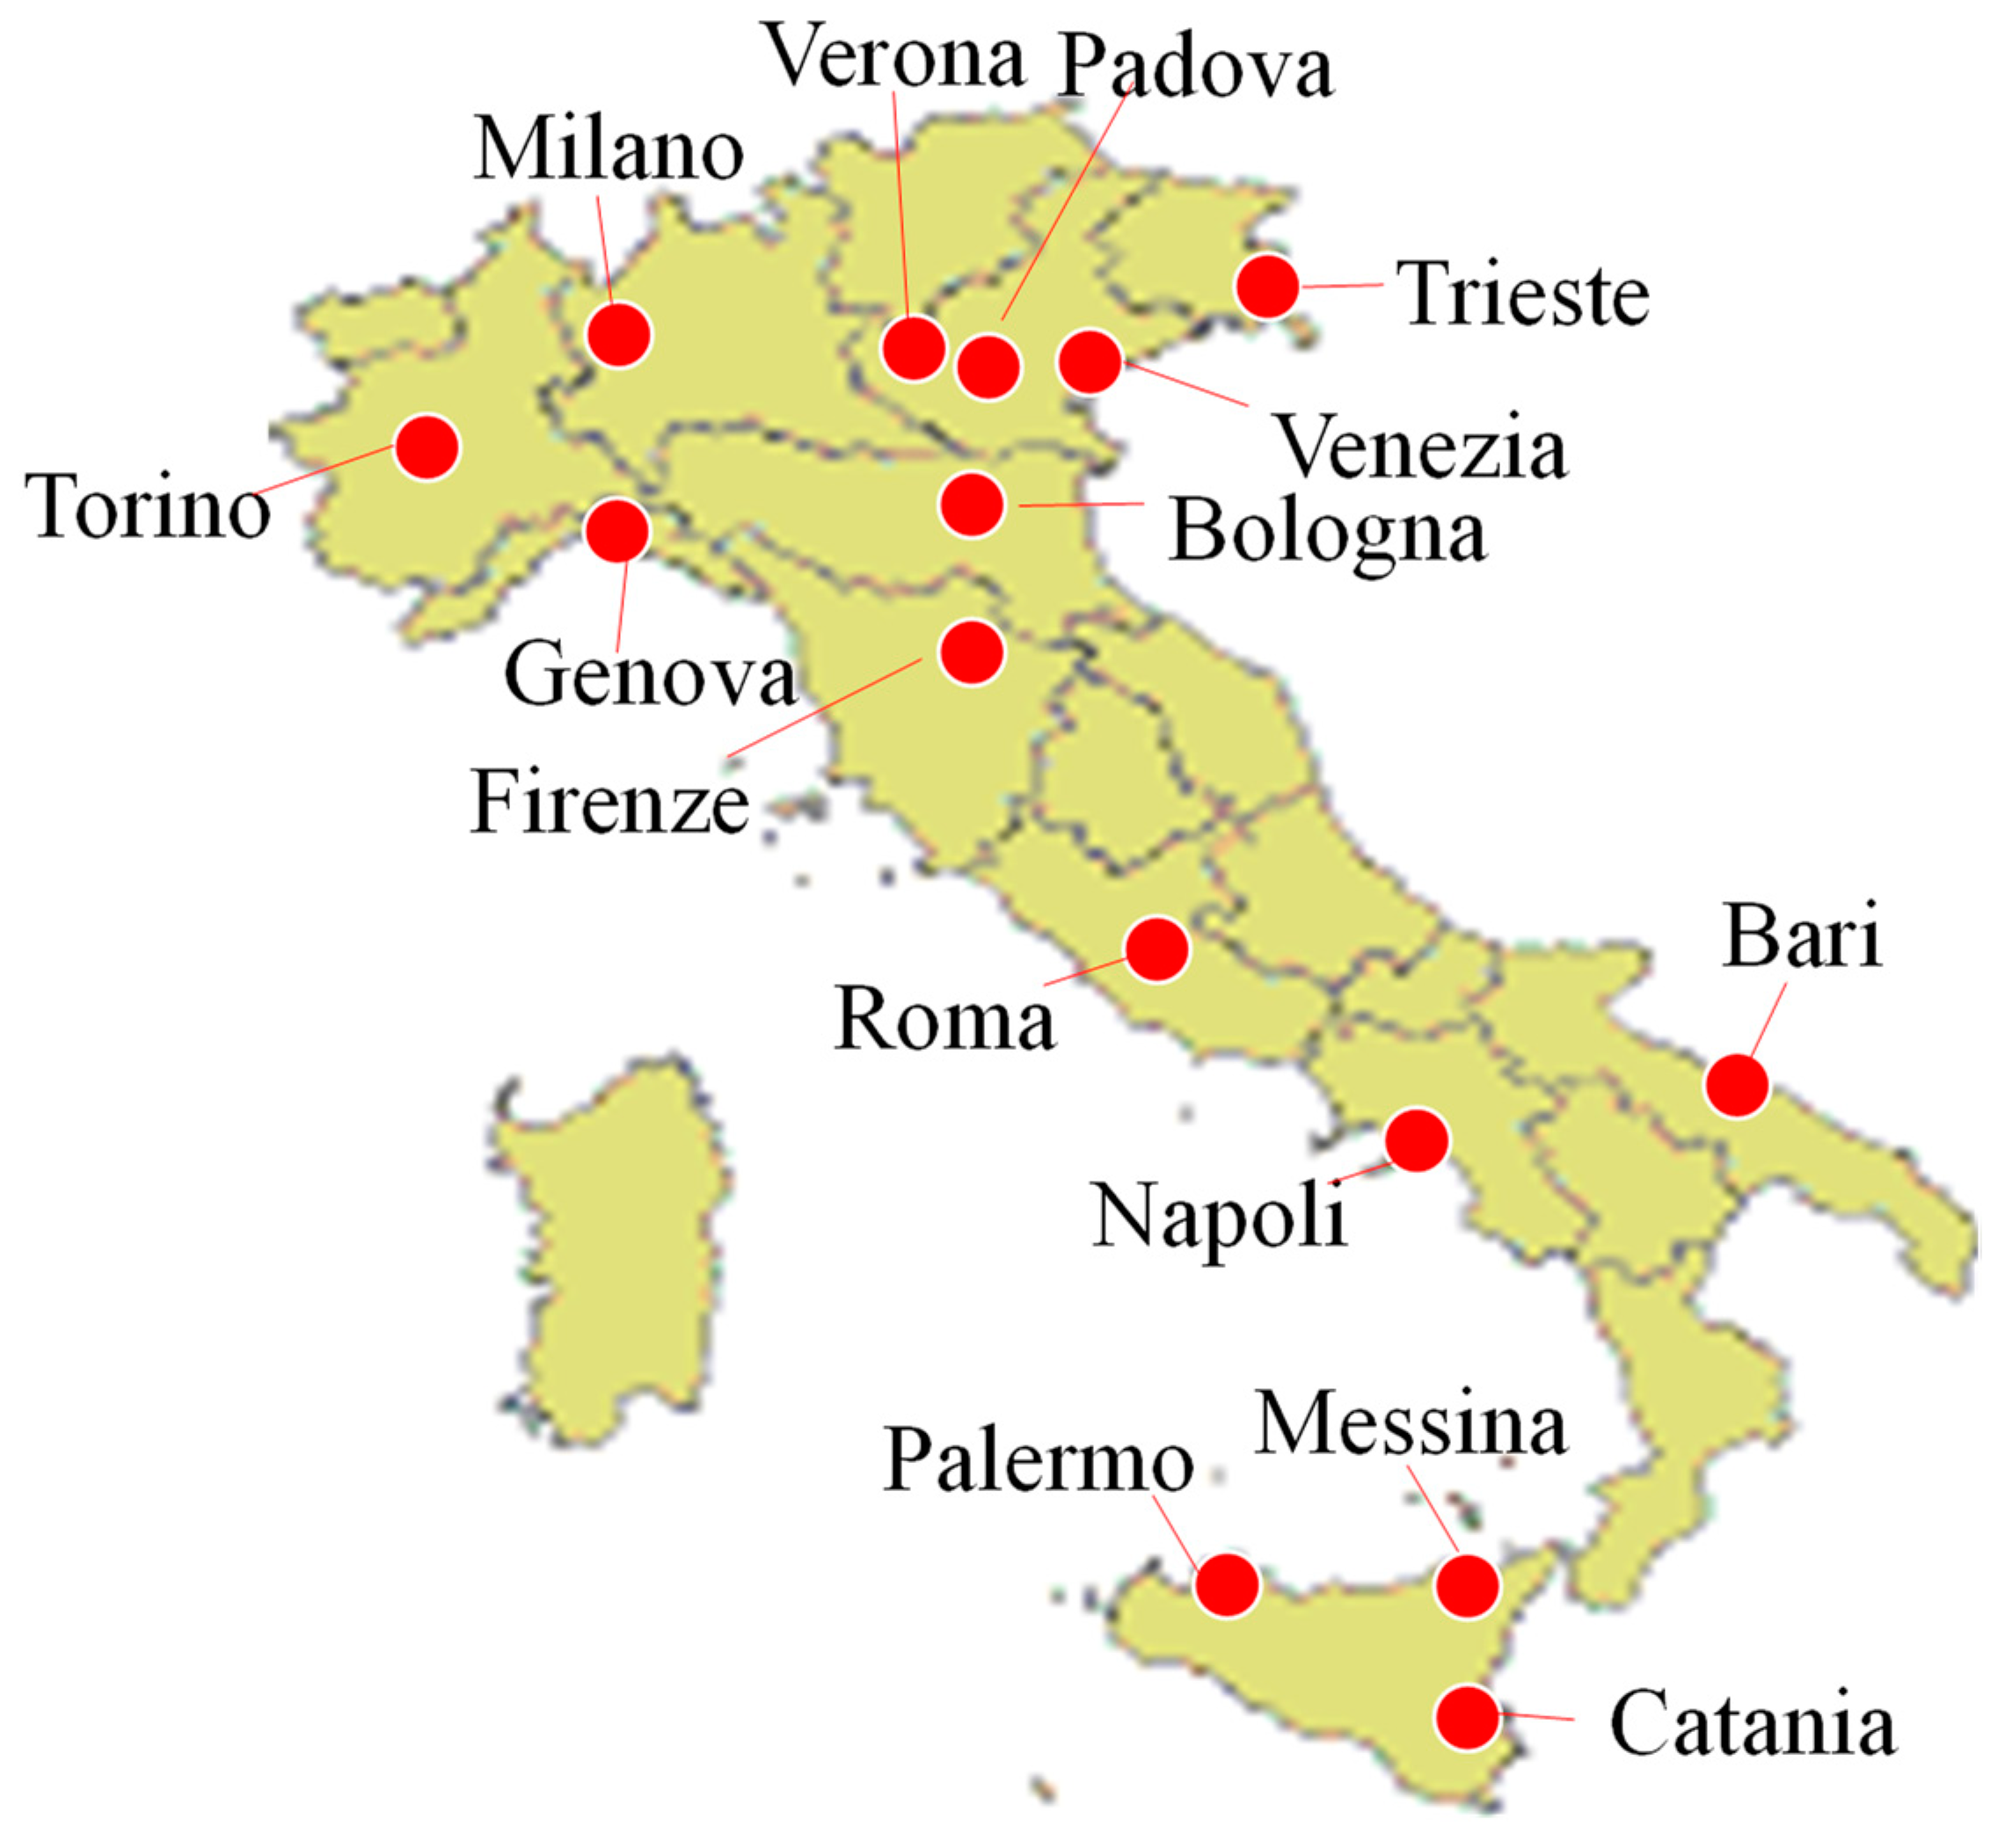
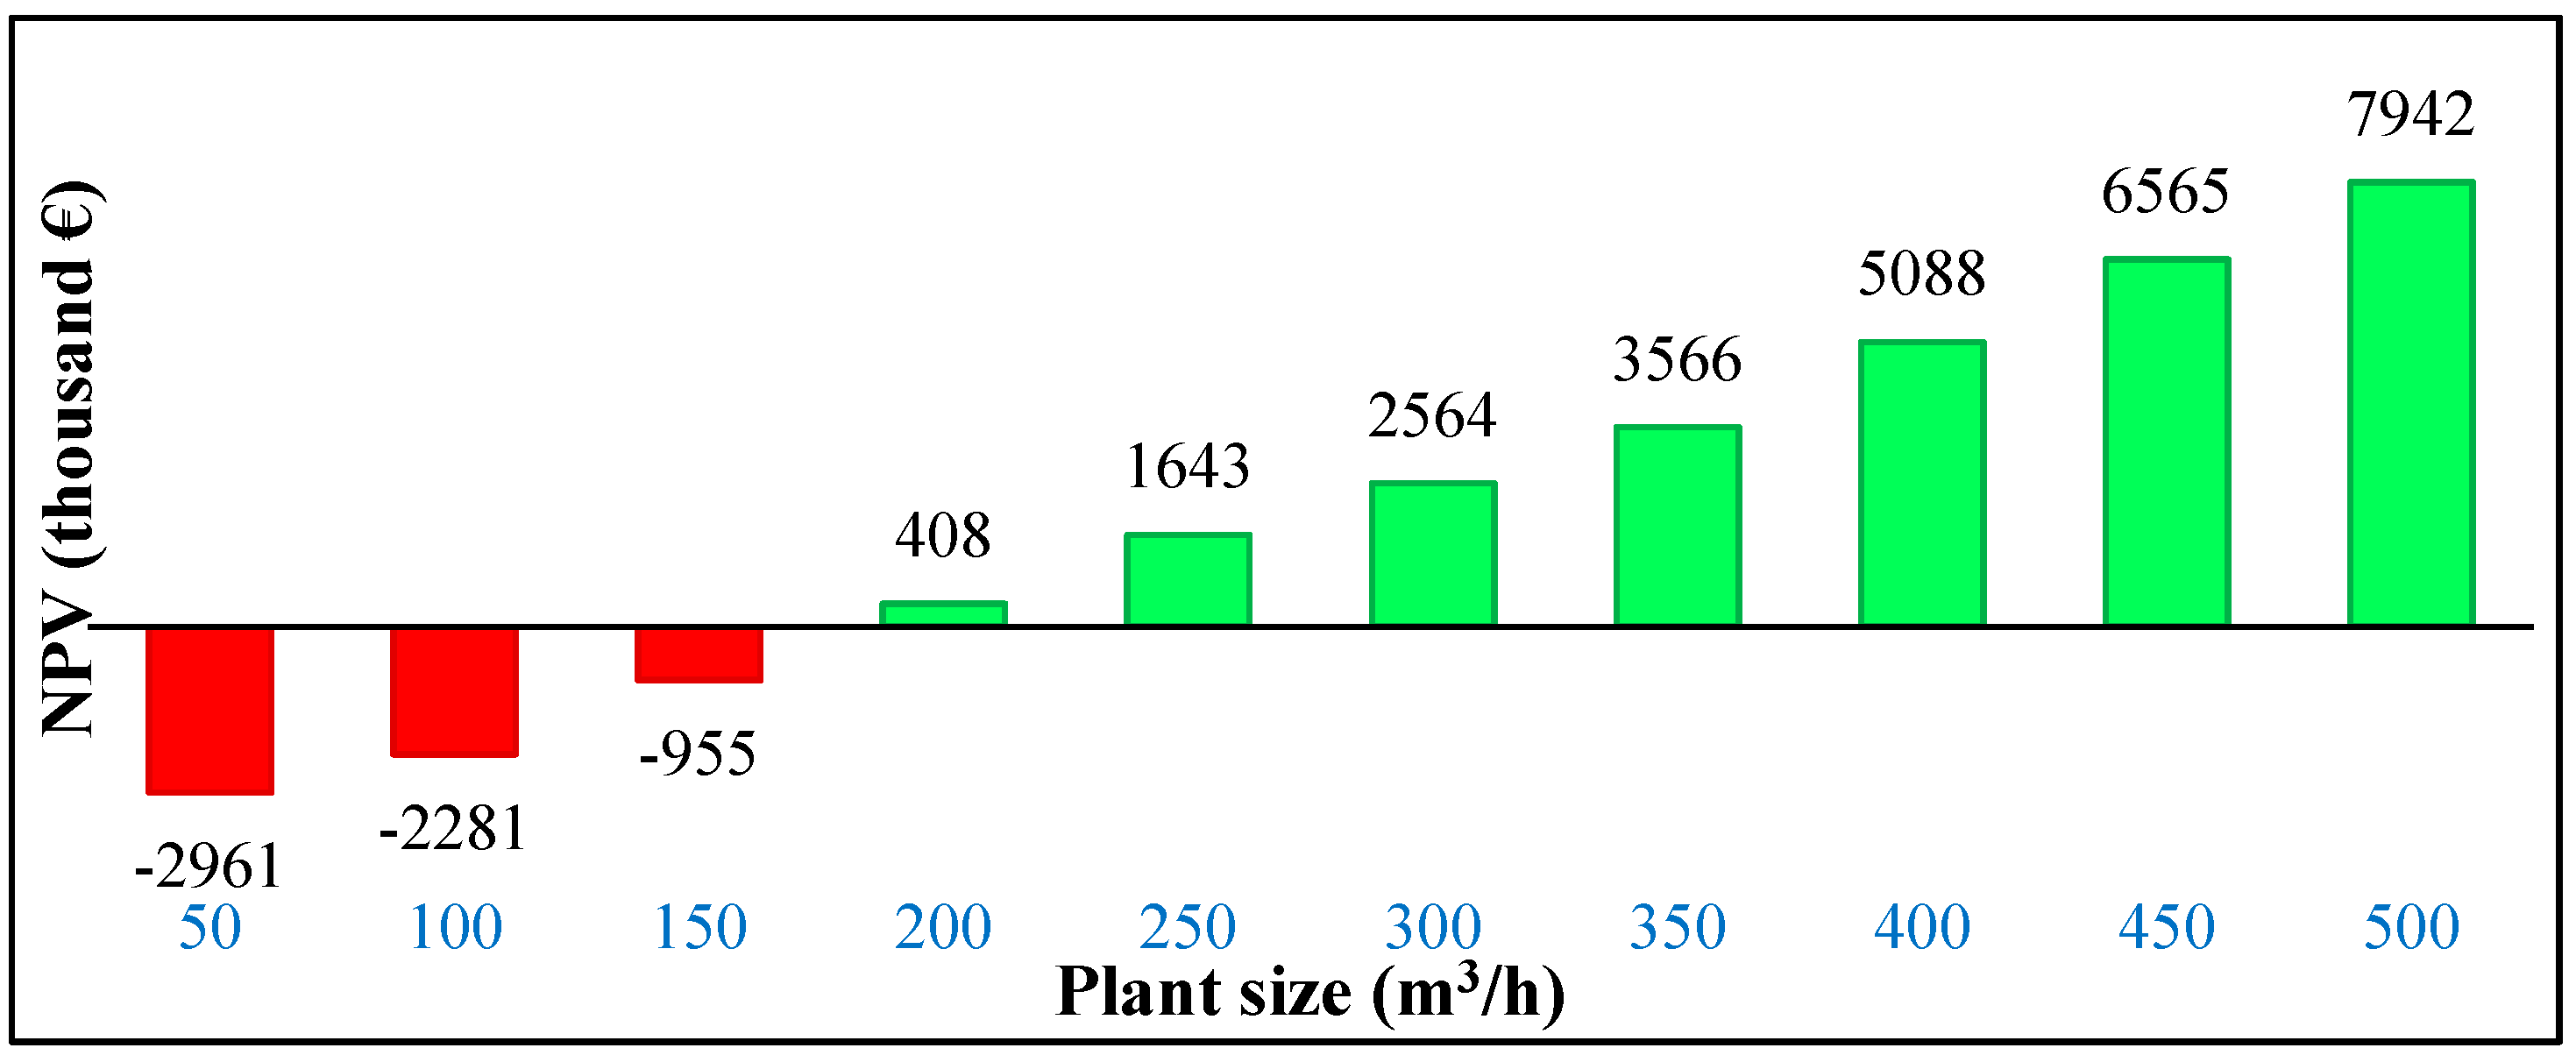
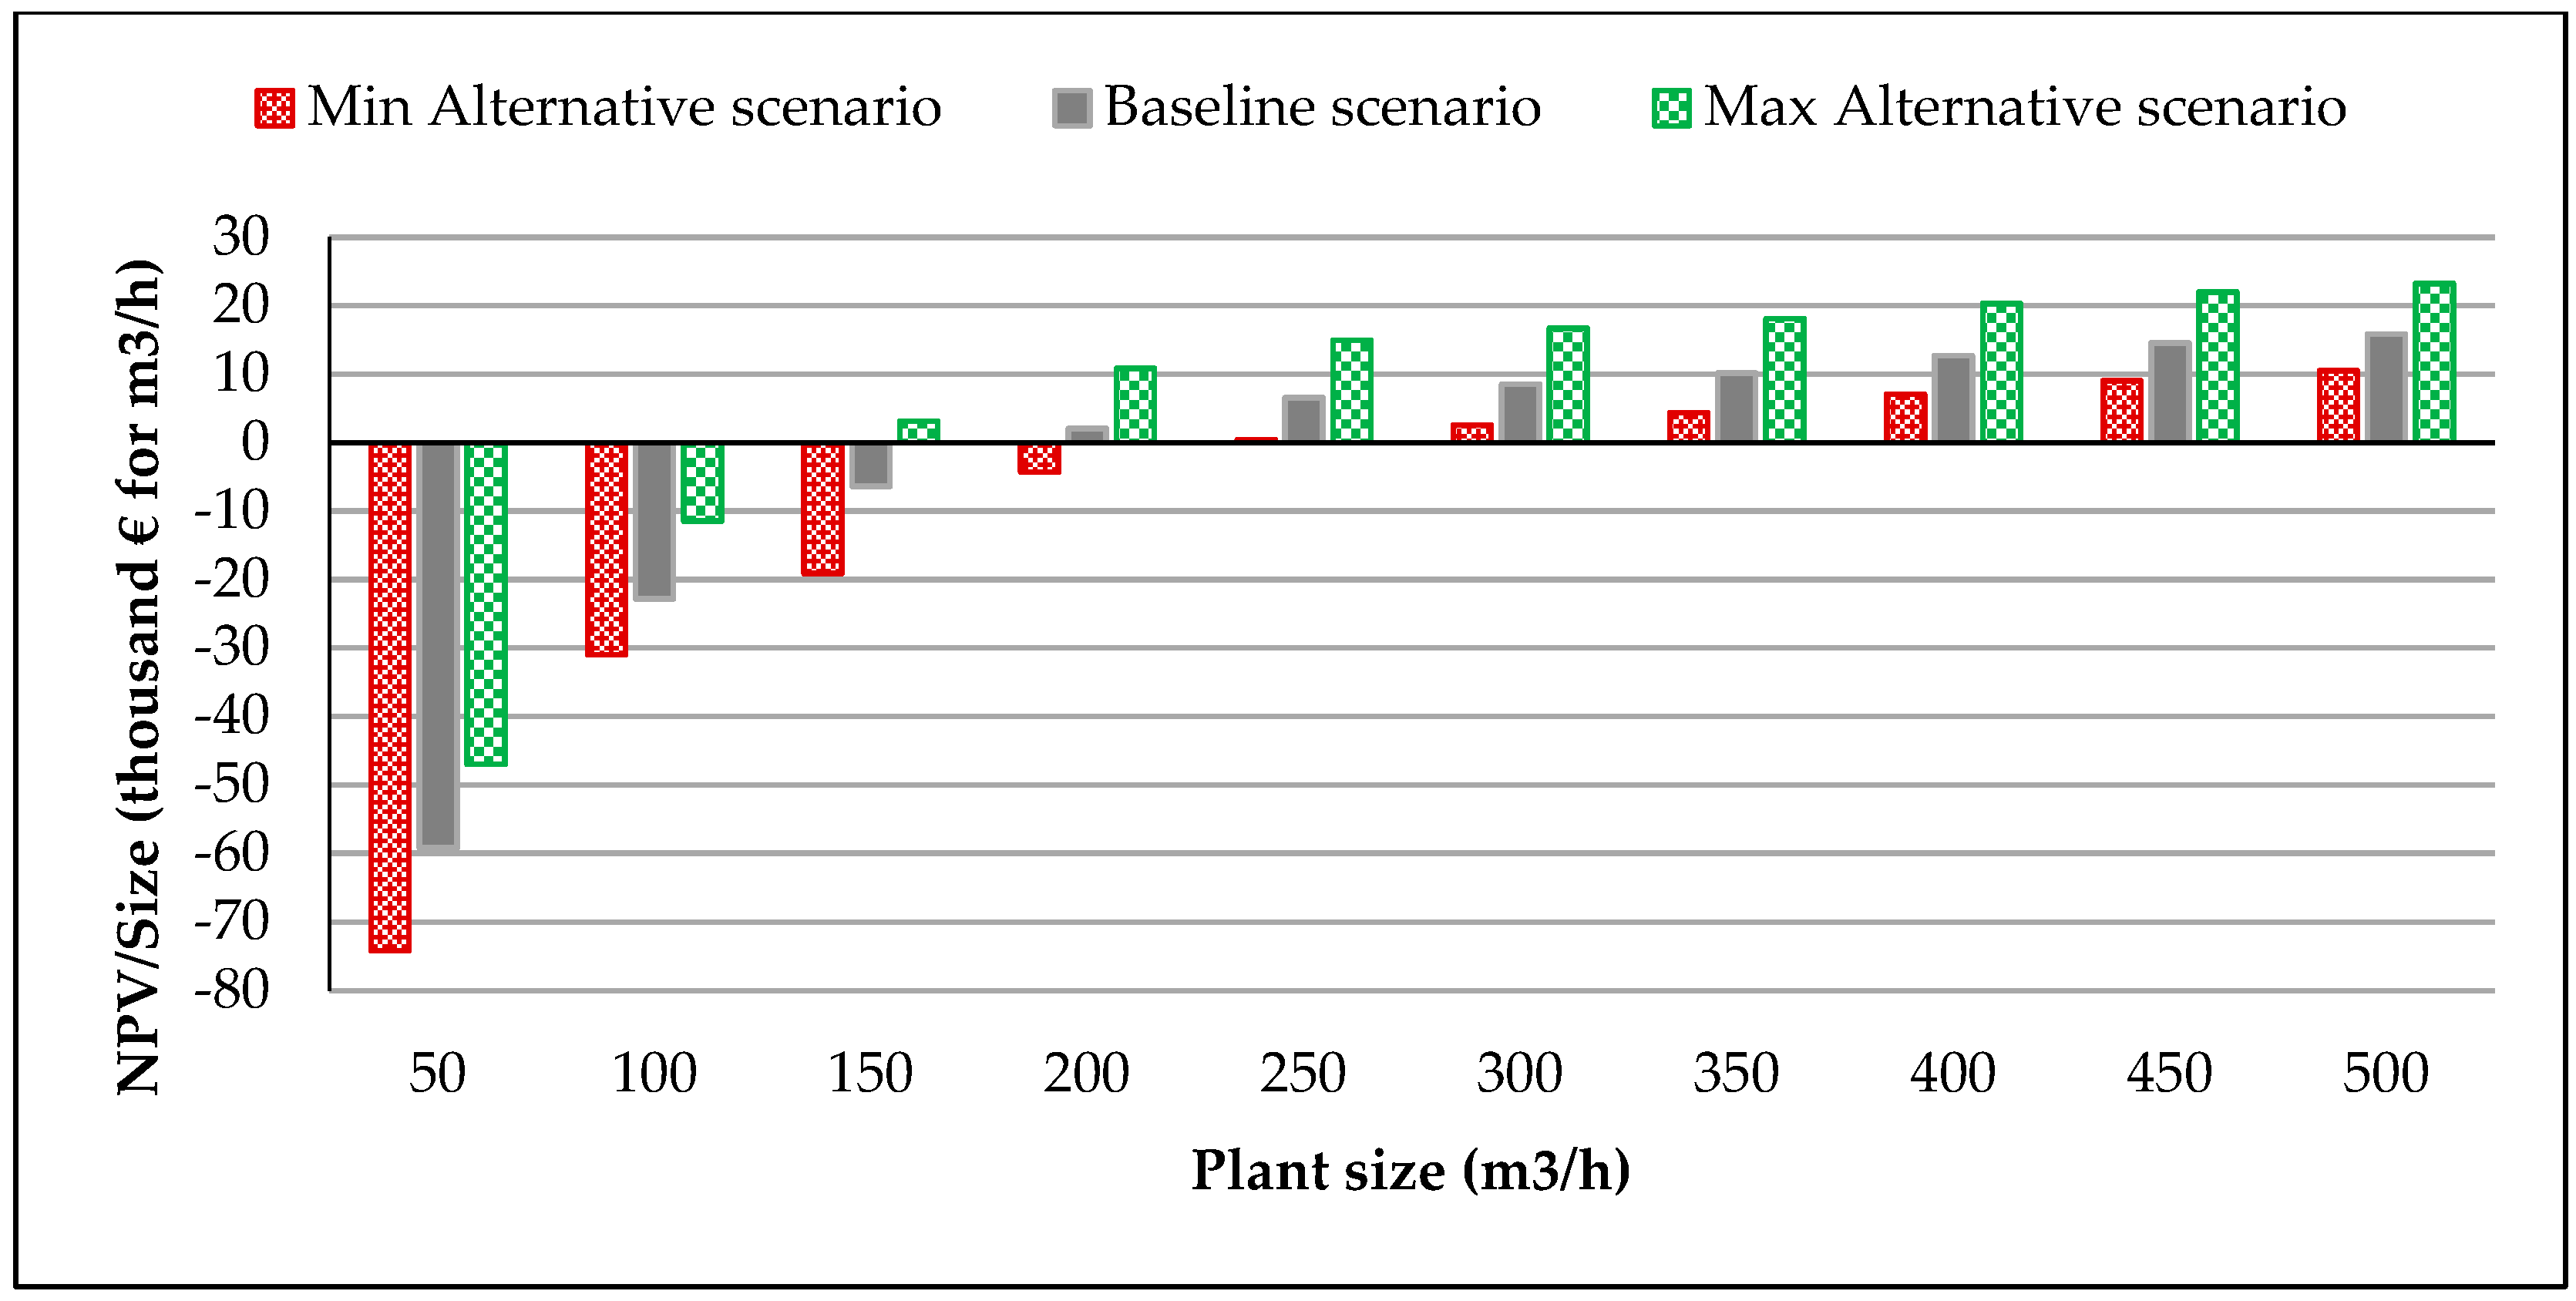
Table 1.
Literature review—economic analysis of biomethane plants. USD—United States Dollar.
| Indicator | Value | Reference |
|---|---|---|
| Biomethane cost production | 0.54–0.73 €/m3 | [17] |
| Biomethane cost production | 0.71–0.75 €/m3 | [53] |
| Biogas cost production | 0.38–0.56 €/m3 | [54] |
| Biomethane cost production | 0.5–1.5 $US/m3 | [55] |
| Carbon price (subsidies) | 70 €/ton of CO2 | [57] |
| Carbon price (subsidies) | 99 €/ton of CO2 | [58] |
| Carbon price (subsidies) | 180–260 €/ton of CO2 | [59] |
| Net present value | (−585)–5667 K$US | [61] |
| Net present value | 0.49–132.7 M€ | [62] |
| Net present value | 616 K€ | [63] |
| Net present value | (−341)–1174 K€ | [64] |
| Net present value | 1498–3200 K€ | [65] |
| Discounted payback time | 3–5 years | [65] |
| Net present value | (−2412)–2868 K€ | [27] |
| Discounted payback time | <1 year | [27] |
Table 2.
Statistical data in Italy regarding municipal solid waste (MSW) [67]. OFMSW—organic fraction of municipal solid waste; SC—separated collection.
Table 2.
Statistical data in Italy regarding municipal solid waste (MSW) [67]. OFMSW—organic fraction of municipal solid waste; SC—separated collection.
| 2015 (1000*tons) | 2016 (1000*tons) | 2015 (kg/capita) | 2016 (kg/capita) | |
|---|---|---|---|---|
| Total MSW | 29,524.3 | 30,116.6 | 486.7 | 497.1 |
| Total SC of MSW | 14,020.9 | 15,821.9 | 231.1 | 261.1 |
| Total OFMSW | 6071.5 | 6516.9 | 100.1 | 107.6 |
Table 3.
Statistical data in 15 Italian municipalities in 2016 [67].
Table 3.
Statistical data in 15 Italian municipalities in 2016 [67].
| Total MSW (tons) | Collection Rate (%) | Total OFMSW (tons) | OFMSW (kg/capita) | |
|---|---|---|---|---|
| Torino | 427,741 | 42.1 | 53,312 | 60.1 |
| Milano | 679,278 | 57.6 | 139,740 | 103.4 |
| Verona | 138,787 | 55.3 | 25,223 | 98.0 |
| Venezia | 166,601 | 57.0 | 35,904 | 137.1 |
| Padova | 124,588 | 55.2 | 26,460 | 126.1 |
| Trieste | 94,104 | 40.2 | 8570 | 42.0 |
| Genova | 287,287 | 33.5 | 17,802 | 30.5 |
| Bologna | 223,011 | 46.0 | 22,834 | 58.8 |
| Firenze | 240,573 | 50.3 | 46,518 | 121.7 |
| Roma | 1,689,206 | 42.0 | 255,161 | 88.8 |
| Napoli | 519,421 | 31.3 | 58,017 | 59.8 |
| Bari | 191,328 | 36.7 | 16,309 | 50.3 |
| Palermo | 347,008 | 7.2 | 8458 | 12.6 |
| Messina | 113,442 | 11.2 | 2139 | 9.0 |
| Catania | 218,213 | 10.3 | 4457 | 14.2 |
Table 4.
Input assumptions.
| Variable | Value | Reference |
|---|---|---|
| 2 | [44] | |
| 1231 m3 | [65] | |
| 0.13 kWh/m3 | [77] | |
| 0.29 kWh/m3 | [72] | |
| 53,000 € | [78] | |
| 680,000–2,250,000 € | [79] | |
| 237,500 € | [80] | |
| 4000–5000 €/kW | [27] | |
| 2250–6300 €/(m3/h) | [27] | |
| 25,000 €/y | [63] | |
| 47,000 €/y | [78] | |
| 45,000–440,000 €/y | [79] | |
| 20,000 €/y | [80] | |
| 0 € | [81] | |
| 49 €/ton | [27] | |
| 2–3 €/ton | [81] | |
| 1.84 kg/m3 | [82] | |
| 0.0105 MWh/m3 | [63] | |
| CIC | 375 € | [44] |
| 0.305 €/m3 | [44] | |
| Inf | 2% | [27] |
| 6% | [80] | |
| 1.5% | [80] | |
| N | 20 y | [27] |
| 15 y | [83] | |
| 8000 h | [83] | |
| 6 | [81] | |
| 10 y | [44] | |
| see Section 3.2 | [25] | |
| see Section 3.5 | [44] | |
| see Section 3.4 | [27] | |
| 10 €/ton | [79] | |
| 50 €/ton | [84] | |
| 10% | [82] | |
| 0.13 €/kWh | [79] | |
| 1% | [84] | |
| 20% | [85] | |
| 10% | [84] | |
| see Section 3.5 | [72] | |
| 40% | [63] | |
| 800 €/ton | [81] | |
| 2000–15,000 tons | [82] | |
| see Section 3.2 | ||
| 50 ton/y | [81] | |
| r | 5% | [27] |
| 97% | [42] | |
| 97% | [81] | |
| rd | 3% | [83] |
| . | 70 €/ton | [27] |
| Sbiogas | 150–1500 kW | |
| Sbiomethane | 50–500 m3/h | |
| 60% | [86] | |
| 47% | [87] | |
| 5% | [44] |
Table 5.
Profitability analysis of biomethane plants (thousand €)—alternative scenarios.
| 50 m3/h | −3079 | −2764 | −3284 | −2713 | −3710 | −2348 |
| 100 m3/h | −2518 | −1888 | −2777 | −1789 | −3098 | −1147 |
| 150 m3/h | −1311 | −366 | −1533 | −377 | −2868 | 473 |
| 200 m3/h | −67 | 1115 | −363 | 1153 | −863 | 2172 |
| 250 m3/h | 1082 | 2444 | 729 | 2511 | 107 | 3733 |
| 300 m3/h | 1913 | 3483 | 1494 | 3586 | 777 | 5005 |
| 350 m3/h | 2849 | 4581 | 2352 | 4733 | 1532 | 6331 |
| 400 m3/h | 4312 | 6131 | 3735 | 6373 | 2824 | 8131 |
| 450 m3/h | 5736 | 7657 | 5079 | 7935 | 4080 | 9908 |
| 500 m3/h | 7073 | 9126 | 6337 | 9434 | 5249 | 11,626 |
Table 6.
Profitability analysis of biomethane plants (thousand €)—point of sale scenarios.
| Rpos | |||
|---|---|---|---|
| 50 m3/h | −3011 | −3650 | −2659 |
| 100 m3/h | −1862 | −3068 | −1296 |
| 150 m3/h | −481 | −1972 | 340 |
| 200 m3/h | 1147 | −966 | 2019 |
| 250 m3/h | 2649 | 242 | 3898 |
| 300 m3/h | 3891 | 1060 | 5366 |
| 350 m3/h | 5390 | 2124 | 7065 |
| 400 m3/h | 7015 | 3335 | 8848 |
| 450 m3/h | 8679 | 4626 | 10,657 |
| 500 m3/h | 10473 | 6071 | 12,607 |
Table 7.
Potential amount of the OFMSW conferred to biomethane plants (tons).
| Scenarios | As Is | To Be—65%SC | To Be—65%SC 40% OFMSW | To Be—110 kg/Inhabitant |
|---|---|---|---|---|
| Torino | 53,312 | 82,480 | 111,213 | 97,552 |
| Milano | 139,740 | 157,689 | 176,612 | 148,672 |
| Verona | 25,223 | 29,851 | 36,085 | 28,309 |
| Venezia | 35,904 | 41,480 | 43,316 | 28,810 |
| Padova | 26,460 | 31,518 | 32,393 | 23,081 |
| Trieste | 8570 | 14,075 | 24,467 | 22,466 |
| Genova | 17,802 | 35,196 | 74,695 | 64,196 |
| Bologna | 22,834 | 32,486 | 57,983 | 42,720 |
| Firenze | 46,518 | 62,339 | 62,549 | 42,049 |
| Roma | 255,161 | 400,301 | 439,194 | 316,084 |
| Napoli | 58,017 | 128,481 | 135,049 | 106,721 |
| Bari | 16,309 | 29,397 | 49,745 | 35,662 |
| Palermo | 8458 | 77,453 | 90,222 | 74,111 |
| Messina | 2139 | 12,388 | 29,495 | 26,066 |
| Catania | 4457 | 28,911 | 56,735 | 34,473 |
| Total | 720,904 | 1,164,045 | 1,419,753 | 1,090,970 |
Table 8.
Potential biomethane productivity (m3/h).
| Scenarios | As Is | To Be—65%SC | To Be—65%SC 40% OFMSW | To Be—110 kg/Inhabitant |
|---|---|---|---|---|
| Torino | 500 | 773 | 1043 | 915 |
| Milano | 1310 | 1478 | 1656 | 1394 |
| Verona | 236 | 280 | 338 | 265 |
| Venezia | 337 | 389 | 406 | 270 |
| Padova | 248 | 295 | 304 | 216 |
| Trieste | 80 | 132 | 229 | 211 |
| Genova | 167 | 330 | 700 | 602 |
| Bologna | 214 | 305 | 544 | 401 |
| Firenze | 436 | 584 | 586 | 394 |
| Roma | 2392 | 3753 | 4117 | 2963 |
| Napoli | 544 | 1205 | 1266 | 1001 |
| Bari | 153 | 276 | 466 | 334 |
| Palermo | 79 | 726 | 846 | 695 |
| Messina | 20 | 116 | 277 | 244 |
| Catania | 42 | 271 | 532 | 323 |
| Total | 500 | 773 | 1043 | 915 |
Table 9.
Definition of plant size and calculation of economic profit (thousand €)—baseline scenario. NPV—net present value.
Table 9.
Definition of plant size and calculation of economic profit (thousand €)—baseline scenario. NPV—net present value.
| Scenarios | As Is | To Be—65%SC | To Be—65%SC 40% OFMSW | To Be—110 kg/inhabitant | ||||
|---|---|---|---|---|---|---|---|---|
| Size | NPV | Size | NPV | Size | NPV | Size | NPV | |
| Torino | 500 | 7942 | 500 | 9585 | 500 [2] | 15,884 | 500 | 13,030 |
| +250 | +400 | |||||||
| Milano | 500 [2] | 18,448 | 500 [3] | 23,826 | 500 [3] | 23,826 | 500 [2] | 20,972 |
| +300 | +400 | |||||||
| Verona | 250 | 1643 | 300 | 2564 | 350 | 3566 | 250 | 1643 |
| Venezia | 350 | 3566 | 400 | 5088 | 400 | 5088 | 250 | 1643 |
| Padova | 250 | 1643 | 300 | 2564 | 300 | 3564 | 200 | 408 |
| Trieste | 0 | 0 | 0 | 0 | 250 | 1643 | 200 | 408 |
| Genova | 0 | 0 | 350 | 3566 | 500 | 8350 | 500 | 7942 |
| +200 | ||||||||
| Bologna | 200 | 408 | 300 | 2564 | 500 | 7942 | 400 | 5088 |
| Firenze | 450 | 6565 | 500 | 7942 | 500 | 7942 | 400 | 5088 |
| Roma | 500 [4] | 36,856 | 500 [7] | 57,237 | 500 [8] | 63,536 | 500 [5] | 46,275 |
| +400 | +250 | +450 | ||||||
| Napoli | 500 | 7942 | 500 [2] | 16,292 | 500 [2] +250 | 17,527 | 500 [2] | 15,884 |
| +200 | +250 | |||||||
| Bari | 0 | 0 | 300 | 2564 | 450 | 6565 | 350 | 3566 |
| Palermo | 0 | 0 | 500 | 9585 | 500 | 11,508 | 500 | 8350 |
| +250 | +350 | +200 | ||||||
| Messina | 0 | 0 | 0 | 0 | 300 | 2564 | 250 | 1643 |
| Catania | 0 | 0 | 250 | 1643 | 500 | 7942 | 300 | 2564 |
| Size (m3/h); NPV (thousand €); [n] = number of plants | ||||||||
Table 10.
Main results in the 15 municipalities from managing the OFMSW—baseline scenario.
| As Is | To Be—65%SC | To Be—65%SC 40% OFMSW | To Be—110 kg/inhabitant |
|---|---|---|---|
| Number of biomethane plants | |||
| 15 | 26 | 29 | 25 |
| Biomethane productivity (m3/h) | |||
| 6200 | 10,650 | 12,850 | 10,050 |
| Biomethane (million m3/y) | |||
| 49.6 | 85.2 | 102.8 | 80.4 |
| Economic benefits (million €) | |||
| 85 | 145 | 187 | 135 |
| Environmental benefits (thousand tCO2-eq/y) | |||
| 78 | 134 | 162 | 127 |
Table 11.
Definition of plant size and calculation of economic profit (thousand €)—alternative scenario (joint implementation biomethane producer and methane distributor).
Table 11.
Definition of plant size and calculation of economic profit (thousand €)—alternative scenario (joint implementation biomethane producer and methane distributor).
| Scenarios | As Is | To Be—65%SC | To Be—65%SC 40% OFMSW | To Be—110 kg/Inhabitant | ||||
|---|---|---|---|---|---|---|---|---|
| Size | NPV | Size | NPV | Size | NPV | Size | NPV | |
| Torino | 500 | 10,473 | 500 | 13,122 | 500 [2] | 20,946 | 500 | 17,488 |
| +250 | +400 | |||||||
| Milano | 500 [2] | 24,837 | 500 [3] | 31,419 | 500 [3] | 31,419 | 500 [2] | 27,961 |
| +300 | +400 | |||||||
| Verona | 250 | 2649 | 300 | 3891 | 350 | 5390 | 250 | 2649 |
| Venezia | 350 | 5390 | 400 | 7015 | 400 | 7015 | 250 | 2649 |
| Padova | 250 | 2649 | 300 | 3891 | 300 | 3891 | 200 | 1147 |
| Trieste | 0 | 0 | 0 | 0 | 250 | 2649 | 200 | 1147 |
| Genova | 0 | 0 | 350 | 5390 | 500 | 11,620 | 500 | 10,473 |
| +200 | ||||||||
| Bologna | 200 | 1147 | 300 | 3891 | 500 | 10,473 | 400 | 7015 |
| Firenze | 450 | 8679 | 500 | 10,473 | 500 | 10,473 | 400 | 7015 |
| Roma | 500 [4] | 48,907 | 500 [7] | 75,960 | 500 [8] | 83,784 | 500 [5] | 61,044 |
| +400 | +250 | +450 | ||||||
| Napoli | 500 | 10,473 | 500 [2] | 22,093 | 500 [2] | 23,595 | 500 [2] | 20,946 |
| +200 | +250 | |||||||
| Bari | 0 | 0 | 300 | 3891 | 450 | 8679 | 350 | 5390 |
| Palermo | 0 | 0 | 500 | 13,122 | 500 | 15,863 | 500 | 11,620 |
| +250 | +350 | +200 | ||||||
| Messina | 0 | 0 | 0 | 0 | 300 | 3891 | 250 | 2649 |
| Catania | 0 | 0 | 250 | 2649 | 500 | 10,473 | 300 | 3891 |
| Size (m3/h); NPV (thousand €); [n] = number of plants | ||||||||
© 2019 by the authors. Licensee MDPI, Basel, Switzerland. This article is an open access article distributed under the terms and conditions of the Creative Commons Attribution (CC BY) license (http://creativecommons.org/licenses/by/4.0/).
Share and Cite
MDPI and ACS Style
Cucchiella, F.; D’Adamo, I.; Gastaldi, M. Sustainable Italian Cities: The Added Value of Biomethane from Organic Waste. Appl. Sci. 2019, 9, 2221. https://doi.org/10.3390/app9112221
AMA Style
Cucchiella F, D’Adamo I, Gastaldi M. Sustainable Italian Cities: The Added Value of Biomethane from Organic Waste. Applied Sciences. 2019; 9(11):2221. https://doi.org/10.3390/app9112221
Chicago/Turabian StyleCucchiella, Federica, Idiano D’Adamo, and Massimo Gastaldi. 2019. "Sustainable Italian Cities: The Added Value of Biomethane from Organic Waste" Applied Sciences 9, no. 11: 2221. https://doi.org/10.3390/app9112221
Note that from the first issue of 2016, this journal uses article numbers instead of page numbers. See further details here.