Computer-Aided Detection of Hyperacute Stroke Based on Relative Radiomic Patterns in Computed Tomography


1
Graduate Institute of Biomedical Informatics, College of Medical Science and Technology, Taipei Medical University, Taipei 110, Taiwan
2
Graduate Institute of Library, Information and Archival Studies, National Chengchi University, Taipei 116, Taiwan
3
Department of Radiology, Taipei Mackay Memorial Hospital, Taipei 104, Taiwan
4
Department of Medical Imaging, Taipei Medical University Hospital, Taipei 110, Taiwan
5
Department of Radiology, School of Medicine, College of Medicine, Taipei Medical University, Taipei 110, Taiwan
*
Author to whom correspondence should be addressed.
Appl. Sci. 2019, 9(8), 1668; https://doi.org/10.3390/app9081668
Submission received: 13 March 2019
/
Revised: 5 April 2019
/
Accepted: 19 April 2019
/
Published: 23 April 2019
(This article belongs to the Special Issue Advanced Intelligent Imaging Technology)
Abstract
:Ischemic stroke is one of the leading causes of disability and death. To achieve timely assessments, a computer-aided diagnosis (CAD) system was proposed to perform early recognition of hyperacute ischemic stroke based on non-contrast computed tomography (NCCT). In total, 26 patients with hyperacute ischemic stroke (with onset <6 h previous) and 56 normal controls composed the image database. For each NCCT slice, textural features were extracted from Ranklet-transformed images which had enhanced local contrast. Textural differences between the two sides of an image were calculated and combined in a machine learning classifier to detect stroke areas. The proposed CAD system using Ranklet features achieved significantly higher accuracy (81% vs. 71%), specificity (90% vs. 79%), and area under the curve (Az) (0.81 vs. 0.73) than conventional textural features. Diagnostic suggestions provided by the CAD system are fast and promising and could be useful in the pipeline of hyperacute ischemic stroke assessments.
1. Introduction
Acute ischemic stroke continues to be a significant burden on worldwide health systems and remains one of the leading causes of disability and death. Intravenous alteplase administration is first-line reperfusion therapy with proven efficacy [1]. However, this therapy can only be given within 4.5 h after symptom onset, and this narrow therapeutic time window is one of the most well-recognized limitations of this treatment. Recent trials proved the efficacy of a mechanical thrombectomy over medical treatment for patients with acute ischemic stroke, with a balance of equivalent rates of adverse events [2,3,4,5,6,7]. Good clinical outcomes were proven to be correlated with early vessel recanalization [8,9]. Therefore, early recognition of ischemic stroke is very critical to improving management of this disease.
Arch et al. [10] reported that up to 22% of ischemic stroke cases were initially misdiagnosed even in academic teaching hospitals and a large community hospital. The failure to diagnose ischemic stroke in the emergency department is a missed opportunity for prompt treatment and acute interventions. Magnetic resonance diffusion-weighted imaging (MR-DWI) is another solution for characterizing ischemic brain tissues [11,12]. The detection rate of hyperacute ischemic lesions was higher on MR-DWI than on plain computed tomography (CT; 76.9% vs. 30.0%) [13]. However, there is limited availability in broad clinical settings because of the need for longer scan times or high-end technology to achieve a fast scan protocol [14]. Therefore, non-contrast CT (NCCT) is always applied by most institutions as a first-line imaging modality for ischemic stroke, and extracting as much information as possible from NCCT may have exceptional benefits.
With NCCT, different tissues have different appearance properties. Interpreting the heterogeneities and irregularities of tissues is relevant processing for tissue characterization. Descriptions of tissue patterns depend on a textural analysis. With the development of image processing, tiny pixel-wise correlations existing between tissues can be quantified and combined in an artificial intelligence classifier to achieve a computer-aided diagnosis (CAD) system [15,16]. The CAD system can analyze textural patterns which might not be readily recognized by human beings and provide diagnostic suggestions. In this study, a Ranklet transformation was proposed to enhance local contrast by relatively ranking pixel values. Through a sophisticated integration of numerous textural features extracted from the Ranklet-transformed images, the probability of brain ischemia was calculated. The resulting CAD suggestion facilitates a clinical ischemic stroke diagnosis with rapid NCCT scanning in a more reliable way.
2. Materials and Methods
Brain NCCT
The dataset used in the experiment was from image archives of Taipei Medical University Hospital. All necessary approvals, authorizations, and institutional review board approvals were acquired. In total, 28 patients diagnosed with hyperacute ischemic stroke proven by a subsequent MR-DWI study were included. All CT images were collected less than 6 h after symptom onset. Eleven of them had a stroke lesion on the right side, 11 of them had a stroke lesion on the left side, and 6 of them had bilateral disease. Fifty-two cases who had headaches with negative findings in neurological examination and no structural abnormalities on NCCT were recruited as non-stroke controls. Cases who had poor CT imaging quality were excluded.
NCCT images of the brain were acquired on a SOMATOM Perspective (Siemens Medical Systems, Forchheim, Germany) with the following parameters: 130 kV and 280~350 mA, 5-mm slice thickness, 512 × 512 image matrix size, collimation of 0.6 mm, and pitch of 1.
Two axial sections from a plain CT scan were selected by a board-certificated neuroradiologist (K.H.) for analysis. The first section was at the basal ganglia level around the roof of the third ventricle, where the thalamus, basal ganglia, and caudate are visible. The second section was at the supraganglionic level around the roof of the lateral ventricle, which included the corona radiata and centrum semiovale. These two sections are ones usually used in clinical settings to calculate the Alberta Stroke Program Early CT Score (ASPECTS) [17].
3. Stroke Pattern Extraction
3.1. Asymmetric Interpretation
NCCT is readily available in a timely manner for evaluating tissue damage. Consequently, the use of NCCT is intrinsically a quantitative and standardized process for infarct brain tissues. The previous literature suggested that since inherent anatomical structures in the human brain are symmetric, ischemic tissues can be highlighted by comparing the left and right sides of a brain [18,19].
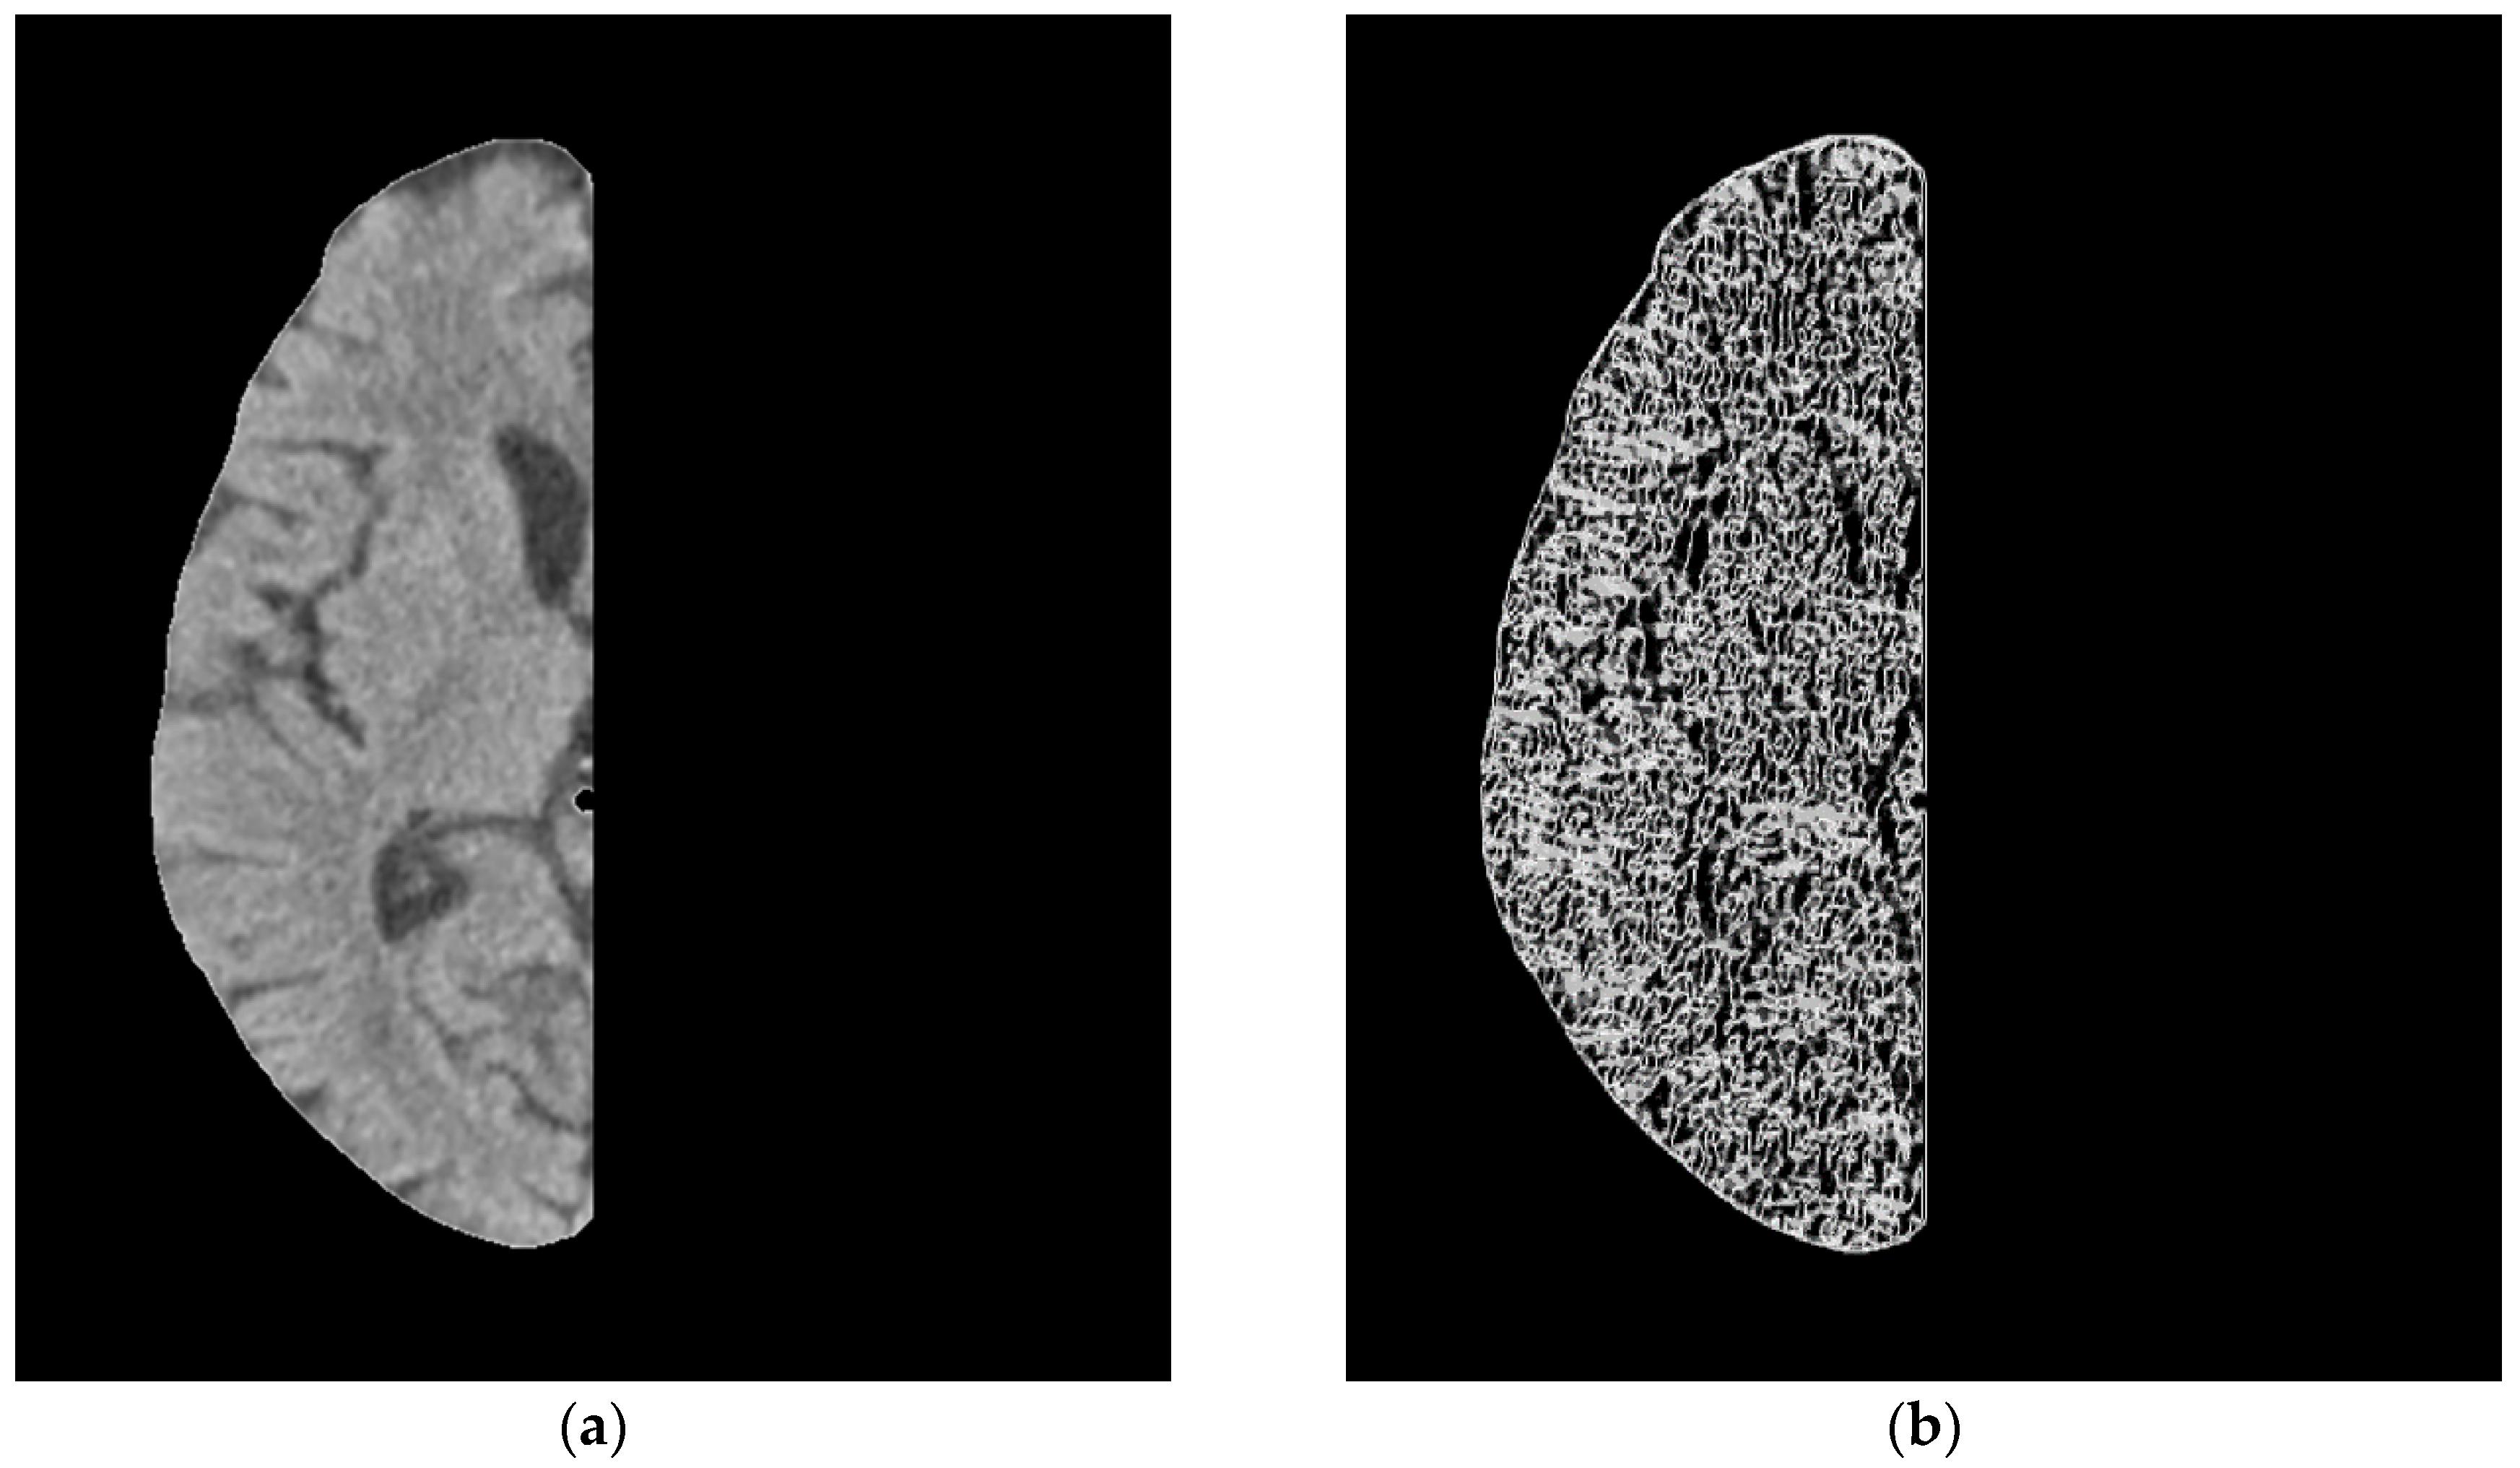
Therefore, the intradural part of the axial brain scan image was separated from the original brain in the experiment using orientation calibration and tissue clustering as shown in Figure 1b. Otsu method was used for automatic binarization and the morphological closing was used with the shape parameters of octagon and size of 12 pixels [20]. Then, the boundaries of the extracted area were determined and used to separate brain areas into left and right sides. On both sides, Ranklet transformation was performed to enhance local patterns. After extracting textural features from Ranklet-transformed images, textural differences of the left and right sides were calculated to be new features of the original slice. These differences were regarded as distinguishing features in the classifier for diagnosing stroke.
3.2. Ranklet Transformation
Detecting acute stroke by visual observation using NCCT is relatively insensitive. In this study, a Ranklet transformation was proposed to enhance the subtle contrast in the underlying NCCT patterns. Ranklet transformation changed the original pixel values into relative contrast coefficients [21]. Variations in gray-scale distributions were thus enhanced. Extracting textural features from the transformed patterns exhibited more-meaningful information for diagnosing stroke.
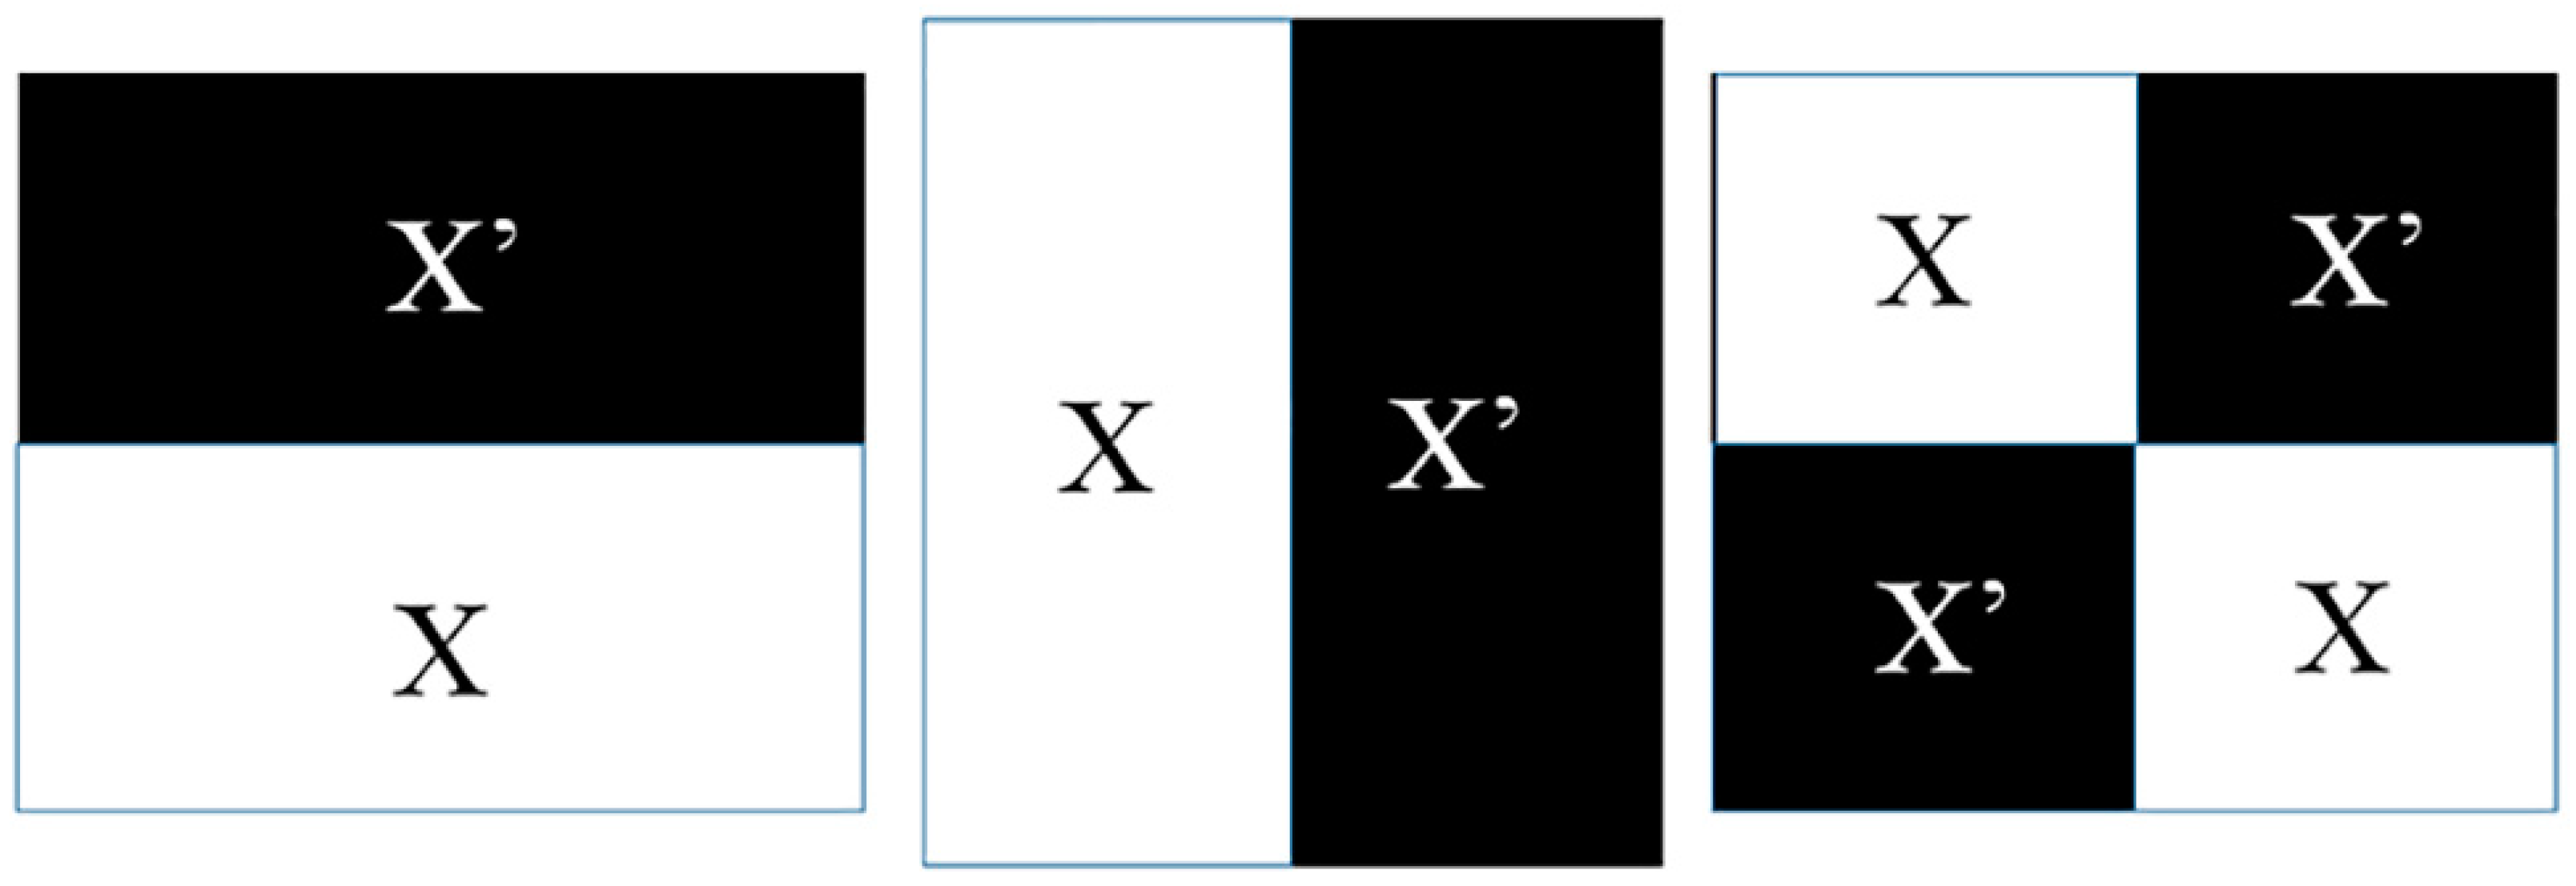
The relative contrast is orientation selective in Ranklet transformations, such as the Haar function used in the wavelet transform [22] and contrast orientations including horizontal, vertical, and diagonal. The three orientations present spatial adjacency between two sides of a block in a local region, and the difference between two sides reveal local fluctuations. Under a resolution value, an image is divided into multiple blocks as local regions. 16 is the single resolution size used in the experiment for the MRI images 512 × 512. Different size parameters determine different spatial features. According to the three orientations, the two sides of each block are defined as X and X′ as shown in Figure 2. Then, the number of pixel pairs (PH, PL) in each block is determined; that is, the relative rank of pixels of PH in subset X is higher than that of PL in the other subset X′. If there are C pixels in a block, then C/2 × C/2 = C2/4 comparisons are calculated. The resulting number is normalized to between −1 and 1. The Ranklet transformation coefficient, RO, is formulated as
In subset , pixel ranks, π(p), are summed. If more pixels in are higher than those in XO, RO is close to 1. Otherwise, it is close to −1. If the pattern in a block has no strong variations, the coefficient is close to 0. After replacing the original pixel values by Ranklet coefficients, the contrast correlation of a local pattern is presented as shown in Figure 3.
3.3. Gray Level Co-Occurrence Matrix (GLCM) Texture
Image texture is known as second-order statistics describing mutual information between adjacent pixels, such as spatial variations in gray-scale distributions. A quantitative texture analysis has successfully been used in medical image diagnosis. After Ranklet transformation, textural characteristics of a transformed NCCT image were analyzed to reveal underlying compositions of stroke areas. As a widely used quantitative texture model, the GLCM was proposed to present correlations between neighboring pixels with a defined orientation and distance [23,24,25]. First, a matrix was established by the co-occurrence frequencies of two adjacent pixel values (i and j) at distance d and direction θ [23]. In the experiment, the distance d = 1 and directions of θ = 0°, 45°, 90°, and 135° were individually calculated and averaged to comprise all possible combinations. In total, 14 GLCM textural features were adopted:
and
where μx, μy, σx, and σy are the mean and standard deviation (SD) of the marginal distributions of p(i,j|d,θ);
and
4. Statistical Analysis
Textural features extracted from transformed NCCT images were compared to conventional GLCM features to demonstrate the performance of local patterns in differentiating stroke occurrence. The distinguishing ability of 14 GLCM features and 42 Ranklet features (14 for each of the horizontal, vertical, and diagonal orientations) were first tested. The Kolmogorov–Smirnov test [26,27,28] was used to evaluate whether the value distribution of a feature was normal. Student’s t-test [26,27,28] was then used to test features with normal distributions, while the Mann–Whitney U-test [26,27,28] tested non-normal features. A resulting p value of <0.05 indicated whether a feature was statistically significant. A prediction model was then constructed using a logistic regression classifier. By stepwise backward elimination, features with the most relevance were selected with the lowest error rate. After validation by the leave-one-out method [26], the generalizability was considered by picking each case to test the trained model from the remaining cases in the iterations. As a result, each case obtained a probability of being a stroke according to its features. Probabilities of >0.5 were regarded as a stroke while others were normal tissues. The accuracy, sensitivity, and specificity of Ranklet and GLCM features were then calculated and compared using a Chi-squared test in SPSS (vers. 16 for Windows; SPSS, Chicago, IL, USA). Trade-offs between sensitivity and specificity were illustrated by a receiver operating characteristic (ROC) curve, and Az, the area under the curve, was also compared.
5. Results
Extracted textural features, including GLCM and Ranklet features, were tested to see if they could distinguish stroke patterns from normal patterns. For GLCM features, three (cluster prominence, cluster shading, and entropy) of 14 features were significant (p < 0.05). Among 42 Ranklet features, 23 of them were determined to be significant, and 8 features were selected to establish the prediction model in the classifier.
Performances of prediction models using GLCM and Ranklet features are compared in Table 1. GLCM features achieved an accuracy of 71% (115/160), a sensitivity of 57% (32/56), a specificity of 79% (83/104), and an Az of 0.73; while Ranklet had an accuracy of 81% (130/160), a sensitivity of 64% (36/56), a specificity of 90% (94/104), and an Az of 0.81. Among the performance comparisons, accuracy, specificity, and Az were statistically significant at p = 0.0478, = 0.0322, and =0.028, respectively. The corresponding ROC curves of both models are illustrated in Figure 4. Figure 5 shows two acute stroke cases correctly classified using Ranklet features (80% and 87%, respectively) but misclassified using GLCM features (19% and 37%, respectively).
6. Discussion
Early ischemic signs (EISs) on NCCT scans are well-established subtle changes associated with early cerebral ischemia within 6 h of stroke onset [29]. The sensitivity of NCCT scans for detecting ischemic stroke varies with different time windows from disease onset, the vascular territory of the infarct, and the experience of the interpreter [29]. When ischemia occurs, cytotoxic edema begins to develop within the affected brain tissues which results in decreased NCCT attenuation. Kucinski et al. [30] reported a decrease of 1.3 Hounsfield units (HU) at 2.5 h after symptom onset in regions with ischemia. However, a difference of 2 HU is the threshold that can be detected by the human eye [31]. Therefore, according to Smajlović’s study, the overall sensitivity in the first 12 h after stroke onset is only around 32–52% [32,33]. The highest detection rate was reached in patients with a total anterior circulation infarct (52%). Edema always progresses with time, and at 48 h after stroke onset, the second NCCT scan was positive in 85% of patients [32]. Since benefits of the latest treatment with an endovascular thrombectomy plus medical therapy related to lower degrees of disability at 3 months was proven to become non-significant at 7.3 h after disease onset [9], timely recognition of EISs is very critical for improving stroke outcomes.
In the experiment, all NCCT images in the stroke group were obtained within 4 h after symptom onset. The average time from disease onset to NCCT acquisition was 74.5 ± 63.8 min. On Ranklet-transformed NCCT images, textural features revealing relative local patterns were extracted to diagnose hyperacute ischemic stroke. Results showed that the prediction model based on the proposed CAD system achieved an 81% accuracy in distinguishing strokes and normal tissues. The performances of Ranklet features were better than those of conventional GLCM features in terms of accuracy, specificity, and Az (area under ROC curve) with respective p values of 0.0478, 0.0322, and 0.028. The local contrast enhanced by Ranklet transformation may provide additional diagnostic information. Figure 5 shows tissues from two patients with hyperacute ischemic stroke successfully classified using Ranklet features with respective likelihoods of 80% and 87%. The demonstrated cases had a homogeneity value of 0.04 in the horizontal orientation. Homogeneity measures differences or similarities between tissue intensities; when image contrast is weaker, homogeneity is greater. As for the entropy feature, stroke cases with higher entropy have a lower level of complexity. As to the biological meaning of this, tissues suffering from ischemia may develop edema and become similar to each other. Our study used the more-informative Ranklet transformation to detect hyperacute ischemic stroke and achieved a more-significant performance than conventional GLCM features. In addition to the improved accuracy, the CAD system efficiently generated a diagnostic assessment which could be appropriately applied to hyperacute disease.
Using a radiomic model for predicting hyperacute ischemic stroke provides a connection between intuitive vision and precision medicine. Hyperacute tissue damage can be mapped and quantified by applying high-throughput radiomic analyses of routine NCCT examinations obtained at a very early stage of the disease, without requiring more time-consuming examinations. However, this preliminary study was limited by the small number of hyperacute stroke cases. More cases should be collected in future studies to support the above results. Another limitation is that we used only NCCT images, which may be insufficient to characterize subtle brain ischemia in cases with good collateral circulation. The impacts of other advanced image modalities including CT angiography, CT perfusion imaging, and MR-DWI will be further investigated. The benefit of Ranklet transformation is that local contrasts of NCCT images are enhanced. Other future work is determining whether the Ranklet transformation can eliminate differences between images obtained from multicenter machines. The ability to generalize the proposed CAD system will be examined and the usefulness will be confirmed in future experiments.
7. Conclusions
A CAD system was proposed to detect hyperacute ischemic stroke using NCCT images. Quantitative textural features extracted from Ranklet-transformed images achieved an accuracy of 81% and an Az of 0.81. The system using a texture-based prediction model is a promising noninvasive method to provide suggestions for stroke assessments.
Author Contributions
Conceptualization, P.-H.H.; Data curation, K.L.-C.H.; Methodology, C.-M.L.; Validation, P.-H.H.; Writing—original draft, C.-M.L.; Writing—review & editing, K.L.-C.H.
Funding
This research was funded by the Ministry of Science and Technology, Taiwan, grant number [MOST 107-2221-E-004-013] and Taipei Medical University and Taipei Medical University Hospital, grant number [106TMU-TMUH-20]. The APC was funded by USTP-NTOU-TMU-108-01.
Conflicts of Interest
The authors declare no conflict of interest.
References
- Emberson, J.; Lees, K.R.; Lyden, P.; Blackwell, L.; Albers, G.; Bluhmki, E.; Brott, T.; Cohen, G.; Davis, S.; Donnan, G.; et al. Effect of treatment delay, age, and stroke severity on the effects of intravenous thrombolysis with alteplase for acute ischaemic stroke: A meta-analysis of individual patient data from randomised trials. Lancet 2014, 384, 1929–1935. [Google Scholar] [CrossRef]
- Campbell, B.C.; Mitchell, P.J.; Kleinig, T.J.; Dewey, H.M.; Churilov, L.; Yassi, N.; Yan, B.; Dowling, R.J.; Parsons, M.W.; Oxley, T.J.; et al. Endovascular therapy for ischemic stroke with perfusion-imaging selection. N. Engl. J. Med. 2015, 372, 1009–1018. [Google Scholar] [CrossRef] [PubMed]
- Goyal, M.; Demchuk, A.M.; Menon, B.K.; Eesa, M.; Rempel, J.L.; Thornton, J.; Roy, D.; Jovin, T.G.; Willinsky, R.A.; Sapkota, B.L.; et al. Randomized assessment of rapid endovascular treatment of ischemic stroke. N. Engl. J. Med. 2015, 372, 1019–1030. [Google Scholar] [CrossRef] [PubMed]
- Jovin, T.G.; Chamorro, A.; Cobo, E.; de Miquel, M.A.; Molina, C.A.; Rovira, A.; San Roman, L.; Serena, J.; Abilleira, S.; Ribo, M.; et al. Thrombectomy within 8 hours after symptom onset in ischemic stroke. N. Engl. J. Med. 2015, 372, 2296–2306. [Google Scholar] [CrossRef] [PubMed]
- Saver, J.L.; Goyal, M.; Bonafe, A.; Diener, H.C.; Levy, E.I.; Pereira, V.M.; Albers, G.W.; Cognard, C.; Cohen, D.J.; Hacke, W.; et al. Stent-retriever thrombectomy after intravenous t-PA vs. t-PA alone in stroke. N. Engl. J. Med. 2015, 372, 2285–2295. [Google Scholar] [CrossRef] [PubMed]
- Albers, G.W.; Marks, M.P.; Kemp, S.; Christensen, S.; Tsai, J.P.; Ortega-Gutierrez, S.; McTaggart, R.A.; Torbey, M.T.; Kim-Tenser, M.; Leslie-Mazwi, T. Thrombectomy for stroke at 6 to 16 hours with selection by perfusion imaging. N. Engl. J. Med. 2018, 378, 708–718. [Google Scholar] [CrossRef] [PubMed]
- Nogueira, R.G.; Jadhav, A.P.; Haussen, D.C.; Bonafe, A.; Budzik, R.F.; Bhuva, P.; Yavagal, D.R.; Ribo, M.; Cognard, C.; Hanel, R.A. Thrombectomy 6 to 24 hours after stroke with a mismatch between deficit and infarct. N. Engl. J. Med. 2018, 378, 11–21. [Google Scholar] [CrossRef] [PubMed]
- Rha, J.H.; Saver, J.L. The impact of recanalization on ischemic stroke outcome: A meta-analysis. Stroke 2007, 38, 967–973. [Google Scholar] [CrossRef]
- Saver, J.L.; Goyal, M.; van der Lugt, A.; Menon, B.K.; Majoie, C.B.; Dippel, D.W.; Campbell, B.C.; Nogueira, R.G.; Demchuk, A.M.; Tomasello, A.; et al. Time to Treatment with Endovascular Thrombectomy and Outcomes from Ischemic Stroke: A Meta-analysis. JAMA 2016, 316, 1279–1288. [Google Scholar] [CrossRef] [PubMed]
- Arch, A.E.; Weisman, D.C.; Coca, S.; Nystrom, K.V.; Wira, C.R., 3rd; Schindler, J.L. Missed Ischemic Stroke Diagnosis in the Emergency Department by Emergency Medicine and Neurology Services. Stroke 2016, 47, 668–673. [Google Scholar] [CrossRef] [Green Version]
- Simonsen, C.Z.; Madsen, M.H.; Schmitz, M.L.; Mikkelsen, I.K.; Fisher, M.; Andersen, G. Sensitivity of diffusion- and perfusion-weighted imaging for diagnosing acute ischemic stroke is 97.5%. Stroke 2015, 46, 98–101. [Google Scholar] [CrossRef] [PubMed]
- Brunser, A.M.; Hoppe, A.; Illanes, S.; Diaz, V.; Munoz, P.; Carcamo, D.; Olavarria, V.; Valenzuela, M.; Lavados, P. Accuracy of diffusion-weighted imaging in the diagnosis of stroke in patients with suspected cerebral infarct. Stroke 2013, 44, 1169–1171. [Google Scholar] [CrossRef]
- Mitomi, M.; Kimura, K.; Aoki, J.; Iguchi, Y. Comparison of CT and DWI findings in ischemic stroke patients within 3 hours of onset. J. Stroke Cerebrovasc. Dis. 2014, 23, 37–42. [Google Scholar] [CrossRef]
- Nael, K.; Khan, R.; Choudhary, G.; Meshksar, A.; Villablanca, P.; Tay, J.; Drake, K.; Coull, B.M.; Kidwell, C.S. Six-minute magnetic resonance imaging protocol for evaluation of acute ischemic stroke: Pushing the boundaries. Stroke 2014, 45, 1985–1991. [Google Scholar] [CrossRef]
- Hsieh, K.L.; Chen, C.Y.; Lo, C.M. Radiomic model for predicting mutations in the isocitrate dehydrogenase gene in glioblastomas. Oncotarget 2017, 8, 45888. [Google Scholar] [CrossRef]
- Reboucas Filho, P.P.; Sarmento, R.M.; Holanda, G.B.; de Alencar Lima, D. New approach to detect and classify stroke in skull CT images via analysis of brain tissue densities. Comput. Methods Programs Biomed. 2017, 148, 27–43. [Google Scholar] [CrossRef]
- Berkhemer, O.A.; Fransen, P.S.; Beumer, D.; van den Berg, L.A.; Lingsma, H.F.; Yoo, A.J.; Schonewille, W.J.; Vos, J.A.; Nederkoorn, P.J.; Wermer, M.J.; et al. A randomized trial of intraarterial treatment for acute ischemic stroke. N. Engl. J. Med. 2015, 372, 11–20. [Google Scholar] [CrossRef]
- Minnerup, J.; Broocks, G.; Kalkoffen, J.; Langner, S.; Knauth, M.; Psychogios, M.N.; Wersching, H.; Teuber, A.; Heindel, W.; Eckert, B.; et al. Computed tomography-based quantification of lesion water uptake identifies patients within 4.5 hours of stroke onset: A multicenter observational study. Ann. Neurol. 2016, 80, 924–934. [Google Scholar] [CrossRef] [PubMed]
- Shieh, Y.; Chang, C.H.; Shieh, M.; Lee, T.H.; Chang, Y.J.; Wong, H.F.; Chin, S.C.; Goodwin, S. Computer-aided diagnosis of hyperacute stroke with thrombolysis decision support using a contralateral comparative method of CT image analysis. J. Digit. Imaging 2014, 27, 392–406. [Google Scholar] [CrossRef] [PubMed]
- Miri, M.S.; Mahloojifar, A. Retinal image analysis using curvelet transform and multistructure elements morphology by reconstruction. IEEE Trans. Biomed. Eng. 2011, 58, 1183–1192. [Google Scholar] [CrossRef]
- Lo, C.-M.; Lai, Y.-C.; Chou, Y.-H.; Chang, R.-F. Quantitative breast lesion classification based on multichannel distributions in shear-wave imaging. Comput. Methods Programs Biomed. 2015, 122, 354–361. [Google Scholar] [CrossRef]
- Mallat, S.G. A theory for multiresolution signal decomposition: The wavelet representation. IEEE Trans. Pattern Anal. Mach. Intell. 1989, 11, 674–693. [Google Scholar] [CrossRef]
- Haralick, R.M.; Shanmugam, K.; Dinstein, I.H. Textural features for image classification. IEEE Trans. Syst. Man Cybern. 1973, 610–621. [Google Scholar] [CrossRef]
- Clausi, D.A. An analysis of co-occurrence texture statistics as a function of grey level quantization. Can. J. Remote Sens. 2002, 28, 45–62. [Google Scholar] [CrossRef]
- Soh, L.-K.; Tsatsoulis, C. Texture analysis of SAR sea ice imagery using gray level co-occurrence matrices. IEEE Trans. Geosci. Remote Sens. 1999, 37, 780–795. [Google Scholar] [CrossRef] [Green Version]
- Field, A.P. Discovering Statistics Using SPSS, 3rd ed.; SAGE Publications: Los Angeles, CA, USA, 2009. [Google Scholar]
- Hsieh, K.L.-C.; Chen, C.-Y.; Lo, C.-M. Quantitative glioma grading using transformed gray-scale invariant textures of MRI. Comput. Biol. Med. 2017, 83, 102–108. [Google Scholar] [CrossRef]
- Moon, W.K.; Chen, I.-L.; Chang, J.M.; Shin, S.U.; Lo, C.-M.; Chang, R.-F. The adaptive computer-aided diagnosis system based on tumor sizes for the classification of breast tumors detected at screening ultrasound. Ultrasonics 2017, 76, 70–77. [Google Scholar] [CrossRef]
- Von Kummer, R.; Nolte, P.N.; Schnittger, H.; Thron, A.; Ringelstein, E.B. Detectability of cerebral hemisphere ischaemic infarcts by CT within 6 h of stroke. Neuroradiology 1996, 38, 31–33. [Google Scholar] [CrossRef] [PubMed]
- Bozzao, L.; Bastianello, S.; Fantozzi, L.M.; Angeloni, U.; Argentino, C.; Fieschi, C. Correlation of angiographic and sequential CT findings in patients with evolving cerebral infarction. AJNR Am. J. Neuroradiol. 1989, 10, 1215–1222. [Google Scholar] [PubMed]
- Marks, M.P. CT in ischemic stroke. Neuroimaging Clin. N. Am. 1998, 8, 515–523. [Google Scholar] [PubMed]
- Smajlovic, D.; Sinanovic, O. Sensitivity of the neuroimaging techniques in ischemic stroke. Med. Arh. 2004, 58, 282–284. [Google Scholar] [PubMed]
- Mair, G.; Boyd, E.V.; Chappell, F.M.; von Kummer, R.; Lindley, R.I.; Sandercock, P.; Wardlaw, J.M.; Group, I.S.T.C. Sensitivity and specificity of the hyperdense artery sign for arterial obstruction in acute ischemic stroke. Stroke 2015, 46, 102–107. [Google Scholar] [CrossRef] [PubMed]
Figure 1.
Image processing used to divide the left and right sides of the brain for symmetric comparisons. (a) The original non-contrast computed tomographic (NCCT) image, (b) the extracted brain area, (c) the left side, and (d) the right side.
Figure 1.
Image processing used to divide the left and right sides of the brain for symmetric comparisons. (a) The original non-contrast computed tomographic (NCCT) image, (b) the extracted brain area, (c) the left side, and (d) the right side.

Figure 2.
Illustration of comparisons of differences in three orientations used in the Ranklet transformation, including horizontal, vertical, and diagonal patterns.
Figure 2.
Illustration of comparisons of differences in three orientations used in the Ranklet transformation, including horizontal, vertical, and diagonal patterns.

Figure 3.
Original non-contrast computed tomographic (NCCT) image of the right side of a brain and the corresponding Ranklet coefficient images. (a) The original NCCT image, (b) the transformed horizontal image, (c) the transformed vertical image, and (d) the transformed diagonal image.
Figure 3.
Original non-contrast computed tomographic (NCCT) image of the right side of a brain and the corresponding Ranklet coefficient images. (a) The original NCCT image, (b) the transformed horizontal image, (c) the transformed vertical image, and (d) the transformed diagonal image.


Figure 4.
Receiver operating characteristic (ROC) curves of the gray level co-occurrence matrix (GLCM) and Ranklet features regarding trade-offs between sensitivity and specificity.
Figure 4.
Receiver operating characteristic (ROC) curves of the gray level co-occurrence matrix (GLCM) and Ranklet features regarding trade-offs between sensitivity and specificity.

Figure 5.
Two hyperacute stroke cases correctly classified by Ranklet features but misclassified by gray level co-occurrence matrix (GLCM) features. (a) A case of right middle cerebral artery (MCA) territory infarction with a stroke likelihood of 80%. (b) Another case of right MCA territory infarction with a stroke likelihood of 87%.


Table 1.
Performance comparisons between gray level co-occurrence matrix (GLCM) and Ranklet features in classifying strokes
Table 1.
Performance comparisons between gray level co-occurrence matrix (GLCM) and Ranklet features in classifying strokes
| GLCM | Ranklet | GLCM vs. Ranklet (p Value) | |
|---|---|---|---|
| Accuracy | 71% (115/160) | 81% (130/160) | 0.0478 * |
| Sensitivity | 57% (32/56) | 64% (36/56) | 0.4390 |
| Specificity | 79% (83/104) | 90% (94/104) | 0.0322 * |
| Az | 0.73 | 0.81 | 0.028 * |
* p < 0.05 indicates a statistically significant difference. Az, the area under the receiver operating characteristic curve.
© 2019 by the authors. Licensee MDPI, Basel, Switzerland. This article is an open access article distributed under the terms and conditions of the Creative Commons Attribution (CC BY) license (http://creativecommons.org/licenses/by/4.0/).
Share and Cite
MDPI and ACS Style
Lo, C.-M.; Hung, P.-H.; Hsieh, K.L.-C. Computer-Aided Detection of Hyperacute Stroke Based on Relative Radiomic Patterns in Computed Tomography. Appl. Sci. 2019, 9, 1668. https://doi.org/10.3390/app9081668
AMA Style
Lo C-M, Hung P-H, Hsieh KL-C. Computer-Aided Detection of Hyperacute Stroke Based on Relative Radiomic Patterns in Computed Tomography. Applied Sciences. 2019; 9(8):1668. https://doi.org/10.3390/app9081668
Chicago/Turabian StyleLo, Chung-Ming, Peng-Hsiang Hung, and Kevin Li-Chun Hsieh. 2019. "Computer-Aided Detection of Hyperacute Stroke Based on Relative Radiomic Patterns in Computed Tomography" Applied Sciences 9, no. 8: 1668. https://doi.org/10.3390/app9081668
Note that from the first issue of 2016, this journal uses article numbers instead of page numbers. See further details here.