Standardization of Fatigue Characteristics of Cement-Treated Aggregate Base Materials under Different Stress States


1
National Engineering Laboratory of Highway Maintenance Technology, Changsha University of Science & Technology, Changsha 410004, Hunan, China
2
Department of Civil and Environmental Engineering, Michigan Technological University, Houghton, MI 49931, USA
*
Author to whom correspondence should be addressed.
Appl. Sci. 2018, 8(9), 1500; https://doi.org/10.3390/app8091500
Submission received: 5 August 2018
/
Revised: 20 August 2018
/
Accepted: 27 August 2018
/
Published: 1 September 2018
Abstract
:In this study, to decrease the evaluation uncertainty of the fatigue characteristics of cement-treated aggregate base materials under different test conditions, unconfined compressive, indirect tensile, flexural tensile strength tests and fatigue tests of these base materials with different cement content and at different curing times were carried out. The Weibull distribution was employed to analyze fatigue test results. The standardization model of fatigue characteristics for cement-treated aggregate base materials under different stress states was established. Based on the interval analysis theory, the fatigue characteristic model under different stress states was established using interval parameters. Results revealed that the curing time and cement content considerably affect the strength and fatigue characteristics of cement-treated aggregate base materials, and with increasing cement content and curing time, the fatigue resistance of cement-treated aggregate base materials can be improved. Clear differences between the fitting parameters a and b of the S-N fatigue equation of cement-treated aggregate base materials under different stress states were observed, which can be eliminated by using the analysis method based on the Weibull distribution and the standardization model, and a unified expression for the cement-treated aggregate base materials under different test conditions was realized. A Standardization model of fatigue characteristics based on the interval analysis new method could solve several problems such as inadequate sampling representation, low precision, and insufficient stability of test equipment; thus, the errors caused by materials, structures, the environment, and loads can be reduced, making the fatigue life interval more reasonable and scientific compared to the point numerical fatigue life. Regression parameters a and be were in intervals [9.0, 10.6] and [9.9, 11.3], respectively, and parameters a and b were similar, which improve the test accuracy and reduce the data error.

1. Introduction
Cement-treated aggregate base materials exhibit several advantages such as high strength, and rigidity good impermeability and frost resistance, facile access to materials [1,2], and cost-effectiveness. These base materials are widely used in high-grade road pavement bases in China. However, engineering practice has demonstrated that such materials undergo facile fatigue cracking under repeated loads and the environment [3]. Furthermore, even if the traffic load is less than the ultimate load, it would suffer fatigue damage. Fatigue damage is the most common failure of cement-treated aggregate base materials. To ensure the good durability and usability of pavement bases, various cost-effective, short-cycle indoor fatigue tests have been carried out worldwide to examine the fatigue resistance of pavement base materials. Preteseille [4] conducted uniaxial flexural test to study the anti- fatigue properties of cement-treated aggregate base materials. Schneider [5] adopted flexural tensile fatigue test to study the anti-fatigue properties of cement-treated aggregate base materials, of which the specimens were large-scale beams. Chinese scholars [6,7] revealed the fatigue properties mostly by carrying out flexural tensile or indirect tensile fatigue tests. Previous researches indicated that the test results of different test methods were different, and the fatigue test results had higher sensitivity to the specimen shape, sizes and stress states. In addition, the existing fatigue characteristics models fail to reduce these differences. Therefore, it is imperative to develop a new method to analyze the fatigue characteristics of cement-treated aggregate base materials and unify the test results obtained from different fatigue test conditions.
To model the fatigue life of cement-treated aggregate base materials, considerable research and practice have been conducted domestically and internationally. Lv et al. [8] improved the fatigue equation based on the true stress ratio and the four-point bending fatigue test. Jameson [9] studied different cement-treated aggregate base materials to evaluate the fatigue properties with tensile strain, and established individual fatigue equation for each material. Otte [10] evaluated the fatigue properties by strain and fracture strain and established the fatigue model. Huang [11] conducted a three-point bending fatigue test to analyzed the fatigue life of cement-treated aggregate base materials specimen beams through coupling fracture and failure mechanics, and calculated the fracture toughness of specimen beams by finite element method (FEM) based on this, he proposed the damage evolution equation with the fracture toughness as control index. Judycki et al. [12,13] adopted the cylinder specimen and specimen beams performed cement-treated aggregate base materials fatigue test, and established the prediction model of fatigue characteristics. Studies discussed above have considerably contributed to the fatigue properties equations of cement-treated aggregate base materials. However, different scholars have reported different fatigue characteristics models based on the widely used S-N fatigue equation. It is not possible to explain fatigue properties of different stress states. Meantime, a unified fatigue damage standard has not been established, as the test results lack uniformity, uniqueness, and inevitability.
To decrease the effect of the stress state, specimen shape, and size on the analysis and evaluation of fatigue characteristics, Li and Lv [14,15,16] developed a series of test methods to examine the fatigue performance of asphalt mixtures and revealed the effect of the specimen size on fatigue life. Results revealed that the specimen sizes marginally affect the tensile and compressive fatigue properties. In addition, he used the Desai strength yield surface model to unify the fatigue properties of asphalt mixtures under different stress states [17]; however, each test result was based on the assumption that the tensile strength of the specimen was constant, which was not consistent with the actual situation and resulted in a considerable inaccuracy with respect to the assessment of the fatigue characteristics of asphalt mixtures. In order to minimize the high scatter of the compressive fatigue life of concrete and fiber reinforced concrete which caused by material heterogeneity and uncertainty during the tests, Tarifa et al. [18] designed an individualized ball-and-socket joint(i-BSJ) for this research. They adopted steel-fiber reinforced concrete cubes compressive fatigue test with this device, and found that the uncertainty of test conditions affect the fatigue characteristics of fiber reinforced concrete. But, the test result was based on one stress state, which could not be used to draw unified conclusions under different stress states. Therefore, it is imperative to develop and improve the method to analyze fatigue characteristics for the standardization of fatigue characteristics of cement-treated aggregate base materials under different stress states, which could decrease the evaluation uncertainty of the fatigue characteristics and improve the science and precision in the designing of pavements.
Although the characteristics of cement-treated aggregate base materials have been examined, besides the aforementioned information, two aspects have been predominantly ignored.
First, the fatigue life of cement-treated aggregate base materials tends to be random and discrete, which is possibly 10 or even dozens of times at the same stress level. Existing studies [3,7,19,20,21] have revealed that the fatigue life and equivalent fatigue life of cement-treated aggregate base materials are subject to the two-parameter Weibull distribution [22]. To tackle the problem of the high scatter of fatigue life. Ou [23] studied effect of frost-damaged on flexural fatigue life of concrete beam specimens by rapid frozen-thaw method. It was noted that the two-parameter Weibull distribution function can appropriately describe the probability distribution of flexural fatigue life. Results of the estimated shape parameter of the Weibull distribution by the method of moments show that the scatter of the flexural fatigue life increases with the increase of the number of freezethaw cycles, and the relationship of the fatigue life and the P-S-N curve was obtained. Sha and Jiang [3,7,24] subjected different structural forms of specimens to bending and indirect tensile fatigue tests and analyzed the fatigue test results by the Weibull distribution and regression analysis. They established the prediction model for the indoor fatigue life of different structural material specimens. Ortega et al. [25] conducted random samples of 100 compressive fatigue test of concrete, the experimentally-fitted probabilistic distributions by failure probability and logN results found that an error in terms of fatigue life that depends on the number of tests. Through statistical resampling, this relationship has been obtained for the two-parameter Weibull probabilistic distribution fitted to a set of 100 tests results. The error was obtained through a Weibull distribution model. Ganesan [26] investigated the flexural fatigue behavior of Self Compacting Rubberized Concrete with and without steel fibers, and the probabilistic distribution of fatigue life subject to Weibull distribution, and established an approximate model by the two-parameter Weibull distribution. These studies have demonstrated to the Weibull distribution can solve the issue of the high scatter of fatigue life, and proposed very sophisticated modeling approaches by two-parameter or three-parameter Weibull distribution from a statistical viewpoint to simulate the probability distribution of fatigue life.
Second, the fatigue equation models established by the above scholars were expressed as point numerical. Owing to the representative issues of test sampling, accuracy, and stability of the test equipment, the point value form does not completely reflect the complex properties such as the variability and uncertainty of parameters and indicators. Therefore, in this study, the interval analysis theory [27,28,29], which replaces the point parameter with the interval parameter, is introduced. The interval parameter value included the true value of the point parameter value, and the uncertainty parameter was used ensure accurate calculation results. By the combination of the interval analysis method and the finite element method, Garcia [30] proposed the interval finite element method and applied it to the calculation of the engineering structure, thereby making the structural calculation more accurate. Chen [31] used the interval evaluation method for the comprehensive analysis of the highway subgrade in the karst area. This method allows for the more reasonable, operable evaluation of the subgrade stability of the karst area. Several uncertainty parameters exist in the slope stability analysis. Dodagoudar [32,33,34] used interval mathematics to evaluate the stability and reliability of slopes and solved the issue of several slope uncertainties.
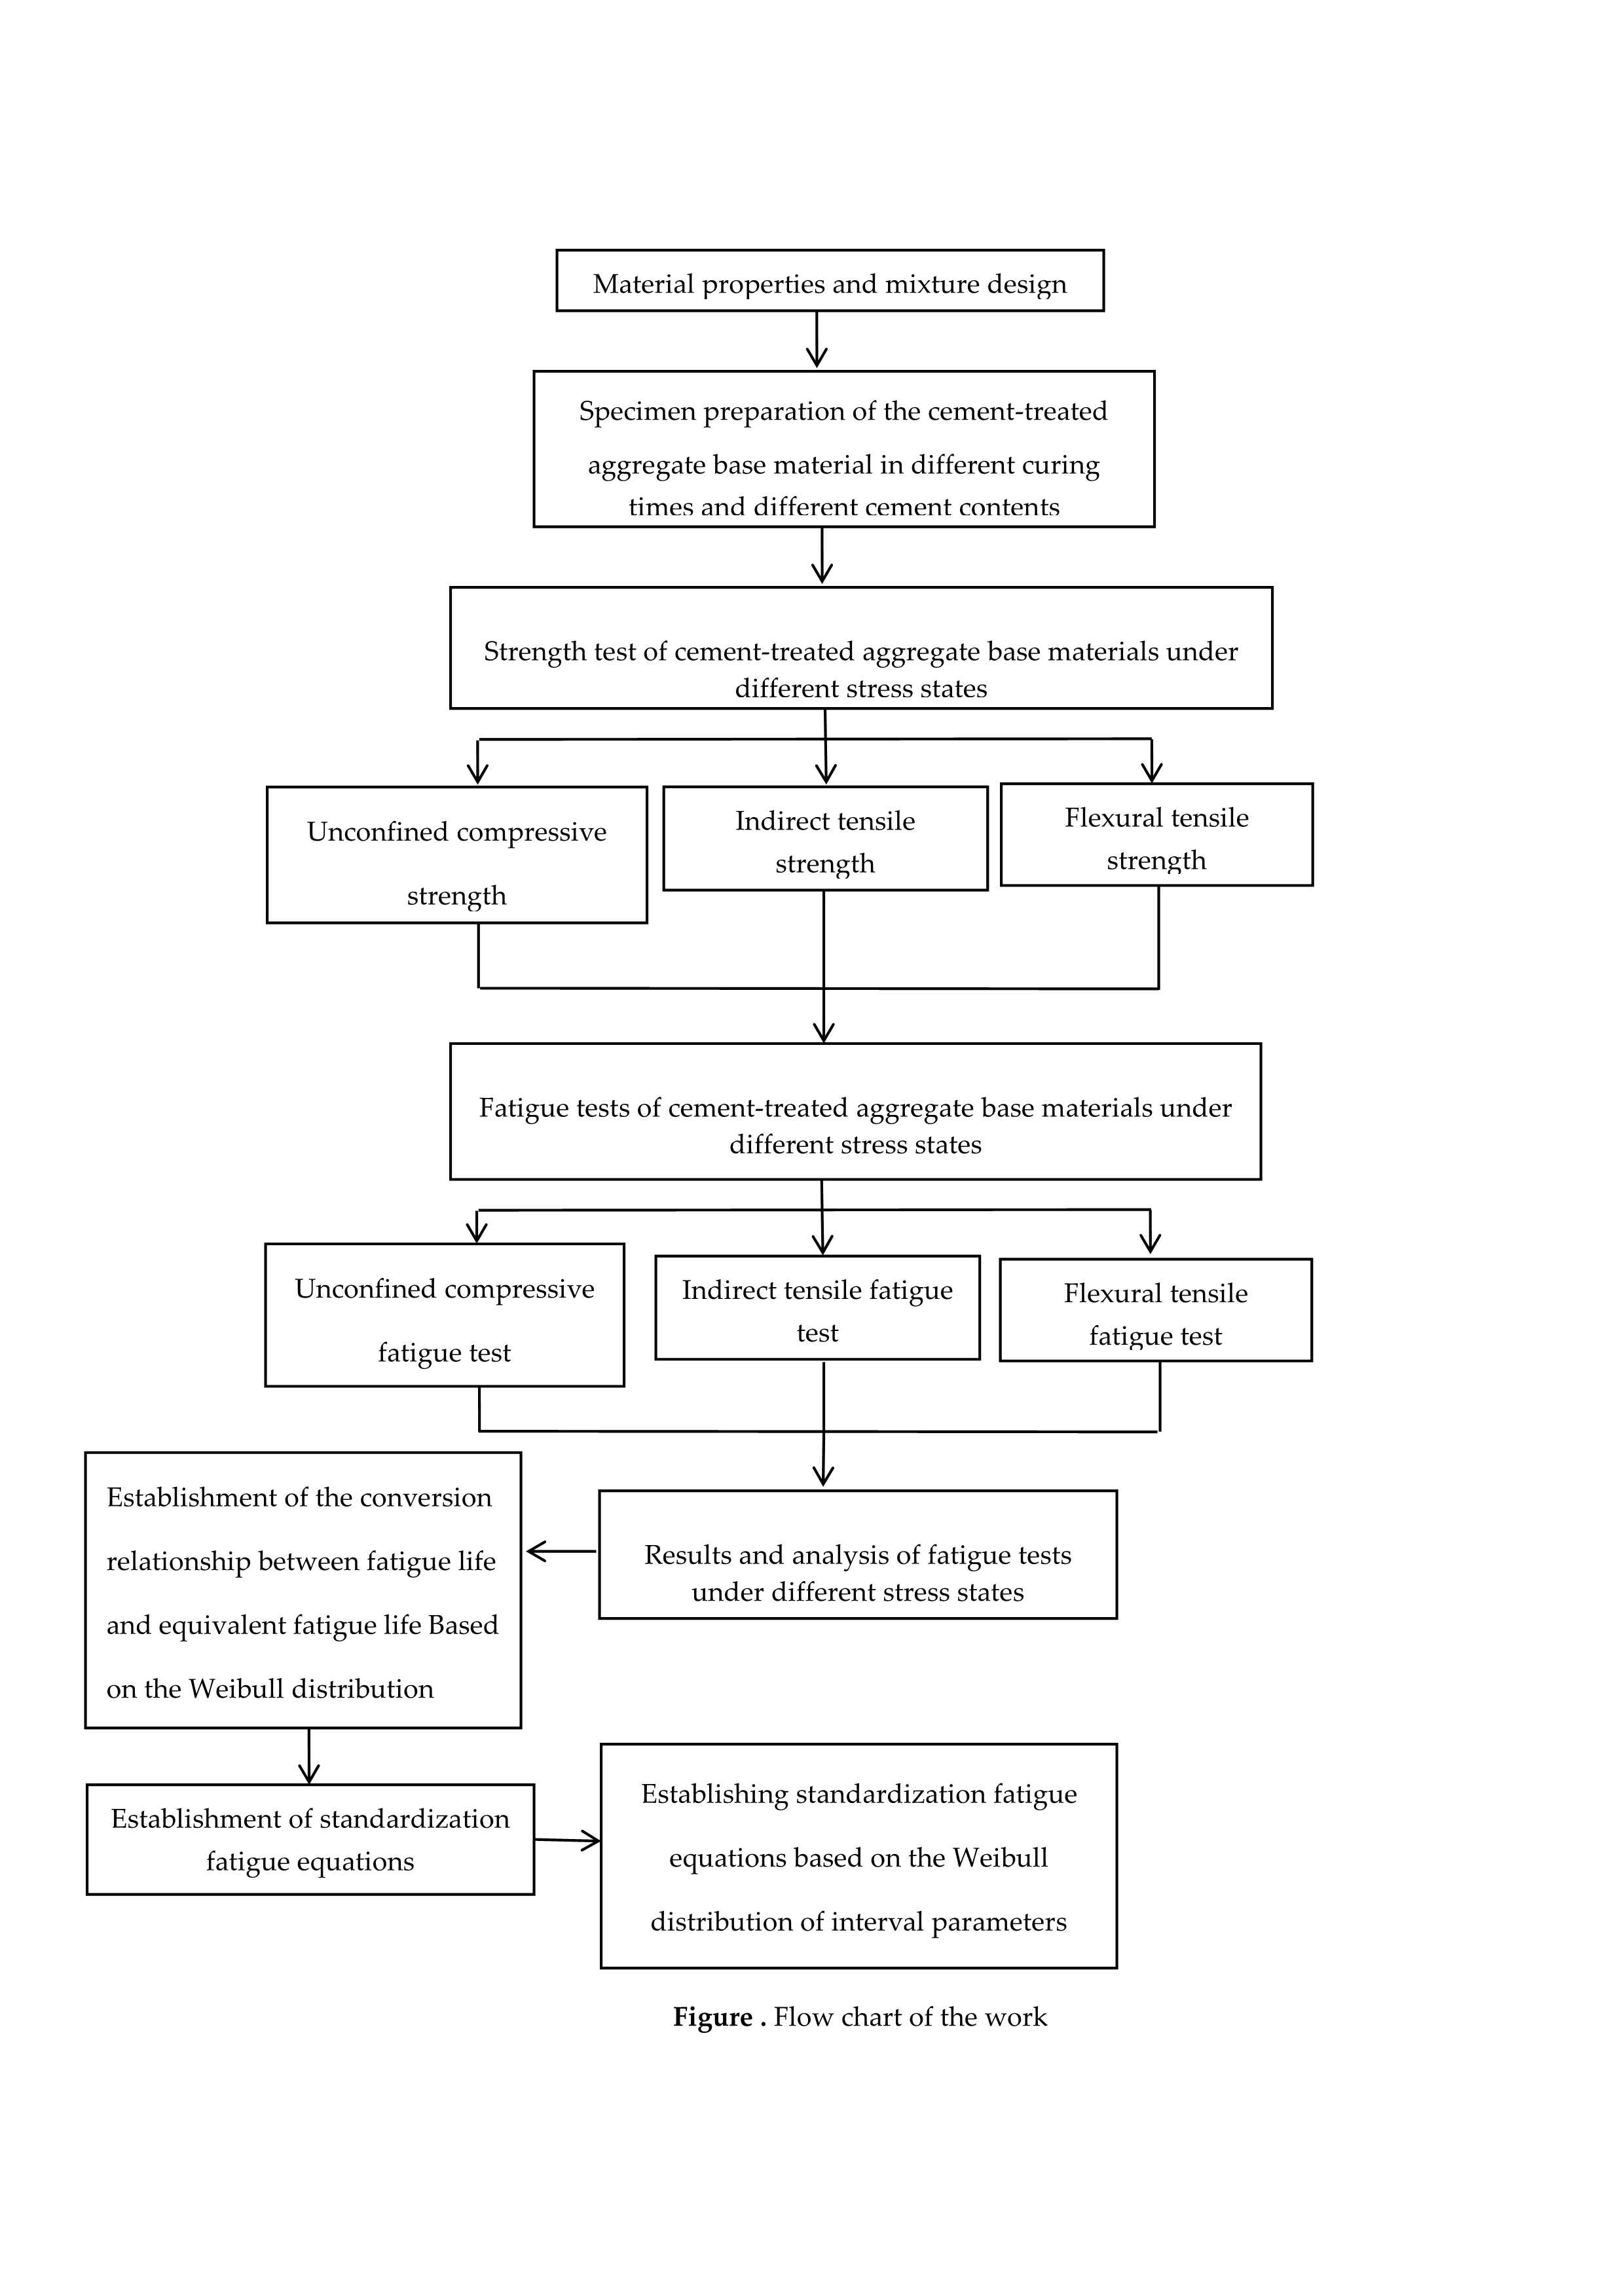
Therefore, in this study, cement-treated aggregate base material specimens are formed by vibration molding at cement contents of 3%, 4%, and 5%; different curing times; and aggregate base materials, which were maintained at a standard curing time until different curing times, after 24 h of water saturation. Specimens were subjected to unconfined compressive strength tests at 1, 3, 7, 14, 28, 60, and 90 days; indirect tensile strength tests also at 1, 3, 7, 14, 28, 60, and 90 days; and flexural tensile strength tests at 3, 7, 14, 28, 60, and 90 days using a material test system (MTS), followed by fatigue life measurements of the 28-day and 90-day specimens at different stress ratios. Different from the aforementioned fatigue life researches of Weibull distribution which adopted both single stress state and different specimen shape, and size to analysis and evaluation of fatigue characteristics, the former researches failed to draw a certain conclusion and decrease the uncertainty of test conditions. Based on the results obtained from fatigue tests, this relationship has been obtained for fatigue life and equivalent fatigue life at different stress states, different curing times and cement content and, a P-S-N standardization model of fatigue characteristics of cement-treated aggregate base materials at different stress states was established by the Weibull distribution. The standardization model reduced or even eliminated the uncertainty of evaluation of cement-treated aggregate base material fatigue characteristics caused by the different test conditions. The new method based on the interval analysis of the fatigue equation decreased uncertainty, caused by inadequate sampling representation; low precision; and insufficient stability of test equipment, thereby decreasing errors caused by materials, structures, the environment, and loads, making the fatigue life interval more reasonable and scientific compared to the point value fatigue life and more consistent with the actual situation.
2. Specimen Formation and Test Preparation
2.1. Material Properties and Mixture Design
2.1.1. Cement
2.1.2. Aggregate
2.2. Specimen Shaping
According to the vibration compaction test methods of inorganic-binder-stabilized materials specified by the Chinese Test Methods of Materials Stabilized with Inorganic Binders for Highway Engineering (JTG E51-2009) [36], the maximum dry density of cement-treated aggregate base materials was determined to be 2.349 g/cm3, and the optimum water content was 5.15%. According to the relevant test code and specifications, with a cement content of 3–5%, a cylinder specimen with a diameter of 150 mm and a height of 150 mm was produced, as well as large-scale beams specimen of a length of 550 mm and a width and height of 150 mm each. To better fit the correlation between the specimen and pavement, the specimen was shaped by vertical vibrations. After molding, the specimen was placed in a standard curing room (temperature of 20 °C ± 2 °C and humidity of <95%), followed by curing at different times. Strength and fatigue tests were carried out at each curing time, and tests were carried out using an MTS manufactured (MTS Systems Corporation, Eden Prairie, MN, USA) in the United States.
3. Strength Test
3.1. Unconfined Compressive Strength
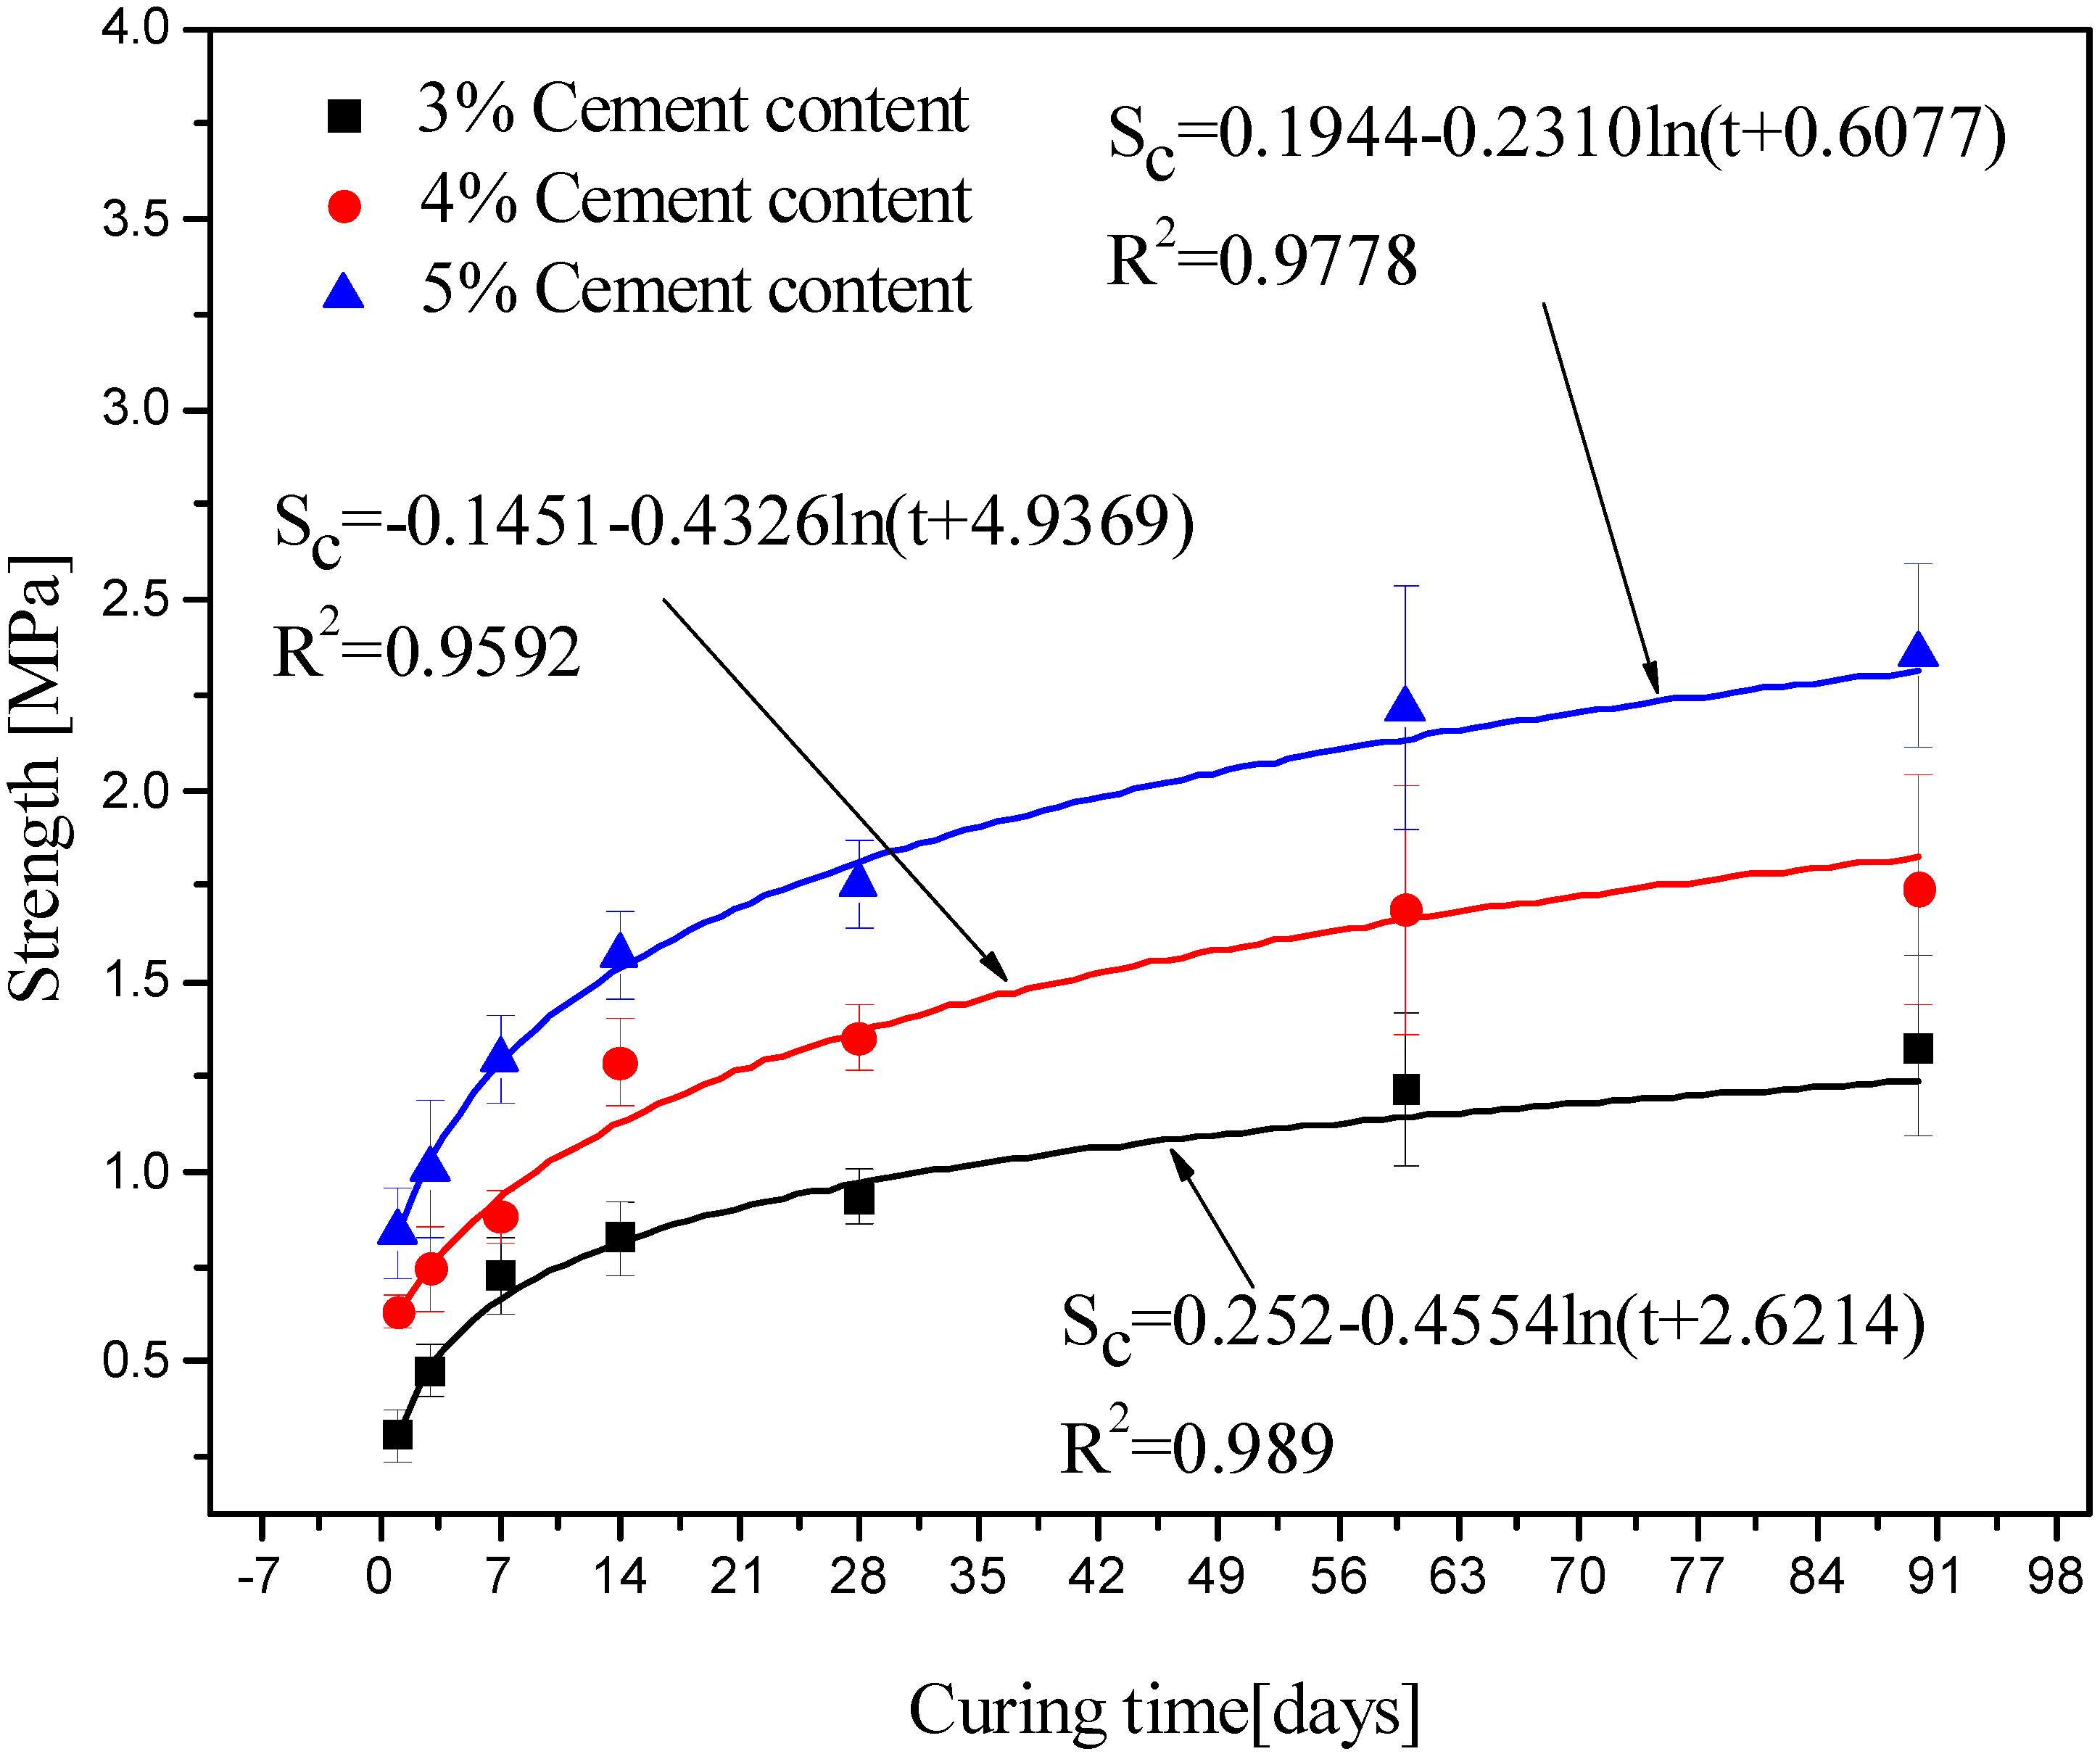
After formation, the cylinder specimen was cured for 1, 3, 7, 14, 28, 60, and 90 days under standard curing conditions. Next, according to the selected cement content and aggregate, on the basis of the Chinese Test Methods of Materials Stabilized with Inorganic Binders for Highway Engineering (JTG E51-2009) [36], unconfined compressive strength tests were carried out at different curing times and with different cement content on the MTS. Five parallel tests were performed at each curing time. The variation pattern was described by a logarithmic equation, and the strength test carried out at different curing times were fitted by Equation (1). Figure 2 shows the fitting results of the unconfined compressive strength, where R2 is the correlation coefficient of fitting.
where Sc is the compressive strength; t is the curing time; and a, b, and c are the fitting parameters.
From the fitting results, it can be noted that
- (1)
- The Chinese Specification for Design of Highway Asphalt Pavement (JTG D50-2017) [37] has stipulated that the unconfined compressive strength of the cement-stabilized gravel base layer for 7 days under special traffic conditions is 5.0–7.0 MPa and that of the subbase layer is 3.0–5.0 MPa. From the existing test, an unconfined compressive strength at 7-day could meet the requirements.
- (2)
- The unconfined compressive strength of cement-treated aggregate base materials monotonously increased with the curing time and cement content. The effect of the cement content on the strength of the cement-treated aggregate base material is larger than the curing time. For example, the strength at a curing time of 90 days and 5% cement content was approximately 1.6 times higher than that of 3% cement content at a curing time of 90 days (from 9 to 14 MPa). The strength of the cement-treated aggregate base material is affected by the curing time significantly, but much less than the cement content. At 1–14 days, the unconfined compressive strength of cement-treated aggregate base materials rapidly increased, with a growth rate of ~1.6 times (from 6 MPa to 10 MPa). At 14–28 days, the unconfined compressive strength growth rate decreased by 1.2 times (from 10 to 12 MPa). After 28 days, the unconfined compressive strength approached stability. Therefore, the cement-treated aggregate base should be maintained for about 28 days after being paved.
3.2. Indirect Tensile Strength
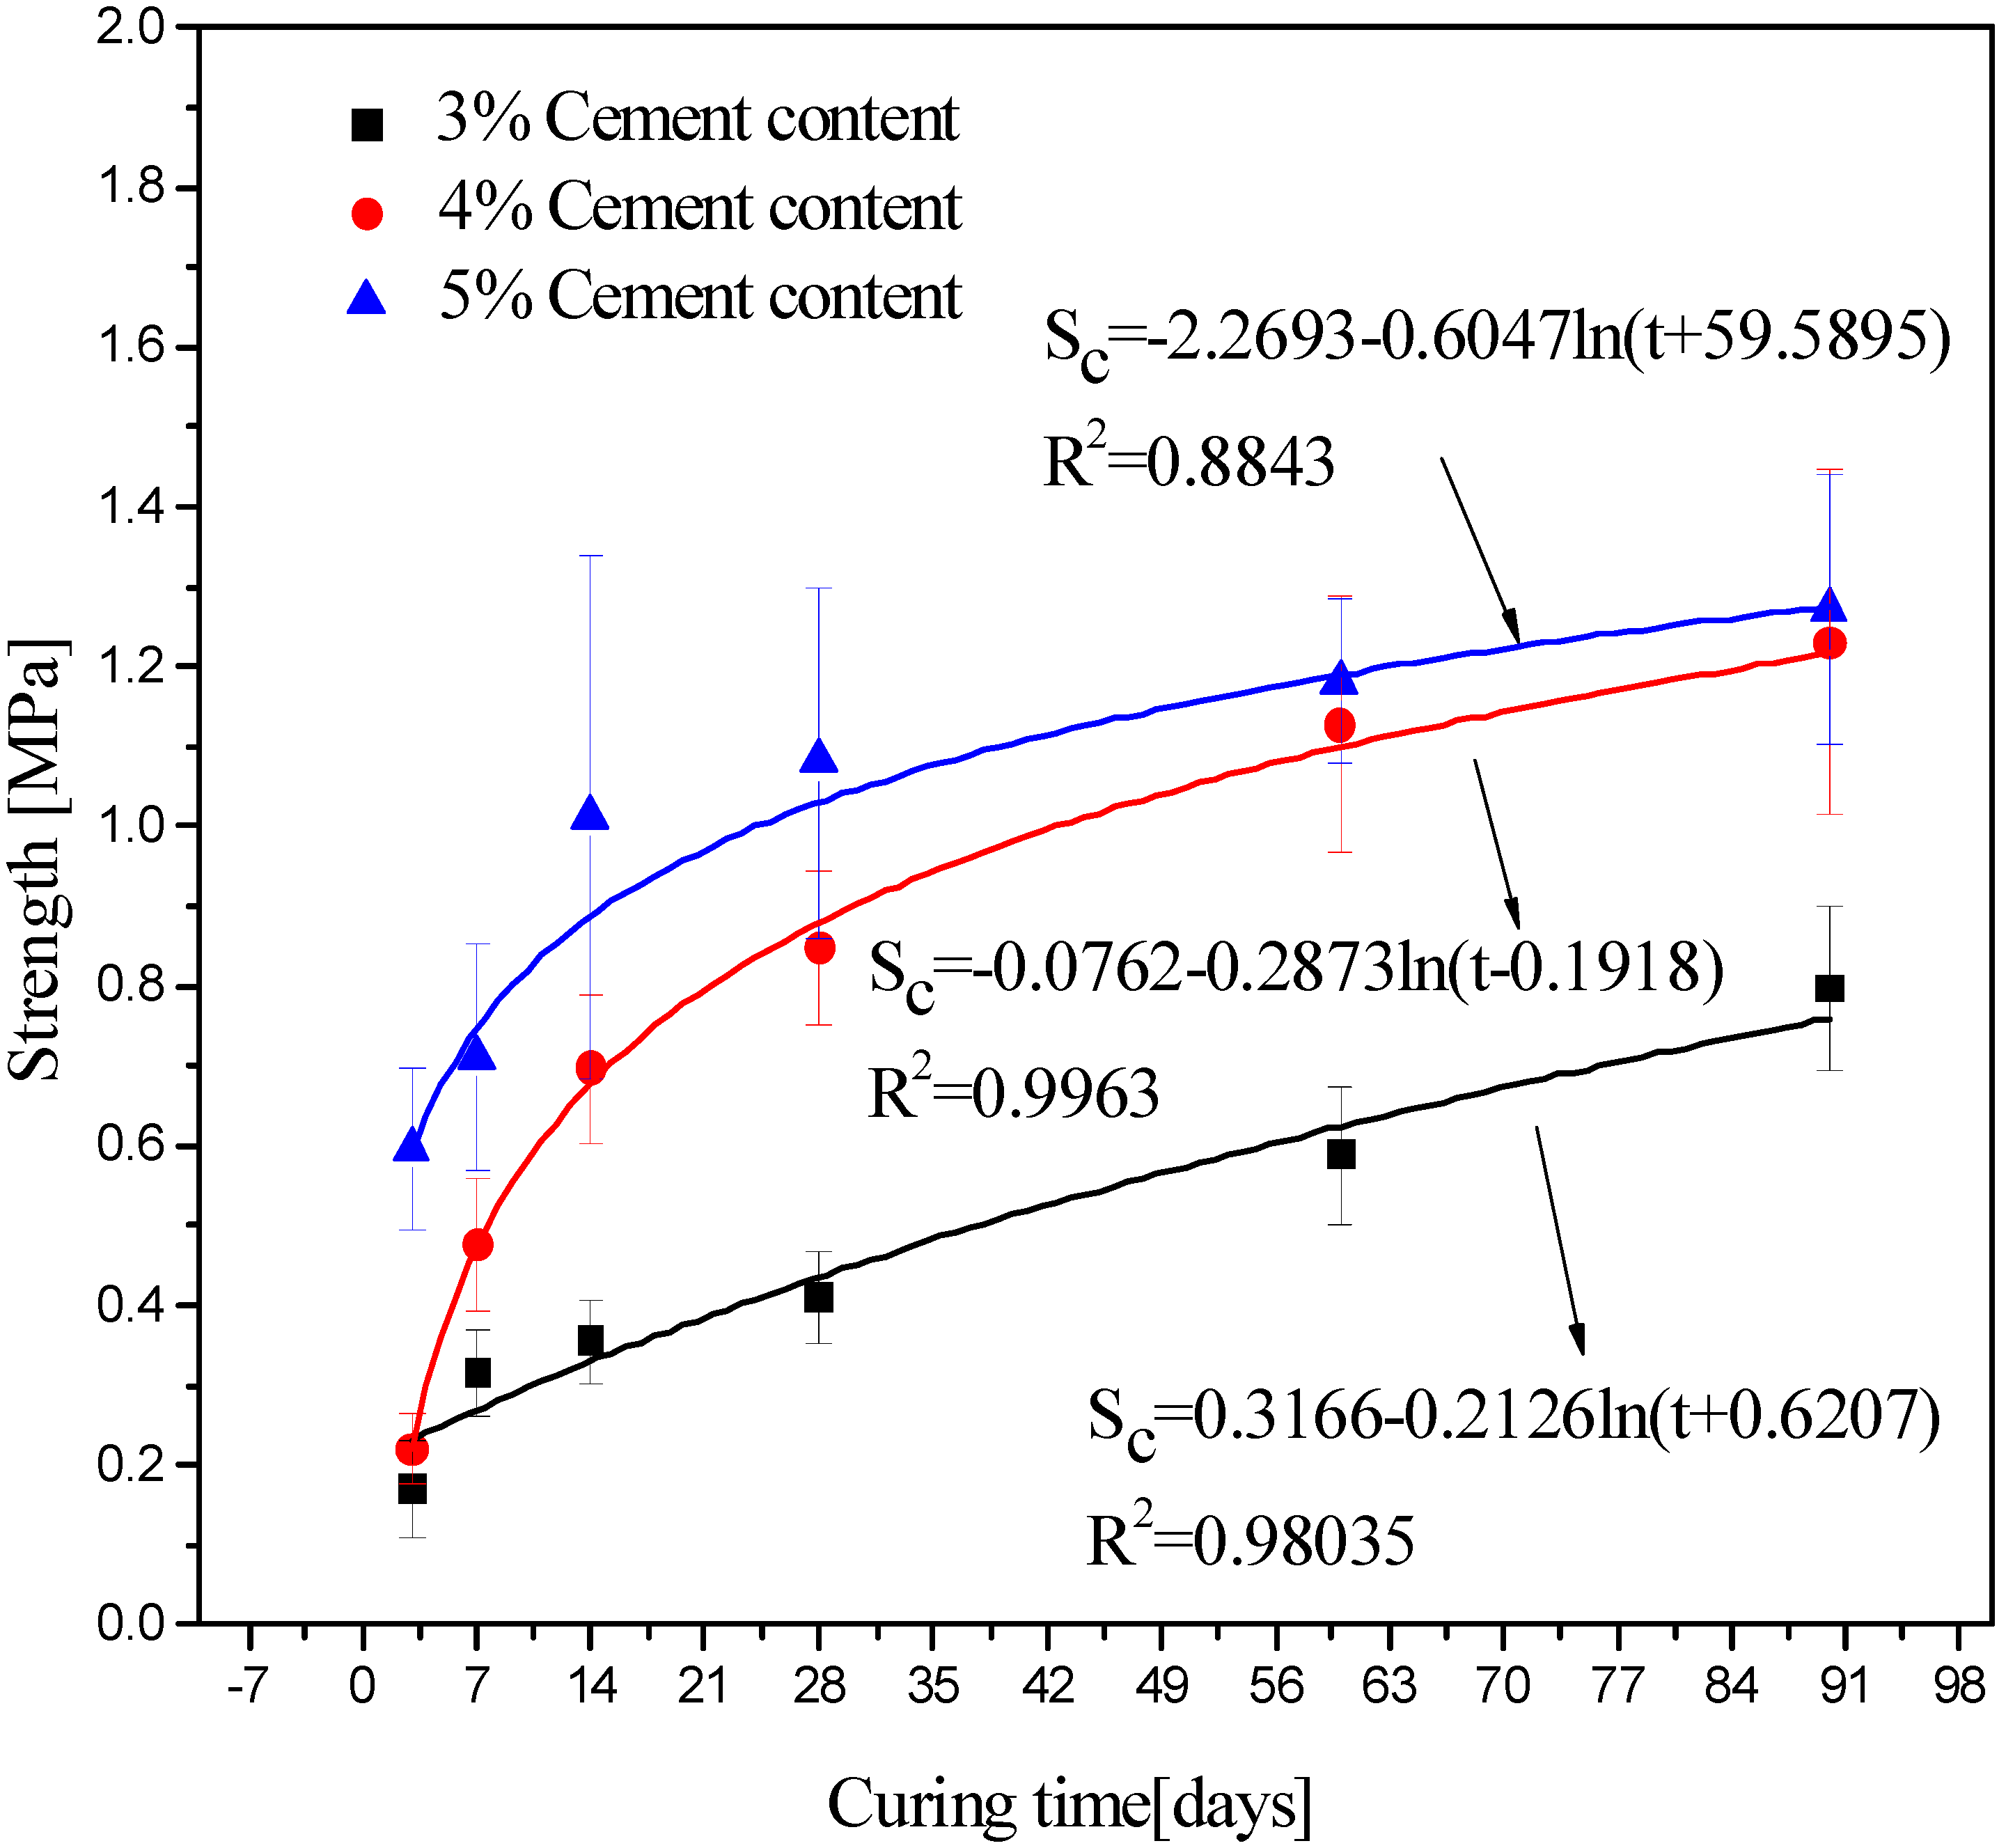
Before performing indirect tensile strength tests, the formed specimens were cured in a standard curing room for 1, 3, 7, 14, 28, 60, and 90 days. According to the Chinese Test Methods of Materials Stabilized with Inorganic Binders for Highway Engineering (JTG E51-2009) [36], strength tests at different curing times and with different cement content were also carried out on the MTS at a loading rate of 1 mm/min. Five parallel tests were carried out at each curing time. In addition, the variation pattern of the indirect tensile strength was described by a logarithmic equation, and the strength test results carried out at different curing times were fitted by Equation (1). Figure 3 shows the fitting results of the indirect tensile strength tests, where R2 is the correlation coefficient of fitting; Sc is the indirect tensile strength; t is the curing time; and a, b, and c are the fitting parameters.
From the fitting results, it can be noted that
- (1)
- The discreteness of indirect tensile strength was small, and basic control was within 15%. The discreteness of indirect tensile strength value was greater than 10% compared to the unconfined compressive strength. The indirect tensile strength showed good agreement with the increase in curing time between different cement contents, which was consistent with the unconfined compressive strength growth trend.
- (2)
- The indirect tensile strength of cement-treated aggregate base materials monotonously increased with the curing time and cement content. The cement content considerably affected the indirect tensile strength. The indirect tensile strength at 3% cement content and 28 days is ~1 MPa, the indirect tensile strength at 5% cement content and 28 days is ~2.2 MPa, i.e., the strength value increased by 2.2 times. At 1–14 days, the unconfined compressive strength of cement-treated aggregate base materials rapidly increased, with a growth rate of ~2 (from 0.8 to 1.6 MPa). At 14–90 days, the growth of indirect tensile strength decreased, but a certain growth trend was still observed (from 1.6 to 2.25 MPa). The Chinese Specification for Design of Highway Asphalt Pavement (JTG D50-2017) [37] has stipulated that the indirect tensile strength of the cement-treated aggregate base materials is about 10% of the unconfined compressive strength. From the test results, it can be observed that the indirect tensile strength at 3% cement content and 90 days is 1.1 MPa which is about 10% of the unconfined compressive strength at 3% cement content and 90 days.
3.3. Flexural Tensile Strength
Flexural tensile strength tests were carried out according to the Chinese Test Methods of Materials Stabilized with Inorganic Binders for Highway Engineering (JTG E51-2009) [36]. The formed large-scale beams specimen with a length of 550 mm and a width and height of 150 mm each were cured in a standard curing room for 3, 7, 14, 28, 60, and 90 days. In addition, strength tests were carried out at different curing times on the MTS at a loading rate of 50 mm/min. Five parallel tests were carried out at each curing time. In addition, the variation pattern of the flexural tensile strength was described by a logarithmic equation. The strength test results at different curing times were fitted by Equation (1). Figure 4 shows the fitting results for flexural tensile strength, where R2 is the correlation coefficient of fitting; Sc is the flexural tensile strength; t is the curing time; and a, b, and c are the fitting parameters.
From the fitting results, it can be noted that
- (1)
- A large variation coefficient for the flexural tensile strength of the large-scale beams specimen was obtained, which was difficult to control within 15%, and discreteness monotonously increased with the cement content. With the same cement content, the flexural tensile strength increased with the curing time. Before 28 days, the growth rate was relatively rapid, the strength value increased 2-fold (from 0.6 to 1.15 MPa), and after 28 days, the growth rate tended to be nearly stable, and the strength value increased by 0.85 times (from 1.15 to 1.35 MPa).
- (2)
- The flexural tensile strength of cement-treated aggregate base materials also monotonously increased with the curing time and cement content. The result was consistent with the growth trend of unconfined compressive strength and indirect tensile strength. The flexural tensile strength for the sample cured for 90 days tended to be stable, and with the increase in the cement content by 1%, the flexural tensile strength was multiplied, the flexural tensile strength at 3% cement content and 28 days is ~0.4 MPa, the flexural tensile strength at 5% cement content and 28 days is ~1.15 MPa. Simultaneously, the effect of the cement content on the strength of the cement-treated aggregate base material is larger than the curing time. The flexural tensile strength was also consistent with the growth trend of unconfined compressive strength. The Chinese Specification for Design of Highway Asphalt Pavement (JTG D50-2017) [37] has used the flexural tensile strength as the strength index of the inorganic binder. The flexural tensile strength at 90 days is ~1.35 MPa which is very close to the requirements.
4. Results and Analysis of Fatigue Tests of Cement-Treated Aggregate Base Materials under Different Stress States
4.1. Fatigue Test Results
In addition, fatigue tests were carried out on the MTS in the same manner as the strength tests; however, fatigue tests were also carried out under unconfined compressive, flexural tensile, and indirect tensile stress states. Generally, the average speed of vehicles on the road is about 60~80 km/s, at which point the pavements receive a loading frequency nearly equivalent to 10 Hz. Thus, the samples were continuously subjected to sinusoidal wave which was implemented as the loading waveform with a loading frequency of 10 Hz. The fracture of the specimen was utilized as the material fatigue failure criterion.
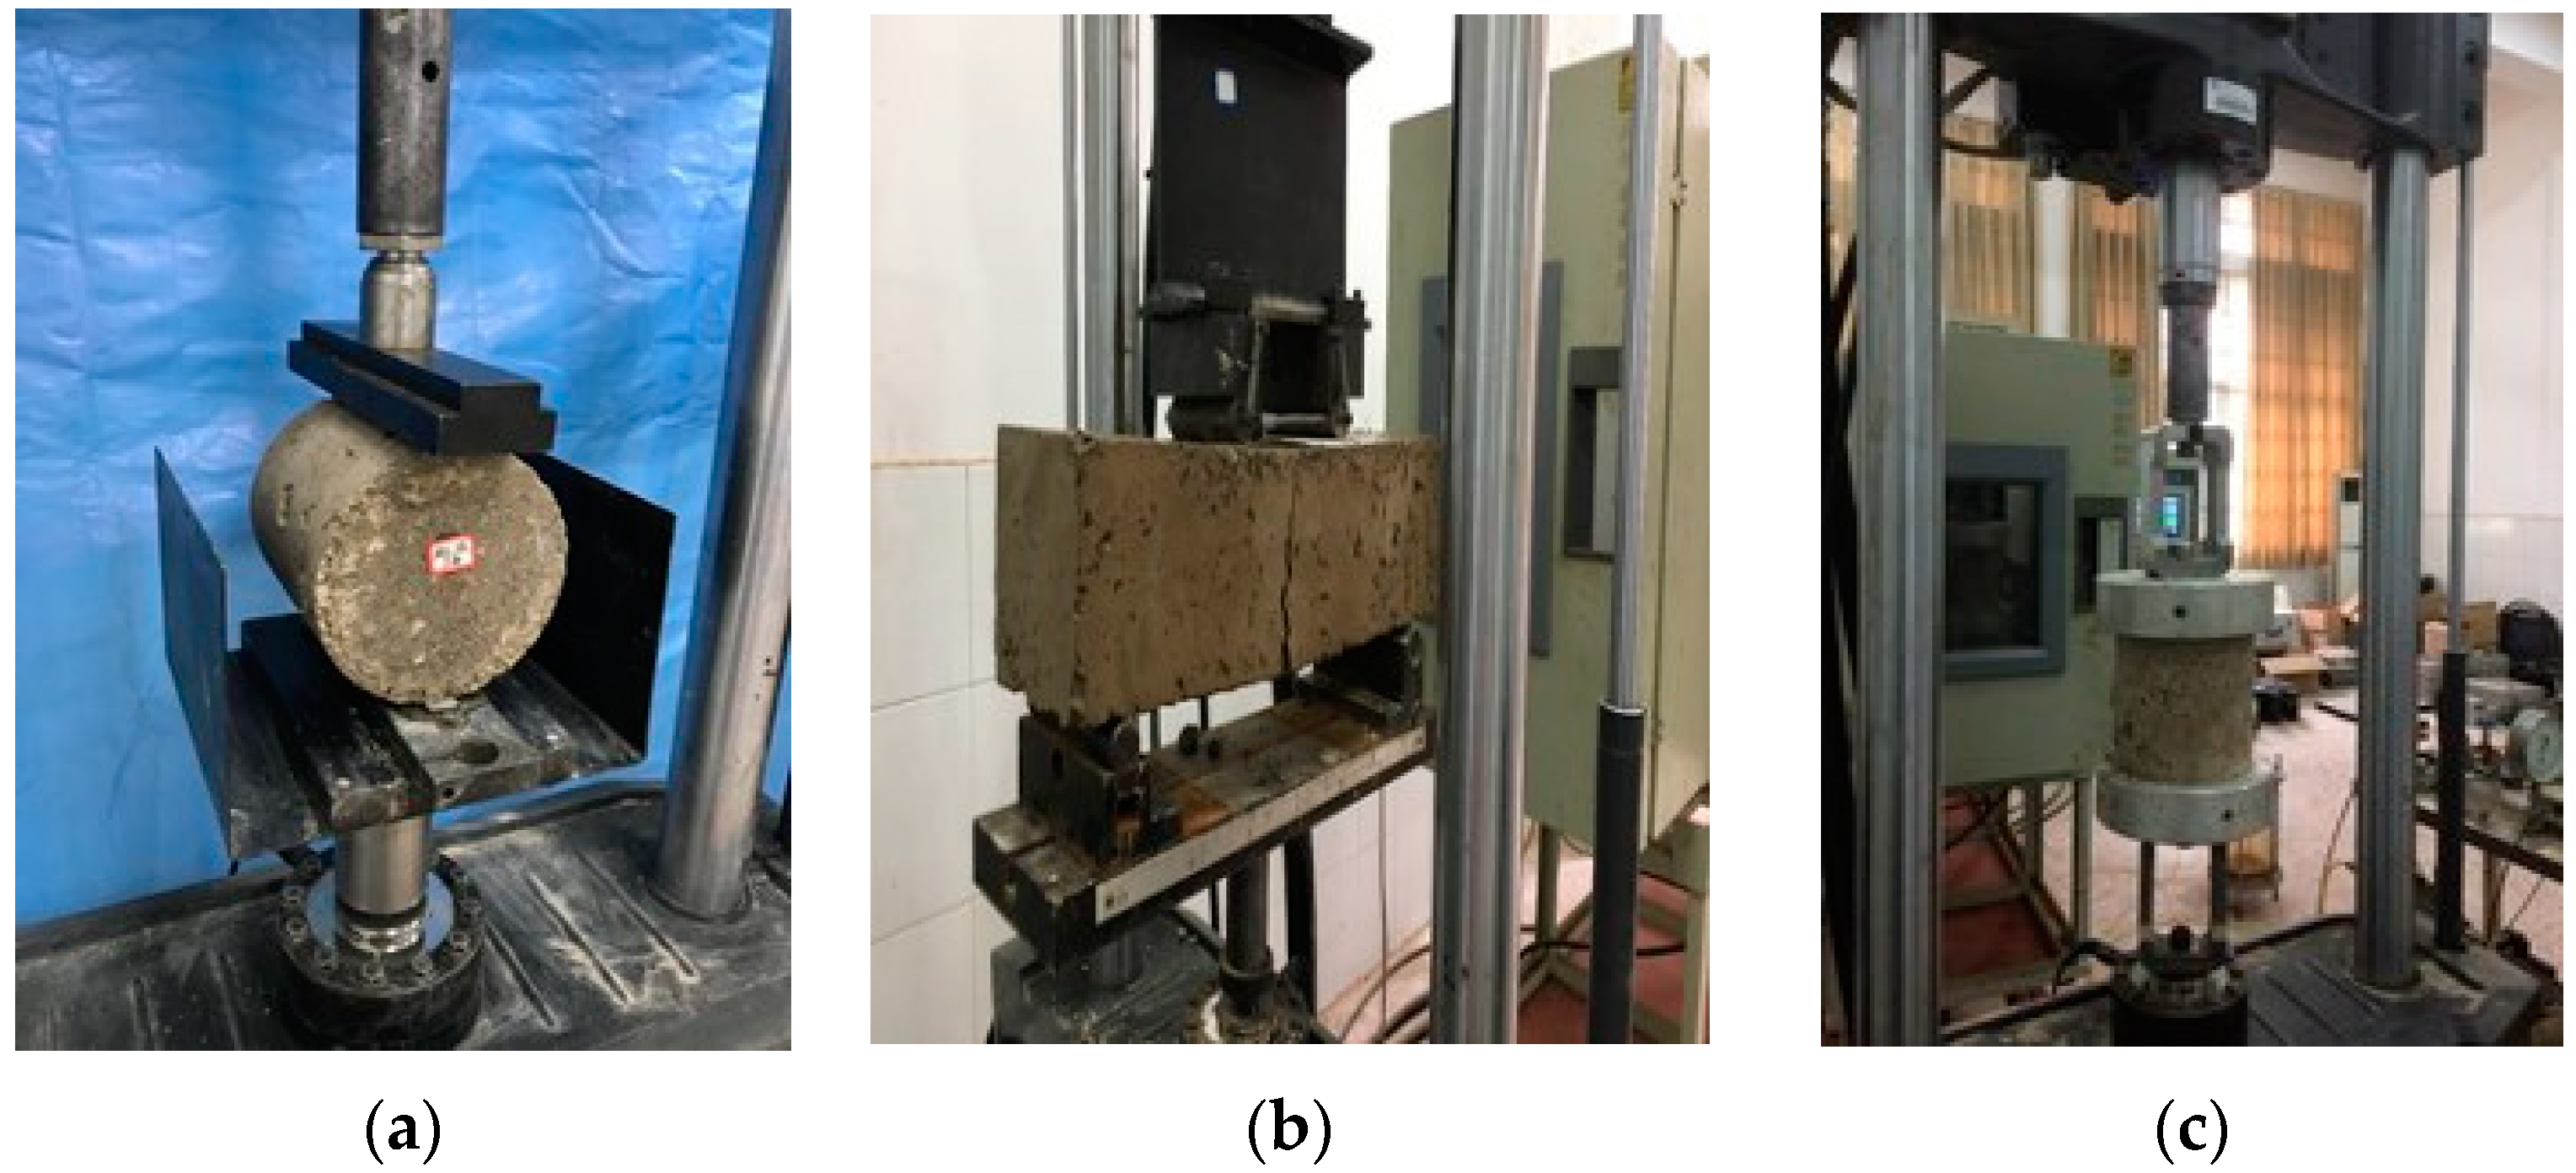
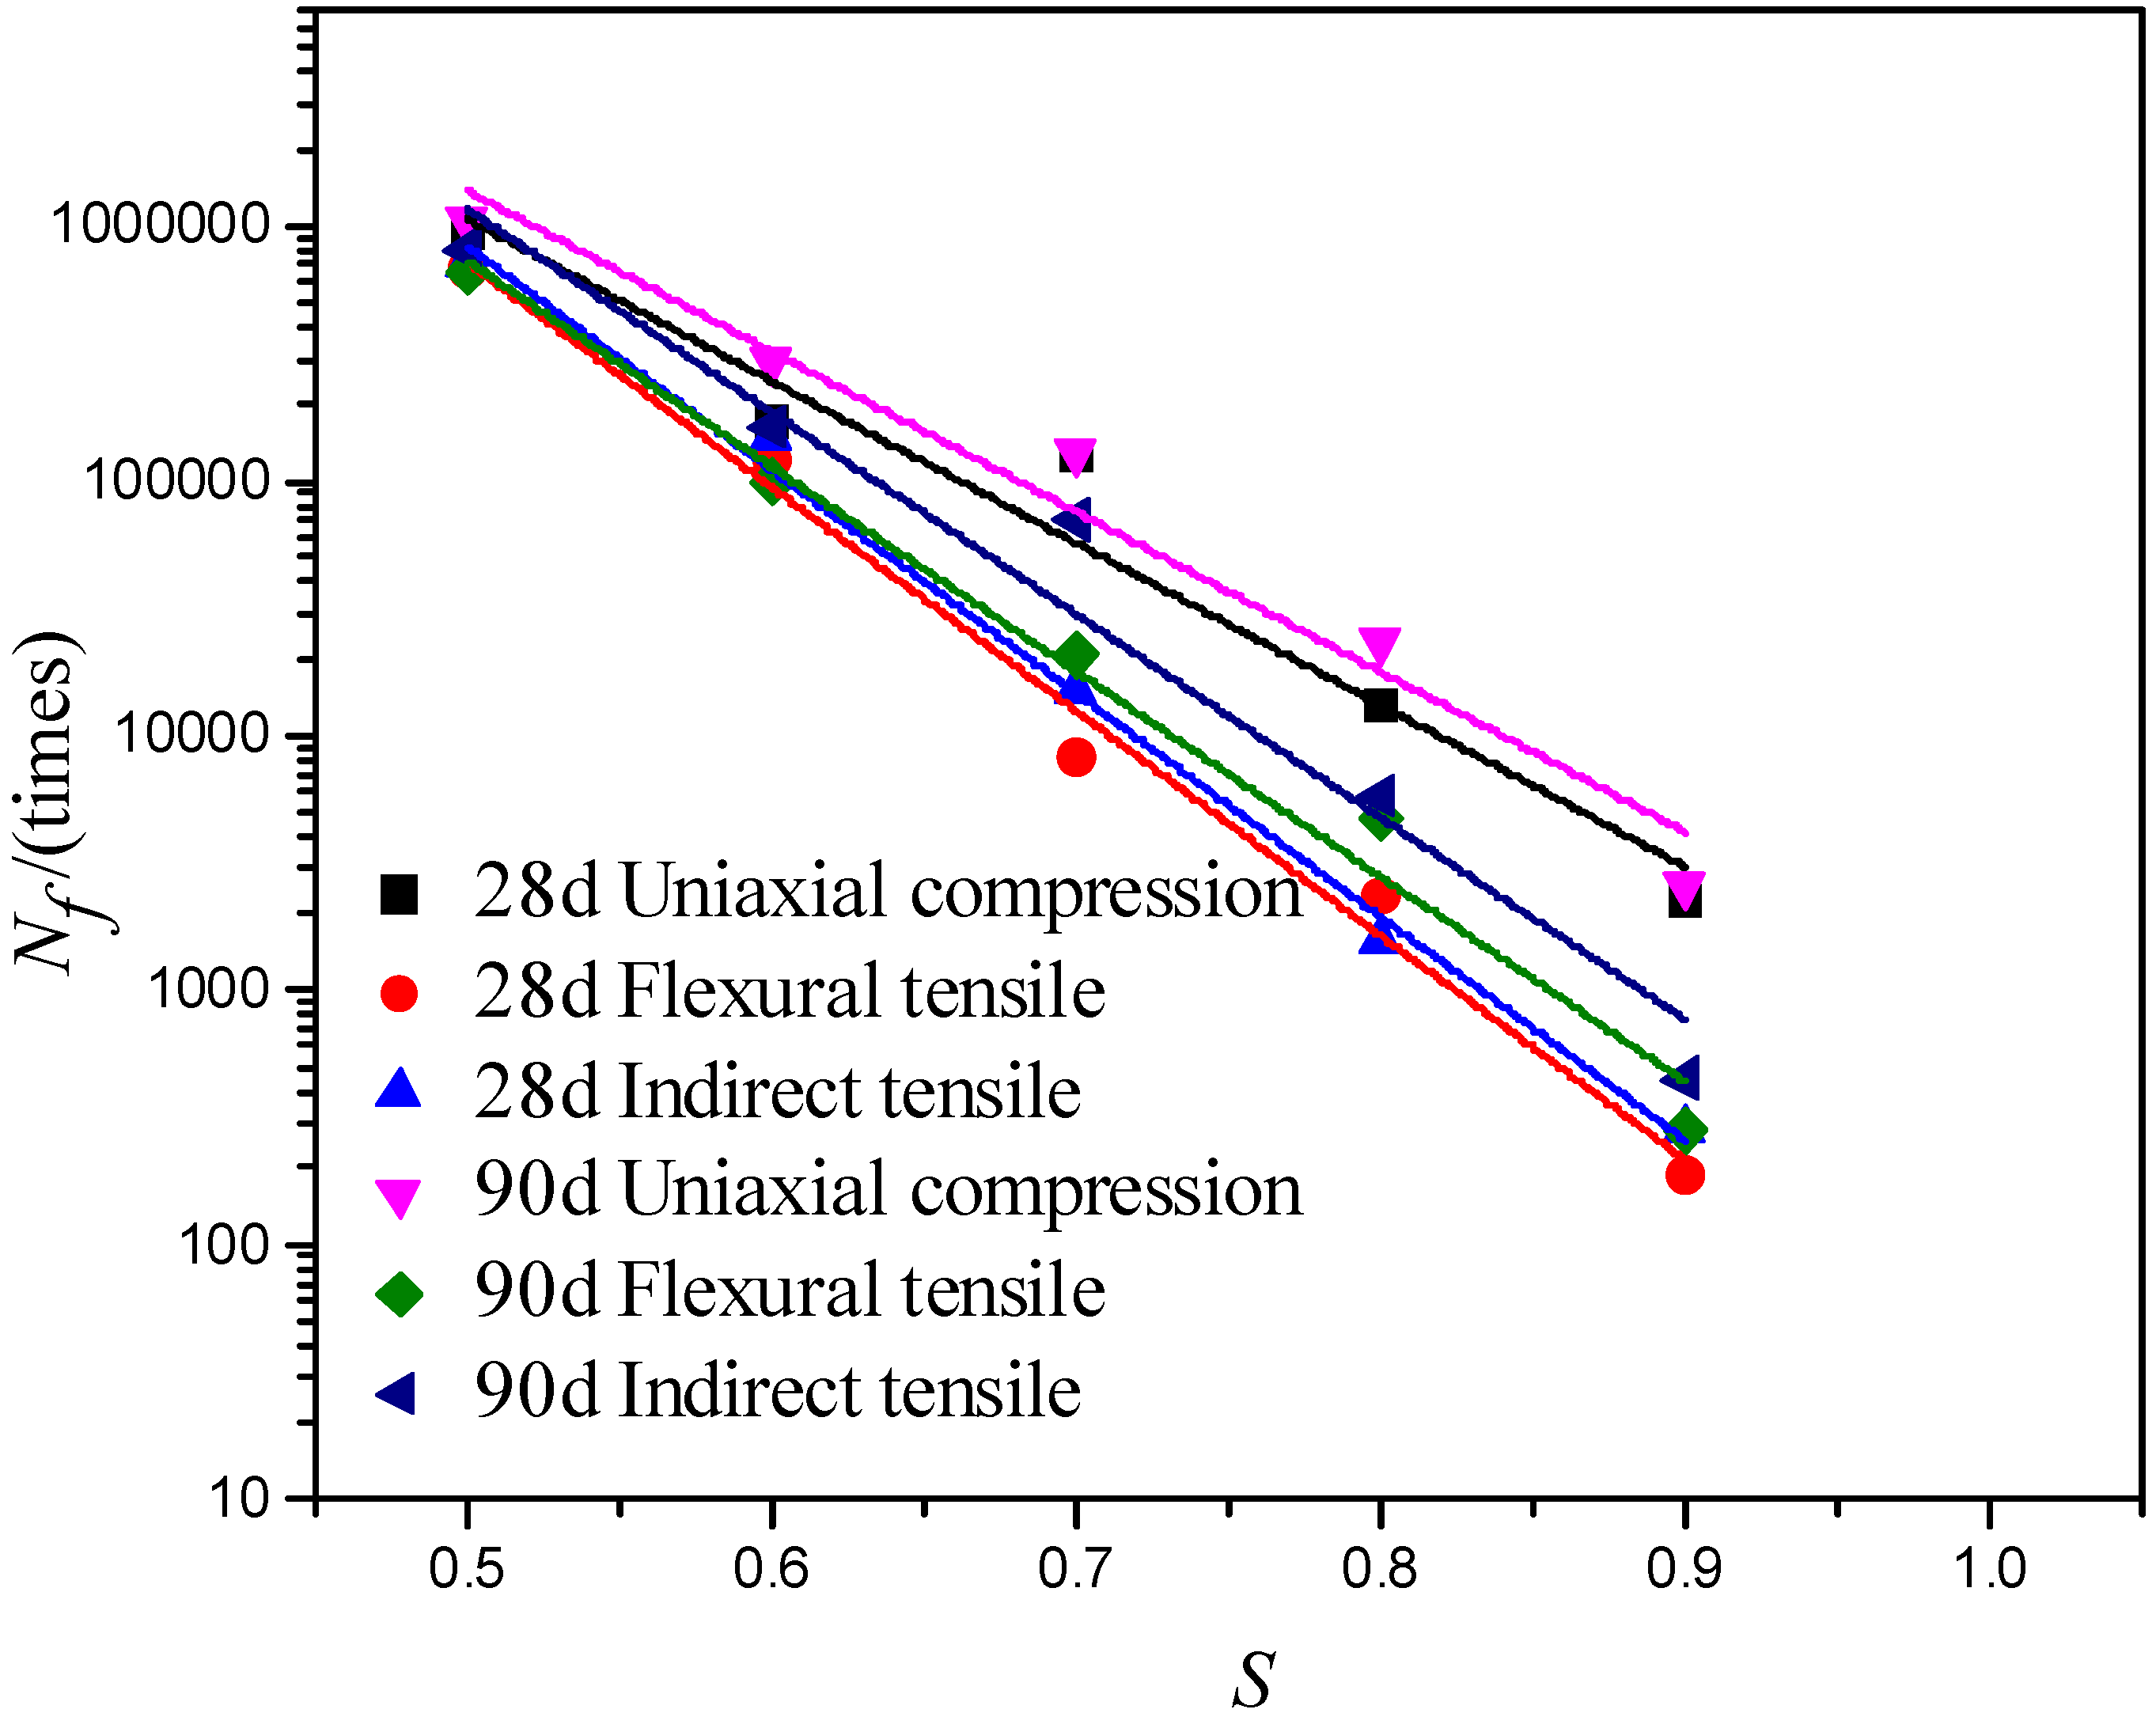
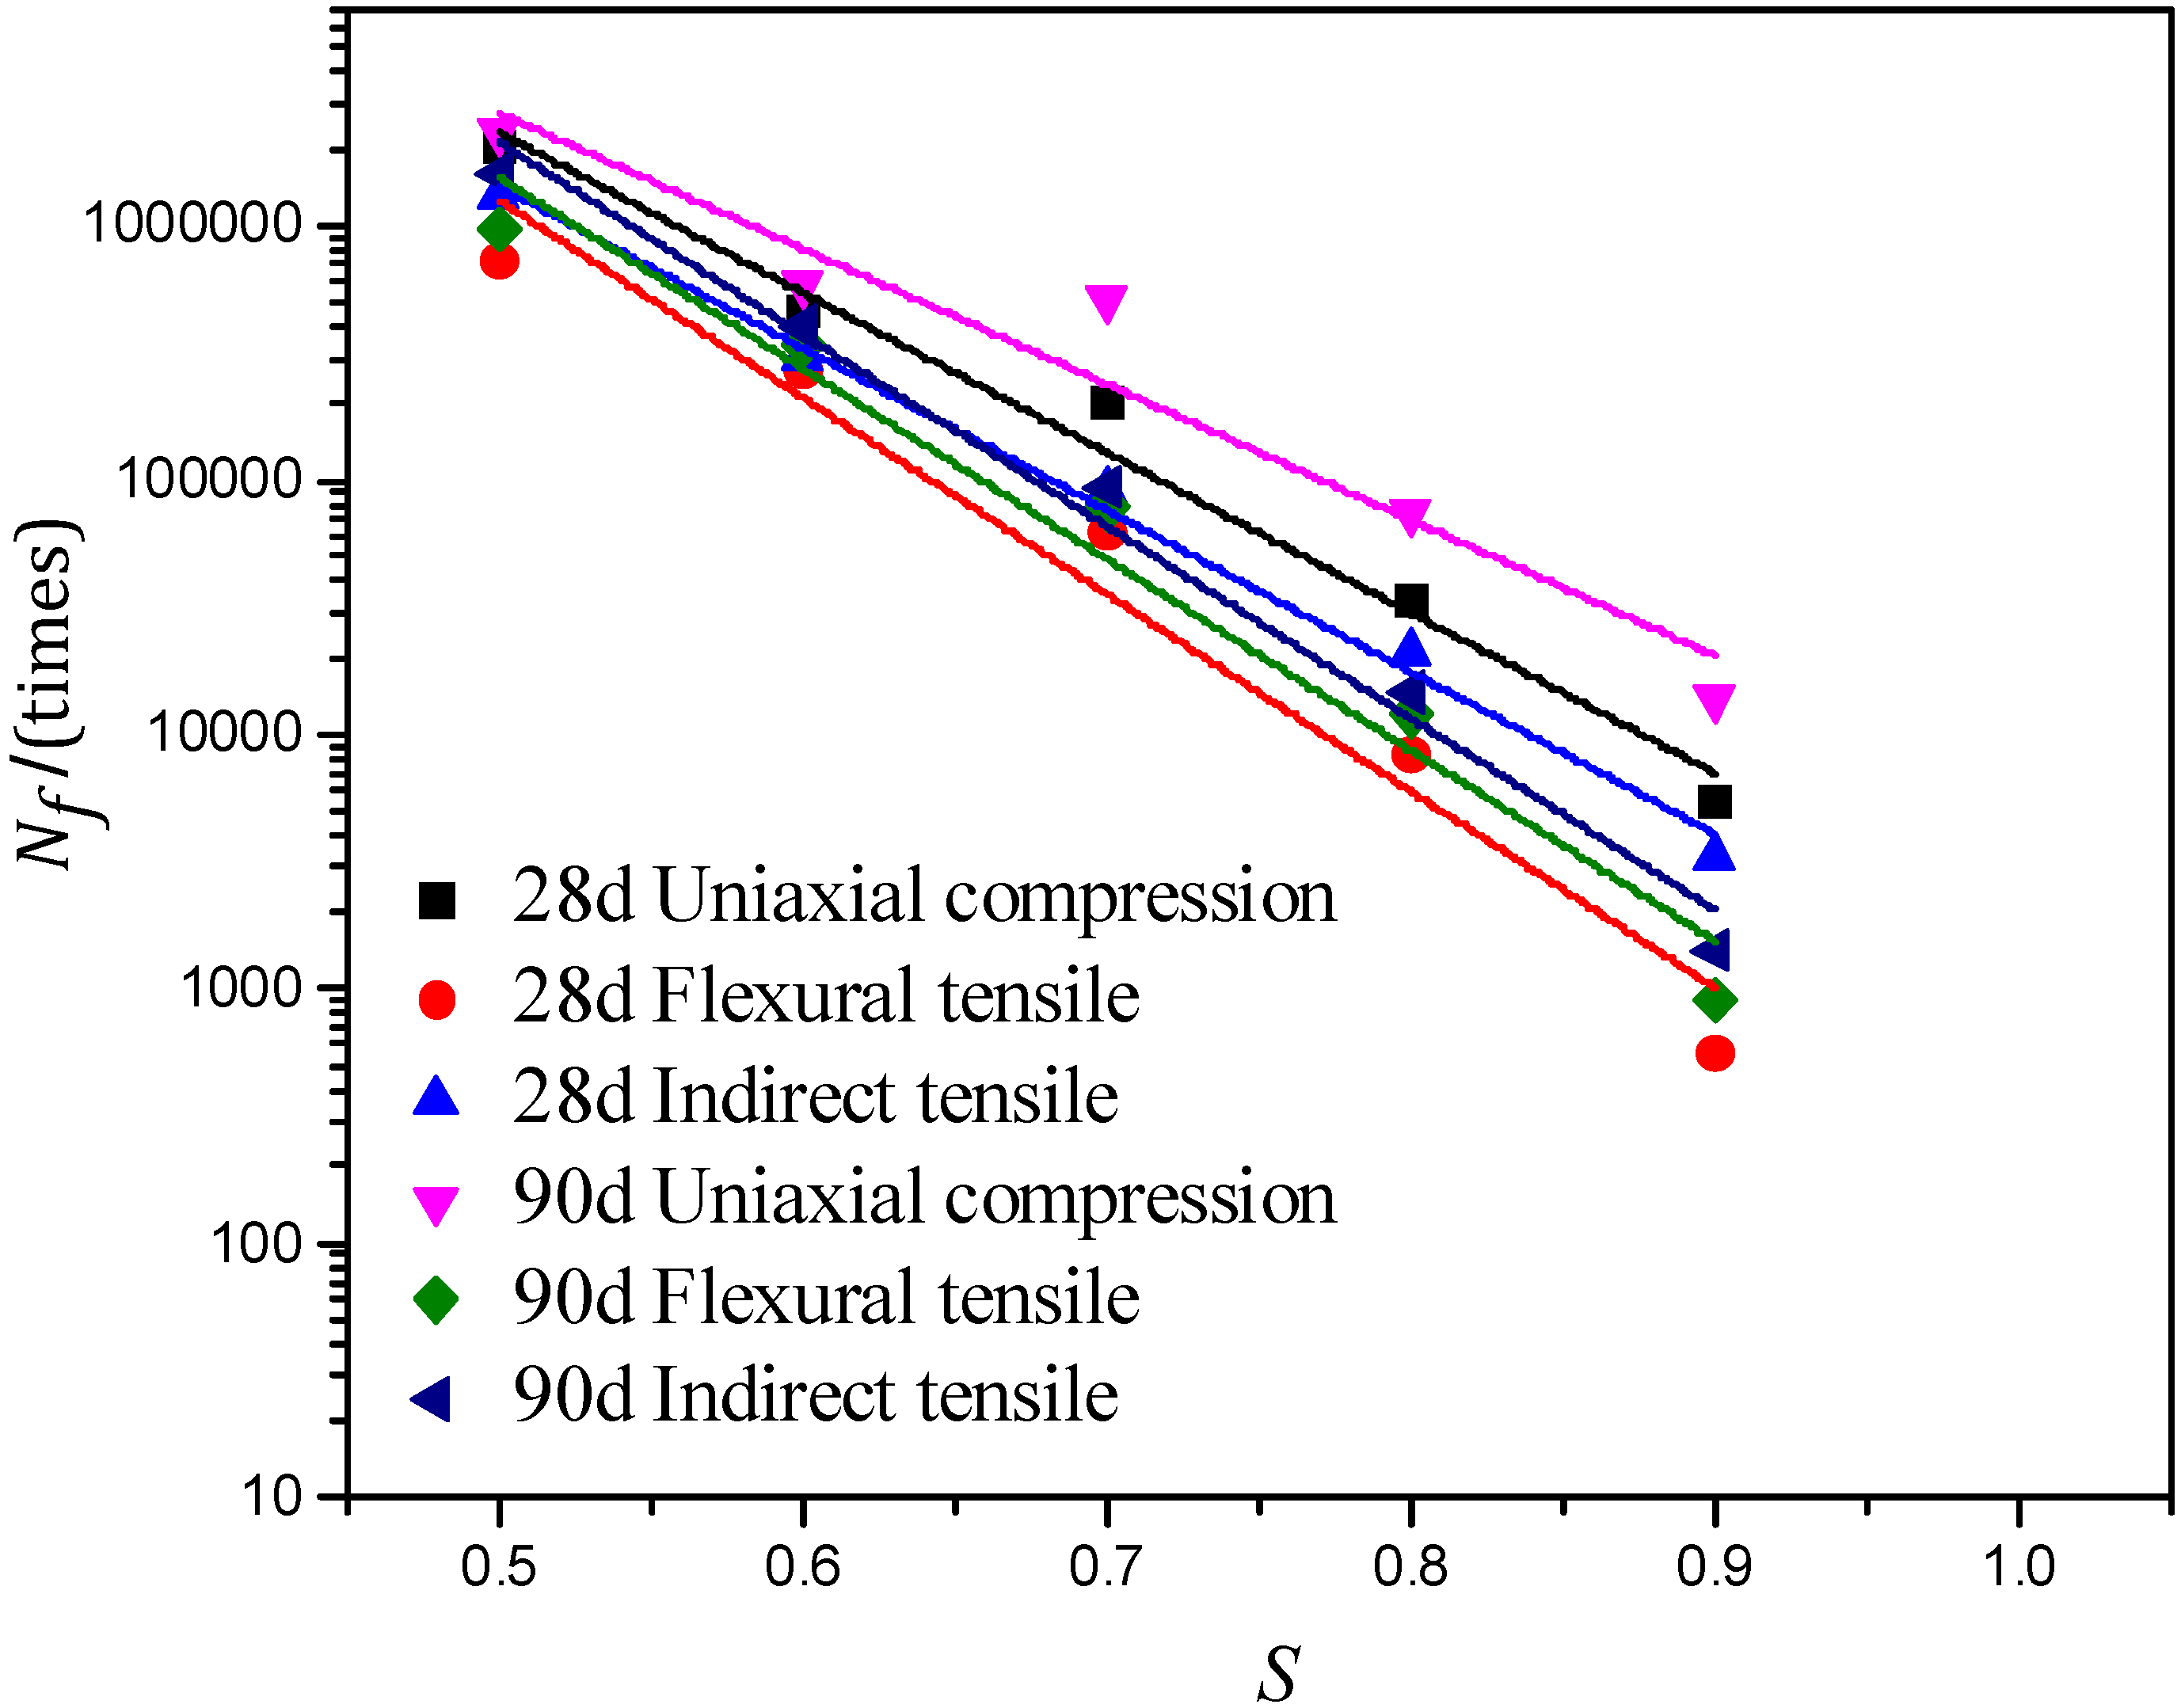
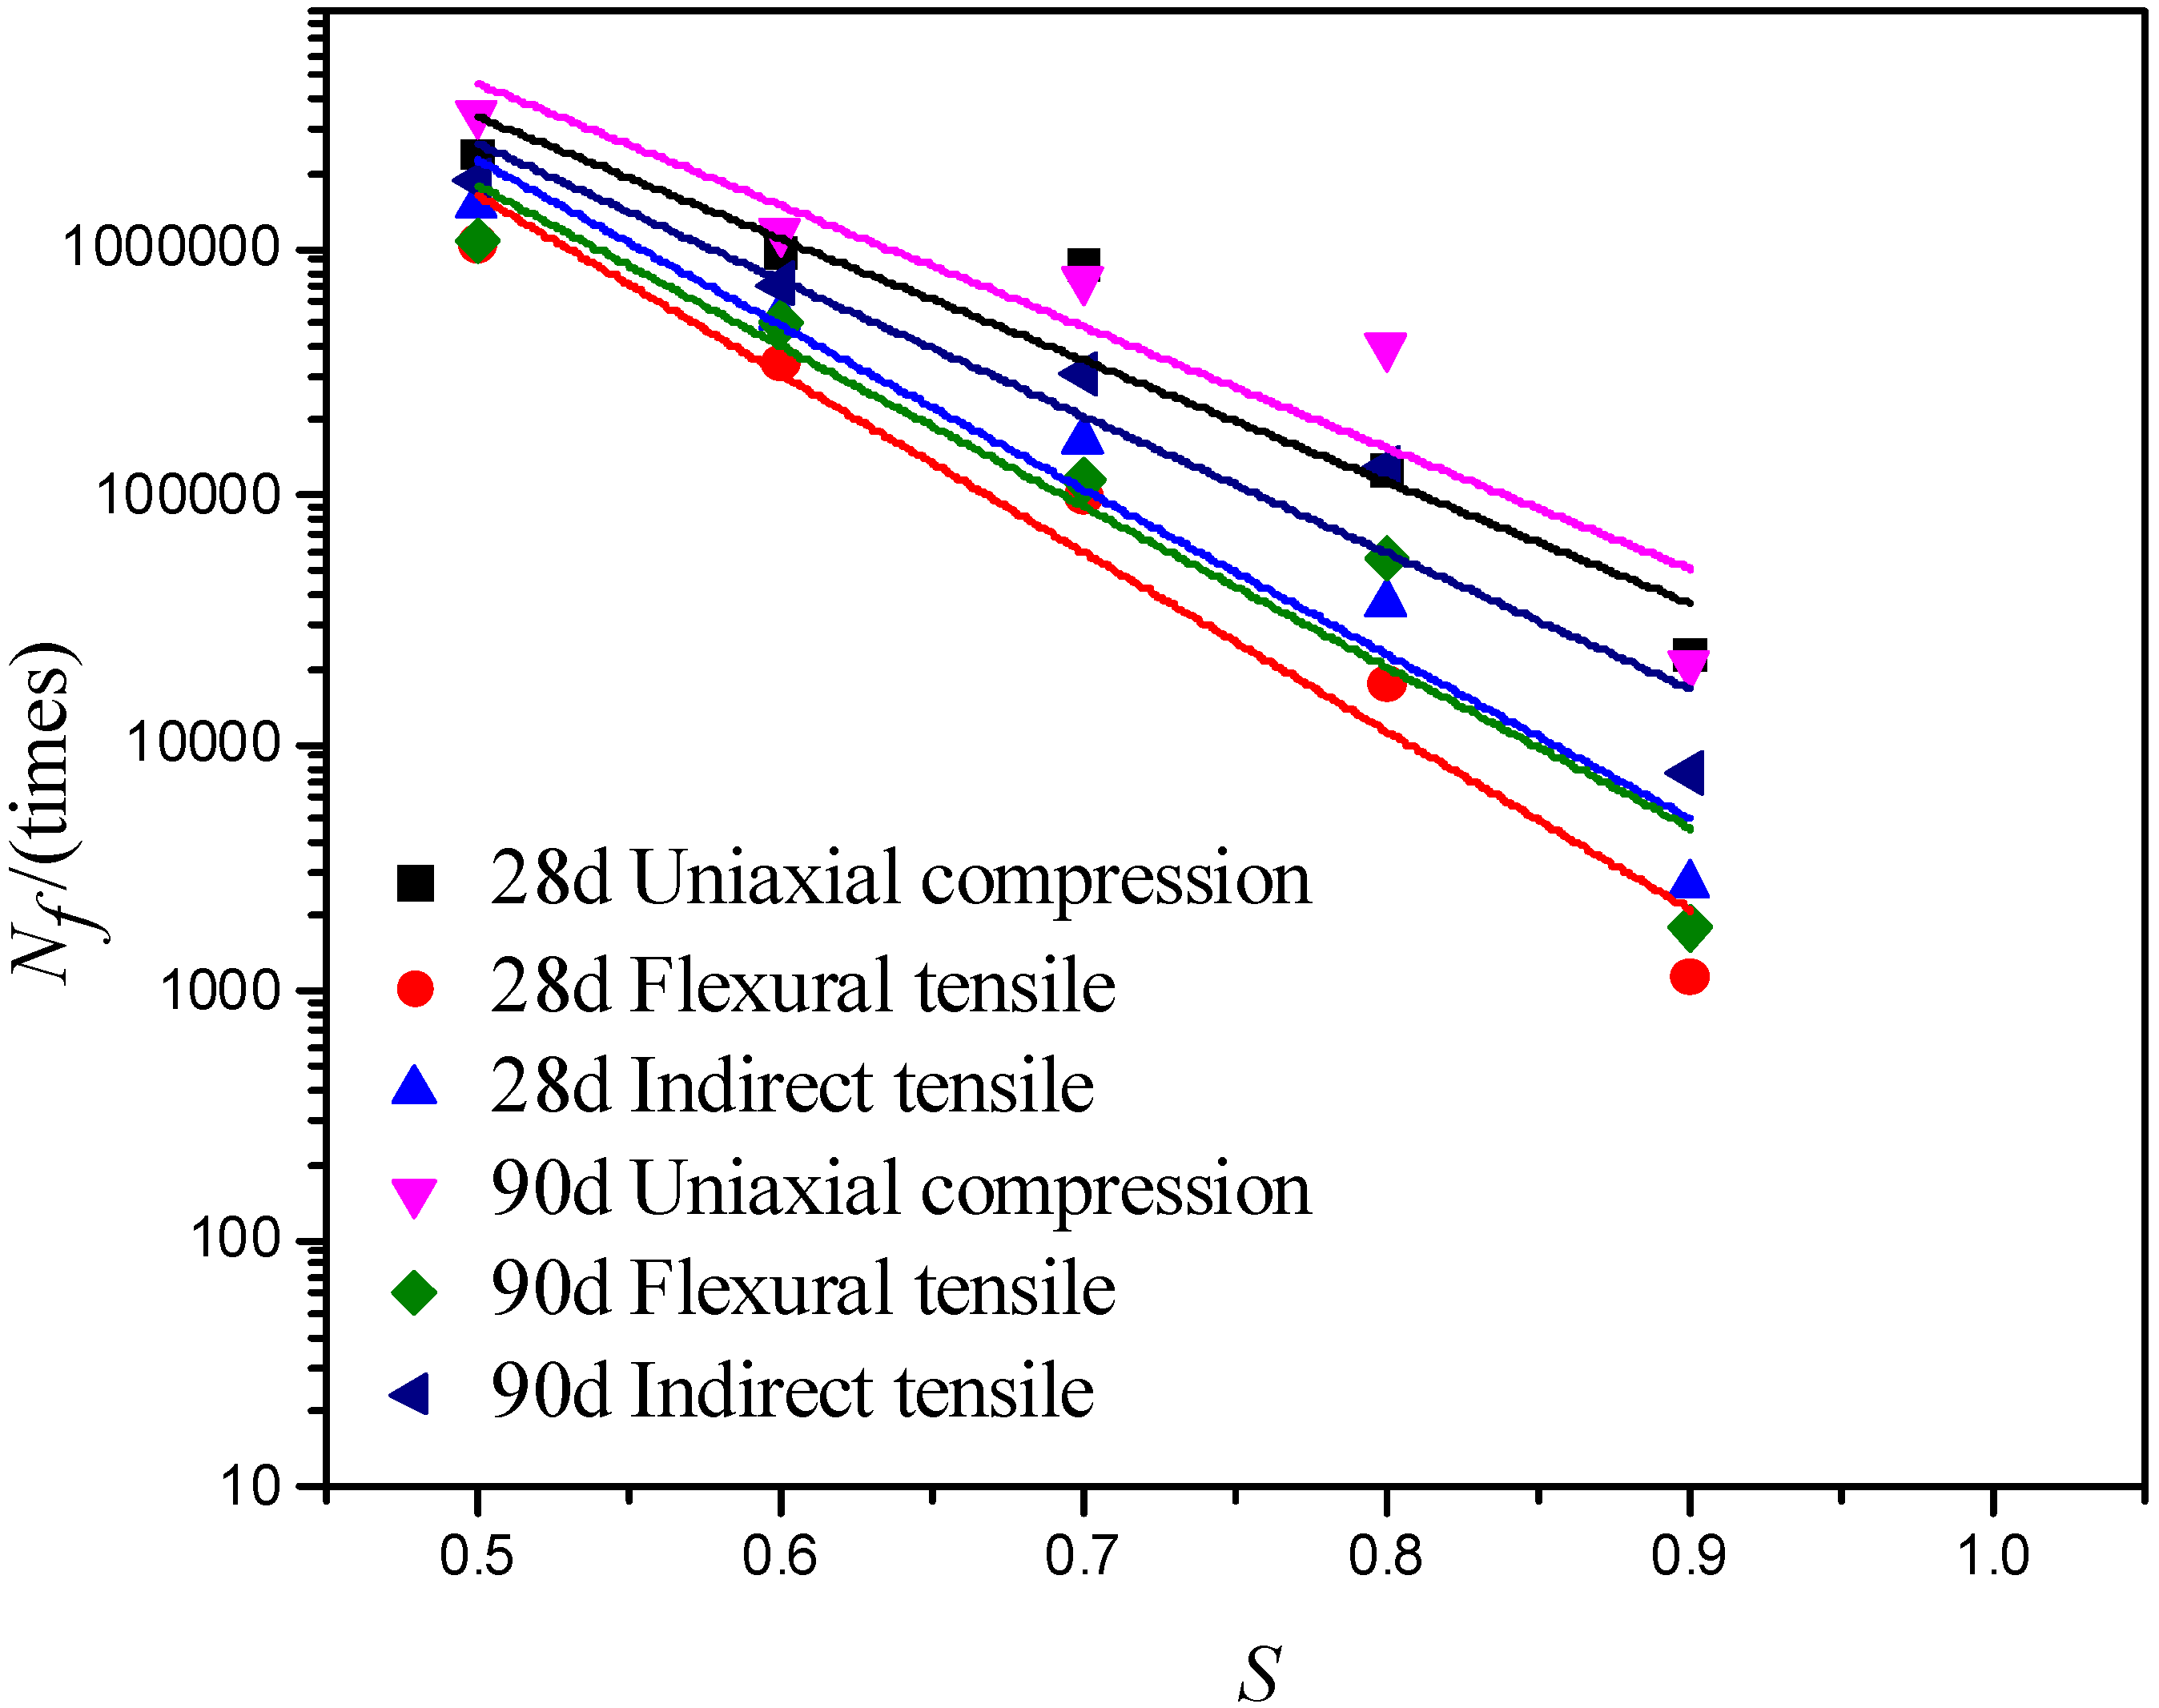
The same specimen size was utilized for the strength test. The curing times were 28 days and 90 days; the cement content was 3–5%, and the selected stress ratios were 0.5, 0.6, 0.7, 0.8, and 0.9. Fatigue tests were carried out with each cement content under different stress ratios and different stress states, and five parallel tests were carried out at each stress ratio. Owing to the variability of the specimen strength and the micro-cracks in the cement-treated aggregate base materials, the cement in some specimens was not completely combined with the aggregate in the specimen, and certain inhomogeneities were noted in the existing specimen-forming process. Owing to these reasons that increased the discreetness of the fatigue test results, some of the large discrete test data were eliminated. The details of the strength and fatigue tests under different stress states are shown in Figure 5. Figure 6, Figure 7 and Figure 8 show the test results where Nf is fatigue life(times), S is stress ratio.
From the above Figure 6, Figure 7 and Figure 8 and the Table 5, Table 6 and Table 7. It can be observed that:
- (1)
- The fatigue life of cement-treated aggregate base materials monotonously increased with the curing time and cement content, monotonously decreased with stress ratio and the fatigue life followed the order of unconfined compressive > indirect tensile > flexural tensile. The result was similar to the growth trend of cement-treated aggregate base materials strength. The fatigue life of unconfined compressive at 5% cement content and 90 days was the longest, and that of flexural tensile at 3% cement content and 28 days, the smallest. Test results revealed that the curing time, cement content and stress states considerably affected the fatigue life of cement-treated aggregate base materials. Test results were similar to former studies [3,7,24,38,39,40].
- (2)
- The magnitude of the parameters a and b of the fatigue equation varied in a wide range, and the curing time and cement content considerably affected the parameters a and b. Parameter a reflected the slope of the fatigue curve, and the parameter a followed the order of flexural tensile > indirect tensile > unconfined compressive. On the other hand, parameter b reflected the intercept of the fatigue curve, and parameter b was significantly different under different stress states. Parameter b followed the order of unconfined compressive > flexural tensile > indirect tensile. Furthermore, similar to previous researchers [14,16,17,38,39], the values of parameter a were accessible to change with the types of the test conditions and the stress states.
- (3)
- The fitting equation for unconfined compressive fatigue is far from the flexural tensile and indirect tensile strength curves, and the S-N single logarithmic fatigue equations of cement-treated aggregate base materials under different stress states exhibit large differences. The fitting correlation coefficient was too low as shown in Table 5, Table 6 and Table 7. Therefore, it was not possible to analyze the fatigue performance of cement-treated aggregate base materials by comparing the fatigue curve obtained under different stress conditions and to scientifically evaluate the fatigue characteristics of cement-treated aggregate base materials and realize scientific transformation from material fatigue to structural fatigue under different stress states.
To summarize, there would be an obvious error if the conventional S-N fatigue equations were used to analyze the fatigue properties of cement-treated aggregate base materials, and parameters a and b of the conventional S-N fatigue equations varied with the stress states and other factors even for the same material, which made it almost impossible to assess the fatigue properties of cement-treated aggregate base materials precisely. Hence, it is essential to establish a standardization analysis method of fatigue characteristics under different stress states.
4.2. Establishing the Fatigue Equation Based on the Weibull Distribution of Point Parameters
Notably, from the fatigue test results under different stress states in Figure 6, Figure 7 and Figure 8, the fatigue life exhibited discreteness and variability under different stress states by fitting the conventional S-N fatigue equation. However, even at the same stress ratio and the same cement content, the fatigue life of the specimen can be considerably discrete, which was related to the molding method of the specimen; curing and test conditions; and internal structural cracks of the material. In this study, to decrease the effect of the stress state, specimen shape, and size on the analysis and evaluation of fatigue characteristics and objectively investigate the laws of fatigue life and achieve standardization, statistical analysis and reliability principles were introduced to analyze these data.
Current studies have suggested that fatigue life generally obeys a lognormal distribution; however, in recent years, some studies proposed very sophisticated modeling approaches by two-parameter or three-parameter Weibull distribution from statistical viewpoint [18,23,25,26] to simulate the probability distribution of fatigue life. According to the Weibull distribution theory, the safe life or the minimum safe life in the range of an extremely high guarantee rate (99–100%) is still in agreement with the actual situation. For long-lived zones with a fatigue life of greater than 106 cycles, some test results were also approximately in accordance with the Weibull distribution, given a safe life in the long-life zone. The Weibull distribution exhibited a fatigue life with a 100% survival rate, which was better from the degree of fitting with empirical probability and more suitable for brittle materials. Currently, the fatigue equation with a guarantee rate of 95% is generally selected as the design basis for a road base layer in China. Therefore, the Weibull distribution theory is utilized to process the data obtained from the fatigue tests of semi-rigid base materials.
From current research [3,7,19,20,21,24], the fatigue life Nf and equivalent fatigue life Ni of cement-treated aggregate base materials obey the two-parameter Weibull distribution, and then the guarantee rate ρ should satisfy the following formula:
where m and t0 are the shape and scale parameters, respectively, R is cyclic eigenvalues.
Ni = N1−R
Table 8 summarizes the data from the Weibull distribution of the fatigue life shown in Figure 6, Figure 7 and Figure 8 according to Equation (4). Owing to space limitations, only one stress state and the cement content randomly selected under each stress ratio of the Weibull distribution of the fatigue life were listed.
Results obtained from the Weibull distribution test summarized in Table 8 revealed that the fatigue life and equivalent fatigue life were subject to a two-parameter Weibull distribution, and the correlation coefficient was extremely good. By substituting the regression coefficient obtained by the Weibull distribution test into Equation (4), and then multiplying the result by R (cyclic eigenvalues), an equivalent fatigue life (Ni) of 95% for different stress states, different curing times, and different cement content was obtained. This relationship has been obtained for fatigue life and equivalent fatigue life at different stress states, different curing times and cement content. Then, Equation (5) was used, where a single logarithmic fatigue equation fitted the standardization equations for the fatigue characteristics for different cement content, different stress states, and different curing times with a guaranteed rate of 95%.
where S is the stress ratio; a, b are the regression coefficients; and Ni is the equivalent fatigue life (times).
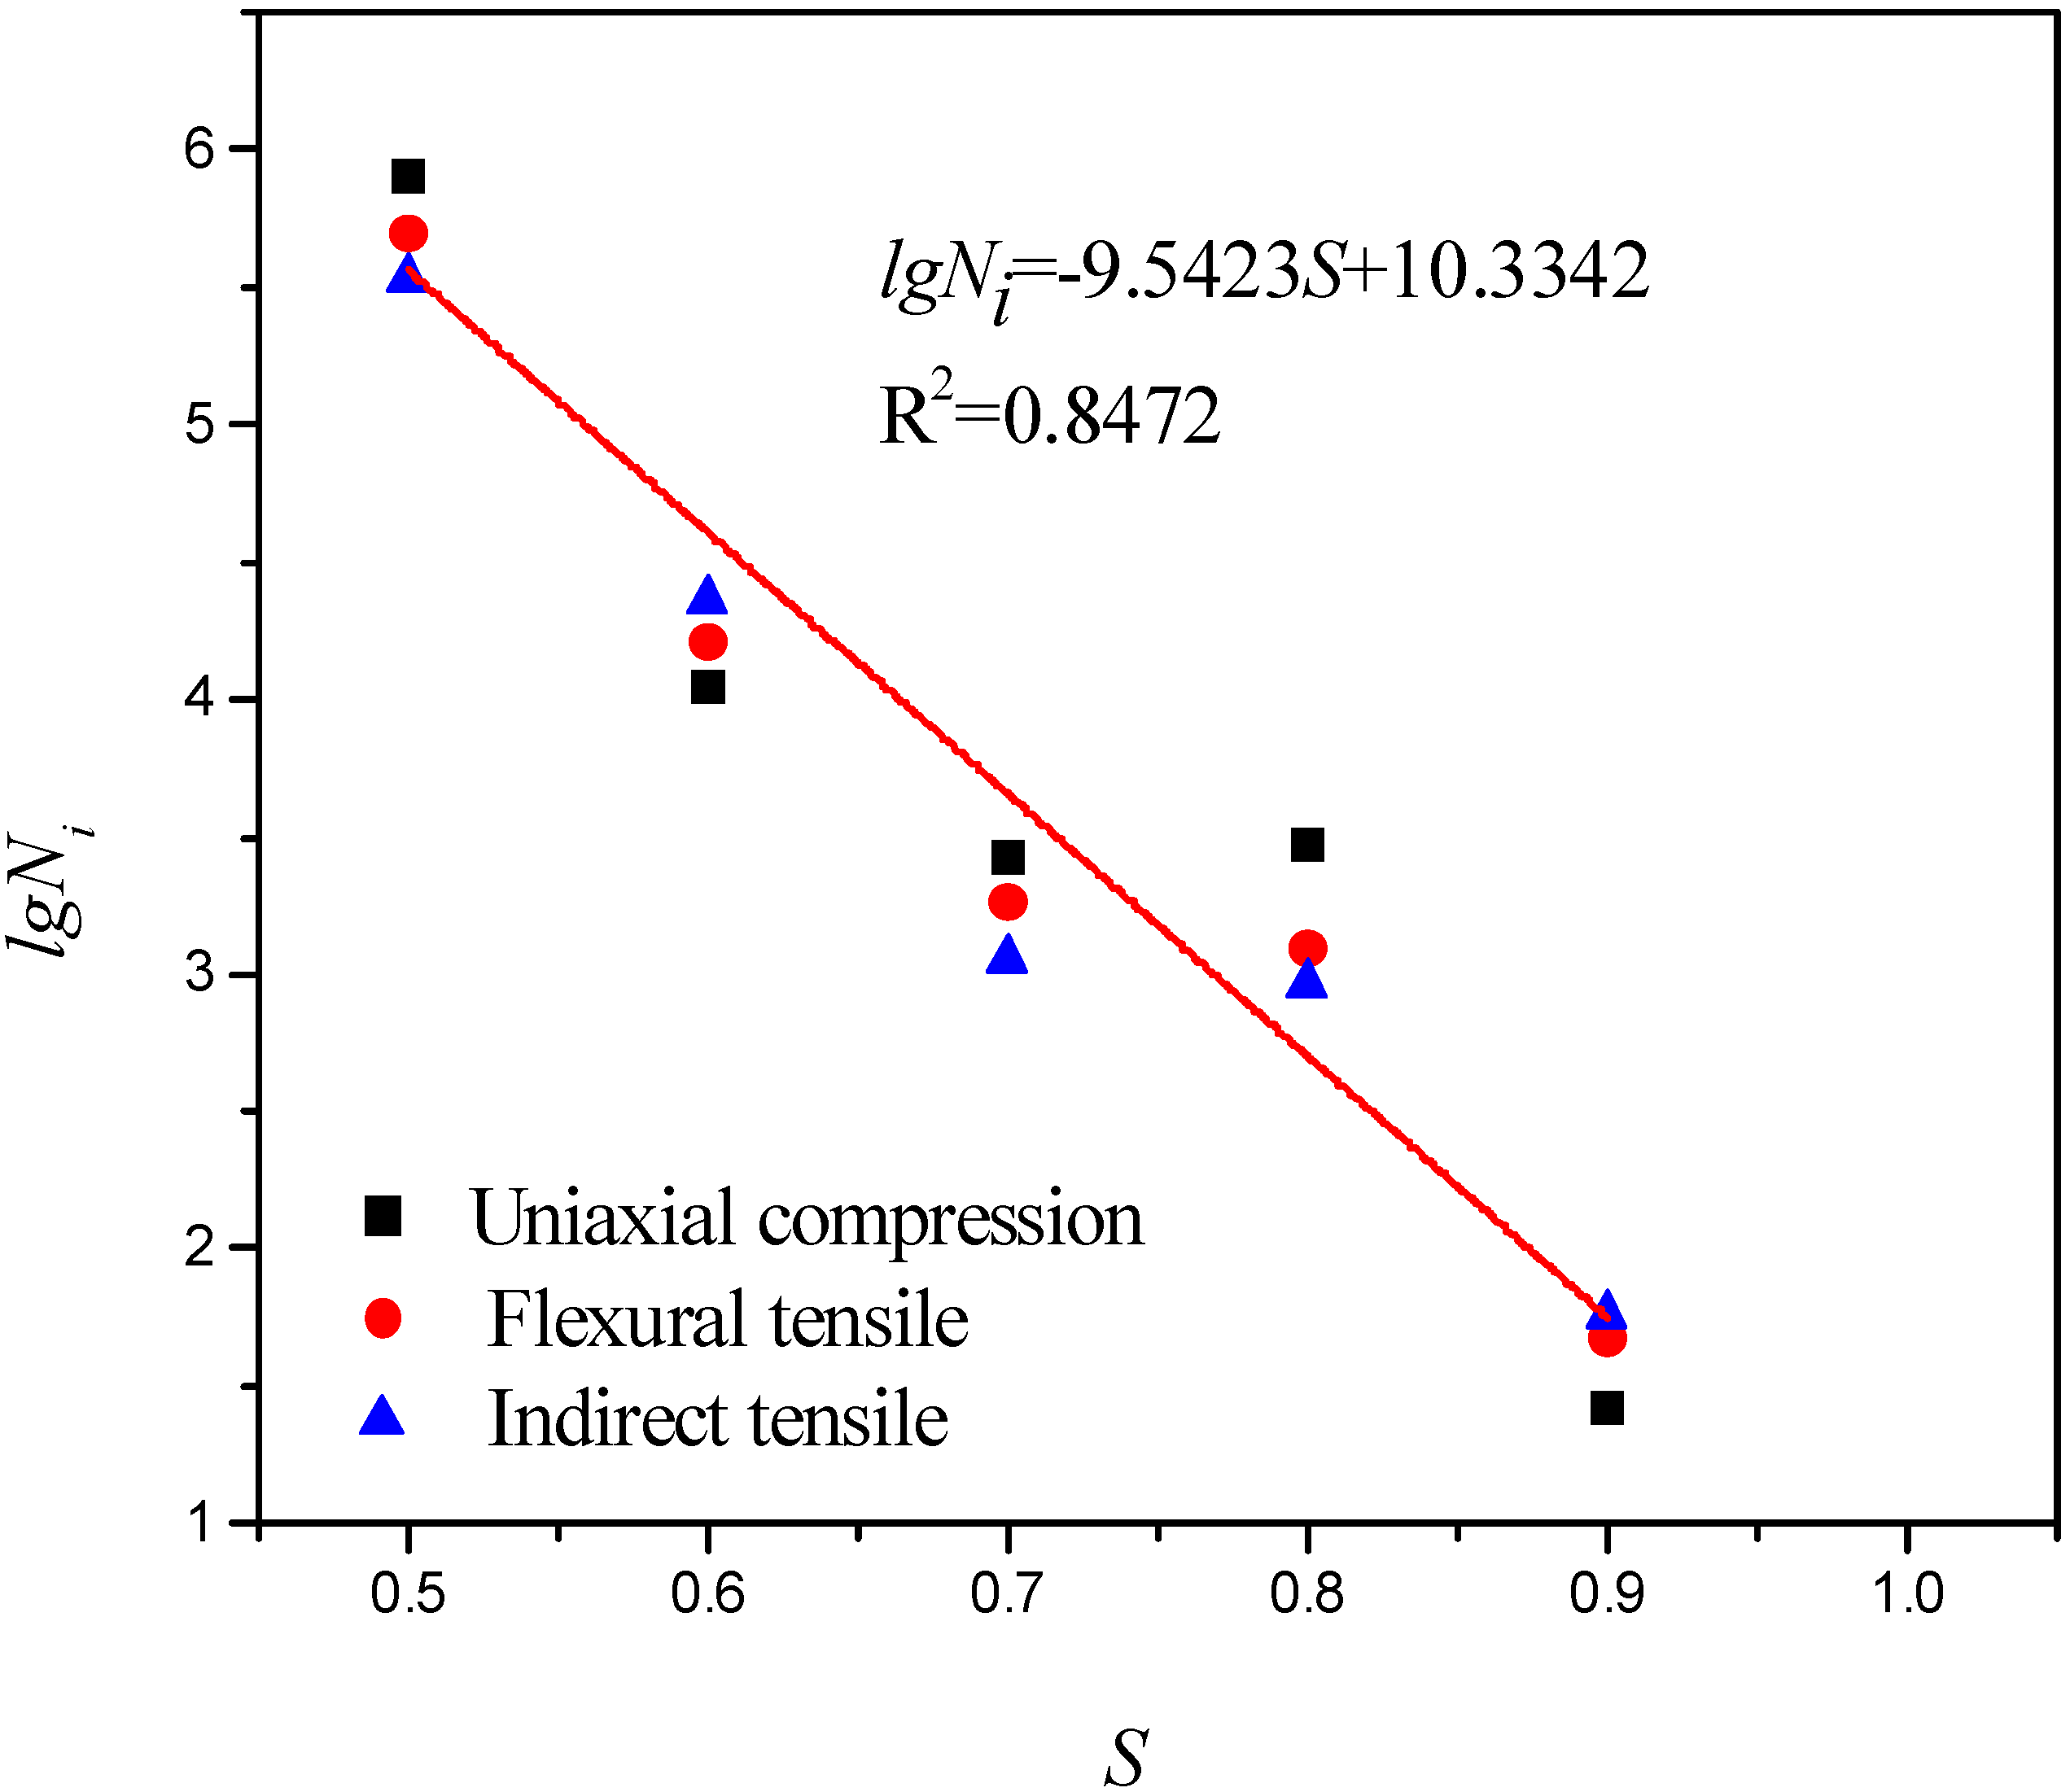
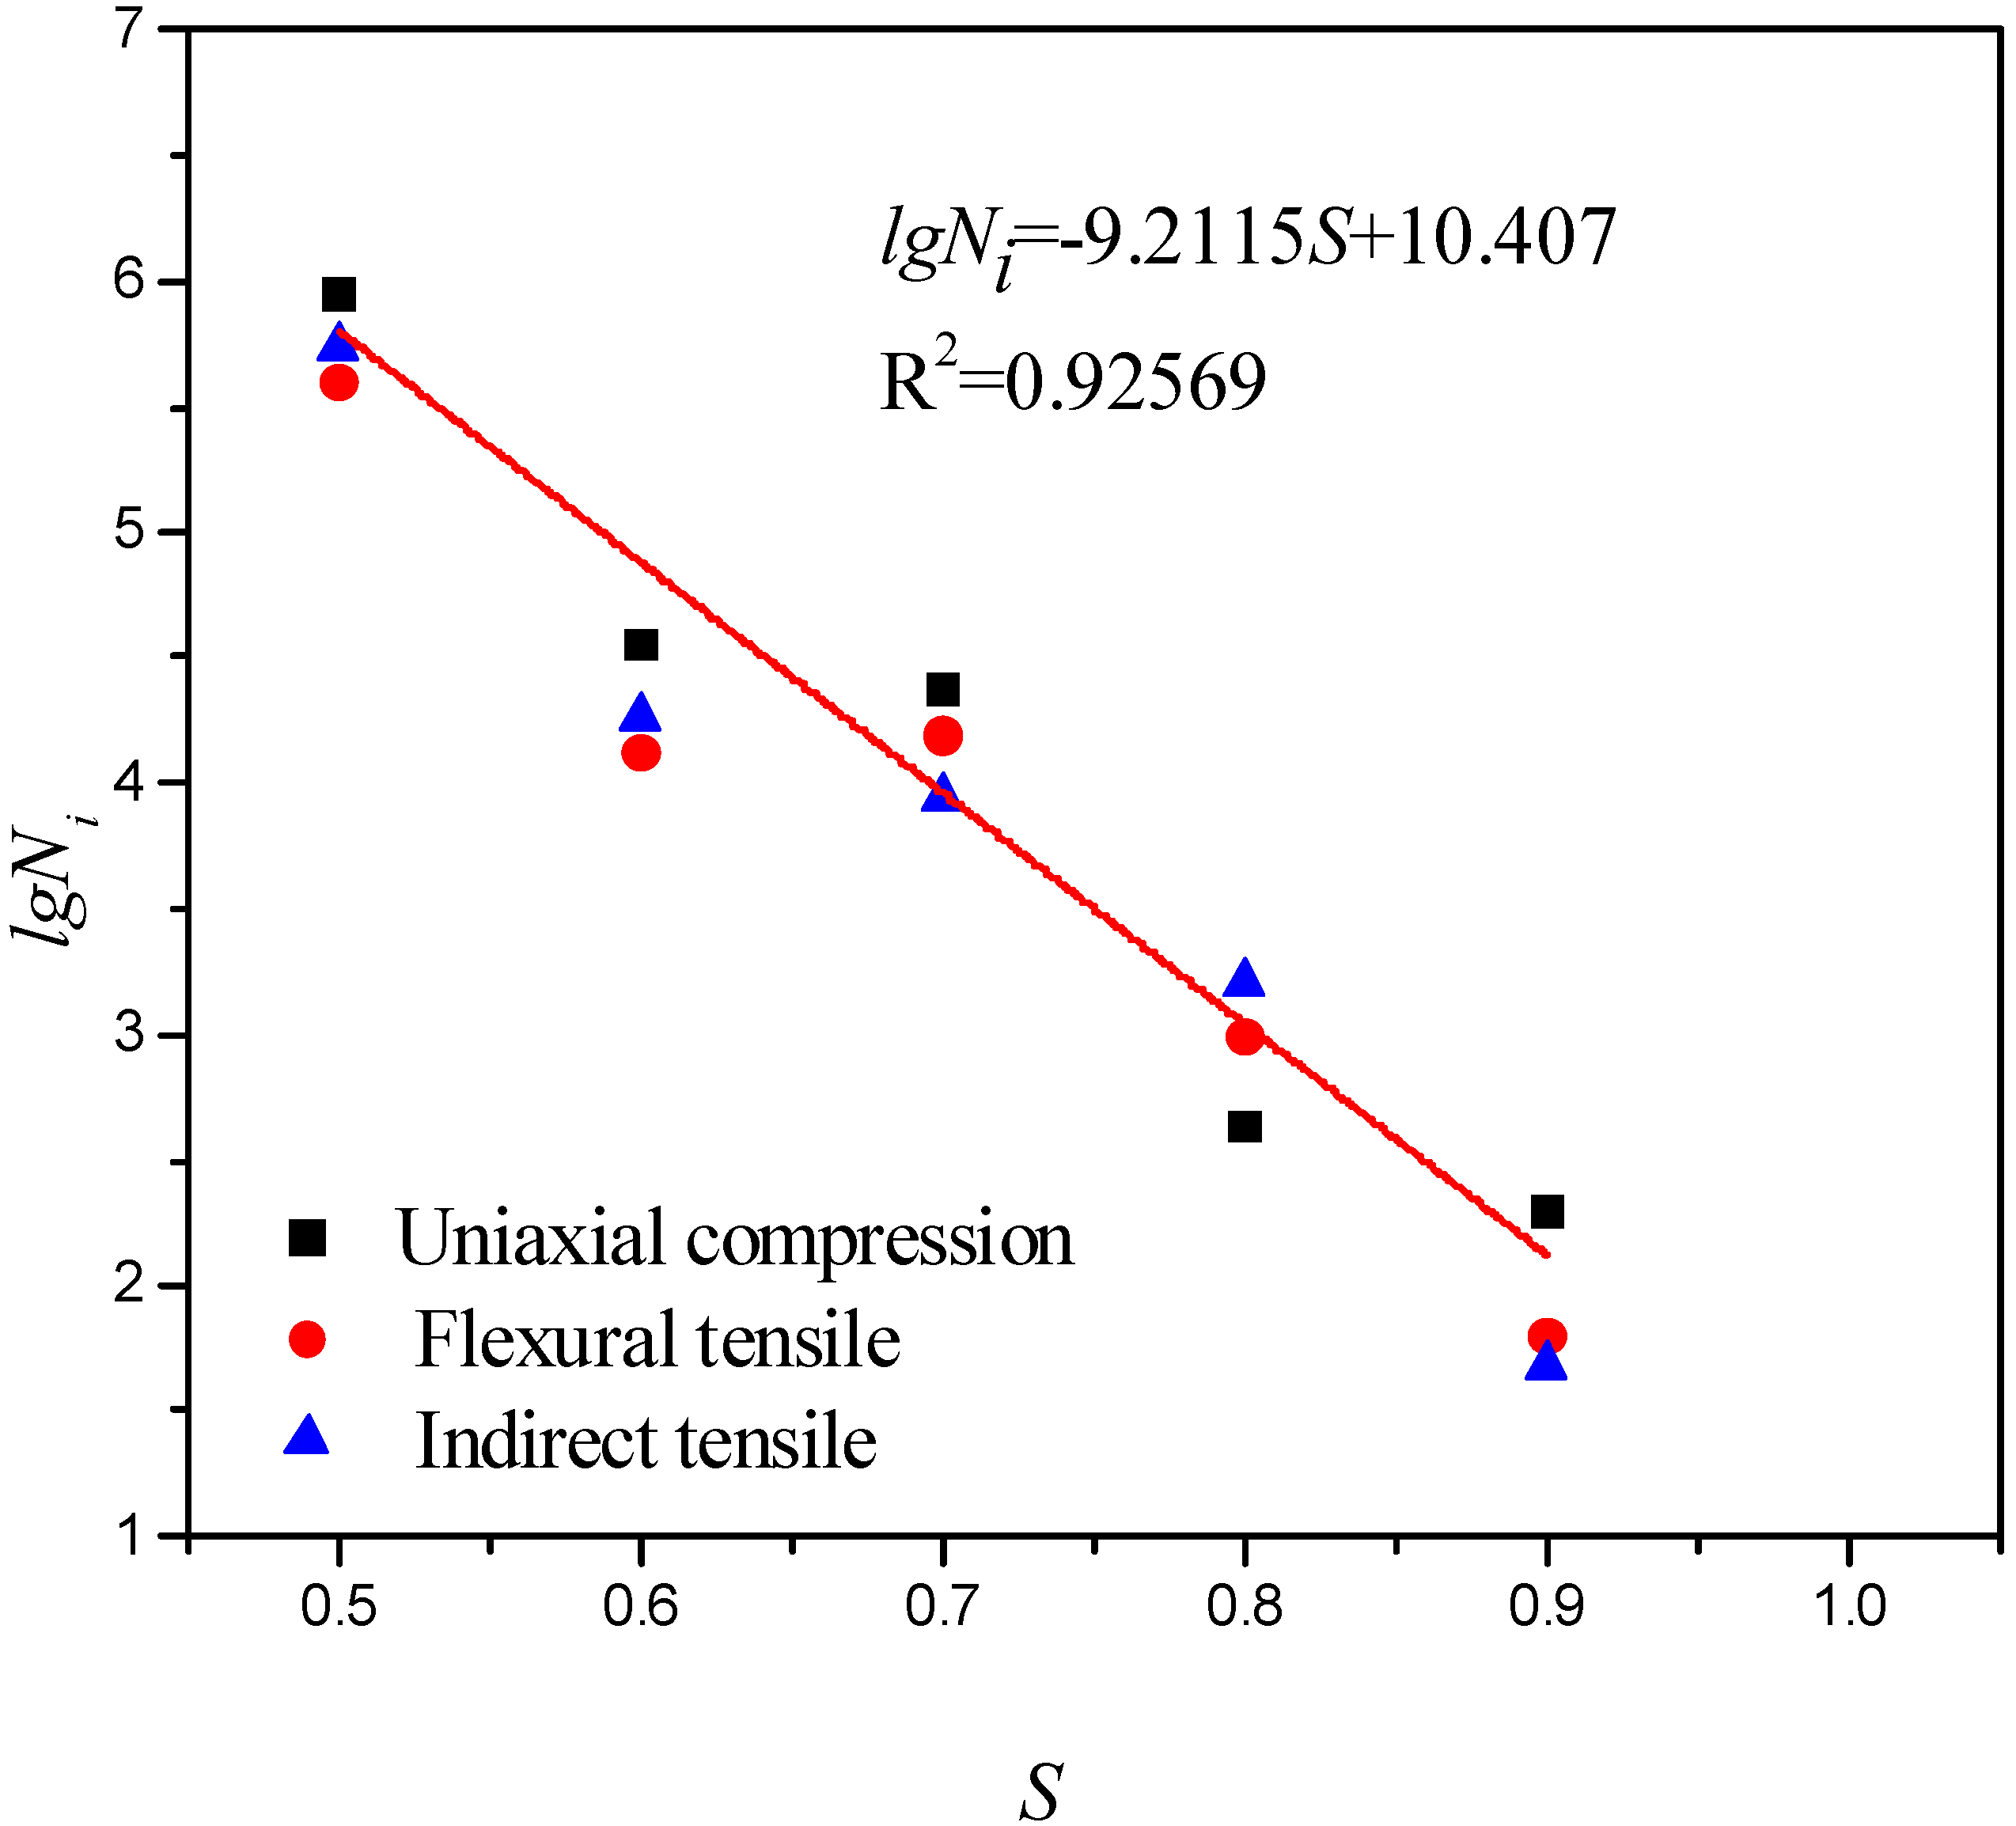
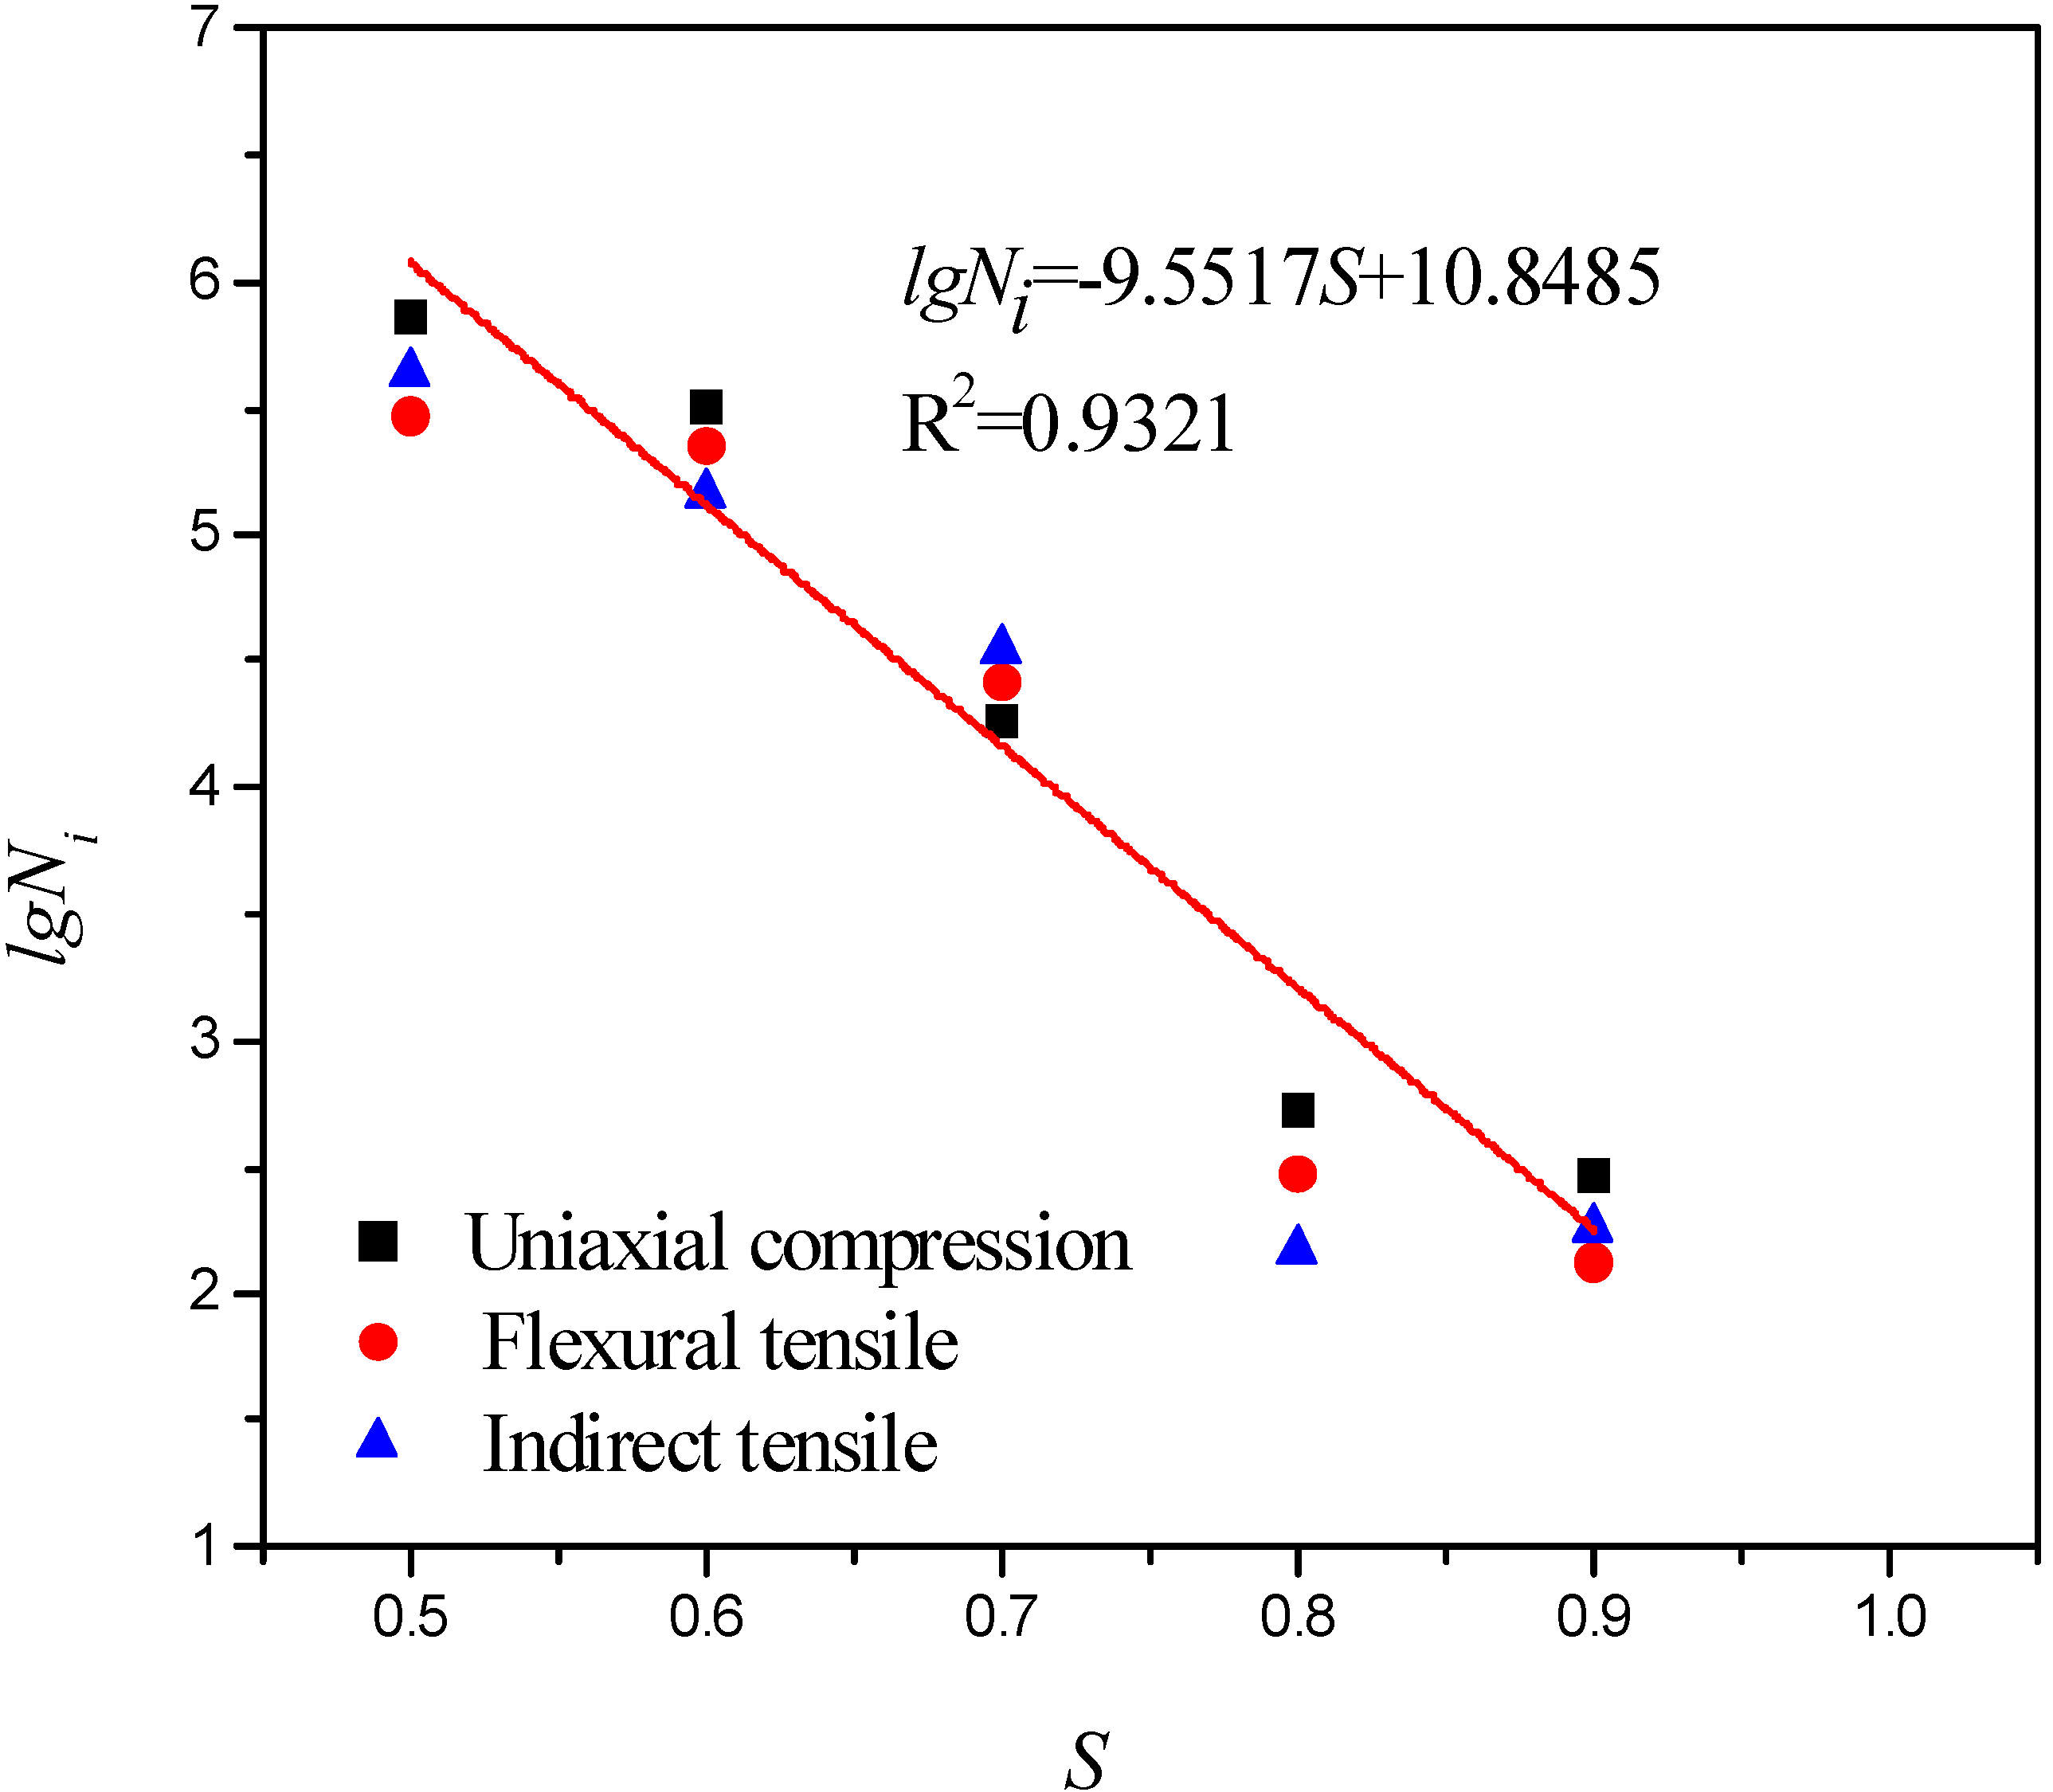
Figure 9, Figure 10, Figure 11, Figure 12, Figure 13 and Figure 14 shows the P-S-N figure of standardization equations, where R2 is the correlation coefficient, lgNi is the logarithm equivalent fatigue life, S is the stress ratio.
Standardization fatigue equations were fitted with different cement content, different curing times, and different stress states. Table 9 summarize the fitting parameters and standardization equations.
From the above Figure 9, Figure 10, Figure 11, Figure 12, Figure 13 and Figure 14 and the Table 9. It can be observed that:
- (1)
- The results obtained from the fatigue tests of cement-treated aggregate base materials under different stress states revealed a good linear relationship in the P-S-N coordinate system, and the fitting correlation coefficient was extremely good. Compared to the conventional S-N fatigue curve, the logarithm equivalent fatigue life of cement-treated aggregate base materials also monotonously decreased with stress ratio, the difference of the fatigue curves under different stress states based on the new method of fatigue analysis has been greatly reduced, and it was hard to point out the fatigue tests results of one stress state from those of the other stress states. The data points were very close to each other. It was difficult to distinguish the fatigue data points under different stress states as a whole, standardization was realized.
- (2)
- In the single logarithmic standardization fatigue equation, the difference in the fatigue equation parameters under different stress states based on the new method of fatigue analysis has been greatly also reduced. The value of parameter a determines the steepness of the fatigue curve, representing the mechanical sensitivity. The smaller the slope of the curve, the lower the mechanical sensitivity, the greater the overloading of the road surface, and the better the over-limit capability. The parameter b value reflects the height of the curve. The higher the intercept, the better the fatigue resistance of cement-treated aggregate base materials. The highest parameter b value was observed at a curing time of 28 days and a cement content of 5%; that is, the fatigue resistance was the best. This result revealed that the higher the cement content, and the better the fatigue resistance of cement-treated aggregate base materials. From the results obtained from the fatigue tests of the existing cement-treated aggregate base materials [3,7,38,39,40], the range of parameter a was typically considered to be 7–28, and the parameter a obtained by the test ranges from 9.2 to 10.8 meet the range of parameter a.
- (3)
- The average of the parameters for the standardized fatigue equation at a curing time of 28 days and a cement content of 3–5% was expressed as follows:a: (9.5423 + 10.4689 + 10.7645)/3 = 10.2584b: (10.3342 + 11.4540 + 11.7037)/3 = 11.1637According to the obtained parameter average of (6) and (7), the unified expression for the standardized fatigue equation at a curing time of 28 days with different cement content can be expressed as lgNi = 11.1637 − 10.2584(σ/Sf).
- (4)
- The average parameters for the standardized fatigue equation at a curing time of 90 days and a cement content of 3–5% were expressed as follows:a: (9.2115 + 9.8136 + 9.5517)/3 = 9.5256b: (10.4075 + 10.8184 + 10.8485)/3 = 10.6914According to the obtained parameter average of (8) and (9), a unified expression for the standardized fatigue equation at a curing time of 90 days with different cement content can be expressed as lgNi = 10.6914 − 9.5256(σ/Sf)
- (5)
- From the standardization equation at a curing time of 28 days with different cement contents, lgNi = 11.1637 − 10.2584(σ/Sf); the standardization equation at a curing time of 90 days with different cement contents was lgNi = 10.6914 − 9.5256(σ/Sf), and the standardized fatigue equations for different cement content at different curing times were expressed as lgNi = 10.9274 − 9.8920(σ/Sf). The standardization of fatigue characteristics reduced or even eliminated the uncertainty of the stress states, curing time, cement content, and the size of specimen in the fatigue test results.
To summarize, the results obtained from the Weibull distribution analysis fatigue test revealed that lgNi and S in different stress states are simultaneously fitted by coordinates. Therefore, the Weibull distribution analysis method of fatigue characteristics solved the problems which caused by the conventional S-N fatigue equation. It is possible to characterize the fatigue properties of cement-treated aggregate base materials under different stress conditions precisely and uniformly. The unified form of the standardized fatigue equations of different cement content at different curing times was obtained. The goal for standardizing the fatigue characteristics under different stress states was achieved, which realized the unification of different fatigue test results and provided a theoretical method and technical basis for the scientific transformation from material fatigue to structural fatigue.
4.3. Establishing Fatigue Equations Based on the Weibull Distribution of Interval Parameters
4.3.1. Interval Analysis Method
In the 1960s, the American mathematician Moore first proposed the interval analysis theory [27,28,29]. Subsequently, the classical “interval analysis” was reported [28], and the interval operation theory was systematically described. In recent years, the interval analysis theory has become an active uncertainty analysis method in structural engineering. Interval analysis treats all variables involved in the project as an interval variable, which transforms the uncertainty of the variable into an interval number and then uses the interval mathematics method to analyze the actual project. This method exhibits immense significance in practical engineering applications.
4.3.2. Interval Value Theory
Typically, two or even more parallel tests are required for the test code and method for the fatigue testing of cement-treated aggregate base materials [41]. With more than two test results from parallel experiments, based on the Weibull distribution, the standardized fatigue equation can be obtained by fitting to a single logarithmic fatigue equation, lgN = aS + b. In the fitting of the fatigue equation (Table 9), parameters a and b were always used to estimate maximum and minimum amin, and bmin, and their values were one digit after the decimal point. The interval variable for this parameter was expressed as follows:
4.3.3. Establishing the Interval Fatigue Equation under the Weibull Distribution
The fatigue characteristic of cement-treated aggregate base materials is an important index to characterize the pavement base performance. The fatigue test method is related to several factors; therefore, the fatigue equation for cement-treated aggregate base materials is extremely complicated. However, the conventional fatigue equation was expressed as point numerical. In fact, because of the experimental equipment and human factors, the fatigue equation for cement-treated aggregate base materials typically exhibits a certain error. The interval parameter was used instead of the uncertainty parameter for engineering analysis, which showed a better agreement to the actual characteristics of the project. Hence, it is a point numerical, indicating that the fatigue equation does not satisfy the actual engineering requirements. Therefore, the interval analysis method is introduced, which could not only present all the possible real values present in the operation results but also exert significance for practical applications.
From the standardized fatigue equation in Table 9, parameters a and b with the cement content of 3–5% comprised three groups, with the maximum and minimum. According to the interval theory, parameters a and b can be regarded as one interval variable. Parameter a values for the fatigue equation standardized for cement-treated aggregate base materials at a curing time of 28 days were 9.5423, 10.4689, and 10.7642, while parameter b values were 10.3342, 11.4541, and 11.7034. Parameter a values for the standardized fatigue equation for cement-treated aggregate base materials at a curing time of 90 days were 9.2115, 9.8136, and 9.5517. The corresponding parameter b values were 10.4075, 10.8184, and 10.8485. The minimum and maximum values for parameters a and b were estimated. According to Formula (10) and (11), the intervals of a and b were as follows:
According to the interval values of a and b obtained from Formula (12), the standardized interval parameters for the fatigue equation under different stress states, different curing times, and cement content of 3–5% at a guaranteed rate of 95% can be obtained:
Let us assume parameters a and b in the standardized fatigue equation with a cement content of 4% and 5% at a curing time of 28 days and 90 days. The minimum and maximum values for parameters a and b were calculated, and the intervals of a and b were still in accordance with Formulas (10) and (11):
From the parameter value obtained by Formula (14), the standardization interval parameters from the fatigue equation under different stress states, different curing times, and cement content of 4–5% at a guarantee rate of 95% were obtained:
When performing interval analysis calculations, it is imperative to consider the length of the interval. The longer the interval, the higher the probability that the sample data was within the interval. The lower the accuracy, the higher the permissible error. By comparing Equations (13) and (15), the lengths of the interval of parameter a in Equations (13) and (15) were 1.6 and 1.3, respectively. On the other hand, the lengths of parameter b in Equations (13) and (15) were 1.5 and 0.9, respectively. The interval length of Equation (13) was greater than that of Equation (15), indicating that the life interval allowed by Equation (13) is greater than that of Equation (15), and the error allowed by Equation (13) is also higher. If the interval length was extremely long, the estimated fatigue life interval would be extremely large, and the actual engineering would exert marginal significance. If the interval length was extremely short, and the estimated fatigue life interval was small, the features of fatigue test results would not satisfy the discreteness and variability. Therefore, the length of the interval can be reasonably controlled to solve the uncertainty problem in the engineering field.
4.3.4. Example of Calculation Analysis
Fatigue tests were carried out on the specimen with cement content of 3–5%, and the fatigue test results and the standardized fatigue equation model were obtained. According to the fatigue equation of Table 9 obtained from the test, parameter a and b values at curing times of 28 days and 90 days with a cement content of 3–5% are summarized in Table 10, which were used to obtain the standardized fatigue equation for the prediction model with the cement content of 3.5% and 4.5%.
Parameters a and b at a curing time of 28 days with a cement content of 3% and 4% were averaged, respectively, and the point parameter prediction model for the standardized fatigue equation at a curing time of 28 days with a cement content of 3.5% was obtained, followed by assigning the cement content of 4% and 5%. Parameters a and b for a cement content of 4.5% were averaged, and the point parameter prediction model for the standardized fatigue equation for the cement content of 4.5% at a curing time of 28 days was also obtained. The point parameter prediction model for the standardized fatigue equation at a curing time of 90 days was also available. Table 11 summarizes specific results.
Parameters a and b at a curing time of 28 days with a cement content of 3% and 4% exhibited the maximum and minimum. Now, a and b were taken as interval parameters according to Formulas (10) and (11), then a: [9.5, 10.5] and b: [10.3, 11.5], and the standardized interval parameters for the fatigue prediction model at a curing time of 28 days and a cement content of 3.5% can be obtained. Parameters a and b for the cement content of 4% and 5% were also obtained from Formulas (10) and (11). The interval parameters a: [10.5, 10.8], and b: [11.4, 11.8], which corresponded to the standardized interval parameters for the fatigue equation prediction model for a cement content of 4.5% at a curing time of 28 days. In addition, the interval parameter standardization fatigue prediction model at a curing time of 90 days was also available. Table 11 summarizes specific results obtained.
The fatigue life of cement-treated aggregate base materials is an important indicator to characterize the pavement base performance. Most scholars expressed fatigue life as point numerical. However, the fatigue life is typically obtained from experiments, and issues such as inadequate sampling representation; low precision; and insufficient stability of test equipment are inevitable, and the point value form cannot completely reflect the complex nature of parameters and indicators such as variability and uncertainty. From Table 11, the interval length for parameters a and b in the interval parameter fatigue equation reached 1.2, with the minimum of only 0.1. Clearly, parameters a and b in the point parameter fatigue equation were completely within the interval of the parameter fatigue equation. The uncertainty of inadequate sampling representation; low precision; and insufficient stability of test equipment can be reduced by life interval. Therefore, the point numerical fatigue life obtained by the point parameter fatigue equation must be within the life interval estimated by the interval parameter fatigue equation, and the life interval is more representative and scientific compared to the point value life, which is more consistent with the actual situation.
The fatigue equation based on the interval parameters is more rational than the fatigue equation of point value form. The effect of accuracy and stability of test equipment and the representative problem of test sampling and errors caused by materials, structures, the environment, and loads can be considered in the S-N fatigue equations characterized by interval parameter fatigue equation. Interval parameter fatigue equation increases the accuracy of the fatigue life prediction for the cement-treated aggregate base material.
By using the concept of the interval numerical value in mathematics and replacing the point value of design parameters with interval values, the problems of accuracy and stability of test equipment and the representative problem of test sampling were solved, and the errors caused by the materials, structure, construction, environment, and load were reduced, making the fatigue life interval more reasonable and scientific compared to the point value life. This is the objective required to characterize the complex nature of parameters and is in agreement with situation in which designs comprise bias and construction comprises errors.
5. Conclusions
Fatigue tests and analysis of cement-treated aggregate base materials under different stress states were carried out. The following conclusions can be drawn from the above:
- (1)
- Strength tests of cement-treated aggregate base materials under different stress states with 3–5% cement content at different curing times were carried out, the strength value of cement-treated aggregate base materials under different stress states monotonously increased with the curing time and cement content. The effect of the cement content on the strength of the cement-treated aggregate base material is larger than the curing time.
- (2)
- Fatigue tests of cement-treated aggregate base materials under different stress states were carried out with 3–5% cement content at 28 days and 90 days curing time, which clearly affected the analysis of their fatigue properties. It was difficult to compare the fatigue tests results under different stress states for cement-treated aggregate base materials.
- (3)
- The standardization equation of the fatigue characteristics under different stress states for cement-treated aggregate base materials was proposed, which could reduce or even eliminate the effect of the stress states, cement content, curing time and the shape and size of the specimen.
- (4)
- The form of point numerical did not completely reflect the complex properties, including the variability and uncertainty of parameters and indicators. The interval parameter value included the true value of the point parameter value, which conformed to the actual situation.
- (5)
- The standardization fatigue equation of interval parameters under different stress states was established, which solved the uncertainty of accuracy and stability of test equipment and the representative problem of test sampling, as well as reduced the error related to the materials, structure, construction, environment, and load.
Author Contributions
J.X. and L.T. conceived the experiments; J.X., and N.Z. performed the experiments; L.T. and J.X. wrote the paper; L.T., S.L., T.H. and H.L. outlined and revised the paper.
Funding
This work was funded by National Key Research and Development Plan of China (2017YFC0805300), Outstanding Youth Project of Hunan Education Department (15B010), National Engineering Laboratory Open Fund Project (kfj140102), and The APC was funded by National Engineering Laboratory Open Fund Project [kfj140102]. Check carefully that the details given are accurate and use the standard spelling of funding agency names at https://search.crossref.org/funding, any errors may affect your future funding.
Acknowledgments
This work was supported by National Key Research and Development Plan of China (2017YFC0805300), Outstanding Youth Project of Hunan Education Department (15B010), National Engineering Laboratory Open Fund Project (kfj140102), National Natural Science Foundation of China (51578081,51608058,51608055), The Ministry of Transport Construction Projects of Science and Technology (2015318825120), Key Projects of Hunan Province-Technological Innovation Project in Industry (2016GK2096), and Hunan Province Natural Science Foundation [2018JJ3550].
Conflicts of Interest
The authors declare no conflict of interest.
References
- Judycki, J.; Jaskula, P. Structural Design and Sensitivity Analysis of Semi-Rigid Pavement of a Motorway. Eng. J. 2012, 16, 117–126. [Google Scholar] [CrossRef] [Green Version]
- Sun, J.S.; Xiao, T.; Dou, Y.M.; Yang, C.F. Study on the Rational Thickness of Surface Course on Semi-Rigid Base Asphalt Pavement. In Proceedings of the GeoHunan International Conference 2011, Hunan, China, June 9–11 2011; pp. 37–44. [Google Scholar]
- Jiang, Y.J.; Cao, F.; Chen, Z.J.; Fang, J. Fatigue Performance and Application of Cement Stabilized Macadam Shaped with Vertical Vibration Test Method. J. Chang’an Univ. (Nat. Sci. Ed.) 2017, 36. [Google Scholar] [CrossRef]
- Preteseille, M.; Lenoir, T. Mechanical Fatigue Behavior in Treated/Stabilized Soils Subjected to a Uniaxial Flexural test. Int. J. Fatigue 2015, 77, 41–49. [Google Scholar] [CrossRef]
- Schneider, S.; Herrmann, R.; Marx, S. Development of a Resonant Fatigue Testing Facility for Large-scale Beams in Flexural Tensile. Int. J. Fatigue 2018, 113, 171–183. [Google Scholar] [CrossRef]
- Wang, Y.; Ni, F.J.; Li, Z.X. Fatigue Performance of Cement-stabilized Macadam Mixture. J. Traffic Transp. Eng. 2009, 9, 10–15. [Google Scholar]
- Jia, K. Study on the Fatigue Performance of Semi-rigid Base Course Materials. Ph.D. Thesis, Chang’an University, Xi’an, China, 17 June 2008. [Google Scholar]
- Lv, S.; Liu, C.; Lan, J.; Zhang, H.; Zheng, J.; You, Z. Fatigue Equation of Cement-Treated Aggregate Base Materials under a True Stress Ratio. Appl. Sci. 2018, 8, 691. [Google Scholar] [CrossRef]
- Jameson, G.; Sharp, K.; Potter, D. New Guidelines for the Design of Flexible Pavements for Australia Conditions. In Proceedings of the International Conference on Asphalt Pavements, Copenhagen, Denmark, 17–22 August 2002. [Google Scholar]
- Theyse, H.; De Beer, M.; Rust, F. Overview of the South African Mechanistic Pavement Design Analysis Method. Transp. Res. Rec. J. Transport. Res. Board 1996, 1539. [Google Scholar] [CrossRef]
- Han, D.; Huang, X. Fatigue Analysis of Cement-stabilized Macadam aggregate with Failure Mechanics. Civ. Eng. Environ. Syst. Eng. 2009, 31, 78–82. [Google Scholar]
- Judycki, J. Comparison of Fatigue Criteria for Flexible and Semi-Rigid Pavements. In Proceedings of the 8th Conference on Asphalt Pavements-International Society of Asphalt Pavements, Seattle, WA, USA, 10–14 August 1997; pp. 919–937. [Google Scholar]
- Geoff, A. Priority issues for performance and durability. In Proceedings of the 8th International Society for Concrete Pavements: 8th International Conference on Concrete Pavements (ICCP), Colorado Springs, CO, USA, 14–18 August 2005; pp. 181–207. [Google Scholar]
- Li, N.; Molenaar, A.A.A.; Pronk, A.C.; van de Ven, M.F.C.; Wu, S. Effect of Specimen Size on Fatigue Behavior of Asphalt Mixture in Laboratory Fatigue Tests. In Proceedings of the 7th RILEM International Conference on Cracking in Pavements, Delft, The Netherlands, 20–22 June 2012; pp. 827–836. [Google Scholar]
- Li, N.; Molenaar, A.A.A.; Pronk, A.C.; van de Ven, M.F.C. Investigation into the Size Effect on Four Point Flexural Tensile Fatigue Tests. In Proceedings of the 3rd workshop on 4PB, Davis, CA, USA, 17–18 September 2012; pp. 444–489. [Google Scholar]
- Lv, S.; Liu, C.; Chen, D.; Zheng, J.; You, Z. Normalization of fatigue characteristics for asphalt mixtures under different stress states. Constr. Build. Mater. 2018, 177, 33–42. [Google Scholar] [CrossRef]
- Li, N.; Molenaar, A.A.A.; Ven, M.F.C.; Wu, S. Characterization of Fatigue Performance of Asphalt Mixture Using a New Fatigue Analysis Approach. Constr. Build. Mater. 2013, 45, 45–52. [Google Scholar] [CrossRef]
- Tarifa, M.; Ruiz, G.; Poveda, E.; Zhang, X.X.; Vicente, M.A.; González, D. Effect of uncertainty on load position in the fatigue life of steel-fiber reinforced concrete under compression. Mater. Struct. 2018, 51. [Google Scholar] [CrossRef]
- Chen, Y.; Zheng, M.; Wang, B. Establishment and Application of the Fatigue Equation of Porous Cement-based Concrete. J. Chin. Ceram. Soc. 2005, 7, 827–831. [Google Scholar]
- Shi, X. Study on Flexural Fatigue Behavior of Cement Concrete. Civ. Eng. J. 1990, 23, 11–22. [Google Scholar]
- Zheng, M.; Sun, J.; Wang, B. Establishment and Application of Fatigue Equation for Lean Concrete. J. Xi’an Univ. Architect. Technol. (Nat. Sci. Ed.) 2007, 3, 92–97. [Google Scholar]
- Rinne, H. The Weibull Distribution A Handbook, 1st ed; CRC Press: Boca Raton, FL, USA, 2008. [Google Scholar]
- Ou, Z.; Lu, S. Flexural fatigue-life reliability of frost-damaged concrete. J. Zhejiang Univ. 2017, 51, 1074–1081. [Google Scholar]
- Sha, A.M.; Kan, J.; Li, X. Fatigue Performances of Semi-rigid Base Course Materials. J. Traffic Transp. Eng. 2009, 9, 29–33. [Google Scholar]
- Ortega, J.J.; Ruiz, G.; Yu, R.C.; Afanador-García, N.; Tarifa, M.; Poveda, E.; Zhang, X.X.; Evangelista, F.J. Number of tests and corresponding error in concrete fatigue. Int. J. Fatigue 2018, 116, 210–219. [Google Scholar] [CrossRef]
- Ganesan, N.; Raj, J.B.; Shashikala, A.P. Flexural fatigue behavior of selfcompacting rubberized concrete. Constr. Build. Mater. 2013, 44, 7–14. [Google Scholar] [CrossRef]
- Moore, R.E. Interval Arithmetic and Automatic Error Analysis in Digital Computing. Ph.D. Thesis, Stanford University, Stanford, CA, USA, 1962. [Google Scholar]
- Moore, R.E. Interval Analysis; Prentice-Hall: Englewood Cliffs, NJ, USA, 1966. [Google Scholar]
- Moore, R.E.; Kearfott, R.B.; Cloud, M.J. Introduction to Interval Analysis; Society for Industrial and Applied Mathematics (SIAM): Philadelphia, PA, USA, 2009. [Google Scholar]
- García, O.; Ehí, J.V.; Iguel, M.; Sainz, A.; Campos, J.; Atos, M. Application of Interval Analysis to Solve Civil Engineering problems—Some Examples. In Proceedings of the Second International Conference on Structural Engineering, Mechanics and Computation, Cape Town, South Africa, 4–7 July 2004. [Google Scholar]
- Chen, R. On Interval Fuzzy Evaluation Analysis of Highway Roadbed Stability in Karst Area. Value Eng. 2014, 6, 72–73. [Google Scholar]
- Dodagoudar, G.R.; Venkatachalam, G. Reliability Analysis of Slopes Using Fuzzy Sets Theory. Comput. Geotech. 2015, 363, 135–143. [Google Scholar] [CrossRef]
- Donald, I.B.; Chen, Z. Slope Stability Analysis by the Upper Bound Approach: Fundamentals and methods. Can. Geotech. J. 2011, 34, 853–862. [Google Scholar] [CrossRef]
- Giasi, C.I.; Masi, P.; Cherubini, C. Probabilistic and Fuzzy Reliability Analysis of a Sample Slope near Aliano. Eng. Geol. 2003, 67, 391–402. [Google Scholar] [CrossRef]
- JTG/T F20-2015 Technical Guidelines for Construction of Highway Road Bases; Renmin Communication Press: Beijing, China, 2015; Available online: http://www.doc88.com/p-5728953349302.html (accessed on 30 August 2017).
- JTG E51-2009 The Chinese Test Methods of Materials Stabilized with Inorganic Binders for Highway Engineering; Renmin Communication Press: Beijing, China, 2009; Available online: https://doc.mbalib.com/view/f4212ef102cc21709e000db4f04ae593.html (accessed on 30 August 2017).
- JTG D50-2017 The Chinese Specification for Design of Highway Asphalt Pavement; Renmin Communication Press: Beijing, China, 2017; Available online: https://www.doc88.com/p-6912879474197.html (accessed on 22 March 2018).
- Lv, S.; Zheng, J.L.; Zhong, W.L. Characteristics of Strength, Modulus and Fatigue Damage for Cement Stabilized Macadam in Curing Period. China J. Highw. Transp. 2015, 28, 9–15. [Google Scholar]
- Wang, Y.; Ni, F.; Li, Z. Study on transverse shrink-curing time crack control of cement-stabilized macadam base. In Proceedings of the 4th Japan/China Workshop on Pavement Technologies, Sapporo, Japan, 25–27 July 2007; pp. 437–446. [Google Scholar]
- Lim, S.; Dan, G.Z. Estimation of the Compressive Strength and Modulus of Elasticity of Cement-Treated Aggregate Base Materials. J. Transp. Res. Rec. 2003, 1837. [Google Scholar] [CrossRef]
- Tang, L.; Zheng, J. Interval Analysis Theory and Method of Geotechnical Engineering; Science Press: Beijing, China, 2017. [Google Scholar]
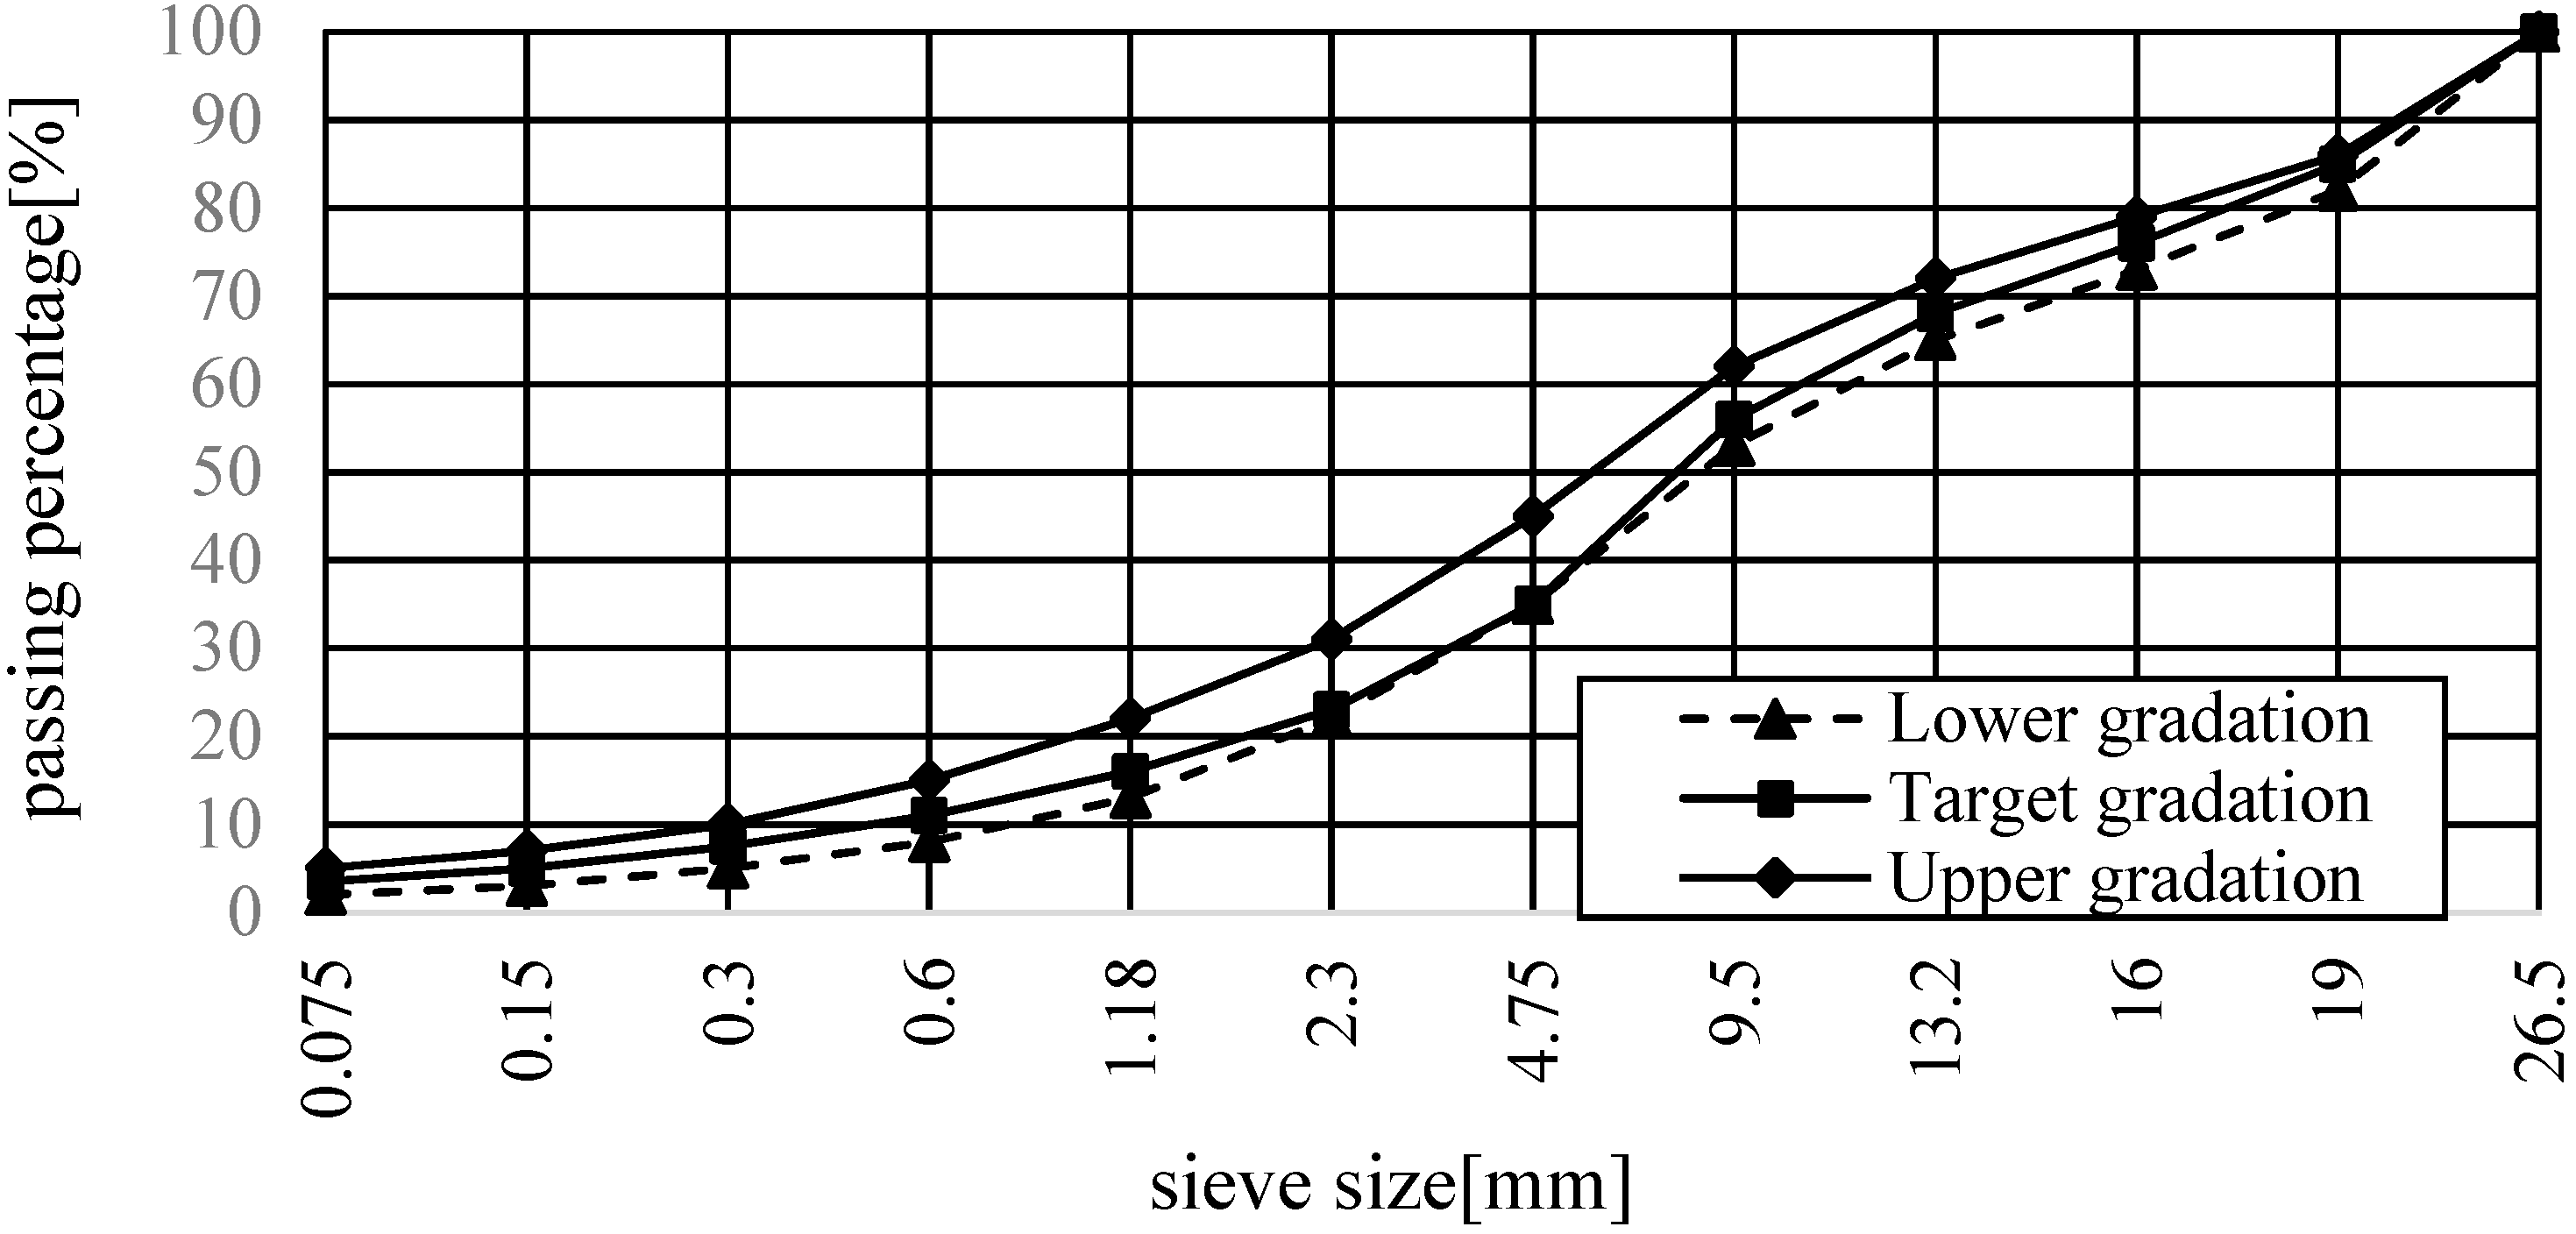
Figure 1.
Gradation curve of cement-treated aggregate base material.

Figure 2.
Variation patterns for the unconfined compressive strength with the curing time and cement content.
Figure 2.
Variation patterns for the unconfined compressive strength with the curing time and cement content.

Figure 3.
Variation patterns of the indirect tensile strength with the curing time and cement content.
Figure 3.
Variation patterns of the indirect tensile strength with the curing time and cement content.

Figure 4.
Variation patterns of flexural tensile strength with curing time and cement content.

Figure 5.
Images of strength and fatigue test procedures: (a) indirect tensile specimen, (b) flexural tensile specimen, and (c). unconfined compressive specimen
Figure 5.
Images of strength and fatigue test procedures: (a) indirect tensile specimen, (b) flexural tensile specimen, and (c). unconfined compressive specimen

Figure 6.
Fitting curve for the fatigue equation for a cement content of 3% under different stress states.
Figure 6.
Fitting curve for the fatigue equation for a cement content of 3% under different stress states.

Figure 7.
Fitting curve for the fatigue equation for a cement content of 4% under different stress states.
Figure 7.
Fitting curve for the fatigue equation for a cement content of 4% under different stress states.

Figure 8.
Fitting curve for the fatigue equation for a cement content of 5% under different stress states.
Figure 8.
Fitting curve for the fatigue equation for a cement content of 5% under different stress states.

Figure 9.
Standardization equations for the fatigue properties with a cement content of 3% at a curing time of 28 days and a guaranteed rate of 95% under different stress states.
Figure 9.
Standardization equations for the fatigue properties with a cement content of 3% at a curing time of 28 days and a guaranteed rate of 95% under different stress states.

Figure 10.
Standardization equations for the fatigue properties with a cement content of 4% at a curing time of 28 days and a guaranteed rate of 95% under different stress states.
Figure 10.
Standardization equations for the fatigue properties with a cement content of 4% at a curing time of 28 days and a guaranteed rate of 95% under different stress states.

Figure 11.
Standardization equations for fatigue properties with a cement content of 5% at a curing time of 28 days and a guaranteed rate of 95% under different stress states.
Figure 11.
Standardization equations for fatigue properties with a cement content of 5% at a curing time of 28 days and a guaranteed rate of 95% under different stress states.

Figure 12.
Standardization equations for the fatigue properties with a cement content of 3% at a curing time of 90 days and a guaranteed rate of 95% under different stress states.
Figure 12.
Standardization equations for the fatigue properties with a cement content of 3% at a curing time of 90 days and a guaranteed rate of 95% under different stress states.

Figure 13.
Standardization equations for fatigue properties with a cement content of 4% at a curing time of 90 days and a guaranteed rate of 95% under different stress states.
Figure 13.
Standardization equations for fatigue properties with a cement content of 4% at a curing time of 90 days and a guaranteed rate of 95% under different stress states.

Figure 14.
Standardization equations for fatigue properties with a cement content of 5% at a curing time of 90 days and a guaranteed rate of 95% under different stress states.
Figure 14.
Standardization equations for fatigue properties with a cement content of 5% at a curing time of 90 days and a guaranteed rate of 95% under different stress states.


Table 1.
Technical indicators of cement.
| Test Projects | Test Results | Technical Requirement | |
|---|---|---|---|
| Fineness detection | 1.8 | ≤10% | |
| Setting time (min) | initial setting /min | 285 | ≥180 |
| final setting /min | 422 | ≥360 | |
| Stability (mm) | 2.8 | ≤5 | |
| Strength of cement mortar(MPa) | 3 days flexural strength | 5.2 | ≥2.5 |
| 3 days unconfined compressive strength | 21.9 | ≥10 | |
| MgO content (%) | 3.5 | ≤5% | |
| SO3 content (%) | 1.6 | ≤3.5% | |
| Loss on ignition | 0.7 | ≤3.0% | |
| Specific surface area (selectivity indicator) | 390 | 300 m2/kg–450 m2/kg | |
| Initial setting time | 120 | ≥90 min | |
| Final setting time | 660 | ≤720 min | |
Table 2.
The aggregate content of cylinder specimen.
| Sieve Size (mm) | 26.5 | 19 | 16 | 13.2 | 9.5 | 4.75 | 2.36 | 1.18 | 0.6 | 0.3 | 0.15 | 0.075 | Total Content (g) |
|---|---|---|---|---|---|---|---|---|---|---|---|---|---|
| Aggtregate Content (g) | 1036.8 | 622.1 | 553 | 829.5 | 1451.5 | 829.5 | 483.8 | 345.6 | 241.9 | 172.8 | 103.7 | 241.9 | 6912.1 |
Table 3.
The aggregate content of large-scale beams specimen.
| Sieve Size (mm) | 26.5 | 19 | 16 | 13.2 | 9.5 | 4.75 | 2.36 | 1.18 | 0.6 | 0.3 | 0.15 | 0.075 | Total Content (g) |
|---|---|---|---|---|---|---|---|---|---|---|---|---|---|
| Aggtregate Content (g) | 4247.9 | 2565 | 2280 | 3420 | 5984.9 | 3420 | 1995 | 1425 | 997.5 | 712.5 | 427.5 | 997.5 | 28499.6 |
Table 4.
Technical indicators of aggregate.
| Test Projects | Test Results | Technical Requirement [20] |
|---|---|---|
| Content of flat and elongated particles in coarse aggregate (%) | 13.8% | ≤20% |
| Crushed stone value (%) | 22.5% | ≤30% |
| Less than 0.6mm particle Liquid limit/plastic index | liquid limit ≤27% | 26.5% |
| plastic index ≤8 | 6.2 | |
| Content of soft stone (%) | 1.2 | ≤3 |
Table 5.
Fitting parameters for the fatigue equation with a cement content of 3% under different stress states.
Table 5.
Fitting parameters for the fatigue equation with a cement content of 3% under different stress states.
| Curing Times (days) | Stress States | a | b | R2 |
|---|---|---|---|---|
| 28 | Unconfined compressive | −2.0258 × 10⁶ | 1.66789 × 10⁶ | 0.5638 |
| Flexural tensile | −1.4729 × 10⁶ | 1.19269 × 10⁶ | 0.5092 | |
| Indirect tensile | −1.5517 × 10⁶ | 1.25961 × 10⁶ | 0.5431 | |
| 90 | Unconfined compressive | −2.3598 × 10⁶ | 1.95095 × 10⁶ | 0.6512 |
| Flexural tensile | −1.4028 × 10⁶ | 1.13783 × 10⁶ | 0.4943 | |
| Indirect tensile | −1.7705 × 10⁶ | 1.4483 × 10⁶ | 0.5648 |
Table 6.
Fitting parameters for the fatigue equation with a cement content of 4% under different stress states.
Table 6.
Fitting parameters for the fatigue equation with a cement content of 4% under different stress states.
| Curing Times (days) | Stress States | a | b | R2 |
|---|---|---|---|---|
| 28 | Unconfined compressive | −4.4579 × 10⁶ | 3.6650 × 10⁶ | 0.5965 |
| Flexural tensile | −1.7026 × 10⁶ | 1.4041 × 10⁶ | 0.7053 | |
| Indirect tensile | −2.9069 × 10⁶ | 2.3819 × 10⁶ | 0.5853 | |
| 90 | Unconfined compressive | −5.1242 × 10⁶ | 4.2909 × 10⁶ | 0.6611 |
| Flexural tensile | −2.2351 × 10⁶ | 1.8415 × 10⁶ | 0.6934 | |
| Indirect tensile | −3.5573 × 10⁶ | 2.9092 × 10⁶ | 0.5976 |
Table 7.
Fitting parameters for the fatigue equation with a cement content of 5% under different stress states.
Table 7.
Fitting parameters for the fatigue equation with a cement content of 5% under different stress states.
| Curing Times (days) | Stress States | a | b | R2 |
|---|---|---|---|---|
| 28 | Unconfined compressive | −5.5173 × 10⁶ | 4.7240 × 10⁶ | 0.8152 |
| Flexural tensile | −2.4064 × 10⁶ | 1.9855 × 10⁶ | 0.6848 | |
| Indirect tensile | −3.4806 × 10⁶ | 2.8836 × 10⁶ | 0.7094 | |
| 90 | Unconfined compressive | −7.7162 × 10⁶ | 6.5691 × 10⁶ | 0.7258 |
| Flexural tensile | −2.5573 × 10⁶ | 2.1357 × 10⁶ | 0.7700 | |
| Indirect tensile | −4.2797 × 10⁶ | 3.5978 × 10⁶ | 0.7489 |
Table 8.
Regression coefficient and correlation coefficient for the Weibull distribution test.
| Stress Ratio | Stress States | Curing Times (days) | Cement Content (%) | m | lnt0 | R2 |
|---|---|---|---|---|---|---|
| 0.5 | Unconfined compressive | 28 | 3 | 38.0303 | 227.5346 | 0.8728 |
| 0.6 | Indirect tensile | 90 | 4 | 3.0914 | 17.5668 | 0.6628 |
| 0.7 | Flexural tensile | 28 | 5 | 2.1103 | 10.6800 | 0.7861 |
| 0.8 | Indirect tensile | 90 | 3 | 4.7462 | 18.1532 | 0.9388 |
| 0.9 | Unconfined compressive | 28 | 4 | 1.5475 | 5.7722 | 0.8406 |
Table 9.
Summary of the fitting results obtained for the standardization equation with different stress states at a guaranteed rate of 95%.
Table 9.
Summary of the fitting results obtained for the standardization equation with different stress states at a guaranteed rate of 95%.
| Cement Content (%) | Curing Times (days) | Standardized Fatigue Equation | R2 |
|---|---|---|---|
| 3 | 28 | 0.8472 | |
| 90 | 0.9257 | ||
| 4 | 28 | 0.9615 | |
| 90 | 0.8956 | ||
| 5 | 28 | 0.9134 | |
| 90 | 0.9321 |
Table 10.
Parameter a and b values.
| Curing Times (days) | Cement Content (%) | Parameter a | Parameter b |
|---|---|---|---|
| 28 | 3 | 9.5423 | 10.3342 |
| 4 | 10.4689 | 11.4541 | |
| 5 | 10.7642 | 11.7034 | |
| 90 | 3 | 9.2115 | 10.4075 |
| 4 | 9.8136 | 10.8184 | |
| 5 | 9.5517 | 10.8485 |
Table 11.
Standardization fatigue prediction model for cement content of 3.5% and 4.5%.
| Curing Times (days) | Cement Content (%) | Point Parameter Fatigue Equation | Interval Parameter Fatigue Equation |
|---|---|---|---|
| 28 | 3.5 | ||
| 4.5 | |||
| 90 | 3.5 | ||
| 4.5 |
© 2018 by the authors. Licensee MDPI, Basel, Switzerland. This article is an open access article distributed under the terms and conditions of the Creative Commons Attribution (CC BY) license (http://creativecommons.org/licenses/by/4.0/).
Share and Cite
MDPI and ACS Style
Xie, J.; Tang, L.; Lv, S.; Zhang, N.; Huang, T.; Liu, H. Standardization of Fatigue Characteristics of Cement-Treated Aggregate Base Materials under Different Stress States. Appl. Sci. 2018, 8, 1500. https://doi.org/10.3390/app8091500
AMA Style
Xie J, Tang L, Lv S, Zhang N, Huang T, Liu H. Standardization of Fatigue Characteristics of Cement-Treated Aggregate Base Materials under Different Stress States. Applied Sciences. 2018; 8(9):1500. https://doi.org/10.3390/app8091500
Chicago/Turabian StyleXie, Jiawei, Limin Tang, Songtao Lv, Naitian Zhang, Tuo Huang, and Hongfu Liu. 2018. "Standardization of Fatigue Characteristics of Cement-Treated Aggregate Base Materials under Different Stress States" Applied Sciences 8, no. 9: 1500. https://doi.org/10.3390/app8091500
Note that from the first issue of 2016, this journal uses article numbers instead of page numbers. See further details here.