Sizing Hybrid Energy Storage Systems for Distributed Power Systems under Multi-Time Scales


1
Department of Electrical Engineering, Northeast Electric Power University, Jilin 132012, China
2
Department of Power Consumption, China Electric Power Research Institute, Beijing 100192, China
3
Department of fundamental teaching, Changchun Architecture and Civilengeering College, Changchun 130022, China
*
Author to whom correspondence should be addressed.
Appl. Sci. 2018, 8(9), 1453; https://doi.org/10.3390/app8091453
Submission received: 15 July 2018
/
Revised: 12 August 2018
/
Accepted: 22 August 2018
/
Published: 24 August 2018
(This article belongs to the Special Issue Distribution Power Systems)
Abstract
:With the rapid development of industry, more fossil energy is consumed to generate electricity, which increases carbon emissions and aggravates the burden of environmental protection. To reduce carbon emissions, traditional centralized power generation networks are transforming into distributed renewable generation systems. However, the deployment of distributed generation systems can affect power system economy and stability. In this paper, under different time scales, system economy, stability, carbon emissions, and renewable energy fluctuation are comprehensively considered to optimize battery and super-capacitor installation capacity for an off-grid power system. After that, based on the genetic algorithm, this paper shows the optimal system operation strategy under the condition of the theoretical best energy storage capacity. Finally, the theoretical best capacity is tested under different renewable energy volatility rates. The simulation results show that by properly sizing the storage system’s capacity, although the average daily costs of the system can increase by 10%, the system’s carbon emissions also reduce by 42%. Additionally, the system peak valley gap reduces by 23.3%, and the renewable energy output’s fluctuation range and system loss of load probability are successfully limited in an allowable range. Lastly, it has less influence on the theoretical best energy storage capacity if the renewable energy volatility rate can be limited to within 10%.
1. Introduction
With the rapid development of the distributed photovoltaic (PV) and the wind turbine systems, power system economy and stability are facing great challenges because of the uncertainty and fluctuation of renewable energy [1,2,3]. To solve this problem, distributed energy storage systems are installed to suppress renewable energy outputs fluctuation, reduce the peak and valley difference of a distributed power system, improve the matching degree of daily renewable energy outputs and loads, reduce the installation capacity of distributed fossil power generators, and minimize the total costs of a distributed network [4,5]. However, due to the relatively high initial installation cost of the energy storage system, a large-scale installation of an energy storage system is difficult to achieve at present. Therefore, properly configuring energy storage capacity is crucial for improving the economy and stability of distributed power systems [6,7].
In recent years, many models have been proposed to optimize the installation capacity of a distributed energy storage system. However, by selecting different simulation time scales and optimization criterion, the results of the optimal capacity are quite different. In [8,9,10,11,12], one hour is selected as the simulation time scale to configure the capacity of a distributed energy storage system. Among them, in [8], the capacity of a distributed energy storage system is configured based on the redundant energy generated by renewable energy generators. In addition, to meet the peak demands of an isolated island, Kaldellis J.K et al [9] design the optimal energy storage capacity of PV systems according to system stability constraints. Similarly, system spinning reserve and the unit commitment problem are fully considered in [10] to estimate the ideal energy storage system capacity for both grid-connected and off-grid power systems. Moreover, Lee T. et al. sized system battery capacity, aiming at reducing the average yearly energy costs of users who have participated in time-of-use (TOU) tariffs [11]. Finally, and crucially, as the mainstream method of configuring energy storage capacity, battery capacity is designed on the basis of the capability of shaving peak demands [12]. In summary, an hour-based energy storage system configuring is commonly focused on improving system economy and security, but it usually neglects the dynamic characteristic of renewable generation.
To analyze the dynamic characteristic of renewable energy generation systems, one second is selected as the simulation cycle in [13] to configure the capacity of a flywheel battery hybrid energy storage system. However, Barelli L. et al. do not take system economy into account. Therefore, this paper is the first time that a battery and super-capacitor storage system is configured under multi-time scales while taking system economy, security, and the fluctuation of a renewable energy system into consideration.
After translating distributed energy storage system capacity configuration problems into multi-objective optimization problems, many scholars have applied different algorithms to solve the proposed problems. Chen S.X. et al [10,14] use mixed-integer linear programming (MILP) to optimize the capacity and the operation strategy of energy storage systems for microgrids. Additionally, considering the efficiency and operation characteristics of the storage devices, dynamic programming is used in [15] to determine the optimal capacity of a vanadium redox battery (VRB). Moreover, some scholars use metaheuristic algorithms to find the optimal capacity of distributed system energy storage systems [16,17]. The aforementioned papers have good performance on translating energy storage configuration problems into multi-objective optimization problems, generating a relatively high accuracy quantitative analysis, and revealing the best capacity and operation strategy of energy storage systems. However, these papers cannot directly point out the influence of different factors on the energy storage system configuration. Therefore, this paper firstly analyzes the key factors that can affect the installation capacity of distributed energy storage systems, and afterwards intuitively displays the key factors that can affect energy storage system installation capacity in a three-dimensional (3D) graph and carries out quantitative analysis.
To model renewable energy resource uncertainty and improve the accuracy of optimization results, the Monte Carlo method is extensively applied to study problems related to power system uncertainty. Liu W. et al. [18] use the pseudo-sequential Monte Carlo simulation to model the uncertainty of PV outputs, and it also combines the intelligent state space reduction to evaluate the economic performance of a power system with PV installation. In addition, based on the state sampling non-sequential Monte Carlo simulation and the DC load flow-based load curtailment model, Bakkiyaraj R.A. et al. simulated the random fault of the power system, and put forward a power system reliability evaluation method [19]. Also, by using the Monte Carlo method to simulate unbalanced voltage and then analyzing the effects of unbalanced voltage on PV hosting capacity, the hosting capacity of PV in different regions was shown in [20]. Moreover, the Monte Carlo method was used to simulate the uncertainty of wind power generation and users’ electric vehicle charging behaviors in [21]. In this paper, a joint operation model is proposed to decrease the high uncertainty of a wind power system by centralizing electric vehicle charging stations. In [18,19,20,21], the Monte Carlo method was successfully used to model the uncertainty of power systems, but this method has some limitations, such as for example, high complexity and low computation efficiency. In order to avoid the limitations of the Monte Carlo method, factors (excluding the uncertainty of renewable energy resource) that can affect energy storage system installation capacity are comprehensively considered when sizing hybrid energy storage systems. Then, by defining two indexes, wind speed volatility and solar irradiance volatility, the influence of renewable energy resource uncertainty on the proposed storage system is evaluated. This approach significantly reduces computation complexity. The main contributions of this article can be summarized as follows. (1) In the view of different time scales, this paper analyzes the renewable generation and load characteristics of a distributed power system, puts forward a high-precision storage capacity configuration method for a place with relatively stable meteorology, and optimizes the proposed model by using the genetic algorithm (GA). (2) By comprehensively considering the limitations of carbon emissions, costs, and the hybrid energy storage system installation capacity, this paper shows the relationship among the super-capacitor installation capacity, the battery installation capacity, and the average daily energy costs of the system in a 3D graph. Then, it generates a region of feasible hybrid energy storage system installation capacity in the 3D graph, and meanwhile reveals the influence of carbon emissions and daily energy cost on energy storage system installation capacity in a straightforward way. (3) The volatility of wind speed and solar irradiance are introduced at last to evaluate the anti-interference capability of the proposed hybrid energy storage system.
2. Modeling of Distributed Power System
This section first introduces the structure of a typical distributed power system. Subsequently, the output power and carbon emissions models of all of the energy carriers in a typical distributed power system will be demonstrated in sequence.
2.1. The Structure of a Typical Distributed Power System
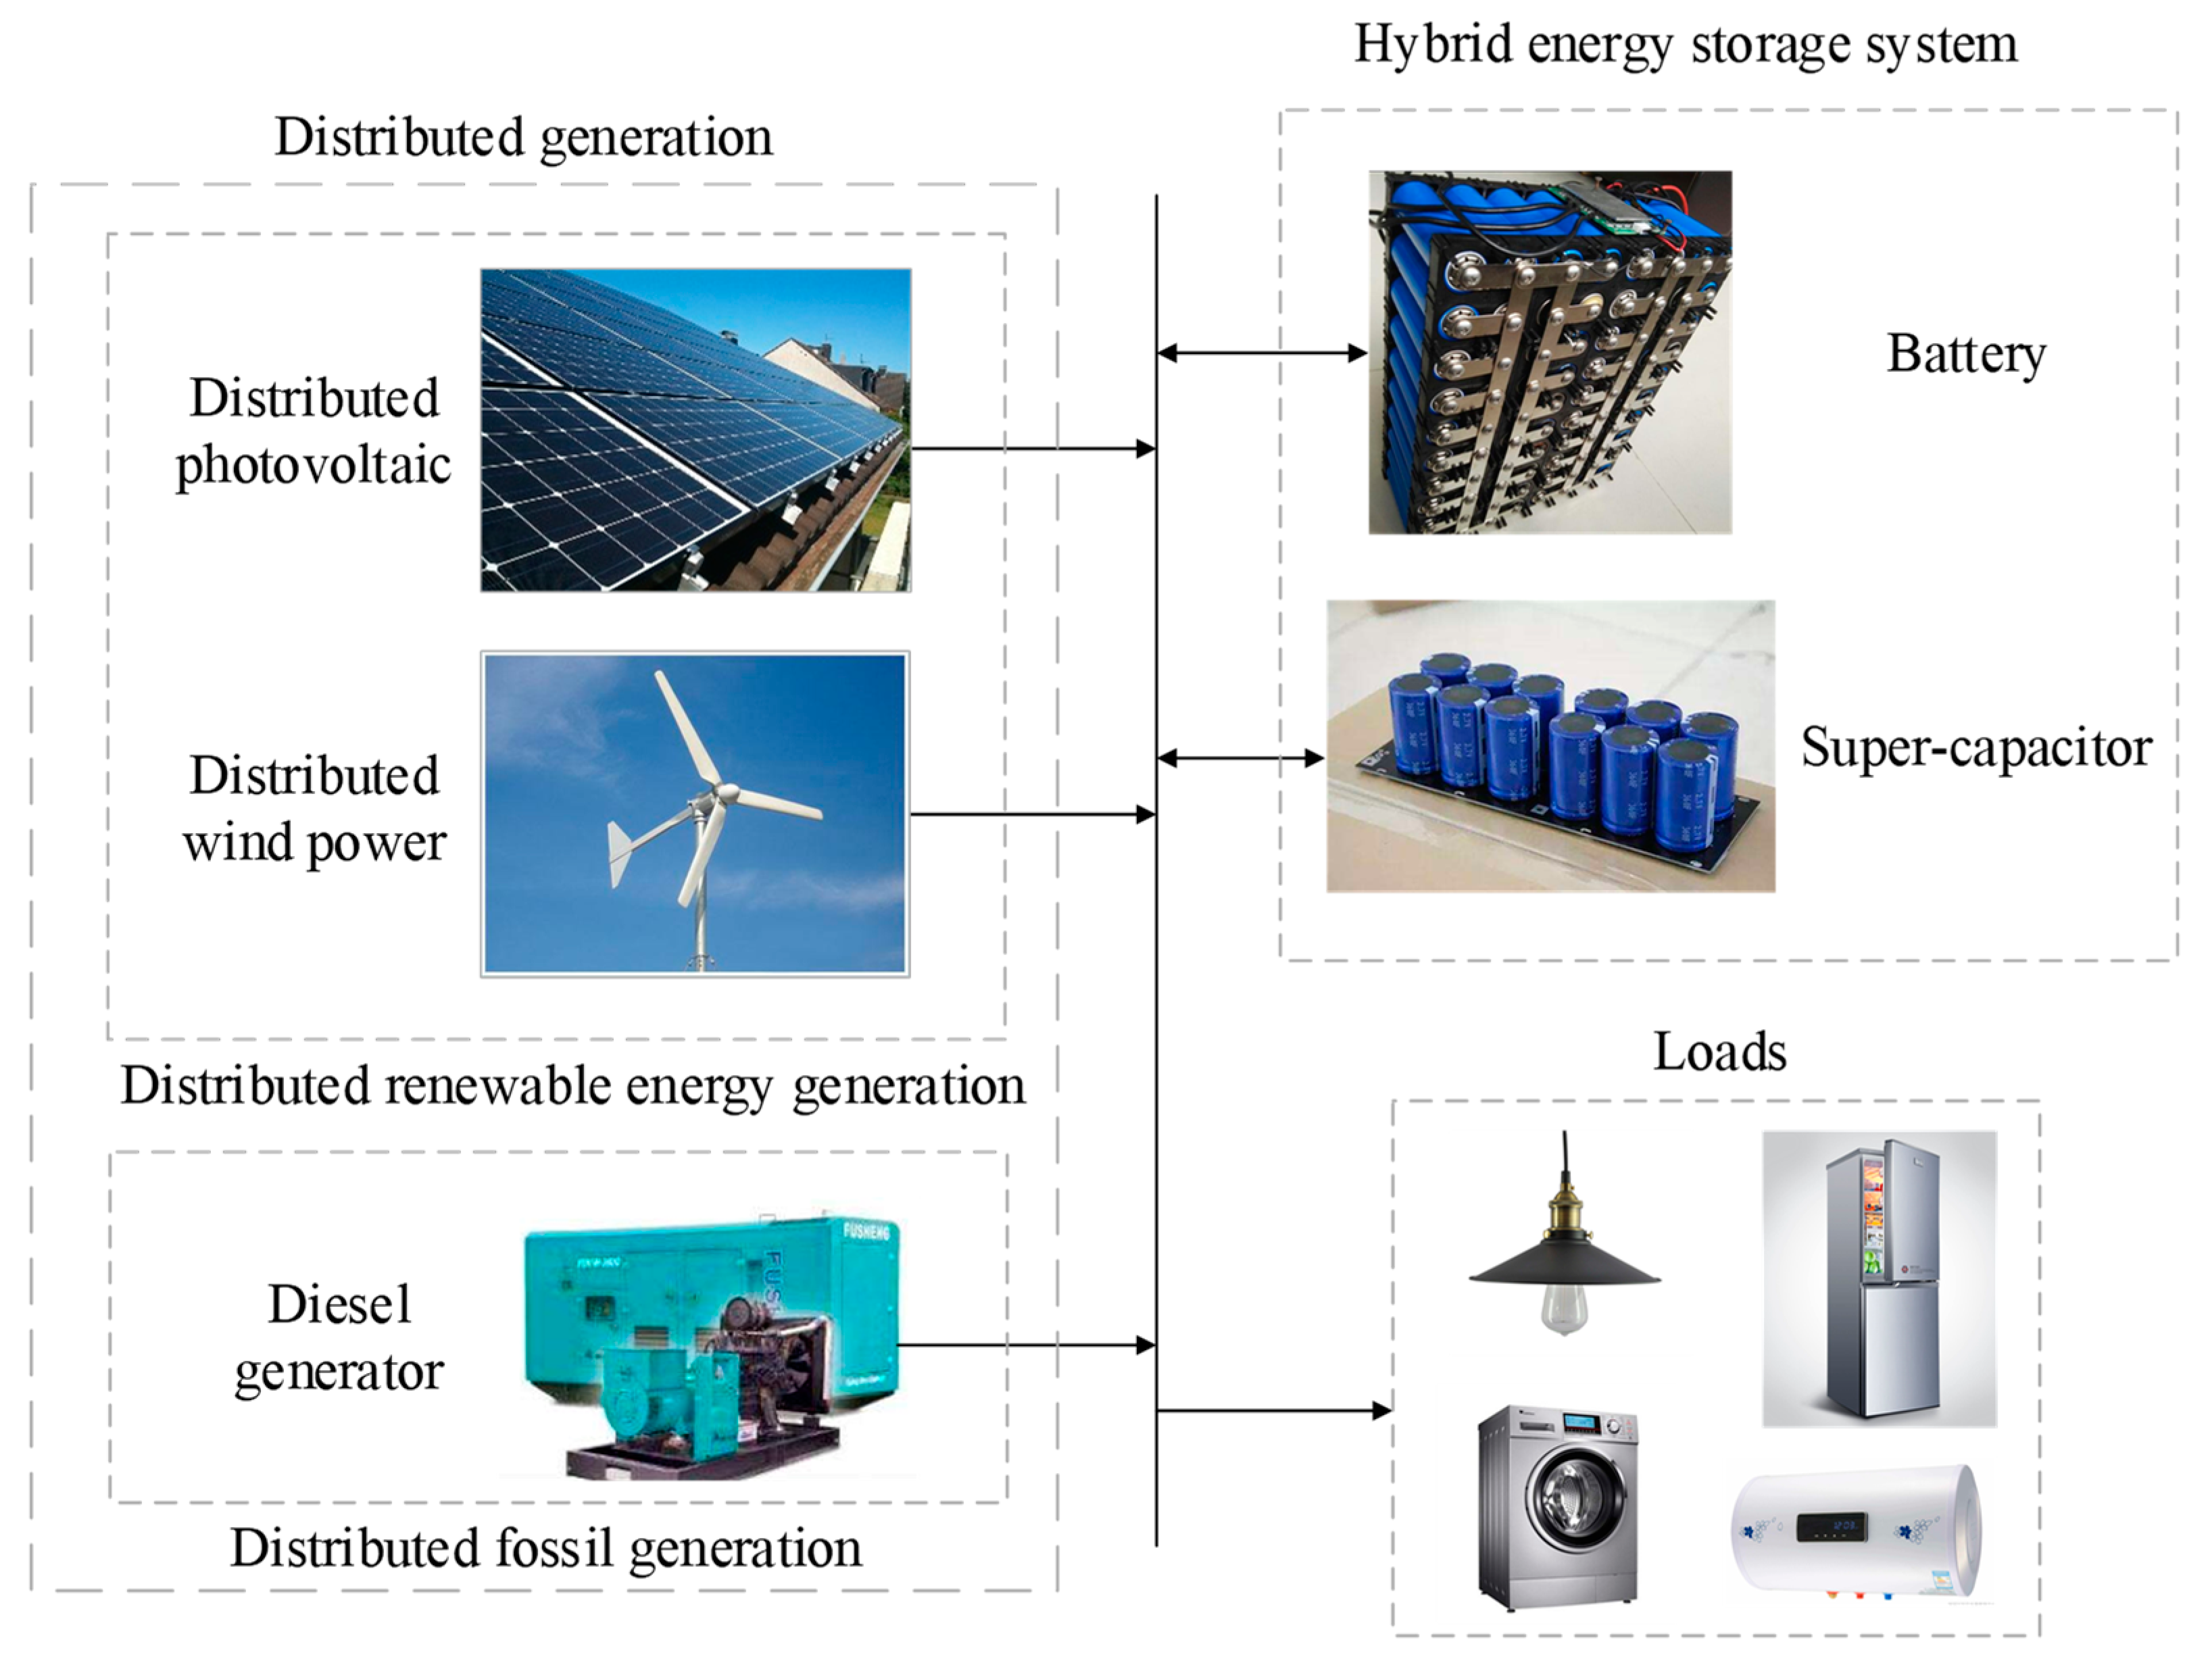
As shown in Figure 1, a distributed power system is composed of a distributed generation system, a hybrid energy storage system, and the loads. Distributed generation mainly includes two parts: the distributed renewable energy generation and the fossil energy generation. As two typical types of renewable energy, wind power and PV are extensively installed in distributed power systems because of their environmental friendliness and easy maintenance characteristics. However, both of their outputs can be greatly influenced by the weather, which may cause network power fluctuation and bring harm to the safety operation of the power grid [22,23,24]. Therefore, in distributed power systems, a fossil energy generation system is usually equipped to alleviate renewable energy system output power fluctuation. In the following sections, the diesel generator will be used as an example to show the mathematical output power and carbon emissions models of a fossil energy generator equipped in the proposed power system.
A distributed energy storage system, as the most important part of distributed power systems, is commonly used to shave peak demand, improve the renewable energy penetration rate, and smooth the renewable generation output power curve. However, as mentioned in the introduction, when different optimization time scales are selected, the meteorology (fluctuation characteristics) and the strong uncertainty of distributed power systems can cause different optimal results of energy storage installation capacity and operation strategy. Previous studies have preferred to take local meteorology characteristics as the key factor and select a longer time scale (for example: hour-based optimization) to configure the capacity of an energy storage system and optimize the operation of the energy storage system, which ignores the strong uncertainty (minute-based optimization) of the distributed generation [25,26]. Therefore, by taking the uncertainty and meteorology characteristics of the distributed power system into account, this paper introduces a super-capacitor and battery hybrid energy storage system to optimize the energy storage installation capacity and operation strategy.
As the end of distributed power system, the loads section is also an important part of power systems. There are many ways to classify the loads, such as AC and DC loads, uncontrollable and controllable loads, etc. In this paper, in order to optimize the energy storage system configuration and provide feasible operation strategies, this paper only monitors the active power of the distributed power system and weakens the load classification.
2.2. Modelling of Distributed Energy Carriers
2.2.1. Distributed Renewable Power Generation System
As shown in Figure 1, as one of the most important part of the distributed power system, the wind turbine system and PV system play a critical role in reducing carbon emissions and system operational costs, which accelerates the pace of the installation of renewable energy generators. However, the installation of renewable generators can increase system uncertainty, which may affect the stable operation of a power system. Therefore, it is better to clearly analyze the key factors that can affect the output power of renewable energy generators.
As reported by [27], the output power of a wind turbine system (PW) is mainly constrained by actual wind speed (v), blade area (A), wind turbine system efficiency (ηW), and air density (ρ), and its mathematical expression can be represented as follows:
where vin and vout are the cut-in speed and cut-out speed of a wind turbine system, respectively. For a distributed wind turbine system, the cut-in speed is about 3 m/s, and is saturated near 10 m/s.
As for the PV system, its output power (PPV) is strictly influenced by the ambient temperature (Tamb) and equivalent solar irradiance (R), which can be expressed as [28]:
where:
In Equations (2) and (3), PPV,STC is the maximum power under the standard test condition, RSTC represents the solar irradiance level under the standard test condition, γ is a coefficient, and Tr, Ta, and TNOC are the reference temperature of the PV cells, the actual temperature of PV cells, and the temperature of PV cells under the normal operating condition, respectively.
It can be concluded from Equations (1) and (2) that the output power of a wind turbine system and a PV system is primarily limited by the wind speed and the solar irradiance. However, the strong uncertainty of wind speed and solar irradiance can break the balance between power supply and demands, which can finally lead to power system outage. Therefore, many scholars have tried to develop complicated mathematical models to predict wind speed and solar irradiance in a more accurate way when sizing energy storage system capacity or optimizing system power flow, but this can increase the complexity of computation to some extent. To ease the process of predicting wind speed and solar irradiance, this paper first sizes hybrid energy storage system capacity by not considering the uncertainty of renewable energy. Then, it defines the maximum wind speed volatility (vv) and solar irradiance volatility (Rv) to represent the uncertainty of renewable generation. Finally, it uses these two variables to evaluate the anti-interference capacity of the proposed storage system (i.e., maximum acceptable renewable energy resource volatility for the designed hybrid energy storage system). In other words, this paper first sizes the energy storage system capacity, and then evaluates the influence of renewable generation uncertainty on the proposed storage system.
The mathematical expressions of wind speed volatility and solar irradiance volatility are defined as follows:
In Equations (4) and (5), αw and αs are coefficients of wind speed volatility and solar irradiance volatility, respectively, while vh and Rh represent the historical wind speed and historical solar irradiance, respectively. Equations (4) and (5) show that both wind speed volatility and solar irradiance volatility have lower limits and upper limits, and that their lower limits and upper limits are directly related to the maximum volatility coefficients and the historical data of wind speed and solar irradiance. To evaluate the influence of renewable energy resource uncertainty on the proposed storage system, the modified wind speed and solar irradiance can be expressed with the summation of their historical data and their volatility values. However, it is worth noting that the modified wind speed and solar irradiance cannot be a negative value; therefore, it is necessary to limit the minimum values of the modified wind speed and solar irradiance. Equations (6) and (7) are the mathematical expressions of modified wind speed (v′) and solar irradiance (R′):
Since the carbon dioxide emissions are relatively low (about 20 g/kWh) for the PV system [29] and even less for the wind turbine system, the carbon emissions of the proposed renewable energy generation system are neglected in this paper.
2.2.2. Distributed Diesel Generator System
A small-scaled diesel generator system is widely deployed in distributed power systems because of its strong controllability, flexibility, high energy efficiency, and adaptability to different environments. For a distributed system, especially an off-grid system, the installation of distributed diesel generators can significantly reduce the system loss-of-load probability (LOLP), which will potentially improve system reliability. The mathematical expression of a diesel generator output power (Pd) can be written as:
where ηd is the energy conversion efficiency of the diesel generator, and Pdin represents the input power of the diesel generator. In this situation, the carbon emissions of the diesel generator (CO2(Pd)) can be expressed as follows:
where a, b, and c, the carbon emission coefficients, are respectively assigned the values of 28.144, 1.728, and 0.0017 in this paper [29].
2.2.3. Distributed Energy Storage System
There are two main types of energy storage devices: the power-type storage devices and the energy-type storage devices. Compared with the energy-type storage devices, the power-type storage devices have a faster response time and a longer lifespan [30,31]. They are widely used in renewable energy generation systems to smooth the output power of wind turbine and PV systems. The super-capacitor, one of the most mature power-type storage devices, is extensively used to stabilize power system fluctuation [32], whose maximum output power (Pscmax) can be expressed as:
Vsc is the terminal voltage of the super-capacitor, and iscmax means the maximum output current of the super-capacitor. In order to achieve its maximum output power, the capacity of the super-capacitor (Qsc) should meet the following requirement:
where:
In Equations (11) and (12), i represents the average current, dV is the difference between the maximum operation voltage and the minimum operation voltage of the super-capacitor system, dt is the time of discharge, τ means the time constant, and iscmin refers to the minimum output current of the super-capacitor.
Unlike the power-type storage devices, the energy-type storage devices have the advantages of longer storage time and larger energy storage capacity. Lead–acid batteries, as the most mature energy-type storage devices, are widely applied to shave the peak demand in a power system [33], whose maximum output (Pbmax) can be expressed as:
where Vb is the terminal voltage of the battery system, and ibmax means the maximum output current of the battery. In order to improve battery lifespan, the maximum output current of the battery is limited by the installation capacity of the battery. Therefore, the initial capacity of the battery (Qb) can be described as [33]:
where β represents the maximum discharge current coefficient of the battery.
Since the distributed hybrid energy storage system (super-capacitor and battery) does not consume fossil energy and exhaust carbon dioxide, the carbon emissions of a hybrid energy storage system are ignored in this paper.
3. System Optimization
In this paper, the power system optimization problem is translated into a multi-time dimension (on the hour level and minute level) optimization problem that relates to the coordinated operation of wind power, PV, energy storage, and loads.
3.1. Objective Function
This paper comprehensively considers renewable generation uncertainty, power system security, and the carbon emissions of fossil generation, and then optimizes the hybrid energy storage installation capacity with the goal of minimum generation cost.
where EW, EPV, and Ed are the electrical energy generated by wind power, a PV system, and diesel generators, respectively. CW, CPV, and Cd represent the levelized cost of energy (LCOE) of a wind turbine system, PV system, and diesel generator system. It is worth noting that the LCOE considers various factors such as the depreciation of the system fixed assets, the operating costs of the project, the maintenance costs, and so on. Therefore, the LCOE can be used to represent the total costs of generating per-unit electricity (kWh) of different energy sources. Equation (16) is the mathematical expression of LCOE:
where Ii is the investment expenditures in the year i, Mi is the operations and maintenance expenditures in i, and Fi and Ei are the fuel expenditures and electricity generation in i, respectively. s represents the discount rate, and n is the expected plant lifetime.
3.2. Constraints
3.2.1. Equality Constraints
• Power Balance
To keep the balance of power supply and demands, the outputs of a renewable power generation system, diesel generator system, and hybrid energy storage system (PHS) should meet the loads (PL):
It is worth noting that the value of PHS is positive if the hybrid energy system is discharged, and it is negative when it is charged. To keep power system security operation, the power balance constraint should always be satisfied. However, in the worst case, energy provided by the distributed generation system and the hybrid energy storage system cannot meet the loads, which makes the power system take a risk of loss of load. The mathematical expression of the loss-of-load probability (LOLP) can be written as:
In Equation (17), T is the overall simulation period, and tL>S is the loss-of-load period.
3.2.2. Inequality Constraints
• Carbon Emission Constraint
In order to strictly control carbon dioxide emissions and reduce greenhouse gas outputs, carbon emissions need to be lower than the maximum carbon emissions (CO2max):
• Loss of Load Constraint
The increase of system loss of load probability will reduce system security. Therefore, the LOLP should be restricted to its maximum acceptable range (LOLPmax):
• Battery State-of-Charge (SOC) Constraint
In order to extend the lifespan of battery system, the SOC of the battery should be set as:
where [34]:
In Equations (20) and (21), SOCmin, SOCmax, SOC(t), and SOC(t − 1) are the minimum SOC, the maximum SOC, battery SOC at time t, and battery SOC at at time t − 1, respectively. ηb and ηc represent the nominal cycle efficiency of the battery system and the nominal efficiency of the power conversion system. Pbc and Pbd are the charge power of the battery system measured in AC before the AC/DC conversion stage, and the discharge power of the battery system measured in the AC after the DC/AC conversion stage. τ is the dimension of the time period t, and SDR is the self-discharge of the storage system.
• Renewable Generation Fluctuation Constraint
The fluctuation characteristics of wind speed and solar irradiance can lead to renewable system output power fluctuation. This paper takes one minute as the simulation step size, and defines that in order to keep the renewable system output power fluctuation within the certain range in a time period (Δt), the renewable power fluctuation rate (γ1) of the renewable system should be limited to:
where:
In Equation (23), γmax is the maximum renewable power fluctuation rate. PW(t), PPV(t), PW(t + Δt), and PPV(t + Δt) represent the outputs of the wind turbine and PV systems at the time of t and t + Δt, respectively. PWR and PPVR are the rated power of the wind turbine and PV systems.
• Power System Peak Shaving Constraint
Similar to the wind speed and solar irradiance, power system loads also fluctuate. However, it is important to consider that a distributed power system normally contains a variety of loads, and the use of these loads can be affected by many reasons, rather than a single reason. Therefore, power system loads may not change frequently. In this situation, many papers select a longer time scale (at the hour level) to optimize the capacity of a battery storage system. At this point, the research focuses on limiting the system peak valley difference. Equation (24) is the constraint of power system peak shaving:
where:
In Equations (24) and (25), θmax is the maximum allowance of the power system peak and valley difference. Meanwhile, PLmax, PLmin, and PLaver are the maximum loads, minimum loads, and average loads of a power system.
3.3. Optimization Algorithm
Since the GA is an effective algorithm to deal with single objective and multi-objective optimization problems, and it has clearly advantages when used to solving discontinuous and nonlinear problems [35], the GA is widely used to optimize power system configuration. Compared with other optimization algorithms, the GA can give more accurate results, although this method needs many iterations and has a relatively long computation time.
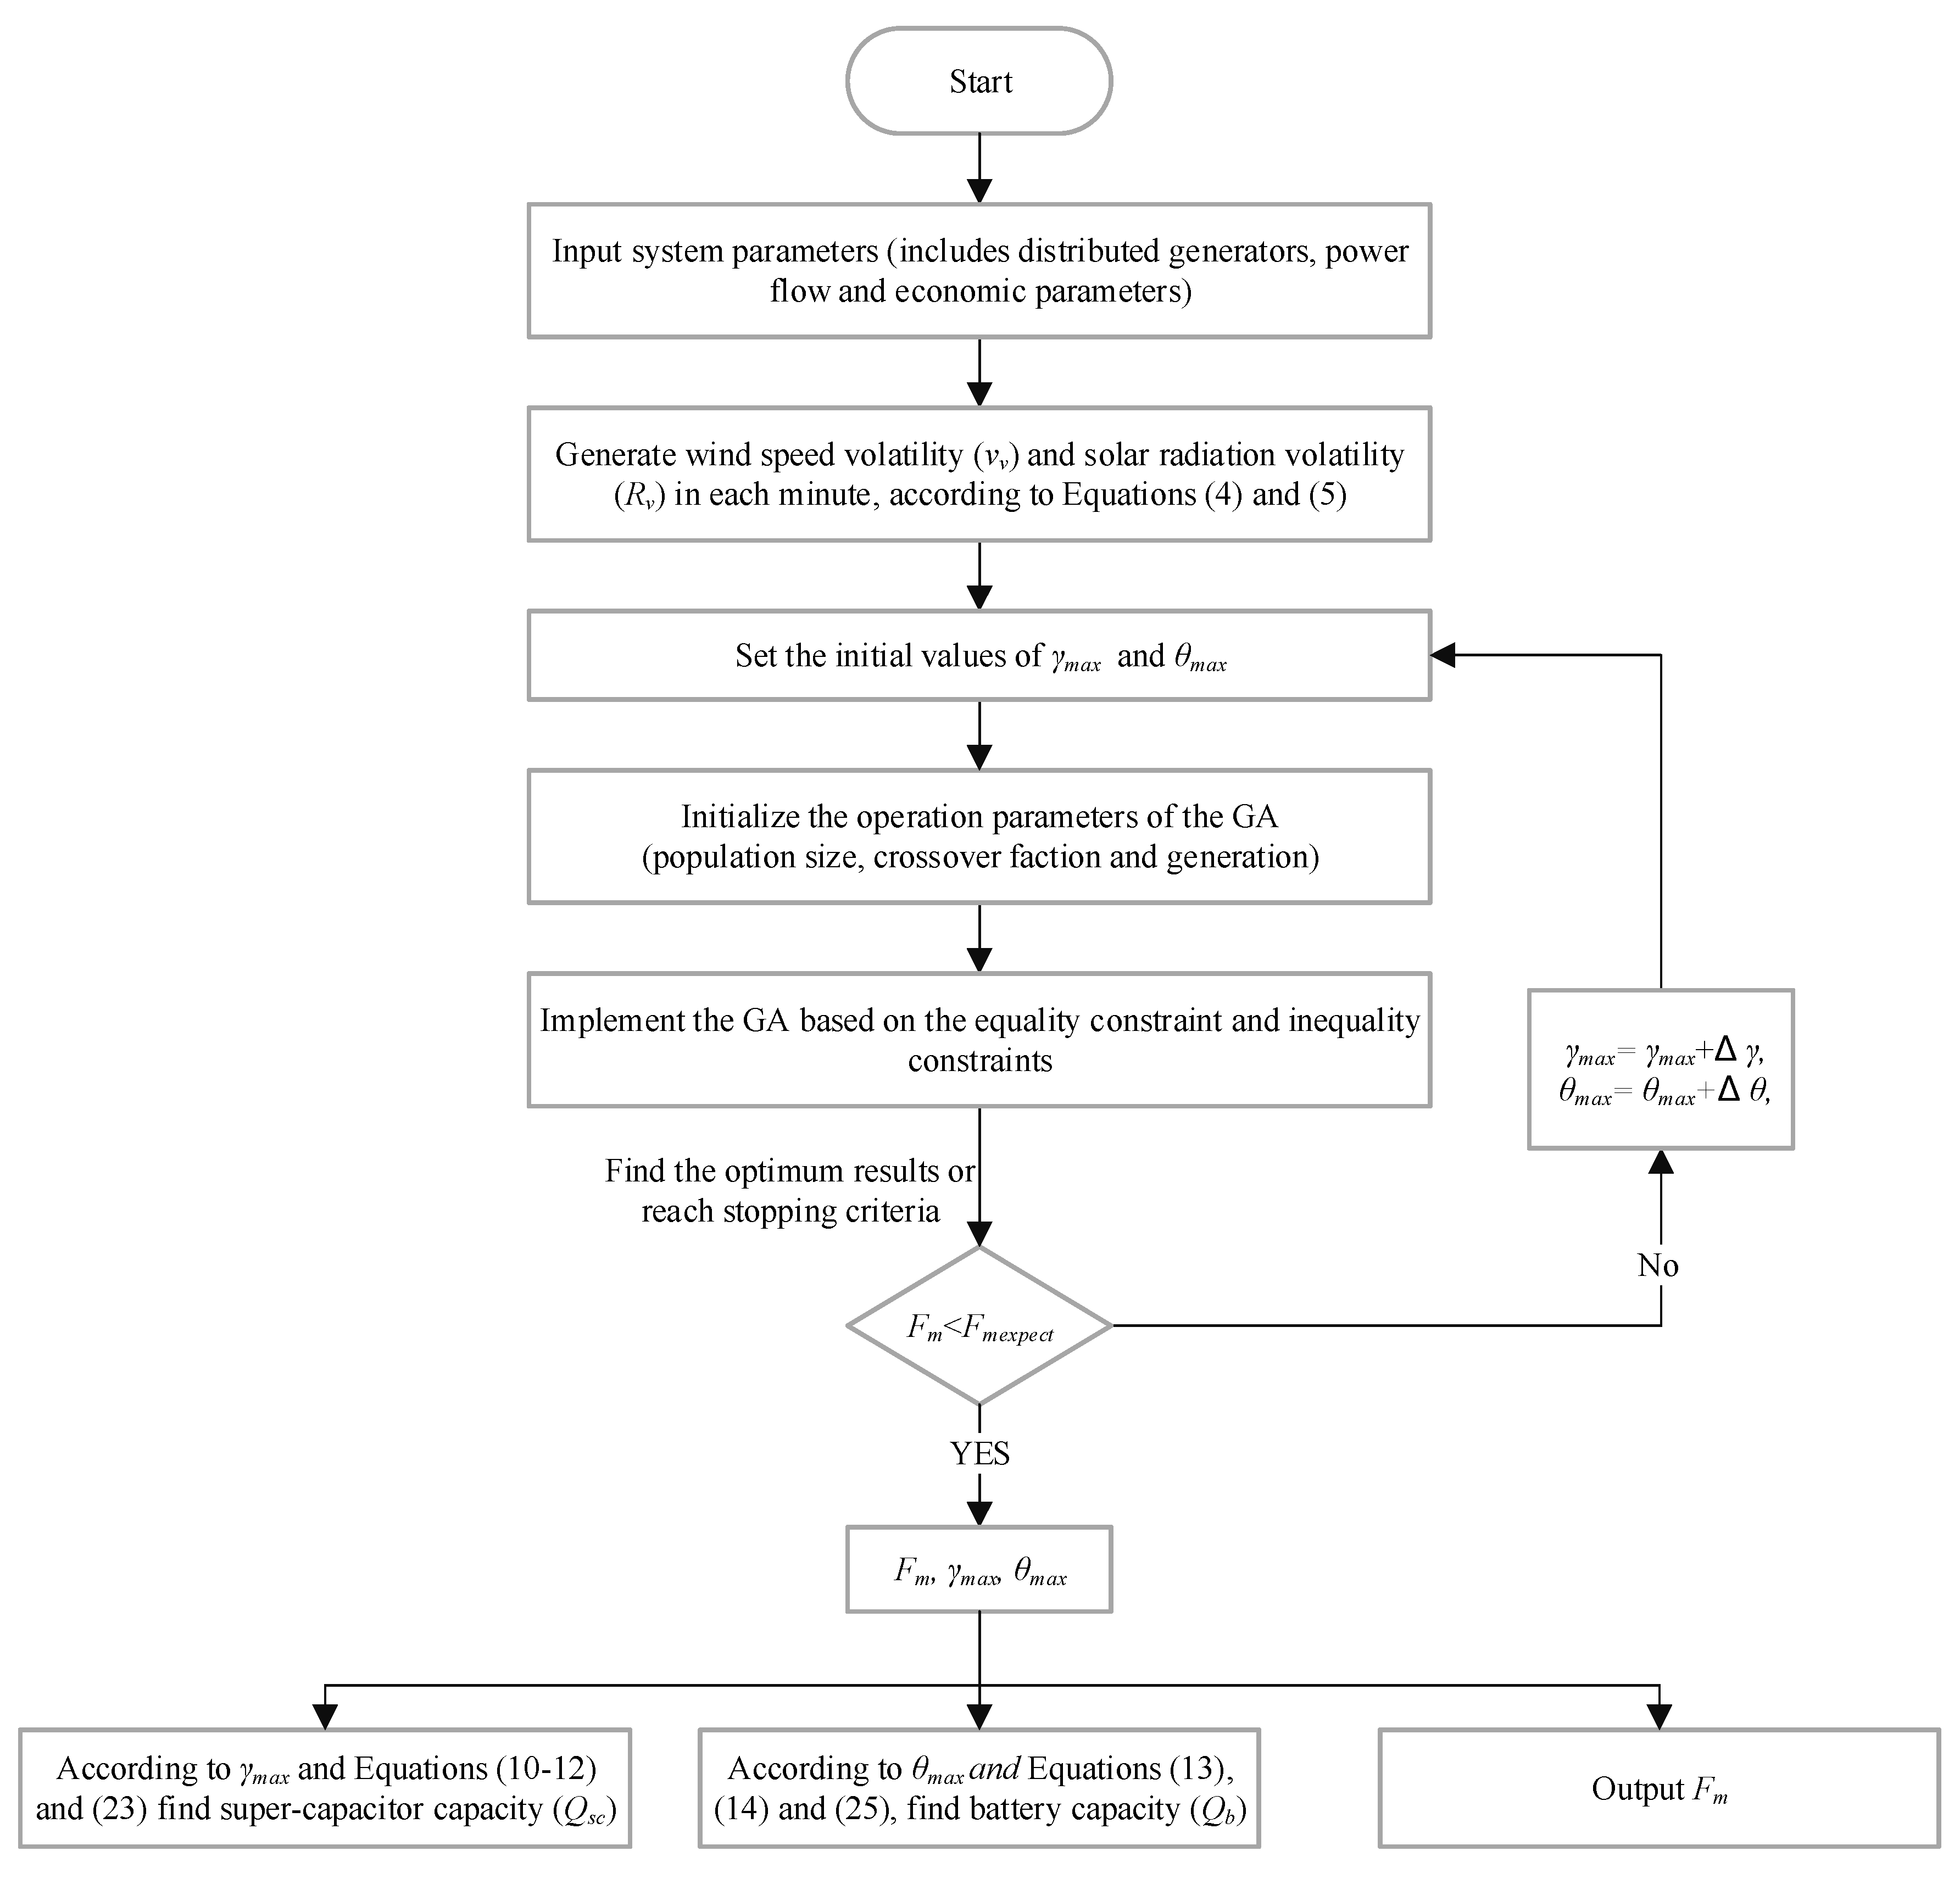
As the key step of implementing the GA, the selection of chromosomes (individuals), selection, crossover, and mutation play a decisive role in improving the accuracy of the optimization results and accelerating the speed of computation. To balance the speed and the accuracy of calculation, this paper selects 20, 0.6 and 100 as the population size, crossover fraction and generations (stopping criteria), respectively. Figure 2 is a flow diagram to show the step of the optimizing hybrid energy storage system installation capacity based on the proposed GA.
4. Case Study
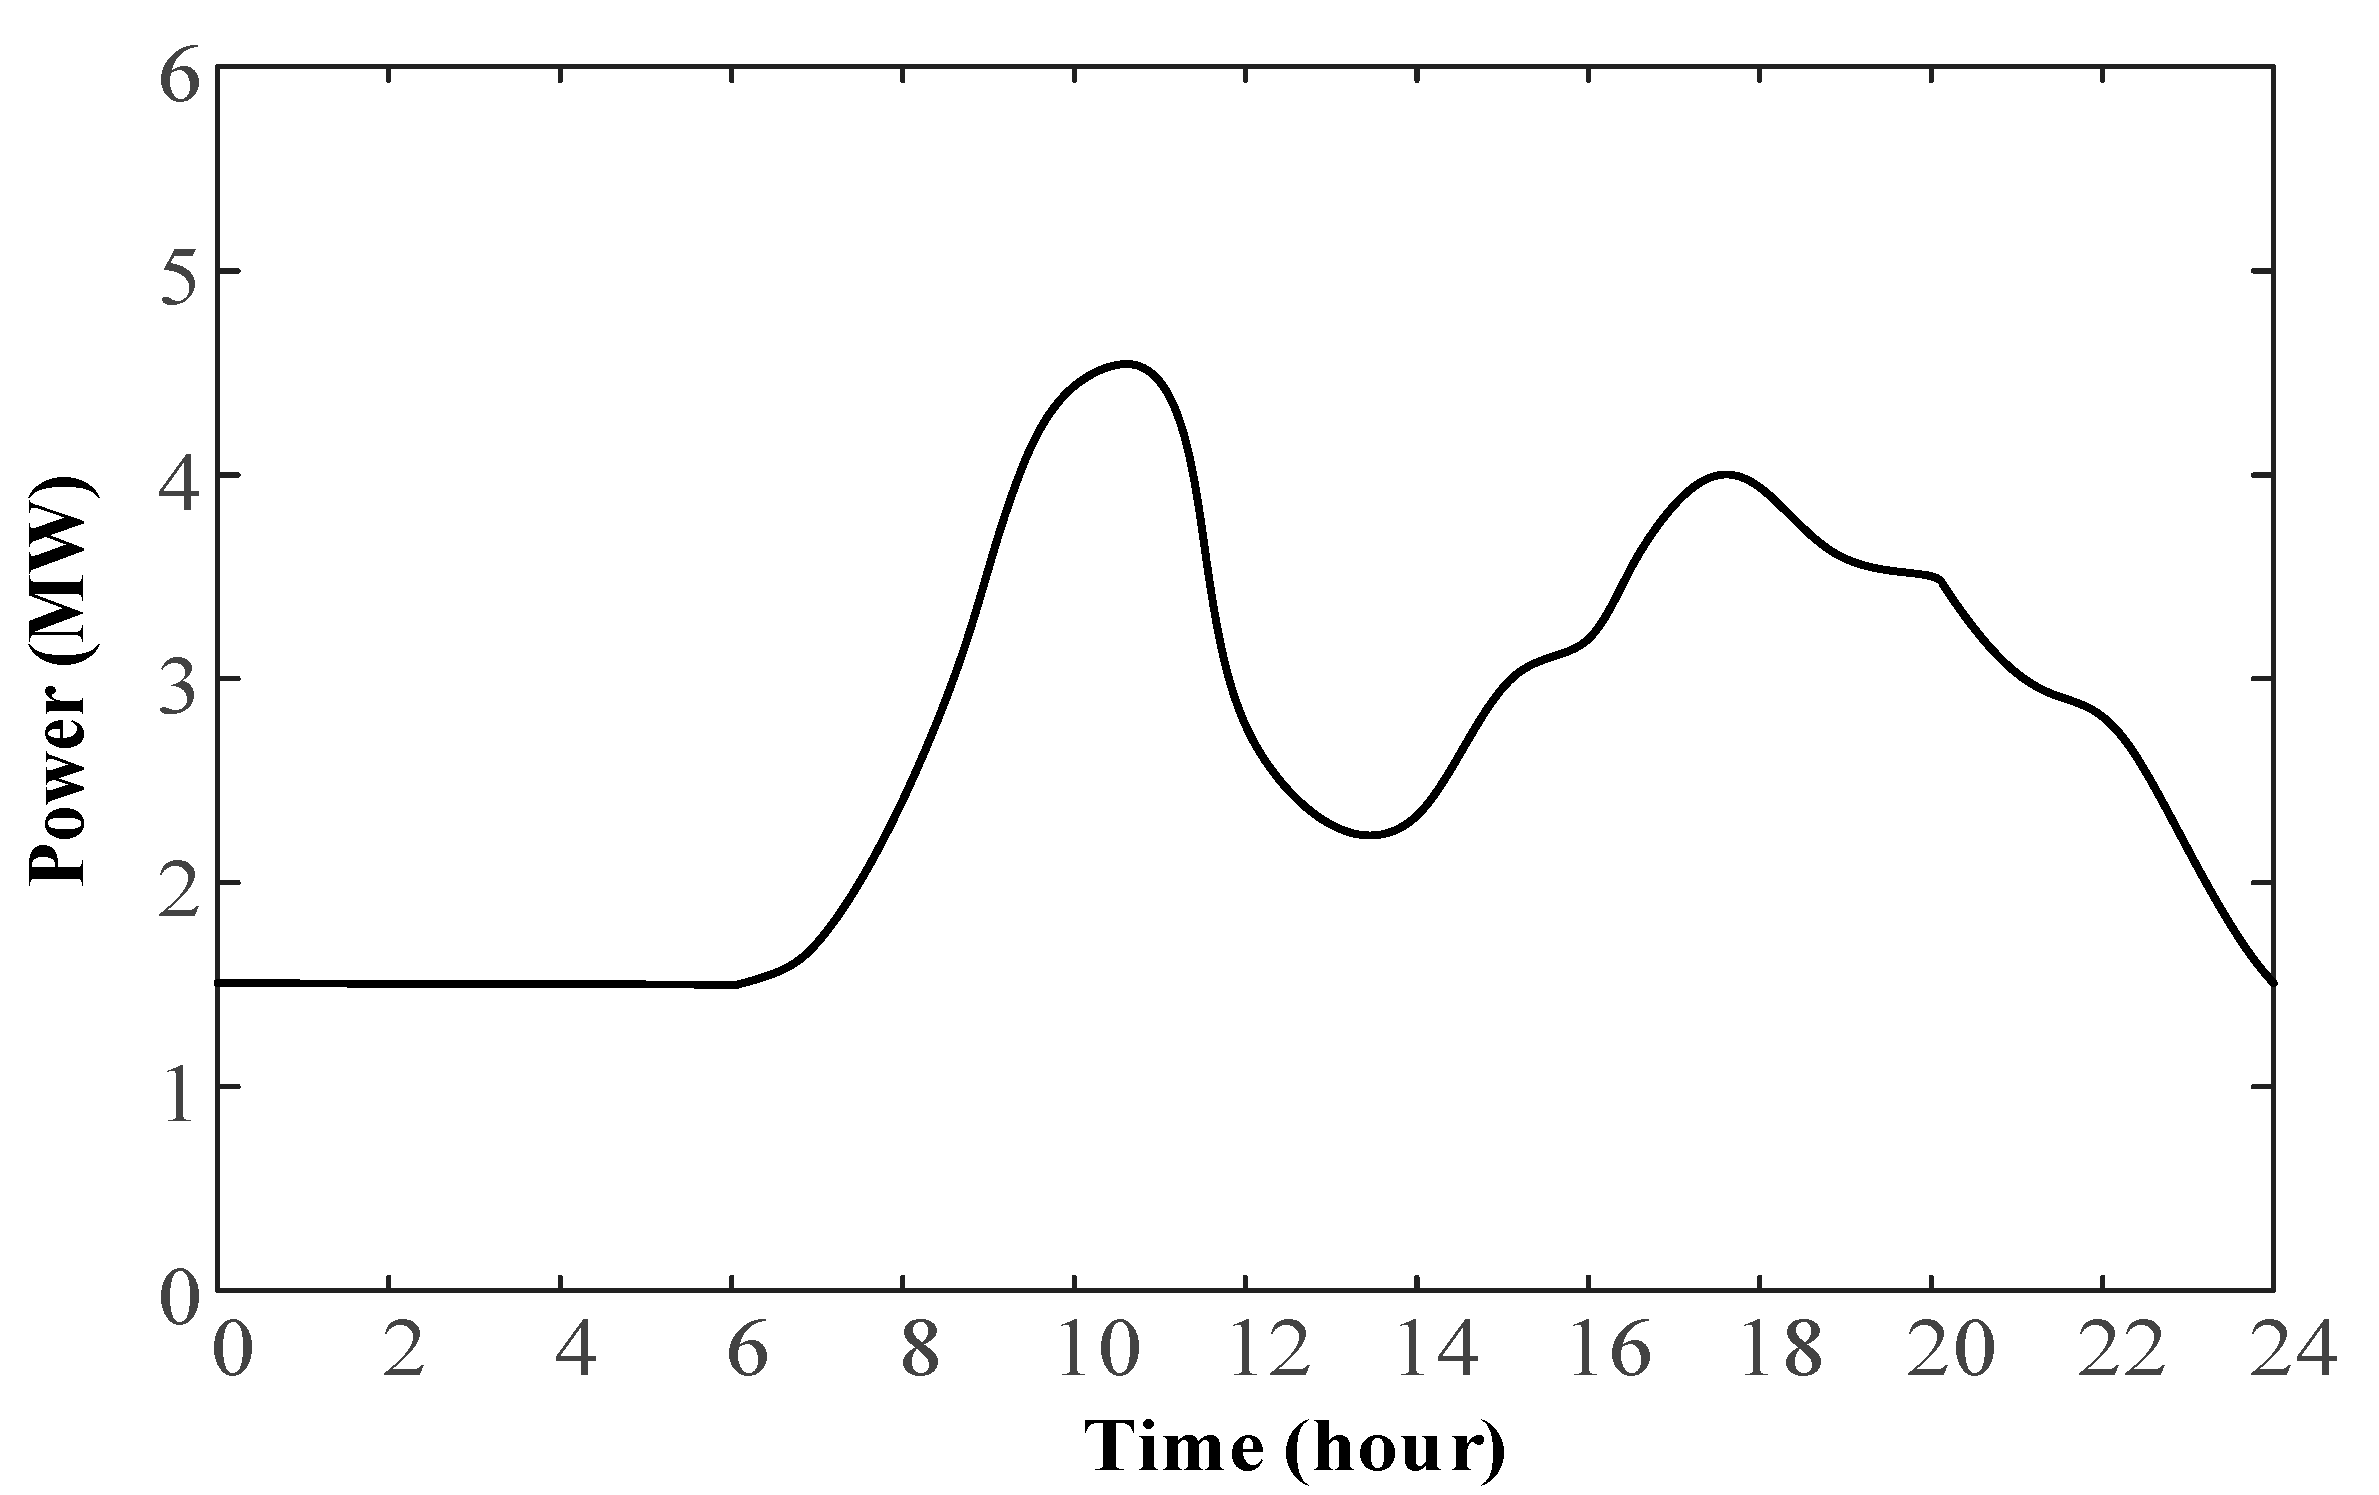
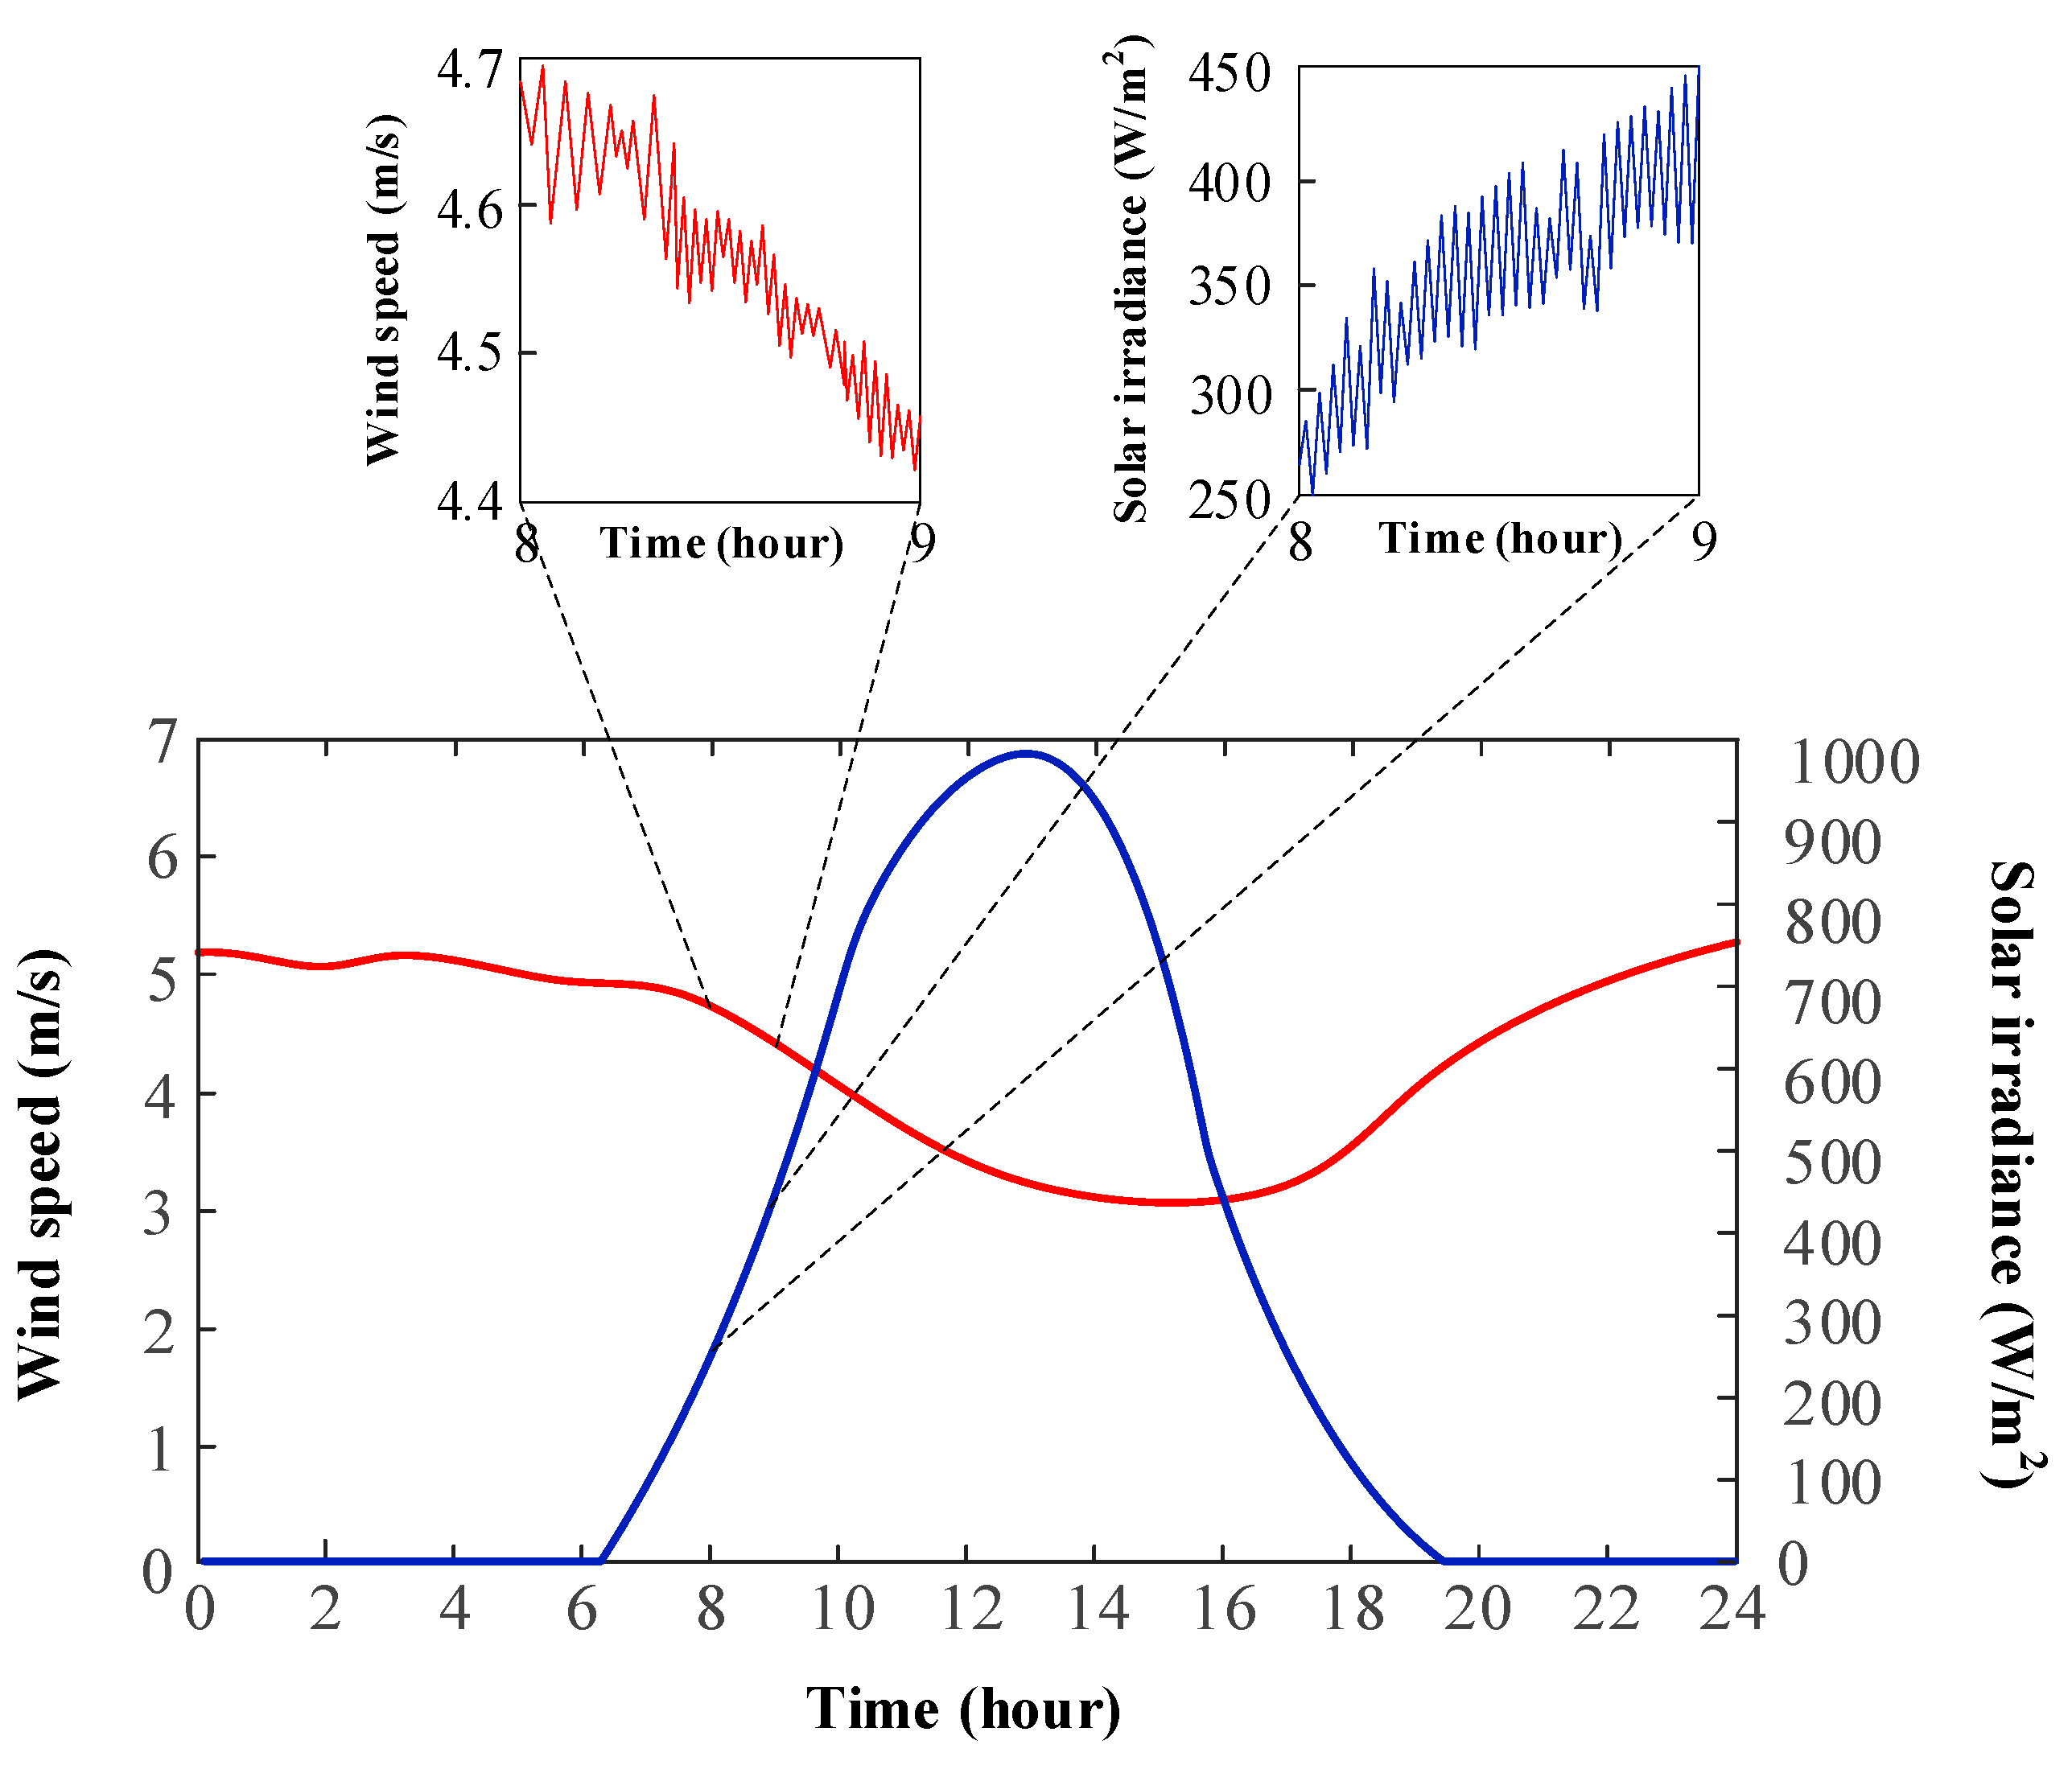
In this paper, a small community in China with a peak demand of 4.5 MW is analyzed. In this community, a distributed PV generation system, a wind turbine system, and diesel generators are installed. Additionally, this community works on the off-grid operation mode. Moreover, in order to meet the basic requirements of the operational cost of the community, smooth the renewable generation and the loads curves, reduce the carbon emissions, and improve the system security (reduce the LOLP rate), this paper focuses on optimizing the installation capacity of a battery super-capacitor energy storage system. Figure 3 shows the average yearly load curve of the proposed community on an hour-based time scale. Figure 4 is the meteorological data of this region, which includes the average yearly wind speed and solar irradiance. It is worth noting that the main body of Figure 4 (hour-based) shows the variation tendency of wind speed and solar irradiance, and two peripheral diagrams in Figure 4 (minute-based) are used to illustrate the uncertainty of renewable energy.
According to the LCOE published by State Electricity Regulatory Commission, CW, CPV, and Cd are assigned the value of 10 US cents/kWh, 14 US cents/kWh, and 6 US cents/kWh in this paper, respectively [36]. Considering the constraint of space, the installation capacity of the PV and wind turbine systems should be no more than 2 MW and 1 MW, respectively. In addition, in order to reduce the LOLP rate, the LOLPmax is set as 5%. Moreover, in order to extend the battery lifespan, the maximum discharge current coefficient of the battery β is assigned to 1, the nominal cycle efficiency of the battery system is set as 90% [27], SDR is set as 0.1%, and the nominal efficiency of the power conversion system is set as 99%. Finally, the energy efficiency of the diesel generators is 40% [37]. The following results are acquired by implementing MATLAB (R2016b, MathWorks company, Nettie, MA, USA) Simulation.
5. Results and Analysis
5.1. Optimization Results of Battery Super-Capacitor Installation Capacity
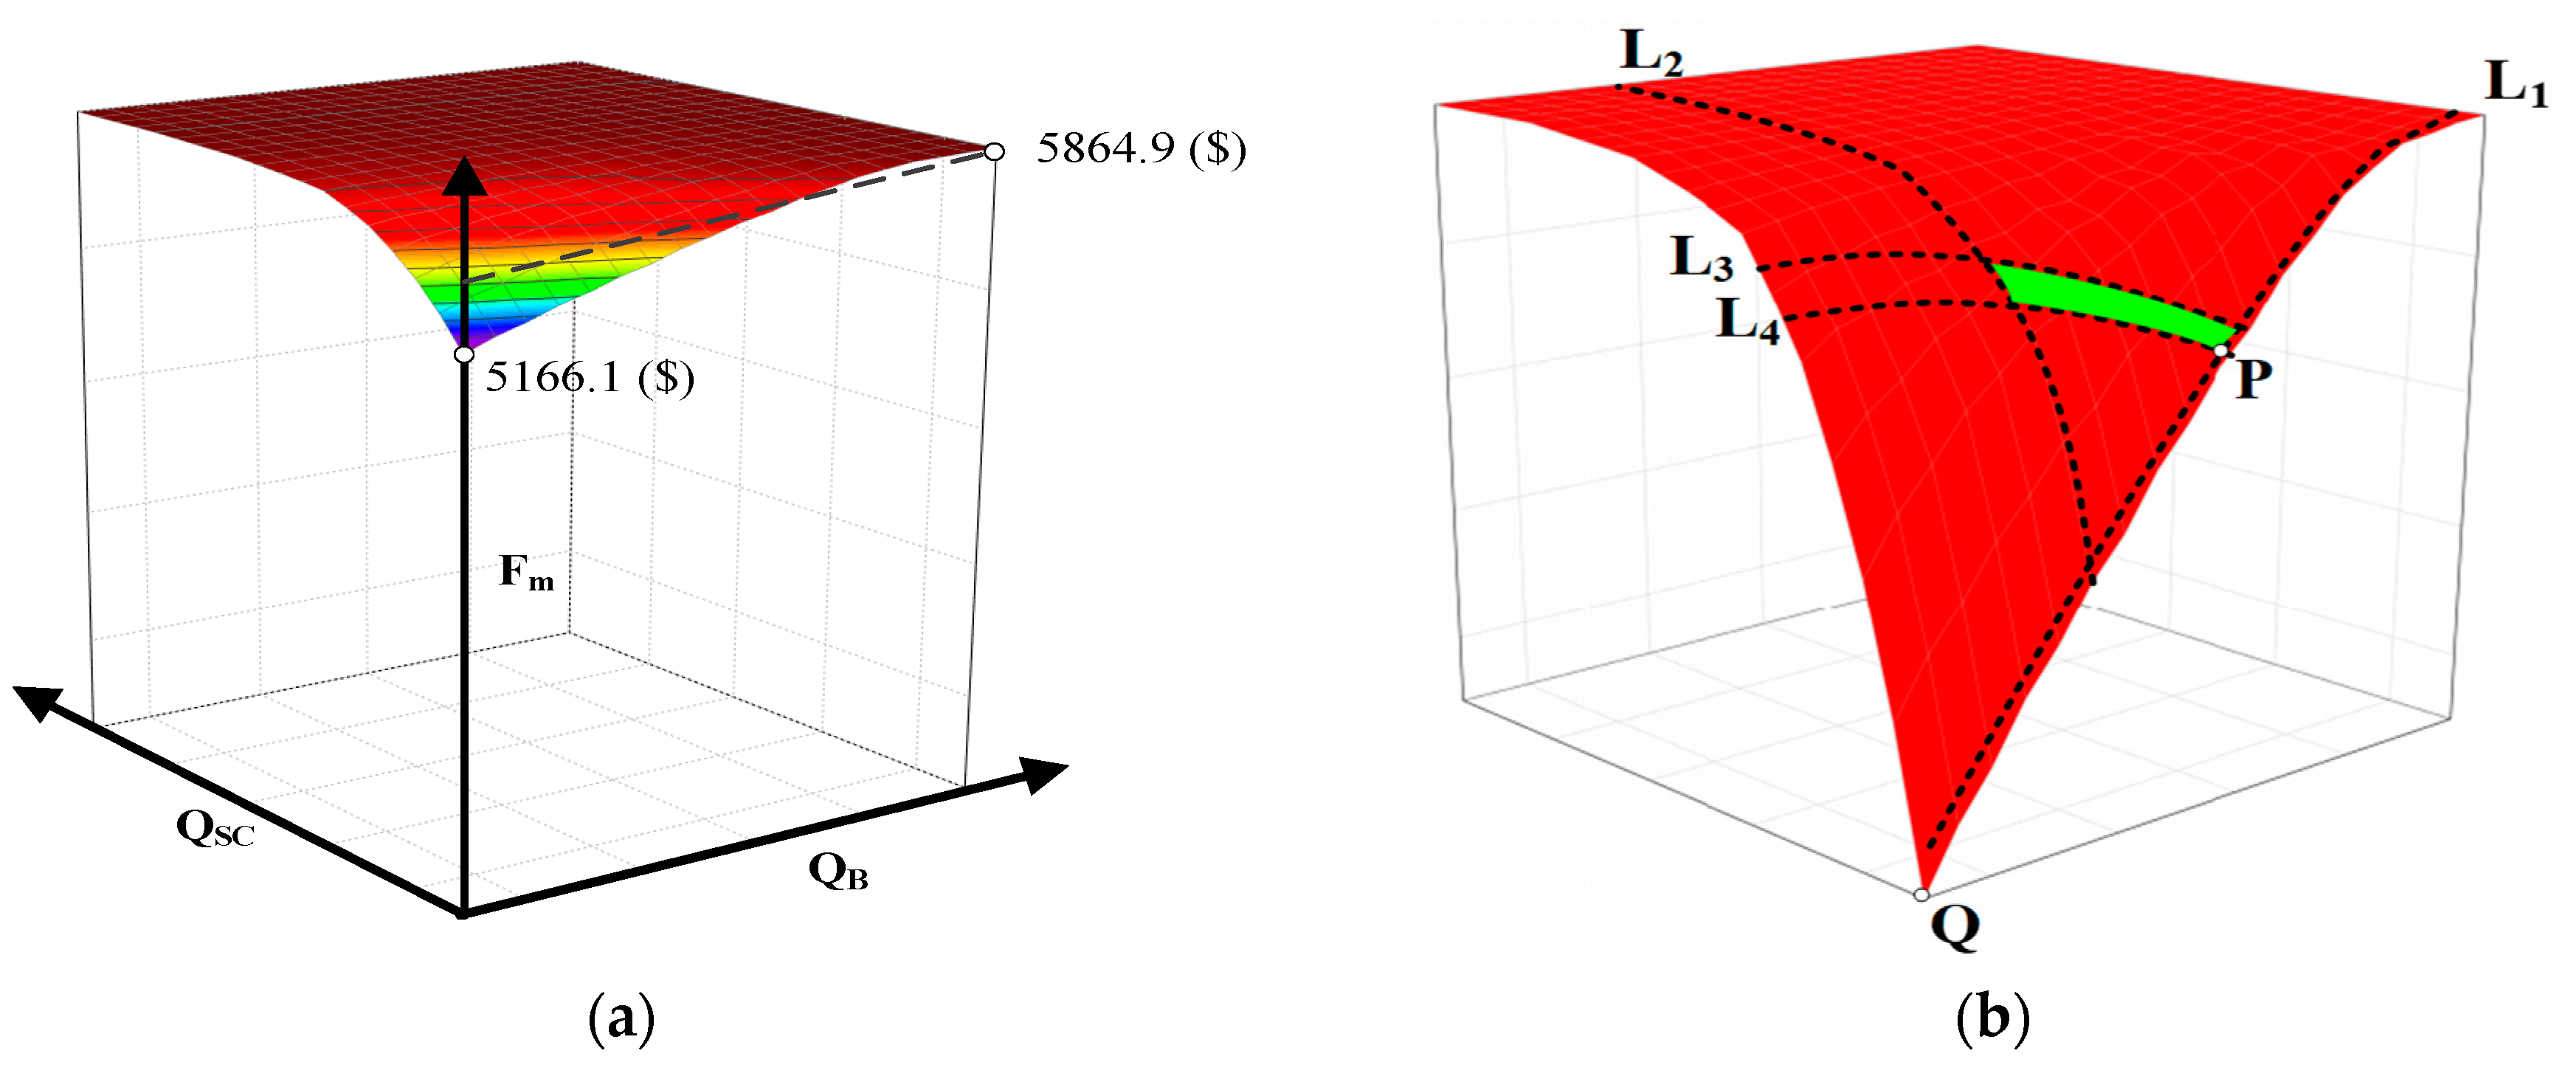
Figure 5a shows the relationship among the battery installation capacity, the super-capacitor installation capacity, and the average daily generation cost of the distributed power system. In order to clearly reveal the factors that can affect the installation capacity of the hybrid energy storage system, Figure 5b magnifies the surface of Figure 5a for further analysis.
As shown in Figure 5a, with the increase of battery and super-capacitor installation capacity, the more electrical energy can be provided by renewable generators to reduce carbon emissions. However, with the increase of renewable generation, the daily energy cost of the distributed power system will increase correspondingly. This is because the power generated by the renewable system has a higher LCOE compared with the diesel generator. Additionally, Figure 5a shows that by increasing the hybrid energy installation capacity, the average daily generation cost of the system increases from 5166.1 U.S. dollars to 5864.9 dollars, which is a 13.5% increase.
Figure 5b shows the constraints of the carbon emissions, the average daily generation cost, the renewable energy fluctuation, and the LOLP rate when sizing the battery and super-capacitor capacity. L1 shows that the minimum capacity of the super-capacitor is limited by the fluctuation of renewable energy. To smooth the outputs of renewable generation, the capacity of the super-capacitor should be no less than L1. L2 mainly reflects that the battery needs to provide enough spinning reserve to reduce the LOLP rate of the system. L3 and L4 reveal that the total capacity of the hybrid energy storage can be tremendously limited by the maximum allowance of the average daily generation cost and the carbon emissions. Due to the aforementioned limitations, the green area in Figure 5b is the only feasible scope of the hybrid energy storage system capacity. Finally, considering that the installation costs of super-capacitor is far more expensive than that of the battery, it is preferable to choose point P as the best capacity of the hybrid energy storage system.
5.2. System Optimal Operation Strategy of Point P
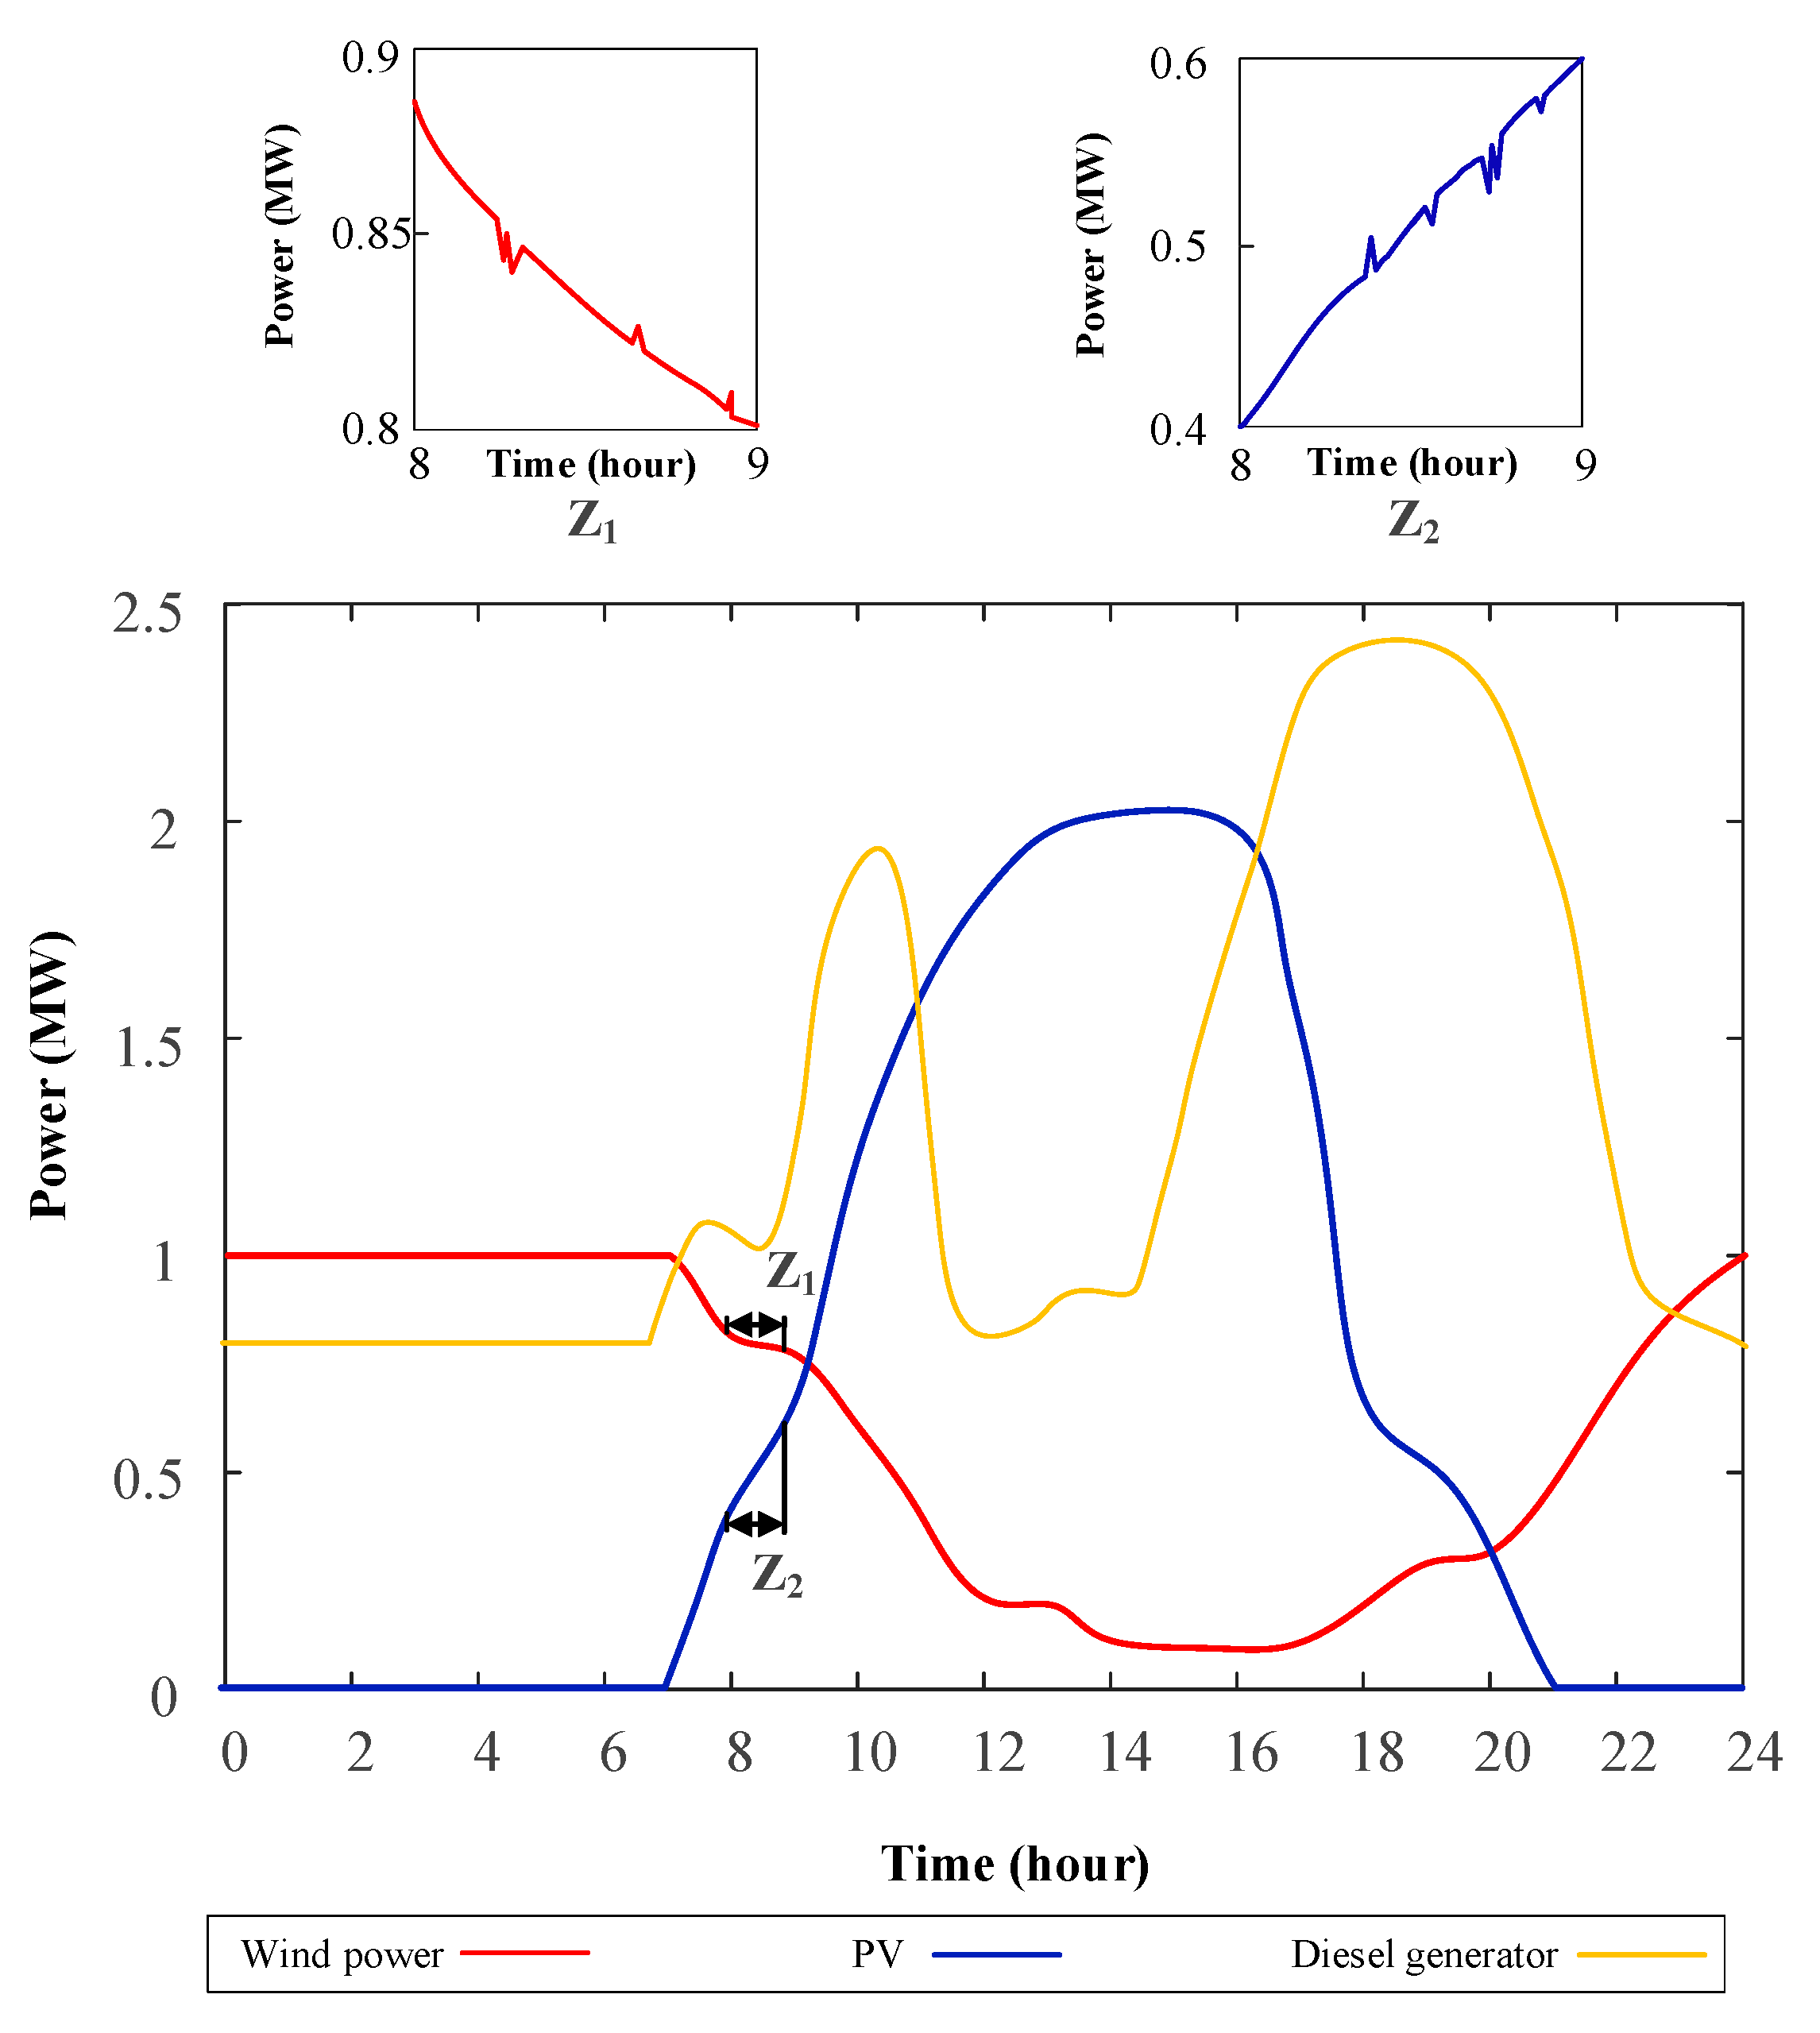
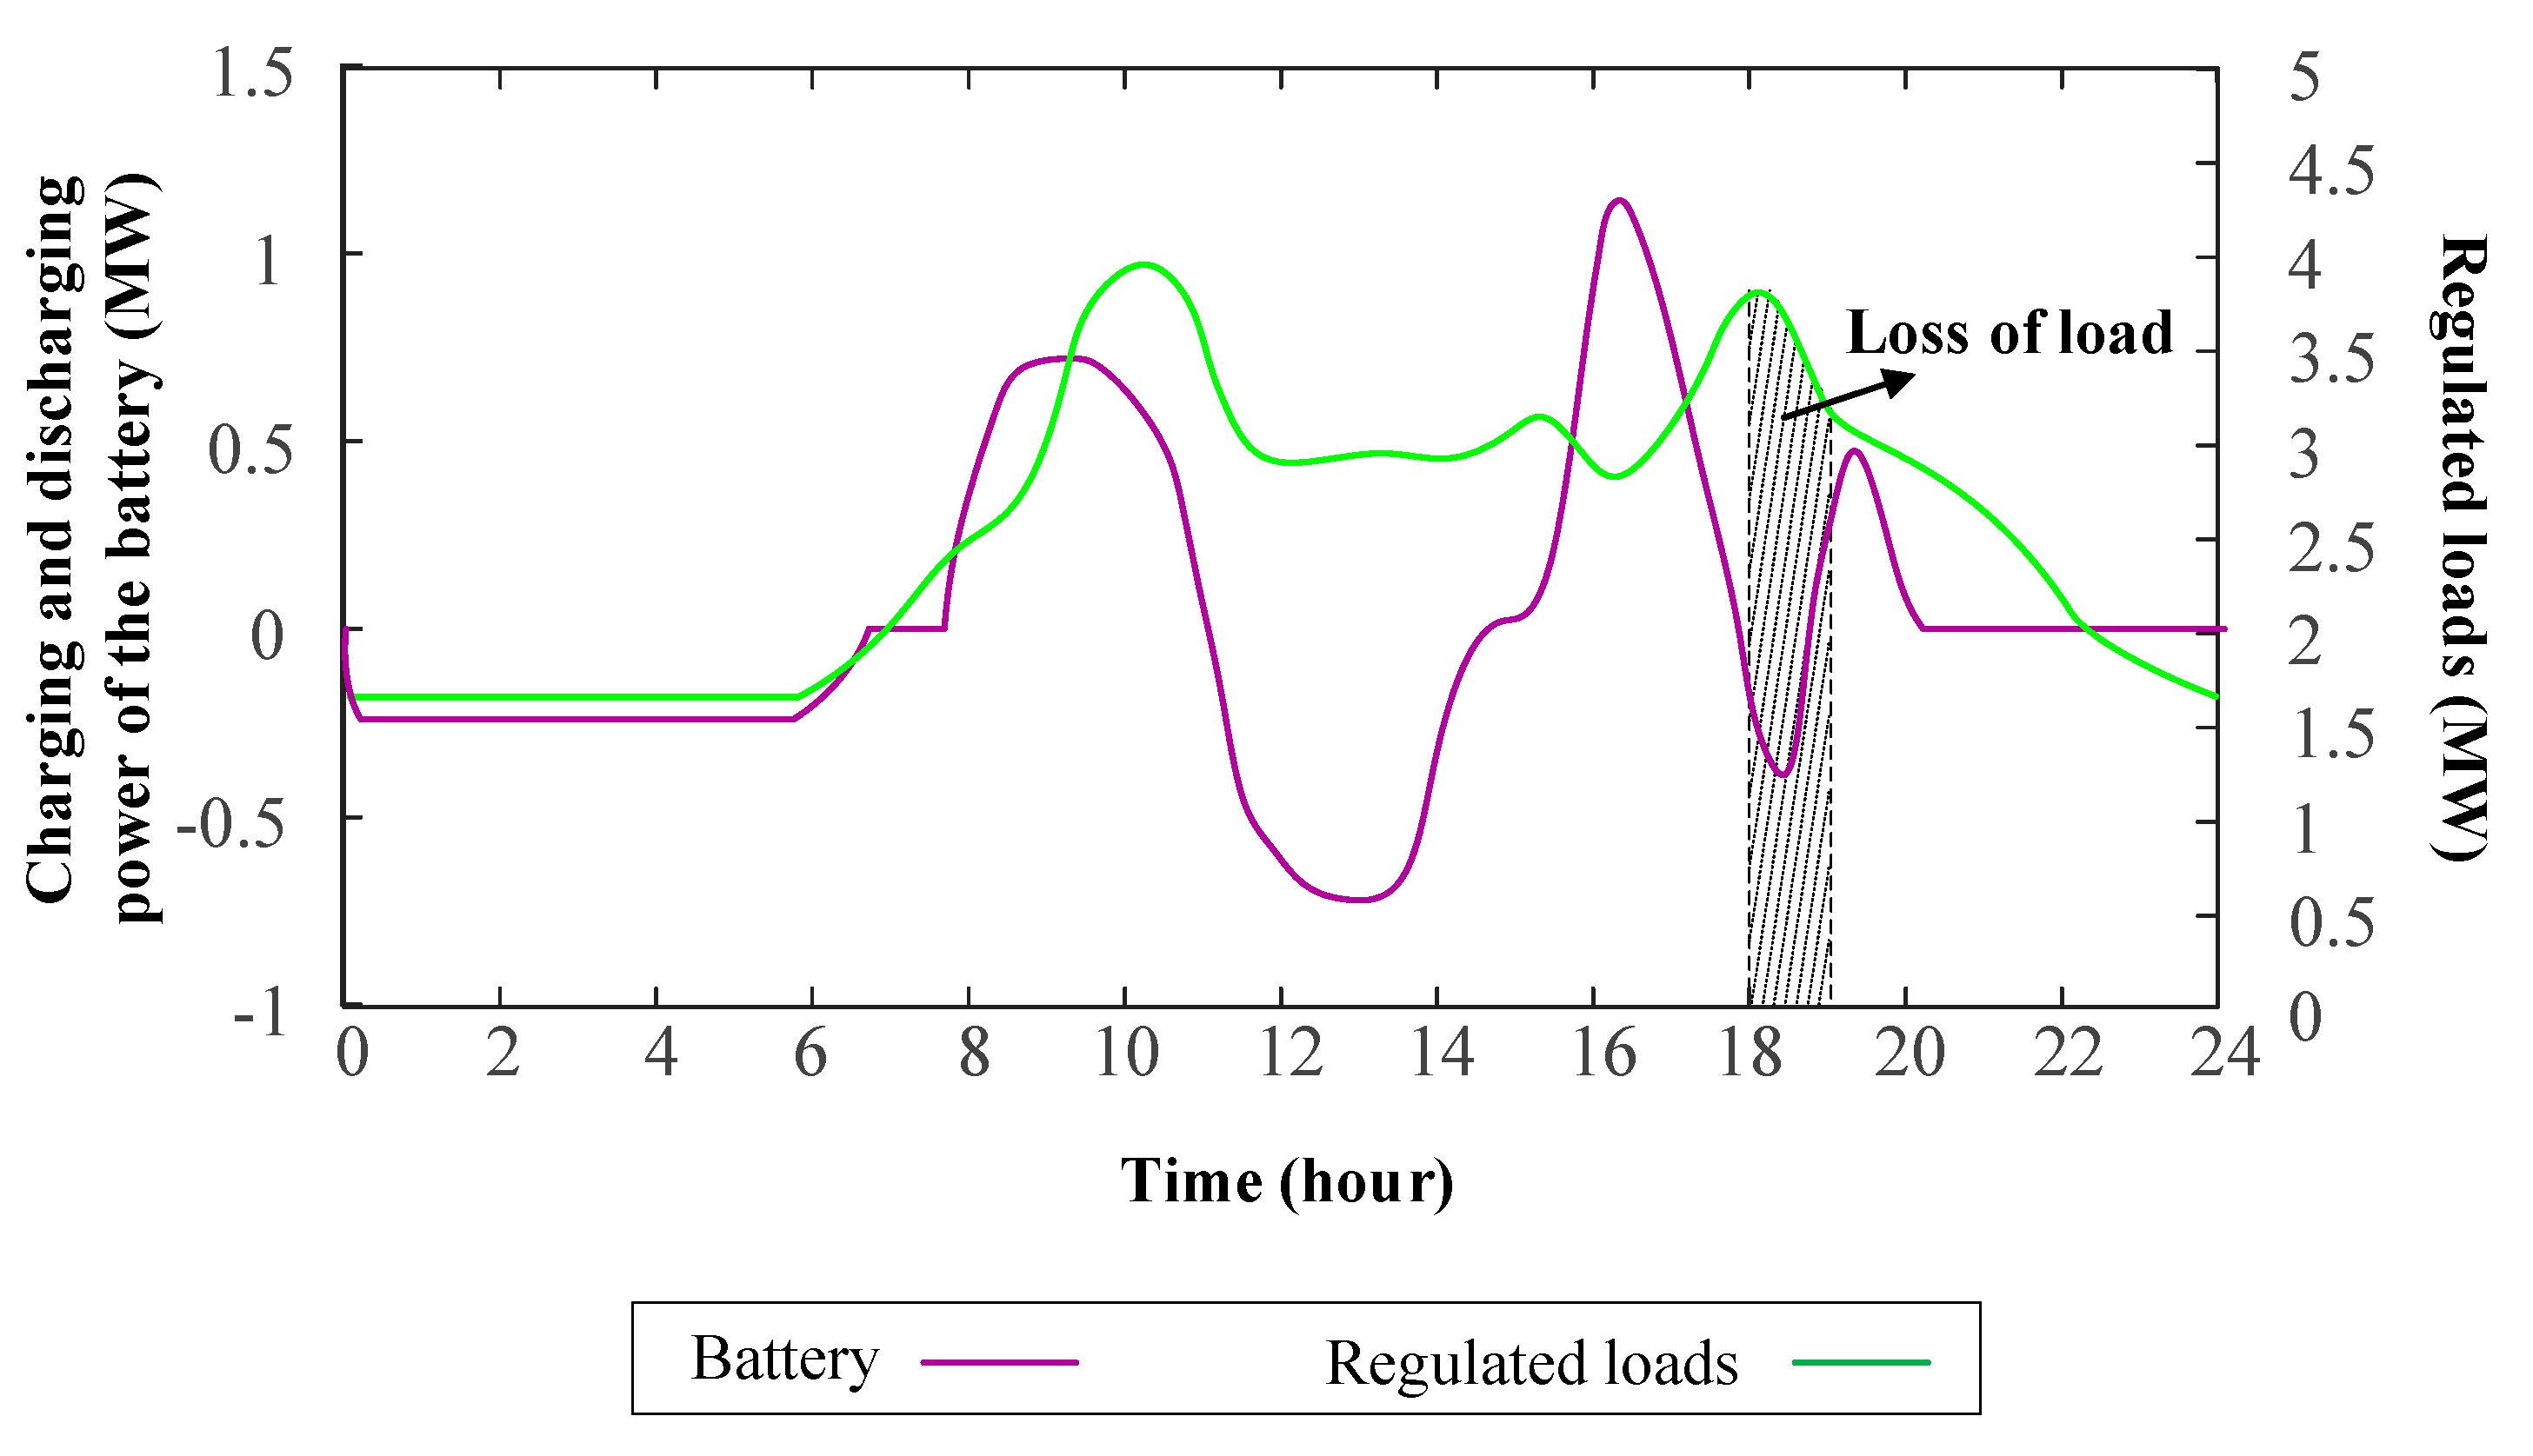
Table 1 is the optimization results of the battery and super-capacitor installation capacity, the average daily carbon emissions, and the average daily generation cost of the proposed system at point P. Figure 6 and Figure 7 show the optimal operation strategy of the distributed power system. More specifically, Figure 6 illustrates the output curves of all of the energy generators, and Figure 7 reveals the output of the energy storage system and the equivalent demands of the proposed community after installing the battery.
As shown in Table 1, given that the terminal voltage of the hybrid energy storage system is 220 V, the optimal capacity of the battery and super-capacitor are 10.92 kAh and 495.87 F, respectively. In this situation, the minimum daily energy cost and the carbon emissions of the proposed community can be successfully limited to under 5800 U.S. dollars and 1.7 ton, respectively. Compared with point Q (shown in Figure 5b), the average daily generation cost of the system increases by about 10%, but meanwhile, the carbon emissions of the system reduce by 42%.
Figure 6 reveals that with the increase of the battery capacity, the installation capacity of the distributed PV and wind turbine systems increase as well. At point P, the installation capacity of the PV and the wind turbine systems have reached their saturation values, which are 2 MW and 1 MW, respectively. In addition, the installed battery system can cooperate with diesel generators to shave system peak demands and fill system valleys, which can reduce diesel generator installation capacity and make full use of the capacity. Moreover, the installed super-capacitor system has a good ability to suppress the fluctuation of renewable energy generation, and thus effectively reduces the frequency and the amplitude of the renewable energy output fluctuation (as shown by Z1 and Z2 in Figure 6).
Comparing Figure 7 with Figure 3 shows that the peak-valley difference of the network reduces from 3 MW (at point Q) to 2.3 MW (at point P), which is a 23.3% reduction. This proves that system demands can be smoothed by increasing the battery capacity. Meanwhile, Figure 7 also shows that the off-grid mode and the insufficient capacity of energy generators can lead to system loss-of-load, but the newly designed hybrid energy storage system can control the LOLP rate within 5%, which can meet the requirements of the community.
5.3. The Influence of Renewable Energy Volatility on the Proposed Energy Storage System
In order to demonstrate the influence of renewable energy volatility on the proposed energy storage system, the red and blue solid lines shown in Figure 8 are used to represent the system average daily generation cost under different renewable energy volatility rates for the best case (i.e., the wind speed and light intensity tend to increase at most of time during the day) and the worst case (i.e., the wind speed and light intensity tend to decrease at most of the time during the day), respectively. Similarly, the red and blue dashed lines are used to represent system LOLP under different renewable energy volatility rates for the best case and the worst case, respectively.
As shown by the red lines, for the best case, with the increase of the renewable generation volatility coefficients, the outputs of the renewable energy and the average daily generation cost will gradually increase as well. However, due to the capability limitation of the renewable generation system, most of the time, the outputs of the renewable generation system can reach saturation value, after the fluctuation rate reaches 30%. Meanwhile, the average daily generation cost is close to saturation, and its growth rate will reduce. In addition, as the renewable generation increases, the system can improve its ability to cope with the system’s peak load, which eventually reduces the system’s LOLP.
Similarly, as shown by the blue lines, for the worst case, with the increase of the renewable generation volatility coefficients, the outputs of renewable energy will reduce, and more electrical power will be provided by diesel generators. Since the LCOE of the diesel generators is much lower than that of the renewable energy generators, the average daily generation cost of the system will reduce significantly. It is worth noting that the average daily generation cost reduces faster after the volatility reaches 40%. This is because when the wind speed and solar irradiance are less than their threshold values, the outputs of renewable energy will reduce to zero immediately, rather than realizing a smaller value. In addition, due to the rapid reduction of renewable generation, the system’s peak demands cannot be supplied by diesel generators, which results in a significant increase of system LOLP.
Therefore, the designed capacity of the hybrid energy storage system can properly cope with climatic change. In other words, if the renewable energy volatility rate can be limited to within 10%, the stability and economy of the distributed network will not be significantly affected. However, when the renewable energy volatility rate increases to more than 20%, the optimal capacity of the energy storage system presented in this paper cannot guarantee the reliability of the off-grid system.
6. Conclusions
In order to suppress the fluctuation of the distributed renewable generation system and reduce the influence of its uncertainty on distributed power systems, this paper comprehensively considers system economy, stability, carbon emissions, and renewable energy fluctuation, and then calculates the theoretical feasible installation capacity of the hybrid distributed energy storage system. Meanwhile, based on the genetic algorithm and the manufacturing prices of the super-capacitor and battery, this paper selects the best capacity for the hybrid energy storage system. After that, this paper shows the optimal operation strategy for the distributed generation system, the energy storage system, and the loads under the condition of the theoretical best energy storage capacity. Finally, this paper analyzes the influence of renewable energy volatility (i.e., renewable energy volatility coefficient α) on system economic and stable operation under the proposed hybrid energy storage capacity.
The simulation results show that for a region with a relatively stable climate, with the increase of the hybrid energy storage capacity, the installation capacity of the renewable energy system also increases, which will reduce the carbon emissions and increase the average daily generation cost. However, due to the space limitation of the community, the average daily generation cost tends to be saturated when the installation capacity of the renewable energy is saturated. For the proposed off-grid power system, the average daily generation cost can increase by 13.5% if the installed storage capacity varies from zero to its saturation value. Moreover, compared with not installing an energy storage system, the average daily generation cost can increase by 10% for a properly sized energy storage system. However, after installing an appropriate energy storage system, system carbon emissions reduce by 42%, and the peak valley gap reduces by 23.3%. In addition, the renewable energy fluctuation rate and system loss of load probability are successfully limited in an allowable range. Finally, if the renewable energy volatility rate can be limited to within 10%, the theoretical best energy storage capacity will not be seriously affected. On the contrary, if the renewable energy volatility rate exceeds 20%, the optimal capacity of the energy storage system presented in this paper cannot guarantee the reliability of the off-grid system.
Author Contributions
H.L. developed the algorithm; designed the simulation cases and wrote this article; Y.L. conducted the simulations and analyzed the data; M.D. discussed the results and revised this paper with D.L.; X.L. proofread the paper; H.Z. revised the paper.
Funding
This research was funded by “Research and verification on key technologies of intelligent power consumption new business service under the environment of open market”, with the grant number of “5442YD180002”.
Conflicts of Interest
The authors declare no conflict of interest.
References
- Daliento, S.; Chouder, A.; Guerriero, P.; Pavan, A.M.; Mellit, A.; Moeini, R.; Tricoli, P. Monitoring, diagnosis, and power forecasting for photovoltaic fields: A review. Int. J. Photoenergy 2017, 2017, 1–13. [Google Scholar] [CrossRef]
- Hansen, A.D.; Altin, M.; Iov, F. Provision of enhanced ancillary services from wind power plants–examples and challenges. Renew. Energy 2016, 97, 8–18. [Google Scholar] [CrossRef] [Green Version]
- Abedini, M.; Nasiri, A. Output power smoothing for wind turbine permanent magnet synchronous generators using rotor inertia. Electr. Mach. Power Syst. 2008, 37, 1–19. [Google Scholar] [CrossRef]
- Abeywardana, D.B.W.; Hredzak, B.; Agelidis, V.G. A fixed-frequency sliding mode controller for a boost-inverter-based battery-supercapacitor hybrid energy storage system. IEEE Trans. Power Electron. 2017, 32, 668–680. [Google Scholar] [CrossRef]
- Ciccarelli, F.; Iannuzzi, D.; Kondo, K.; Fratelli, L. Line-voltage control based on wayside energy storage systems for tramway networks. IEEE Trans. Power Electron. 2016, 31, 884–899. [Google Scholar] [CrossRef]
- Hall, P.J. Energy storage: The route to liberation from the fossil fuel economy? Energy Policy 2008, 36, 4363–4367. [Google Scholar] [CrossRef] [Green Version]
- Xu, Y.; Singh, C. Adequacy and economy analysis of distribution systems integrated with electric energy storage and renewable energy resources. IEEE Trans. Power Syst. 2012, 27, 2332–2341. [Google Scholar] [CrossRef]
- Le, H.T.; Nguyen, T.Q. Sizing energy storage systems for wind power firming: An analytical approach and a cost-benefit analysis. In Proceedings of the IEEE Power and Energy Society General Meeting–Conversion and Delivery of Electrical Energy in the 21st Century, Pittsburgh, PA, USA, 20–24 July 2008; pp. 1–8. [Google Scholar]
- Kaldellis, J.K.; Zafirakis, D.; Kondili, E. Optimum sizing of photovoltaic-energy storage systems for autonomous small islands. Int. J. Electr. Power Energy Syst. 2010, 32, 24–36. [Google Scholar] [CrossRef]
- Chen, S.X.; Gooi, H.B.; Wang, M.Q. Sizing of energy storage for microgrids. IEEE Trans. Smart Grid 2012, 3, 142–151. [Google Scholar] [CrossRef]
- Lee, T.Y.; Chen, N. Determination of optimal contract capacities and optimal sizes of battery energy storage systems for time-of-use rates industrial customers. IEEE Trans. Energy Convers. 1995, 10, 562–568. [Google Scholar]
- Chen, S.X.; Gooi, H.B. Scheduling of energy storage in a grid-connected PV/battery system via SIMPLORER. In Proceedings of the TENCON 2009—2009 IEEE Region 10 Conference, Singapore, 23–26 November 2009; pp. 1–5. [Google Scholar]
- Barelli, L.; Bidini, G.; Bonucci, F.; Castellini, L.; Castellini, S.; Ottaviano, A.; Pelosi, D.; Zuccari, A. Dynamic analysis of a hybrid energy storage system (H-ESS) coupled to a photovoltaic (PV) plant. Energies 2018, 11, 396. [Google Scholar] [CrossRef]
- Rueda-Medina, A.C.; Franco, J.F.; Rider, M.J.; Padilha-Feltrin, A.; Romero, R. A mixed-integer linear programming approach for optimal type, size and allocation of distributed generation in radial distribution systems. Electr. Power Syst. Res. 2013, 97, 133–143. [Google Scholar] [CrossRef]
- Nguyen, T.A.; Crow, M.L.; Elmore, A.C. Optimal sizing of a vanadium redox battery system for microgrid Ssystems. IEEE Trans. Sustain. Energy 2015, 6, 729–737. [Google Scholar] [CrossRef]
- Schneider, M.; Biel, K.; Pfaller, S.; Schaede, H.; Rinderknecht, S.; Glock, C.H. Optimal sizing of electrical energy storage systems using inventory models. Energy Procedia 2015, 73, 48–58. [Google Scholar] [CrossRef]
- Mohammadi, S.; Mohammadi, A. Stochastic scenario-based model and investigating size of battery energy storage and thermal energy storage for micro-grid. Int. J. Electr. Power Energy Syst. 2014, 61, 531–546. [Google Scholar] [CrossRef]
- Liu, W.; Guo, D.; Xu, Y.; Cheng, R.; Wang, Z.; Li, Y. Reliability assessment of power systems with photovoltaic power stations based on intelligent state space reduction and pseudo-sequential Monte Carlo simulation. Energies 2018, 11, 1431. [Google Scholar] [CrossRef]
- Bakkiyaraj, R.A.; Kumarappan, N. Optimal reliability planning for a composite electric power system based on Monte Carlo simulation using particle swarm optimization. Int. J. Electr. Power Energy Syst. 2013, 47, 109–116. [Google Scholar] [CrossRef]
- Arshad, A.; Püvi, V.; Lehtonen, M. Monte Carlo-based comprehensive assessment of PV hosting capacity and energy storage impact in realistic finnish low-voltage networks. Energies 2018, 11, 1467. [Google Scholar] [CrossRef]
- Jiang, Z.; Han, X.; Li, Z.; Wang, M.; Liu, G.; Wang, M.; Li, W.; Ollis, T.B. Capacity optimization of a centralized charging station in joint operation with a wind farm. Energies 2018, 11, 1164. [Google Scholar] [CrossRef]
- Seyedmahmoudian, M.; Jamei, E.; Thirunavukkarasu, G.S.; Soon, T.K.; Mortimer, M.; Horan, B.; Stojcevski, A.; Mekhilef, S. Short-term forecasting of the output power of a building-integrated photovoltaic system using a metaheuristic approach. Energies 2018, 11, 1260. [Google Scholar] [CrossRef]
- Sadamato, T.; Chakraborty, A.; Ishizaki, T.; Imura, J.I. Retrofit control of wind-integrated power systems. IEEE Trans. Power Syst. 2018, 33, 2804–2815. [Google Scholar] [CrossRef]
- Chakraborty, T.; Watson, D.; Rodgers, M. Automatic generation control using an energy storage system in a wind park. IEEE Trans. Power Syst. 2018, 33, 198–205. [Google Scholar] [CrossRef]
- Dui, X.; Zhu, G.; Yao, L. Two-stage optimization of battery energy storage capacity to decrease wind power curtailment in grid-connected wind farms. IEEE Trans. Power Syst. 2018, 33, 3296–3305. [Google Scholar] [CrossRef]
- Hashemi, S.; Østergaard, J.; Yang, G. A scenario-based approach for energy storage capacity determination in LV grids with high PV penetration. IEEE Trans. Smart Grid 2014, 5, 1514–1522. [Google Scholar] [CrossRef]
- Zhang, H.; Zhang, Q.; Gong, T.; Sun, H.; Su, X. Peak load regulation and cost optimization for microgrids by installing a heat storage tank and a portable energy system. Appl. Sci. 2018, 8, 567. [Google Scholar] [CrossRef]
- Riffonneau, Y.; Bacha, S.; Barruel, F.; Ploix, S. Optimal power flow management for grid connected PV systems with batteries. IEEE Trans. Sustain. Energy 2011, 2, 309–320. [Google Scholar] [CrossRef]
- Hong, Y.; Lai, Y.; Chang, Y.; Lee, Y.; Liu, P. Optimizing capacities of distributed generation and energy storage in a small autonomous power system considering uncertainty in renewables. Energies 2015, 8, 2473–2492. [Google Scholar] [CrossRef]
- Gee, A.M.; Robinson, F.V.P.; Dunn, R.W. Analysis of battery lifetime extension in a small-scale wind-energy system using supercapacitors. IEEE Trans. Energy Convers. 2013, 28, 24–33. [Google Scholar] [CrossRef]
- Linzen, D.; Buller, S.; Karden, E.; de Doncker, R.W. Analysis and evaluation of charge-balancing circuits on performance, reliability, and lifetime of supercapacitor systems. IEEE Trans. Ind. Appl. 2005, 41, 1135–1141. [Google Scholar] [CrossRef]
- Asghar, F.; Talha, M.; Kim, S.H. Robust frequency and voltage stability control strategy for standalone AC/DC hybrid microgrid. Energies 2017, 10, 760. [Google Scholar] [CrossRef]
- Yu, D.; Liu, H.; Yan, G.; Jiang, J.; Le Blond, S. Optimization of hybrid energy storage systems at the building level with combined heat and power generation. Energies 2017, 10, 606. [Google Scholar] [CrossRef]
- Marchi, B.; Pasetti, M.; Zanoni, S. Life cycle cost analysis for BESS optimal sizing. Energy Procedia 2017, 113, 127–134. [Google Scholar] [CrossRef]
- Yu, D.; Meng, Y.; Yan, G.; Mu, G.; Li, D.; Blond, S.L. Sizing combined heat and power units and domestic building energy cost optimisation. Energies 2017, 10, 771. [Google Scholar] [CrossRef]
- State Electricity Regulatory Commission. 2010 Annual Implementation Electricity Price and Electricity Bill Settlement Report. Available online: https://wenku.baidu.com/view/f9625b2e2af90242a895e575.html (accessed on 13 June 2018).
- SUNRUN. Product Handbook. Available online: https://www.alibaba.com/product-detail/75kw-china-yuchai-japanese-used-desiel_60603876154.html?spm=a2700.7724857.main07.12.1dc37c5fp6riH7&s=p (accessed on 13 June 2018).
Figure 1.
The structure diagram of a distributed power system.

Figure 2.
The flow diagram of the proposed genetic algorithm (GA).

Figure 3.
The average yearly load curve of the proposed community.

Figure 4.
The average yearly wind speed and solar irradiance.

Figure 5.
The relationship among the battery installation capacity, the super-capacitor installation capacity, and the average daily generation cost of the distributed power system: (a) an overview; (b) in a detailed version.
Figure 5.
The relationship among the battery installation capacity, the super-capacitor installation capacity, and the average daily generation cost of the distributed power system: (a) an overview; (b) in a detailed version.

Figure 6.
Real-time output power different power generators.

Figure 7.
Real-time battery output power (positive represents discharging) and regulated loads (“regulated loads” is defined as “original loads minus hybrid energy system output”).
Figure 7.
Real-time battery output power (positive represents discharging) and regulated loads (“regulated loads” is defined as “original loads minus hybrid energy system output”).

Figure 8.
The best-case curves and the worst-cases curve of the system’s average daily generation cost and loss-of-load probability (LOLP) under different renewable energy volatility rates.
Figure 8.
The best-case curves and the worst-cases curve of the system’s average daily generation cost and loss-of-load probability (LOLP) under different renewable energy volatility rates.


Table 1.
Summary of optimal system operation parameters of point P.
| Battery Capacity (kAh) | Super-Capacitor Capacity (F) | Average Daily Generation Cost ($) | Carbon Emissions (t) |
|---|---|---|---|
| 10.92 | 495.87 | 5708.4 | 1.67 |
© 2018 by the authors. Licensee MDPI, Basel, Switzerland. This article is an open access article distributed under the terms and conditions of the Creative Commons Attribution (CC BY) license (http://creativecommons.org/licenses/by/4.0/).
Share and Cite
MDPI and ACS Style
Liu, H.; Li, D.; Liu, Y.; Dong, M.; Liu, X.; Zhang, H. Sizing Hybrid Energy Storage Systems for Distributed Power Systems under Multi-Time Scales. Appl. Sci. 2018, 8, 1453. https://doi.org/10.3390/app8091453
AMA Style
Liu H, Li D, Liu Y, Dong M, Liu X, Zhang H. Sizing Hybrid Energy Storage Systems for Distributed Power Systems under Multi-Time Scales. Applied Sciences. 2018; 8(9):1453. https://doi.org/10.3390/app8091453
Chicago/Turabian StyleLiu, Huanan, Dezhi Li, Yuting Liu, Mingyu Dong, Xiangnan Liu, and Hong Zhang. 2018. "Sizing Hybrid Energy Storage Systems for Distributed Power Systems under Multi-Time Scales" Applied Sciences 8, no. 9: 1453. https://doi.org/10.3390/app8091453
Note that from the first issue of 2016, this journal uses article numbers instead of page numbers. See further details here.