
Monitoring System Enhancing the Potential of Urban Beekeeping

1
Faculty of Environmental Engineering, Wroclaw University of Science and Technology, Wybrzeże Wyspiańskiego 27, 50-370 Wrocław, Poland
2
InSysPom, Bolesława Krzywoustego 6-12, 51-165 Wrocław, Poland
*
Author to whom correspondence should be addressed.
Appl. Sci. 2023, 13(1), 597; https://doi.org/10.3390/app13010597
Submission received: 24 November 2022
/
Revised: 27 December 2022
/
Accepted: 29 December 2022
/
Published: 1 January 2023
(This article belongs to the Section Green Sustainable Science and Technology)
Abstract
:Featured Application
The monitoring system presented in this work may be applied as a means of honey bee observation and a source of information about the beehive environment, in particular in the framework of urban beekeeping.
Abstract
Urban beekeeping has become increasingly popular, despite having different objectives than the large-scale professional/commercial one. Not so much focused on financial profit, urban apiculture provides valuable educational opportunities, promotes the greening of cities, and creates environmental awareness. Many companies and institutions make it a valuable component of their public relations strategy. Urban beekeeping benefits may be enhanced by applying specialized technical infrastructure. In particular, the use of modern technologies attracts the younger generation to be involved in beekeeping. This paper aims to present the abilities of the automatic monitoring system, which meets the goals of urban beekeeping. The set of equipment consists of a sensor module, video cameras, a unit for data acquisition, and a system for data transmission, presentation, and visualization. The monitoring system allows for real-time observation of the beehive interior and entrance. It continuously measures selected physical and chemical parameters of the beehive atmosphere and provides a record of the beehive’s weight. Additionally, ambient air is monitored for reference. The video streaming and measurement results are available to the public online through the dedicated webpage. System performance was evaluated regarding the interactions with honey bees, sensor measurement characteristics, and data collection efficiency. Three months of operation in the urban apiary confirmed that the system is fully functional and fulfills its objectives. System development continues.
1. Introduction
In recent years, there has been a growing interest in urban beekeeping throughout Europe and North America. Urban beekeeping is the practice of keeping bee colonies in urban areas (within an urban environment) [1,2]. Many reasons cause the urban setting to be an attractive place for honeybees. In cities, for example, bees are shielded from many pesticides and predators. Large agricultural fields in rural settings are very often a danger zone for these insects as chemical treatments to control crop pests negatively affect bees [3,4]. Additionally, the period of honey bee activity in urbanized areas is usually longer due to the warmth caused by the heat island effect and better protection from the wind in this environment. Many metropolitan beekeepers believe that bees from urban apiaries are more productive than their country cousins and they also provide healthier products [5,6,7].
Urban beekeeping is a specific activity that involves both individual beekeepers and various companies or institutions [7]. Of course, this branch of apiculture will not replace traditional or large-scale beekeeping, but it may play important role in the cities, where it provides many economic, environmental, and social benefits [8]. Beekeeping offers, for example, a range of high-quality products, including honey, pollen, royal jelly, wax, propolis, and apitoxin [5]. The significant opportunity is its contribution to biodiversity and habitat conservation, as well as helping to improve the pollination of wild and cultivated plants in an urban environment [9,10,11]. Urban beekeeping is also a source of serious non-material benefits that are reflected in terms of well-being, recreation, enjoyment, satisfaction, and personal reward to those who practice it or get in touch with it [12]. This activity is often referred to as a rewarding and renowned hobby. Urban apiculture provides valuable educational opportunities [13,14], encourages connection with nature, promotes the greening of an urban environment, and creates environmental awareness [15]. By installing honey bee hives, people take action to protect bees and all pollinators and begin to rethink their responsibility towards the environment [16]. In this way, the feeling of tightness and connection to nature in cities is created. Urban beekeeping is also interesting from the perspective of a public relations strategy; it may be used for the creation of a positive company image [17,18]. Owning honey in jars, personalized with the organization’s logo and colors, certainly makes a good impression.
Non-material benefits of urban beekeeping may be enhanced and become more attractive by using specialized technical infrastructure [19,20,21]. For example, digital cameras are a very good tool for the observation of honey bees’ behavior [22,23,24]. Their remote monitoring is beneficial for many reasons. One of them is associated with the predominant choices of location for beehives in cities. Urban beekeeping is most often realized without access to a large yard, lawn, or flower bed. In many municipalities, the location of apiaries is regulated by governmental agencies or local authorities, to assure protection for both urban residents and honey bees. For example, in Polish cities, apiaries localization rules are defined by municipal councils. In Wrocław, a 10 m distance is required between the beehive and the nearest people’s wandering route [25]. In practice, this condition is very difficult to fulfil in the city, at the ground level. For this reason, the rooftop location is characteristic of urban apiaries. From a perspective of an average human, access to urban beehives is usually difficult, inconvenient, or purposefully restricted. In most cases, it is limited to beekeepers. Video cameras allow for remote observation of honey bees simultaneously by many people, in addition to those who are not specially related to beekeeping, not allowed to enter the apiary, or who are afraid of bees. Their “virtual” visits are non-intrusive and safe. The observation of honey bees’ behavior is fascinating. Their remote observation may become a hobby. It may also play a significant role in education, promotion, and the creation of environmental awareness. In urban beekeeping, there is a high potential for taking advantage of the Internet and modern telecommunication technology. It is especially important for the dissemination of information, photos, and videos, as well as online video streaming and online access to the measurement data. The last possibility is especially attractive in combination with sensor technology, which gives the possibility to establish continuous, online monitoring of many physical and chemical parameters in virtually any environment. Measurements performed in real-time are a source of interesting information about conditions occurring inside beehives, which may be advantageous for the management of urban apiaries [26,27]. Online monitoring is especially praised when regular inspections of beehives by beekeepers are difficult or even impossible for various reasons. It should be noted that the care for the honey bee colony is exercised by individual beekeepers, the owners of the apiaries, or specialized companies that offer maintenance and hive management. As an example, one could mention Alvéole, a company based in Montreal, that manages thousands of beehives on the rooftops of more than 600 office buildings in North America, at corporations that host bees and offer free honey as an employee perk [28].
The application potential of different technical solutions and information technologies in the field of urban apiculture is not strictly recognized. It should be verified in practice, in real-life situations. This paper aims to present the abilities of the set of equipment consisting of a sensor module, video cameras, a unit for data acquisition, and a system for data transmission, presentation, and visualization.
2. Methods
2.1. Monitoring System for Urban Beekeeping—Assumptions
Our concept of the monitoring system for urban beekeeping was based on several assumptions regarding its metrological, technical, functional, and economic aspects.
2.1.1. Metrological Assumptions
It was assumed that the monitoring shall focus on the honey bee colony, but the colony is to be observed in the context of the environment of the beehive and the beehive’s surroundings. To provide a wide range of information, monitoring must be multimodal and multiparametric. The monitoring system shall allow: (1) to observe the beehives’ interiors and entrances, (2) to measure multiple physical and chemical parameters of air inside the beehives and outside them, in the apiary, (3) to record the beehives’ weight, and (4) to observe meteorological conditions in the apiary.
Measurements of Physical and Chemical Parameters of Air Inside the Beehives and Outside Them
The beehive air is a unique and complex mixture of many different volatile compounds. They are emitted by honey bees themselves (e.g., pheromones, other chemicals released to repel pests and predators, metabolites, etc.). However, multiple volatile substances come from honey, nectar, larvae, beeswax, pollen, and propolis. They are also released by materials out of which hives are constructed (wood, paint, plastic, etc.). Additionally, volatile compounds emitted by external sources (road traffic, building installations, etc.) find their way into the beehive, because the beehive is not an isolated system. Due to ventilation, outside air is brought inside. The composition of beehive air and its physical parameters are sources of information about honey bee colony activity, health, and overall well-being [29,30]. However, they are also expected to indicate the magnitude of the impact of the ambient environment on the honey bee colony. To study the influence of the urban environment on the honey bee, it is proposed to monitor the air inside and outside the hives in parallel. An informative set of physical and chemical parameters is required to achieve this goal. The following ones were chosen: temperature, relative humidity, CO2 concentration, the content of volatile organic compounds, and the concentration of particulate matter. It was proposed to apply the same methods and techniques for measuring these parameters inside as well as outside the hives. The feasibility of this solution had to be verified in real conditions, similar to the informative potential of the parameters selected for measurement.
The factors that influence honey bees act in various time scales. For this reason, we proposed to apply high temporal resolution of data recording by the monitoring system. Based on our previous measurement experience, the time resolution of 1 s was initially set, with a possibility of adjustment if needed. Due to the strong dependence of honey bee performance on meteorological conditions, a simple weather station could be installed in the apiary.
Video Monitoring
A bee colony is a complex society. By all means, the opportunity to observe its life in real time is appealing. By applying the appropriate technical measures for watching the beehive interior and its entrance, one could be able to recognize different kinds of honey bee activities, their intensity, and temporal variation. Also, the honey bee combs management procedures become revealed (eggs laying, brood breeding, nectar, and pollen storage). The goal may be attained, for example, using video monitoring. This implementation promises several other advantages. (1) Video monitoring may act as a supplement to beehive inspections. In urban conditions, the beekeeper oftentimes does not live next to the apiary, which may monitored by a volunteer, or someone hired, who visits the place only according to the schedule. In such circumstances, cases of honey bee colony losses have been noted due to delayed interventions. Utilizing video monitoring combined with real-time streaming offers the possibility of a remote check of the situation in the beehive. It will not replace the detailed inspection, but may be critical in identifying a warning signal. (2) Live video transmission may be used for multiple other purposes including company/institution image building, educational projects, or just for leisure and pleasure. These motives stimulate founding urban apiaries in many cases. (3) From a research and development perspective, inside-beehive observation is an attractive input for beekeeping-oriented applications settled in artificial intelligence (AI) [31]. Novel methods of pattern recognition in video data streams are constantly developed. Another challenge is the integration of video transmission and measurement data streams for the automatic labelling of the monitoring data. Currently, data labelling is mostly done manually, which makes it a prohibitive factor in AI systems developments, in general [31,32,33].
Measurement of Beehive Weight
Hive weight is usually considered indicative of the activity of the honey bee colony. Truly, in the foraging season, the beehive weight is influenced by the collection of nectar, pollen, and the breeding activity of these insects [21]. Events like robbery or swarming also alter this parameter. In the winter season, the consumption of the honey stock by the colony would be expected to cause the beehive weight reduction. Weight is a comprehensive parameter [34]. However, beehive weight measurement may be confounded by multiple factors, which are not related to bee colony characteristics. For example, beehive maintenance operations like honey extraction, and adding/removing frames or modules change beehive weight. It is also altered by factors related to weather conditions. Beehives absorb water vapor from the moist air, during fog, rainfall, or wet snowfall and they desorb the moisture in the dry air. They also dry out in the sun. The wind can bias the beehive weight measurement. In urban conditions, vibrations are yet another important interference to be considered. Their sources are building installations, urban infrastructure, road traffic, and the wind. Vibrations and weather conditions particularly affect the weight measurement of hives mounted on the roofs. As this location is favoured in urban conditions, the confounding effect of these factors requires understanding.
It is proposed to measure beehive weight with a high temporal resolution of 1 s. This corresponds to the temporal resolution applied for monitoring the physical and chemical parameters of air inside beehives and outside them.
2.1.2. Technical Assumptions
The relatively small dimensions and complexity of the beehive environment result in specific criteria that the devices intended for inside-beehive operation should meet. Regarding the measurement of air parameters inside the beehive, it was assumed that sensor technology is the best choice for realizing this task Recently, the application of sensors in apiculture is growing in popularity [27,28,29,35]. Small, autonomous sensors can provide versatile information in real time with no disturbance to honey bee colonies. Sensors are widely available, affordable, and durable. They offer good accuracy and sensitivity, present a relatively small consumption of energy, and in most cases, they are easy to integrate into multiparametric measurement systems. In addition, they are lightweight, and not bulky in size. However, it shall be noted that some constituents of beehive air can cause sensor memory effects and sensor drift. Regarding video monitoring, it was assumed that a small size digital camera operating in the visual range, fitted with the field of view illumination shall be tested as a first choice in this application.
It is certainly clear, that the devices located inside the beehive should be accepted by the insects as an integral part of the hive environment. In particular, the organization of the hive space, which is familiar to the honey bees, needs to be preserved. The potential disturbance associated with their presence and operation in the beehive should be minimized. The device should: (1) occupy little space and not disrupt the spatial organization inside the hive, (2) be noiseless (within achievable limits), (3) not affect the natural air circulation in the beehive, (4) not change the composition of the beehive air, (5) not release or absorb significant amounts of heat, and (6) not emit light that is stronger than daylight. It is requested that the position of the measuring devices in the hive can be easily changed so that different parts of the beehive can be examined. The devices should not make the inspection of the hive more difficult than usual.
The entrance of the hive may be observed with an outdoor camera, mounted laterally, facing the hive. The camera shall operate in the visible light range during the day and infrared at night. This will make it possible to dispense with external lighting of the apiary. The cameras are to provide magnification sufficient to distinguish individual honey bees, as their number and movement are of interest.
To assure continuous and reliable operation of the monitoring system, its elements that are mounted inside the beehive have to withstand the beehive’s gaseous atmosphere. In addition, they may require protection from the dissatisfaction of the honey bees resulting in the purposeful deposition of propolis or wax. The devices that operate outdoors are naturally exposed to rain, sunlight, wind, and other adversities that are detrimental to optics and most electronic systems. For these reasons, the external modules of the system shall be fitted with adequate protection from meteorological conditions. Adequate precautions will prevent measurement errors and breaks in system operation.
All data collected by the monitoring system should be available remotely, in real-time, including continuous video streaming. Fast data transmission without delays and interruption is critical for this application. Given the request for continuous and uninterrupted operation of the monitoring system, the reliability of the power supply is very important. For this reason, batteries, solar panels, or combined solutions were not considered the major, or exclusive means of power supply. It is assumed that the power outlet is made directly available in the apiary and that the whole urban beehive monitoring system is directly plugged in. In the densely built urban environment, in particular city centres, the best place for the apiary is the roof. This location features a close neighbourhood of the building’s technical infrastructure. Hence, usually, it is not difficult to establish additional access points to the power supply and Ethernet.
We assumed that the transmission network and protocols shall guarantee real-time online access to video streaming of high quality.
2.1.3. Functional Assumptions
In urban apiaries, especially those on roofs, the space is usually limited, and the ambient conditions are harsh (wind, sun exposure, etc.). Hence, the monitoring system must be compact (preferably modular), easy to mount/dismount, robust, and made of durable elements. The instruments should work with minimal operator attention/intervention because access to measurement equipment can be difficult. The system is expected to operate automatically and unattended. Only periodic checks would be done by the specialized service. However, the user is encouraged to call in case of problems with the system. Generally, urban beekeepers are not specialists in the field of measurement techniques. Therefore, the monitoring system should be relatively easy to implement and simple to use. One shall exclude the option that special training and experience are required to use the system.
2.1.4. Economic Assumptions
Founders of urban apiaries usually can afford expenditure at a level that is not affordable for traditional beekeepers. Therefore, the investment and operation costs are not the major limiting factors in the development of a monitoring system that serves urban beekeeping. While the main priority in commercial apiculture is economic gain, urban beekeeping is not so directly profit-oriented. It rather looks towards long-term objectives. A significant group of urban apiaries is owned by private companies. Via this activity, they wish to improve their public relations by demonstrating a pro-ecological attitude, responsibility for the environment, and innovative profile. Municipal institutions also willingly raise honey bees. In this way, they realize the statutory duties of making effort towards the sustainability of the urban environment, taking care of community education, and becoming more citizen friendly. Important motivations stand behind apiaries opening by educational institutions. The young generation learns about the importance of honey bees in the environment and gains habits to respect them from the perspective of long-term food security in the world. Finally, ordinary inhabitants in cities who have a high level of ecological awareness invest in urban apiaries. They would like to prevent honey bee extinction and increase the pollination potential in the urban environment. Due to the distinctive motivations of urban beekeeping, the design of the urban apiary monitoring system shall not be strictly beekeeping orientated. Contrarily, it must be fitted with functionalities for attaining demonstration, education, leisure, and potential research objectives. In such circumstances, the financial limitations are not critical. It implies that low-cost devices are not the only option for the monitoring system dedicated to urban beekeeping [36].
2.2. Monitoring System Overview
Figure 1 presents the schema of the developed monitoring system.
The main component of the monitoring system is the following measurement and observation equipment: multi-sensor devices, beehive weight scales, inside-beehive cameras, and outside-beehive cameras. Additionally, the following auxiliary equipment was utilized: Power-over-Ethernet (PoE) management switch, Wi-Fi access point, electric switchboard fitted with fuses, lightning arrester, AC-DC power converters, and cables (electric, Ethernet, and USB cables).
Multi-sensor devices are powered via AC-DC power converters, and they use Wi-Fi connection for data transmission. The same solution was applied in the case of beehive weight scales. Wi-Fi devices are connected to the access point working in bridge mode.
Cameras mounted outside as well as inside beehives use Ethernet cables for data transmission and power. They are directly connected to a PoE-managed switch.
The roof location of the monitoring system allows utilizing the line-of-sight microwave transmission line for connecting the switch with the server-side net infrastructure, in case it is located not far away, e.g., in a neighbouring building.
Data from all devices are transmitted online and presented on a dedicated website [35]. The measurement data from multi-sensor devices and beehive weight scales are transmitted as MQTT messages. They are also saved as *.csv text files to data partition in the internal memory cards of the devices as a backup, for further analysis. Live video streaming from all cameras is also displayed on the webpage. Additionally, the videos are recorded and stored over a selected period, for offline analysis.
2.2.1. Multi-Sensor Device
Multi-sensor device was designed for measuring the selected physical and chemical parameters of the beehive air. The sensors of the following quantities were mounted in the device: temperature and relative humidity—SHT25 (Sensirion AG, Stäfa, Switzerland), particulate matter—SPS30 (Sensirion AG, Stäfa, Switzerland), carbon dioxide—SCD30 (Sensirion AG, Stäfa, Switzerland), total volatile organic compounds (TVOC) with ionization potentials < 10.6 eV—PIDAH2 (Alphasense, Skyfall, United Kingdom), TVOC—SGP41 (Sensirion AG, Stäfa, Switzerland), NOx—SGP41. The measurement characteristics of the applied sensors are provided in Table 1.
The listed quantities were chosen to be measured for several reasons. Beehive air temperature and relative humidity are the essential parameters pointing to the thermoregulatory capacity of the honey bee colony. This capability is one of the indicators of the colony’s well-being. However, thermal conditions in the beehive are also influenced by other factors, such as the beehive construction materials, apiary location, and the ambient environment. In particular, urban heat islands may be a different challenge for bee colony thermoregulation activity, compared with rural conditions. Temperature and humidity sensors are very cheap, and the measurement of these quantities is relatively easy. It is also the most popular measurement in apiculture; therefore, considerable reference is available for comparison and discussion.
The concentration of carbon dioxide in beehive air is related to honey bees’ metabolism, health, and activity. It is also dependent on the colony development stage and size. This parameter is not so frequently measured in the beehives. CO2 sensors are a bit more expensive compared with temperature and relative humidity ones. Due to the small amount of reference data the CO2 concentration variation in the beehive is not well understood yet. In urban air, the concentration of CO2 is generally higher than in rural areas. Still, based on our observation, the urban background level remains well below the CO2 concentrations we observed inside beehives. Honey bee colony-related factors are predominant in shaping the temporal variation of this compound in beehive air.
Examples of continuous monitoring of volatile organic compounds in the beehive atmosphere are extremely scarce. These compounds are usually measured in samples collected from the honey bees or the components of their environment in the framework of research studies aimed at detecting and quantifying some target compounds. Advanced analytical techniques and lab-based instruments are used for this purpose. Our goal is different. We are interested in continuously monitoring the total amount of volatile organic compounds in beehive air. There are premises to expect that their concentration inside the beehive is related to multiple aspects of the honey bee colony life and performance, e.g., its health (diseases), activity level, currently exploited sources of nectar, etc. However, in urban conditions, there are numerous other sources of volatile compounds, e.g., vehicles, industry, urban infrastructure, city operation, and activities of citizens. The relative contribution of these sources versus honey bee colonies’ contribution to the beehive atmosphere has not been recognized so far. In our system, we test the performance of two kinds of sensors for VOCs measurement. They are based on different measurement principles namely, SGP41 is a semiconductor gas sensor and the PID AH2 is a photoionization sensor. The sensors differ regarding their sensitivity to the individual volatile compounds and the measurement ranges, see Table 1. We also expect a difference in terms of lifetime. Regarding price, the SGP41 sensor is very cheap, while the PID AH2 sensor is considerably more expensive.
The monitoring data on NOx comes as an added value associated with the use of the SGP41 sensor, which is primarily applied for TVOC measurement. Still, we are going to carefully look at this parameter. Its content in beehive air as compared with ambient air is of particular interest in the summertime when the probability of urban photochemical smog increases.
Similar to VOCs, the particulate matter concentration measurement in beehives is very uncommon. As a consequence, the value of this parameter for the characterization of bee colonies remains unexploited. We intend to collect the data which may be the basis for the respective analysis. Given the typically elevated PM levels in urban air, the shielding effect of the beehive against ambient conditions deserves examination.
The schema of the multi-sensor module applied for beehive air measurements is shown in Figure 2. It was designed as a single PCB expansion card compatible with a Raspberry Pi GPIO connector. The expansion card contains connectors for sensors and a power management module. Except for one analogue sensor (Photo Ionisation Detector), all sensors used in the device were integrated with a digital I2C interface. High-precision ADS1256 analogue-to-digital converter was applied for handling the voltage signal from the PID sensor. All sensors were attached to PCB inside one housing. Only the temperature and humidity sensor STH25 was placed outside to avoid the systematic error resulting from heat emission by the electronics inside the housing.
A miniature single-board computer (Raspberry Pi Zero W) with an operating system based on the Linux kernel was chosen as a processing unit for a multi-sensor module. It offers the easiness of remote supervision and software modification in comparison with solutions based on microcontrollers. The main drawbacks of this solution are the degradation of SD cards and power consumption. The first issue was handled by using a read-only memory operating system with a separate partition for data and logs, and by using industrial class SD cards. The second problem was overcome by using a grid power supply.
The measurement unit is powered by a 12 V DC cable with a DCDC converter on board, and Wi-Fi is used for data transmission. It can be expanded easily by connecting modules that use the UART interface, for example, additional sensors, GPS module, or GSM modem for data transmission.
A multi-sensor device was dedicated to monitoring the indoor environment of a beehive. One device per beehive was deployed. One additional device was operated outside, in the vicinity of beehives, to provide the reference for the inside-beehive measurements.
2.2.2. Inside-Beehive Camera
Typical low-cost endoscope HD cameras with USB interface were used as inside cameras. Each camera has a diameter of 8 mm, a manually regulated LED illuminator, and a semi-rigid USB cable. All inside cameras have been connected to one single-board computer, which is common for all beehives (Raspberry Pi 3B+ model was used). Raspberry Pi transmits the video as the MPEG stream in real time. The video is compressed with MPEG codec in the camera module, so there is no high demand for computational processing power on the computer side or data transition bandwidth, and several cameras can be connected to one single-board computer easily. The main drawback of this solution is the limited length of the USB cable (up to 5 m) and the necessity of an independent cable connection for each beehive. This solution can be applied to a limited number of beehives, provided they are located nearby the common Raspberry Pi module.
2.2.3. Outside-Beehive Camera
Video camera model BLOW77-781 was used as the outside-beehive camera in our monitoring system. This is a quite typical IP camera with the possibility to use Ethernet cables for both data transmission and power (PoE), which simplifies cable routing. The camera provides high-resolution image (max.2880 * 1620 at 30FPS), H.265/H.264 compression, IR highlights, and a wide zoom range (2.7–13.5 mm focus length), which was especially helpful for the monitoring of the beehive entrance.
2.2.4. Beehive Weight Scale
The beehive weight scale was developed from scratch because the commercially available scales do not allow monitoring the beehive weight with high temporal resolution. The schema and technical realization of the beehive weight scale are shown in Figure 3.
Two common industrial load cells (NA1, 35 kg per load cell) were installed on aluminium profiles and attached to the long sides of the rectangular beehive base. A developed PCB module of load cell amplifier, based on the hx711 module, uses the digital two-wire interface to communicate with RPi, and it is compatible with GPIO (like commercial RPi Huts). A miniature single-board computer RPi Zero W was used as a data processing unit to handle the amplifier for unification with the multi-sensor device placed inside the beehive. The electronic parts were secured by an IP68 enclosure. The unit is powered by a 12 V DC cable with a DCDC converter on board, and Wi-Fi is used for data transmission. The accuracy (non-linearity, hysteresis, repeatability, creep) of the load cell is declared at the level of 0.02% F.S., which is 7 g. The temperature affects both zero value and signal output (respectively, 0.003% F.S./°C and 0.002% F.S./°C). The measurement resolution of the scale is 0.1 g. Based on the performed measurements, the electronic noise of the measurement circuit can be neglected in comparison with disturbances resulting from the vibrations of the mounting platform.
2.3. Monitoring System—Installation in the Urban Apiary for Tests
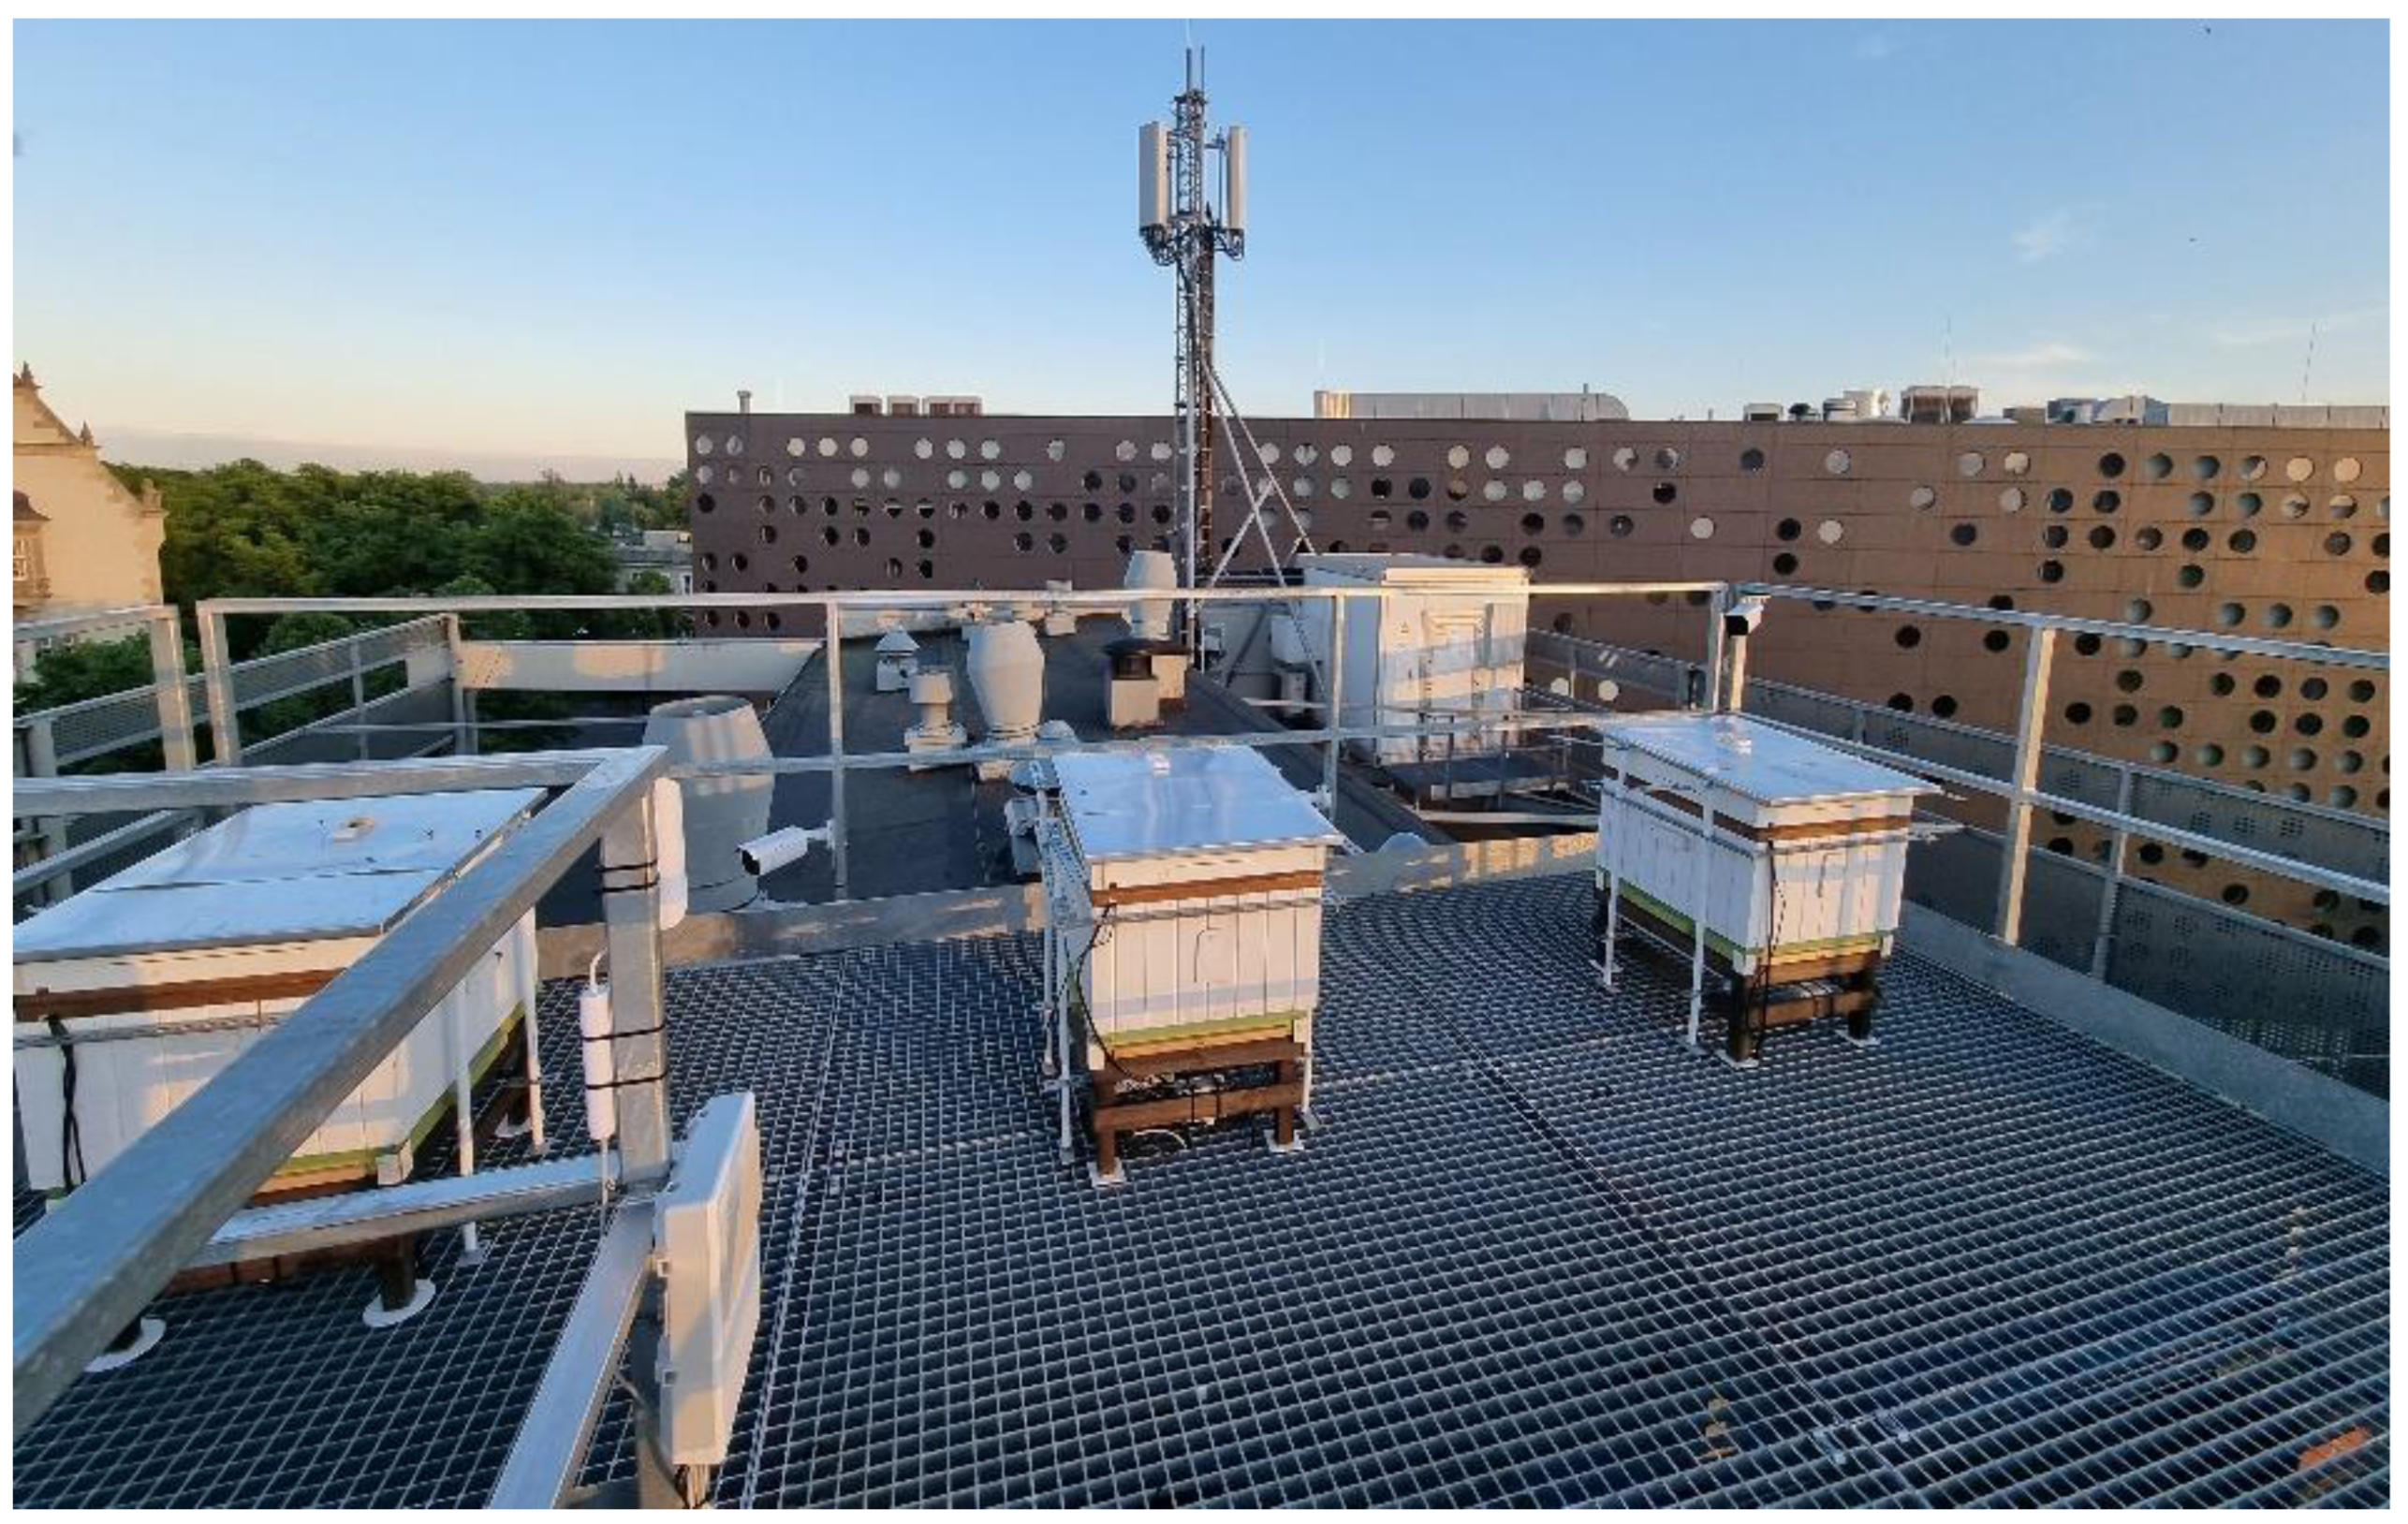
The monitoring system was tested in an urban apiary, which is shown in Figure 4. The apiary consists of three self-made wooden hives. The beehive construction type is Wielkopolski, slightly extended. Frames are arranged in parallel to the beehive entrance. Hives were populated by inoffensive colonies of honey bee (Apis mellifera).
The hives are located on the roof of the four-floor building (Poland, Wroclaw University of Science and Technology, building C-6). They were mounted on the fenced-in, elevated openwork technical platform, as shown in Figure 4. A special harness was designed, see Figure 4, to protect them from overturning by the wind or sliding from the base.
The devices dedicated to inside-beehive monitoring, i.e., the multi-sensor device and the endoscopic camera, were mounted in the measuring frame. It was a normal hive frame, but empty, without the comb. The part of the frame hosting the multi-sensor device was separated from the beehive air by a transparent, stainless steel mesh, as shown in Figure 5. This partition was intended to prevent the device from bees clogging the gas inlets and to assure free access of the beehive air to the sensors. The part of the frame hosting the endoscopic camera was left open on both sides. The initially applied side plexiglass covers were removed due to the light reflection effect distorting the camera view. The camera was free to move upside-down and left-right as well as turn around so that the watched section of the adjacent comb could be changed. Power and Ethernet cables were pulled through the top of the frame. The measurement frame was mounted among regular frames as the fourth one from the beehive entrance. The distance from the neighbouring comb, watched by the camera, was twice the normal between-frame distance.
Outside-beehive cameras were mounted on the railing of the beehive’s hosting platform. The cameras for beehive-entrances monitoring were located opposite beehive entrances at the side so as not to obstruct the bees’ pathway to/from the beehive. The camera overlooking the apiary as well as the auxiliary equipment, such as the electric switchboard, and the components of the data transmission system were also mounted on the railing. All cables were routed under the platform.
3. Results
To realize the kind and magnitude of the beehive environment’s impact on the performance of measurement devices installed inside, the selected parameters were examined, which characterize the devices operation.
3.1. Sensors
The following characteristics of multi-sensor devices were studied: (1) the capability to reflect the levels and the temporal variation of the measured parameters inside and outside beehives, (2) the measurement data collection efficiency, (3) the percentage of outliers in the measurement data, and (4) the occurrence of the systematic change of individual sensor response.
3.1.1. Capability to Reflect the Levels and the Temporal Variation of the Measured Parameters Inside and Outside Beehives
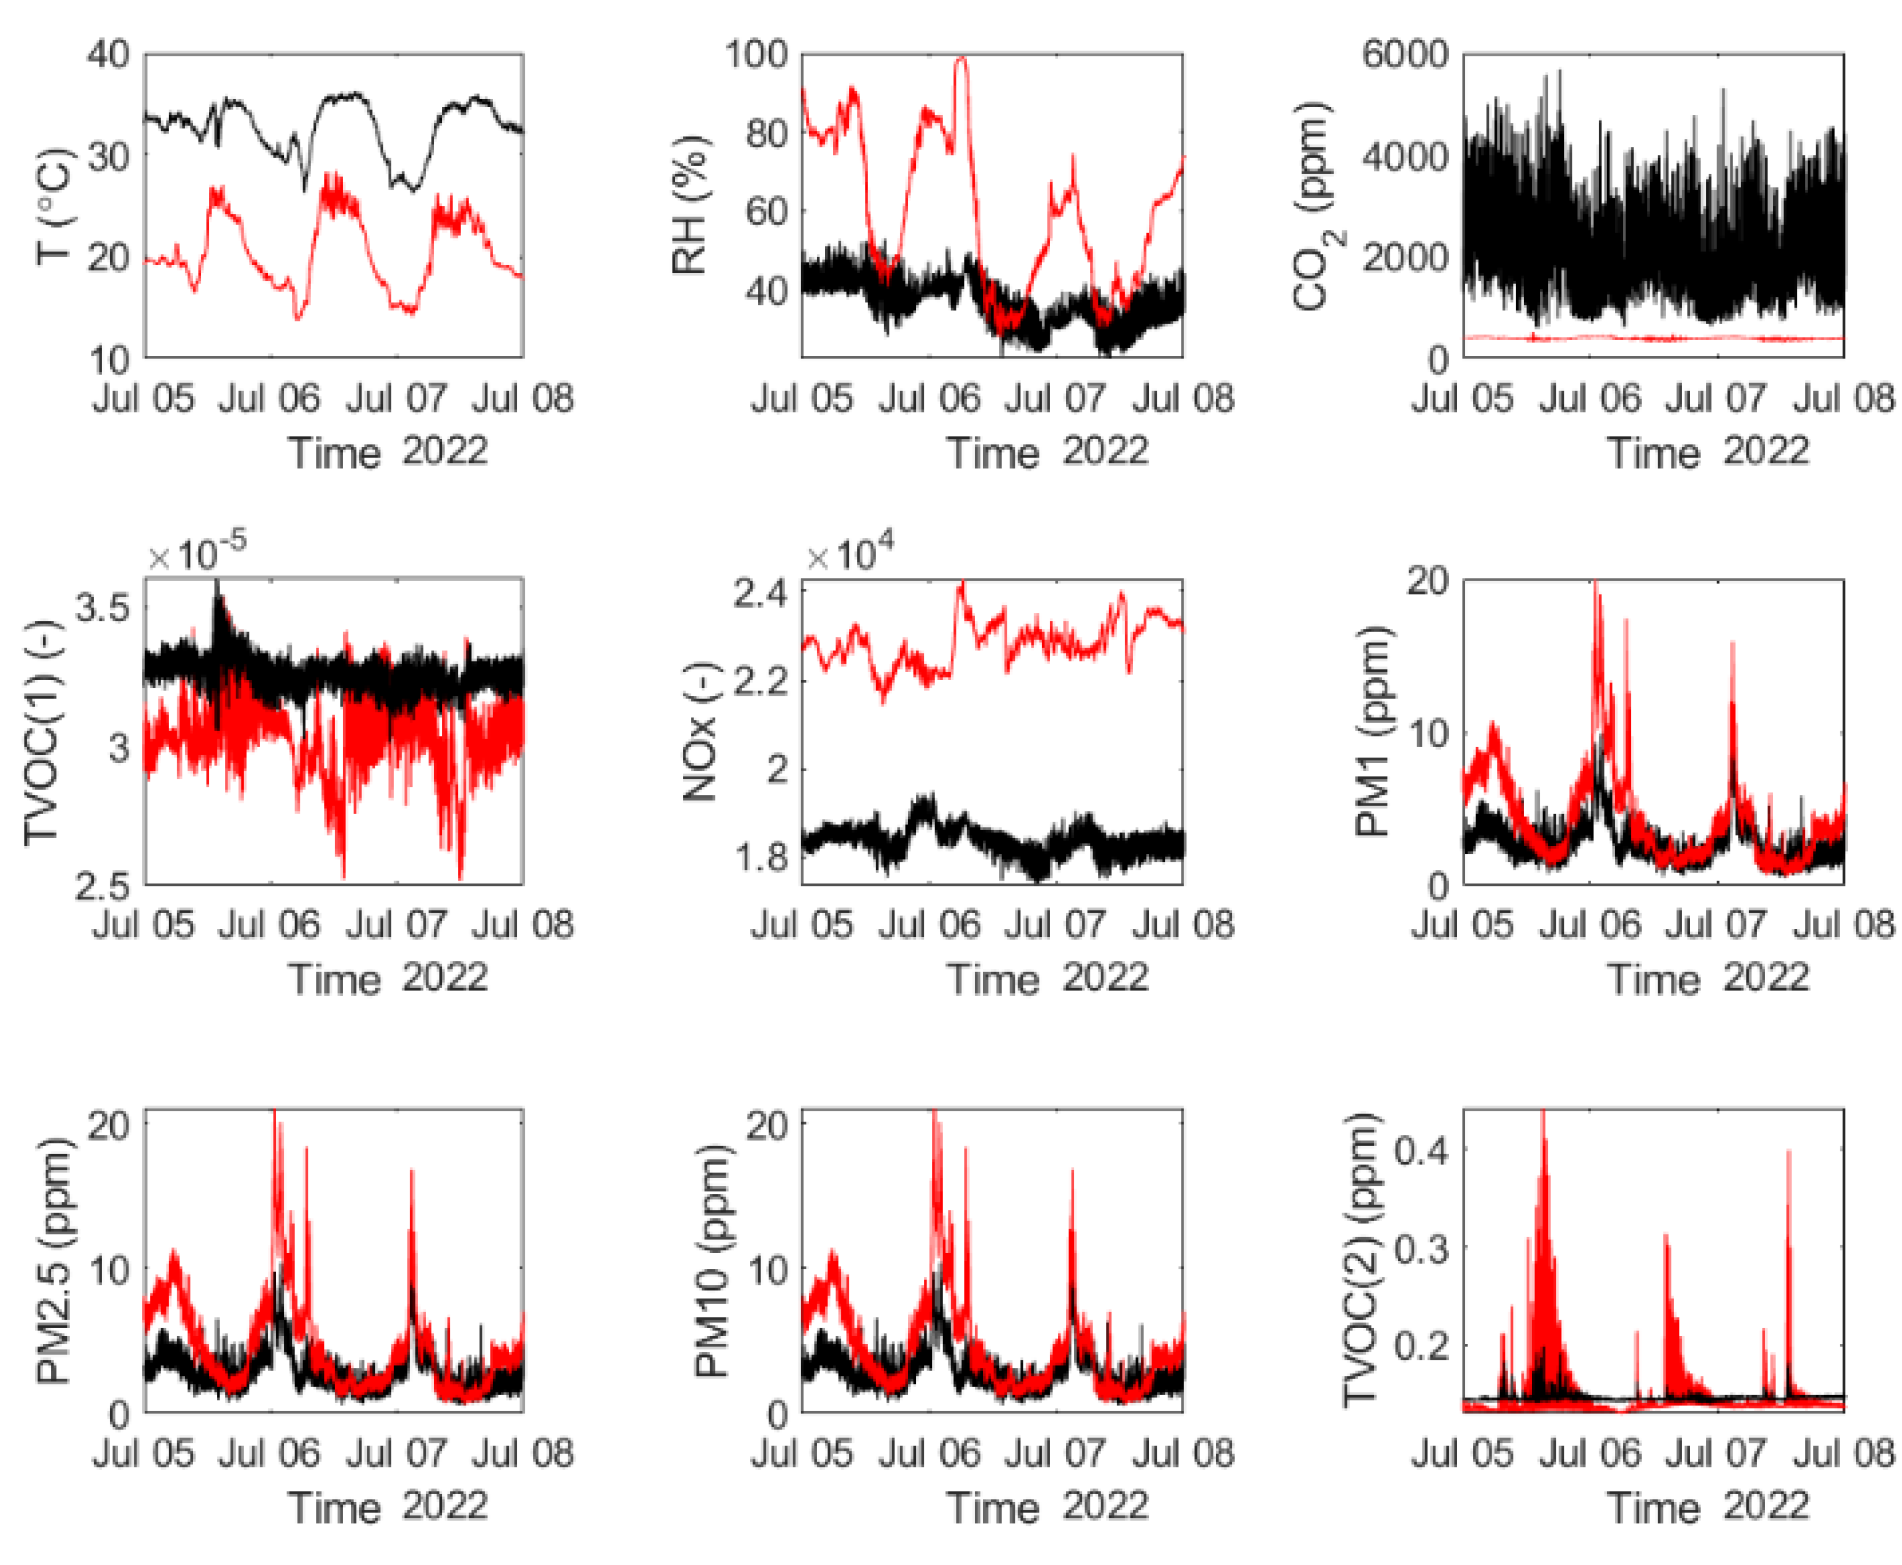
An example of the results of measurements performed by multi-sensor devices is shown in Figure 6. In charts, we compared the data of the monitoring of air inside the beehive and outside, in the apiary, close to the beehive.
Based on Figure 6, we see that the multi-sensor devices are capable of reflecting the actual values of the parameters of air inside the beehives as well as outside them. As shown, beehive air has a different composition in terms of the content of compounds, such as CO2, VOCs, and PM, as compared with the ambient air in the apiary. The beehive environment is also featured by different thermal conditions (temperature and relative humidity) compared with its surroundings. As shown in Figure 6, the measurements done with multi-sensor devices also allow observation of the temporal variation of the parameters of air inside the beehives and outside them. For the majority of parameters, like T, RH, PM, and TVOC(2), the diurnal variation was well pronounced. However, other parameters, like CO2, NOx, and TVOC(1), seemed not to follow this kind of pattern of temporal change. In our future work, the data collected by our monitoring system will be extensively investigated regarding the mutual relationship between the ambient air and the beehive atmosphere in urban conditions.
3.1.2. Measurement Data Collection Efficiency
The daily data collection efficiency was determined for each of the four multi-sensor devices operating in our monitoring system. The daily data collection efficiency was defined as the number of seconds during the day (a fraction of 24 h × 3600 s) when the complete set of measurement data was recorded by the device. By the complete set of data, we mean the data vector including the responses of all sensors associated with the same time point and the respective time coordinate. The temporal resolution of data collection by the system is 1 s. Table 2 presents the daily data collection efficiency for the individual multi-sensor devices in the testing period using the 5th, 50th, and 95th percentile. The devices were identified by their location.
As shown in Table 2, during 95% of the days, the data collection efficiency exceeded 99.53% (i.e., 23 h 53 min). The data losses had the form of individual gaps lasting up to several seconds and their occurrence in time was not showing any regularity. The data coverage at the level offered by the monitoring system allows for the exhaustive multivariate analysis of the measurement data in the time domain. Regarding the objectives of the monitoring, it shall be considered satisfactory.
3.1.3. Percentage of Outliers in the Measurement Data
The measurement data were examined for outliers. It is known that the identification of outliers is crucial for building a reliable statistical model of the data and obtaining a valid statistical characterization of the measured object. Based on outliers, abnormal conditions can be examined regarding the circumstances and frequency of their occurrence.
In general, the statistical distribution of the measurement data may be different from normal. We chose the criterion for outlier detection, which is not sensitive to data distribution. Based on this criterion, an outlier is the data scoring more than 1.5 interquartile range above the upper quartile or below the lower quartile. Figure 7 presents the percentage of outliers for the measurement data collected by our monitoring system. As shown, for a particular air parameter, a similar percentage of outliers was noted across all measurement points. Different parameters even measured at the same location had a different percentage of outliers. It may be concluded that the percentage of outliers depends on the measured parameter. In other words, a particular feature of the measured object, represented by this parameter is likely to have a contribution of abnormal states as calculated, or the sensor of a particular quantity is likely to give that contribution of abnormal readouts. In general, the percentages of outliers in our monitoring system were higher than expected in the case of normally distributed data, which is 0.03%. Less than 2% of outliers were found in the case of relative humidity, CO2 concertation, and temperature. A higher percentage of outliers, yet still below 6%, was associated with the measurements of TVOCs (both using semiconductor gas sensors and PID) and particulate matter. The measurement of NOx concentration was featured by a very high number of outliers 6–18%. As mentioned, for building the statistical model of the data outliers shall be rejected, if no explanation is found for their existence. Based on our analysis, the associated data loss would be substantial only in the case of NOx.
3.1.4. Systematic Change of an Individual Sensor Response
One of the important problems in the sensor systems dedicated to continuous measurements is the occurrence of a systematic change in sensor responses. If the reason for this kind of change cannot be found in the measured object, it may be attributed to the change in the sensing properties of the sensor. Systematic change of sensor response is a source of measurement error. The measurement data collected by our monitoring system was examined in this respect.
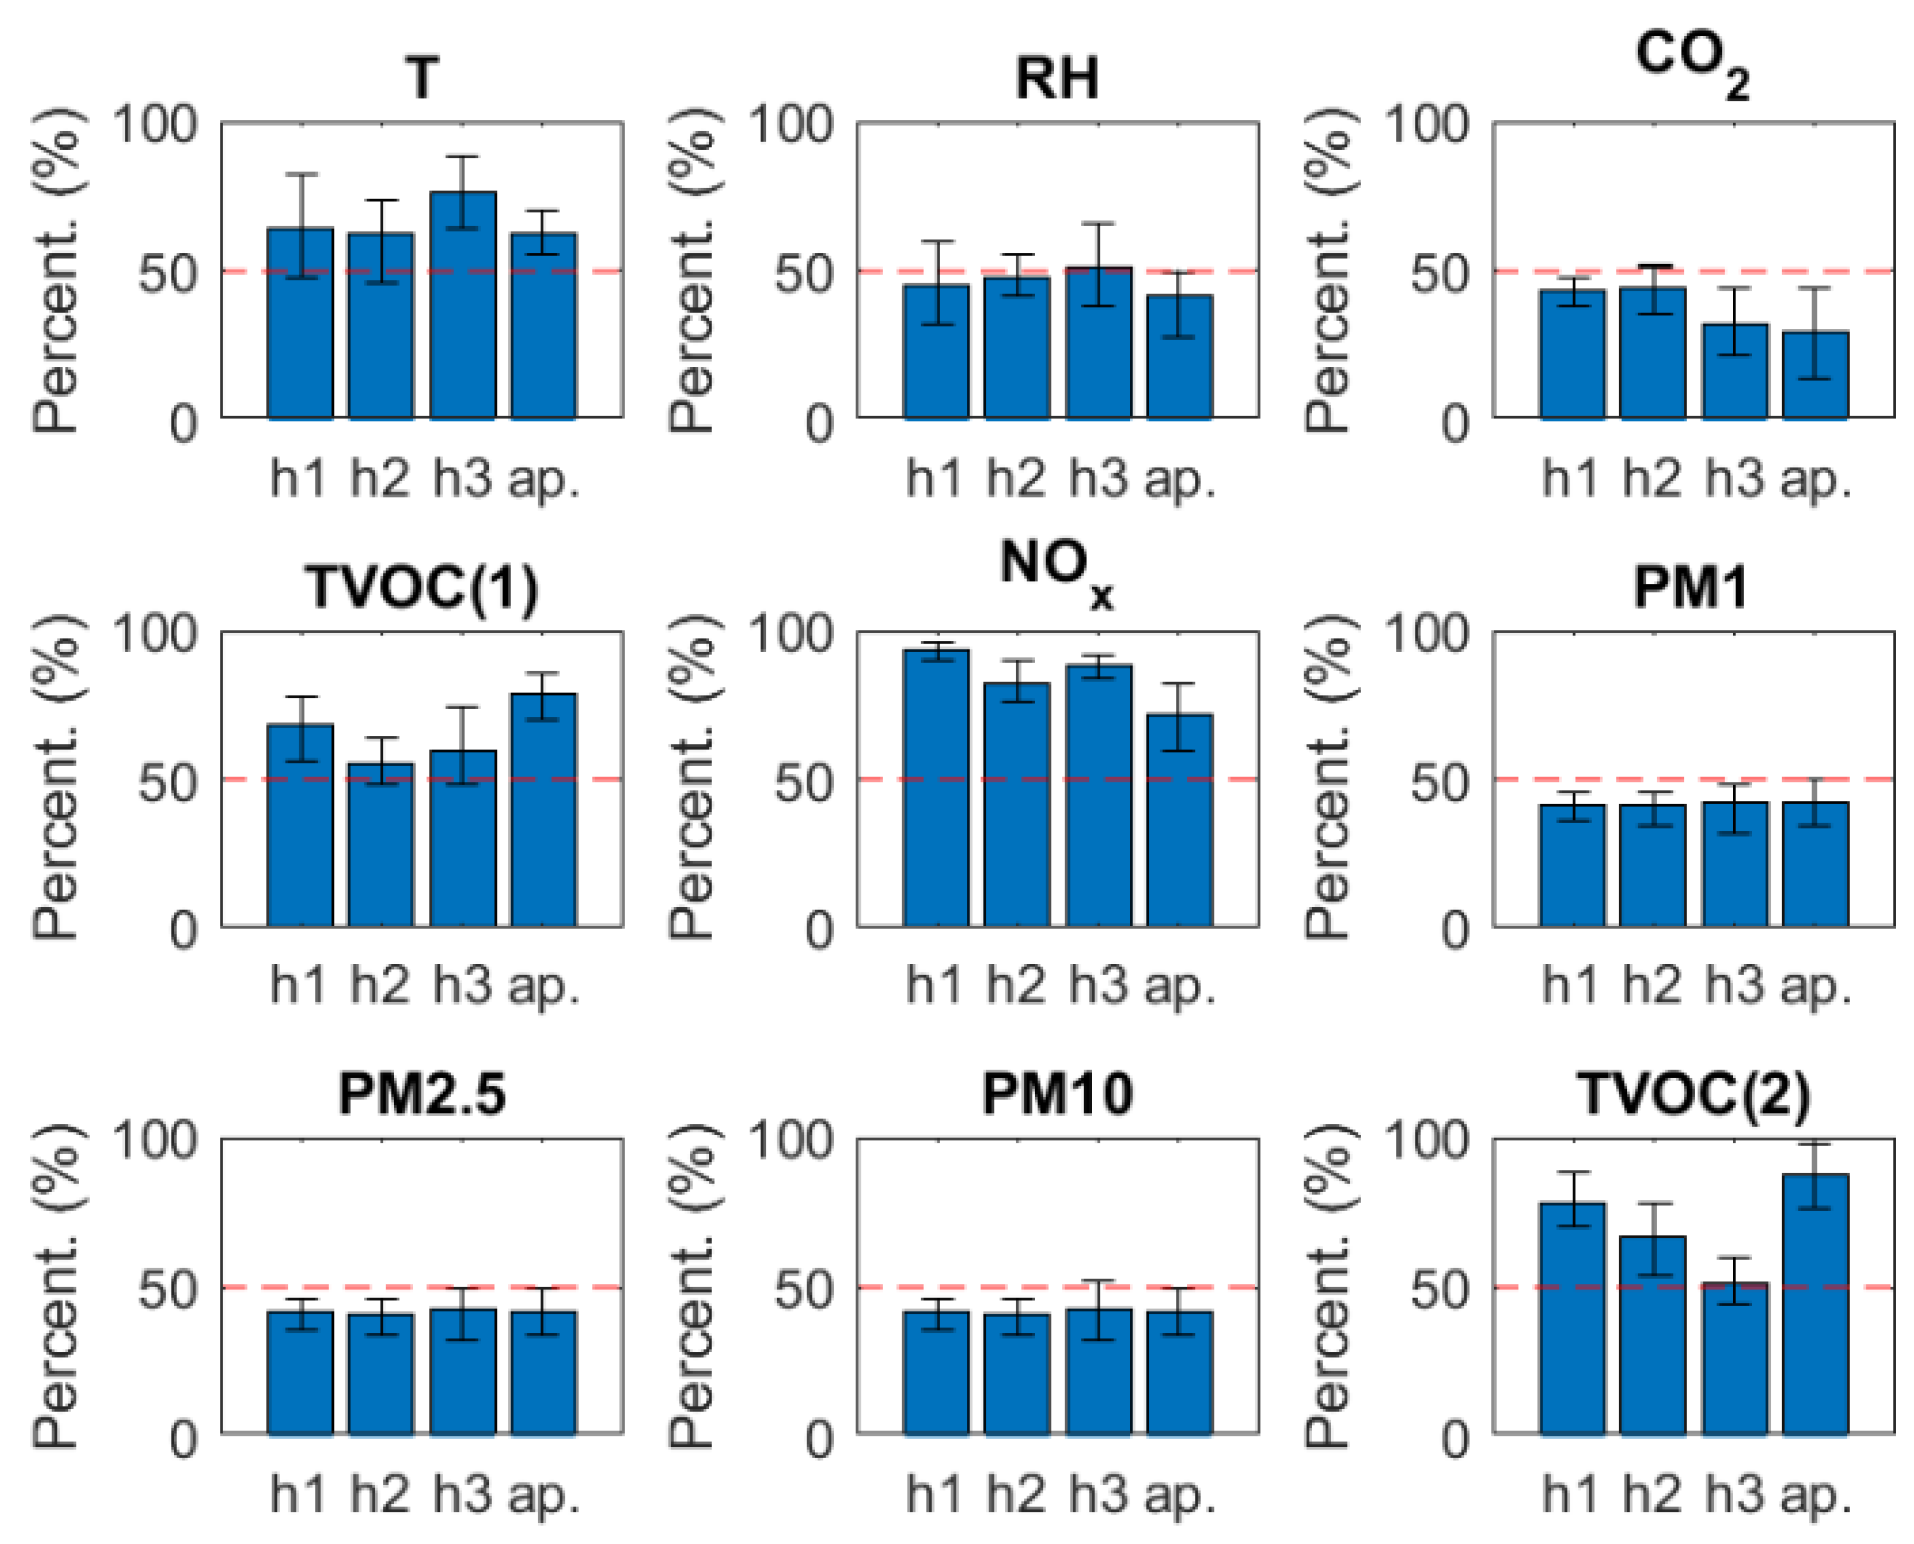
The measurement data collected inside beehives as well as outside them, in the apiary, have a periodic component, as shown in Figure 6. The major one is associated with the diurnal variation of the examined environments. To detect the systematic change in sensor responses, this component must be eliminated. The following procedure was proposed: (1) each day was divided into 1-h-long intervals, i.e., between 0 and 1 a.m., between 1 a.m. and 2 a.m., and so on; (2) the data collected over the entire test period were combined, within particular time intervals, i.e., for each measured parameter, 24 data sets were formed; (3) data in these data sets were arranged by date and time; (4) each data set was further divided into 50 subsets forming a time sequence; (6) the means in each subset was then compared with the mean in the aggregate of preceding subsets, using the two-sample t-test. The null hypothesis about means being equal was tested against the alternative that the first mean was greater than the second. In Figure 7, we show the percentage of cases when the null hypothesis was rejected in favour of the alternative hypothesis at the significance level
As shown in Figure 8, for some of the measured parameters, the percentage of cases when the null hypothesis about equal means was rejected was greater than 50%. These parameters were: temperature, NOx, and TVOC measured using SMSs as well as using the PID sensor.
3.2. Video Cameras
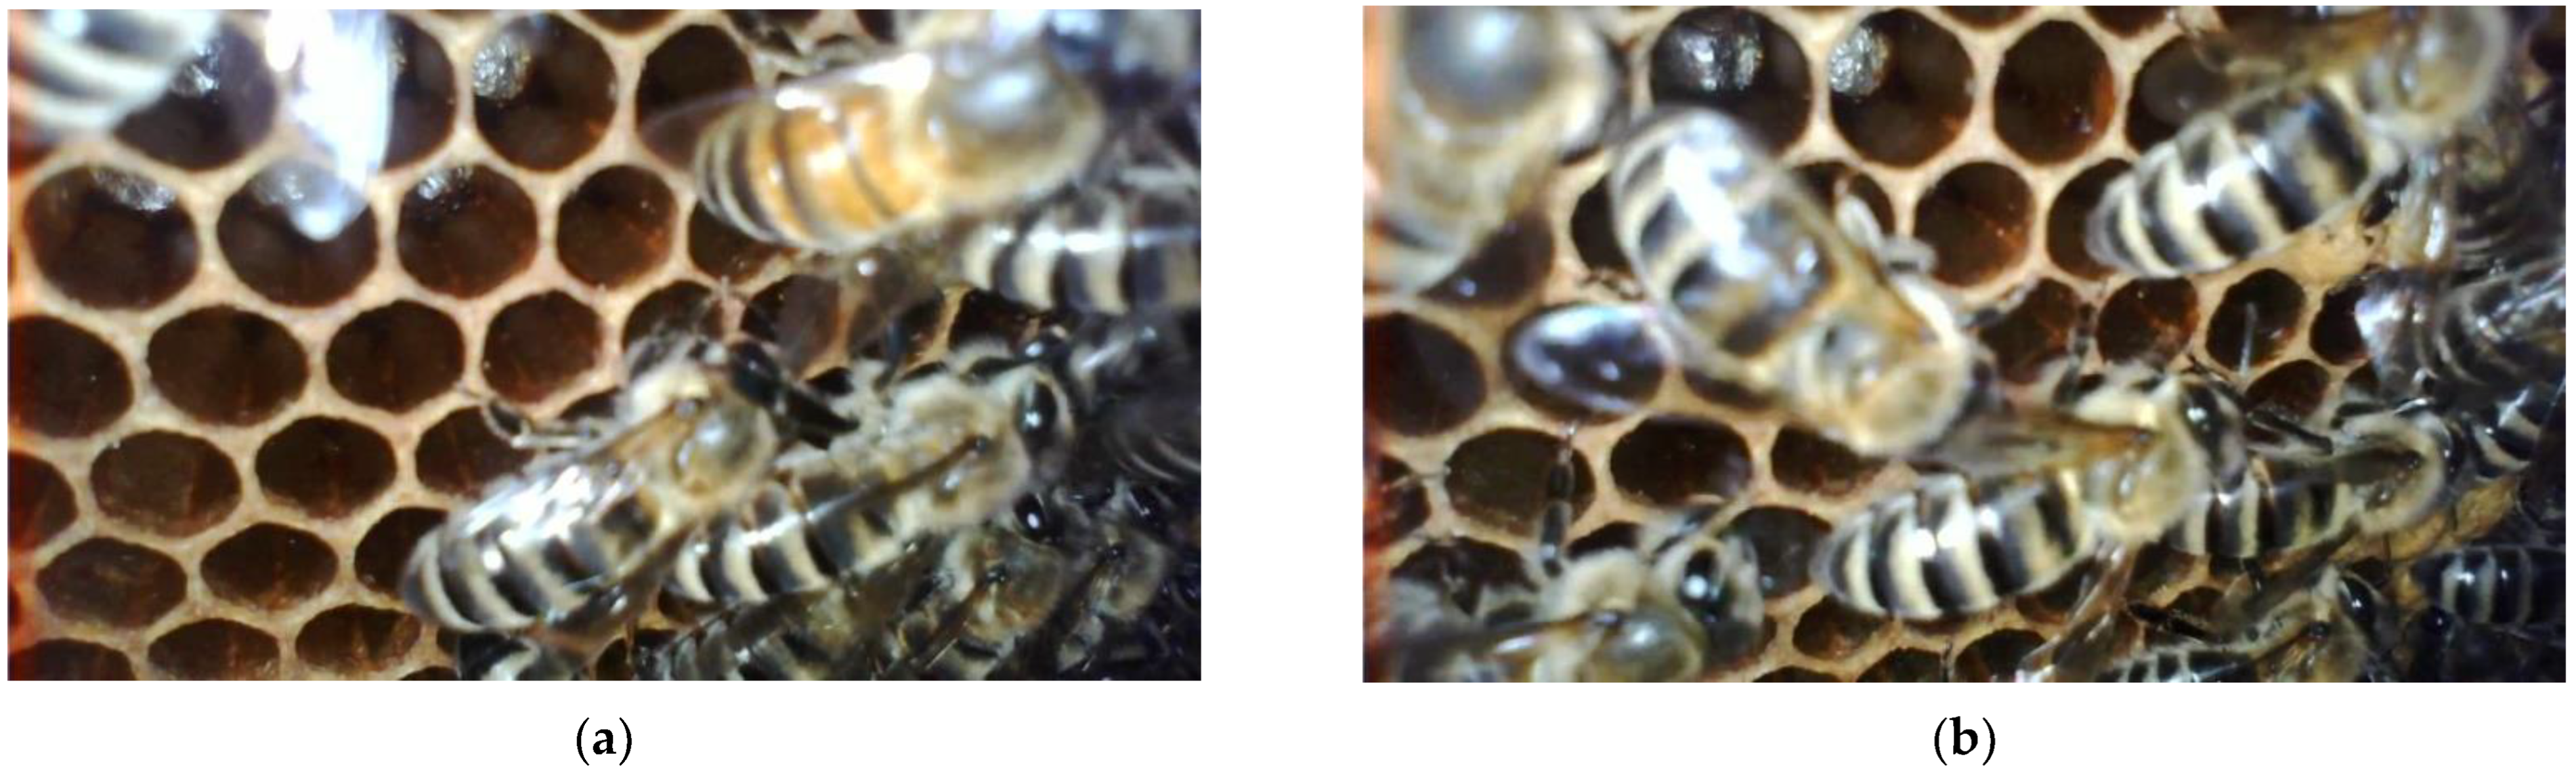
The endoscopic cameras mounted inside the beehive in the measurement frame allow us to observe the adjacent frame, i.e., the comb and bees’ activity on it. The fragment of the comb in the camera’s field of view is from several to several dozen cells in size, depending on the distance between the measurement frame and the observed comb, see Figure 9 and Figure 10. By trial and error, we found that the video image is sharp when using twice the normal between-frame distance. The spacing of this size is already somewhat unnatural for the insects. Our study showed, that in strong colonies, one may expect the development of an additional comb on the distance stick, which makes up for the gap and obstructs the view. We also observed that when the comb thickness is changed (especially when mounting the camera next to the frame with wax foundation), the distance to the camera is shortened, and the sharpness of the image slowly deteriorates.
Based on our experience, the inside-beehive video observation is equally comfortable during the daytime and at night time. The camera’s source of light is sufficient to assuring good visibility of the details, as shown in Figure 9. One may observe the movement of honey bees on the comb [36] and the alteration of movement intensity is well pronounced. The magnification offered by the camera is adequate to determine the content of comb cells like pollen, nectar, bee egg, larvae, sealed developing young bees, and sealed honey. With video streaming, one may follow the process of comb development and management, including stages of a new honey bee formation from the egg until the young insect burrows out [36]. We found that the three monitored honey bee colonies could be effectively ranked in terms of their overall strength based on the video transmission. Moreover, the ranking was coherent with the results of the beehive inspection. The beekeeper found the online monitoring supportive in his care for honey bee colonies.
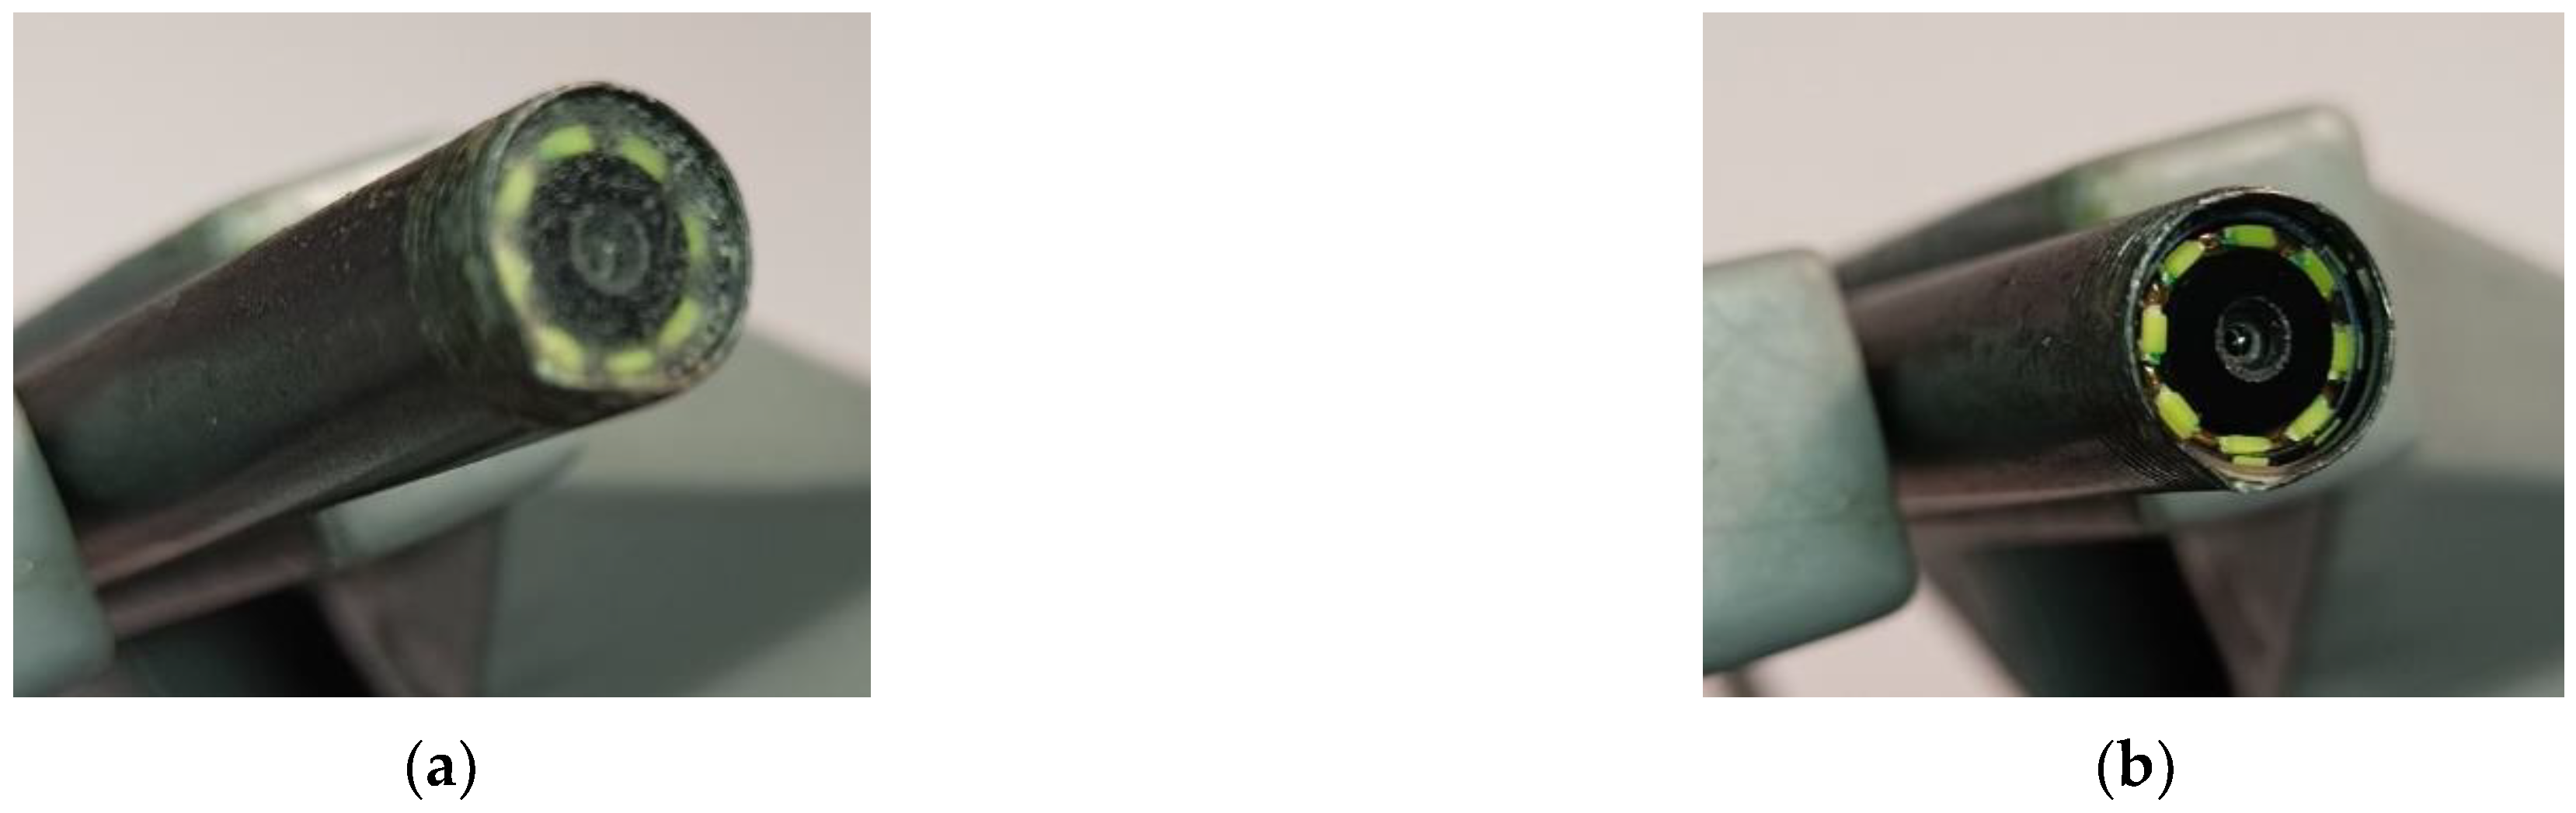
Our tests showed that cameras inside the hive do not require a protective cover. Honey bees did not attack the camera and did not shield it with any kind of purposefully built structure. They behaved naturally, often walking over it as if it was the comb. We found that the insects gradually built up the free space in the measurement frame with a comb, incorporating the camera into it. This process was very fast. This wax structure stabilizes the camera, although it also limits the possibility of changing its position within the frame. Based on our experiment, over time, a kind of semi-solid deposit collects on the camera lens, see Figure 11. Its component must come from the beehive air, or they are brought by the insects that walk over the camera. Upon deposit accumulation, the quality of the video may deteriorate up to the point when the observation becomes uncomfortable, see Figure 10. Fortunately, the deposit is easy to remove using organic solvent and cloth.
3.3. Scales
In traditional beekeeping, the major use of beehive weight measurement is to observe honey accumulation and note the occurrence of swarming events or acts of vandalism. Due to energy-saving constraints, the measurement is usually performed with a small time resolution of 1 h or less. We proposed to measure beehive weight with a high temporal resolution of 1 s for gaining additional insight into the information value of this parameter. Daily data coverage associated with beehive weight measurement exceeded 99.99%.
The representative results of beehive weight monitoring within 24 h are shown in Figure 12. They reveal the fact that in urban conditions, beehive weight measurement was subject to a noticeable disturbance during the day. Their amplitude was roughly 0.5 kg, which is between 15 and 18% of the beehive’s weight. This level of interference with the beehive weight measurement is considerable. It may turn out typical for urban conditions. The time of the day when the variation of the measurement signal occurred suggests that their source is the vibrations of the building where the beehives are located on the roof. The vibrations may be associated with the operation of building installations (e.g., ventilation) as well as city activity in general (e.g., road traffic).
The data collected during a test run of our monitoring system have indicated that beehive weight measurements are considerably influenced by the occurrence of rain. This fact is illustrated in Figure 13, which presents the results of three beehives’ weight monitoring for 1 week. Heavy rain started on 30 July 2022 in the afternoon. During about 1 day of heavy rainfall, the weight of the most exposed hive 3 increased by about 13 kg. The weight of the less exposed hive 2 changed by 3 kg and hive 1 seemed unaffected by the rain. Based on the monitoring data, one could additionally observe the beehive dry-out process. In the discussed case, it lasted for 5 days.
4. Discussion
The major problem associated with the realization of inside-beehive monitoring was to assure proper conditions for its continuous operation in the beehive environment. There are multiple examples of imaging systems developed for beekeeping. They are mostly aimed at monitoring honey bees’ in-and-out activity [37]. With these systems, lateral traffic may be determined [22], insects can be counted, the position of individual bees may be identified [24], and recognition is possible whether or not bees are carrying pollen sacs [38]. Video monitoring is also applied for parasite detection [23]. The common feature of the imaging systems like these is the equipment mounted outside the beehives. Usually, a special construction is affixed for this purpose to the beehive entrance [22,23,24,38], which includes a camera and additional elements, e.g., for bees traffic pipelining [23,37] or increasing the visibility of the individual insects in video frames [24,38]. In this location, the imaging system does not constitute an element of the inside-beehive environment. Therefore it is neither exposed to the beehive’s internal atmosphere nor to the massive presence of insects, which is the case for the devices operated inside beehives. While preparing to realize our concept of inside-beehive monitoring, we have found just one reference to the inside-beehive imaging system [39]. It was based on an IR camera and dedicated to periodic use only. Before our system installation, there were worries that honey bees may clog the cameras with the wax or propolis. Such a reaction would imply that long-term camera operation is not possible without periodic replacement. In principle, it would undermine the feasibility of inside-beehive video monitoring.
During the test period of the monitoring system operation in the apiary, we did not observe signs of camera non-acceptance by the honey bees. The camera view was not purposefully obscured by the insects. We did not note any exceptional bee grouping or abnormal behavior in the vicinity of these devices However, due to employing very simple cameras, our insight into the functioning of an entire beehive was quite limited. It was obvious when comparing the video transmission and the information obtained from the beehive inspection. Wide-angle cameras and using more than one camera would offer a better view. Different parts of the hive fulfill different functions. Also, the content of an individual comb is not uniform. Taking into account the fact that honey bees are capable of utilizing the free space around the camera for comb formation (see Figure 5), it is possible to use multiple observation frames in the hive, without depriving the insects of their living space. An alternative would be to deploy cameras in the walls of the hive. At the moment we do not know whether cameras placed inside the hive but flush with its walls will meet with equal acceptance of honey bees as those placed in the frame. We must also think of a better camera fixing solution that allows for it to be easily taken out for cleaning, see Figure 10 and Figure 11.
Just like in the case of cameras, the placement of multi-sensor devices inside beehives also raised concerns about assuring proper conditions for the operation of these devices. The concerns resulted from our earlier experience in developing sensor devices for varroosis detection based on beehive air measurement [40]. In the course of field experiments, it was observed that the bees tended to leave the deposits of propolis or wax on the gas sampling probes if they remained in the beehive for several hours. In the case of long-term measurements, this could limit the beehive air access to the sampling probe and impair the measurement. The multi-senor system presented in this work is based on passive exposure, therefore, the unobstructed access of beehive air to the measurement module is critical for attaining credible results. There are multiple examples of sensors located inside beehives, but multi-sensor devices are most willingly localized on the inner side of the beehive base, for convenience [41]. We chose the location directly on the frame amidst brood, honey, and pollen areas, to assure a better quality of data. Ultimately this option showed non-intrusive toward bees.
Still, the devices are operated inside the beehive, in its atmosphere. The conditions in the beehive, e.g., thermal and chemical, are distinctive and specific for this kind of environment. Potentially, they could influence the performance of the devices operated there. Our monitoring system is composed of commercially available elements, which have not been optimized for inside-beehive exploitation. The examination of the selected parameters, which characterize the performance of the measurement devices, has shown that the beehive environment does not pose a major threat to their operation. The multi-senor devices continuously provide exhaustive data on the beehive atmosphere composition and its temporal variation, see Figure 6. Regarding the most commonly monitored parameters, like temperature and relative humidity, their values as well as the patterns of daily variation are coherent with those found by other researchers [27,30,42]. Concerning other parameters, in particular, TVOC, NOx, or PM, the data for comparison are difficult to find. The coverage of the period of system operation with the measurement data is very high, which confirms the reliability of the applied data collection and transmission solutions, see Table 2.
Unfortunately, it is likely that a drift affects the signals of some sensors and respective correction algorithms will have to be developed. Based on our findings, in the case of temperature, NOx, and TVOC measured using SMSs as well as using PID sensors, one could consider the occurrence of a systematic error, see Figure 8. Interestingly, this systematic change was detected in sensors that were exposed to beehive air as well as those exposed to ambient air. Hence, probably the change of the same kind of sensing element with time was encountered irrespective of exposure conditions. Except for the temperature, we could not identify the factors causing the systematic increase in the sensor signal, which would be associated with the measured object. For example, the systematic development of honey bee colonies would be expected to cause a CO2 concentration increase, but it was not observed. The exhaustive diagnostics of this issue will be possible upon the analysis of the larger set of data, in particular, after completing 1 year of measurements. The completeness of data collected over a long time is very important for overcoming the problem of sensor drift.
Various information can be acquired based on beehive weight measurement, in particular, the magnitude and the dynamics of its change. The available information is greatly dependent on the measurement resolution and temporal resolution offered by the measurement device. The typical measurement resolution of the continuously operating beehive scales is 100 g [34], although 10 g has been reported as well [21]. The measurement resolution of our beehive scales is 0.1 g. It greatly enhances the ability to observe small changes in beehive weight. Typically, beehive weight is measured several times a day [34] or with a temporal resolution of 1 h [43]. Our system offers the temporal resolution of 1 s. It is useful to observe the short-term changes in beehive weight. Based on the measurement results recorded in the first period of monitoring system operation, we observed that using this high temporal resolution and measurement resolution resulted in detecting the interferences with beehive weight measurement, which were most likely associated with the building vibration, see Figure 12. This may be typical for urban apiaries located on roofs. However, this interference was easy to filter out revealing the daily rhythm of beehive weight changes. In [43], the day was divided into the period between dusk and the dawn when “colony’s interactions with the environment in terms of weight were limited to temperature effects and gas exchange (e.g., water vapor), and the active period during the day from the initial departure of bees about dawn until their return about dusk”. Our honey bee colonies followed the same daily rhythm and the daily pattern of beehive weight variation, see Figure 12, was similar to the one observed in [43] in the case of conditions without nectar. Truly, the nectar availability was limited. At night, we also observed the effect noted in [43] that “hives usually maintained or even gained weight, probably because of increased moisture content of hive wooden parts as the ambient relative humidity rose at night”. The weight of our beehives increased regularly in the hours preceding dawn, see Figure 12. The drastic changes in beehive weight that were observed during rain, see Figure 13, were most likely associated with beehive material soaking with water. High temporal resolution and measurement resolution of our beehive scales should be sufficient to monitor bee colonies in a passive state. The average daily change of a beehive’s weight during winter is about 100 g [44]. Currently, we are in the process of collecting the measurement data to verify this hypothesis.
5. Conclusions
The paper presents a monitoring system meeting the objectives of urban beekeeping. The monitoring system allows for real-time observation of the beehive interior and entrance. It continuously measures selected physical and chemical parameters of the beehive atmosphere and provides a record of the beehive’s weight. It operates continuously in an automatic manner. The video streaming and the measurement data records are available to the public online through the dedicated webpage [35]. The system was tested for almost 3 months (June–August 2022) in the urban apiary.
It was found that inside-beehive monitoring may be effectively realized by the multi-sensor device and endoscope camera mounted inside. An effective solution for fixing the devices was the empty frame. Honey bees remained indifferent to the devices and did not obstruct their operation.
The video transmission from cameras mounted inside beehives and outdoors ran smoothly. In the period of operation, we encountered three unexpected breaks, which required resetting the system. They were most likely associated with imperfect exception handling by the software.
The average daily measurement data collection efficiency for the multi-sensor devices was 99.99%, which is high. Several percent of the recorded data were outliers. Their percentage was dependent on the measured parameter. A systematic change of measurement signal was noted in the case of some sensors. They were temperature sensor (SHT25), TVOC sensor (PIDAH2), as well as the TVOC and NOx sensor (SGP41).
The operation of beehive weight scales was beyond any complaints. The applied high measurement resolution allowed for the observation of factors that interfere with beehive weight measurement as being unrelated to the condition of the honey bee colony. We recognized the interference from the building vibrations and the rain.
The real test for our system will be the wintertime. During that period, the meteorological conditions (low temperatures, rain, snow, and wind) are not favourable for the electronic devices. Additionally, access to the beehive interior will be restricted, which heavily limits the possibility of maintenance and repair work.
Author Contributions
Conceptualization, A.S. and M.M.; methodology, A.S., M.M. and P.B.; software, M.M. and P.B.; validation, M.M. and P.B.; formal analysis, A.S. and M.M.; investigation, M.M. and P.B.; resources, A.S.; data curation, M.M.; writing—original draft preparation, A.S., M.M. and P.B.; writing—review and editing, A.S., M.M. and P.B.; visualization, M.M. and P.B.; supervision, A.S.; project administration, A.S.; funding acquisition, A.S. All authors have read and agreed to the published version of the manuscript.
Funding
This research was funded by the National Centre for Research and Development under grant no. BIOSTRATEG3/343779/10/NCBR/2017.
Institutional Review Board Statement
Not applicable.
Informed Consent Statement
Not applicable.
Data Availability Statement
Data sharing is subject to restrictions.
Acknowledgments
Authors express their gratitude to the Foundation Bees Embassy, Wroclaw Center for Networking, and Supercomputing and all individual supporters who contributed with their effort to the creation of Ulopolis.
Conflicts of Interest
The authors declare no conflict of interest.
References
- Sponsler, D.B.; Bratman, E.Z. Beekeeping in, of or for the city? A socioecological perspective on urban apiculture. People Nat. 2021, 3, 550–559. [Google Scholar] [CrossRef]
- Moore, L.J.; Kosut, M. Buzz: Urban Beekeeping and the Power of the Bee; New York University Press: New York, NY, USA, 2013. [Google Scholar]
- Neumann, P.; Carreck, N.L. Honey bee colony losses. J. Apic. Res. 2010, 49, 1–6. [Google Scholar] [CrossRef] [Green Version]
- EPILOBEE Consortium; Chauzat, M.-P.; Jacques, A.; Laurent, M.; Bougeard, S.; Hendrikx, P.; Ribière-Chabert, M. Risk indicators affecting honeybee colony survival in Europe: One year of surveillance. Apidologie 2016, 47, 348–378. [Google Scholar] [CrossRef] [Green Version]
- Drummond, F.A.; Ballman, E.S.; Eitzer, B.D.; Du Clos, B.; Dill, J. Exposure of Honey Bee (Apis mellifera L.) Colonies to Pesticides in Pollen, A Statewide Assessment in Maine. Environ. Entomol. 2018, 47, 378–387. [Google Scholar] [CrossRef] [PubMed] [Green Version]
- Cohen, H.; Quistberg, R.D.; Philpott, S.M. Vegetation Management and Host Density Influence Bee–Parasite Interactions in Urban Gardens. Environ. Entomol. 2017, 46, 1313–1321. [Google Scholar] [CrossRef] [Green Version]
- EMBARQ. Why Cities Should Invest in Beekeeping. Available online: https://www.smartcitiesdive.com/ex/sustainablecitiescollective/why-cities-should-invest-beekeeping/1093071/ (accessed on 28 December 2022).
- Egerer, M.; Kowarik, I. Confronting the Modern Gordian Knot of Urban Beekeeping. Trends Ecol. Evol. 2020, 35, 956–959. [Google Scholar] [CrossRef]
- Gerner, E.E.; Sargent, R.D. Local plant richness predicts bee abundance and diversity in a study of urban residential yards. Basic Appl. Ecol. 2022, 58, 64–73. [Google Scholar] [CrossRef]
- Mwebaze, P.; Marris, G.C.; Brown, M.; MacLeod, A.; Jones, G.; Budge, G.E. Measuring public perception and preferences for ecosystem services: A case study of bee pollination in the UK. Land Use Policy 2018, 71, 355–362. [Google Scholar] [CrossRef]
- Rutter, B. Urban Beekeeping: History, Challenges, Benefits & Best Practices. Available online: https://bestbees.com/2022/02/16/urban-beekeeping/#benefits (accessed on 28 December 2022).
- Kohsaka, R.; Park, M.S.; Uchiyama, Y. Beekeeping and honey production in Japan and South Korea: Past and present. J. Ethn. Foods 2017, 4, 72–79. [Google Scholar] [CrossRef]
- Schönfelder, M.L.; Bogner, F.X. How to sustainably increase students’ willingness to protect pollinators. Environ. Educ. Res. 2018, 24, 461–473. [Google Scholar] [CrossRef]
- Wilson, J.S.; Forister, M.L.; Carril, O.M. Interest exceeds understanding in public support of bee conservation. Front. Ecol. Environ. 2017, 15, 460–466. [Google Scholar] [CrossRef] [Green Version]
- Ramer, H.; Nelson, K.C.; Spivak, M.; Watkins, E.; Wolfin, J.; Pulscher, M. Exploring park visitor perceptions of ‘flowering bee lawns’ in neighborhood parks in Minneapolis, MN, US. Landsc. Urban Plan. 2019, 189, 117–128. [Google Scholar] [CrossRef]
- Hall, D.M.; Martins, D.J. Human dimensions of insect pollinator conservation. Curr. Opin. Insect Sci. 2020, 38, 107–114. [Google Scholar] [CrossRef]
- Keeping Honey Bees on your Property. Available online: https://vancouver.ca/people-programs/beekeeping.aspx (accessed on 28 December 2022).
- Bees in Business. Available online: https://beezthingz.co.nz/featured_item/bees-in-business/ (accessed on 28 December 2022).
- Kulyukin, V. Audio, Image, Video, and Weather Datasets for Continuous Beehive Monitoring. Appl. Sci. 2021, 11, 4632. [Google Scholar] [CrossRef]
- Abdollahi, M.; Giovenazzo, P.; Falk, T.H. Automated Beehive Acoustics Monitoring: A Comprehensive Review of the Literature and Recommendations for FutureWork. Appl. Sci. 2022, 12, 3920. [Google Scholar] [CrossRef]
- Hajdur, H.; Ammar, D.; Lefevre, L. Toward an intelligent and efficient beehive: A survey of precision beekeeping systems and services. Comput. Electron. Agric. 2022, 192, 106604. [Google Scholar]
- Kulyukin, V.; Mukherjee, S.; Minichiello, A.; Truscott, T. BeePIV: A Method to Measure Apis Mellifera Traffic with Particle Image Velocimetry in Videos. Appl. Sci. 2021, 11, 2276. [Google Scholar] [CrossRef]
- Schurischuster, S.; Remeseiro, B.; Radeva, P.; Kampel, M. A preliminary study of image analysis for parasite detection on honey bees. In Image Analysis and Recognition; Campilho, A., Karray, F., Romeny, B.T.H., Eds.; Springer International Publishing: Cham, Switzerland, 2018; pp. 465–473. [Google Scholar]
- Tu, G.J.; Kragh Hansen, M.; Kryger, P.; Ahrendt, P. Automatic behaviour analysis system for honeybees using computer vision. Comput. Electron. Agric. 2016, 122, 10–18. [Google Scholar] [CrossRef]
- Resolution No. XXV/672/20 of the Municipal Council of Wroclaw of July 23, 2020. On the Rules and Regulations for Maintaining Cleanliness and Order in the Territory of Wroclaw. In Proceedings of the Municipal Council of Wroclaw, Wroclaw, Poland, 23 July 2020; Available online: https://baw.um.wroc.pl/UrzadMiastaWroclawia/document/42247/Uchwa%C5%82a-XXV-672-20 (accessed on 28 December 2022).
- Hong, W.; Xu, B.; Chi, X.; Cui, X.; Yan, Y.; Li, T. Long-Term and Extensive Monitoring for Bee Colonies Based on Internet of Things. IEEE Internet Things J. 2020, 7, 7148–7155. [Google Scholar] [CrossRef]
- Cecchi, S.; Terenzi, A.; Orcioni, S.; Spinsante, S.; Mariani Primiani, V.; Moglie, F.; Ruschioni, S.; Mattei, C.; Riolo, P.; Isidoro, N. Multi-sensor platform for real time measurements of honey bee hive parameters. In IOP Conference Series: Earth and Environmental Science; IOP Publishing: Bristol, UK, 2019; Volume 275, p. 012016. [Google Scholar]
- Bee-Friendly Communities for Greener Cities. Available online: https://www.alveole.buzz/ (accessed on 28 December 2022).
- Henry, A.; Adamchuk, V.; Stanhope, T.; Buddle, C.; Rindlaub, N. Precision apiculture: Development of a Wireless Sensor Network for honeybee hives. Comput. Electron. Agric. 2019, 156, 138–144. [Google Scholar] [CrossRef] [Green Version]
- Meikle, W.G.; Weiss, M.; Maes, P.W.; Fitz, W.; Snyder, L.A.; Sheehan, T.; Mott, B.M.; Anderson, K.E. Internal hive temperature as a means of monitoring honey bee colony health in a migratory beekeeping operation before and during winter. Apidologie 2017, 48, 666–680. [Google Scholar] [CrossRef]
- Abreu, C.A.H.; Domínguez, R.G.; Vasconcelos, M.P.; Romero, F.C.; Silva, E.S. Impact of Artificial Intelligence in Beekeeping. Innov. Y Desarro. Tecnol. Rev. Digit. 2021, 13, 1–9. [Google Scholar]
- Ngo, T.N.; Rustia, D.J.A.; Yang, E.C.; Lin, T.T. Automated monitoring and analyses of honey bee pollen foraging behavior using a deep learning-based imaging system. Comput. Electron. Agric. 2021, 187, 106239. [Google Scholar] [CrossRef]
- Kulyukin, V.; Mukherjee, S. On video analysis of omnidirectional bee traffic: Counting bee motions with motion detection and image classification. Appl. Sci. 2019, 9, 3743. [Google Scholar] [CrossRef] [Green Version]
- Bratek, P.; Dziurdzia, P. Energy-Efficient Wireless Weight Sensor for Remote Beehive Monitoring. Sensors 2021, 21, 6032. [Google Scholar] [CrossRef]
- Ntawuzumunsi, E.; Kumaran, S.; Sibomana, L. Self-Powered Smart Beehive Monitoring and Control System (SBMaCS). Sensors 2021, 21, 3522. [Google Scholar] [CrossRef]
- Ulopolis. Available online: https://ulopolis.pwr.edu.pl/ (accessed on 9 January 2022).
- Chen, C.; Yang, E.-C.; Jiang, J.-A.; Lin, T.-T. An imaging system for monitoring the in-and-out activity of honey bees. Comput. Electron. Agric. 2012, 89, 100–109. [Google Scholar] [CrossRef]
- Yang, C.; Collins, J. Deep learning for pollen sac detection and measurement on honeybee monitoring video. In Proceedings of the 2019 International Conference on Image and Vision Computing New Zealand (IVCNZ), Dunedin, New Zealand, 2–4 December 2019; pp. 1–6. [Google Scholar]
- Edwards-Murphy, F.; Magno, M.; O’Leary, L.; Troy, K.; Whelan, P.; Popovici, E. Big brother for bees (3b)—Energy neutral platform for remote monitoring of beehive imagery and sound. In Proceedings of the 2015 6th International Workshop on Advances in Sensors and Interfaces (IWASI), Gallipoli, Italy, 18–19 June 2015; pp. 106–111. [Google Scholar]
- Szczurek, A.; Maciejewska, M. Beehive Air Sampling and Sensing Device Operation in Apicultural Applications—Methodological and Technical Aspects. Sensors 2021, 21, 4019. [Google Scholar] [CrossRef]
- Giammarini, M.; Concettoni, E.; Zazzarini, C.; Orlandini, N.; Albanesi, M.; Cristalli, C. Beehive lab project—Sensorized hive for bee colonies life study. In Proceedings of the 2015 12th International Workshop on Intelligent Solutions in Embedded Systems (WISES), Ancona, Italy, 29–30 October 2015. [Google Scholar]
- Cook, D.; Tarlinton, B.; McGree, J.M.; Blackler, A.; Hauxwell, C. Temperature Sensing and Honey Bee Colony Strength. J. Econ. Entomol. 2022, 115, 715–723. [Google Scholar] [CrossRef]
- Meikle, W.G.; Holst, N.; Colin, T.; Weiss, M.; Carroll, M.J.; McFrederick, Q.S.; Barron, A.B. Using within-day hive weight changes to measure environmental effects on honey bee colonies. PLoS One 2018, 13, e019758. [Google Scholar] [CrossRef]
- Zacepins, A.; Brusbardis, V.; Meitalovs, J.; Stalidzans, E. Challenges in the development of Precision Beekeeping. Biosyst. Eng. 2015, 130, 60–71. [Google Scholar] [CrossRef]
Figure 1.
Schema of the monitoring system for urban beekeeping.

Figure 2.
The schema of the multi-sensor module.

Figure 3.
The beehive scale: (a) schema, and (b) technical realization.

Figure 4.
Urban apiary where the monitoring system was installed and tested.

Figure 5.
Measurement frame with the multi-sensor device and endoscopic camera: (a) originally, and (b) after comb formation around the camera.
Figure 5.
Measurement frame with the multi-sensor device and endoscopic camera: (a) originally, and (b) after comb formation around the camera.

Figure 6.
The results of beehive air (black) and apiary air monitoring (red) using multi-sensor devices. TVOC(1) and TVOC(2) refer to measurements performed using SGP41 and PID AH2, respectively.
Figure 6.
The results of beehive air (black) and apiary air monitoring (red) using multi-sensor devices. TVOC(1) and TVOC(2) refer to measurements performed using SGP41 and PID AH2, respectively.

Figure 7.
Percentage of outliers detected in the measurement data collected during first 3 months of monitoring system operation. TVOC(1) and TVOC(2) refer to measurements performed using SGP41 and PID AH2, respectively.
Figure 7.
Percentage of outliers detected in the measurement data collected during first 3 months of monitoring system operation. TVOC(1) and TVOC(2) refer to measurements performed using SGP41 and PID AH2, respectively.

Figure 8.
Percentage of time when the systematic of sensor response was observed. TVOC(1) and TVOC(2) refer to measurements performed with SGP41 and PID AH2, respectively. Abbreviations: h1—hive 1, h2—hive 2, h3—hive 3, ap.—apiary.
Figure 8.
Percentage of time when the systematic of sensor response was observed. TVOC(1) and TVOC(2) refer to measurements performed with SGP41 and PID AH2, respectively. Abbreviations: h1—hive 1, h2—hive 2, h3—hive 3, ap.—apiary.

Figure 9.
Screenshot of the video stream from hive 2 on 9 August 2022: (a) in the middle of the day (about 10:30), and (b) in the middle of the night (about 23:30).
Figure 9.
Screenshot of the video stream from hive 2 on 9 August 2022: (a) in the middle of the day (about 10:30), and (b) in the middle of the night (about 23:30).

Figure 10.
Video image deterioration during 3 months of camera operation inside: (a) hive 1, and (b) hive 3. Screenshots from 9 August 2022 at about 10:30.
Figure 10.
Video image deterioration during 3 months of camera operation inside: (a) hive 1, and (b) hive 3. Screenshots from 9 August 2022 at about 10:30.

Figure 11.
The endoscopic camera taken out from the hive: (a) with the deposit on it, and (b) after cleaning.
Figure 11.
The endoscopic camera taken out from the hive: (a) with the deposit on it, and (b) after cleaning.

Figure 12.
Beehive weight measurement data, which was collected for 1 day.

Figure 13.
Impact of heavy rain and the dry-out process on beehive weight.


Table 1.
The measurement characteristics of sensors included in the multi-sensor device.
| Sensor | Measured Parameter | Detection Principle | Measurement Range | Accuracy | Resolution | Repeatability | Long Term Drift |
|---|---|---|---|---|---|---|---|
| SHT25 | Temperature Relative | band gap | −40–125 °C | typ ± 0.2 °C | 0.01 °C | ±0.1 °C | <0.02 °C/y |
| Humidity | capacitive | 0–100% RH | typ ± 1.8 °C | 0.04% RH | ±0.1% RH | <0.25% RH/yr | |
| SPS30 | Particulate matter | laser scattering | 0–1000 μg/m3 | ± 10 μg/m3 * or ± 10% m.v.* * device-to-device variation with KCl aerosol | float values | - | ±1.25 μg/m3 /year or ±1.25% m.v. /year |
| SCD30 | Carbon dioxide | NDIR sensor | 400–10,000 ppm (with declared accuracy) | ±(30 ppm + 3% m.v.) | float values | ±10 ppm | ±50 ppm/lifetime with ASC field callibration algorithm |
| PID AH2 | TVOCs with ionisation potentials <10.6 eV | photoionisation gas detector | 1 ppb–50 ppm isobutylene (linear range) | - | - (analogue sensor) | - | - |
| SGP41 | TVOC and NOx | dual channel MOX gas sensor | 0–1000 ppm ethanol (0.5–10 ppm specified range) 0–10 ppm NOx (50–650 ppb specified range) | Typ < ±15% m.v. * Typ < ±15% m.v. * * device-to-device variation | nonlinear | Typ < ±15% m.v. Typ < ±15% m.v. | - |
* device-to-device variation with KCl aerosol.
Table 2.
Daily data collection efficiency for the individual multi-sensor devices of the monitoring system.
Table 2.
Daily data collection efficiency for the individual multi-sensor devices of the monitoring system.
| Multi-Sensor Device Location | Daily Data Collection Efficiency [%] | ||
|---|---|---|---|
| 5th Percentile | 50th Percentile | 95th Percentile | |
| Hive 1 | 99.53 | 99.99 | 100.00 |
| Hive 2 | 99.81 | 100.00 | 100.00 |
| Hive 3 | 99.80 | 99.99 | 100.00 |
| Apiary | 99.84 | 99.99 | 100.00 |
Disclaimer/Publisher’s Note: The statements, opinions and data contained in all publications are solely those of the individual author(s) and contributor(s) and not of MDPI and/or the editor(s). MDPI and/or the editor(s) disclaim responsibility for any injury to people or property resulting from any ideas, methods, instructions or products referred to in the content. |
© 2023 by the authors. Licensee MDPI, Basel, Switzerland. This article is an open access article distributed under the terms and conditions of the Creative Commons Attribution (CC BY) license (https://creativecommons.org/licenses/by/4.0/).
Share and Cite
MDPI and ACS Style
Szczurek, A.; Maciejewska, M.; Batog, P. Monitoring System Enhancing the Potential of Urban Beekeeping. Appl. Sci. 2023, 13, 597. https://doi.org/10.3390/app13010597
AMA Style
Szczurek A, Maciejewska M, Batog P. Monitoring System Enhancing the Potential of Urban Beekeeping. Applied Sciences. 2023; 13(1):597. https://doi.org/10.3390/app13010597
Chicago/Turabian StyleSzczurek, Andrzej, Monika Maciejewska, and Piotr Batog. 2023. "Monitoring System Enhancing the Potential of Urban Beekeeping" Applied Sciences 13, no. 1: 597. https://doi.org/10.3390/app13010597
Note that from the first issue of 2016, this journal uses article numbers instead of page numbers. See further details here.