Hyperspectral Image Classification Using 3D Capsule-Net Based Architecture


1
Electronics and Telecommunications Research Institute (ETRI), Gwangju 61012, Korea
2
Department of Electronics and Information Engineering, Jeonbuk National University, Jeonju 54896, Korea
*
Author to whom correspondence should be addressed.
†
These authors equally contributed to this work.
Appl. Sci. 2022, 12(21), 11299; https://doi.org/10.3390/app122111299
Submission received: 7 October 2022
/
Revised: 2 November 2022
/
Accepted: 4 November 2022
/
Published: 7 November 2022
Abstract
:Convolution neural networks have received much interest recently in the categorization of hyperspectral images (HSI). Deep learning requires a large number of labeled samples in order to optimize numerous parameters due to the expansion of architecture depth and feature aggregation. Unfortunately, only few examples with labels are accessible, and the majority of spectral images are not labeled. For HSI categorization, the difficulty is how to acquire richer features with constrained training data. In order to properly utilize HSI features at various scales, a 3D Capsule-Net based supervised architecture is presented in this paper for HSI classification. First, the input data undergo incremental principal component analysis (IPCA) for dimensionality reduction. The reduced data are then divided into windows and given to a 3D convolution layer to get the shallow features. These shallow features are then used by 3D Capsule-Net to compute high-level features for classification of HSI. Experimental investigation on three common datasets demonstrates that the categorization performance by Capsule-Net based architecture exceeds a number of other state-of-the-art approaches.
1. Introduction
As spectrum imagery technology has advanced recently, the data collected by hyperspectral devices have become increasingly precise with growing spectral and spatial qualities [1]. The final hyperspectral image (HSI) contains both 1D spectral data and 2D spatial data about the items. An HSI may be utilized for many things thanks to its wealth of information, including precision farming [2], bioimaging [3], mineral extraction [4], food hygiene [5], and army surveillance [6], and many other drone applications can be included in this list. To fully utilize the capabilities of the HSI, a number of data-processing approaches have been investigated, including noise removal [7,8], target-detection [9], and categorization [10,11,12]. The categorization of recorded information has garnered the most interest of these HSI processing methods.
The majority of traditional computer learning-based techniques used in the early stages are supervised learning techniques, such as k-nearest-neighbors [13], logistic regression [14], and random forest [15], that, in the ideal case, may produce results that are adequate. Conventional classification techniques, on the other hand, rely on specialists to manually develop characteristics, which are typically superficial, thus limiting the performance [16,17]. In contrast, end-to-end training with deep learning [18] utilizing neural network models can extract relevant structured and non-linear features. In numerous domains, including autonomous automobiles [19], tumor identification [20,21], bio-informatics [22], and machine translation [23], it has had considerable success.
So far, convolutional neural networks (CNN) [24,25], deep-belief-neural-networks [26], recurrent-neural-networks [27], as well as auto-encoder [28] are the most often utilized deep neural networks in Hyperspectral image classification. CNN stands out among them because of its physical connection and weight-sharing features, which greatly minimize the number of learning parameters. Additionally, CNN is capable of directly recording both spatial and spectral data by separating patches [29]. In the area of hyperspectral image classification, CNN-based techniques are becoming more and more significant. The spectral–spatial deep learning approach, which is more accurate than conventional machine-learning techniques used for the research problem related to HSI classification, has been suggested in [28,30]. Real 3D blocks can be used as data input for the end-to-end spectral–spatial-residual-network (SSRN) [30], eliminating the need for complicated feature extraction on HSI. The hybrid spectral CNN (HybridSN) [31], which combines a spatial 2D-CNN with a spectral–spatial 3D-CNN to acquire a more abstracted kind of spatial context, has been proposed. Additionally, deep learning techniques such as residual-networks and densely linked CNN are increasingly being used for HSI classification [28,29,30].
Zhong et al. [32] suggested a spatial–spectral residual architecture to identify HSI in light of the popularity of ResNet in the domain of image categorization. This approach considerably increased the feature usage rate, making the details about the front layer’s characteristics as an addition to the traits of the rear layer. A pyramidal ResNet framework created to categorize HSI is found in [33]. This approach successfully extracted the features information disclosed by the convolution layer by enlarging the feature space dimension and organizing the feature vector into a pyramidal ResNet block. In addition, Wang et al. [34] enhanced the topology of the densely connected CNN model and suggested a brand-new cubic-CNN architecture for extracting features. The input data to the network for this technique were the recovered original picture chunks, the attributes after feature reduction, and the outputs after 1D convolutional operation. The redundant features were efficiently removed by this technique. In order to properly utilize characteristics in various scales, a newly supervised multiresolution alternatively maintained clique architecture was developed for HSI classification in [35]. Using convolution kernels of varying sizes, a multiscale alternatively revised clique block was created in this technique to dynamically use multiscale data. The majority of the strategies noted above are dependent on CNN and its variations. Despite the fact that these techniques significantly boost HSI classification efficiency, it is challenging to overcome the decreased performance of the classifier brought on by the small number of training samples and growing number of network layers. Additionally, they include many redundant features.
For spectral–spatial categorization of HSI, the authors of [29] suggested a fused 3D CNN that aims to combine several 3D CNNs applied to a collection of groups of related spectral bands. However, combining many supervised 3D CNNs requires a significant amount of effort and computation. By effectively retrieving relevant spectral and spatial characteristics, deep learning models have demonstrated their great performance in improving HSI categorization, as can be seen from prior publications. However, there are a few problems, particularly for CNN, which needsmany samples with labels for training and classification. However, finding enough trained labeled data for HSIs is typically exceedingly challenging.
To address the aforementioned limitations and to improve the performance of HSI classification, in this paper we propose a 3D Capsule-Net based architecture. So far, Capsule-Net is used by several researchers to solve problems related to 1D and 2D data, but the performance of 3D Capsule-Net is still unexplored. Prior to analyzing the few crucial wavelengths from the whole HSI cube, incremental-principle-component-analysis (IPCA) is used to decrease band redundancies. Then, a 3D-CNN layer is used to extract the shallow features, which are given to the 3D-CNN framework for classification of HSI. The comparison is made with the existing 2D/3D techniques proposed in literature. The suggested technique surpasses the ones that were tested, according to experimental and comparison data.
2. Dataset
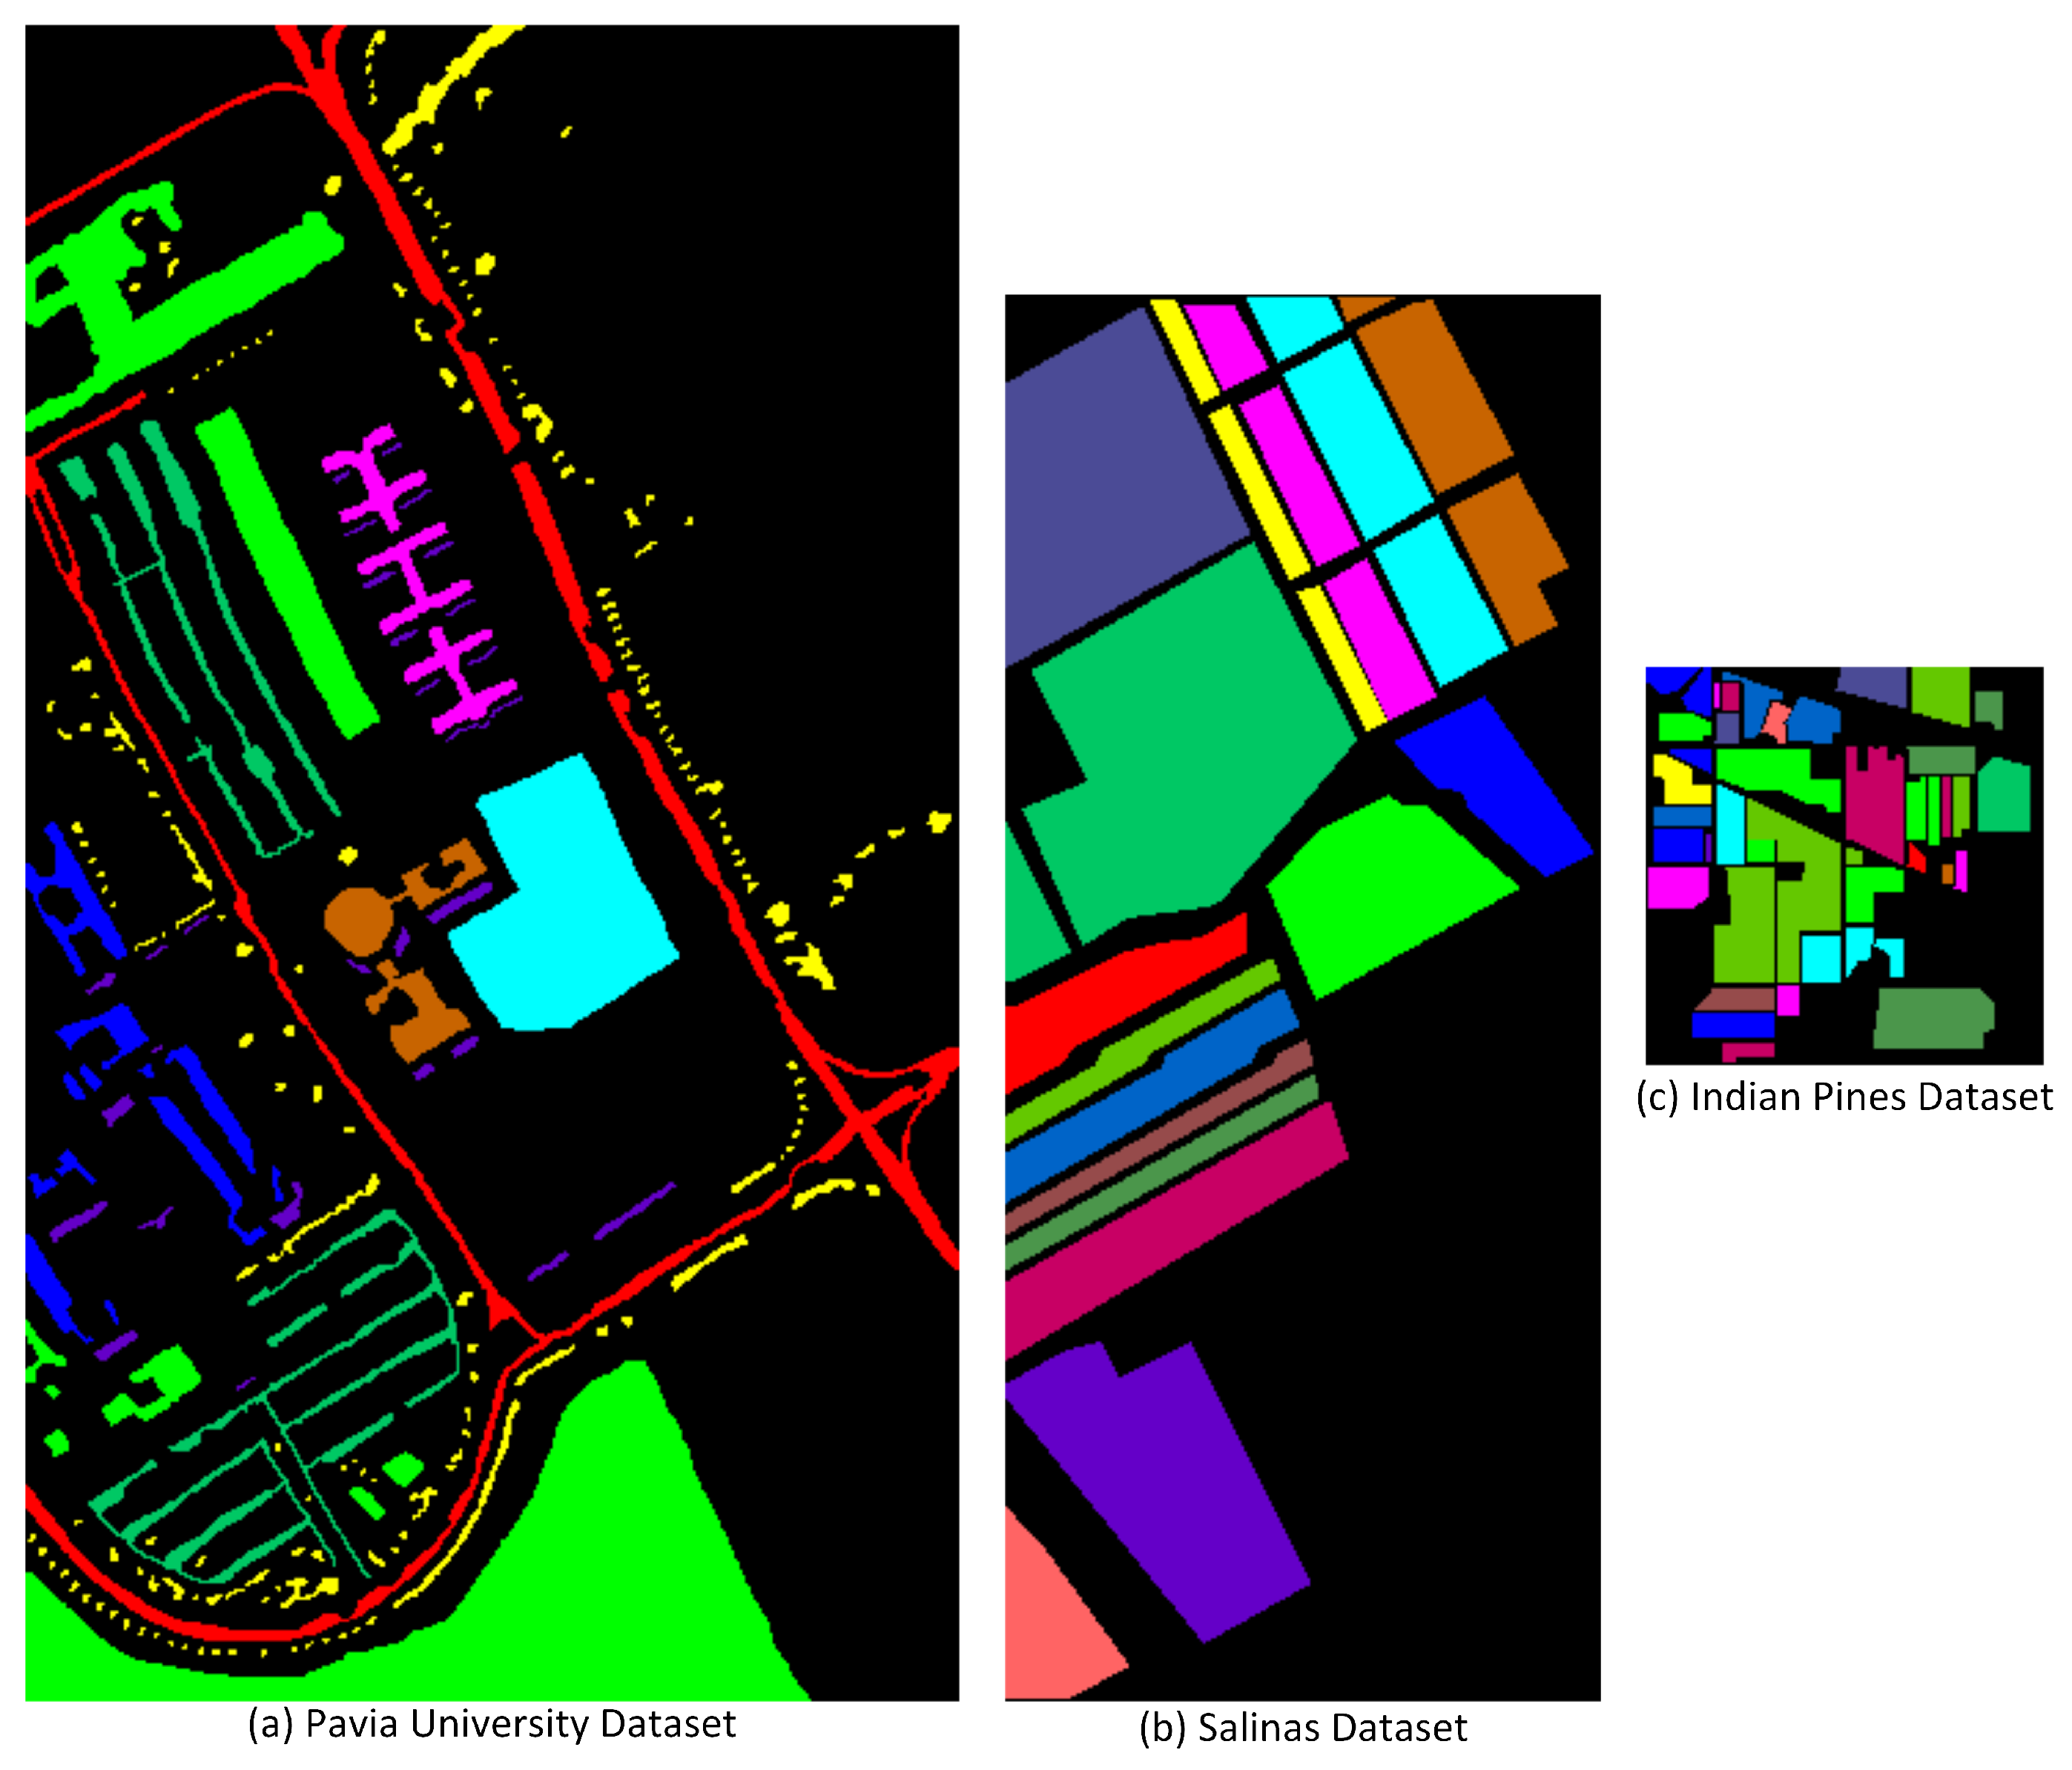
In this research, three datasets, namely, Pavia University Dataset (PUD), Salinas Dataset (SD), and Indian Pines Dataset (IPD) are used. The PUD was compiled over Pavia, northern Italy, though an optical sensor called a reflective-optics-system imaging-spectrometer (ROSIS). PUD images have a spatial resolution of 1.3 m with 103 spectral channels of size 610 × 610. There are nine classes in PUD.
High resolution spatial imagery (3.7 m) is a feature of the Hybrid-sparsity and Statistics-Detector (HS-SD), which was acquired by the 224 band AVIRIS camera over the Salinas Valley in California. The covered region consists of 217 samples along 512 lines. Twenty water absorption bands, including 108–112, 154–167, and 224, were discarded. There were only at-sensor radiance data for this photograph. Vegetables, barren soils, and grape fields are all included. Sixteen categories are included in the Salinas ground truth. Indian Pines is a dataset for segmenting HSI. The imagery of the source dataset contains 145 × 145 pixel HS bands covering a specific region in Indiana, United States. The data collection includes 220 reflectance bands, or wavelength ranges, for each pixel that represent various wavelength ranges of the electromagnetic-spectrum. There are a total of 16 classes in IPD. For visual understanding, Figure 1 illustrates the ground truth of all three datasets.
3. Proposed Methodology
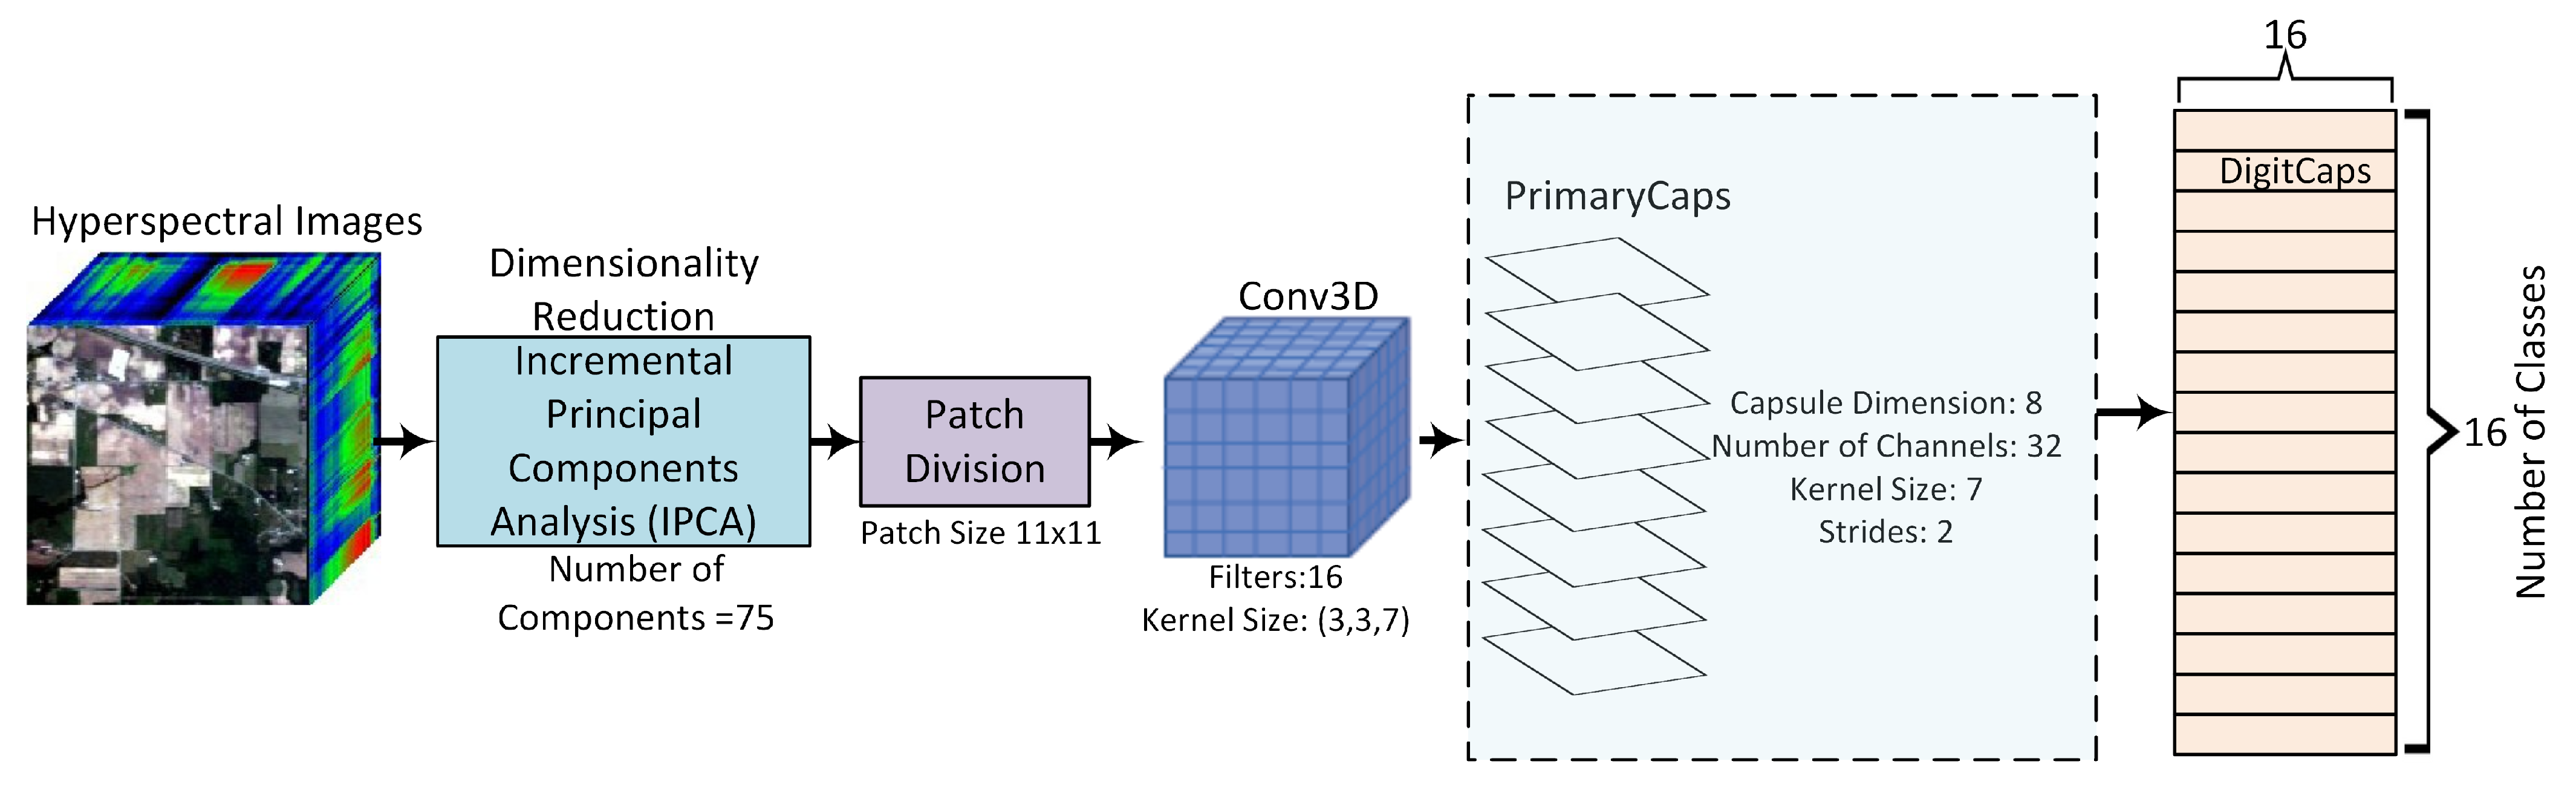
As demonstrated in Figure 2, in the proposed framework, the hyperspectral images are passed by IPCA to reduce the dimension and keep important information only. After this, the image is divided into 11 × 11 patches, which undergo a 3D convolution layer to extract shallow features. These extracted features are used by Capsule-Net to get classification done. The details regarding IPCA and Capsule-Net are discussed below.
3.1. IPCA
Principal Component Analysis (PCA) is a commonly used method and a topic that has received extensive scholarly attention. It is a method for reducing a set of correlated variables’ data dimensions. Numerous concepts and data mining activities are represented by a significant amount of data, so the feature reduction technique, PCA, was developed. As a result, PCA conveniently applies to the analysis of statistical data. This indicates that such a method is typically used as an offline batch procedure. However, PCA might be helpful when used with incrementally accessible data. Using an incremental algorithm with PCA can be applied to challenges involving pattern recognition. When it is practical for image features, IPCA is meant to maintain the restricted number of variables and alter its dimensionality. Using memory that is unrelated to the quantity of input size, IPCA creates a low-rank estimate for the input image.
3.2. Capsule-Net
Modern day technologies such as artificial intelligence (AI) and computer vision (CV) are paving the way for multiple applications that provide autonomous and intelligent systems [36]. Whether it is in the field of robotics, health, education, or transport industry, both AI and CV are playing their role in the development of top-notch intelligent systems [37]. Computer vision encompasses a variety of applications that further perform autonomous and intelligent processes, including object detection, image classification, image recognization, and natural language processing [38]. To meet these requirements of CV applications, multiple approaches are listed in the literature. The choice of researchers in such cases was using deep learning models, primarily convolutional neural networks (CNN) [39]. But as research progressed, options to complete computer vision tasks kept on changing, and a novel method was proposed by Hinton et al. (2017). They introduced the idea of capsule networks, which would ultimately be more effective than CNNs in many aspects. In CNNs, a layered type of structure is formed, and the model is trained using a large quantity of images from a dataset. The trained model efficiency is determined by testing the model on multiple test subjects. The information that is gathered by the CNN model is utilized in performing computer vision tasks [40]. However, a drawback that occurs in CNN models led to the designing of a new approach that can perform effectively in CV and AI applications. The inefficiency of the pooling function of CNN and the drawback that CNN require a larger quantity of data in the training process means labeling and acquiring such vast amounts of data is an arduous task [38]. Another inefficiency of the CNN model arises because there exists no spatial relationship between the features when they are extracted from an image using CNNs [41].
Capsule networks fill in the loopholes that are present in convolutional neural networks. First, CNNs have difficulty obtaining the spatial information due to ineffective pooling functions, but capsule networks can effectively obtain this information [41]. Furthermore, the dynamic routing approach is utilized in capsule nets. In a capsule network, capsules are used to take in input values, computation is performed on the given input values, and output is encapsulated as well. The inputs and outputs in a capsule network are in vector form, which is a major distinction from CNN, where both of them are in scalar form [42]. Information related to the disorientation and deformation that can exist in an image can be extracted using capsule nets, and this is another edge for which capsule nets excel over CNNs [38].
The utility of capsule networks arise as they are used as a subdivision in the neural network design. The input to a capsule network is the output from a CNN model. This input is given to a capsule in a network that produces an output vector form that comprises two values: vector values and probability [41]. A two-part structure is formed in a capsule network that consists of an encoder and a decoder. The encoder part in the structure further comprises three layers: convolution, digitcaps, and a primary layer. The decoder part in the structure has the ability to take input from the digitcaps layer of the encoder block and reconstruct an image by decoding the information obtained from the digitcaps layer [38,41]. In the first step, low-level features (LLFs) are obtained using CNN; these low-level features are used in the next stage where these LLF are provided as an input to the capsule network. By performing computations on these low-level features, the output of the capsule network comes out to be high-level features (HLFs). The obtained features in a vector form from a capsule network are provided to a denser layer [43]. The purpose of such an operation is simply to get valuable insight into what kind of information is present in the feature vector. The obtained information, which is simply a meaningful insight or a representation of a feature vector, is obtained in this way. Further, this insight and information is utilized to perform classification.
In order to calculate the input and output of the capsules in the vector form, a squashing function is utilized. This function is used in order to make sure that, if the vector is short, then its value should be zero, and in the case where the vector is long, its value should be one. This property ensures that the total length of a capsule remains in the range [0, 1]. A nonlinear squashing function is given below [41]:
In the above equation, is the output of the capsule in vector form, and r and are the inputs of the capsule.
Next, the marginal loss function is computed for each capsule as follows [43]:
The value of is 1 if the respective digitcaps will be present.
The structure of capsule networks comprises two convolutional layers (3D convolution layers in our case), and it also consists of a layer that is fully connected. The parameter used in the layers are similar to [41]. The output of this layer is given to the PrimaryCaps layer. The primary capsule has a total of 32 channels that consist of convolutional 8D capsules. The next layer, digitcaps, contains only one 16D capsule per digit class. This means that each of these capsules gets input from all the capsules of the PrimaryCaps layer [38]. As the routing is considered, the routing only exists between two layers that are adjacent to each other. These two layers are the PrimaryCaps and digitcaps layers [41].
3.3. Implementation Details
Four verification and validation, indices are provided, comprising overall accuracy (OA), average accuracy (AA), kappa statistics (), as well as the prediction accuracy of every land-cover category, to objectively examine the effectiveness of the suggested technique and other techniques for comparing. Each indicator’s higher value indicates a greater categorization effect.
We examined a variety of variables essential for optimizing, such as the patch size of the input cube and the amount of kernels of the 3D convolution layers, that have an impact on the training phase and classification accuracy. These parameters were selected using various experiments. The optimization variables were the patch size of the input image, the number of filters of the convolution layer, its kernel size, capsule dimension, number of channels, the kernel size of PrimaryCaps, and its strides.
4. Results and Discussion
Here, we contrast the classification results achieved using the suggested strategy based on Capsule-Net with those acquired using alternative deep learning-based techniques, such as DSVM, DCNN, CNN, R-VCA, and 3DCNN. In order to enhance the HSI categorization, DSVM attempts to employ a number of filters in the deep SVM classifier, including the logarithmic radial base function (rbf) and the normal distribution rbf. The CNN model seeks to carry out the HSI categorization by taking into account both spectral information and geographical context. Triplet loss is used by DCNN to enhance HSI categorization. R-VCA uses a vertex curve fitting network with rolling guiding filter to include geographical data and spectral features into the classification process. The spatial and spectral information are taken into consideration concurrently by CNN using a 3D convolution layer.
The achieved performance by different classes of the Indian Pines HSI are reported in Table 1. These findings demonstrate that the suggested network, based on Capsule-Net, outperforms alternative deep learning-based approaches in terms of classification accuracies. Table 2 shows the performance for the SV, UP, and IP datasets. It is feasible to see that the proposed approach offers the best overall results as well as the highest accuracy values. The achieved results show that the suggested method offers a notable quantitative improvement, showing that the suggested spectral–spatial framework can produce more unique characteristics to successfully classify remotely sensed HSIs, achieving the highest detection accuracy for all the tests carried out.
The suggested approach may incorporate more 3D volume locations as the network depth rises thanks to the structure of the network, which keeps increasing the feature map dimension by including the Caps-Net when compared with normal CNN. This fact ultimately encourages the discovery of a wider range of high-level spectral–spatial features, evenly distributing the workload between many units to speed up network training and also enabling the model to lessen the weakening phenomenon when taking significantly deep networks into account. We can draw the conclusion that the suggested methodology is more able to exploit the spectral–spatial data present in an HSI data cube and maintain strong quantitative performance with tiny kernel spatial sizes based on the published results with distinct HSI datasets.
5. Conclusions
Due to the high levels of similarity between classes and the high levels of intra-class variation, HSI classification is a difficult undertaking. In this research, we have put forward a Capsule-Net based architecture for HSI classification. The benefit of this strategy is that it only requires a minimal number of tagged samples to be effective. The proposed model can also extract pertinent features while still maintaining the valuable spatial–spectral data for categorization. The challenges of significant intra-class variation and inter-class similarities are being addressed by using spatial–spectral data from 3D Capsule-Net. In the research, this strategy is demonstrated to rapidly and effectively increase classification results. Moreover, it is shown that the HSI classification method can be expanded to include the main high contextual classification task.
Author Contributions
Conceptualization: J.R. and Y.J.; methodology: J.R. and Y.J.; software: J.R. and Y.J.; validation: J.R. and Y.J.; investigation: J.R. and Y.J.; writing—original draft preparation:J.R. and Y.J.; writing—review and editing: J.R. and Y.J.; supervision: J.R. All authors have read and agreed to the published version of the manuscript.
Funding
This work was supported by the National Research Foundation of Korea(NRF) grant funded by the Korea government(MSIT) (No. 2020R1A2C2005612).
Institutional Review Board Statement
Not Applicable.
Informed Consent Statement
Not Applicable.
Data Availability Statement
Not Applicable.
Conflicts of Interest
The authors declare no conflict of interest. The funders had no role in the design of the study; in the collection, analyses, or interpretation of data; in the writing of the manuscript, or in the decision to publish the results.
References
- Bioucas-Dias, J.M.; Plaza, A.; Camps-Valls, G.; Scheunders, P.; Nasrabadi, N.; Chanussot, J. Hyperspectral remote sensing data analysis and future challenges. IEEE Geosci. Remote Sens. Mag. 2013, 1, 6–36. [Google Scholar] [CrossRef] [Green Version]
- Gevaert, C.M.; Suomalainen, J.; Tang, J.; Kooistra, L. Generation of spectral–temporal response surfaces by combining multispectral satellite and hyperspectral UAV imagery for precision agriculture applications. IEEE J. Sel. Top. Appl. Earth Obs. Remote Sens. 2015, 8, 3140–3146. [Google Scholar] [CrossRef]
- Noor, S.S.M.; Michael, K.; Marshall, S.; Ren, J.; Tschannerl, J.; Kao, F. The properties of the cornea based on hyperspectral imaging: Optical biomedical engineering perspective. In Proceedings of the 2016 International Conference on Systems, Signals and Image Processing (IWSSIP), Sofia, Bulgaria, 1–3 June 2016; pp. 1–4. [Google Scholar]
- Wang, J.; Zhang, L.; Tong, Q.; Sun, X. The Spectral Crust project—Research on new mineral exploration technology. In Proceedings of the 2012 4th Workshop on Hyperspectral Image and Signal Processing: Evolution in Remote Sensing (WHISPERS), Shanghai, China, 11 August 2012; pp. 1–4. [Google Scholar]
- Fong, A.; Shu, G.; McDonogh, B. Farm to Table: Applications for New Hyperspectral Imaging Technologies in Precision Agriculture, Food Quality and Safety. In Proceedings of the CLEO: Applications and Technology, Optical Society of America, Washington, DC, USA, 10–15 May 2020; p. AW3K-2. [Google Scholar]
- Ardouin, J.P.; Lévesque, J.; Rea, T.A. A demonstration of hyperspectral image exploitation for military applications. In Proceedings of the 2007 10th International Conference on Information Fusion, Quebec, QC, Canada, 9–12 July 2007; pp. 1–8. [Google Scholar]
- Sun, L.; He, C.; Zheng, Y.; Tang, S. SLRL4D: Joint Restoration of S ubspace L ow-R ank L earning and Non-Local 4-D Transform Filtering for Hyperspectral Image. Remote Sens. 2020, 12, 2979. [Google Scholar] [CrossRef]
- He, C.; Sun, L.; Huang, W.; Zhang, J.; Zheng, Y.; Jeon, B. TSLRLN: Tensor subspace low-rank learning with non-local prior for hyperspectral image mixed denoising. Signal Process. 2021, 184, 108060. [Google Scholar] [CrossRef]
- Yang, S.; Shi, Z. Hyperspectral image target detection improvement based on total variation. IEEE Trans. Image Process. 2016, 25, 2249–2258. [Google Scholar] [CrossRef] [PubMed]
- Sun, L.; Wu, Z.; Liu, J.; Xiao, L.; Wei, Z. Supervised spectral–spatial hyperspectral image classification with weighted Markov random fields. IEEE Trans. Geosci. Remote Sens. 2014, 53, 1490–1503. [Google Scholar] [CrossRef]
- Sun, L.; Ma, C.; Chen, Y.; Zheng, Y.; Shim, H.J.; Wu, Z.; Jeon, B. Low rank component induced spatial-spectral kernel method for hyperspectral image classification. IEEE Trans. Circuits Syst. Video Technol. 2019, 30, 3829–3842. [Google Scholar] [CrossRef]
- Sun, L.; Ma, C.; Chen, Y.; Shim, H.J.; Wu, Z.; Jeon, B. Adjacent superpixel-based multiscale spatial-spectral kernel for hyperspectral classification. IEEE J. Sel. Top. Appl. Earth Obs. Remote Sens. 2019, 12, 1905–1919. [Google Scholar] [CrossRef]
- Zhang, M.L.; Zhou, Z.H. ML-KNN: A lazy learning approach to multi-label learning. Pattern Recognit. 2007, 40, 2038–2048. [Google Scholar] [CrossRef] [Green Version]
- Xue, W.; Zhang, L.; Mou, X.; Bovik, A.C. Gradient magnitude similarity deviation: A highly efficient perceptual image quality index. IEEE Trans. Image Process. 2013, 23, 684–695. [Google Scholar] [CrossRef]
- Belgiu, M.; Drăguţ, L. Random forest in remote sensing: A review of applications and future directions. ISPRS J. Photogramm. Remote Sens. 2016, 114, 24–31. [Google Scholar] [CrossRef]
- Wang, Z.; Du, B.; Guo, Y. Domain adaptation with neural embedding matching. IEEE Trans. Neural Netw. Learn. Syst. 2019, 31, 2387–2397. [Google Scholar] [CrossRef] [PubMed]
- Rehman, M.U.; Akhtar, S.; Zakwan, M.; Mahmood, M.H. Novel architecture with selected feature vector for effective classification of mitotic and non-mitotic cells in breast cancer histology images. Biomed. Signal Process. Control 2022, 71, 103212. [Google Scholar] [CrossRef]
- Hinton, G.E.; Salakhutdinov, R.R. Reducing the dimensionality of data with neural networks. Science 2006, 313, 504–507. [Google Scholar] [CrossRef] [Green Version]
- Babu Naik, G.; Ameta, P.; Baba Shayeer, N.; Rakesh, B.; Kavya Dravida, S. Convolutional Neural Network Based on Self-Driving Autonomous Vehicle (CNN). In Innovative Data Communication Technologies and Application; Springer: Berlin/Heidelberg, Germany, 2022; pp. 929–943. [Google Scholar]
- Rehman, M.U.; Cho, S.; Kim, J.; Chong, K.T. Brainseg-net: Brain tumor mr image segmentation via enhanced encoder–decoder network. Diagnostics 2021, 11, 169. [Google Scholar] [CrossRef]
- Rehman, M.U.; Cho, S.; Kim, J.H.; Chong, K.T. Bu-net: Brain tumor segmentation using modified u-net architecture. Electronics 2020, 9, 2203. [Google Scholar] [CrossRef]
- Rehman, M.U.; Tayara, H.; Chong, K.T. DL-m6A: Identification of N6-methyladenosine Sites in Mammals using deep learning based on different encoding schemes. IEEE/ACM Trans. Comput. Biol. Bioinform. 2022. [Google Scholar] [CrossRef]
- Bensalah, N.; Ayad, H.; Adib, A.; Ibn El Farouk, A. CRAN: An hybrid CNN-RNN attention-based model for Arabic machine translation. In Networking, Intelligent Systems and Security; Springer: Berlin/Heidelberg, Germany, 2022; pp. 87–102. [Google Scholar]
- Paoletti, M.; Haut, J.; Plaza, J.; Plaza, A. A new deep convolutional neural network for fast hyperspectral image classification. ISPRS J. Photogramm. Remote Sens. 2018, 145, 120–147. [Google Scholar] [CrossRef]
- Cheng, G.; Li, Z.; Han, J.; Yao, X.; Guo, L. Exploring hierarchical convolutional features for hyperspectral image classification. IEEE Trans. Geosci. Remote Sens. 2018, 56, 6712–6722. [Google Scholar] [CrossRef]
- Mughees, A.; Tao, L. Multiple deep-belief-network-based spectral-spatial classification of hyperspectral images. Tsinghua Sci. Technol. 2018, 24, 183–194. [Google Scholar] [CrossRef]
- Schuster, M.; Paliwal, K.K. Bidirectional recurrent neural networks. IEEE Trans. Signal Process. 1997, 45, 2673–2681. [Google Scholar] [CrossRef] [Green Version]
- Chen, Y.; Lin, Z.; Zhao, X.; Wang, G.; Gu, Y. Deep learning-based classification of hyperspectral data. IEEE J. Sel. Top. Appl. Earth Obs. Remote Sens. 2014, 7, 2094–2107. [Google Scholar] [CrossRef]
- Sellami, A.; Abbes, A.B.; Barra, V.; Farah, I.R. Fused 3-D spectral-spatial deep neural networks and spectral clustering for hyperspectral image classification. Pattern Recognit. Lett. 2020, 138, 594–600. [Google Scholar] [CrossRef]
- Chen, Y.; Zhao, X.; Jia, X. Spectral–spatial classification of hyperspectral data based on deep belief network. IEEE J. Sel. Top. Appl. Earth Obs. Remote Sens. 2015, 8, 2381–2392. [Google Scholar] [CrossRef]
- Roy, S.K.; Krishna, G.; Dubey, S.R.; Chaudhuri, B.B. HybridSN: Exploring 3-D–2-D CNN feature hierarchy for hyperspectral image classification. IEEE Geosci. Remote Sens. Lett. 2019, 17, 277–281. [Google Scholar] [CrossRef] [Green Version]
- Zhong, Z.; Li, J.; Luo, Z.; Chapman, M. Spectral–spatial residual network for hyperspectral image classification: A 3-D deep learning framework. IEEE Trans. Geosci. Remote Sens. 2017, 56, 847–858. [Google Scholar] [CrossRef]
- Paoletti, M.E.; Haut, J.M.; Fernandez-Beltran, R.; Plaza, J.; Plaza, A.J.; Pla, F. Deep pyramidal residual networks for spectral–spatial hyperspectral image classification. IEEE Trans. Geosci. Remote Sens. 2018, 57, 740–754. [Google Scholar] [CrossRef]
- Wang, W.; Dou, S.; Jiang, Z.; Sun, L. A fast dense spectral–spatial convolution network framework for hyperspectral images classification. Remote Sens. 2018, 10, 1068. [Google Scholar] [CrossRef] [Green Version]
- Liu, Q.; Wu, Z.; Du, Q.; Xu, Y.; Wei, Z. Multiscale alternately updated clique network for hyperspectral image classification. IEEE Trans. Geosci. Remote Sens. 2021, 60, 1–15. [Google Scholar] [CrossRef]
- Zhang, C.; Lu, Y. Study on artificial intelligence: The state of the art and future prospects. J. Ind. Inf. Integr. 2021, 23, 100224. [Google Scholar] [CrossRef]
- Kakani, V.; Nguyen, V.H.; Kumar, B.P.; Kim, H.; Pasupuleti, V.R. A critical review on computer vision and artificial intelligence in food industry. J. Agric. Food Res. 2020, 2, 100033. [Google Scholar] [CrossRef]
- Patrick, M.K.; Adekoya, A.F.; Mighty, A.A.; Edward, B.Y. Capsule networks–a survey. J. King Saud-Univ.-Comput. Inf. Sci. 2022, 34, 1295–1310. [Google Scholar]
- Sun, W.; Zhao, H.; Jin, Z. A facial expression recognition method based on ensemble of 3D convolutional neural networks. Neural Comput. Appl. 2019, 31, 2795–2812. [Google Scholar] [CrossRef]
- Lou, G.; Shi, H. Face image recognition based on convolutional neural network. China Commun. 2020, 17, 117–124. [Google Scholar] [CrossRef]
- Sabour, S.; Frosst, N.; Hinton, G.E. Dynamic routing between capsules. In Proceedings of the Advances in Neural Information Processing Systems 30: Annual Conference on Neural Information Processing Systems 2017, Long Beach, CA, USA, 4–9 December 2017; Volume 30. [Google Scholar]
- Xiang, C.; Zhang, L.; Tang, Y.; Zou, W.; Xu, C. MS-CapsNet: A novel multi-scale capsule network. IEEE Signal Process. Lett. 2018, 25, 1850–1854. [Google Scholar] [CrossRef]
- Rehman, M.U.; Tayara, H.; Zou, Q.; Chong, K.T. i6mA-Caps: A CapsuleNet-based framework for identifying DNA N6-methyladenine sites. Bioinformatics 2022, 38, 3885–3891. [Google Scholar] [CrossRef]
Figure 1.
Ground truth of datasets.

Figure 2.
Visual salience based proposed framework for no-reference image quality assessment.


Table 1.
Performance by different classes of the Indian Pines HSI.
| Class | Models | |||||
|---|---|---|---|---|---|---|
| DSVM | DCNN | CNN | R-VCA | 3DCNN | Proposed | |
| C1 | 88.22 | 94.21 | 93.41 | 95.02 | 94.46 | 84.2 |
| C2 | 92.31 | 95.41 | 96.80 | 94.91 | 92.19 | 98.6 |
| C3 | 95.12 | 96.98 | 95.26 | 97.36 | 98.05 | 100 |
| C4 | 95.96 | 97.56 | 93.82 | 96.99 | 97.09 | 98.9 |
| C5 | 97.03 | 95.11 | 96.22 | 94.78 | 92.16 | 100 |
| C6 | 83.03 | 96.51 | 94.02 | 98.89 | 95.10 | 100 |
| C7 | 89.64 | 95.63 | 95.04 | 96.14 | 94.06 | 100 |
| C8 | 92.03 | 97.10 | 98.01 | 95.31 | 98.91 | 100 |
| C9 | 96.12 | 94.12 | 97.02 | 93.36 | 97.03 | 87.5 |
| C10 | 91.22 | 91.85 | 98.04 | 94.21 | 94.02 | 99.2 |
| C11 | 85.13 | 93.45 | 95.32 | 94.21 | 95.21 | 99.6 |
| C12 | 91.12 | 89.48 | 86.14 | 92.14 | 95.03 | 100 |
| C13 | 86.12 | 94.25 | 94.06 | 93.84 | 96.21 | 100 |
| C14 | 95.01 | 93.85 | 97.13 | 94.96 | 96.12 | 99.4 |
| C15 | 95.02 | 94.61 | 95.23 | 95.95 | 94.18 | 99.4 |
| C16 | 92.38 | 96.85 | 96.10 | 95.91 | 95.19 | 100 |
Table 2.
Performance comparison of proposed framework with existing techniques.
| Parameter | Indian Pine Dataset (IPD) | |||||
|---|---|---|---|---|---|---|
| DSVM | DCNN | CNN | R-VCA | 3DCNN | Proposed | |
| OA | 92.24 | 94.86 | 94.99 | 94.26 | 96.54 | 99.41 |
| AA | 92.13 | 96.72 | 94.81 | 94.08 | 96.47 | 97.93 |
| 92.25 | 94.78 | 94.85 | 94.18 | 96.40 | 99.33 | |
| Parameter | Salinas Dataset (SD) | |||||
| DSVM | DCNN | CNN | R-VCA | 3DCNN | Proposed | |
| OA | 95.12 | 96.56 | 97.12 | 96.74 | 96.36 | 98.91 |
| AA | 95.02 | 96.31 | 97.03 | 96.61 | 96.22 | 99.44 |
| 95.07 | 96.30 | 97.15 | 96.47 | 96.28 | 98.785 | |
| Parameter | Pavia University Dataset (PUD) | |||||
| DSVM | DCNN | CNN | R-VCA | 3DCNN | Proposed | |
| OA | 92.24 | 94.86 | 94.99 | 94.26 | 96.54 | 99.74 |
| AA | 92.13 | 96.72 | 94.81 | 94.08 | 96.47 | 99.51 |
| 92.25 | 94.78 | 94.85 | 94.18 | 96.40 | 99.66 | |
Publisher’s Note: MDPI stays neutral with regard to jurisdictional claims in published maps and institutional affiliations. |
© 2022 by the authors. Licensee MDPI, Basel, Switzerland. This article is an open access article distributed under the terms and conditions of the Creative Commons Attribution (CC BY) license (https://creativecommons.org/licenses/by/4.0/).
Share and Cite
MDPI and ACS Style
Ryu, J.; Jang, Y. Hyperspectral Image Classification Using 3D Capsule-Net Based Architecture. Appl. Sci. 2022, 12, 11299. https://doi.org/10.3390/app122111299
AMA Style
Ryu J, Jang Y. Hyperspectral Image Classification Using 3D Capsule-Net Based Architecture. Applied Sciences. 2022; 12(21):11299. https://doi.org/10.3390/app122111299
Chicago/Turabian StyleRyu, Jihyoung, and Yeongmin Jang. 2022. "Hyperspectral Image Classification Using 3D Capsule-Net Based Architecture" Applied Sciences 12, no. 21: 11299. https://doi.org/10.3390/app122111299
Note that from the first issue of 2016, this journal uses article numbers instead of page numbers. See further details here.