

Analysis of Influencing Characteristics of Biochars for Ammonium Adsorption


1
Division of Sustainable Environment and Construction, Mälardalen University, 722 23 Västerås, Sweden
2
School of Science and Technology, Örebro University, 701 82 Örebro, Sweden
*
Author to whom correspondence should be addressed.
Appl. Sci. 2022, 12(19), 9487; https://doi.org/10.3390/app12199487
Submission received: 16 August 2022
/
Revised: 10 September 2022
/
Accepted: 13 September 2022
/
Published: 21 September 2022
(This article belongs to the Special Issue Biochar: Preparation, Properties and Applications)
Abstract
:This article summarizes and performs a systematic analysis using experimental results from recent research on ammonium recovery from aqueous sources using biochar. Numerous studies have focused on using different materials to produce biochar adsorbents, and many have attempted to draw conclusions about the physical or chemical characteristics that dominate the adsorption to infer the mechanism. However, to date, there has not been statistical analysis performed on a large set of adsorption data and physical/chemical characteristics of chars to be able to draw conclusions about ammonium adsorption mechanisms. From this analysis, it was found that consistency in experimental methods and characteristic measurement reporting is lacking, and therefore it is difficult to perform metadata analysis and draw conclusions about ammonium adsorption on biochar. Among the important factors influencing ammonia recovery proposed in literature, the meta-analysis only strongly supports the effect of BET surface area and NH4+ concentration, with weaker support for the importance of cation exchange capacity and pyrolysis temperature. This suggests that standard procedures for biochar production, experiments and analysis of physical and chemical characteristics are needed to usefully compare results across different studies. Examples of the present difficulty in identifying trends across studies are shown by comparing clusters in the data identified by the analysis. The ability to make such comparisons would provide clearer direction in how best to further improve the adsorption capacity of biochars.
1. Introduction
The ammonium ion (NH4+) is one of the most concentrated species of inorganic nitrogen in wastewater, originating from human urine (4 g/L [1]), fertilizer runoff (1 kg/ha*year [2]) and agricultural slurries (1.7–2.5 g/L [3]). As ammonium is a main ingredient used to produce many fertilizers, its abundance in wastewater streams calls for recovery attempts to be made to decrease the proportion of ammonium produced by the energy and resource intensive Haber –Bosch process. Nitrogen recovery from waste streams is a popular topic, with a race in research to find technology that allows for efficient nitrogen recovery with low energy requirements and minimal material costs [4]. Popular techniques include physical removal (using filters, membranes, adsorbents), biological (transformation using metabolic pathways of bacteria or algae) and chemical separation (precipitation from solution through the formation of struvite). One technique with low energy requirements and simple implementation is adsorption, where ammonium ions can be attached to material by means of bonding to the removal surface. Adsorption mechanisms may include electrostatic attraction, ion exchange, physical entrapment, chemical bonding with surface functional groups, and precipitation. Biochar, the solid product from pyrolysis, has been targeted as an adsorbent of interest as it allows for the valorization of waste products like agricultural, municipal, and industrial wastes, creating a circular economy. Biochar can be used for carbon sequestration and is estimated to be able to reduce net emissions of carbon dioxide, methane and nitrous oxide by 12% per year when used in soil [5]. It has variable surface area, surface functional groups, charge, etc. that are dependent on feedstock origins and characteristics, as well as process conditions. Pyrolysis temperature has been linked to pore volume, surface area, surface pH, cation exchange capacity, ash, carbon and volatile content among other parameters [6]. Using biochar as an adsorbent can allow for the production of either liquid or solid fertilizers. To produce a liquid fertilizer, ammonium can be bound to the surface and then desorbed and concentrated using additional methods. If the ammonium is bound strongly to the biochar surface, the loaded biochar can be used as a solid fertilizer, as the sorbed ammonium has been shown to be bio-available [7]. Aluminum-silicate materials such as zeolite have shown to be useful in full scale wastewater applications for ammonium recovery since the 1990s [8] due to their inherent affinity for ammonium, adsorption capacity, and ability to desorb and be regenerated into reusable adsorbents. Biochar has shown to have much less efficient desorption when compared to zeolite [9]; therefore, it may be used as a solid fertilizer after adsorption instead.
As biochar is such a diverse material, with properties depending on material, process conditions and treatments, the range of ammonium adsorptions recorded is vast. Even so, the potential for circular economy connection agriculture and wastewater treatment is interesting [10]. Some individual studies have reported ammonium adsorption as high as 137.3 mgNH4+/g biochar [11], and others have reported less than 1 mgNH4+/g biochar [12], but most have not been corroborated with more than one study using the exact same conditions and materials. Many studies have tried to vary biochar processing conditions using different materials to optimize adsorption of ammonium, but the analysis of the physical and chemical characteristics chosen in literature is not consistent. It is therefore difficult to compare different results from different studies, and to draw conclusions about what specific characteristics are responsible for increasing or decreasing ammonium adsorption capacity. This article provides an overview of experimental studies using biochar to adsorb ammonium, including an analysis of physical and chemical characteristics to determine the most important factors that influence adsorption capacity.
2. Materials and Methods
2.1. Literature Study and Data Selection
A literature study was performed using Google Scholar and the keywords biochar, nitrogen, ammonium, and adsorption. Articles with clearly reported experimental adsorption capacities that were published from 2013–2022 were used for data collection of different physical and chemical biochar characteristics. In addition, 54 independent research articles were found that had experimentally tested biochar for ammonium adsorption from aqueous solutions. The data from these studies were compared using expectation maximization implemented in Python for data imputation and scikit-learn for principal component analysis and GraphPad Prism to discover trends and relationships between various parameters and the adsorption capacity. All data were fact-checked by calculating the theoretical maximum ammonium adsorption (as defined below) and comparing that value with the reported actual ammonium adsorbed. In some cases, the reported ammonium adsorption was higher than the theoretical maximum; these cases were excluded from analysis.
As an additional calculation of efficiency, a “percent of maximum adsorption capacity” was included. This was calculated by comparing the actual adsorption capacity (experimentally determined) with the theoretical maximum adsorption capacity that was calculated from the fact check above.
Twenty articles had to be excluded from analysis due to missing information that prevented fact checking or conflicting information reported within the study. For example, the study by Wong, Weber, and Ogbonnaya [13] did not include the volume of ammonium solution and grams of biochar used in their experiments, so the theoretical maximum could not be calculated and compared with the reported adsorption capacity. Others such as Gao et al. [14] were removed because they did not report any physical or chemical characteristics of the biochar and therefore did not have enough information to be included in the analysis. A few studies like the one by Liu et al. [15] reported an adsorption capacity that was higher than the theoretical maximum that was calculated using the equation above; therefore, it was not included in this analysis. The inconsistency of analysis provided by the various research studies required pairing down of the data into subsets and thus not all the influencing factors could be compared at one time. Thirty-four articles containing experimental data for ammonium adsorption onto biochar were used for analysis [12,16,17,18,19,20,21,22,23,24,25,26,27,28,29,30,31,32,33,34,35,36,37,38,39,40,41,42,43,44,45,46,47,48,49].
2.2. Expectation Maximization
To determine which variables may be correlated with an increase in adsorption capacity, the Pearson correlation coefficient was computed between adsorption capacity and all other variables of interest. This implicitly assumes that all measured variables are drawn from a multivariate normal distribution. Though this is an unrealistic assumption for the physical processes involved, it should serve well for identifying which variables are important to investigate further. However, only some of the variables of interest are considered by individual studies in the literature and, as a result, much of the data are missing. Many methods for handling missing data in statistical analyses have been proposed; we perform maximum likelihood estimation using expectation maximization (EM) [50]. EM is an iterative algorithm which provides better estimates than simpler methods such as mean imputation [51].
Each set of reported measurements is treated as a vector in . The set of N reported measurements from the literature is denoted where . However, as mentioned, only some elements of this vector are observed by every reference work.
Assuming that the data are drawn from a multivariate normal distribution, EM was used to obtain an iterative maximum likelihood estimate of the mean and covariance of this distribution. Then, the maximum likelihood estimate of the covariance was used to calculate pairwise correlations between adsorption capacity and the other variables of interest.
Let the set of indices of measurements available in reference work be , and the set of indices of measurements missing in reference work be . Let denote the variables which are available from reference work , and the variables which are missing from reference work .
Let
be the likelihood of parameters and given the observations, where is the probability density of of . The maximum likelihood estimate of the distribution parameters can be determined by maximizing the marginal likelihood of the data available from the reference works:
Given an initial estimate and , the EM-algorithm is typically broken into two steps. The expectation step where we define as the expected value of the log-likelihood
and the maximization step where the distribution parameters are updated:
Under the assumption that is a multivariate normal random variable, this simplifies to the following procedure:
- Begin with an initial estimate ;
- For every reference work , impute the missing data with the mean of the conditional distribution , explicitly:
- Compute an updated estimate of the distribution parameters . Specifically, if with we denote the data from reference work with imputed data from the parameters in step , thenand
- Repeat Steps 2 and 3 until convergence.
The converged parameters can be used to directly perform some analysis; for example, principal components can be determined from the eigenvectors of the covariance matrix. This approach was first proposed in [52] and has proven to be a reliable method for efficient principle component analysis, which naturally accommodates missing information in multiple applications [53,54]. However, using the converged parameters for conditional mean imputation and then performing principal component analysis (PCA) using the imputed data produces nearly identical results but has the benefit of making visual inspection through loading biplots possible. For this reason, the imputed data were used to perform PCA. The imputation, however, is only used as a mechanism to permit analysis using techniques that are not generally amenable to missing data. Strong conclusions concerning variables that are reported in few studies and thus consist primarily of imputed data should thus be avoided.
In total, observations were collected from literature. Of the possible 9200 observations, 4408 were missing. Initial analysis was carried out using the full set of observations . However, the degree of non-Gaussianity in the full data combined with the weakness of anticipated trends made this approach inconclusive at best. The analysis was thus restricted to key variables that have been identified in literature as significant influencers of ammonia adsorption (Table 1). This reduced the number of dimensions in the problem from 40 to 9.
All variables were standardized using the available observations. Denote the variable in literature reference by ,
where denotes the mean of available observations of variable , and denotes the variance of available observations of variable :
Here, denotes the Iverson bracket.
Once normalized, the EM algorithm was run using (which is known a priori due to the standardization) and using samples of drawn from an inverse Wishart distribution with the same number of degrees of freedom as variables considered and the identity matrix as a scale parameter. The converged covariance estimates using the whole data set did not differ significantly with different initial values of . As such, in the interest of reproducibility, the initial estimate was fixed to . The same procedure was carried out using subsets containing only data from agricultural waste () and wood ()—the two largest subsets of material types in the collected data.
3. Results and Discussion
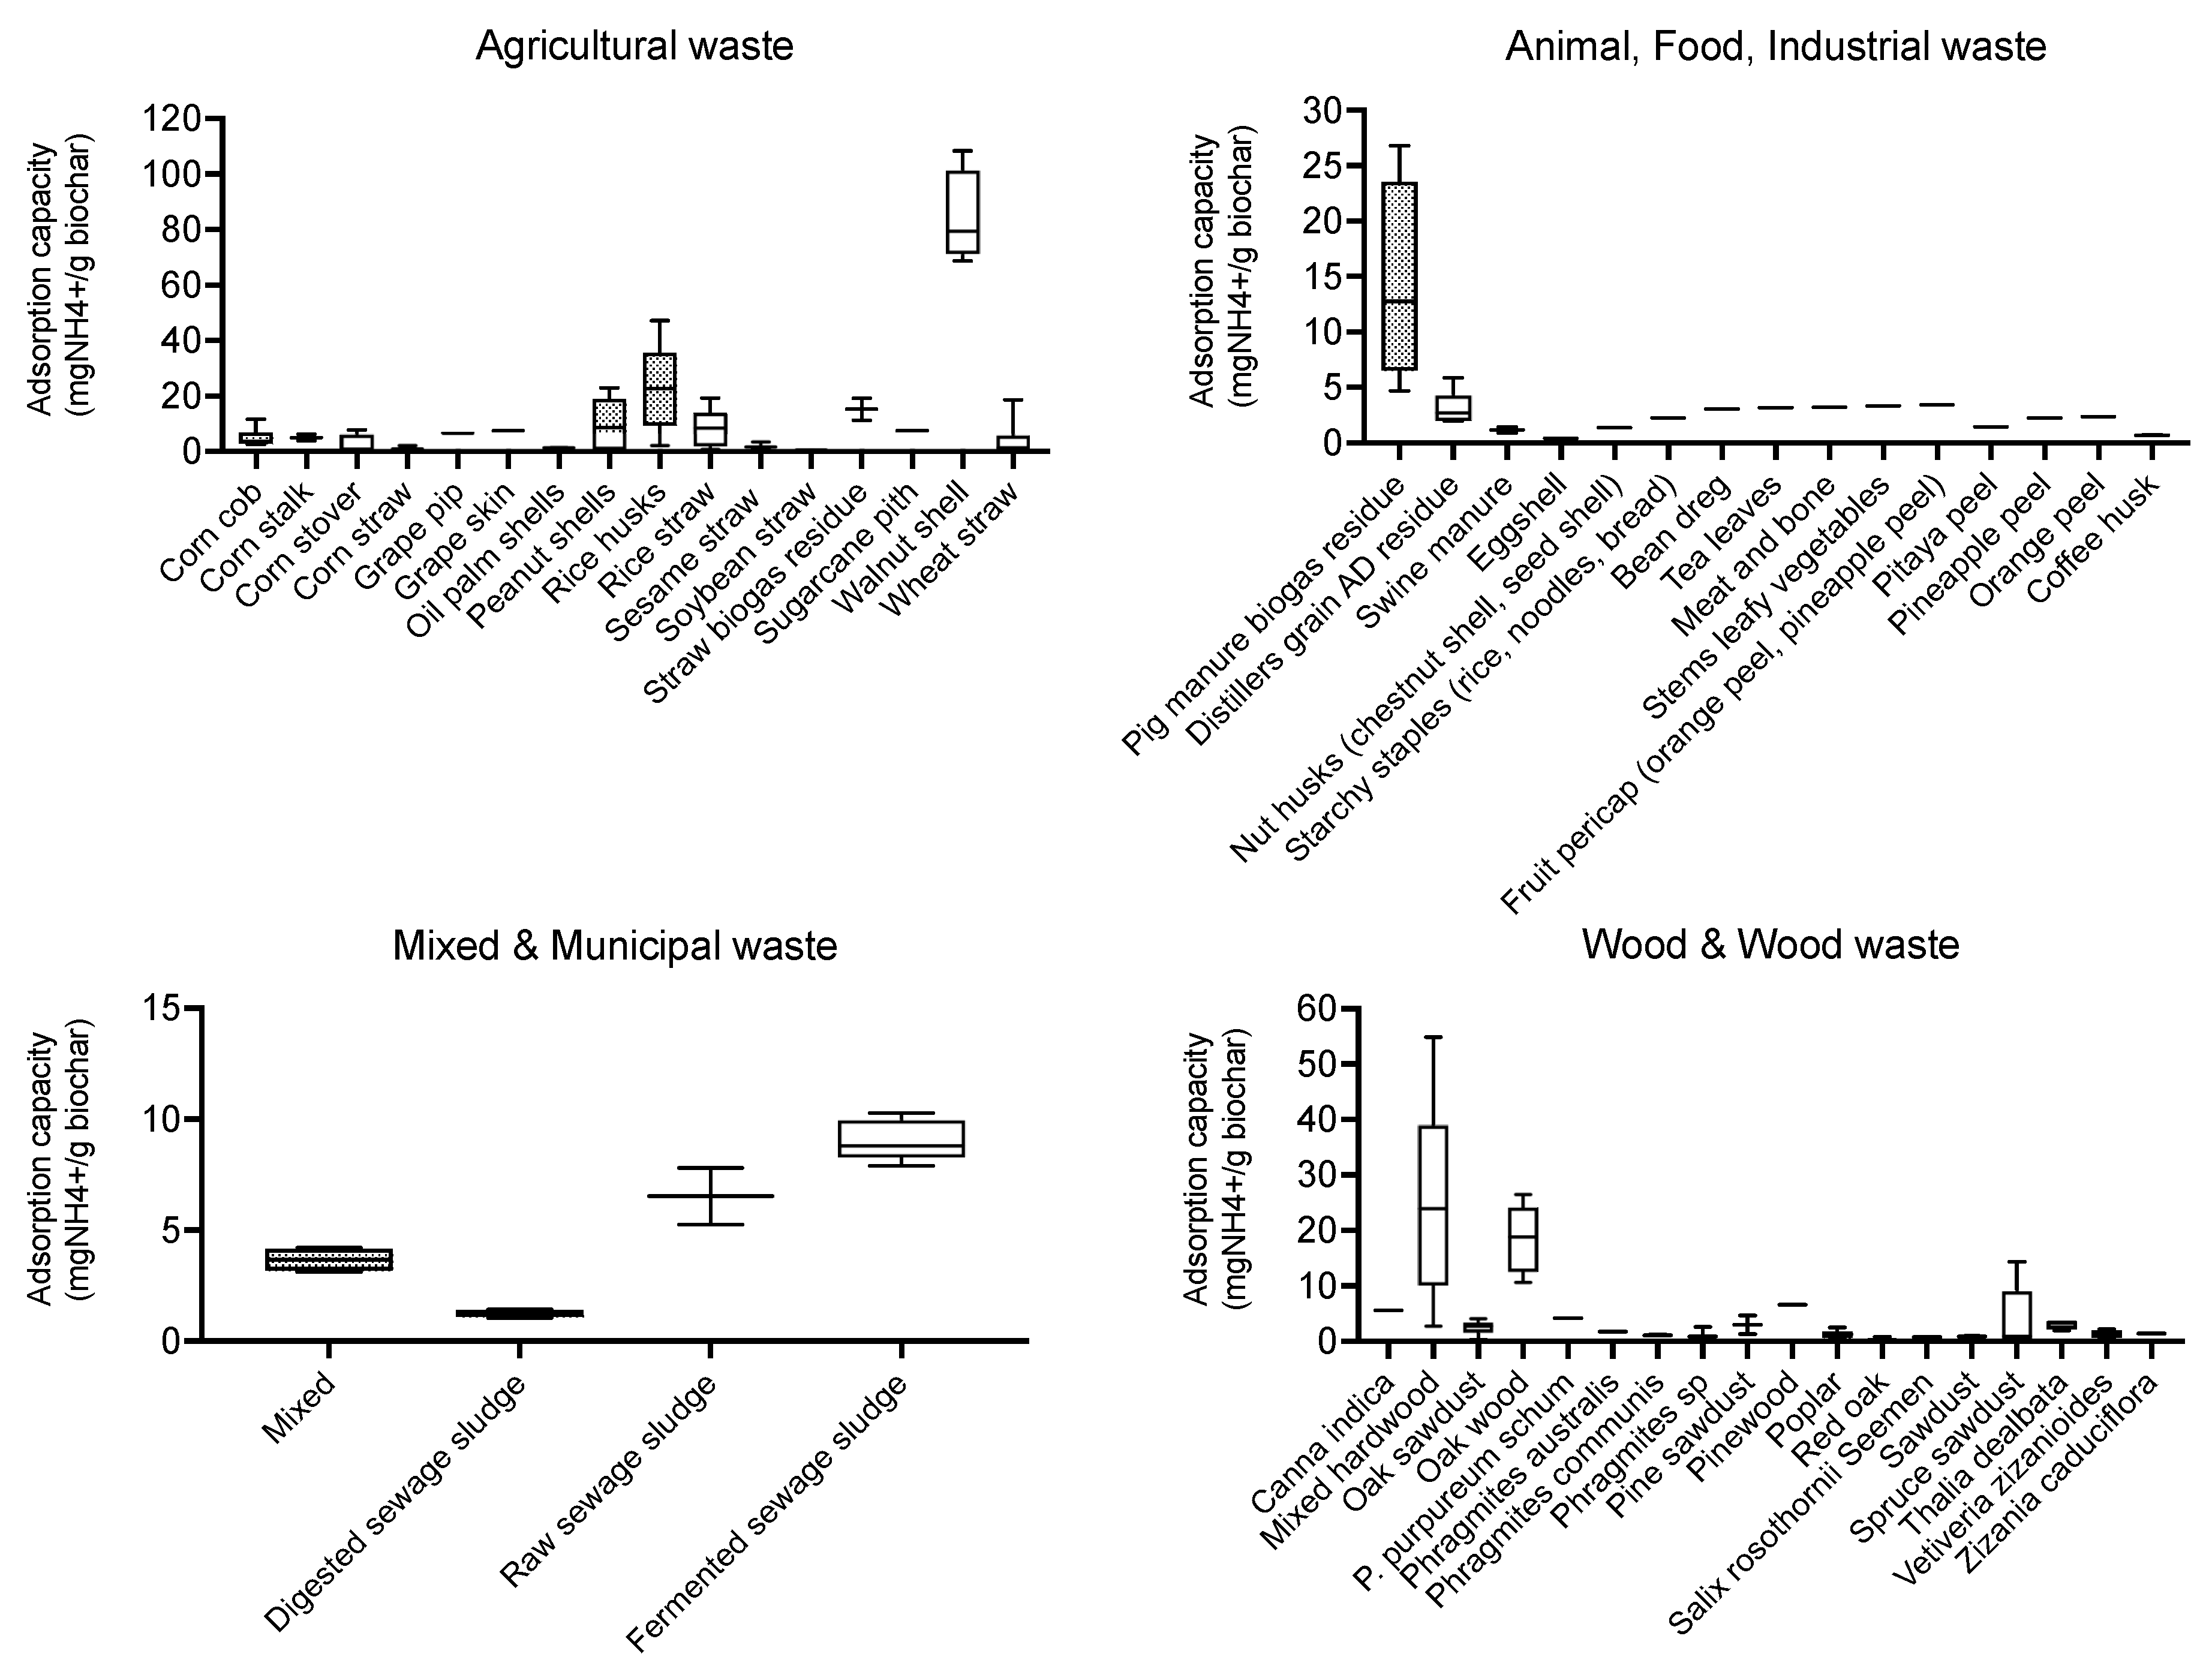
The data collected were organized by feedstock material category and by specific feedstock material, for direct comparison of like biochar materials for ammonium adsorption capacity. The results of this comparison are shown in Figure 1.
The materials with the highest adsorption capacity in the data collected were wood or wood-waste based or from the agricultural waste categories. Compared to the other materials in the same categories, the capacities were very high. For walnut shell, only one article was referenced; thus, these high adsorption values have not been corroborated by another test and should be carefully considered. For the mixed hardwood, two studies were referenced, but one had a high range of capacities (9.73–54.86 mgNH4+/g biochar [20]), and the other was lower (2.8–5.3 mgNH4+/g biochar [18]). The processes for both biochar creation and the adsorption testing were very different between the two studies (pyrolysis temperature, pH of solution, particle size of biochar, residence time, etc.) so it is difficult to pinpoint a specific reason for the difference in the adsorption capacities. This is a perfect example of the issues seen in the field of biochar for adsorption—a lack of consistency in testing and measurements makes drawing conclusions tricky if not impossible. In order to narrow down the characteristics reported in literature for analysis, five review papers were consulted, and their conclusions about important influencing factors for ammonium adsorption were recorded in Table 1.
The characteristics chosen for analysis against adsorption capacity were based on the characteristics in Table 1 as available. Surface functional groups and ambient temperature were not characteristics reported in most articles, and therefore it had to be removed from analysis. Dosage of biochar was calculated as g biochar/mL solution, and competing ions were noted as 1 for pure solutions (experiments using only an NH4+ compound like NH4Cl) and 0 for mixed (including mixed chemical solutions and “real” wastewater samples). The influencing factors listed in Table 1 were mentioned in review articles as possible mechanisms important to ammonium adsorption. As many are interrelated, singling out individual characteristics and their impact on the adsorption capacity is complicated. As an example, the pH value of the solution will control the speciation of ammonium and ammonia, thereby affecting the adsorption ability of any material. The pH thus should be kept below a value of 9 to prevent volatilization and loss of ammonia to the atmosphere. However, solutions with extremely low pH have an abundance of H+ ions that increase competition for adsorption sites and thus the adsorption of ammonium may be low. Additionally, surface functional groups can exist as protonated or deprotonated depending on the pH, which affects the availability of binding sites for NH4+ [58]. Therefore, there is likely an optimal pH for the solutions containing ammonium that allow for the highest availability of NH4+ ions with low competition from competing ions and most active functional groups.
Due to the binary nature of the data for pure versus mixed solution (competing ions) and washed versus unwashed biochar treatment, a Mann–Whitney test was used to determine significance in adsorption capacity. This test was chosen due to the less strict assumptions about the data distribution when compared with a standard t-test but would still provide information about whether the two groups were statistically different or the same [59]. The results for the purity of solution had a p value < 0.0001 and washing had a value of 0.0335. These results indicate that washing the biochar after pyrolysis (thus removing ash from the surface) and using a pure solution versus a mixed solution (competition with other ions) can be significant to the adsorption capacity of the biochar.
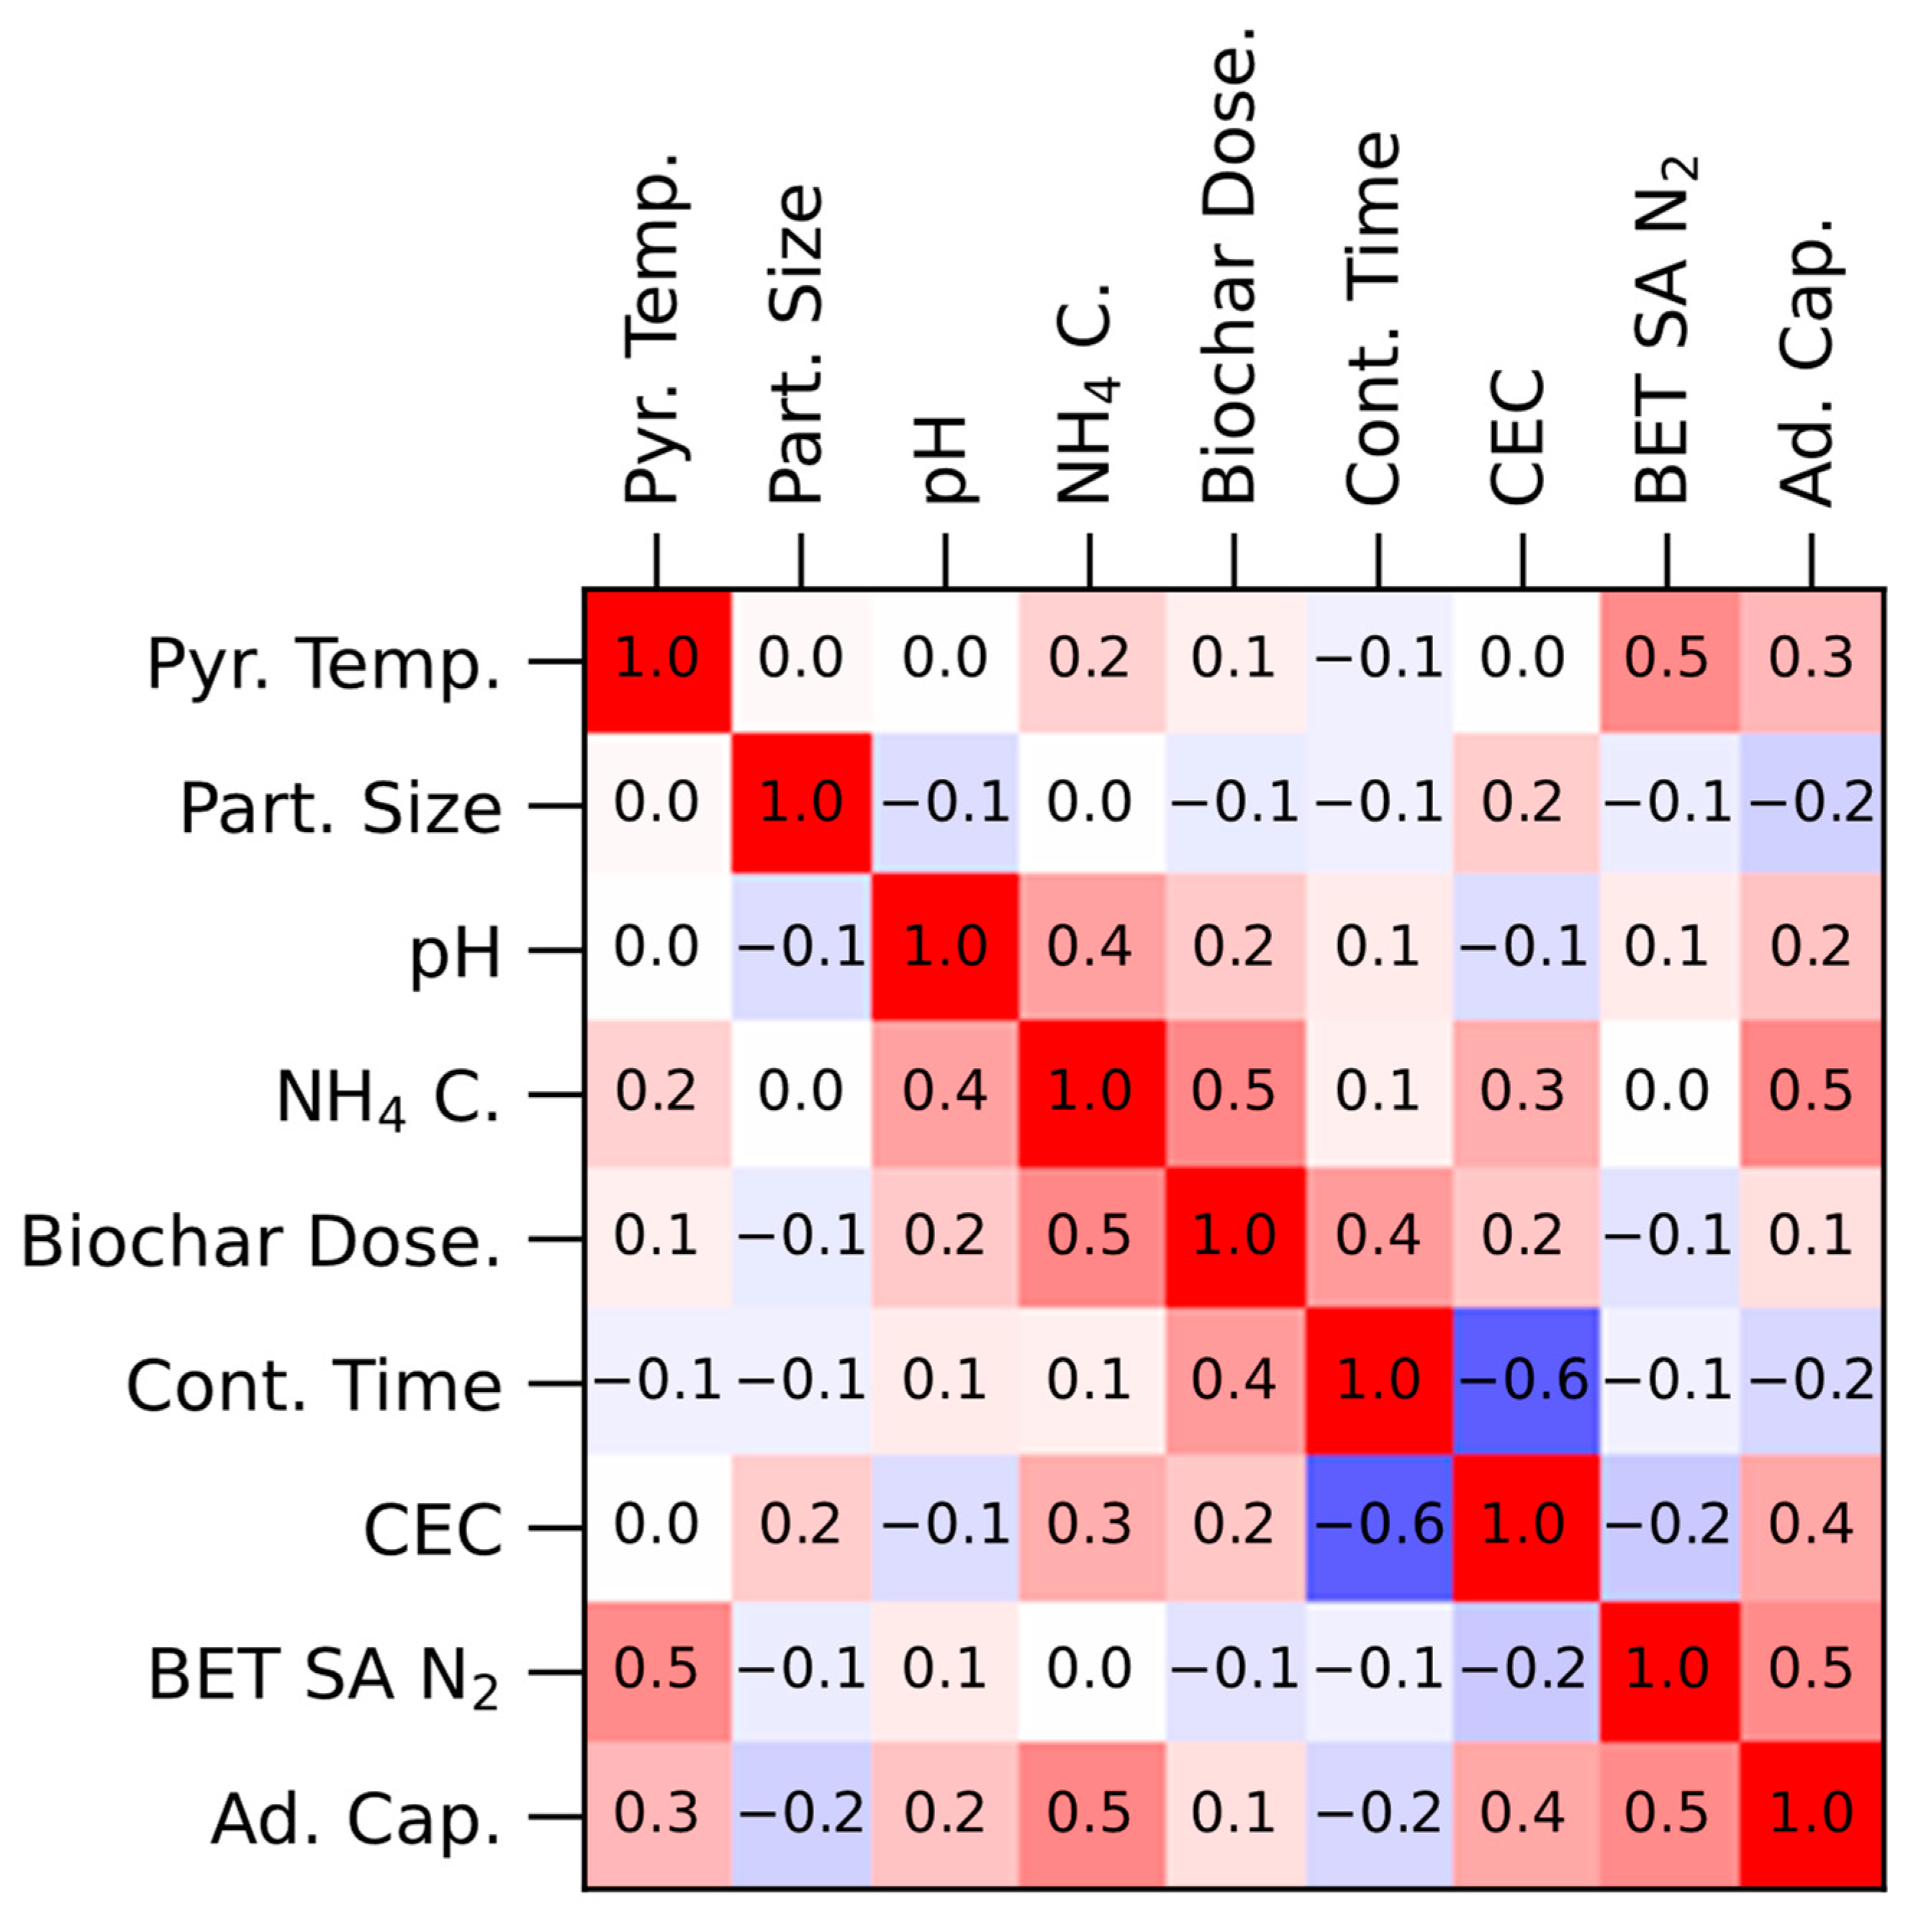
As previously mentioned, the covariance estimates for all collected data produced by EM did not strongly depend on the initial coviariance estimate. The converged correlation matrix (using Pearson correlation) with is shown below in Figure 2 for . The number of available observations of each variable of interest is shown in Table 2.
The correlation matrix shown in Figure 3 suggested a positive correlation between adsorption capacity and BET surface area, CEC, and ammonium concentration, and to a lesser extent pyrolysis temperature and solution pH. The magnitude of the correlation coefficients suggests there was a small negative correlation between adsorption capacity and particle size, and adsorption capacity and residence time. The correlation between adsorption capacity and biochar dosage was small and considered negligible for this analysis. From the magnitude of the coefficients, the strongest conclusions to be drawn from this analysis are the positive relationships between adsorption capacity and BET surface area, CEC and NH4+ concentration. These relationships make sense theoretically as well. As the BET surface area increases, there should be more adsorption sites available for ammonium to adhere to. Likewise, with an increase in ammonium concentration in solution, the number of collisions between ammonium ions and the biochar surface would increase, leading to an increase in adsorption. CEC indicates the ability of a material to bind positively charged ions, so an increase in CEC should also correspond with an increase in ammonium adsorption. However, in the case of CEC, the strength of this conclusion should perhaps be tempered—of the 210 reported measurements, only 57 reported CEC.
This analysis also showed a strong positive relationship between BET surface area and pyrolysis temperature, which has been proven experimentally in literature [60]. CEC and contact time showed a strong negative relationship, implying that biochar with larger cation exchange capacity should require a shorter contact time to reach equilibrium. This also makes sense as a higher CEC should indicate better and therefore potentially faster adsorption of positive ions like ammonium. Surprisingly, there was no correlation between pyrolysis temperature and CEC. This could be attributed to the fact that the CEC data were limited, but also could point to a stronger role of feedstock in determining CEC than pyrolysis temperature. A meta-analysis performed by Ippolito et al. showed that average CEC varied much more with feedstock source than pyrolysis temperature or pyrolysis type (fast versus slow), with manure/biosolids having the highest CEC and wood-based materials the lowest (on average) [60]. Interestingly, the surface areas of wood-based materials were much higher on average, and the surface area of manure/biosolid biochars was lowest, with crop waste in between on both parameters. For the purposes of ammonium adsorption, there was not a clear feedstock material type that performed best on average (Figure 1) to be able to say whether this relationship between feedstock material, CEC and surface area is indicative of adsorption capacity.
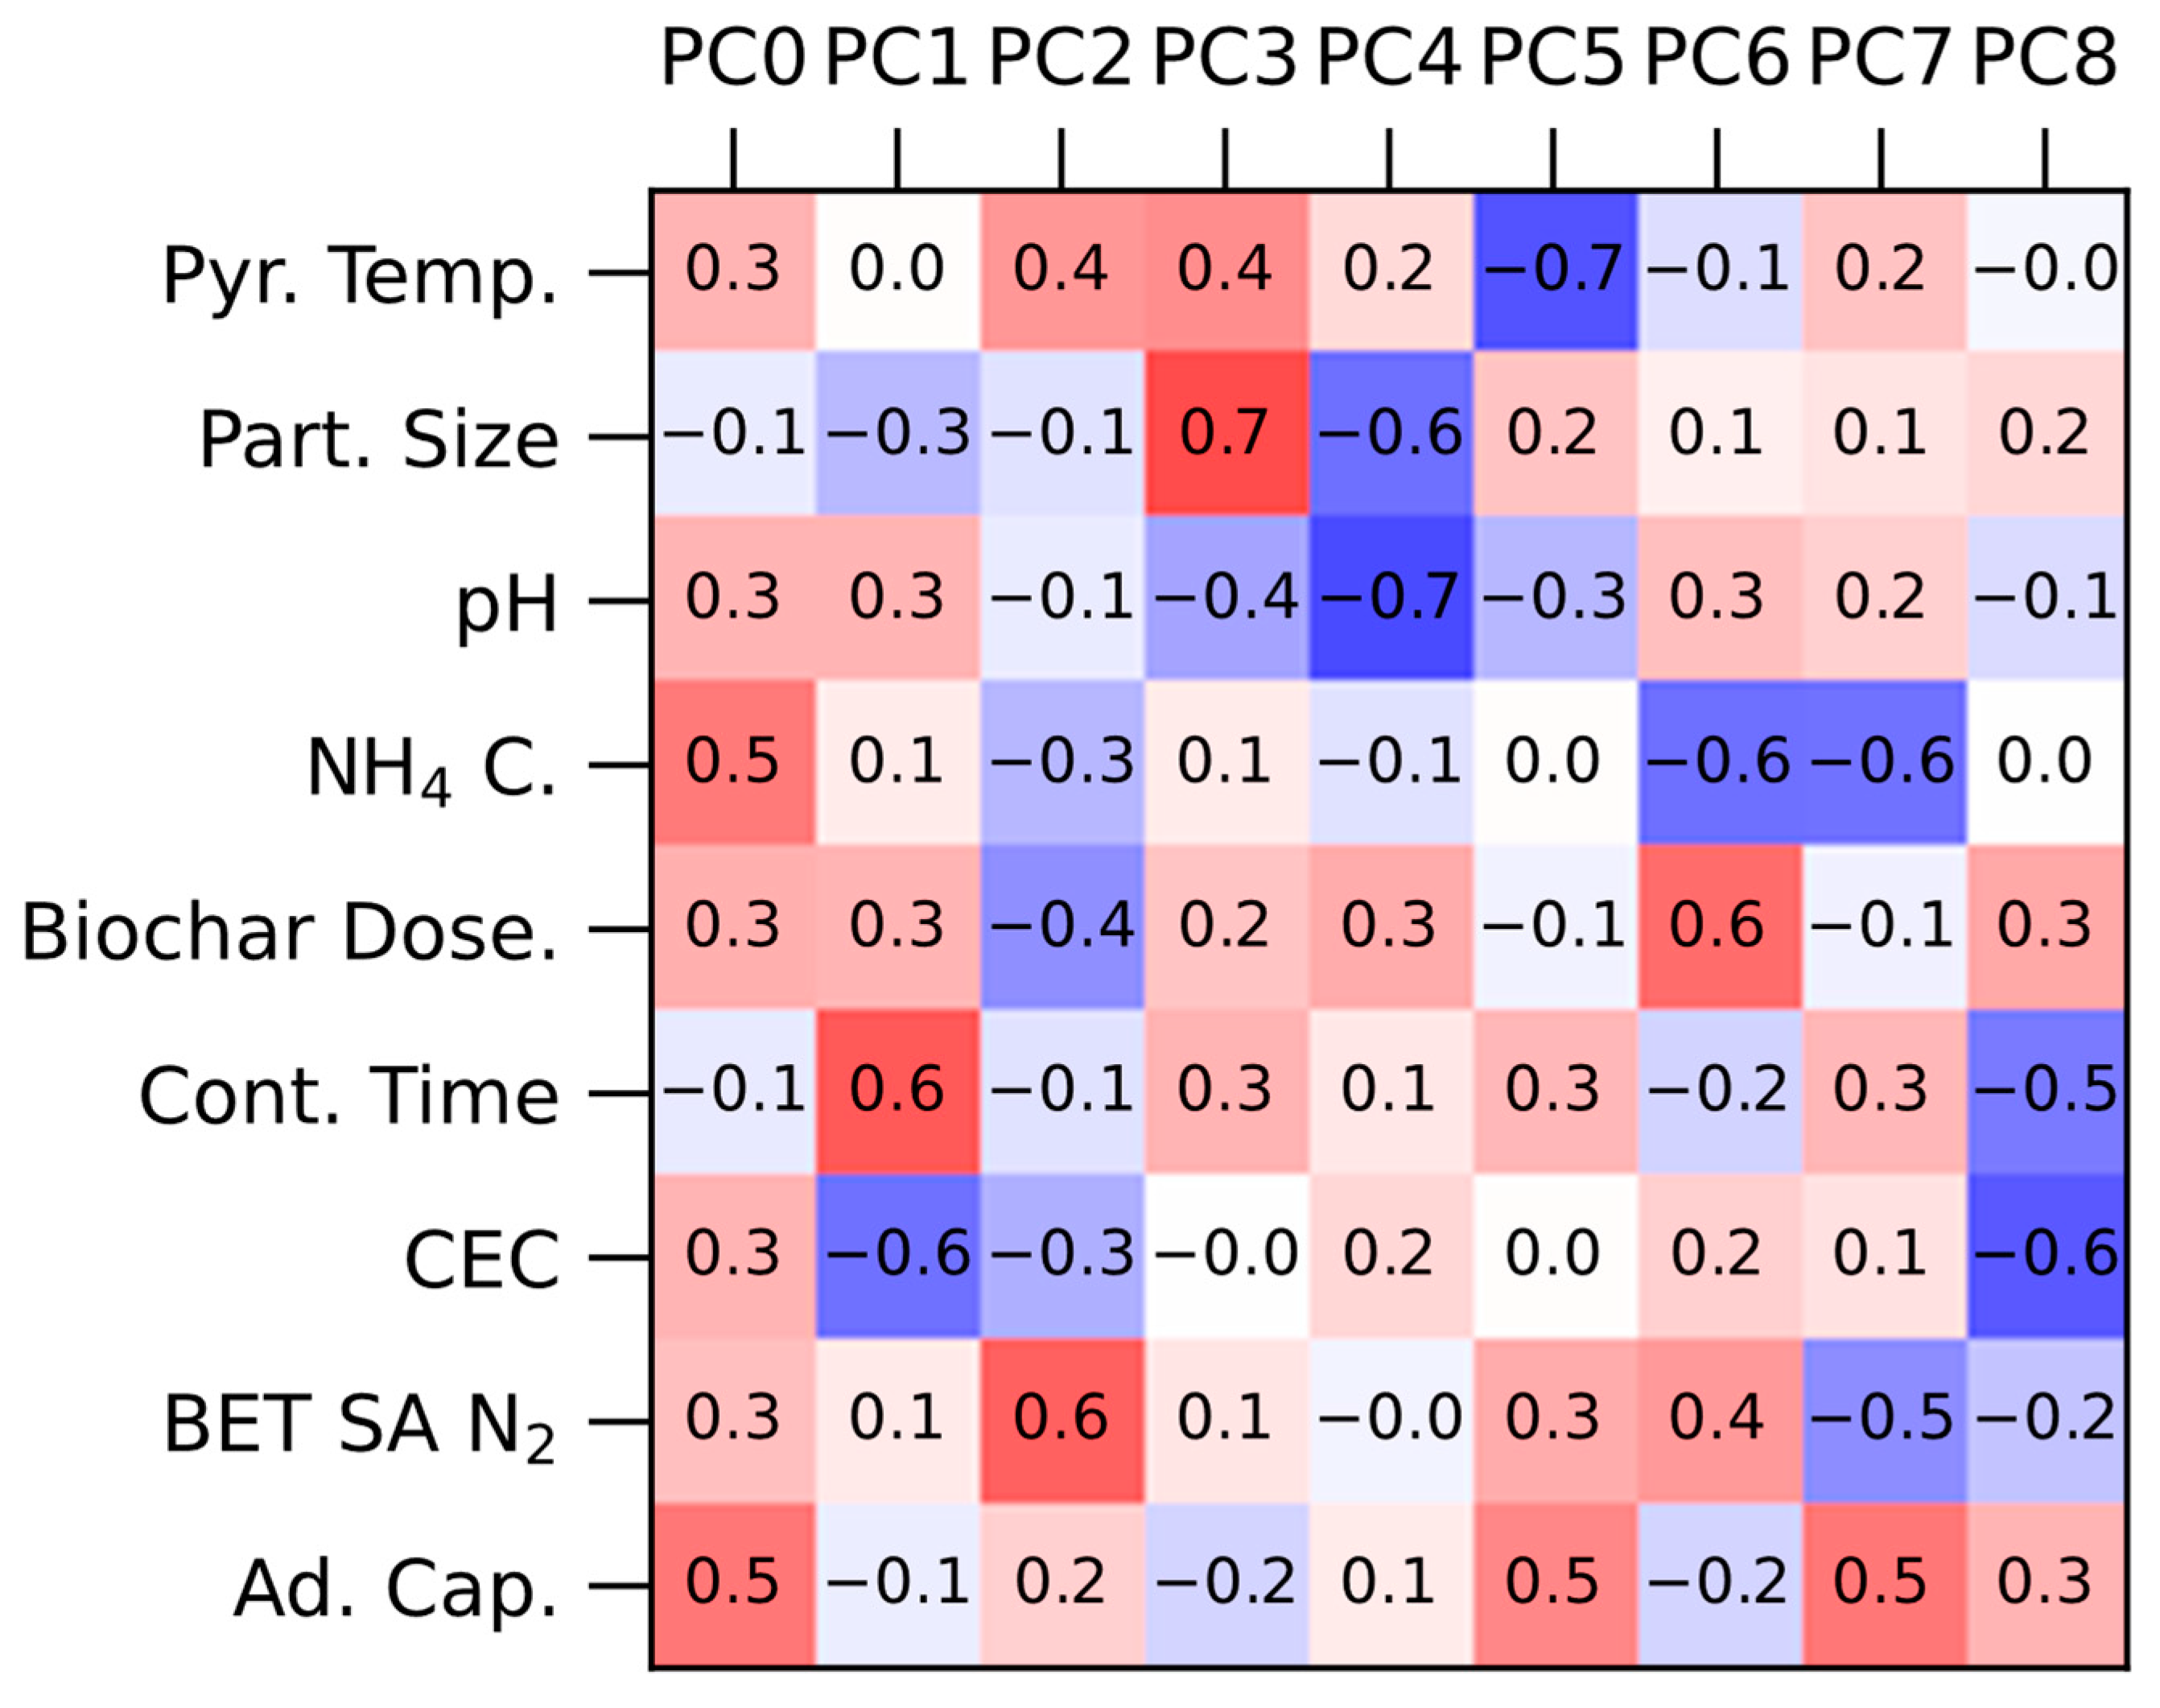
The PCA loading matrix in Figure 4 corroborated some of the relationships from the correlation matrix, though some of the principal components showed conflicting data. In addition, 80% of the total variance could be explained using the first five principal components (PC0-4), so subsequent PCs were not analyzed further. The relationships suggested by PC0 were positive between adsorption capacity and BET surface area, biochar dosage (g/mL biochar), ammonium concentration (NH4+ mg/L), pH solution and pyrolysis temperature. Looking at PC1, a similar relationship between adsorption capacity and BET surface area and pyrolysis temperature was noted, but the opposite relationship between adsorption and biochar dosage, ammonium concentration and pH was determined. Additionally, cation exchange capacity (CEC cmol/kg) showed a positive correlation according to PC1. PC3 confirms the positive relationship between adsorption and solution pH from PC0, but suggests an inverse relationship with pyrolysis temperature, particle size, biochar dosage, residence time, and BET surface area. As PC2 and PC4 have small coefficients for adsorption capacity, the relationships shown are likely less important than the other PCs.
The contradictions seen in the various principal components in Figure 4 could be partially explained by bias in experimental parameters. For example, all experiments using high concentrations of ammonium also used a solution pH above 7. This creates a bias in the data that is unrelated to the mechanism of adsorption which can lead to incorrect conclusions. Therefore, it is suggested that both the PCA loading matrix and the correlation matrix relationships be considered, and those which are common for both are most likely to be correct. It can be concluded that ammonium adsorption is positively correlated with BET surface area, CEC, NH4+ concentration and possibly pyrolysis temperature. Again, it is important to stress that the relationship between CEC and adsorption capacity is supported by less data than the other relationships.
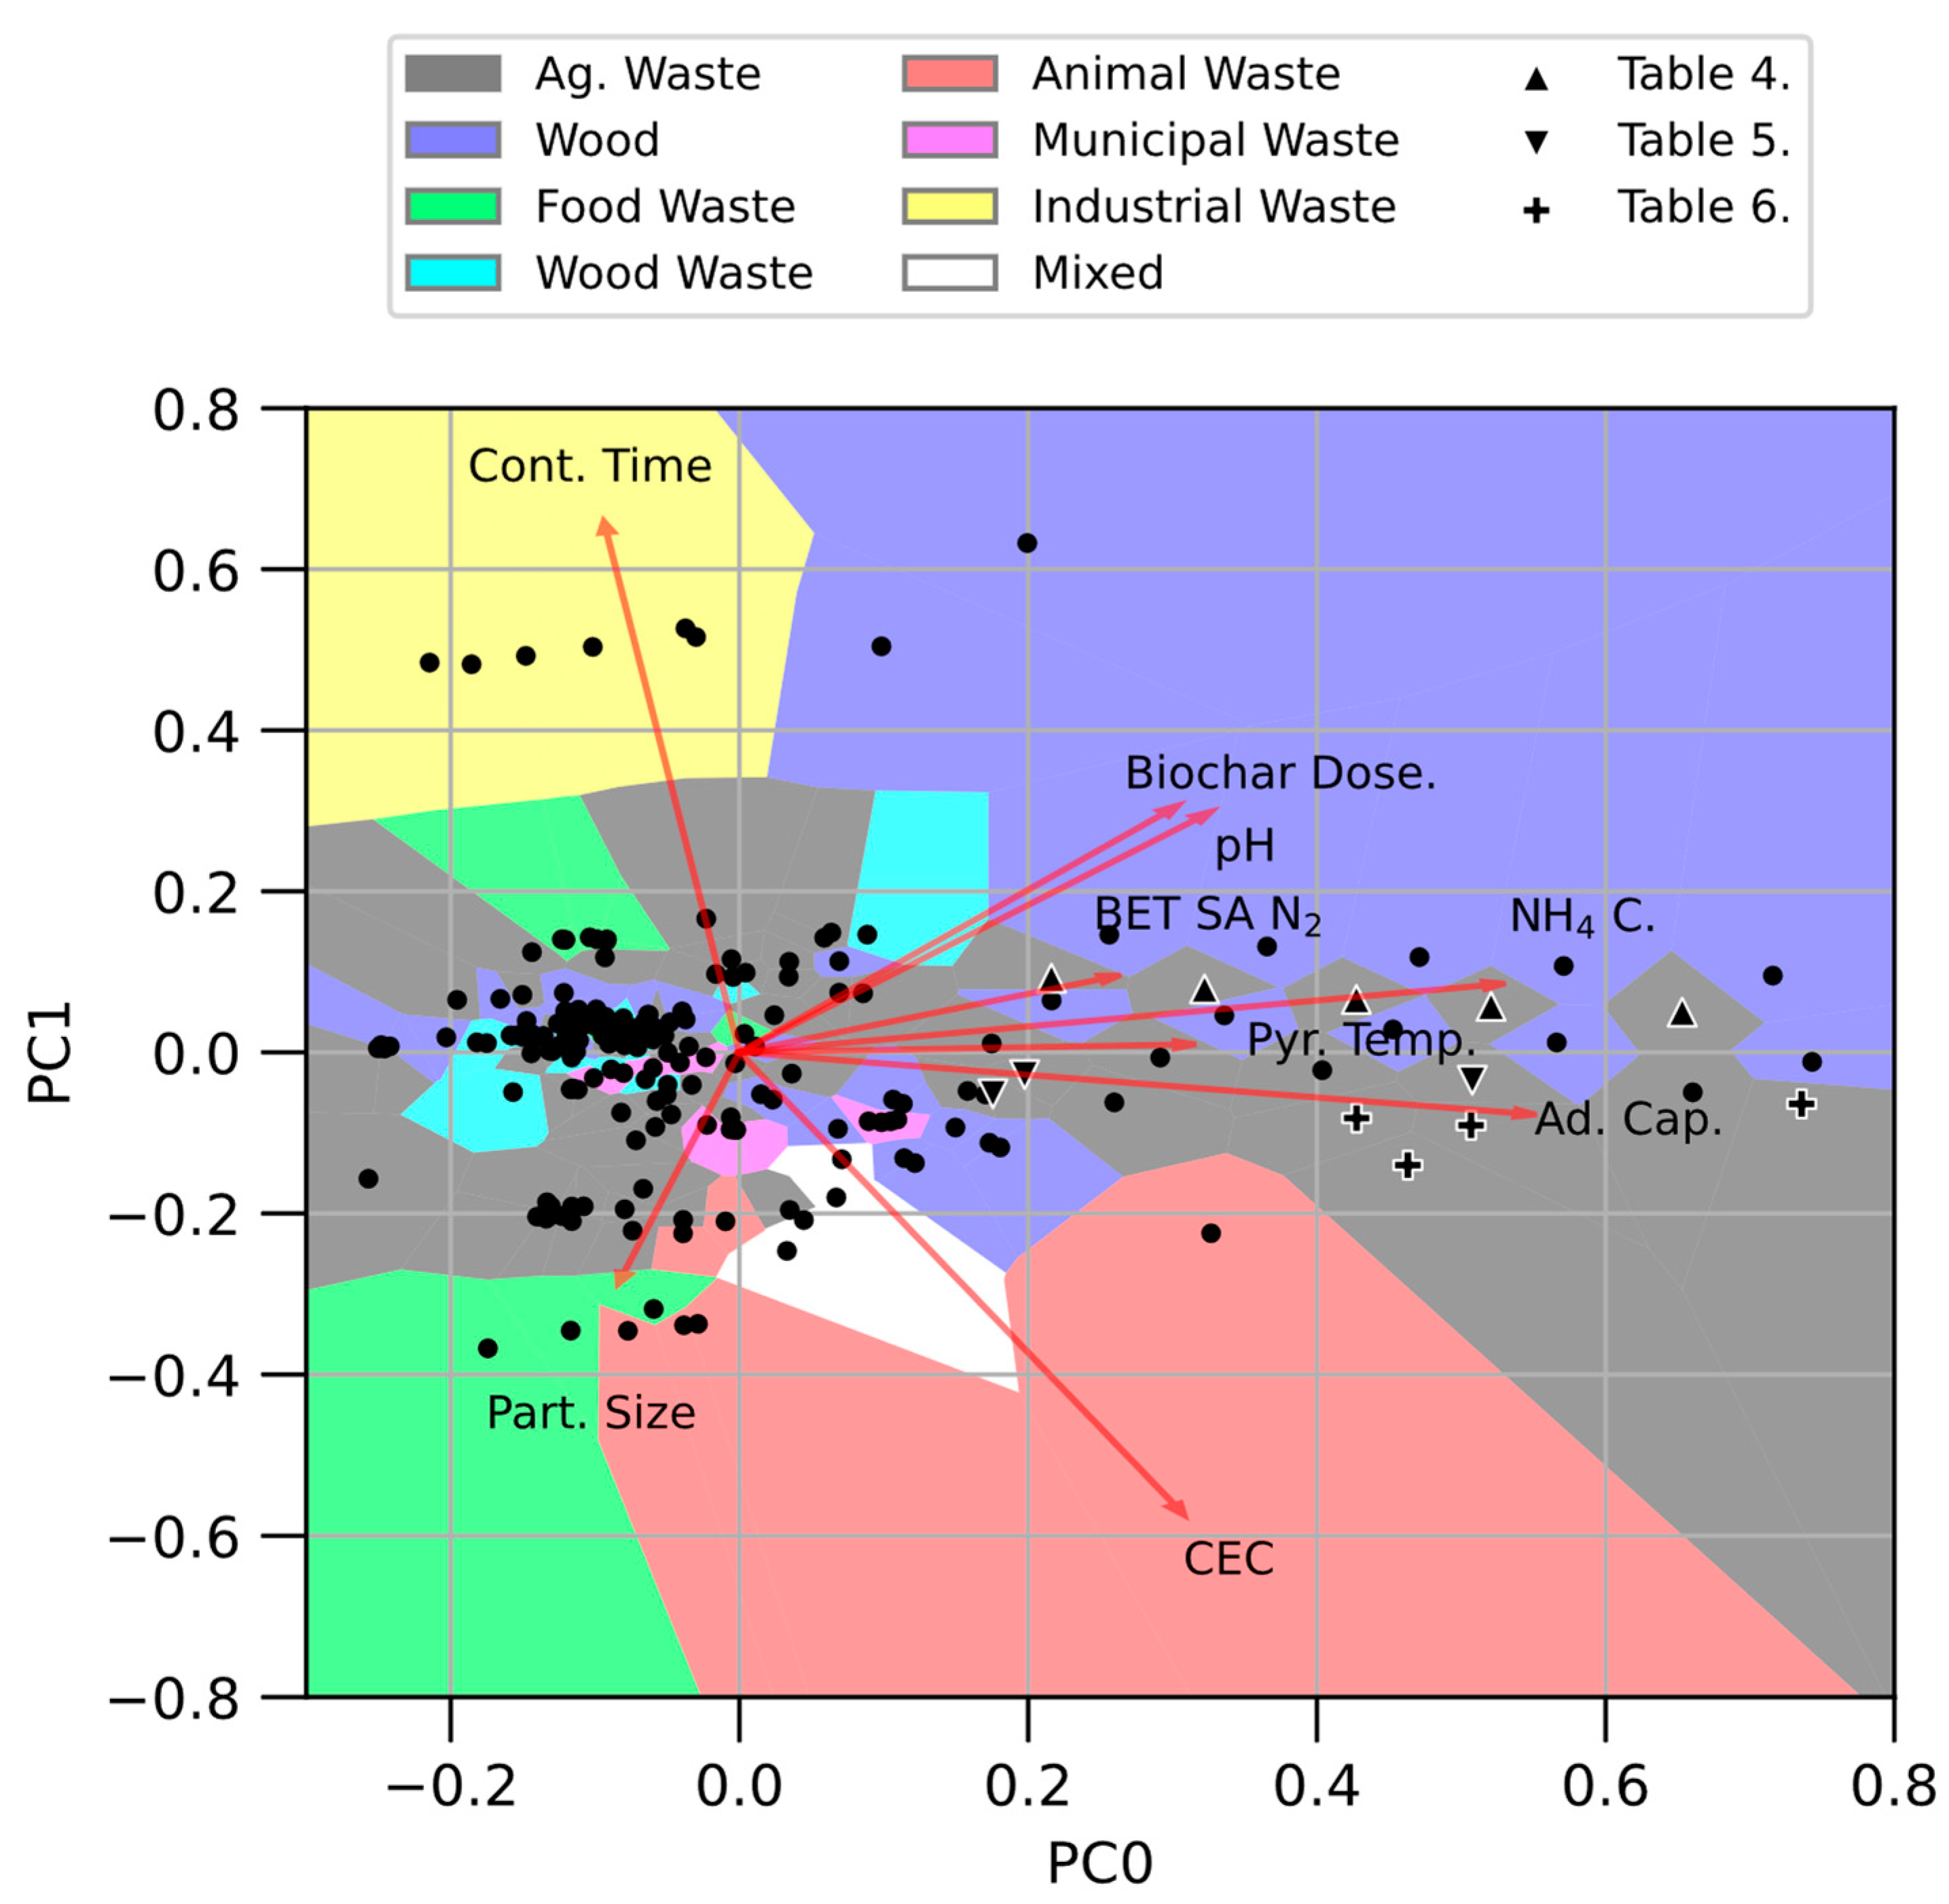
A similar principal component analysis was performed on data separated by material type, though the results were highly dependent on the initial value for used in the EM algorithm. Many of the converged covariance estimates had similar likelihoods despite significant differences in the converged parameters. The goal of such an analysis would be to determine if significantly different trends occur when considering different material type. Alternatively, a biplot for the first two PCs can offer a visual aid in seeking qualitative trends. Figure 4 shows such a biplot, where the Voronoi diagram of the datapoints has been used to color the plot area. This coloring shows the material type of the closest data point in, and can be used to visually identify trends in the data.
Visual inspection of Figure 5 is sufficient to reveal some interesting trends. For example, the region where and contains, from top to bottom,
- a sequence of five wood experiments showing increasing adsorption capacity;
- a sequence of five agricultural waste experiments showing increasing adsorption capacity;
- a sequence of five wood experiments showing increasing adsorption capacity;
- a group of 10 agricultural waste experiments showing increasing adsorption capacity.
Throughout the plot, there are other clear linearly arranged sequences of experiments, for example the series of industrial waste experiments in the top left, or a group of three food waste experiments in the bottom left. In all such cases, these clear groups of linearly arranged points represent data from a single study, which often identifies a strong relationship between adsorption capacity and some other factor. As an illustrating example, Table 3 shows the data from the studies corresponding to the trend enumerated in points 2 and 4 above. As CEC was not reported in any of the three articles, the data were not included in the table.
We can see that a particular set of experiments can be visible as a straight line in the biplot indicating a prevailing adsorption trend. However, tabulating the experiments enumerated in item 4 above shows the difficulty in comparing results between studies. Looking at BET surface area, for example, the first five entries in Table 3 differ only in initial ammonium concentration, but the adsorption capacity varies from 9.14 mgNH4+/g biochar to 37.63 mgNH4+/g biochar, corresponding to a difference of 19% of the maximum adsorption capacity. The study by Chen et al. [44] used the same material, but with an increase of 100 m2/g in the BET surface area, the adsorption capacity only increased by 1 mgNH4+/g biochar. In addition, the last point by Kizito et al. [20] had similar experimental conditions and similar BET surface area but much higher adsorption capacity. The final study by Li and Shi [47] showed increases in adsorption capacity in the four points which correspond to different chemical treatments of the biochars, with the first point being the pure biochar without treatment. The different treatments increased the surface area, but the first treatment led to a decrease in adsorption capacity due to changes in the surface morphology (likely from a condensation reaction between walnut shell components and dicyandiamide). This example demonstrates that surface area alone is often not enough of an indication of surface properties to draw direct conclusions about ammonium adsorption. Comparing the data from group q, it is unclear whether the large difference in capacity is due to pyrolysis temperature, contact time, biochar dose, or some other parameter related to the method that was not recorded. The results of the PCA show that it is possible to identify extremely strong trends in literature at the level of individual studies, but that almost all of these trends become much weaker when considering the literature as a whole. Using data from a range of studies results in support for a relationship between adsorption capacity and BET surface area, CEC, ammonium concentration, and perhaps pyrolysis temperature. However, the weakness of these relationships when compared to individual studies reflects the difficulty in drawing conclusions on critical influencing factors for ammonium adsorption from a combination of studies.
Prior to this study, most research articles that comment on possible adsorption mechanisms for ammonium onto biochar attempt to draw conclusions without the support of statistical analysis. It is clear from this work that there are significant challenges to performing statistical analysis due mostly to a lack of consistency in reporting different physical and chemical characteristics of the biochar. It is hypothesized that what is currently reported is based on the availability of equipment rather than the variables that are definitively contributing to the adsorption. It is difficult to make suggestions on what variables are most important and therefore which should be focused on for reporting since the missing data makes analysis complex. However, from the preliminary findings here, we may suggest that solution purity, biochar washing, biochar surface area and cation exchange capacity are important factors for adsorption capacity for some materials. Material type should be considered in the analysis of biochar for adsorption as it seems to alter the relationship of the different characteristics with adsorption capacity, though it is difficult to determine if this or the methods for biochar production and experiments are responsible. To be able to accurately model the adsorption of ammonium onto biochar for implementation of nitrogen recovery in wastewater treatment for fertilizer production, standard methods for biochar production and adsorption experiments would be extremely useful. Many of the influencing factors are related to the experimental setup for either the biochar production or the adsorption testing, so standardized methods would help remove ambiguity. Pyrolysis temperature in particular is an important process condition that can affect many biochar characteristics including surface area, porosity, surface charge, etc., though feedstock choice may prove to be a more important parameter when engineering biochar for ammonium adsorption.
4. Conclusions
We suggest the most important characteristics to report for experiments using biochar for ammonium adsorption are BET surface area, ammonium concentration in solution and cation exchange capacity. However, it is clear that the feedstock material plays a vital role in determining biochar characteristics, which in turn affect the adsorption capacity. If more studies are performed with additional analysis like surface functional groups (carboxylic, lactonic, acidic, acid neutralizing capacity), ultimate and proximate analysis, etc., more meta-analyses can be performed in the future with less missing data to provide an even better idea of the essential mechanisms and influencing factors for ammonium adsorption onto biochar.
Author Contributions
Conceptualization, A.S. and S.S.; methodology, A.S. and J.-P.A.I.; formal analysis, A.S. and J.-P.A.I.; investigation, A.S. and J.-P.A.I.; resources, J.-P.A.I. and M.O.; data curation, A.S.; writing—original draft preparation, A.S.; writing—review and editing, A.S., J.-P.A.I., S.S.; supervision, M.O. and S.S. All authors have read and agreed to the published version of the manuscript.
Funding
This research received no external funding.
Institutional Review Board Statement
Not applicable.
Informed Consent Statement
Not applicable.
Data Availability Statement
Not applicable.
Acknowledgments
We would like to thank Ryan Merckel of University of Pretoria for his insights and assistance on the manuscript.
Conflicts of Interest
The authors declare no conflict of interest.
References
- Kuntke, P.; Śmiech, K.M.; Bruning, H.; Zeeman, G.; Saakes, M.; Sleutels, T.H.J.A.; Hamelers, H.V.M.; Buisman, C.J.N. Ammonium Recovery and Energy Production from Urine by a Microbial Fuel Cell. Water Res. 2012, 46, 2627–2636. [Google Scholar] [CrossRef] [PubMed]
- Lang, M.; Li, P.; Yan, X. Runoff Concentration and Load of Nitrogen and Phosphorus from a Residential Area in an Intensive Agricultural Watershed. Sci. Total Environ. 2013, 458–460, 238–245. [Google Scholar] [CrossRef] [PubMed]
- Dube, P.J.; Vanotti, M.B.; Szogi, A.A.; García-González, M.C. Enhancing Recovery of Ammonia from Swine Manure Anaerobic Digester Effluent Using Gas-Permeable Membrane Technology. Waste Manag. 2016, 49, 372–377. [Google Scholar] [CrossRef] [PubMed]
- Beckinghausen, A.; Odlare, M.; Thorin, E.; Schwede, S. From Removal to Recovery: An Evaluation of Nitrogen Recovery Techniques from Wastewater. Appl. Energy 2020, 263, 114616. [Google Scholar] [CrossRef]
- Woolf, D.; Amonette, J.E.; Street-Perrott, F.A.; Lehmann, J.; Joseph, S. Sustainable Biochar to Mitigate Global Climate Change. Nat. Commun. 2010, 1, 56. [Google Scholar] [CrossRef]
- Tomczyk, A.; Sokołowska, Z.; Boguta, P. Biochar Physicochemical Properties: Pyrolysis Temperature and Feedstock Kind Effects. Rev. Env. Sci. Biotechnol. 2020, 19, 191–215. [Google Scholar] [CrossRef]
- Taghizadeh-Toosi, A.; Clough, T.J.; Sherlock, R.R.; Condron, L.M. Biochar Adsorbed Ammonia Is Bioavailable. Plant Soil 2012, 350, 57–69. [Google Scholar] [CrossRef]
- Booker, N.A.; Cooney, E.L.; Priestley, A.J. Ammonia Removal from Sewage Using Natural Australian Zeolite. Water Sci. Technol. 1996, 34, 17–24. [Google Scholar] [CrossRef]
- Beckinghausen, A.; Reynders, J.; Merckel, R.; Wu, Y.W.; Marais, H.; Schwede, S. Post-Pyrolysis Treatments of Biochars from Sewage Sludge and A. Mearnsii for Ammonia (NH4-n) Recovery. Appl. Energy 2020, 271, 115212. [Google Scholar] [CrossRef]
- Xiang, W.; Zhang, X.; Chen, J.; Zou, W.; He, F.; Hu, X.; Tsang, D.C.W.; Ok, Y.S.; Gao, B. Biochar Technology in Wastewater Treatment: A Critical Review. Chemosphere 2020, 252, 126539. [Google Scholar] [CrossRef]
- Takaya, C.A.; Fletcher, L.A.; Singh, S.; Anyikude, K.U.; Ross, A.B. Phosphate and Ammonium Sorption Capacity of Biochar and Hydrochar from Different Wastes. Chemosphere 2016, 145, 518–527. [Google Scholar] [CrossRef] [PubMed]
- Fidel, R.B.; Laird, D.A.; Spokas, K.A. Sorption of Ammonium and Nitrate to Biochars Is Electrostatic and PH-Dependent. Sci. Rep. 2018, 8, 17627. [Google Scholar] [CrossRef] [PubMed]
- Wong, J.W.C.; Webber, J.B.W.; Ogbonnaya, U.O. Characteristics of Biochar Porosity by NMR and Study of Ammonium Ion Adsorption. J. Anal. Appl. Pyrolysis 2019, 143, 104687. [Google Scholar] [CrossRef]
- Gao, F.; Xue, Y.; Deng, P.; Cheng, X.; Yang, K. Removal of Aqueous Ammonium by Biochars Derived from Agricultural Residuals at Different Pyrolysis Temperatures. Chem. Speciat. Bioavailab. 2015, 27, 92–97. [Google Scholar] [CrossRef]
- Liu, Z.; Xue, Y.; Gao, F.; Cheng, X.; Yang, K. Removal of Ammonium from Aqueous Solutions Using Alkali-Modified Biochars. Chem. Speciat. Bioavailab. 2016, 28, 26–32. [Google Scholar] [CrossRef]
- Zeng, Z.; Zhang, S.; Li, T.; Zhao, F.; He, Z.; Zhao, H.; Yang, X.; Wang, H.; Zhao, J.; Rafiq, M.T. Sorption of Ammonium and Phosphate from Aqueous Solution by Biochar Derived from Phytoremediation Plants. J. Zhejiang Univ. Sci. B 2013, 14, 1152–1161. [Google Scholar] [CrossRef]
- Gai, X.; Wang, H.; Liu, J.; Zhai, L.; Liu, S.; Ren, T.; Liu, H. Effects of Feedstock and Pyrolysis Temperature on Biochar Adsorption of Ammonium and Nitrate. PLoS ONE 2014, 9, e113888. [Google Scholar] [CrossRef]
- Sarkhot, D.V.; Ghezzehei, T.A.; Berhe, A.A. Effectiveness of Biochar for Sorption of Ammonium and Phosphate from Dairy Effluent. J. Environ. Qual. 2013, 42, 1545–1554. [Google Scholar] [CrossRef]
- Zhang, Y.; Li, Z.; Mahmood, I.B. Recovery of NH4+by Corn Cob Produced Biochars and Its Potential Application as Soil Conditioner. Front. Environ. Sci. Eng. 2014, 8, 825–834. [Google Scholar] [CrossRef]
- Kizito, S.; Wu, S.; Kipkemoi Kirui, W.; Lei, M.; Lu, Q.; Bah, H.; Dong, R. Evaluation of Slow Pyrolyzed Wood and Rice Husks Biochar for Adsorption of Ammonium Nitrogen from Piggery Manure Anaerobic Digestate Slurry. Sci. Total Environ. 2015, 505, 102–112. [Google Scholar] [CrossRef]
- Wang, Z.; Guo, H.; Shen, F.; Yang, G.; Zhang, Y.; Zeng, Y.; Wang, L.; Xiao, H.; Deng, S. Biochar Produced from Oak Sawdust by Lanthanum (La)-Involved Pyrolysis for Adsorption of Ammonium (NH4+), Nitrate (NO3−), and Phosphate (PO43−). Chemosphere 2015, 119, 646–653. [Google Scholar] [CrossRef] [PubMed]
- Cui, X.; Hao, H.; Zhang, C.; He, Z.; Yang, X. Capacity and Mechanisms of Ammonium and Cadmium Sorption on Different Wetland-Plant Derived Biochars. Sci. Total Environ. 2016, 539, 566–575. [Google Scholar] [CrossRef] [PubMed]
- Yu, Q.; Xia, D.; Li, H.; Ke, L.; Wang, Y.; Wang, H.; Zheng, Y.; Li, Q. Effectiveness and Mechanisms of Ammonium Adsorption on Biochars Derived from Biogas Residues. RSC Adv. 2016, 6, 88373–88381. [Google Scholar] [CrossRef]
- Zhang, J.; Wang, Q. Sustainable Mechanisms of Biochar Derived from Brewers’ Spent Grain and Sewage Sludge for Ammonia–Nitrogen Capture. J. Clean. Prod. 2016, 112, 3927–3934. [Google Scholar] [CrossRef]
- Vu, T.M.; Doan, D.P.; Van, H.T.; Nguyen, T.V.; Vigneswaran, S.; Ngo, H.H. Removing Ammonium from Water Using Modified Corncob-Biochar. Sci. Total Environ. 2017, 579, 612–619. [Google Scholar] [CrossRef]
- Zheng, X.; Yang, Z.; Xu, X.; Dai, M.; Guo, R. Characterization and Ammonia Adsorption of Biochar Prepared from Distillers’ Grains Anaerobic Digestion Residue with Different Pyrolysis Temperatures. J. Chem. Technol. Biotechnol. 2018, 93, 198–206. [Google Scholar] [CrossRef]
- Shang, L.; Xu, H.; Huang, S.; Zhang, Y. Adsorption of Ammonium in Aqueous Solutions by the Modified Biochar and Its Application as an Effective N-Fertilizer. Water Air Soil Pollut. 2018, 229, 320. [Google Scholar] [CrossRef]
- Yang, H.I.; Lou, K.; Rajapaksha, A.U.; Ok, Y.S.; Anyia, A.O.; Chang, S.X. Adsorption of Ammonium in Aqueous Solutions by Pine Sawdust and Wheat Straw Biochars. Environ. Sci. Pollut. Res. 2018, 25, 25638–25647. [Google Scholar] [CrossRef]
- Yin, Q.; Zhang, B.; Wang, R.; Zhao, Z. Phosphate and Ammonium Adsorption of Sesame Straw Biochars Produced at Different Pyrolysis Temperatures. Env. Sci. Pollut. Res. 2018, 25, 4320–4329. [Google Scholar] [CrossRef]
- Yin, Q.; Wang, R.; Zhao, Z. Application of Mg–Al-Modified Biochar for Simultaneous Removal of Ammonium, Nitrate, and Phosphate from Eutrophic Water. J. Clean. Prod. 2018, 176, 230–240. [Google Scholar] [CrossRef]
- Gong, H.; Tan, Z.; Zhang, L.; Huang, Q. Preparation of Biochar with High Absorbability and Its Nutrient Adsorption–Desorption Behaviour. Sci. Total Environ. 2019, 694, 133728. [Google Scholar] [CrossRef] [PubMed]
- Luo, L.; Wang, G.; Shi, G.; Zhang, M.; Zhang, J.; He, J.; Xiao, Y.; Tian, D.; Zhang, Y.; Deng, S.; et al. The Characterization of Biochars Derived from Rice Straw and Swine Manure, and Their Potential and Risk in N and P Removal from Water. J. Environ. Manag. 2019, 245, 1–7. [Google Scholar] [CrossRef] [PubMed]
- Takaya, C.; Parmar, K.; Fletcher, L.; Ross, A. Biomass-Derived Carbonaceous Adsorbents for Trapping Ammonia. Agriculture 2019, 9, 16. [Google Scholar] [CrossRef]
- Tang, Y.; Alam, M.S.; Konhauser, K.O.; Alessi, D.S.; Xu, S.; Tian, W.; Liu, Y. Influence of Pyrolysis Temperature on Production of Digested Sludge Biochar and Its Application for Ammonium Removal from Municipal Wastewater. J. Clean. Prod. 2019, 209, 927–936. [Google Scholar] [CrossRef]
- Xu, D.; Cao, J.; Li, Y.; Howard, A.; Yu, K. Effect of Pyrolysis Temperature on Characteristics of Biochars Derived from Different Feedstocks: A Case Study on Ammonium Adsorption Capacity. Waste Manag. 2019, 87, 652–660. [Google Scholar] [CrossRef]
- Xue, S.; Zhang, X.; Ngo, H.H.; Guo, W.; Wen, H.; Li, C.; Zhang, Y.; Ma, C. Food Waste Based Biochars for Ammonia Nitrogen Removal from Aqueous Solutions. Bioresour. Technol. 2019, 292, 121927. [Google Scholar] [CrossRef]
- Yin, Q.; Liu, M.; Ren, H. Removal of Ammonium and Phosphate from Water by Mg-Modified Biochar: Influence of Mg Pretreatment and Pyrolysis Temperature. BioResources 2019, 14, 6203–6218. [Google Scholar]
- Aghoghovwia, M.P.; Hardie, A.G.; Rozanov, A.B. Characterisation, Adsorption and Desorption of Ammonium and Nitrate of Biochar Derived from Different Feedstocks. Environ. Technol. 2020, 43, 774–787. [Google Scholar] [CrossRef]
- Chandra, S.; Medha, I.; Bhattacharya, J. Potassium-Iron Rice Straw Biochar Composite for Sorption of Nitrate, Phosphate, and Ammonium Ions in Soil for Timely and Controlled Release. Sci. Total Environ. 2020, 712, 136337. [Google Scholar] [CrossRef]
- Deng, Y.; Huang, S.; Dong, C.; Meng, Z.; Wang, X. Competitive Adsorption Behaviour and Mechanisms of Cadmium, Nickel and Ammonium from Aqueous Solution by Fresh and Ageing Rice Straw Biochars. Bioresour. Technol. 2020, 303, 122853. [Google Scholar] [CrossRef]
- Hu, X.; Zhang, X.; Ngo, H.H.; Guo, W.; Wen, H.; Li, C.; Zhang, Y.; Ma, C. Comparison Study on the Ammonium Adsorption of the Biochars Derived from Different Kinds of Fruit Peel. Sci. Total Environ. 2020, 707, 135544. [Google Scholar] [CrossRef] [PubMed]
- Wang, Z.; Li, J.; Zhang, G.; Zhi, Y.; Yang, D.; Lai, X.; Ren, T. Characterization of Acid-Aged Biochar and Its Ammonium Adsorption in an Aqueous Solution. Materials 2020, 13, 2270. [Google Scholar] [CrossRef]
- Xiao, R.; Zhang, H.; Tu, Z.; Li, R.; Li, S.; Xu, Z.; Zhang, Z. Enhanced Removal of Phosphate and Ammonium by MgO-Biochar Composites with NH3·H2O Hydrolysis Pretreatment. Env. Sci. Pollut. Res 2020, 27, 7493–7503. [Google Scholar] [CrossRef] [PubMed]
- Chen, M.; Wang, F.; Zhang, D.; Yi, W.; Liu, Y. Effects of Acid Modification on the Structure and Adsorption NH4+-N Properties of Biochar. Renew. Energy 2021, 169, 1343–1350. [Google Scholar] [CrossRef]
- Zhang, L.; Deng, F.; Liu, Z.; Ai, L. Removal of Ammonia Nitrogen and Phosphorus by Biochar Prepared from Sludge Residue after Rusty Scrap Iron and Reduced Iron Powder Enhanced Fermentation. J. Environ. Manag. 2021, 282, 111970. [Google Scholar] [CrossRef]
- Phuong, N.V.; Hoang, N.K.; Luan, L.V.; Tan, L.V. Evaluation of NH 4 + Adsorption Capacity in Water of Coffee Husk-Derived Biochar at Different Pyrolysis Temperatures. Int. J. Agron. 2021, 2021, 1463814. [Google Scholar] [CrossRef]
- Li, X.; Shi, J. Simultaneous Adsorption of Tetracycline, Ammonium and Phosphate from Wastewater by Iron and Nitrogen Modified Biochar: Kinetics, Isotherm, Thermodynamic and Mechanism. Chemosphere 2022, 293, 133574. [Google Scholar] [CrossRef]
- Wang, S.; Ai, S.; Nzediegwu, C.; Kwak, J.-H.; Islam, M.S.; Li, Y.; Chang, S.X. Carboxyl and Hydroxyl Groups Enhance Ammonium Adsorption Capacity of Iron (III) Chloride and Hydrochloric Acid Modified Biochars. Bioresour. Technol. 2020, 309, 123390. [Google Scholar] [CrossRef]
- Munar-Florez, D.A.; Varón-Cardenas, D.A.; Ramírez-Contreras, N.E.; García-Núñez, J.A. Adsorption of Ammonium and Phosphates by Biochar Produced from Oil Palm Shells: Effects of Production Conditions. Results Chem. 2021, 3, 100119. [Google Scholar] [CrossRef]
- Dempster, A.P.; Laird, N.M.; Rubin, D.B. Maximum Likelihood from Incomplete Data via the EM Algorithm. J. R. Stat. Soc. 1977, 39, 1–38. [Google Scholar]
- Little, R.J.A.; Rubin, D.B. Statistical Analysis with Missing Data: Little/Statistical Analysis with Missing Data; John Wiley & Sons, Inc.: Hoboken, NJ, USA, 2002; ISBN 978-1-119-01356-3. [Google Scholar]
- Roweis, S. EM Algorithms for PCA and SPCA. In Advances in Neural Information Processing Systems; MIT Press: Cambridge, MA, USA, 1997; Volume 10. [Google Scholar]
- Malan, L.; Smuts, C.M.; Baumgartner, J.; Ricci, C. Missing Data Imputation via the Expectation-Maximization Algorithm Can Improve Principal Component Analysis Aimed at Deriving Biomarker Profiles and Dietary Patterns. Nutr. Res. 2020, 75, 67–76. [Google Scholar] [CrossRef] [PubMed]
- Van Ginkel, J.R.; Kroonenberg, P.M.; Kiers, H.A.L. Missing Data in Principal Component Analysis of Questionnaire Data: A Comparison of Methods. J. Stat. Comput. Simul. 2014, 84, 2298–2315. [Google Scholar] [CrossRef]
- Liang, P.; Yu, H.; Huang, J.; Zhang, Y.; Cao, H. The Review on Adsorption and Removing Ammonia Nitrogen with Biochar on Its Mechanism. MATEC Web Conf. 2016, 67, 07006. [Google Scholar] [CrossRef]
- Sizmur, T.; Fresno, T.; Akgül, G.; Frost, H.; Moreno-Jiménez, E. Biochar Modification to Enhance Sorption of Inorganics from Water. Bioresour. Technol. 2017, 246, 34–47. [Google Scholar] [CrossRef]
- Premarathna, K.S.D.; Rajapaksha, A.U.; Sarkar, B.; Kwon, E.E.; Bhatnagar, A.; Ok, Y.S.; Vithanage, M. Biochar-Based Engineered Composites for Sorptive Decontamination of Water: A Review. Chem. Eng. J. 2019, 372, 536–550. [Google Scholar] [CrossRef]
- Zhang, M.; Song, G.; Gelardi, D.L.; Huang, L.; Khan, E.; Mašek, O.; Parikh, S.J.; Ok, Y.S. Evaluating Biochar and Its Modifications for the Removal of Ammonium, Nitrate, and Phosphate in Water. Water Res. 2020, 186, 116303. [Google Scholar] [CrossRef]
- Fay, M.P.; Proschan, M.A. Wilcoxon-Mann-Whitney or t-Test? On Assumptions for Hypothesis Tests and Multiple Interpretations of Decision Rules. Stat. Surv. 2010, 4, 1–39. [Google Scholar] [CrossRef]
- Ippolito, J.A.; Cui, L.; Kammann, C.; Wrage-Mönnig, N.; Estavillo, J.M.; Fuertes-Mendizabal, T.; Cayuela, M.L.; Sigua, G.; Novak, J.; Spokas, K.; et al. Feedstock Choice, Pyrolysis Temperature and Type Influence Biochar Characteristics: A Comprehensive Meta-Data Analysis Review. Biochar 2020, 2, 421–438. [Google Scholar] [CrossRef]
Figure 1.
Adsorption capacities of different materials.

Figure 2.
Adsorption capacities of different materials.

Figure 3.
Correlation matrix for key influencing parameters; red indicates positive correlation and blue indicates negative correlation.
Figure 3.
Correlation matrix for key influencing parameters; red indicates positive correlation and blue indicates negative correlation.

Figure 4.
PCA loading matrix for all data.

Figure 5.
PCA biplot for all data by biochar material.


Table 1.
Data collection of influencing factors for ammonium adsorption onto biochar from different review studies.
Table 1.
Data collection of influencing factors for ammonium adsorption onto biochar from different review studies.
| Influencing Factor | [55] | [56] | [57] | [10] | [58] |
| Dosage of biochar | x | ||||
| pH value of solution | x | x | x | ||
| Biochar particle size | x | x | |||
| Ammonium concentration in solution | x | x | |||
| Contact time | x | ||||
| Surface Area (BET *) | x | x | x | x | x |
| Pyrolysis temperature | x | x | x | x | |
| Competing ions (purity of solution) | x | x | x | ||
| Cation exchange capacity (CEC) | x | ||||
| Surface functional groups | x | x | x | x | |
| Ambient temperature | x | x |
* BET—Brunauer, Emmett, and Teller method for determining surface area.
Table 2.
Data availability for influencing factors.
| Influencing Factor | Available Observations (Out of 210) |
|---|---|
| Dosage of biochar | 210 |
| pH value of solution | 138 |
| Biochar particle size | 192 |
| Ammonium concentration in solution | 210 |
| Residence time | 198 |
| Surface Area (BET) | 163 |
| Pyrolysis temperature | 205 |
| Cation exchange capacity (CEC) | 57 |
Table 3.
Agricultural waste experiment examples of trends from biplot.
| Pyr. Temp. (C) | Part. Size (mm) | pH | NH4+ Conc. (mg/L) | Contact Time (h) | BET SA (m2/g) | Biochar Dose. (g/mL) | Ad. Cap. (mg/g) | % of Max Ads Cap | Study | Symbol in Figure 5 | Material |
|---|---|---|---|---|---|---|---|---|---|---|---|
| 600 | 0.25 | 8.15 | 250 | 20 | 10.995 | 0.02 | 9.14 | 73 | [20] | p | Rice husks |
| 600 | 0.25 | 8.15 | 500 | 20 | 10.995 | 0.02 | 17.18 | 69 | [20] | p | Rice husks |
| 600 | 0.25 | 8.15 | 750 | 20 | 10.995 | 0.02 | 25.08 | 67 | [20] | p | Rice husks |
| 600 | 0.25 | 8.15 | 1000 | 20 | 10.995 | 0.02 | 30.99 | 62 | [20] | p | Rice husks |
| 600 | 0.25 | 8.15 | 1400 | 20 | 10.995 | 0.02 | 37.63 | 54 | [20] | p | Rice husks |
| 600 | 0.25 | 7.0 | 1000 | 20 | 10.995 | 0.02 | 37.11 | 74 | [20] | q | Rice husks |
| 550 | - | - | 1026 | 12 | 6.16 | 0.004 | 2.1 | 1 | [44] | q | Rice husks |
| 550 | - | - | 1026 | 12 | 106.00 | 0.004 | 3.00 | 1 | [44] | q | Rice husks |
| 600 | 0.059 | 7.2 | 100 | 4.3 | 285.5 | 0.0008 | 78.67 | 63 | [47] | É | Walnut shells |
| 600 | 0.059 | 7.2 | 100 | 4.3 | 456.3 | 0.0008 | 68.78 | 55 | [47] | É | Walnut shells |
| 600 | 0.059 | 7.2 | 100 | 4.3 | 536.5 | 0.0008 | 80.16 | 64 | [47] | É | Walnut shells |
| 600 | 0.059 | 7.2 | 100 | 4.3 | 967.1 | 0.0008 | 108.4 | 87 | [47] | É | Walnut shells |
Publisher’s Note: MDPI stays neutral with regard to jurisdictional claims in published maps and institutional affiliations. |
© 2022 by the authors. Licensee MDPI, Basel, Switzerland. This article is an open access article distributed under the terms and conditions of the Creative Commons Attribution (CC BY) license (https://creativecommons.org/licenses/by/4.0/).
Share and Cite
MDPI and ACS Style
Shenk, A.; Ivan, J.-P.A.; Schwede, S.; Odlare, M. Analysis of Influencing Characteristics of Biochars for Ammonium Adsorption. Appl. Sci. 2022, 12, 9487. https://doi.org/10.3390/app12199487
AMA Style
Shenk A, Ivan J-PA, Schwede S, Odlare M. Analysis of Influencing Characteristics of Biochars for Ammonium Adsorption. Applied Sciences. 2022; 12(19):9487. https://doi.org/10.3390/app12199487
Chicago/Turabian StyleShenk, Aubrey, Jean-Paul A. Ivan, Sebastian Schwede, and Monica Odlare. 2022. "Analysis of Influencing Characteristics of Biochars for Ammonium Adsorption" Applied Sciences 12, no. 19: 9487. https://doi.org/10.3390/app12199487
Note that from the first issue of 2016, this journal uses article numbers instead of page numbers. See further details here.