
The Evaluation of Conventional, Electric and Hybrid Electric Passenger Car Pass-By Noise Annoyance Using Psychoacoustical Properties


Chair of Acoustics and Haptics, Faculty of Electrical Engineering, Technische Universität Dresden, 01062 Dresden, Germany
Appl. Sci. 2022, 12(10), 5146; https://doi.org/10.3390/app12105146
Submission received: 30 April 2022
/
Revised: 15 May 2022
/
Accepted: 18 May 2022
/
Published: 19 May 2022
(This article belongs to the Special Issue Psychoacoustic Approach to Noise: Evaluation, Estimation and Design)
Abstract
:Road traffic noise is one of the most prominent sources of urban noise pollution. Recently, as a result of the electrification of vehicles, lower noise levels are expected in urban areas at speeds below 50 km/h. The commonly used physical descriptor, the A-weighted sound pressure level, does not sufficiently characterize the perceived annoyance of either combustion engine or electric passenger car pass-by noises. Psychoacoustical descriptors are advantageous for characterization purposes. The objective of this study was to evaluate the perceived annoyance caused by the noise from internal combustion engine, electric, and hybrid passenger cars using psychoacoustical properties. To achieve this objective, the following steps were conducted. First, the binaurally recorded sounds of 40 cars from different brands with different motorization were presented to the subjects who indicated the intensity of their perceived annoyance on a quasi-continuous scale. Second, the signal and psychoacoustical properties of the recorded sounds were analyzed. Third, a new annoyance index was developed, based on annoyance judgments and signal and psychoacoustical properties, to characterize the annoyance caused by pass-by noises. One of the novel aspects of this study is the consideration of not only the pass-by sounds of the internal combustion engine passenger cars, but also the pass-by sounds of hybrid and electric passenger cars. An acceleration from idle to a target speed of 50 km/h was selected as a traffic pass-by situation, which differs from those considered in previous studies. The results of the study show that psychoacoustical properties, such as loudness, tonality, roughness, and fluctuation strength, are very useful to characterize the annoyance perception, which is caused by single passenger car pass-by sounds in the above mentioned traffic situation. The developed index, which is a weighted combination of chosen psychoacoustical properties, can be very useful for traffic planning and traffic noise prevention measures.
1. Introduction
Traffic noise is a serious worldwide problem. In Germany, 54 percent of the population complain about road traffic noise, 44 percent feel strongly disturbed by aircraft noise, and 38 percent feel strongly disturbed by train noise, according to recent research by the German Federal Environment Agency [1]. A reduction in urban noise is important to increase the quality of life and reduce health problems that are based on noise emissions. The relationship between traffic-noise-related annoyance and health problems was reported in a World Health Organization report [2]. The Guideline Development Group (GDG) defined this annoyance as a critical health outcome, and according to the guidelines, annoyance was the most objective measure of health outcomes. Noise annoyance may be part of the causal pathway of noise-induced cardiovascular and metabolic diseases [3,4,5,6]. Some previous studies found that there is a strong relationship between perceived annoyance by aircraft noise and mental health issues such as depression and anxiety [7,8]. The Gutenberg Health Study showed that the degree of noise annoyance reported by people living in the vicinity of the Frankfurt Airport was strongly associated with the degree of depression and anxiety [9]. Considering these aspects, it is important to find perceptually relevant sound properties to predict the perceived noise annoyance.
Until now, most scientific research and noise maps have been based on measured or calculated A-weighted equivalent continuous sound pressure levels or maximum time-weighted and A-weighted sound pressure levels with a FAST (t = 125 ms) time constant [2]. For daily noise exposure, the GDG strongly recommends reducing the noise levels produced by road traffic below 53 decibels (dB) Lden (day-evening-night-weighted sound pressure level) and reducing the noise levels produced by road traffic during night time below 45 dB Lnight (equivalent continuous sound pressure level when the reference time interval is during the night). If the sound properties, except for the sound pressure level, remain unchanged, an increase in the sound pressure level is directly proportional to the percentage of the population that is “highly annoyed” (%HA).
In the European Union and in several countries around the world, the vehicle pass-by noises are measured and evaluated according to the international standard ISO 362 [10]. This standard defines the sound pressure level thresholds for the pass-by noises. After long-term experience and the identification of several problems with the previous standard, the measurement method and other contents of the regulation were updated 6–8 years ago [10]. The updated standard takes into account particularly typical daily life urban driving conditions rather than only 50 km/h constant driving. The final “pass-by noise level” is calculated as a weighted average of the noise emitted by the vehicle in a full-load acceleration and at constant speed [11]. The current legislation has stricter sound pressure level limits and also includes the new driving conditions.
However, the sound pressure level is only one noise parameter among many other parameters and does not properly represent all the perceptual aspects of the noise. For example, temporal aspects play an important role in the perceived annoyance. Our hearing sense is very sensitive to each kind of temporal change. If noise events occur regularly or irregularly, or if noise events have fluctuating or modulating characteristics (such as diesel knocking), they are more annoying than stationary noise events.
Additionally, recent studies have shown that the spectral characteristics, high-frequency content, and tonality can play an important role in the perceived annoyance of various product sounds [12,13,14]. Except for the sound pressure level, the psychoacoustical and signal properties are also important for the perceived annoyance of electric car sounds. In particular, the sharpness and tonality of electric car sounds differ strongly from those of internal combustion engine (ICE) car sounds [15,16,17]. The tire-road noise, which can be a dominant sound source at some velocities depending on the engine type, can be better characterized using psychoacoustical parameters, such as loudness and sharpness, rather than A-weighted equivalent mean average sound pressure level (LAeq) or the A-weighted maximum sound pressure level (LAmax) [18,19,20].
The studies, which were conducted within the framework of the EU Project “Quiet City Transport”, showed that loudness, sharpness, roughness, impulsiveness, and relative approach are important psychoacoustical properties to describe the perceived annoyance of the pass-by sounds [21,22,23,24,25,26]. The studies of Marquis-Favre’s team showed that particularly the sensation dull/shrill, which can be characterized by the total energy of tonal components within critical bands from 16 to 24 barks, can describe urban road single-vehicle pass-by noise annoyance [27,28].
The aim of this study is to find perceptually relevant measures for the characterization of the noise annoyance caused by pass-by noise of passenger cars, including conventional, hybrid, and electric cars with and without an acoustic vehicle alerting system (AVAS) and signal. A real-life traffic pass-by situation, which is an acceleration from idle to 50 km/h, was selected for this study. The consideration of the hybrid and electric passenger cars including AVAS is one of the important novel aspects of this study. The selected pass-by situation differs from the existing literature [21,22,23,24,25,26,27,28]. To achieve the above-mentioned aim, the exterior noise signals of passenger cars, such as diesel, gasoline, hybrid, and electric, were recorded. Then, the recorded signals were analyzed, and psychoacoustical metrics were calculated. In parallel, a listening test was conducted to evaluate the perceived annoyance. The results of the psychoacoustical analyses and the annoyance evaluation test were correlated.
2. Pass-By Noise Annoyance Evaluation Experiment
Considering the above-mentioned previous scientific results and discussions, an annoyance evaluation experiment for pass-by noises was conducted to identify perceptually relevant measures for traffic noise annoyance.
2.1. Participants
Twenty-two people, including twelve men and ten women aged between 22 and 51 years, participated in the experiments. The participants had a normal hearing ability for their age (as determined by the testing). They were paid for their participation on an hourly basis. All participants had no specific knowledge of acoustics.
2.2. Stimuli
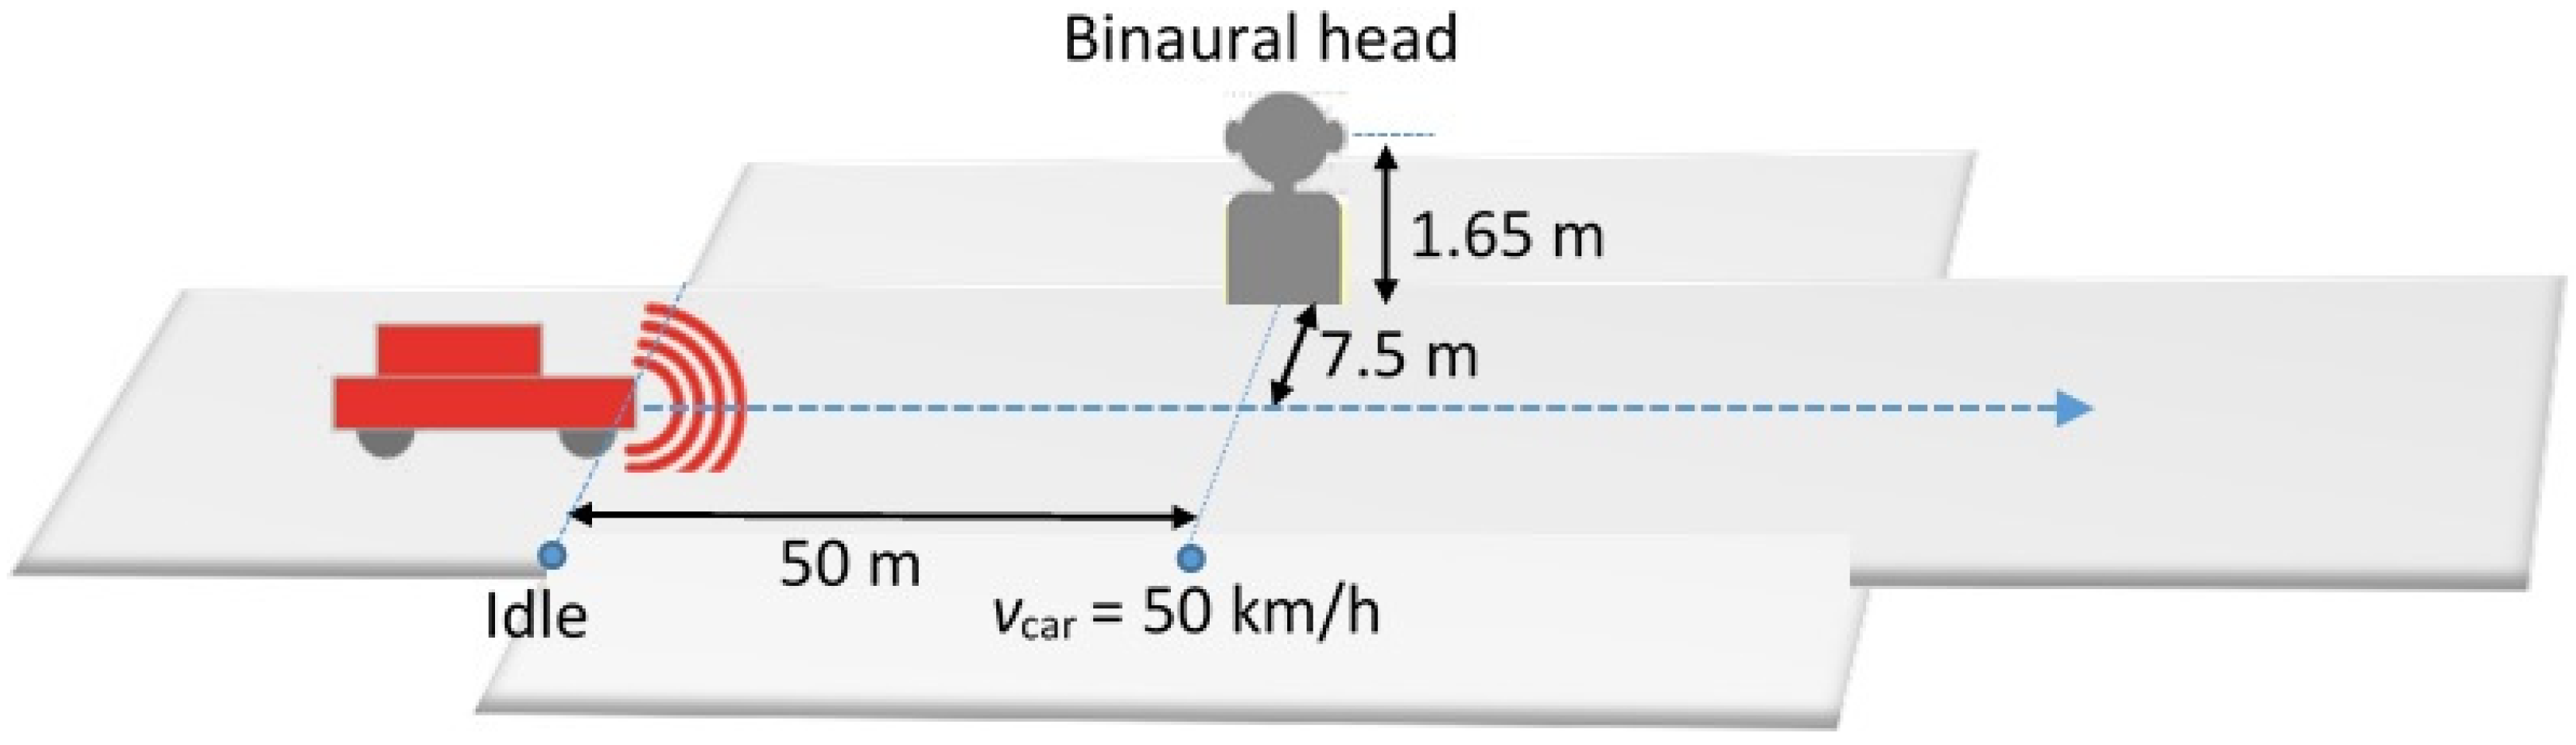
Representative vehicle types from different brands with different forms of motorization were selected. The sounds of 40 cars (11 cars with gasoline engines, 6 cars with diesel engines, 6 cars with hybrid engines, and 17 cars with electric engines) were recorded using an artificial head (HEAD acoustics HMS IV) that was placed 7.5 m from the middle of the vehicle according to ISO 362. The height of the artificial head ears was adjusted to 1.65 m. Some electric cars with and without an AVAS warning sound were recorded. The driving conditions involved an acceleration from idle (50 m from the artificial head) to 50 km/h. The cars reached a maximum speed of 50 km/h in front of the artificial head. Figure 1 shows a schematic representation of the pass-by traffic situation and measurement setup.
2.3. Methodology
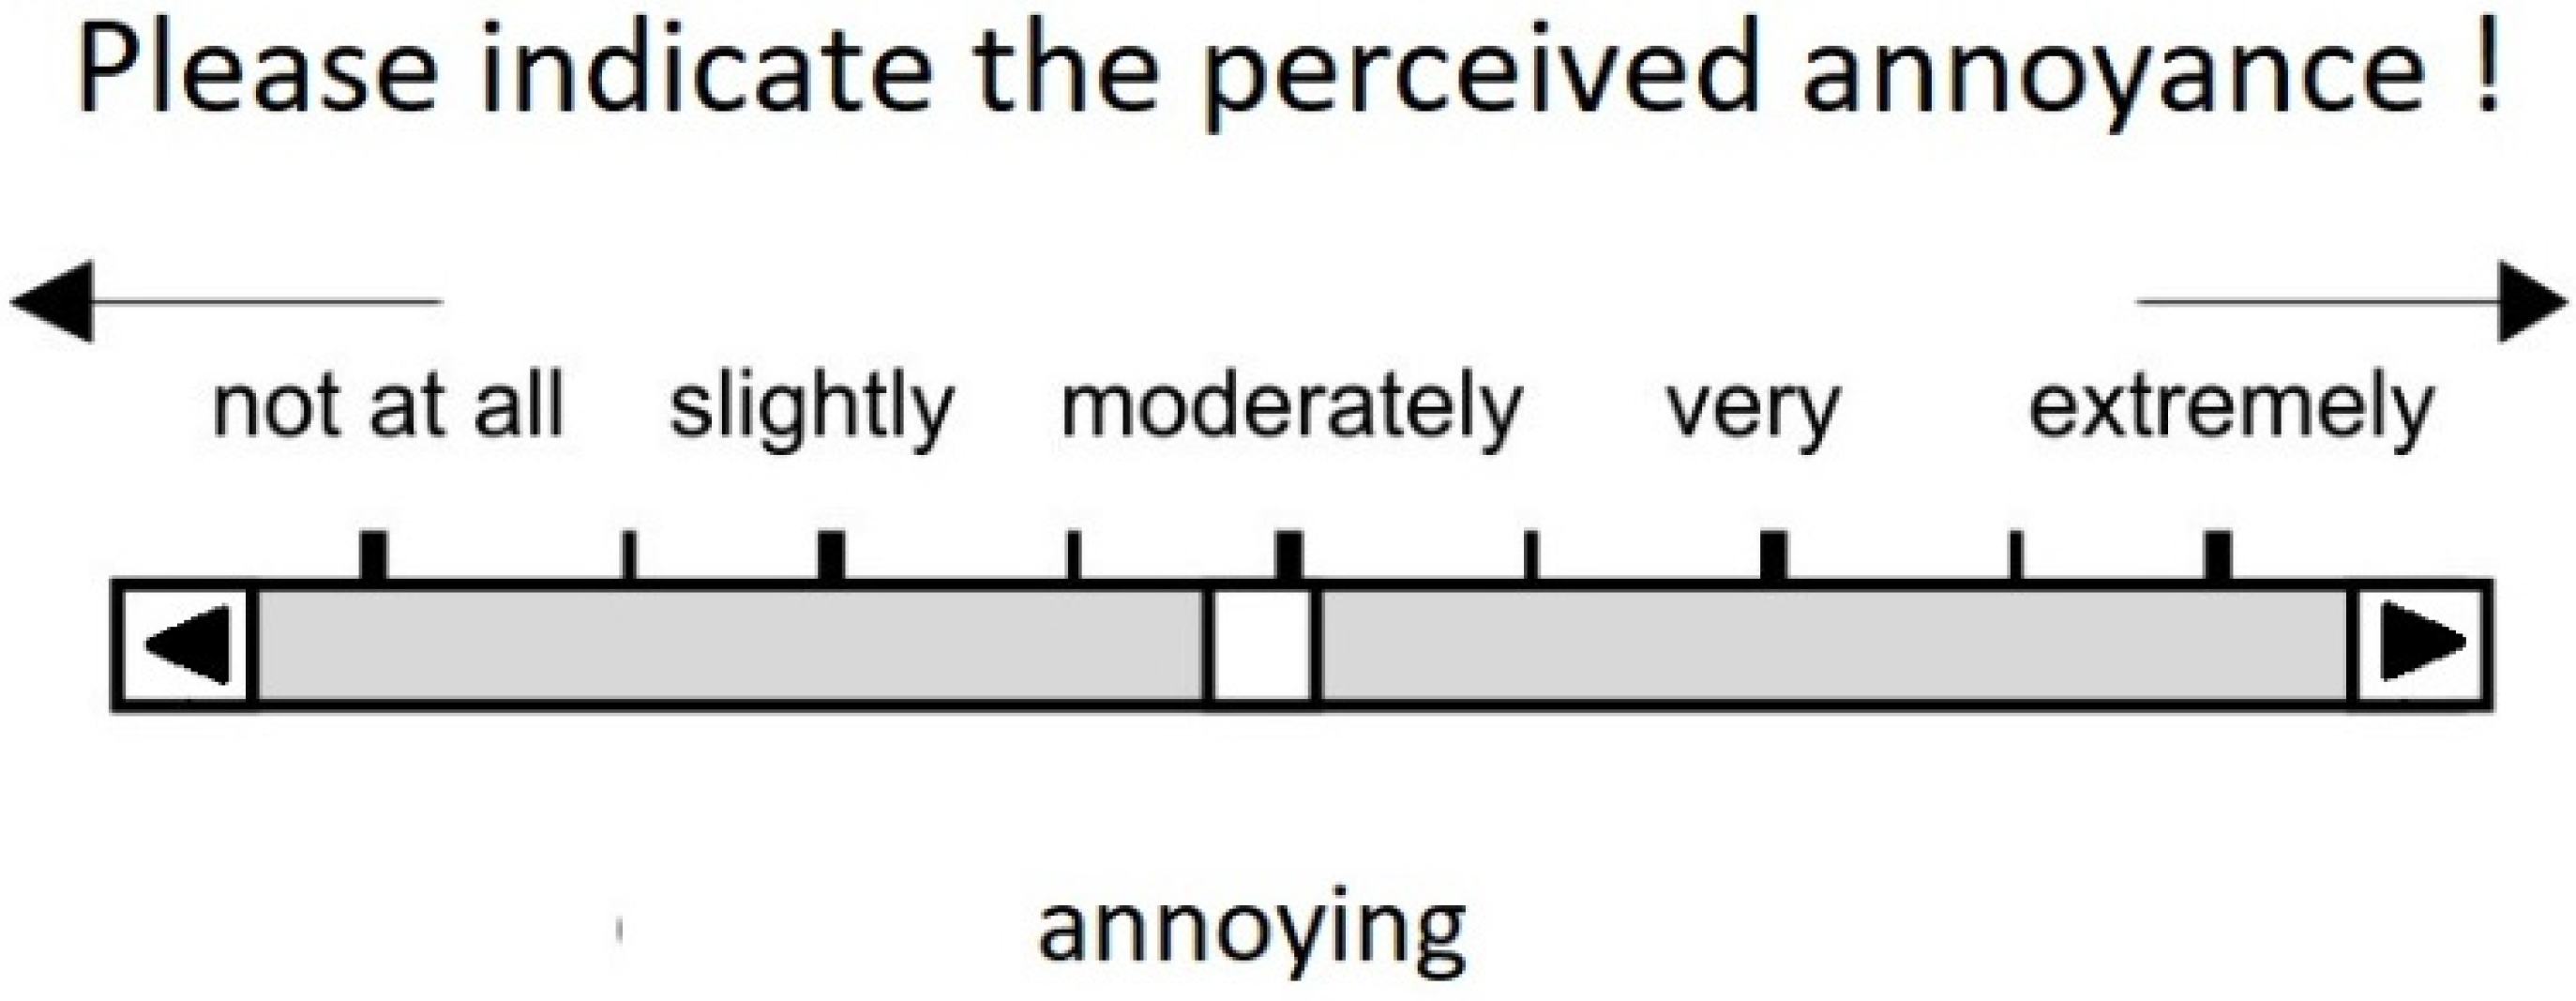
The listening test was conducted in a sound-insulated laboratory. The participants received an instruction and were asked to imagine a scenario as if they were actually there. The scenario was that they were in their flat/house, sitting in a room with an open window to a street in front of the flat/house. They heard various vehicle sounds and were asked to evaluate the annoyance of the sounds on a quasi-continuous scale, for which Rohrmann tested the equidistance of neighboring categories, of not at all (0), slightly (25), moderately (50), very (75), and extremely (100) annoying [29]. The length of the slider was 100 mm with a resolution of 1 mm. The score on this scale was equal to the distance (mm) from the left end of the bar. A graphical user interface in MATLAB [30] was implemented for the evaluation experiments (see also [31]). Figure 2 shows the slider and the scale, which was used in this study.
Stimuli were presented in a random order. The actual listening test was preceded by a training session. In this training session, several pass-by noises were presented to the subjects to introduce the stimuli range. The stimuli were presented in a sound-insulated laboratory via a calibrated headphone of Sennheiser type HD 600 and with the equalizer (HEAD acoustics PEQ IV).
2.4. Results
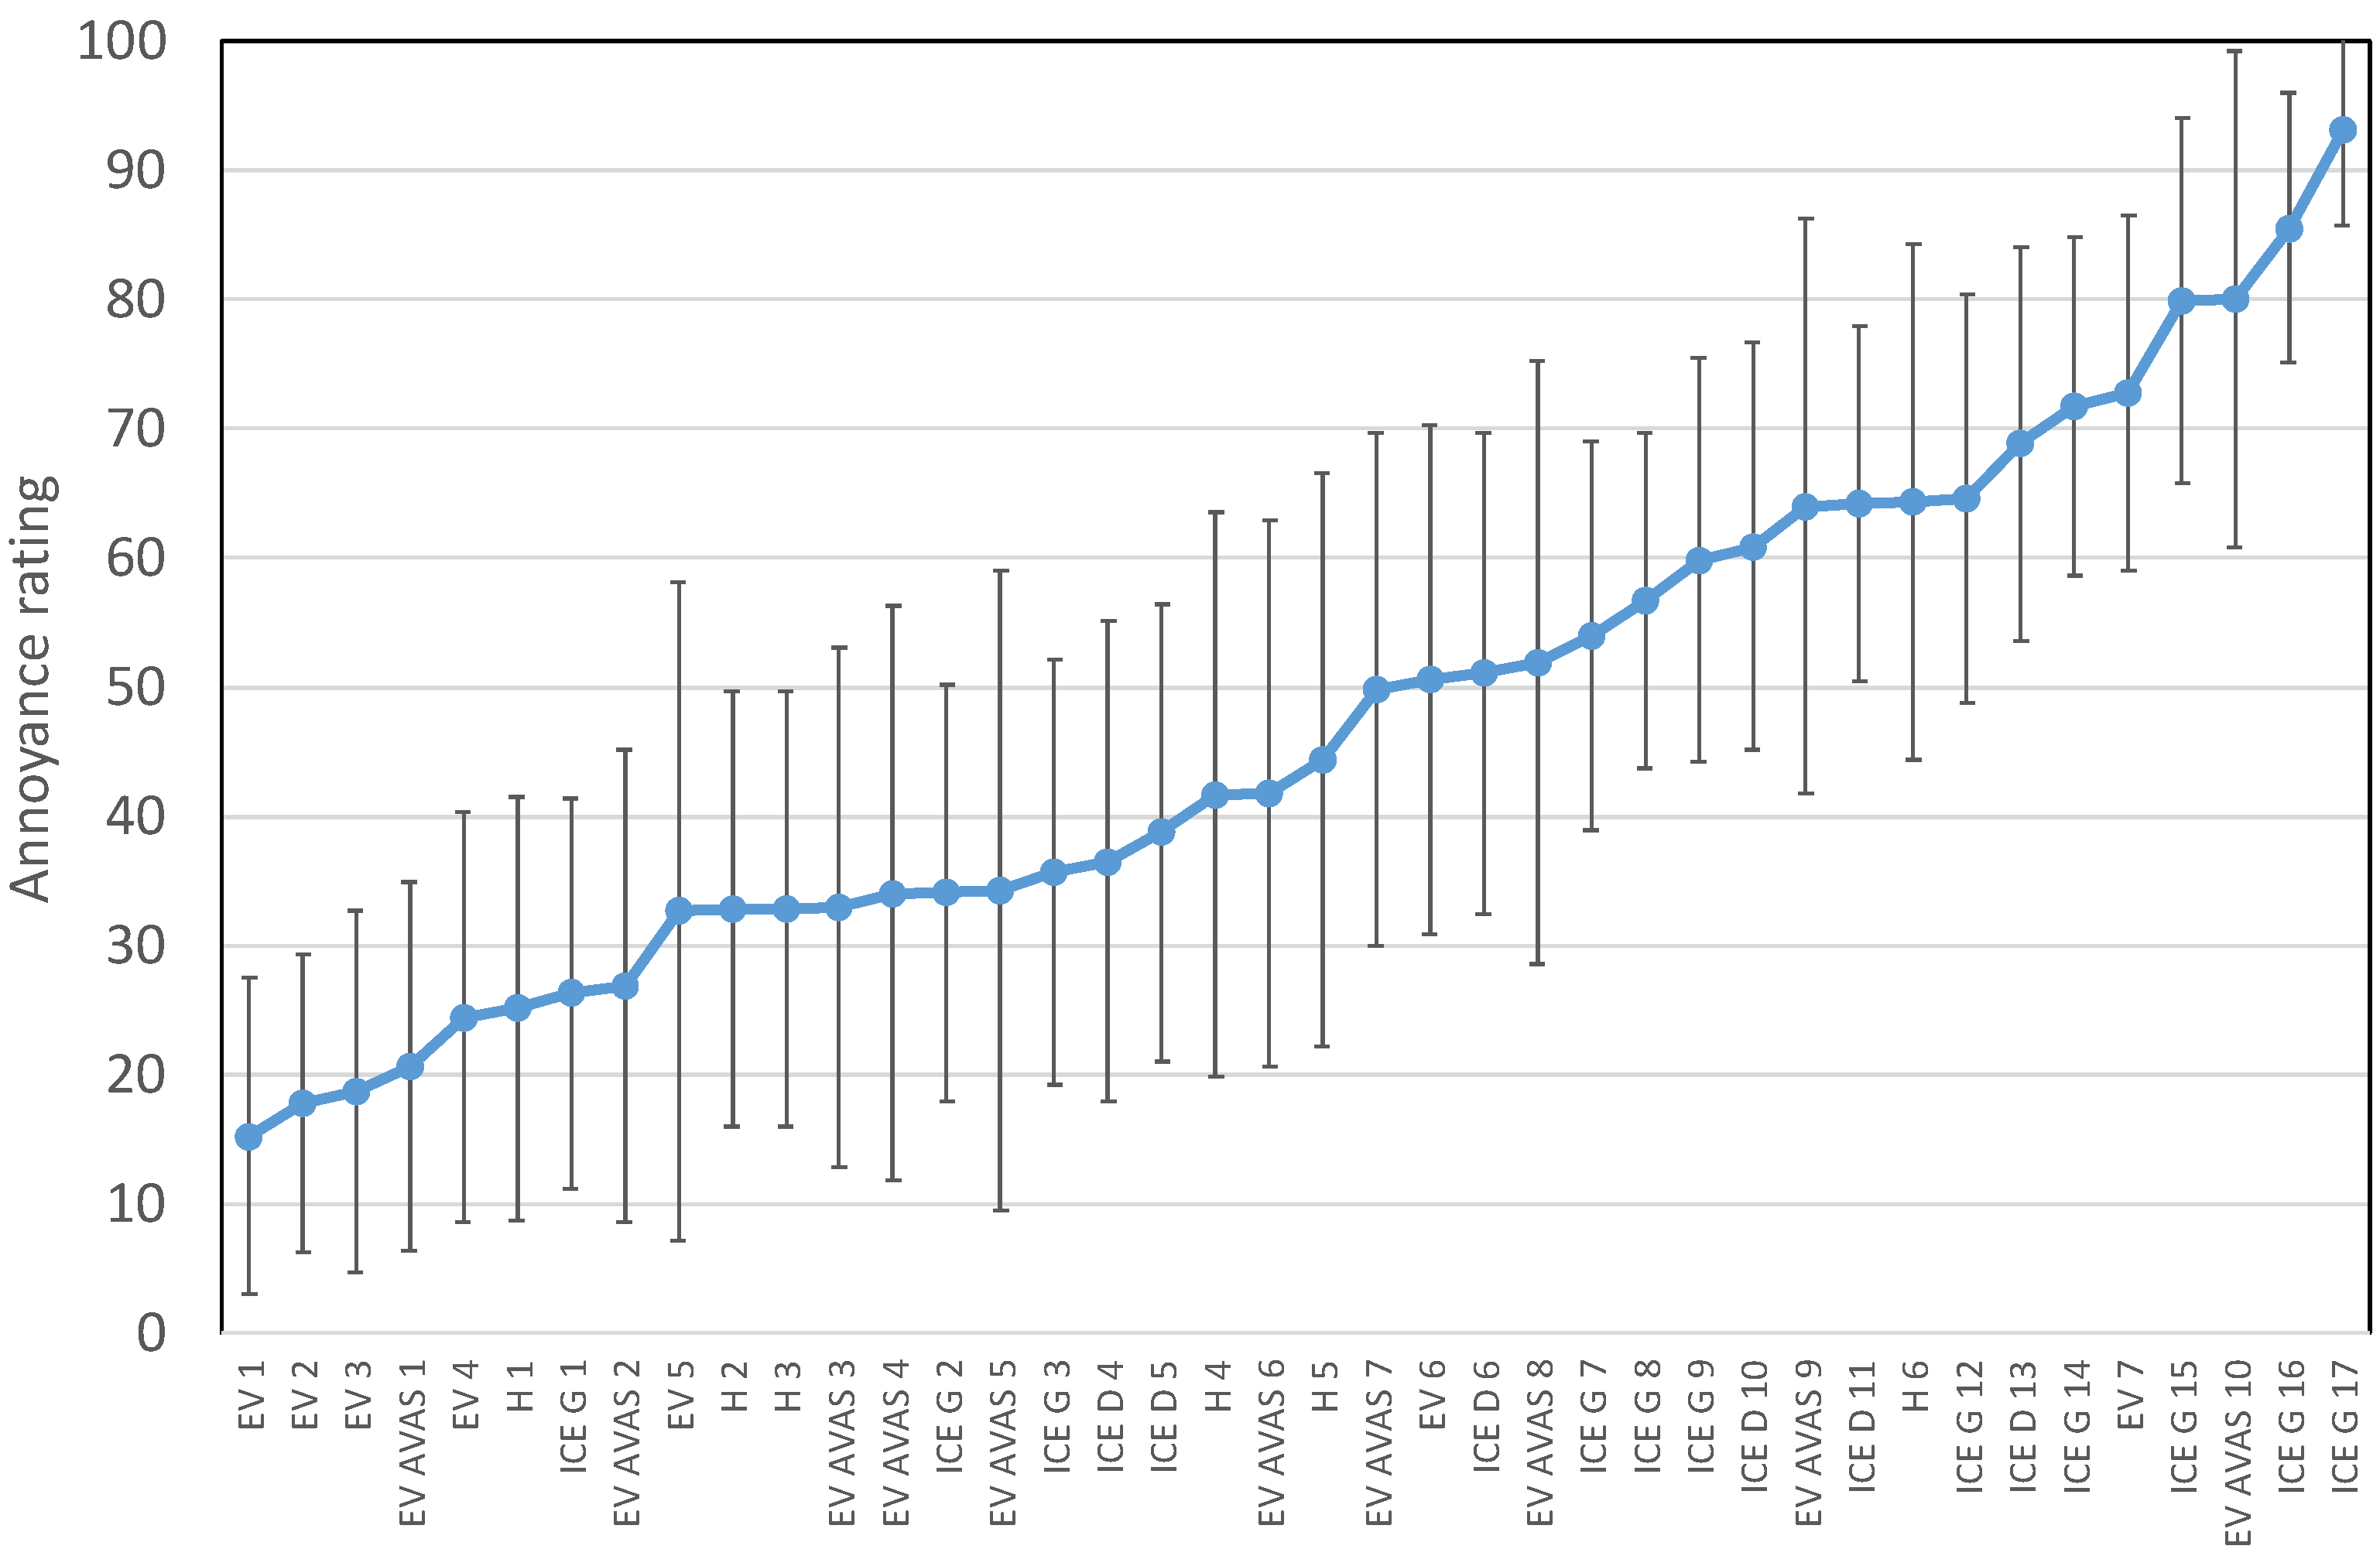
For a statistical analysis of the results, Shapiro-Wilk tests were used to check that the resulting dataset fulfilled the requirements for conducting a repeated measure analysis of variance (ANOVA). The annoyance ratings of the 40 recorded car sounds, which were averaged over all participants’ scores, were sorted in ascending order, as shown in Figure 3.
The results show that the annoyance levels of the vehicle sounds were rated in the range of 15 (slightly annoying) to 93 (extremely annoying). Most of the electric vehicle sounds were rated less annoying than ICE vehicle sounds. These results are in line with the literature data [15,16,17,32,33]. There are some very annoying electric cars with an AVAS, but at the same time, there are some slightly annoying electric cars with an AVAS. As expected, the AVAS will increase the annoyance of electric car sounds, but the type of AVAS sound plays an important role in the perception. Some AVAS sounds were rated less annoying than other AVAS sounds. Our previous studies showed that it is possible to design minimally annoying AVAS sounds that are detected at a safe distance in traffic [16].
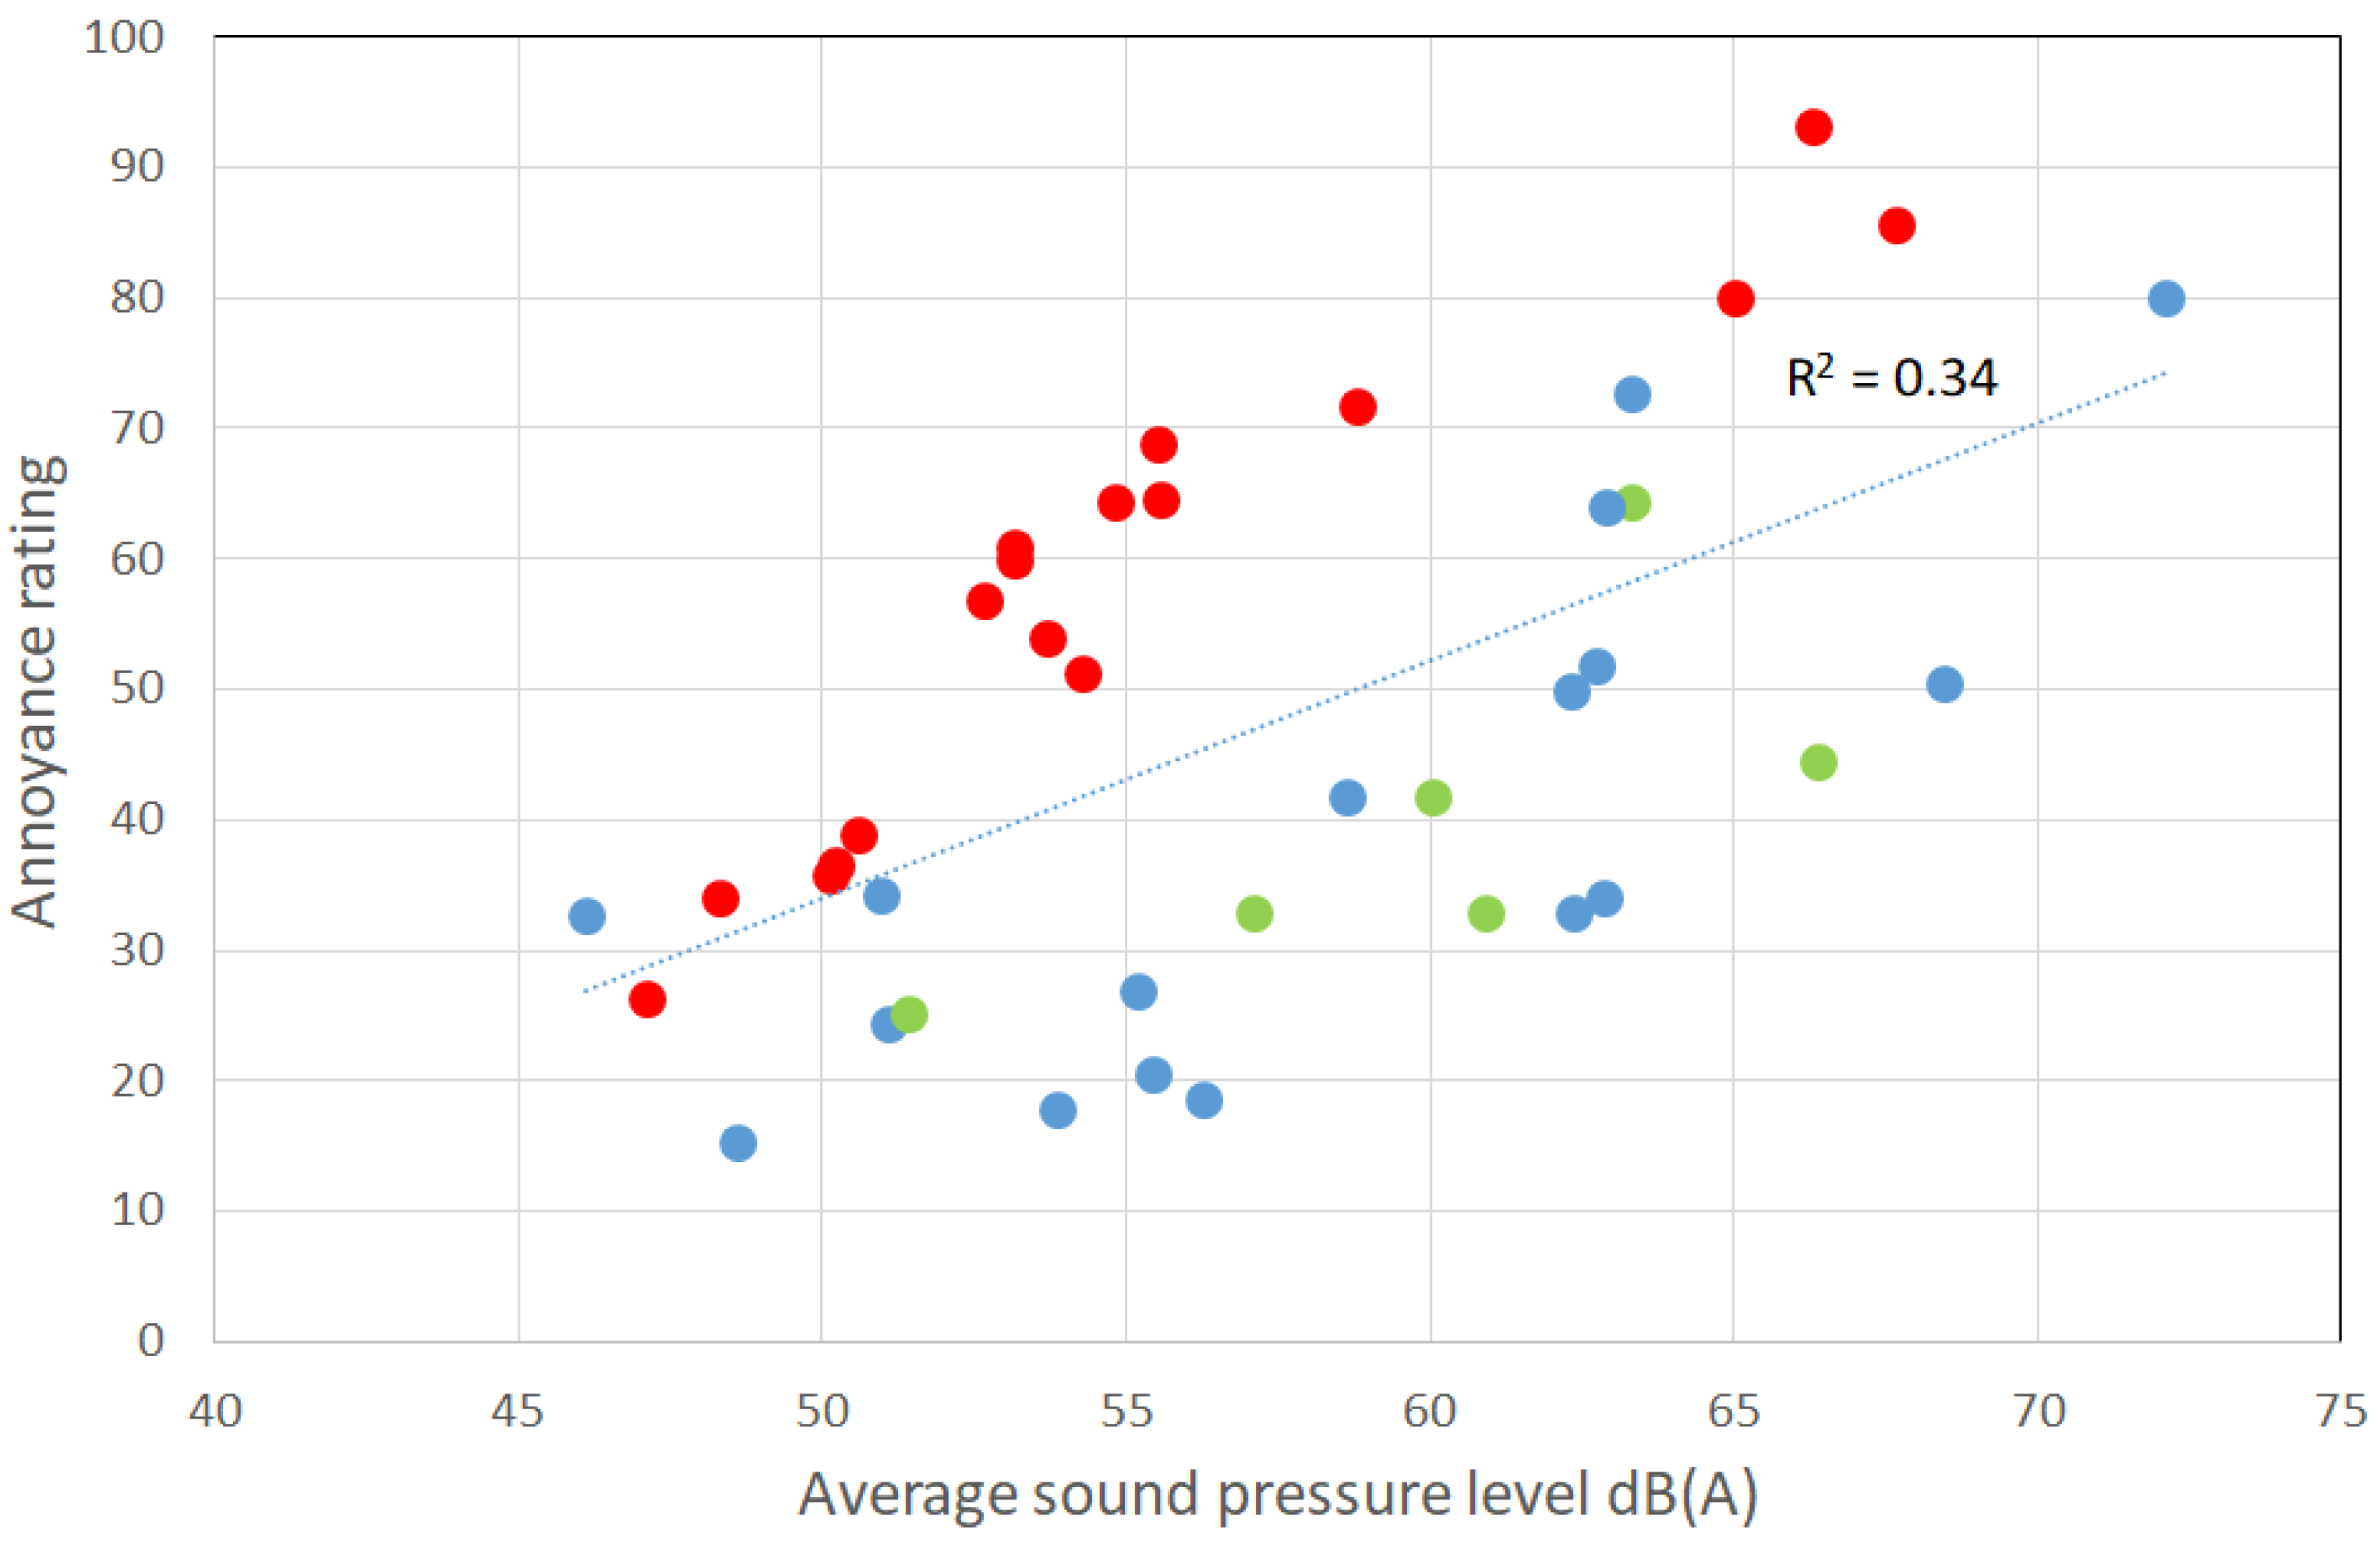
To understand which parameter can describe the perceived annoyance most appropriately, various analyses were conducted. First, the sound pressure levels of the car sounds were calculated. A regression analysis between the sound pressure levels in dB(A) and the annoyance judgments of the 40 vehicle sounds resulted in a coefficient of determination, which quantifies the strength of a linear relationship and the proportion of explained variance [34], R2 = 0.34. Figure 4 shows the relationship between the annoyance rating and the average sound pressure level. The correlation between the average sound pressure level and the annoyance ratings is very low. The sounds of both car groups, such as ICE (red dots) and hybrid/electric (green/blue dots), form two different groups, because the annoyance ratings of both groups differ from each other as discussed at Figure 2. The sounds of electric and hybrid electric passenger cars cause in most cases less annoyance than the sounds of ICE cars. Their average sound pressure levels are slightly lower or comparable to those of ICE cars.
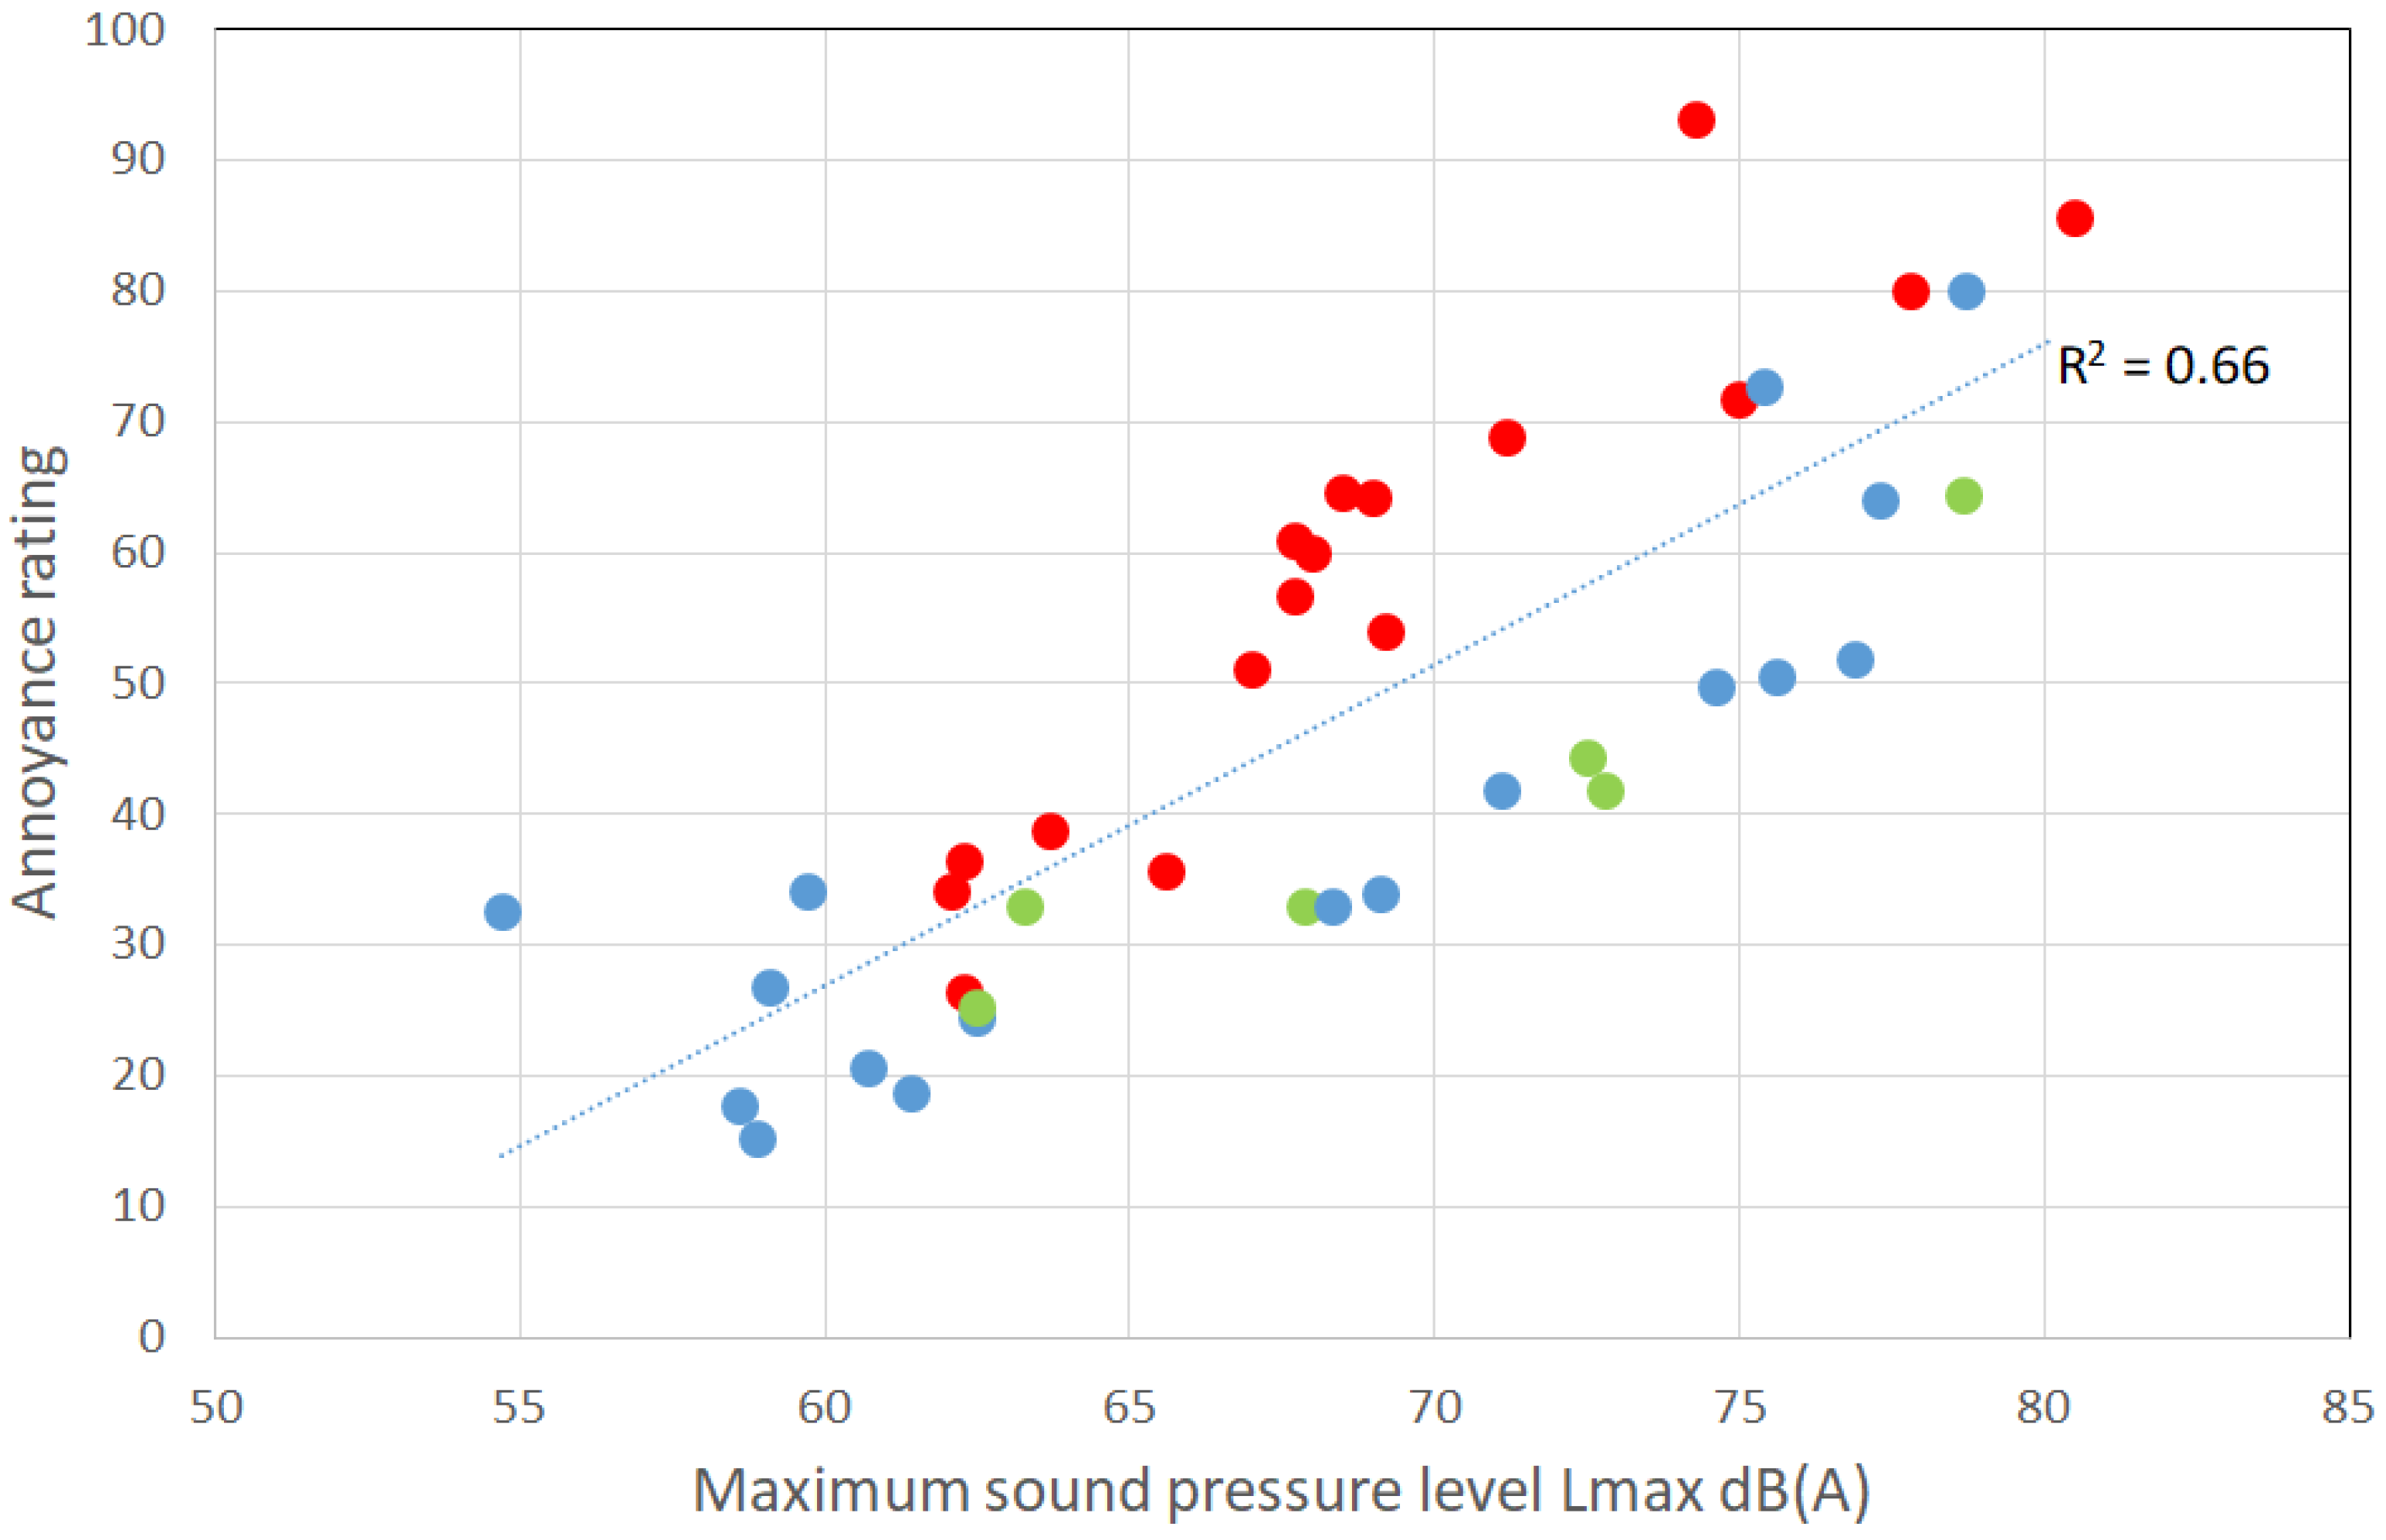
Previous studies showed that the maximum sound pressure level occurring in the interval of a vehicle pass-by is a better measure than the average sound pressure level [35,36]. The maximum sound pressure level (Lmax) values of the vehicle sounds and the annoyance ratings are shown in Figure 5. The regression resulted in a coefficient of determination of R2 = 0.65. This result shows that the maximum sound pressure level is more suitable for describing the perceived annoyance than the average sound pressure level, because the correlation between the annoyance ratings and the average sound pressure level is very low (R2 = 0.34).
Both the average and maximum sound pressure levels, which can be easily measured and determined, describe the perceived annoyance to a limited extent. Aurally adequate analyses are more suitable for describing the perceived annoyance, quality, and pleasantness of household appliance sounds, medical equipment sounds and auditory signs [12,13,14,37,38]. To describe the perceived characteristics of car pass-by noises, the psychoacoustical properties of the noises were calculated using different perceptual models.
A panel consisting of five acoustic experts and five naive participants with no technical background or specific acoustic knowledge listened to car pass-by noises and discussed their annoyance levels. The signal properties of the stimuli were analyzed using Short-Time Fourier Transform (STFT) and sound pressure level versus time analysis. The frequency content over time and several level properties, such as LAeq, Lmax, LAF, LAS, etc., were determined. Psychoacoustical properties, such as loudness, tonality, roughness and fluctuation strength, were selected as proper indicators for the annoyance characterization, taking into account the panel discussion, signal analyses of the car pass-by noises, and annoyance ratings from the listening experiment. Although sharpness was also considered as a possible indicator, the analysis results (von Bismarck model [39]), which can be found in Figure 7b, showed that the sharpness differences of the pass-by noises were very small and not very consistent with the annoyance ratings. An index was developed to account for the relationship between the annoyance ratings and the calculated psychoacoustical parameters. In this index, the Zwicker model was used for the calculation of the loudness (according to ISO532-1 [40]), the model from ECMA-74 was used for the calculation of the tonality, the Sottek model was used for the calculation of the roughness [41,42,43], and the Terhardt model was used for the calculation of the fluctuation strength [44]. The weightings of the psychoacoustical properties given in Equation (1) were determined considering the feedbacks during the panel and the relationship between the annoyance ratings and the results of the psychoacoustical properties. An important criterion was the differences in the numerical values of the psychoacoustical properties. For example, the numerical value of the loudness of car pass-by noises is 40 to 100 times higher than that of the tonality value. Another important criterion was to iteratively check if additional psychoacoustical property improves the coefficient of determination. If so, it was important to find which weighting delivers the optimum result without neglecting the feedback of panel members. The weighting of tonality gives tonality slightly lower importance than loudness in the equation. The numerical value of the loudness of pass-by noises is 10 to 20 times higher than that of the roughness value. Consideration of roughness in the equation improved the coefficient of determination. However, the contribution should be limited because of the achievement of an optimum coefficient of determination. The numerical value of the loudness of pass-by noises is 500 to 1000 times higher than that of the fluctuation strength value. Consideration of fluctuation strength in the equation also improved the coefficient of determination. However, the contribution should be limited because of the achievement of an optimum coefficient of determination. All these weightings are also in line with the feedback of the panel members.
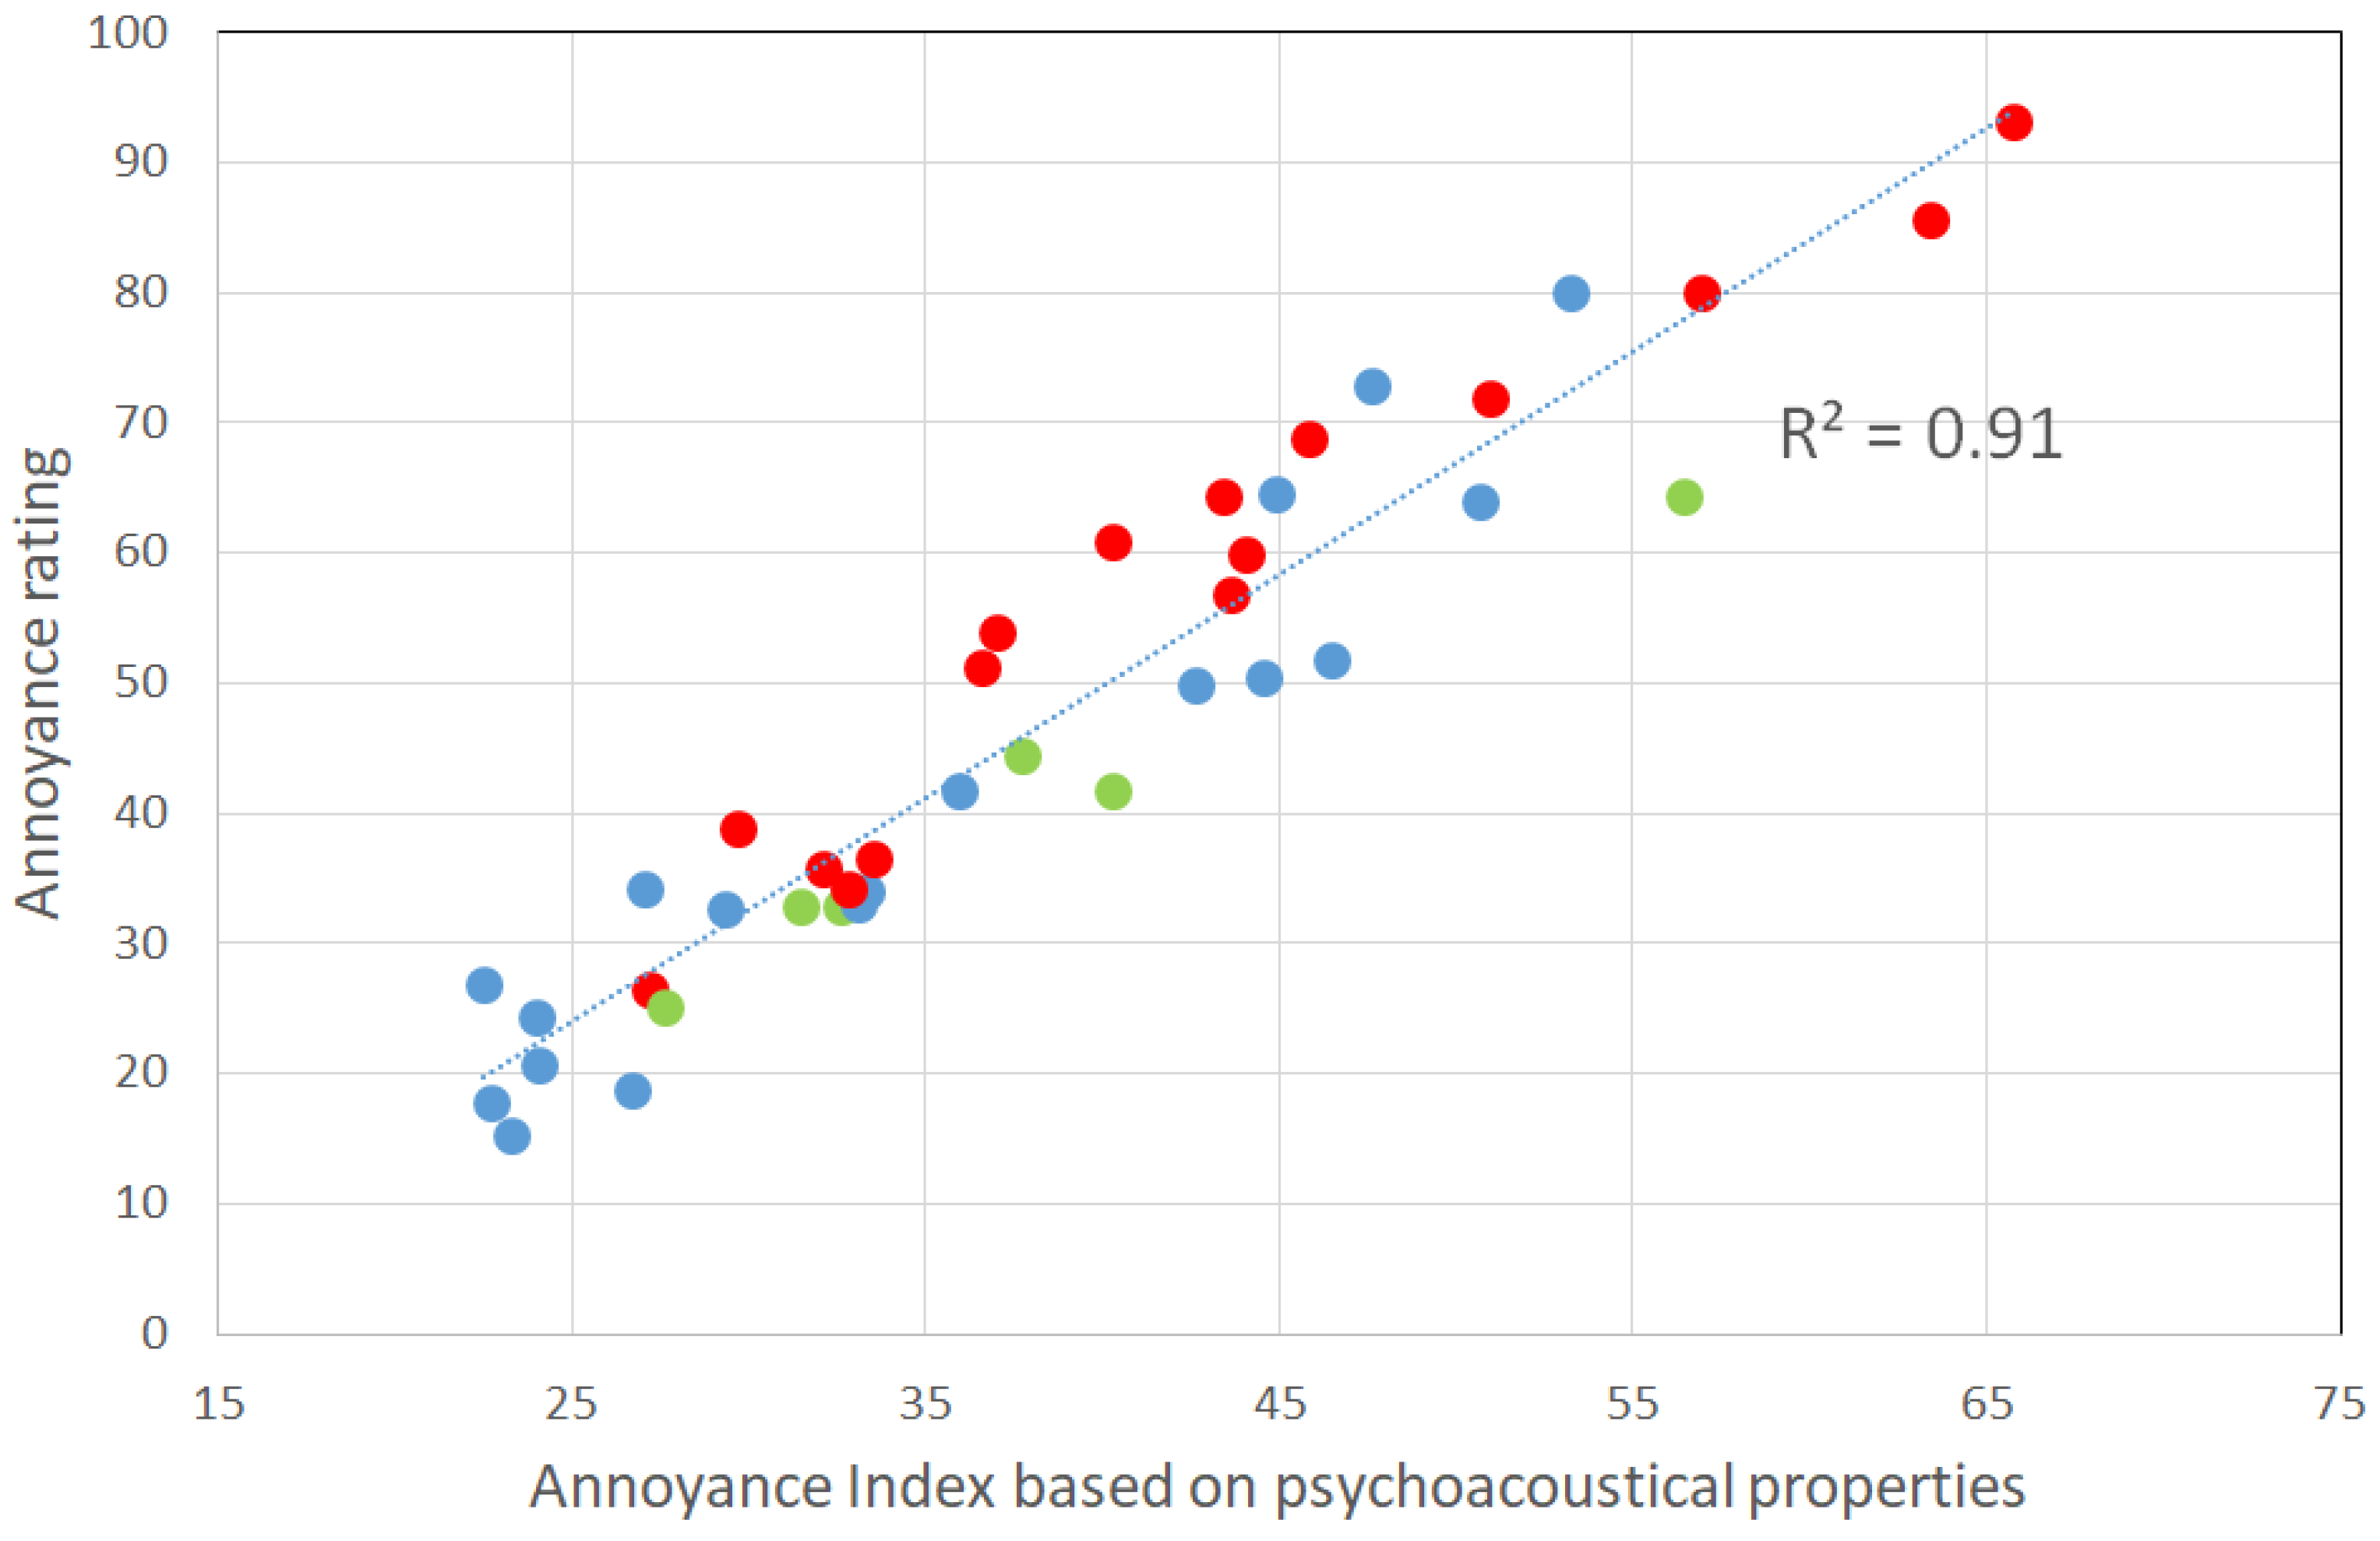
where AI is the “annoyance index”, N5 is the percentile loudness in sone (according to [39]), T5 is the percentile tonality in tu (according to [42]), R is the roughness in asper (according to [43]), and FS is the fluctuation strength in vacil (according to [44]). A regression analysis between the developed annoyance index and perceived annoyance ratings resulted in a coefficient of determination of R2 = 0.91. Figure 6 shows the results of regression analysis between the annoyance index and annoyance ratings.
AI = N5 + 60 × T5 + 2 × R + 50 × FS,
The relationship between the annoyance index (AI) and annoyance ratings (AR) was determined by linear fitting and can be described as:
AR = 1.714 × AI − 18.806,
Trollé et.al. proposed the Total Energy of Tonal Components (TETC) Index, which is presented in Equation (3), to characterize the high-frequency content due to the squeal noise of single tramway pass-by sounds [45]. Klein et al. showed that the TETC Index can characterize the breaking noise of urban road single-vehicle pass-by noises and annoyance-relevant sensation of dull/shrill due to single pass-by noises very well [27]. The driving condition and types of vehicles of this study differ from these investigations [27,45]. However, it is interesting to analyze the suitability of the TETC Index for the characterization of the perceived annoyance caused by the pass-by noise from internal combustion engine, electric, and hybrid passenger cars in this study.
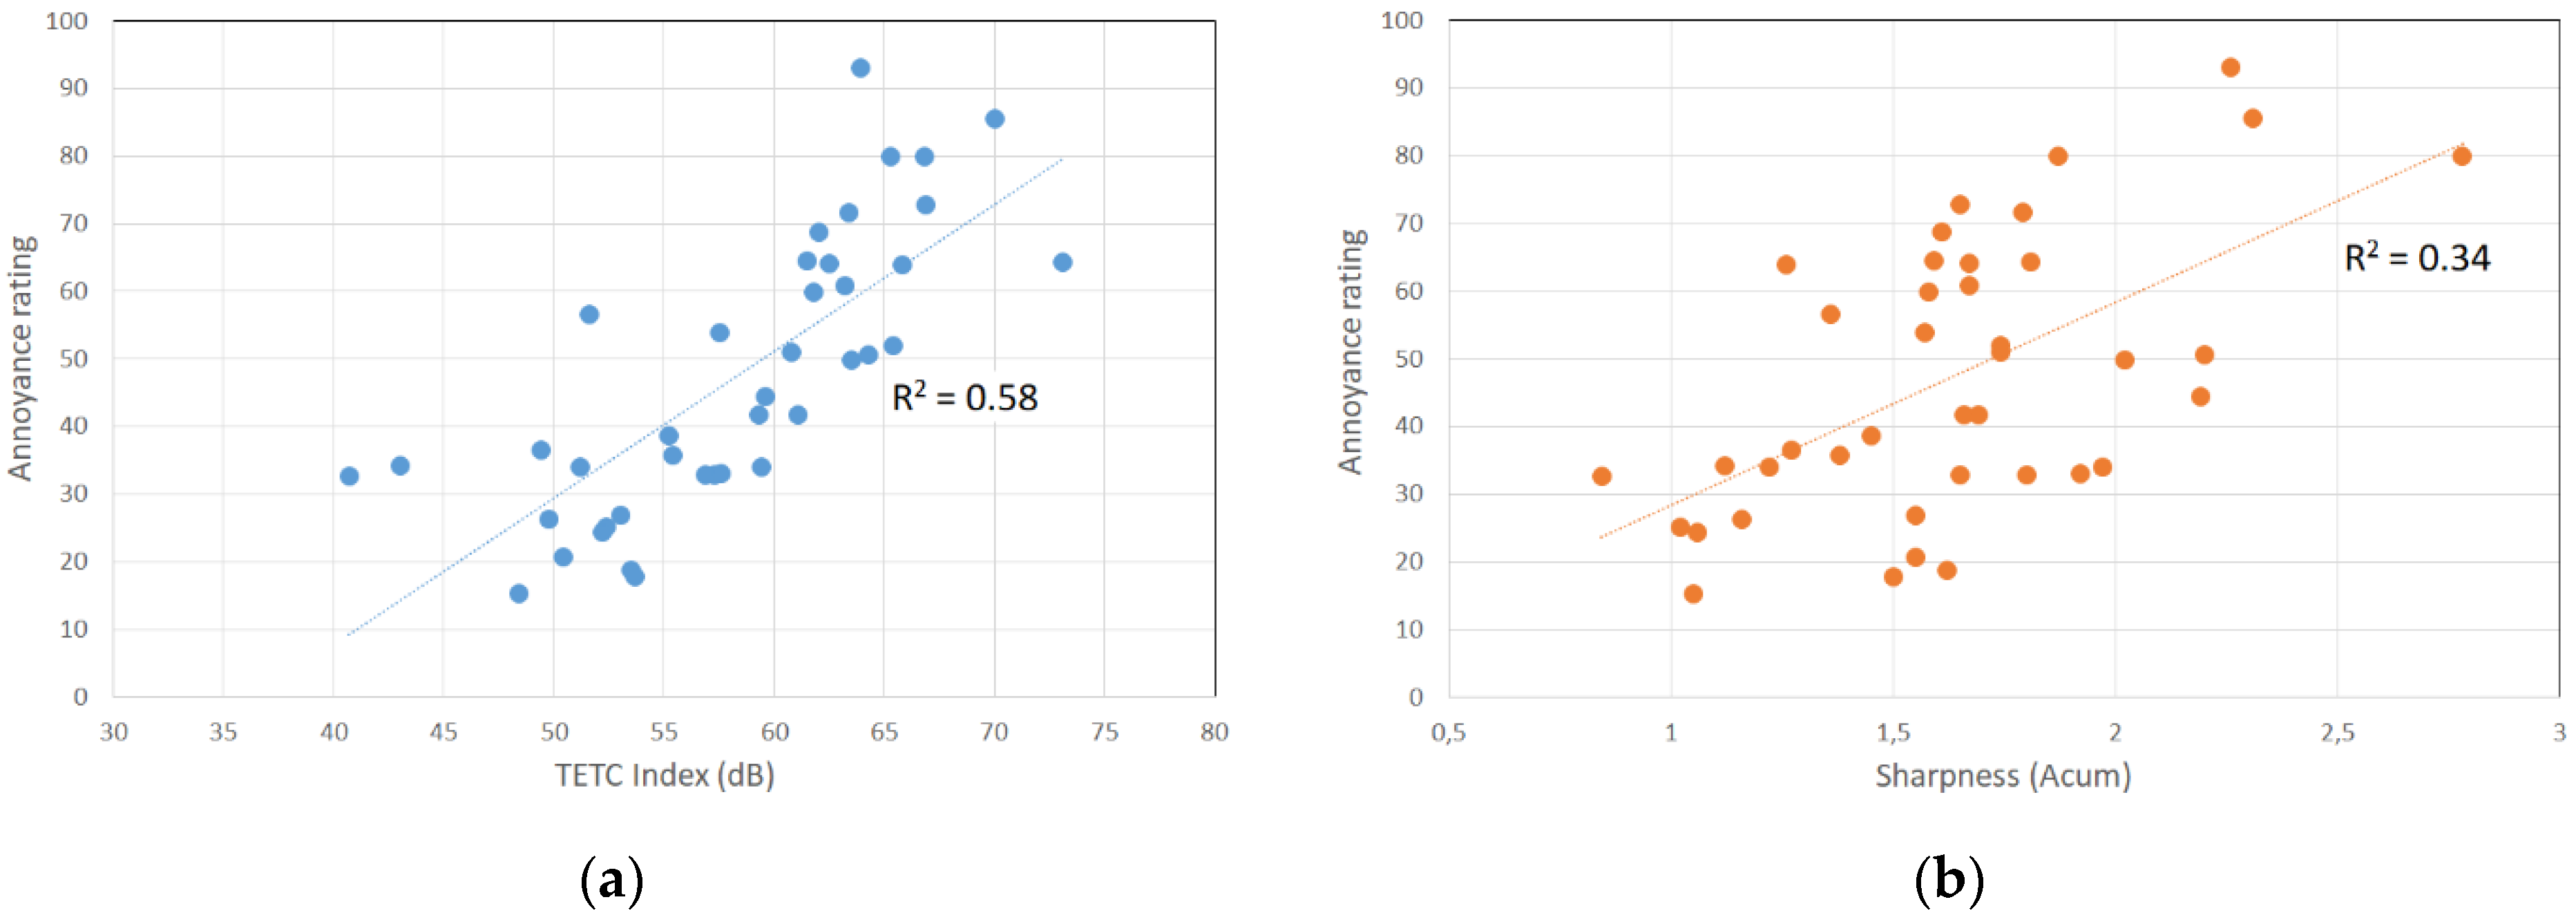
where TETC is the Total Energy of Tonal Components within critical bands from 16 to 24 barks and Lz is the maximal (across time) level of the tonal components as a function of the critical band rate z. As the sharpness results are not suitable to characterize the pass-by noise evaluation results in this study, the analysis of the TETC index can be useful. The TETC Index values of the vehicle sounds and the annoyance ratings are shown in Figure 7a and the sharpness values of the vehicle sounds and the annoyance ratings are shown in Figure 7b (sharpness model: von Bismark [39]). The results show that the TETC Index has a clearly better correlation with the annoyance evaluation results than sharpness.
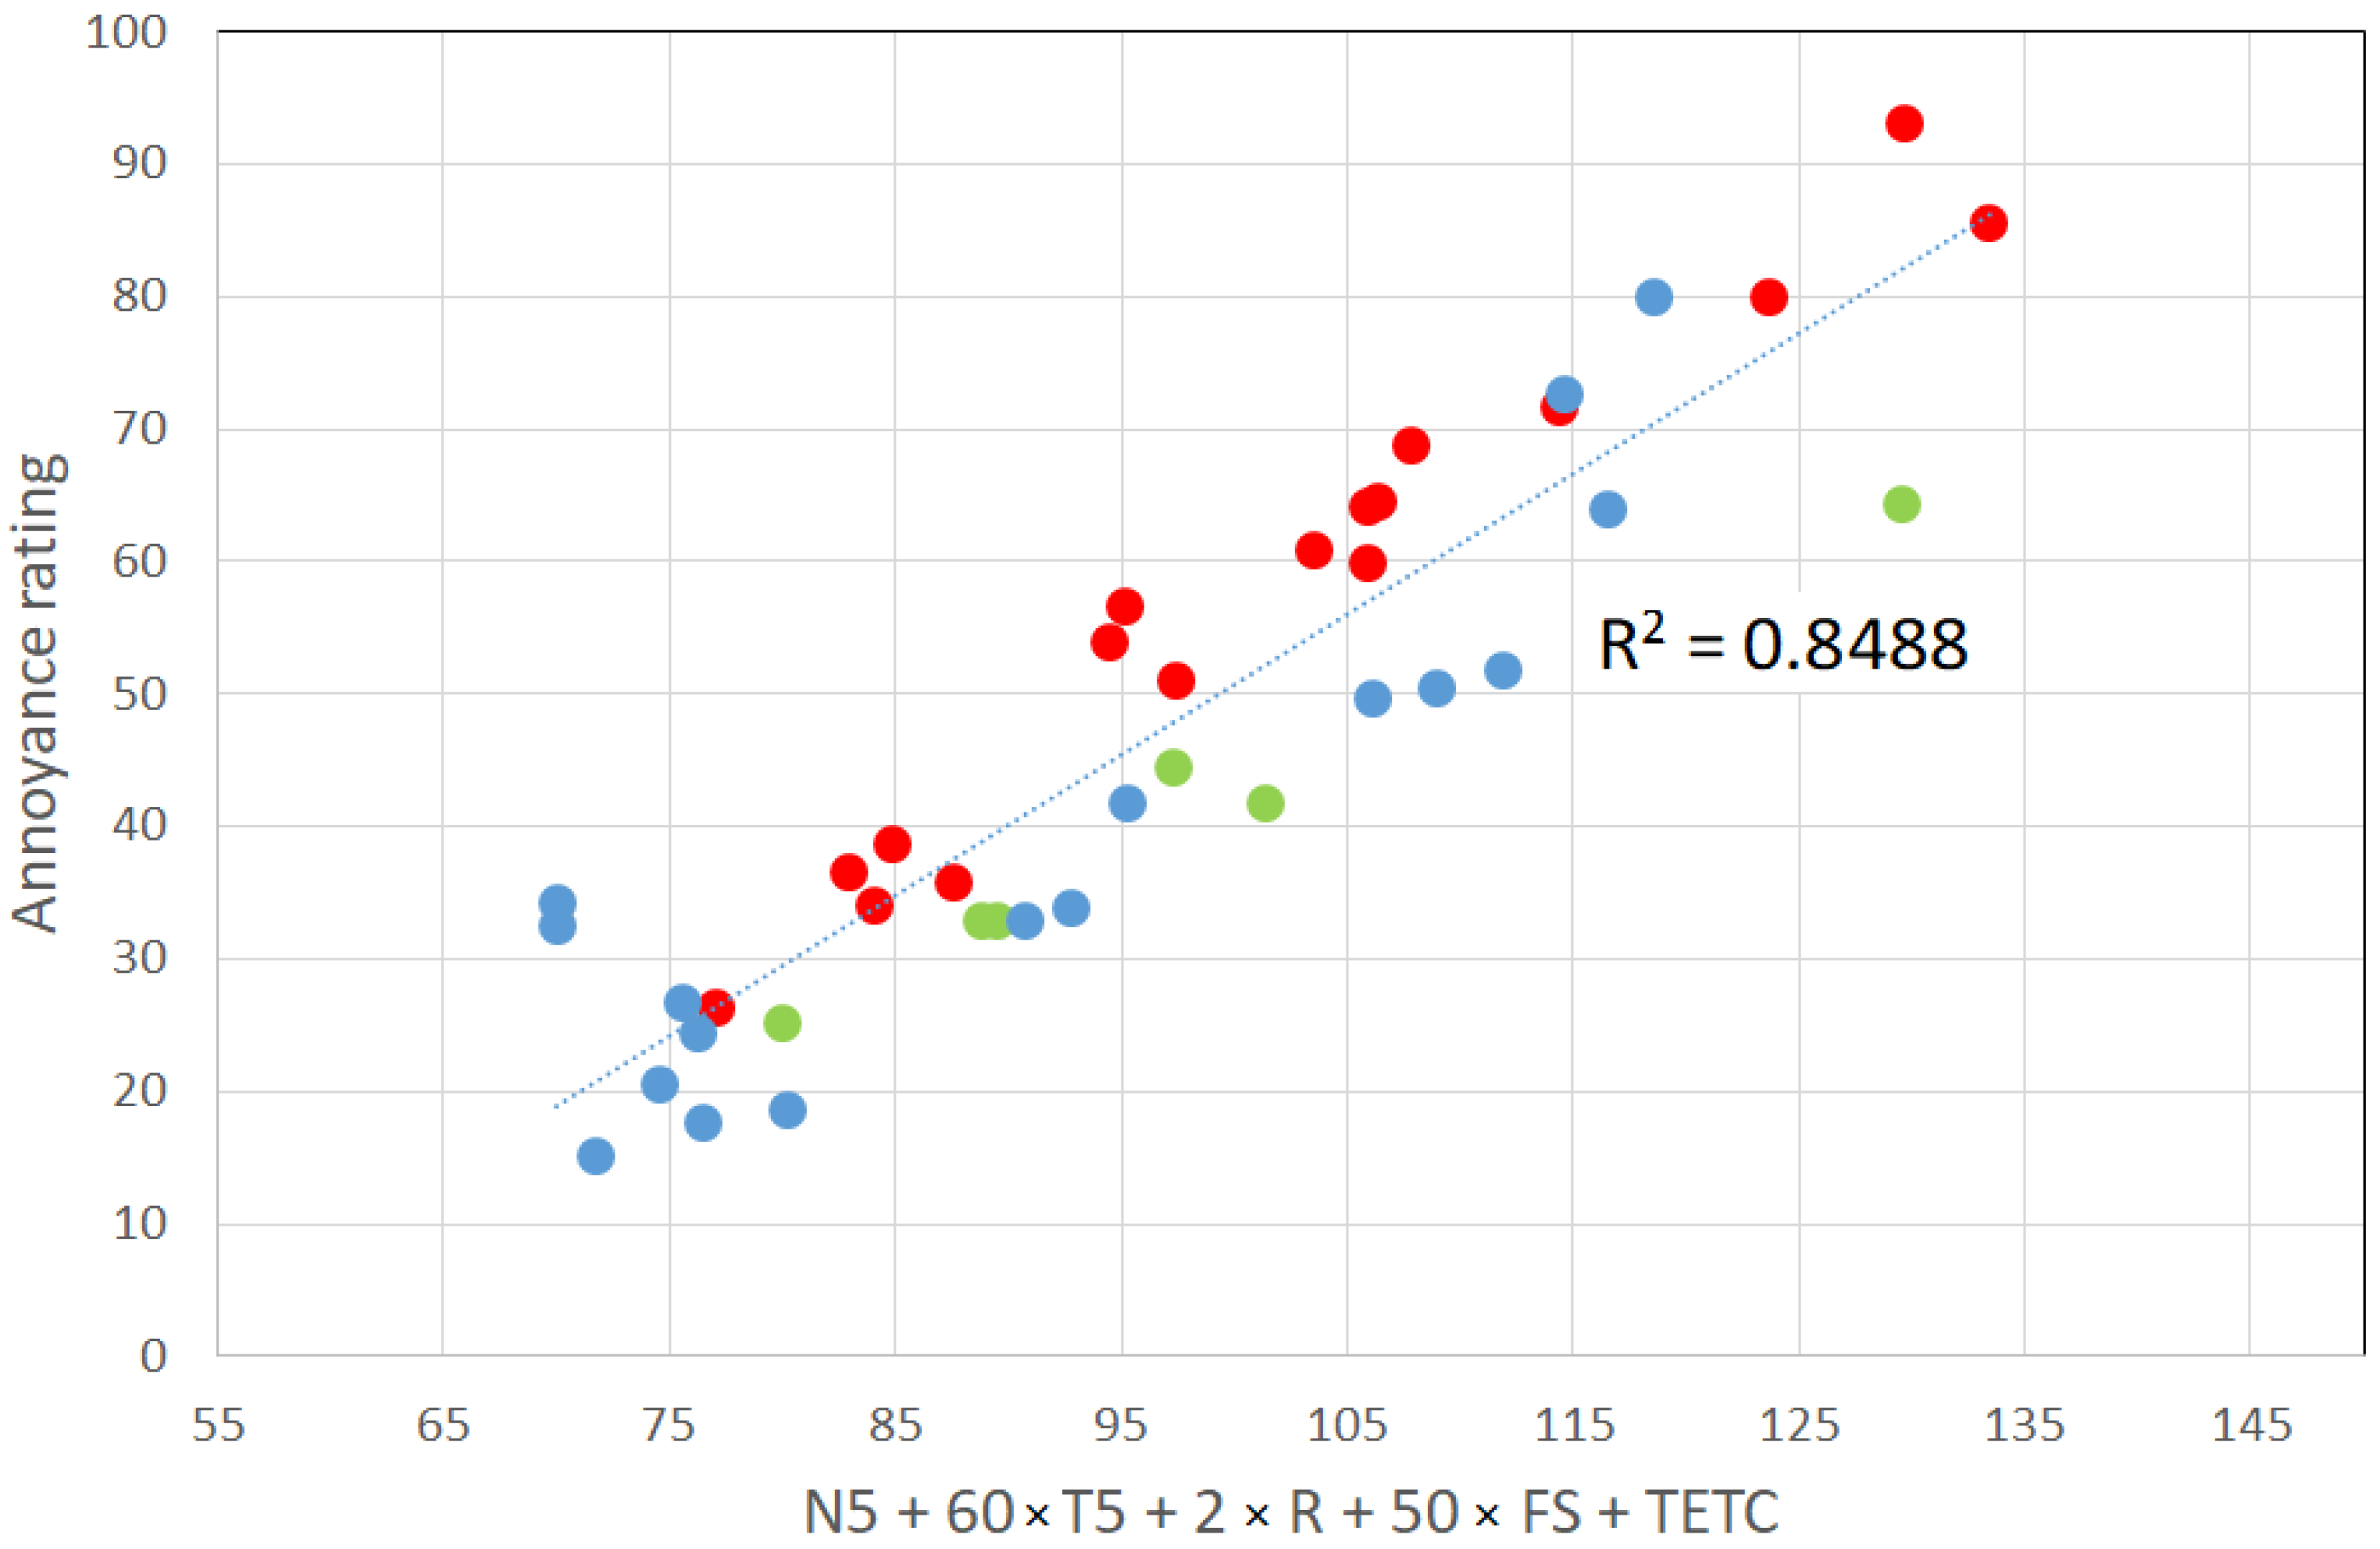
According to these results, the consideration of the TETC index at the annoyance index (Equation (1)) makes sense. However, the participation of the TETC index to the annoyance index, which was proposed in this study, did not cause better estimation of the annoyance index. The relationship between the index (AI = N5 + 60 × T5 + 2 × R + 50 × FS + TETC) and the annoyance ratings are shown in Figure 8. The regression resulted in a coefficient of determination of R2 = 0.84.
Taking this result into account, it was decided to propose the annoyance index from the Equation (1) to characterize the perceptual annoyance ratings of the car pass-by noises. The possible reason why TETC cannot strongly support the annoyance index, which is proposed in this study, will be discussed in the next section.
3. Discussion
Based on the experiments in this study, an attempt was made to provide insight into the relationship between the signal and psychoacoustical parameters of passenger car sounds and the perceived annoyance ratings. The analyses, which were conducted in this study, show that Lmax gives better results than the corresponding average sound pressure level to characterize the perceived annoyance of passenger car pass-by noises. Although Lmax seems to be helpful in describing the perceived annoyance, both the average and maximum sound pressure levels can describe the perception only to a limited extent. Psychoacoustical properties, which are based on perceptual models, are helpful for considering the various perceptual characteristics of car pass-by sounds. Therefore, an annoyance index, which is based on loudness, tonality, roughness, and fluctuation strength, is developed in this study. The correlation between the developed index and annoyance ratings is very high. The results show that the psychoacoustically motivated annoyance index can be very helpful for estimating the perceived annoyance and accordingly noise-annoyance-based health problems. This result is in line with various studies that evaluated the auditory annoyance of pass-by noises, household appliances, and information technology devices [12,13,21,24,27,43]. The analysis of the annoyance rating results and the panel discussion show that the perceived loudness of car pass-by sounds plays an important role in the perceived annoyance. The psychoacoustical property of loudness takes into account not only the frequency sensitivity of the human ear but also the spectral and temporal masking properties of the auditory system using a perceptually motivated ratio scale. Discrete tonal components, narrowband noise, and steep discontinuities in the noise spectra attract our attention more strongly than broadband noise alone [34]. STFT is helpful and was used in this study to identify the tonal components and their levels/frequencies in the pass-by sounds. A spectral analysis of car pass-by sounds using STFT shows that some of the sounds have strong tonal components. This is particularly true for electric cars, because in most cases electric motor or gear mechanisms produce strong tonal components. Additionally, the AVAS sounds mostly have a strong tonal character. In addition to loudness, the tonality should be taken into account for the estimation of the perceived annoyance. This finding is in agreement with our previous investigations, which underlined the importance of tonality not only for the perception of annoyance but also for the detection of car sounds [16,17]. STFT analysis shows that car pass-by sounds have modulated components in some cases. This is true not only for ICE cars, where modulated components arise because of engine orders or diesel knocking, but also for electric cars, where tonal components occur within a critical band of human hearing. Such temporal variations, such as roughness, are strongly noticeable. Therefore, the psychoacoustical property of roughness is included in the annoyance index. The fluctuation strength is useful for considering the slow temporal variations of car pass-by sounds. To consider the nonstationary character of car pass-by sounds, which was discussed in Section 1, the 5th percentile of the loudness and tonality values were taken into account. This kind of approach has also been applied in other psychoacoustical studies [14,34]. The experts and participants have the opinion that the high frequency content of the pass-by sounds (dull/shrill) is important for the perceived annoyance. However, the sharpness values of the sounds were not meaningful for this aim. The analyses showed that the TETC is much more suitable for the characterization of the pass-by noise annoyance. This result was in line with the findings of [27]. However, a possible contribution of the TETC to the proposed annoyance index was negligible. A possible reason is the high correlation between the loudness (N5) and the TETC index values (R2 = 0.85). Because the loudness is already considered at the annoyance index, the contribution of the TETC index was small. The TETC index is a useful analysis for the pass-by sounds. Depending on the driving condition, its importance can vary.
Relative approach analysis is a powerful tool to identify and characterize signal changes and distinct patterns in temporal and spectral domains. However, it seems that the included psychoacoustical analyses at the annoyance index, such as roughness and fluctuation strength, etc., deliver comparably good results to describe temporal signal changes of pass-by sounds. Therefore, it was decided not to include the relative approach analysis in the annoyance index. In particular, the analyzed driving condition in this study also plays a role in it. The relative approach properties can be adjusted in various ways. Several property variations of the analyses were tried to find the optimum analysis properties in this study but the results were comparable. Depending on future AVAS sound design examples, the role and the consideration of the relative approach, the TETC, or the hearing model, the impulsiveness analysis in the proposed annoyance index can be reevaluated.
The developed index delivers better results in estimating the traffic noise annoyance caused by a passenger car than the commonly used A-weighted sound pressure level measures. This result is valid not only for ICE-based car sounds but also for electric cars. Furthermore, the AVAS has been taken into account in this study. The results of the annoyance evaluation experiment show that electric cars with or without an AVAS have the potential to be less annoying than the existing ICE cars. These results are promising for the future because almost all prognoses estimate that the percentage share of electric cars, hydrogen fuel cell cars, or cars based on similar technology will rapidly increase in the near future. It seems that, with this development, the sound pressure level of the overall traffic noise will be 2 to 4 dB lower than the current level, and the perceived annoyance will also be lower [32]. The results of this study clearly show that the development of not only the sound pressure level, but also of the psychoacoustical properties of electric car pass-by sounds (with and without AVAS) should be taken into account for the sound packaging and design decisions regarding the perceived annoyance. In this investigation, analyzed electric car sounds (with and without AVAS) show a promising tendency that their overall psychoacoustical properties are lower and better than conventional car sounds.
In this research, we only considered the evaluation of traffic noise annoyance levels based on passenger car sounds. However, the contribution of heavy and utility vehicles to traffic noise is also very important. Investigations have shown that heavy vehicles, such as buses and trucks, play an important role in overall traffic noise [45,46,47]. The estimations show that the decrease in the overall traffic noise sound pressure level due to electric cars will be limited and only 1.2 dB if heavy vehicles are not taken into account [33]. The electrification of heavy vehicles will be an important topic in the future because of the corresponding effects on noise emissions. Although reasonable truck electrification may take a very long time, bus electrification is rapidly evolving. A recent study showed that an average electric bus is 8 dB quieter than an ICE bus at a constant speed of 20 km/h and 5 dB quieter at a constant speed of 30 km/h [48]. Both the electrification of cars and buses can cause a significant level of reduction in traffic noise. Therefore, the results of this investigation and particularly the developed index should also be extended for these kinds of vehicles. Heavy vehicles mostly cause loud sounds that have strong low-frequency components [48,49,50,51]. Therefore, a special weighting for the low-frequency spectral components and a loudness weighting adaptation scheme will be necessary. In recent years, motorcycle noise has gained increased importance. The sharpness, temporal character, and tonality of motorcycle noise are very relevant to the perceived annoyance. Therefore, the consideration of the psychoacoustical property of sharpness and additional temporal weightings in the index may be useful.
Recent studies have shown that modelling of the combined exposure to different types of traffic noise, such as aircraft, road, or railway traffic noise, is necessary for traffic planning [52,53,54]. The results indicate that an “epidemiological risk multiplication” is possibly a better approach than an “energetic addition” approach. Our study provides useful hints for the evaluation of passenger-car-based traffic noise. Similar studies are necessary for the evaluation of aircraft and railway traffic noises and to obtain a general view of perceived traffic noise annoyance. Furthermore, the masking and interaction effects of different noise sources should be considered in the general modelling.
4. Conclusions
There is a strong relationship between the perceived annoyance associated with traffic noise and health risks, such as mental and cardiovascular and metabolic diseases. Therefore, a sufficient characterization of the perceived annoyance is necessary for future traffic planning.
This study developed an annoyance index based on psychoacoustical properties that can more successfully estimate the perceived annoyance of passenger-car-based road traffic noise than the commonly used sound pressure-level-based measures. The novel aspects of this study are the consideration of electric and hybrid electric passenger cars and the investigated pass-by situation, which is an acceleration from idle to 50 km/h. The results of this study show that loudness, tonality, roughness and fluctuation strength can describe the perceived annoyance caused by the pass-by noise of passenger cars. The developed index is a weighted combination of these four psychoacoustical properties. This index can be useful for scientific studies, car manufacturers, traffic planning and prevention measures. In this study, not only conventional passenger car pass-by sounds, but also electric car pass-by sounds were evaluated. However, it also is important to analyze truck or motorcycle pass-by sounds. Further studies are necessary to extend this approach to include other traffic noise sources and other driving conditions.
Funding
This study was partly funded by TU Dresden and partly funded by Boysen-TU Dresden-Graduate College. The author wish to thank the Friedrich and Elisabeth Boysen Foundation and Technische Universität Dresden for their financial support for this work during the third Boysen-TU Dresden Research Training Group.
Institutional Review Board Statement
Not applicable.
Informed Consent Statement
Informed consent was obtained from all subjects involved in the study.
Data Availability Statement
Not applicable.
Acknowledgments
Author would like to thank Margitta Lachmann for her support to conduct the listening experiments.
Conflicts of Interest
The author declare no conflict of interest. The funders had no role in the design of the study; in the collection, analyses, or interpretation of data; in the writing of the manuscript, or in the decision to publish the results.
References
- Umweltbundesamt. Lärmbelästigung in Deutschland. 2019. Available online: https://www.umweltbundesamt.de/themen/verkehr-laerm/laermwirkung/laermbelaestigung (accessed on 16 August 2019).
- World Health Organization (WHO). Environmental Noise Guidelines for the European Region. 2018. Available online: http://www.euro.who.int/__data/assets/pdf_file/0008/383921/noise-guidelines-eng.pdf (accessed on 16 August 2019).
- Eriksson, C.; Pershagen, G.; Nilsson, M. Biological Mechanisms Related to Cardiovascular and Metabolic Effects by Environmental Noise. Copenhagen. WHO Regional Office for Europe. Available online: http://www.euro.who.int/en/health-topics/environment-and-health/noise/publications/2018/biological-mechanisms-related-to-cardiovascular-and-metabolic-effects-by-environmental-noise (accessed on 16 August 2019).
- Kohlhuber, M.; Bolte, G. Einfluss von umweltlärm auf schlafqualität und schlafstörungen und auswirkungen auf die gesundheit. Bundesgesundheitsblatt 2011, 54, 1319–1324. [Google Scholar] [CrossRef] [PubMed]
- Ndrepepa, A.; Twardella, D. Relationship between noise annoyance from road traffic noise and cardiovascular diseases: A meta-analysis. Noise Health 2011, 13, 251–259. [Google Scholar] [PubMed]
- Münzel, T.; Schmidt, F.P.; Steven, S.; Herzog, J.; Daiber, A.; Sørensen, M. Environmental noise and the cardiovascular system. J. Am. Coll. Cardiol. 2018, 71, 688–697. [Google Scholar] [CrossRef] [PubMed]
- Beutel, M.E.; Jünger, C.; Klein, E.M.; Wild, P.; Lackner, K.; Blettner, M.; Binder, H.; Michal, M.; Wiltink, J.; Brähler, E.; et al. Noise annoyance is associated with depression and anxiety in the general population-the contribution of aircraft noise. PLoS ONE 2016, 11, e0155357. [Google Scholar] [CrossRef] [PubMed]
- Lovasi, G.S.; Mooney, S.J.; Muennig, P.; DiMaggio, C. Cause and context: Place-based approaches to investigate how environments affect mental health. Soc. Psychiatry Psychiatr. Epidemiol. 2016, 51, 1571–1579. [Google Scholar] [CrossRef] [Green Version]
- Wild, P.S.; Zeller, T.; Beutel, M.; Blettner, M.; Dugi, K.A.; Lackner, K.J.; Pfeiffer, N.; Münzel, T.; Blankenberg, S. The Gutenberg health study. Bundesgesundheitsblatt Gesundh. Gesundh. 2012, 55, 824–829. [Google Scholar] [CrossRef]
- ISO 362–1; Measurement of Noise Emitted by Accelerating Road Vehicles—Engineering Method—Part 1: M and N Categories. International Organization for Standardization: Geneva, Switzerland, 2015.
- Caprioli, D. The evolution of pass-by noise regulation. ATZextra Worldw. 2018, 23, 46. [Google Scholar] [CrossRef] [Green Version]
- Altinsoy, E.; Gül, M.; Kuyumcuoglu, A. Washing machine sound quality. In Proceedings of the 23rd International Congress on Sound and Vibration ICSV23, Athens, Greece, 10–14 July 2016. [Google Scholar]
- Altinsoy, M.E.; Gül, M.; Kuyumcuoglu, A. Sound quality of household appliances for life quality—An investigation on tumble dryer sound quality. In Proceedings of the 22nd International Congress on Sound and Vibration ICSV 22, Florence, Italy, 12–16 July 2015. [Google Scholar]
- Altinsoy, M.E.; Atamer, S. Sound label for household appliances. In Proceedings of the ASME Noise Control and Acoustics Division Conference, ASME 2018 Noise Control and Acoustics Division, Chicago, IL, USA, 26–29 August 2018. [Google Scholar]
- Parizet, E.; Janssens, K.; Poveda-Martinez, P.; Pereira, A.; Lorencki, J.; Ramis-Soriano, J. Sound quality of electric vehicles. In NVH Analysis Techniques for Design and Optimization of Hybrid and Electric Vehicles; Campillo-Davo, N., Rassili, A., Eds.; Shaker Verlag: Aachen, Germany, 2016; pp. 313–328. [Google Scholar]
- Steinbach, L.; Altinsoy, M.E. Prediction of annoyance evaluations of electric vehicle noise by using artificial neural networks. Appl. Acoust. 2019, 145, 149–158. [Google Scholar] [CrossRef]
- Steinbach, L.; Altinsoy, M.E.; Atamer, S.; Rosenkranz, R. Evaluation of electric vehicle sounds and new concepts regarding speed-dependency. J. Acoust. Soc. Am. 2017, 141, 3877. [Google Scholar] [CrossRef]
- Lee, S.K.; An, K.; Cho, H.Y.; Hwang, S.U. Prediction and sound quality analysis of tire pattern noise based on system identification by utilizing an optimal adaptive filter. Appl. Sci. 2019, 9, 3995. [Google Scholar] [CrossRef] [Green Version]
- Davies, P. An Overview of Methods to Quantify Annoyance Due to Noise with Application to Tire-Road Noise; 430180000 8000008325-1; American Concrete Pavement Association Report. Available online: www.igga.net/wp-content/uploads/2018/08/PurdueOverviewofMethodstoQuantifyAnnoyance.pdf (accessed on 17 May 2022).
- Hoffmann, A.; Kropp, W. Auralization of simulated tyre noise: Psychoacoustic validation of a combined model. Appl. Acoust. 2019, 145, 220–227. [Google Scholar] [CrossRef]
- Fiebig, A.; Guidati, S.; Goehrke, A. Psychoacoustic evaluation of traffic noise. In Proceedings of the NAG/DAGA 2009, Rotterdam, The Netherland, 23–26 March 2009. [Google Scholar]
- Genuit, K.; Fiebig, A. Psychoacoustics and its benefit for the soundscape approach. Acta Acust. United Acust. 2006, 92, 952–958. [Google Scholar]
- Genuit, K.; Fiebig, A. Prediction of psychoacoustic parameters. In INTER-NOISE and NOISE-CON Congress and Conference Proceedings; Institute of Noise Control Engineering: Washington, DC, USA, 2005; pp. 893–898. [Google Scholar]
- Genuit, K.; Guidati, S.; Rossberg, S. Psychoacoustical evaluation of traffic noise. In Proceedings of the 19th International Congress on Acoustics, Madrid, Spain, 2–7 September 2007. [Google Scholar]
- Kaczmarek, T.; Preis, A. Annoyance of time-varying road-traffic noise. Arch. Acoust. 2010, 35, 383–393. [Google Scholar] [CrossRef] [Green Version]
- Raggam, R.B.; Cik, M.; Höldrich, R.R.; Fallast, K.; Gallasch, E.; Fend, M.; Lackner, A.; Marth, E. Personal noise ranking of road traffic: Subjective estimation versus physiological parameters under laboratory conditions. Int. J. Hyg. Environ. Health 2007, 210, 97–105. [Google Scholar] [CrossRef]
- Klein, A.; Marquis-Favre, C.; Weber, R.; Trollé, A. Spectral and modulation indices for annoyance-relevant features of urban road single-vehicle pass-by noises. J. Acoust. Soc. Am. 2015, 137, 1238–1250. [Google Scholar] [CrossRef]
- Gille, L.A.; Marquis-Favre, C. Estimation of field psychoacoustic indices and predictive annoyance models for road traffic noise combined with aircraft noise. J. Acoust. Soc. Am. 2019, 145, 2294–2304. [Google Scholar] [CrossRef]
- Rohrmann, B. Verbal Qualifiers for Rating Scales: Sociolinguistic Considerations and Psychometric Data. Project Report, University of Melbourne, Australia. 2007. Available online: www.rohrmannresearch.net/pdfs/rohrmann-vqs-report.pdf (accessed on 17 May 2022).
- MATLAB. 9.7.0.1190202 (R2019b); The MathWorks Inc.: Natick, MA, USA, 2018.
- Altinsoy, M. Identification of quality attributes of automotive idle sounds and whole-body vibrations. Int. J. Veh. Noise Vib. 2013, 9, 4–27. [Google Scholar] [CrossRef]
- Verheijen, E.; Jabben, J. Effect of electric cars on traffic noise and safety. In RIVM Letter Report; National Institute of Public Health and Environmental Protection: Bilthoven, The Netherlands, 2010. [Google Scholar]
- Campello-Vicente, H.; Peral-Orts, R.; Campillo-Davo, N.; Velasco-Sanchez, E. The effect of electric vehicles on urban noise maps. Appl. Acoust. 2017, 116, 59–64. [Google Scholar] [CrossRef]
- Glantz, S.A.; Slinker, B.K. Primer of Applied Regression and Analysis of Variance; McGraw-Hill: New York, NY, USA, 1990. [Google Scholar]
- Wunderli, J.M.; Pieren, R.; Habermacher, M.; Vienneau, D.; Cajochen, C.; Probst-Hensch, N.; Brink, M. Intermittency ratio: A metric reflecting short-term temporal variations of transportation noise exposure. J. Expo. Sci. Environ. Epidemiol. 2016, 26, 575–585. [Google Scholar] [CrossRef]
- Zwicker, E.; Fastl, H. Psychoacoustics: Facts and Models; Springer: Berlin/Heidelberg, Germany, 2013. [Google Scholar]
- Pietila, G.; Cerrato, G. Sound quality guidelines for non-automotive products. Sound Vib. 2012, 46, 8–14. [Google Scholar]
- Altinsoy, M.E. Auditory signs for public transportation—Accessible pleasant smart cities. In Proceedings of the Internoise 2019, Madrid, Spain, 16–19 June 2019. [Google Scholar]
- Von Bismarck, G. Sharpness as an attribute of the timbre of steady sounds. Acta Acust. United Acust. 1974, 30, 159–172. [Google Scholar]
- ISO 532-1:2017; Acoustics—Methods for Calculating Loudness—Part 1: Zwicker Method. 2017. Available online: www.iso.org/standard/63077.html (accessed on 17 May 2022).
- Standard ECMA-74; 14th ed. Measurement of Airborne Noise Emitted by Information Technology and Telecommunications Equipment. Ecma International: Geneva, Switzerland, 2017.
- Sottek, R. Progress in calculating tonality of technical sounds. In Proceedings of the Internoise 2014, Melbourne, Australian, 16–19 November 2014. [Google Scholar]
- Sottek, R. A hearing model approach to roughness. In Proceedings of the Internoise 2016. Institute of Noise Control Engineering, Hamburg, Germany, 21–24 August 2016. [Google Scholar]
- Von Terhardt, E. Uber akustische rauhigkeit und schwankungsstarke. Acustica 1968, 20, 215–224. [Google Scholar]
- Trollé, A.; Marquis-Favre, C.; Klein, A. Short-term annoyance due to tramway noise: Determination of an acoustical indicator of annoyance via multilevel regression analysis. Acta Acust. 2014, 100, 34–45. [Google Scholar] [CrossRef]
- Steele, C. A critical review of some traffic noise prediction models. Appl. Acoust. 2001, 62, 271–287. [Google Scholar] [CrossRef]
- Alves Filho, J.M.; Lenzi, A.; Zannin, P.H. Effects of traffic composition on road noise: A case study. Transp. Res. Part D Transp. Environ. 2004, 9, 75–80. [Google Scholar] [CrossRef]
- Turcsany, J. Electric Buses and Noise. 2016. Available online: http://www.bullernatverket.se/wp-content/uploads/2014/05/Electric-buses-and-noise_Volvo-Bus.pdf (accessed on 14 May 2022).
- Ouis, D. Annoyance from road traffic noise: A review. J. Environ. Psychol. 2001, 21, 101–120. [Google Scholar] [CrossRef]
- Laib, F.; Braun, A.; Rid, W. Modelling noise reductions using electric buses in urban traffic. A case study from Stuttgart, Germany. Transp. Res. Procedia 2019, 37, 377–384. [Google Scholar] [CrossRef]
- Rosenkranz, R.; Altinsoy, M.E.; Nicht, A. Noise emission of electric street sweepers—Perceptual evaluation of sound. In Proceedings of the Forum Acusticum, Kraków, Poland, 7–12 September 2014. [Google Scholar]
- Seidler, A.; Hegewald, J.; Seidler, A.L.; Schubert, M.; Zeeb, H. Is the whole more than the sum of its parts? Health effects of different types of traffic noise combined. Int. J. Environ. Res. Public Health 2019, 16, 1665. [Google Scholar] [CrossRef] [Green Version]
- Seidler, A.L.; Hegewald, J.; Schubert, M.; Weihofen, V.M.; Wagner, M.; Dröge, P.; Swart, E.; Zeeb, H. The effect of aircraft, road, and railway traffic noise on stroke—Results of a case-control study based on secondary data. Noise Health 2018, 20, 152–161. [Google Scholar]
- Tobollik, M.; Hintzsche, M.; Wothge, J.; Myck, T.; Plass, D. Burden of disease due to traffic noise in Germany. Int. J. Environ. Res. Public Health 2019, 16, 2304. [Google Scholar] [CrossRef] [Green Version]
Figure 1.
Pass-by traffic situation with measurement position of the binaural head.

Figure 2.
Rating scale used in this study.

Figure 3.
The annoyance ratings of various car pass-by noises. In the ratings, 100 means extremely annoying and 0 means not at all annoying. Abbreviations: EV: electric vehicle without a warning sound, EV AVAS: electric vehicle with a warning sound, ICE G: gasoline internal combustion engine vehicle, ICE D: diesel internal combustion engine vehicle, H: hybrid vehicle.

Figure 4.
The relationship between perceived annoyance ratings and sound pressure level in dB(A). Different colors are used in the figure to represent three different passenger car types. Color representation is also used in the Figure 5, Figure 6, Figure 7 and Figure 8. Red dots correspond to the internal combustion engine cars, green dots represent the hybrid cars, and blue dots represent the electric cars.

Figure 5.
The relationship between perceived annoyance ratings and the maximum sound pressure level in dB(A). (Red dots: ICE cars, green dots: hybrid cars, and blue dots: electric cars).
Figure 5.
The relationship between perceived annoyance ratings and the maximum sound pressure level in dB(A). (Red dots: ICE cars, green dots: hybrid cars, and blue dots: electric cars).

Figure 6.
The relationship between perceived annoyance ratings and the developed annoyance index, which is based on psychoacoustical properties. (Red dots: ICE cars, green dots: hybrid cars, and blue dots: electric cars).
Figure 6.
The relationship between perceived annoyance ratings and the developed annoyance index, which is based on psychoacoustical properties. (Red dots: ICE cars, green dots: hybrid cars, and blue dots: electric cars).

Figure 7.
(a) The relationship between perceived annoyance ratings and the TETC index. (b) The relationship between perceived annoyance ratings and sharpness.
Figure 7.
(a) The relationship between perceived annoyance ratings and the TETC index. (b) The relationship between perceived annoyance ratings and sharpness.

Figure 8.
The relationship between perceived annoyance ratings and the annoyance index, which is the combination of the psychoacoustical properties from the Equation (1) and the TETC index. (Red dots: ICE cars, green dots: hybrid cars, and blue dots: electric cars).
Figure 8.
The relationship between perceived annoyance ratings and the annoyance index, which is the combination of the psychoacoustical properties from the Equation (1) and the TETC index. (Red dots: ICE cars, green dots: hybrid cars, and blue dots: electric cars).

Publisher’s Note: MDPI stays neutral with regard to jurisdictional claims in published maps and institutional affiliations. |
© 2022 by the author. Licensee MDPI, Basel, Switzerland. This article is an open access article distributed under the terms and conditions of the Creative Commons Attribution (CC BY) license (https://creativecommons.org/licenses/by/4.0/).
Share and Cite
MDPI and ACS Style
Altinsoy, M.E. The Evaluation of Conventional, Electric and Hybrid Electric Passenger Car Pass-By Noise Annoyance Using Psychoacoustical Properties. Appl. Sci. 2022, 12, 5146. https://doi.org/10.3390/app12105146
AMA Style
Altinsoy ME. The Evaluation of Conventional, Electric and Hybrid Electric Passenger Car Pass-By Noise Annoyance Using Psychoacoustical Properties. Applied Sciences. 2022; 12(10):5146. https://doi.org/10.3390/app12105146
Chicago/Turabian StyleAltinsoy, M. Ercan. 2022. "The Evaluation of Conventional, Electric and Hybrid Electric Passenger Car Pass-By Noise Annoyance Using Psychoacoustical Properties" Applied Sciences 12, no. 10: 5146. https://doi.org/10.3390/app12105146
Note that from the first issue of 2016, this journal uses article numbers instead of page numbers. See further details here.