
On Wind-Induced Fatigue of Curtain Wall Supporting Structure of a High-Rise Building


1
Key Laboratory of Building Safety and Efficiency of the Ministry of Education, Hunan University, Changsha 410082, China
2
College of Civil Engineering, Hunan University, Changsha 410082, China
*
Author to whom correspondence should be addressed.
Appl. Sci. 2022, 12(5), 2547; https://doi.org/10.3390/app12052547
Submission received: 18 January 2022
/
Revised: 22 February 2022
/
Accepted: 23 February 2022
/
Published: 28 February 2022
(This article belongs to the Topic Fatigue and Fracture Assessment of Structural Components and Materials)
Abstract
:Due to the soft stiffness of high-rise buildings in the horizontal direction, strong wind will cause a strenuous structural response. Wind load is one key control load in the design of high-rise buildings. This study analyzes wind-induced fatigue of curtain wall supporting structure of a high-rise building in accordance with dynamic pressure measurement data of wind tunnel, acquiring wind pressure in each part of the structure. The finite element model is established for the curtain wall supporting structure, and the fatigue of corresponding nodes is discussed. Moreover, RBF (radial basis function) neural network regression is introduced to predict the fatigue life of unknown working conditions. Based on the joint distribution model of wind velocity and direction, this study explores the distribution law of fatigue life of supporting structure nodes, proposes a hypothesis of life distribution, and conducts a test. Moreover, working conditions with higher probability life are collected to provide a basis for practical engineering applications. The results show that the average deviation is below 10% by using RBF neural network and the probability life of the sample nodes is between 0 and 1016. Wind velocity is 8~15 m/s and azimuth angles of 50°~100°, 120°~200°, and 260°~300° are found in working conditions with low probability life; about 95% of the fatigue damage takes place in the first 30 conditions, and their fatigue damage values are between 3.5 × 10⁻³~9.36 × 10⁻².
1. Introduction
The curtain wall is a peripheral maintenance structure of buildings, which is composed of metal supporting structures (aluminum beam, column, steel structure, etc.) and plates (glass, aluminum plate, slate, ceramic plate, etc.). When panel material is made of glass, it is called a glass curtain wall, with functions of bearing and decoration. Compared with the main structure, maintenance structures such as curtain walls can be easily damaged in wind disasters. Because of improper design or installation of curtain wall connectors, the curtain wall will fall off a high-rise building when strong winds come, causing casualties. At home and abroad, there are limited studies on wind-induced fatigue of curtain wall supporting structures, so similar research can be consulted. Sivaprakasam et al., [1] studied the structural performance of mullions through the full-scale wind simulation test of façade assembly. Under headwind, the tilting effect of male and female mullions produces little influence, and mullion cannot be regarded as a valid interaction for hollow sections. Liang et al., [2] proposeed a bimodal probability distribution model for wind pressure acting on the windward side of a main building. It includes the Gaussian model and generalized extreme-value model, to reveal non-Gaussian characteristics of wind pressure on glass curtain walls. Moreover, Hui et al., [3] tested the wind resistance performance of aluminum alloy columns with different structures in a unit glass curtain wall and analyzed the numerical simulation. The results showed when there are proper numbers and positions of hooks, the beam-to-column constraint is very small whether the wind pressure is positive or negative. Yu et al., [4] mainly investigated L-shaped cable-supported glass curtain walls, the wind-induced dynamic response in four directions is analyzed taking into account the fluid-structure interaction effects. The deflection of the glass surface is explained in view of displacement statistics, obtaining wind vibration coefficients suitable for engineering structure design, and the change in cable force is described, too. Ouyang et al., [5] introduced a probabilistic performance-based wind engineering (PBWE) framework for estimating envelope damage, the envelope structures include the effects of demands originating from dynamic net pressure and structural responses for assessing the response of structural systems under material yielding/lag and large deformation settings. You [6] measured the cladding pressure by wind tunnel to estimate the stress in the connections, fatigue damages were evaluated for different city development stages using the direct wind time history method and Weibull wind distribution methods were adopted from the literature.
With the aid of CFD (computational fluid dynamics) numerical simulation of large-scale building groups, Chen [7] raises a method to analyze wind damage vulnerability of high-rise glass curtain walls. According to the research, the main failure mode of beams is caused by shear damage of bolts between beams and columns under the action of strong wind. At the same time, Zeng [8] studied structural theory and design specifications of glass curtain walls, explored wind resistance performance of glass curtain walls through a finite element simulation and actual measurement, then analyzed the safety performance of curtain walls according to interval numbers. Li et al., [9] researched wind-induced fatigue of a flexible support system of point-supported glass curtain wall and calculated its equivalent stress amplitude and cumulative damage, finding members at the truss nodes in support systems and weld position at support nodes are the weakest. The analysis of wind-induced fatigue of connectors can be referred to as connectors of other structures. For example, adopting empirical formula of high-strength bolt stress, According to Mu [10], a local refined solid model is constructed for the ring flange connection of lightning rods to conduct fatigue analysis, and the conclusion is drawn that fatigue performance of bolts can be enhanced by the increase in pre-tightening force and thickness of the ring flange.
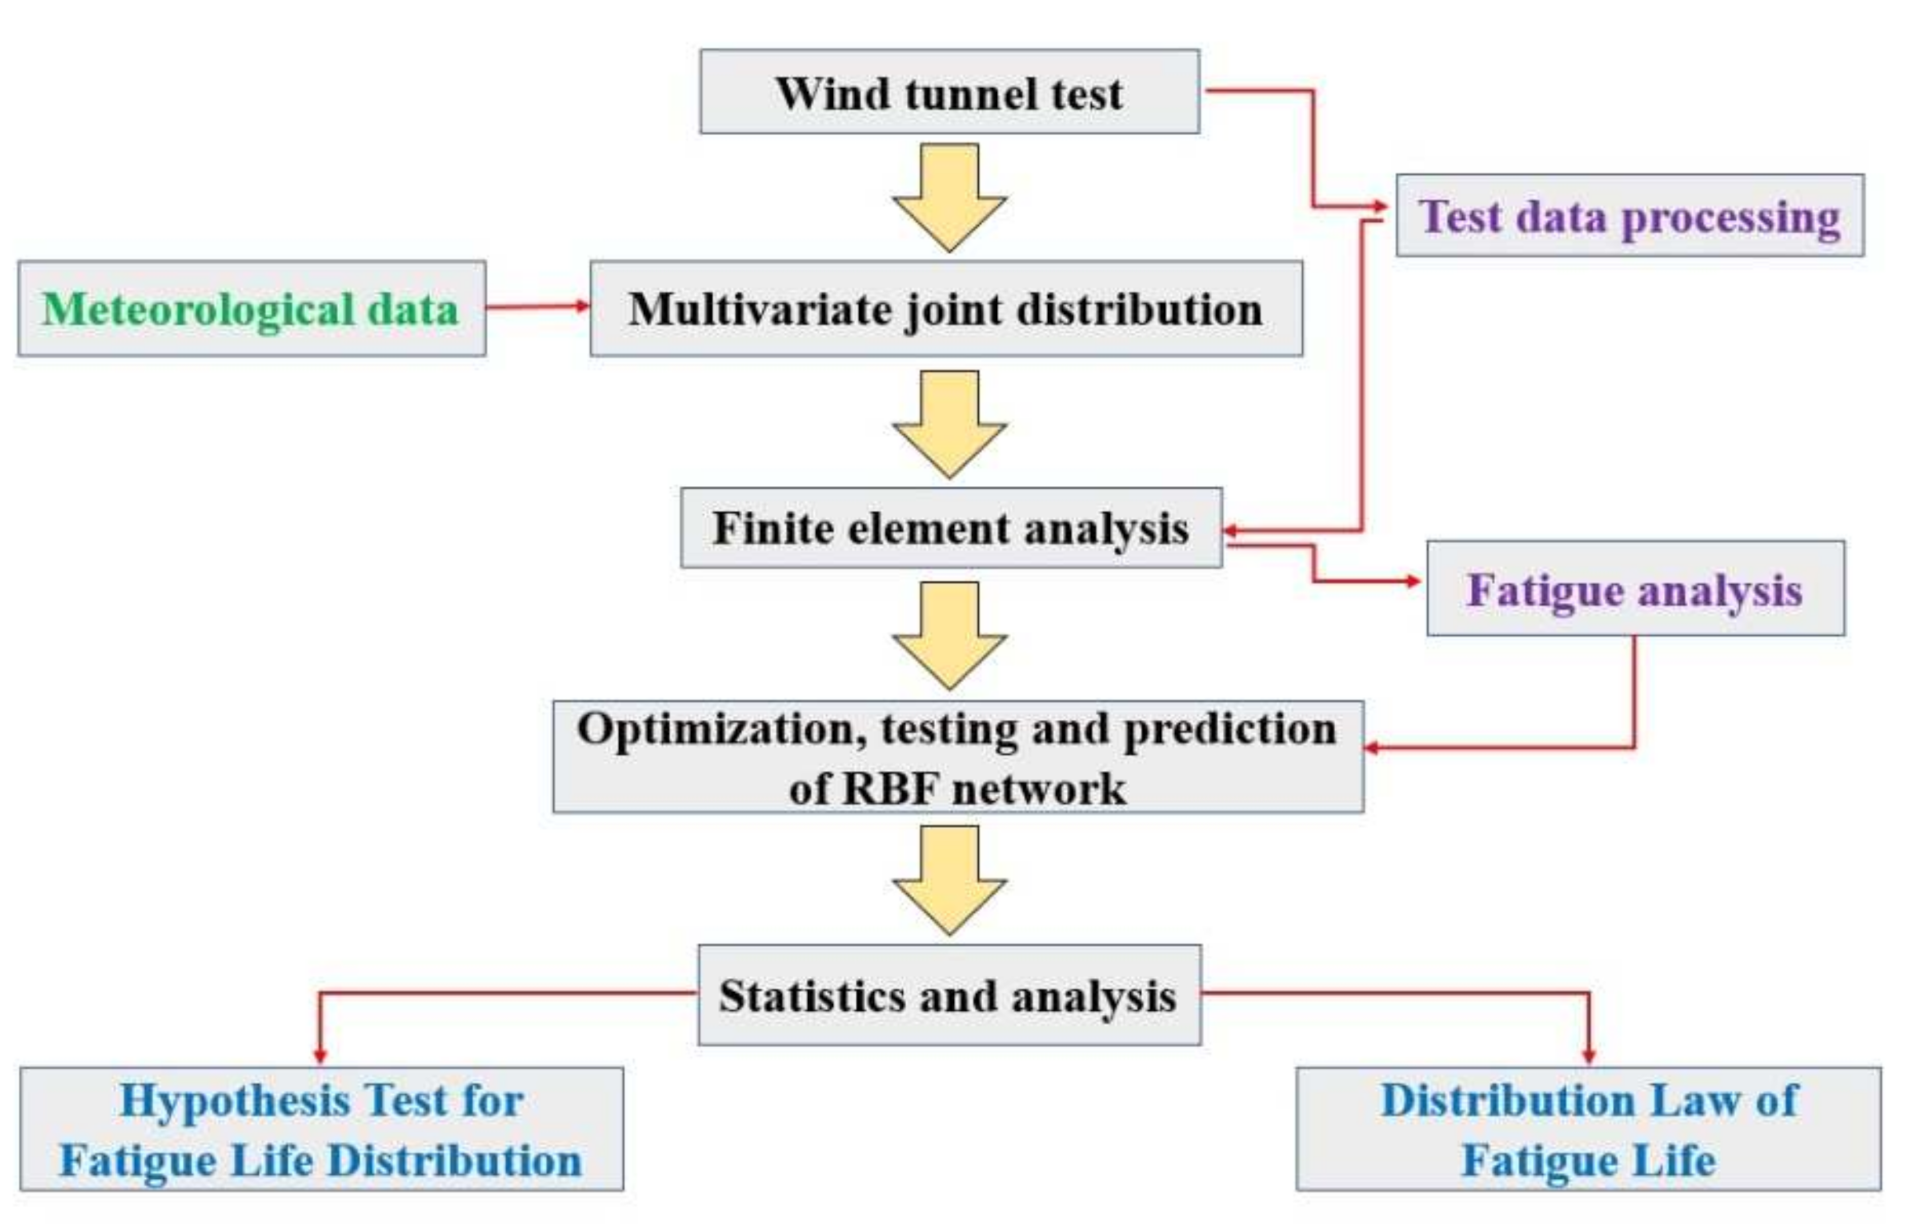
Due to the high wind pressure of super high-rise buildings at high places, their supporting structures will be affected by wind-induced fatigue, which will cause the glass curtain wall to fall off from high places once it reaches a certain degree, which can easily cause harm to related property and personal. Most of the existing literature focuses on the study of structural wind resistance, and there is less research on wind fatigue for curtain wall support structures, and almost no consideration is given to the joint distribution of wind speed and wind direction leading to a rather one-sided result. Therefore, the fatigue life distribution law of the supporting structure of curtain wall is analyzed by the wind tunnel test and finite element simulation; moreover, wind speed and direction joint distribution and neural network regression methods are considered. This method improves the reliability of results while significantly reducing test conditions and test time; it provides a reference for engineering design. The research process is shown in Figure 1.
2. Research Methodology
2.1. Wind Tunnel Test
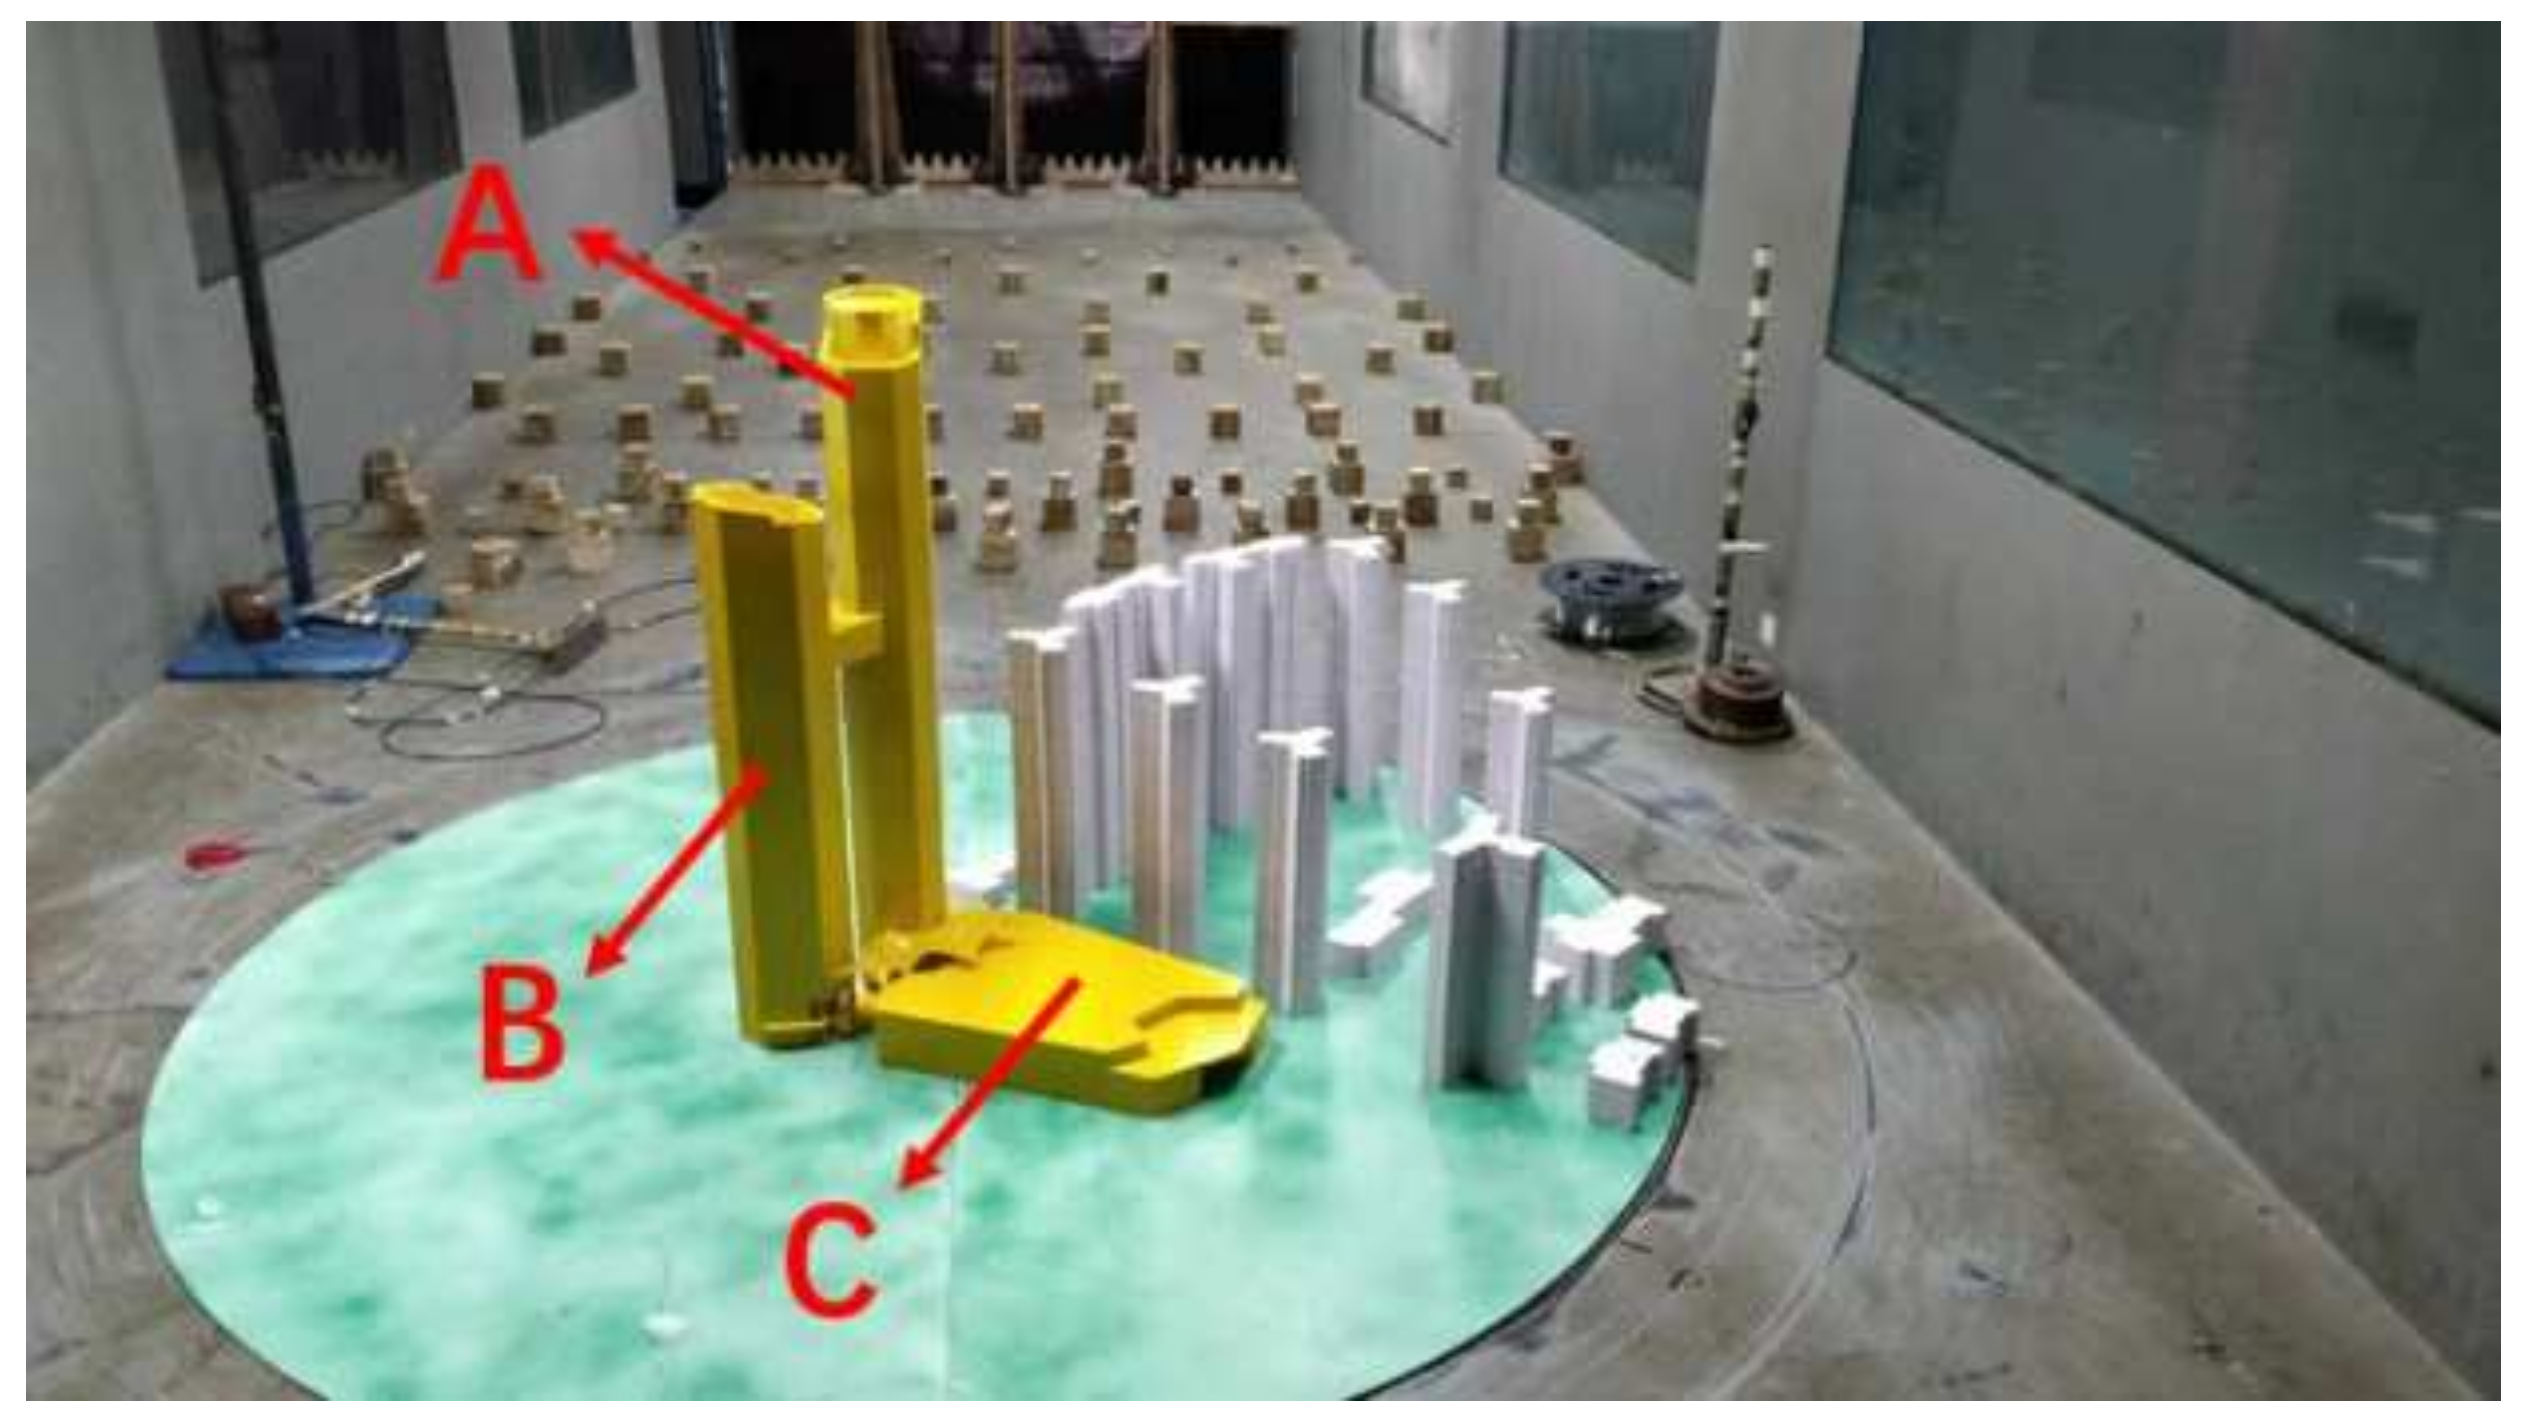
Researchers have used a combination of wind tunnel tests and finite element analysis to study wind-induced fatigue of buildings [11,12]. The test model for high-rise buildings refers to a rigid body model made of ABS (Acrylonitrile Butadiene Styrene) material, with sufficient strength and stiffness. The principles of wind tunnel tests (including similar guidelines, scale, amount of shielding, number of principle directions, etc.) can be found in the literature [13]. The model is geometrically similar to real objects in appearance, the building prototype includes two towers, A and B, and a commercial center C. Tower A is about 280 m high and tower B is about 200 m high; the scale ratio is 1:300, and the height of tower A of the building model is about 0.93 m. There were many air pressure holes on the outside of the model, to maintain an airtight state, and the inside was hollowed out and installed with air pressure pipes. Finally, the model was placed in a section of the wind tunnel test, and the wind pressure pipe was connected to an electronic pressure scanning valve to measure the surface wind pressure of the main building and envelope structure. In the test, the model was fixed on the turntable of the wind tunnel, which could rotate to simulate different wind directions. A total of 969 measuring points were arranged in the model, in order to measure wind pressure distribution on the building surface, podium surface, canopy surface, and building roof (Figure 2).
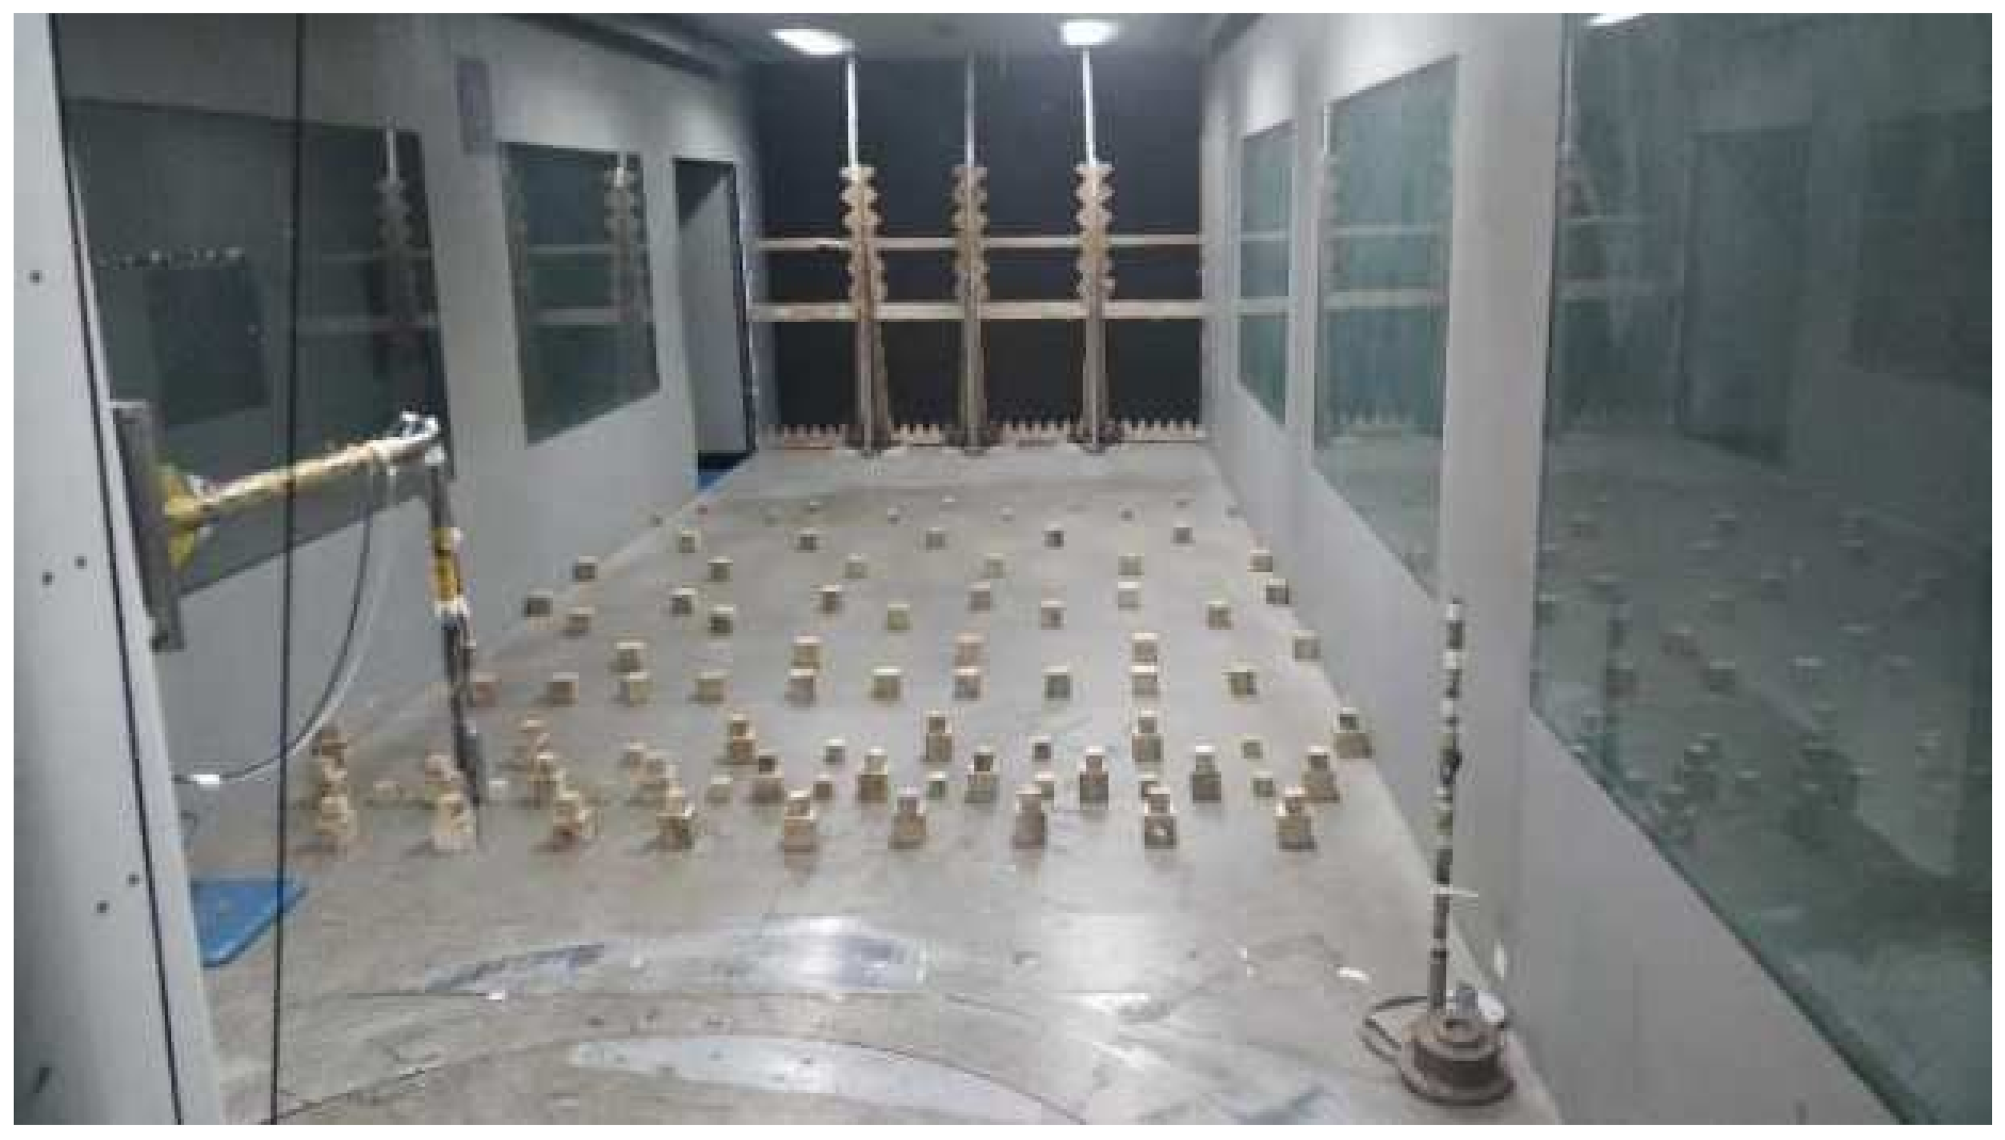
This test was carried out in the HD-3 atmospheric boundary layer wind tunnel of Hunan University. Focusing on the main building, the wind tunnel test simulated the load-carrying capability of a single building, and ignoring surrounding main buildings and terrain, the wind tunnel model was placed on the turntable in the wind tunnel test section to measure data. It aimed to measure the wind pressure on the structures surface in 24 wind directions (rotation counterclockwise at a vertical plane, 0°, 0°~360°, and the wind direction angle was 15° to the north elevation of building A). During the test, each measurement point was sampled for 30 s, the sampling frequency was 312.5 Hz, the height of the test reference point was 110 cm, and wind velocity at the test reference point was controlled to 7.5 m/s (Figure 3).
The wind tunnel test and related calculations refer to the “Load Code for the design of building structures”(GB50009-2012). For each measurement point, 10,000 wind pressure data were recorded. According to the following formula, the model’s time histories of wind pressure obtained from the pressure test can be converted into the prototype’s time histories of wind pressure [14]:
where is the time history data obtained from the pressure test; is the time history data of wind pressure converted to actual conditions, is the actual incoming flow wind pressure, and is the experimental incoming flow wind pressure.
2.2. Finite Element Analysis
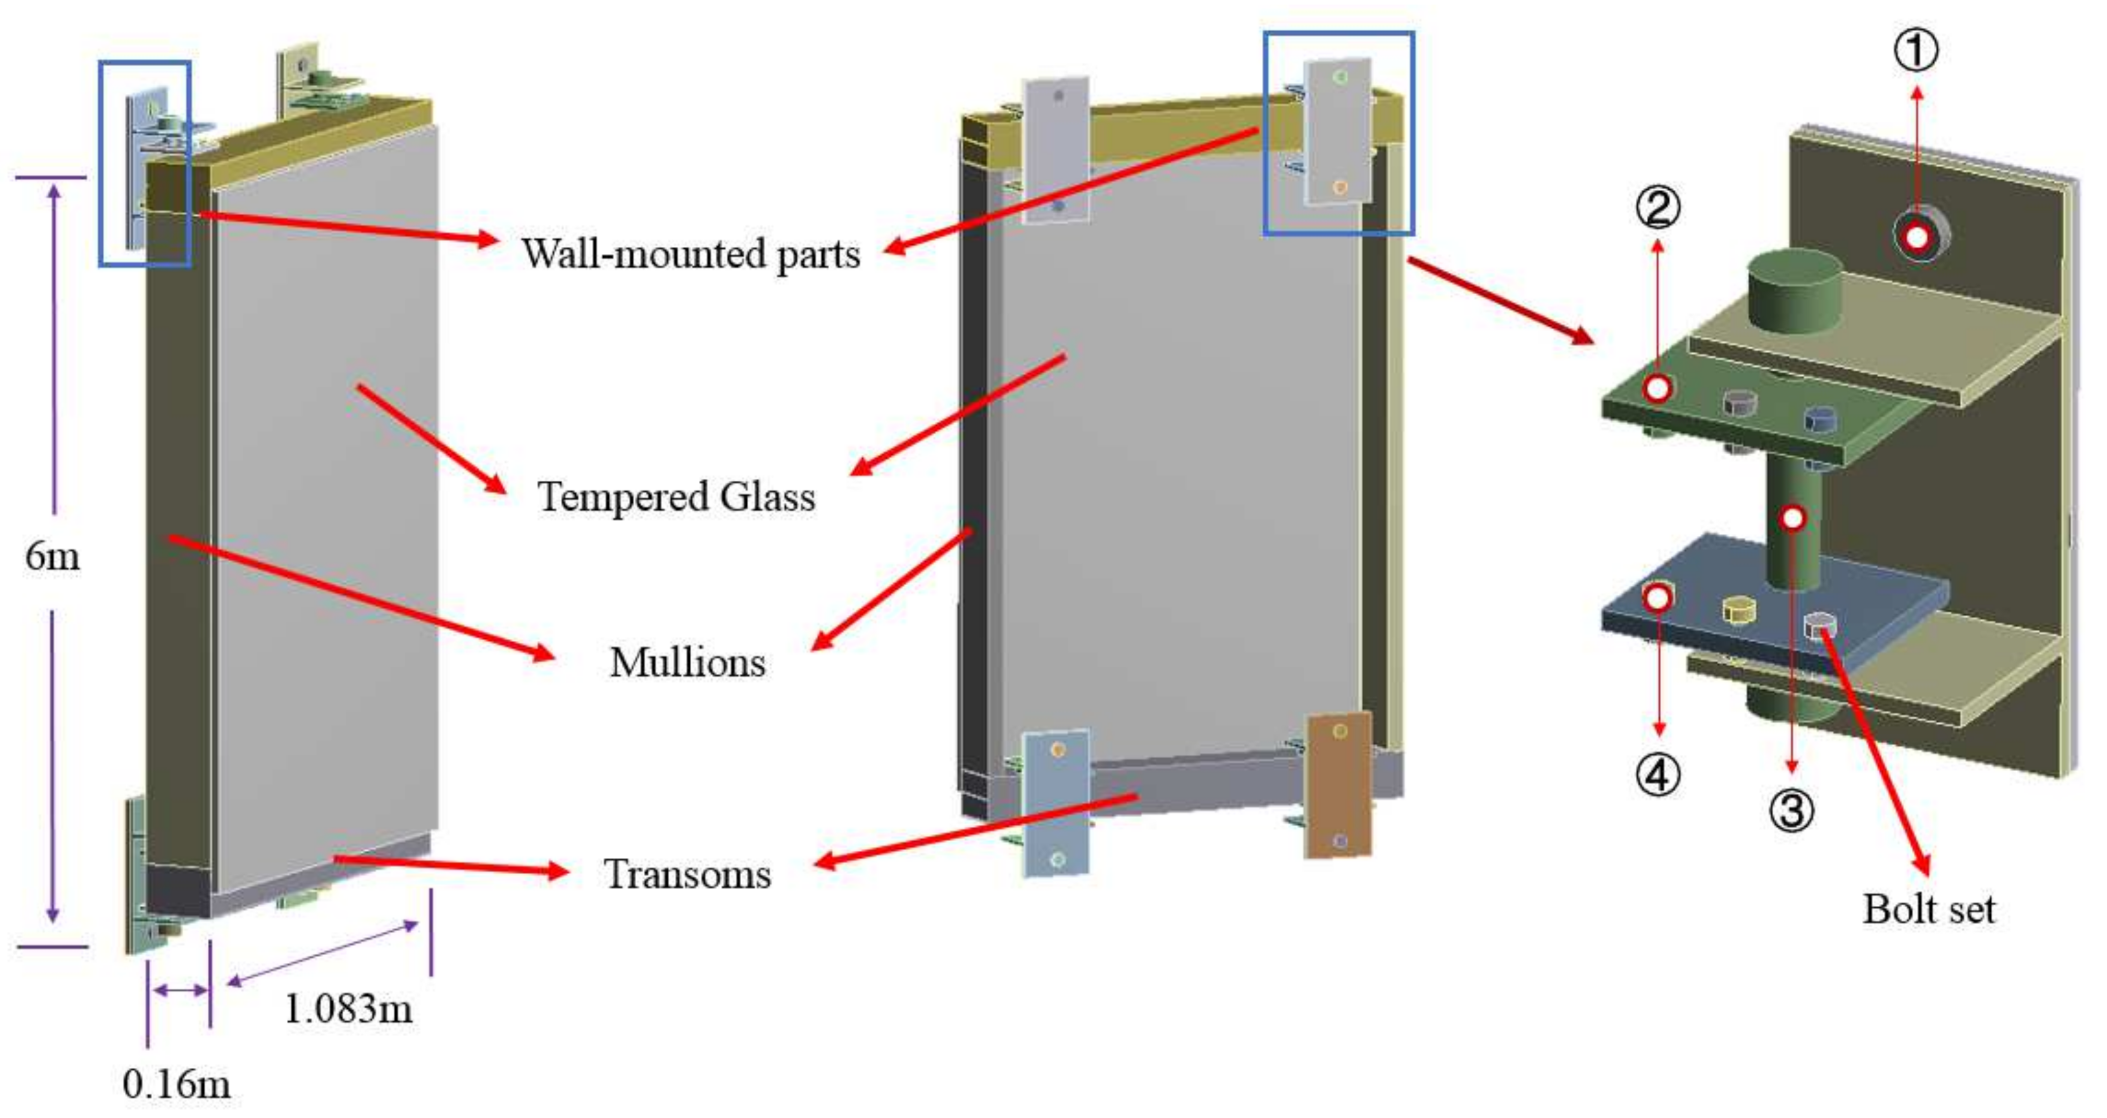
The maximum wind pressure of the wall partition of Block A is 1.89 kPa, which occurs in the northwest area (see Section 3.3 for partition diagram), located on the north side of Floor 58 of Building A, at a height of 255–260 m. With this area as a case, this study analyzed wind-induced fatigue of a curtain wall. The dimension of a glass curtain wall is 6 m × 1.083 m × 0.16 m. The glass was TP8Low-e + 12Ar + TP8 triple silver (argon) medium silver glass (full ultra-white). The curtain wall structure was modeled in ANSYS according to material parameters in Table 1. The settings of the finite element model parameters are shown in Table 2.
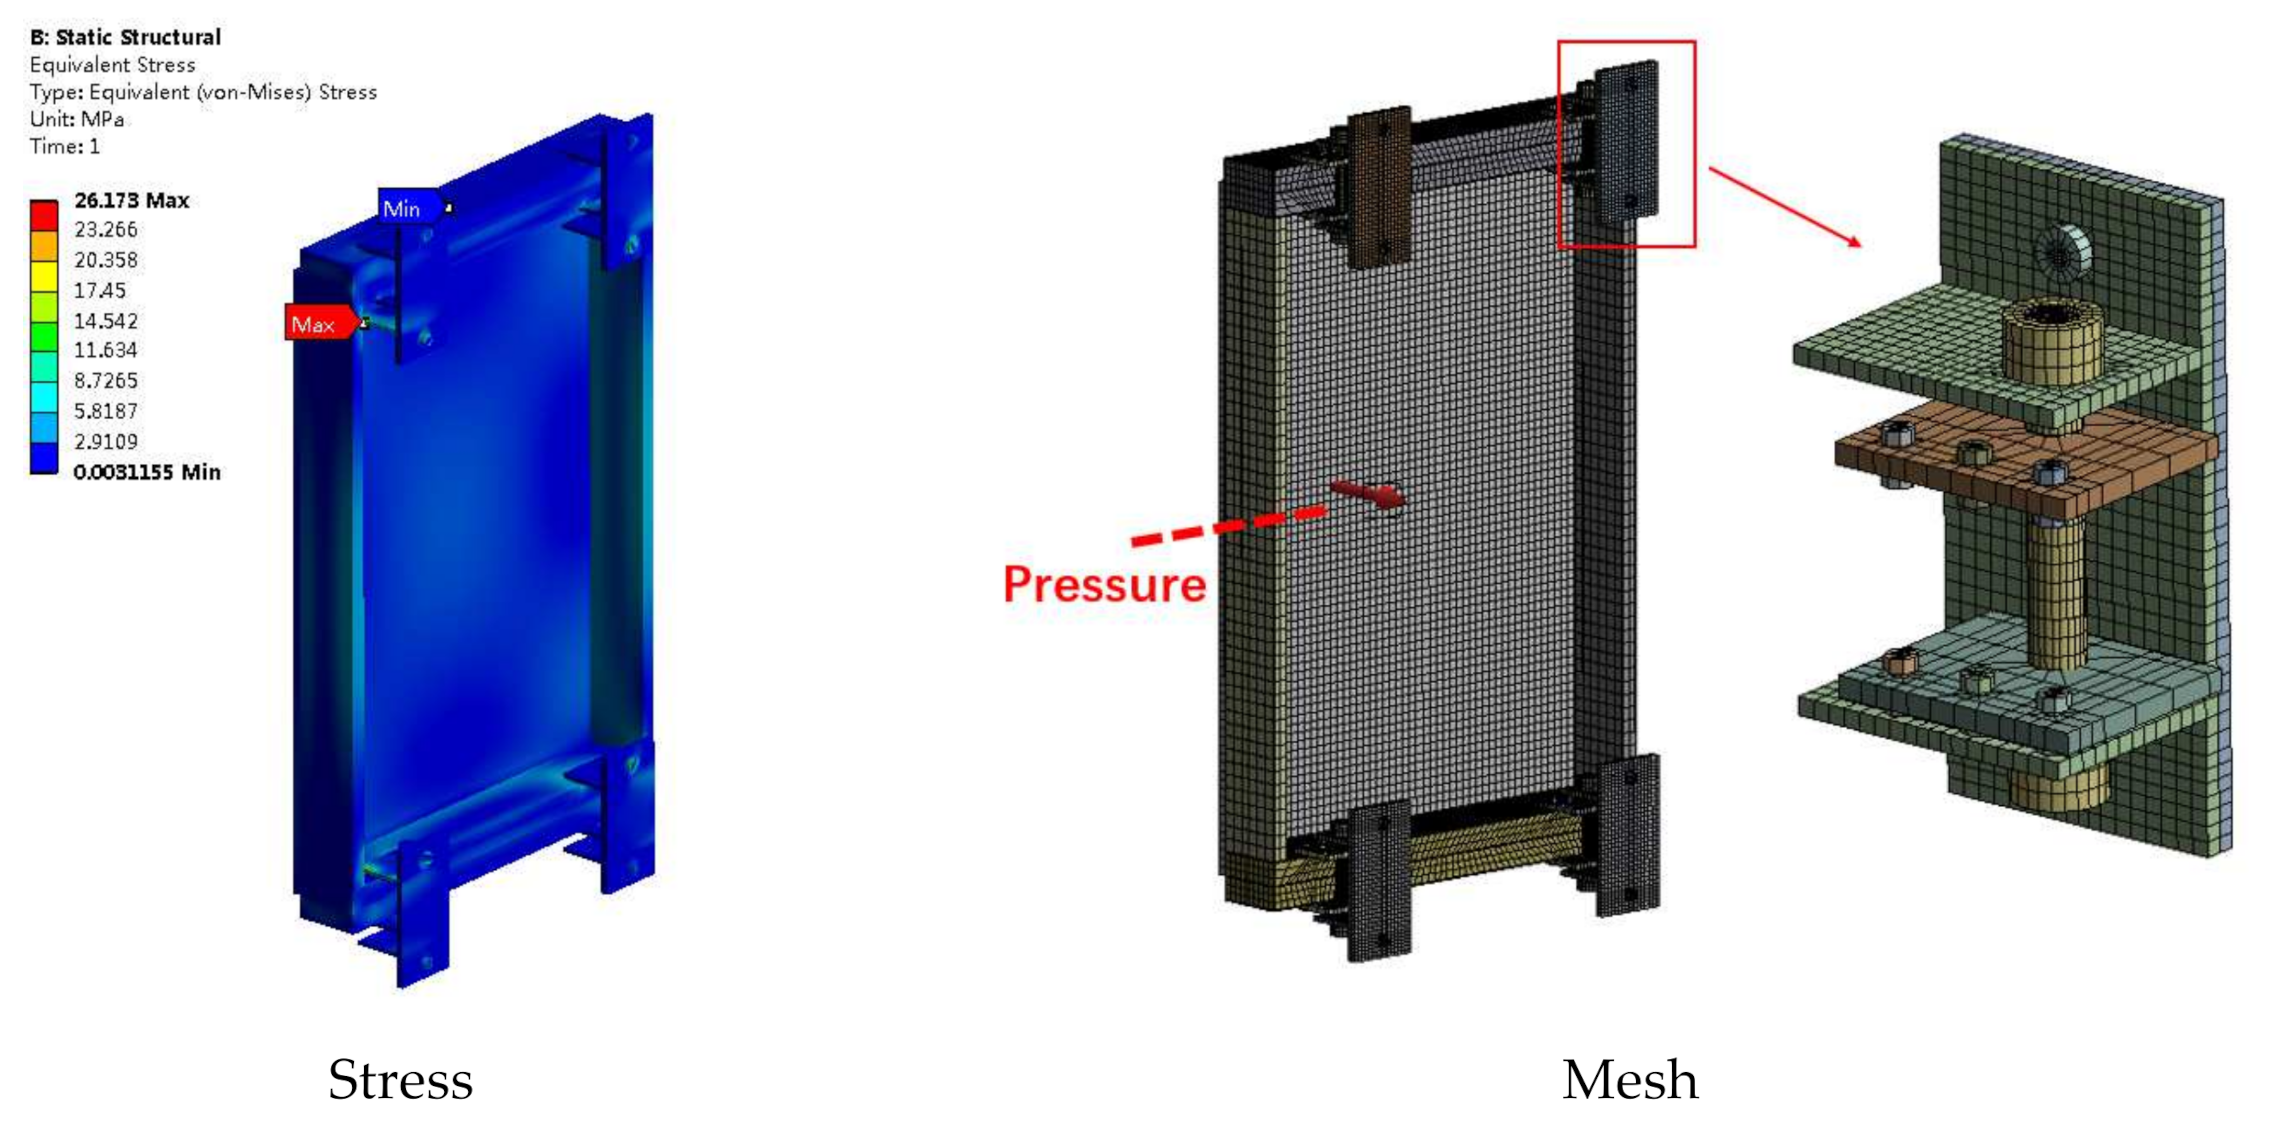
Typical glass curtain wall structure includes metal tempered glass, frame structure, a connecting tube that is usually composed of steel structure, and bolt groups. Figure 4 introduces static analysis results of the curtain wall model with 1000 Pa applied. It tells maximum equivalent stress value can reach 26.173 Mpa; higher stress occurs in parts where the structure is connected with aluminum transoms and mullions, which is also the place in which fatigue easily occurs. According to the joint distribution probability model for wind velocity and direction and fatigue analysis results, this study calculated the life of curtain wall supporting structure nodes by selecting some representative nodes (Figure 5).
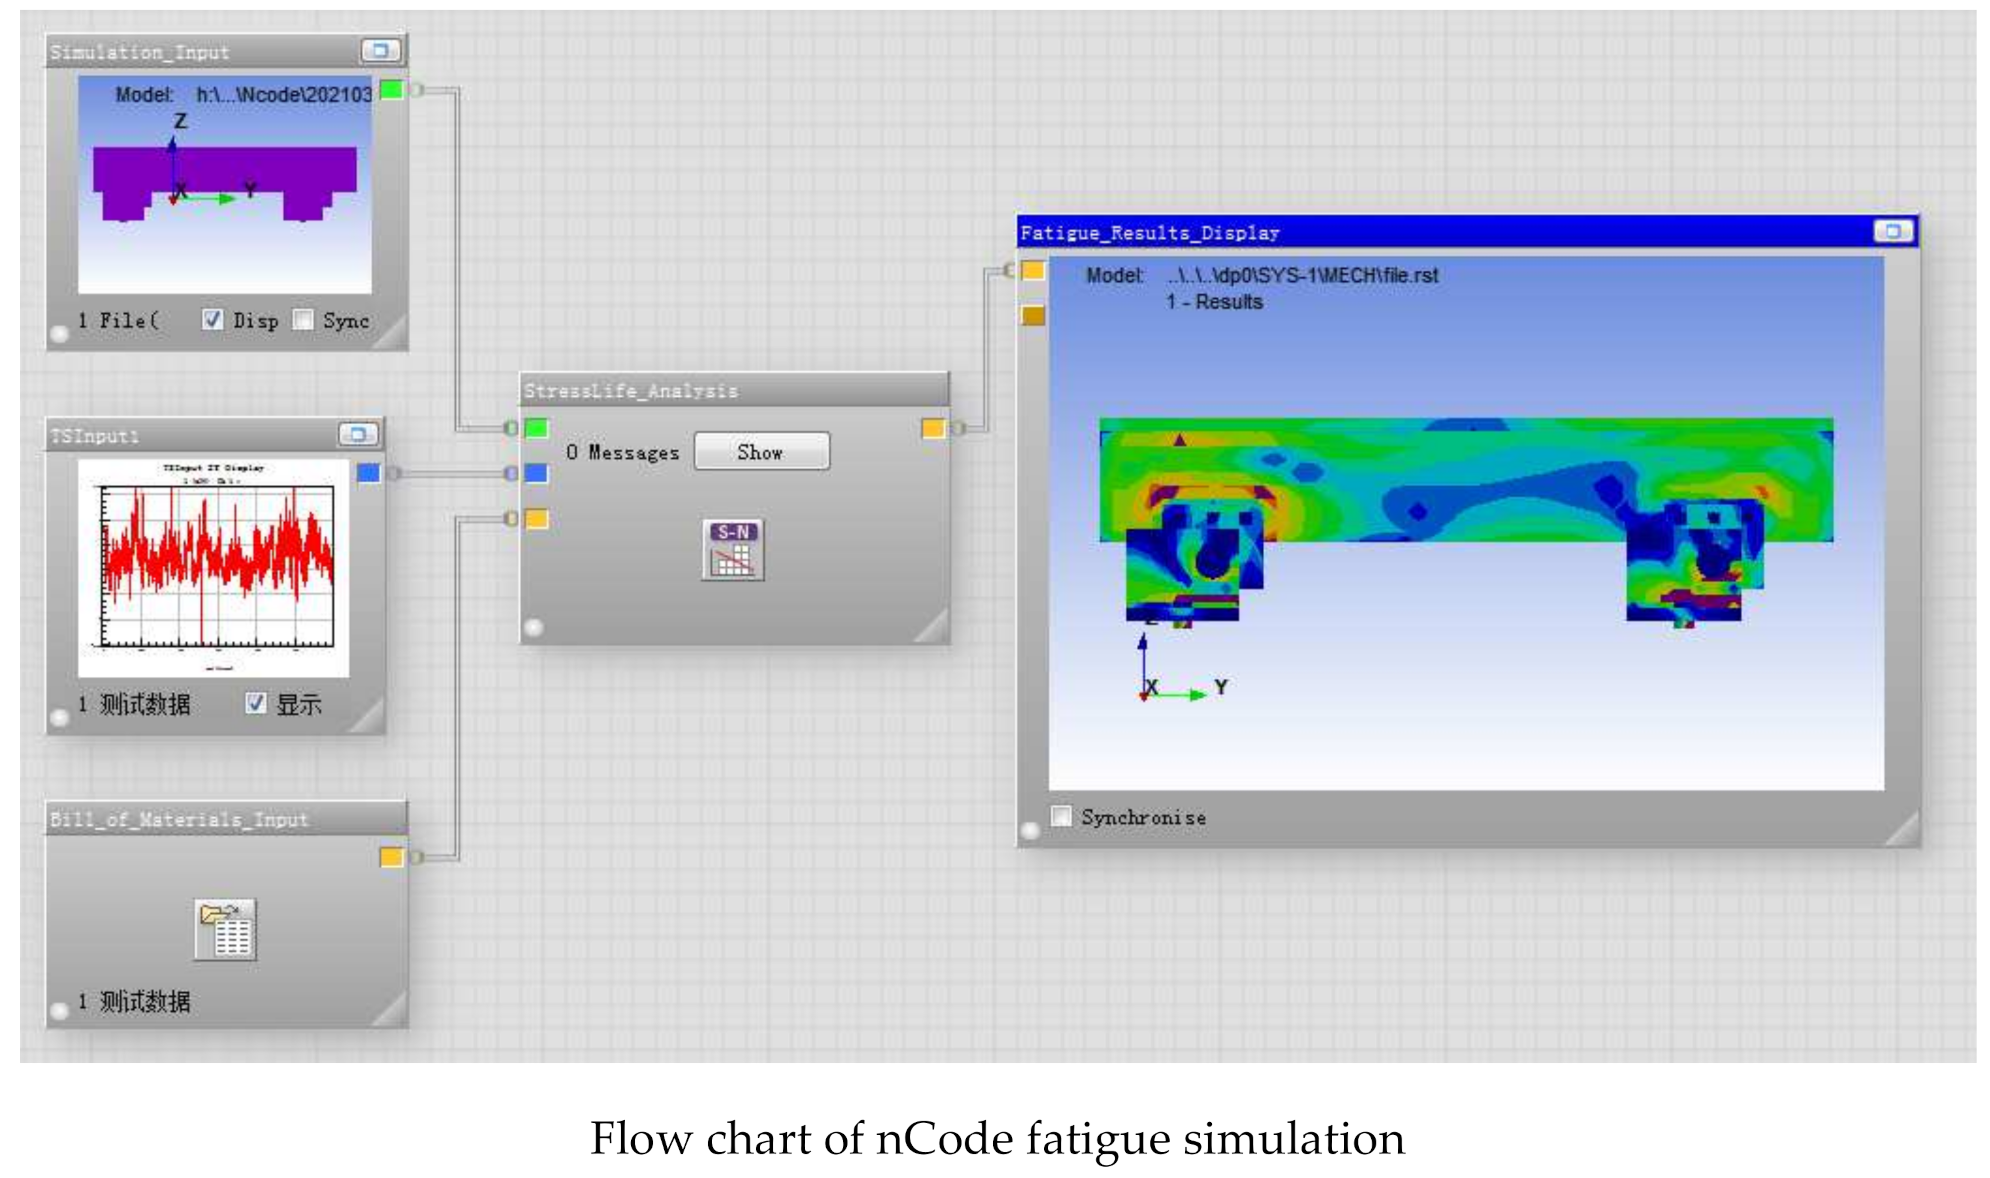
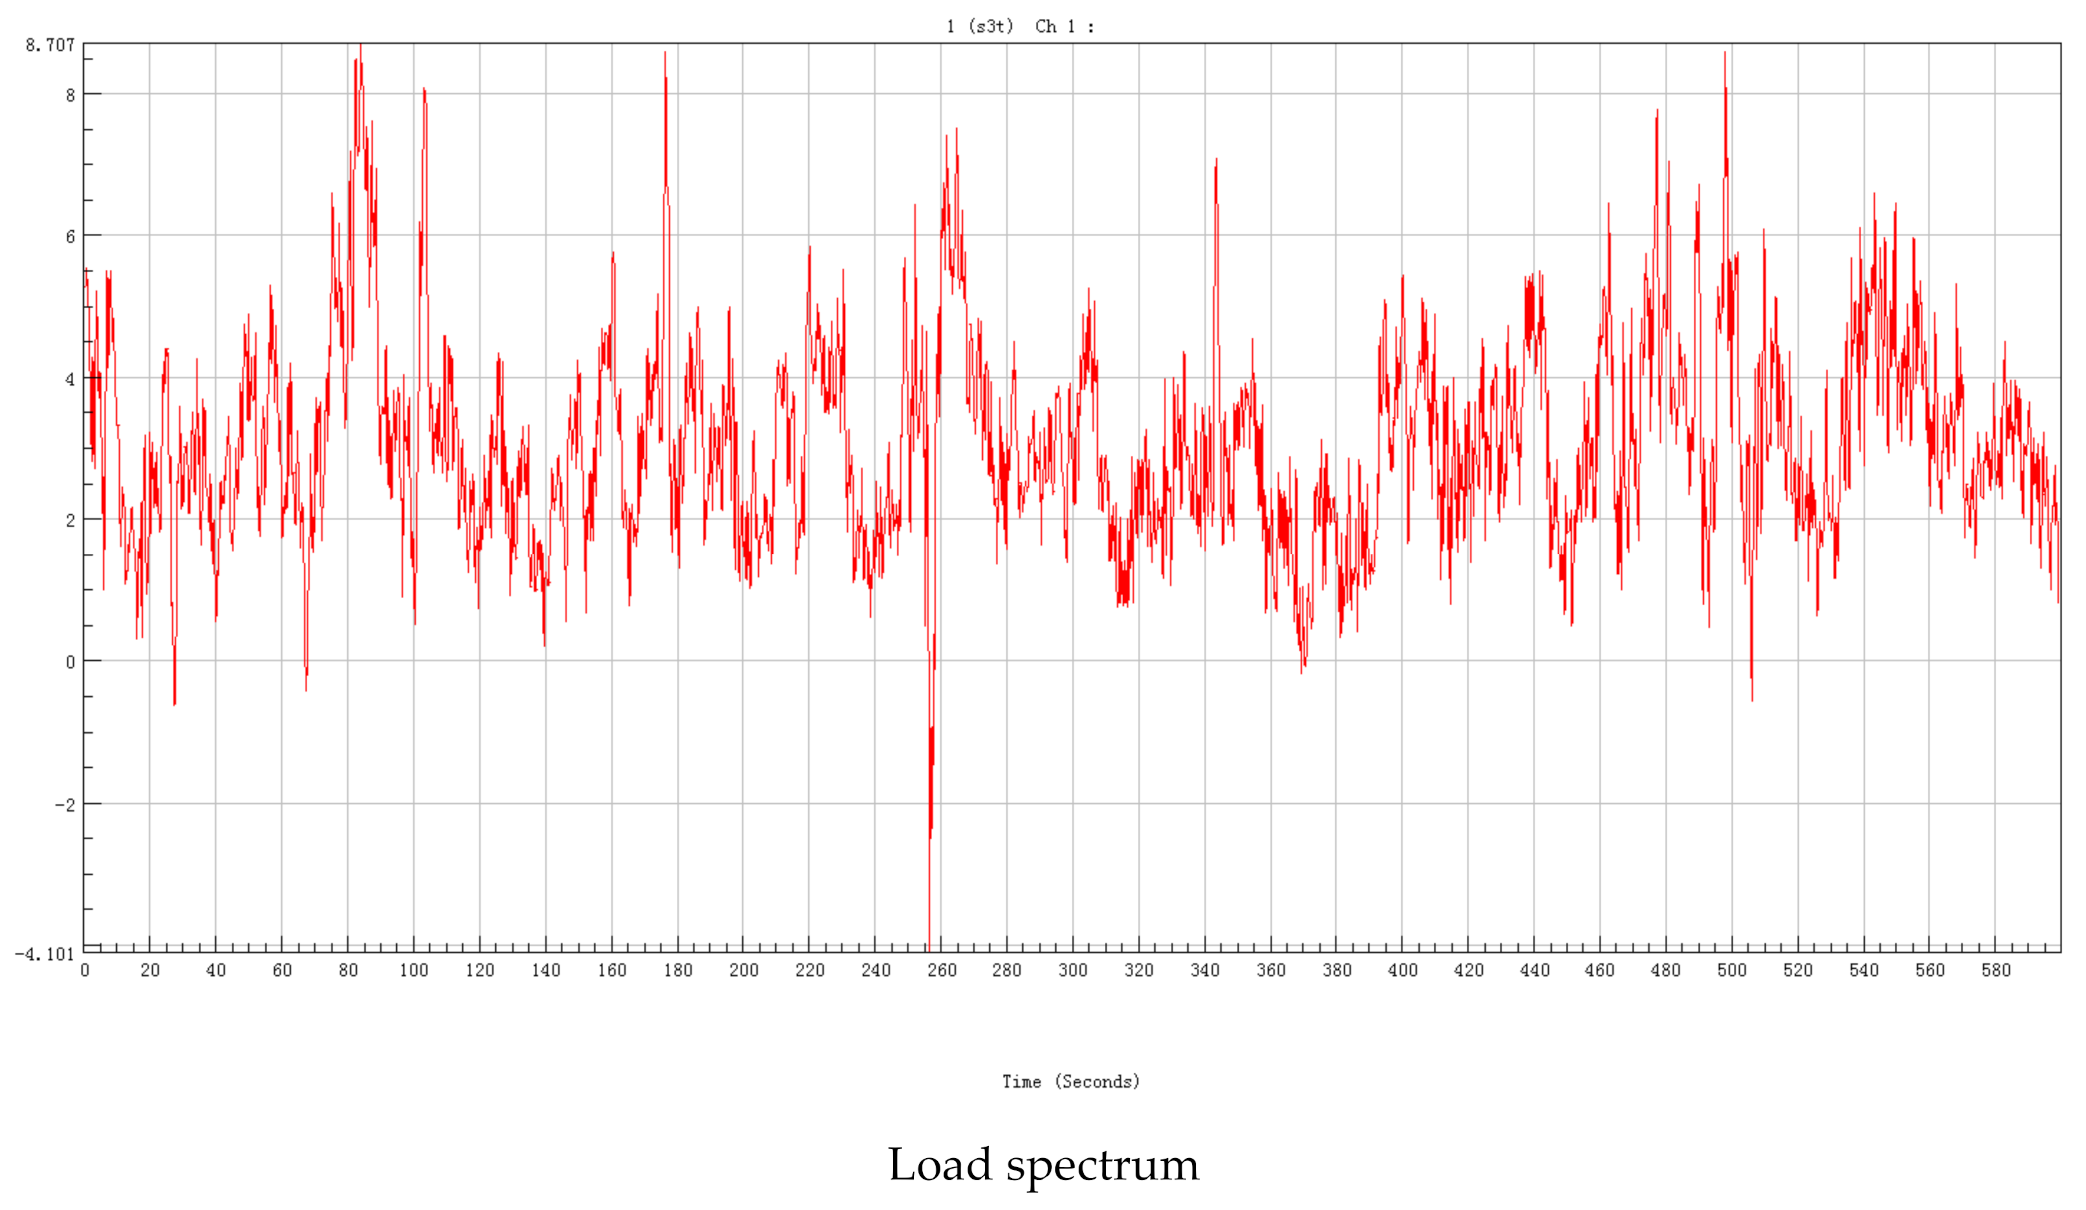
First, time–history data of wind pressure obtained from the wind tunnel test was converted into actual time–history data of wind pressure, and it was defined as wind pressure load with different time histories. A channel was established corresponding to measuring points on the glass curtain wall, and the finite element analysis results were imported into the nCode fatigue analysis module into the S-N time-series fatigue analysis environment. Moreover, a five-frame flow chart for typical fatigue analysis was constructed and included a geometric model, material parameter information, load information, fatigue solution settings, and result display. Finally, corresponding wind pressure time–history load was applied to the channel to form load spectrum, due to the large number of working conditions, the corresponding load spectrum is not listed, and the S-N curve of the system was used to calculate the fatigue life of the node by referring to the critical plane stress combination method (Figure 6).
2.3. Joint Distribution Model of Wind Velocity and Direction
According to the generalized extreme-value distribution model, this study fitted a probability density distribution of wind velocity under different wind directions, finding that extreme value type II (Frechet) distribution had a better fitting degree, and its formula is as follows:
where , , and represent location, scale, and shape parameters, respectively, and is the wind velocity. Parameters for the extreme value type II distribution are shown in Table 3.
The relationship between the azimuth angle and probability can be expressed by the following formula:
where is the probability; is the azimuth angle that will be radiated during regression; , , , are model parameters, as shown in Table 4.
indicates the joint distribution probability of any working condition of curtain wall supporting structure nodes and can be calculated through the following formula:
where is the probability of any working condition; and are wind velocity and azimuth angle of working condition, respectively.
3. Analysis of Results
3.1. Regression Analysis
Since countless working conditions are required to analyze wind-induced fatigue of the curtain wall, regression methods can be considered to reduce working conditions to be calculated. Traditional regression methods must be based on mathematical models, but it is difficult to find the relationship between wind velocity and direction with fatigue life. There is no mature mathematical model as reference. Even if there is, it cannot serve as a general model for different scenarios. In summary, the RBF neural network was adopted for regression analysis because it could not only approximate functions but also make predictions. The learning steps of the RBF neural network are:
① Initialization. Determine input vector , output vector , expected output vector , link weight from hidden layer to output layer, central parameter of each neuron in hidden layer, width vector and other neural network parameters:
where is the number of input layer units; means the number of output layer units. The initial value of the neural network center parameter and width vector can be output by the following formula:
In the formula, represents the total number of hidden layers; is the width adjustment coefficient, and the value should be less than 1, in order to allow each hidden layer neuron to easily perceive local information. However, the nonlinear mapping ability of the RBF network is reflected in the hidden layer function, so the adjustment of the hidden layer is conducive to improving the local response ability of the RBF neural network.
② Calculate output of the j-th neuron in the hidden layer:
③ Calculate output of neurons in the output layer.
In the formula, refers to adjustment weight between -th neuron in the output layer and j-th neuron in the hidden layer.
④ Iteration of weight parameters. The gradient descent method was applied to adaptively adjust calculation center, width, and weight parameters to the optimal value:
where means adjustment weight between k-th output neuron and j-th hidden layer neuron in the t-th iteration calculation; is the central component of the j-th hidden layer corresponding to the i-th input neuron in the t-th iterative calculation; means width corresponding to the center ; is the learning factor; is the RBF neural network error function given by the formula below:
where is the expected output value of the k-th output neuron at l-th input sample; is the network output value of k-th output neuron at l-th input sample.
⑤ When error is the smallest, iteration ends and the output is calculated; otherwise, go to step ②.
After trial calculation, in newrb (general function of the RBF neural network), the target of mean square error was set to 0; expansion velocity of radial basis was 6; maximum number of neurons was 110, and the number of neurons added each time was 4.
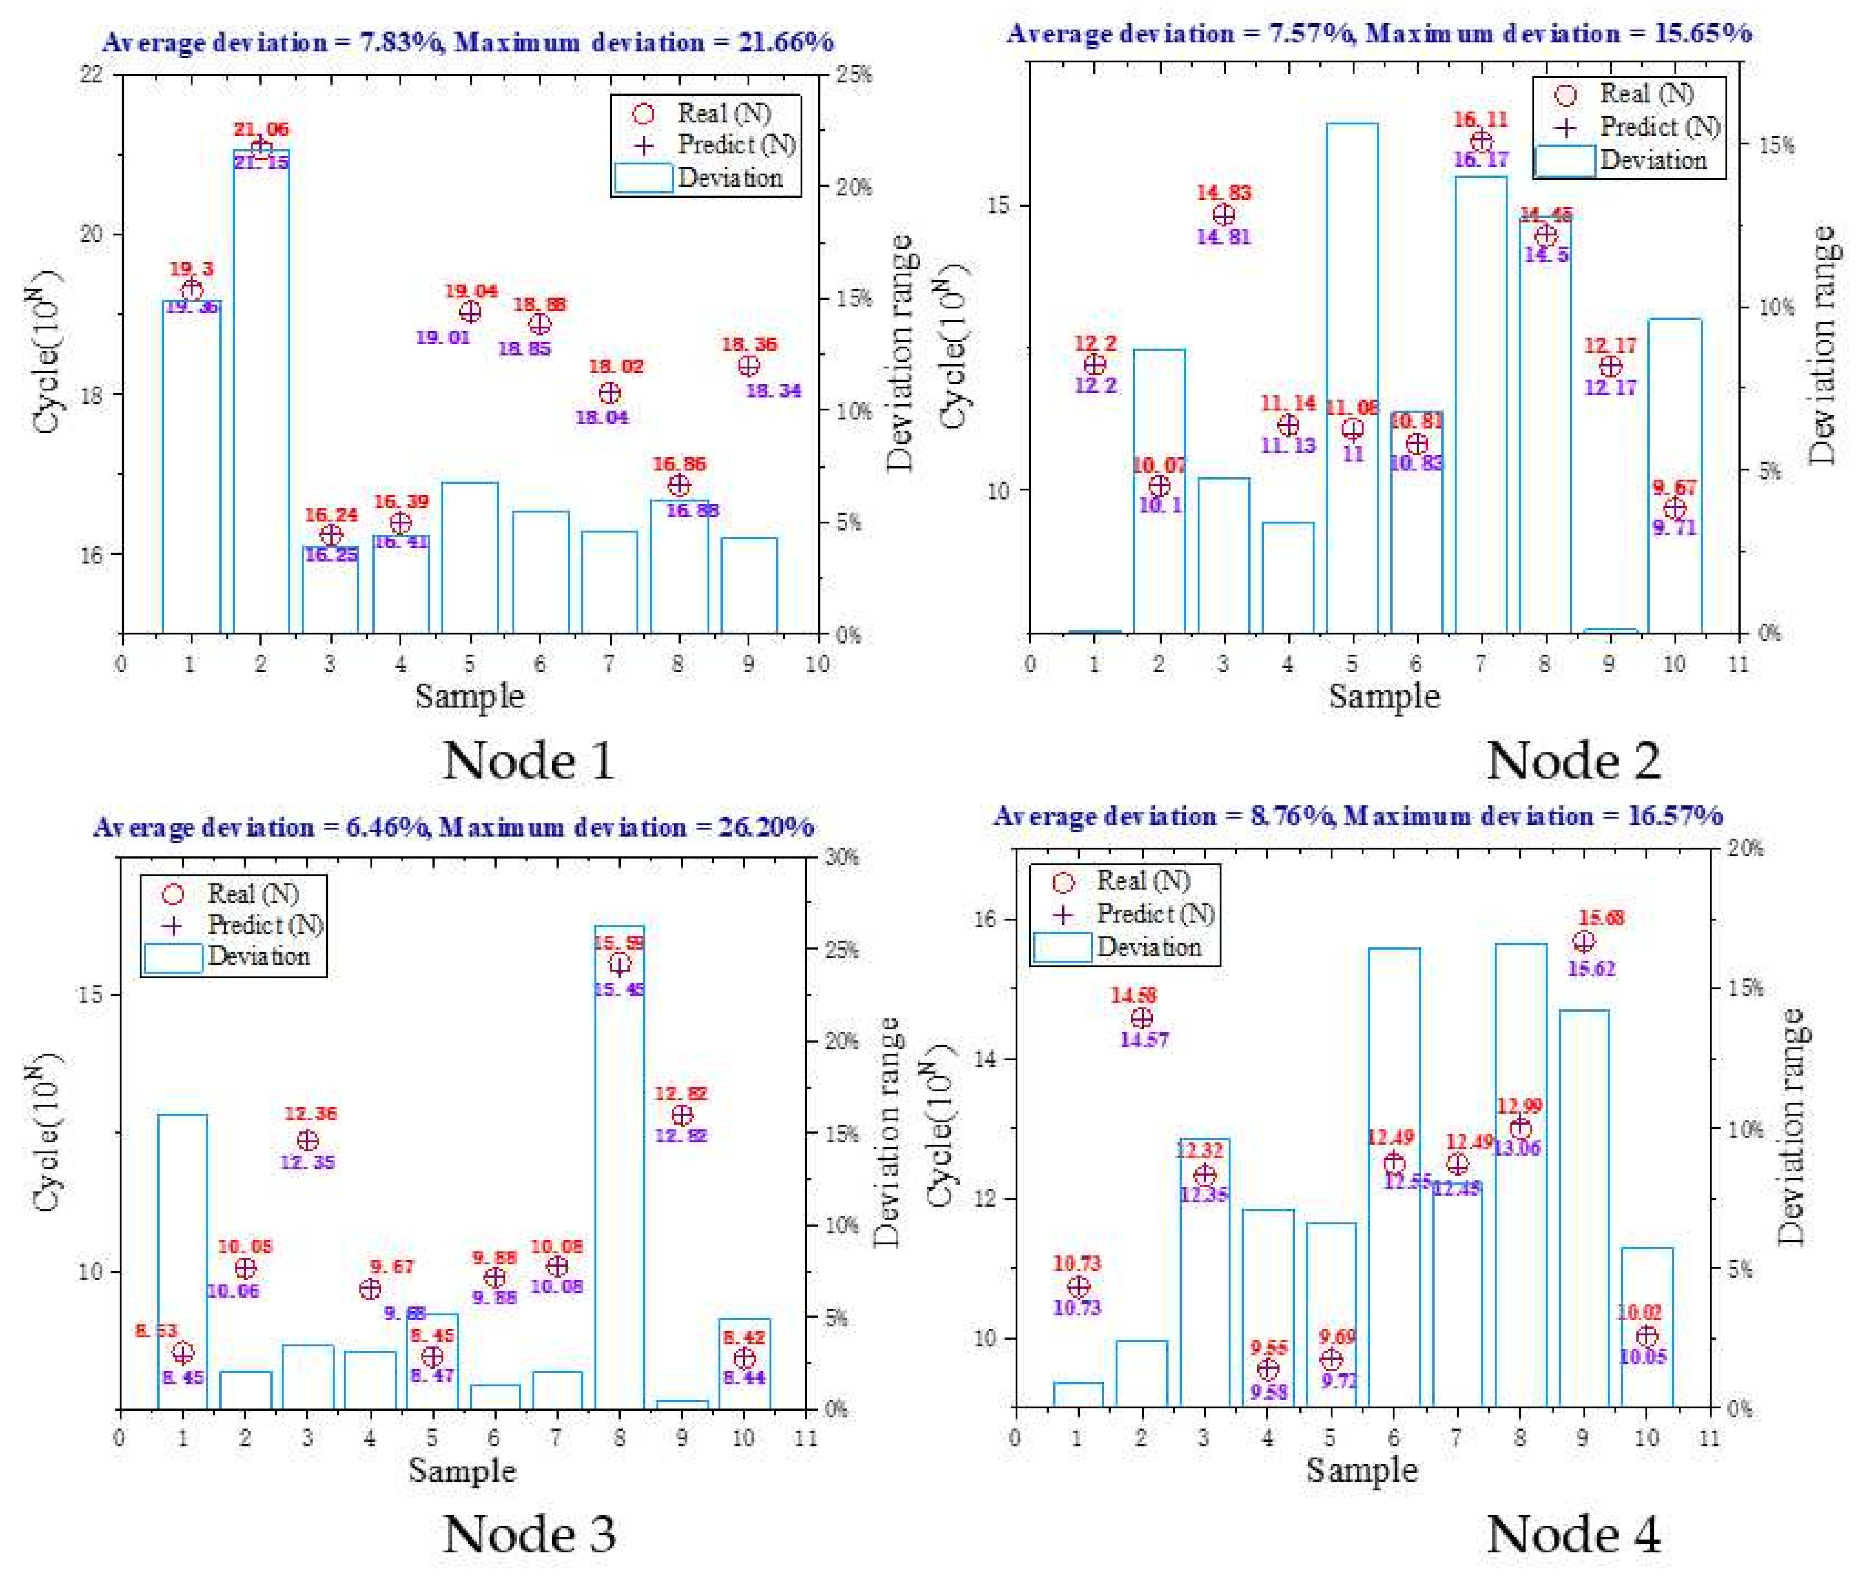
In this study, 10-fold cross-validation was used. Prior to formal regression, the training sample set and verification sample set would be randomly selected in a ratio of 9:1. The former was used to train different network structures, and the latter evaluated model performance. In order to avoid overfitting, it was necessary to find an optimal number of training times. Generally, before the optimal times, training error and test error shall decrease as the number of training times increase, but after this point, errors would rise. Figure 7 shows the results of the data training and test. The average deviation of the radial basis neural network is below 10%, and most of the maximum deviations are below 20%, which can be used for subsequent predictions.
3.2. Hypothesis Test for Fatigue Life Distribution
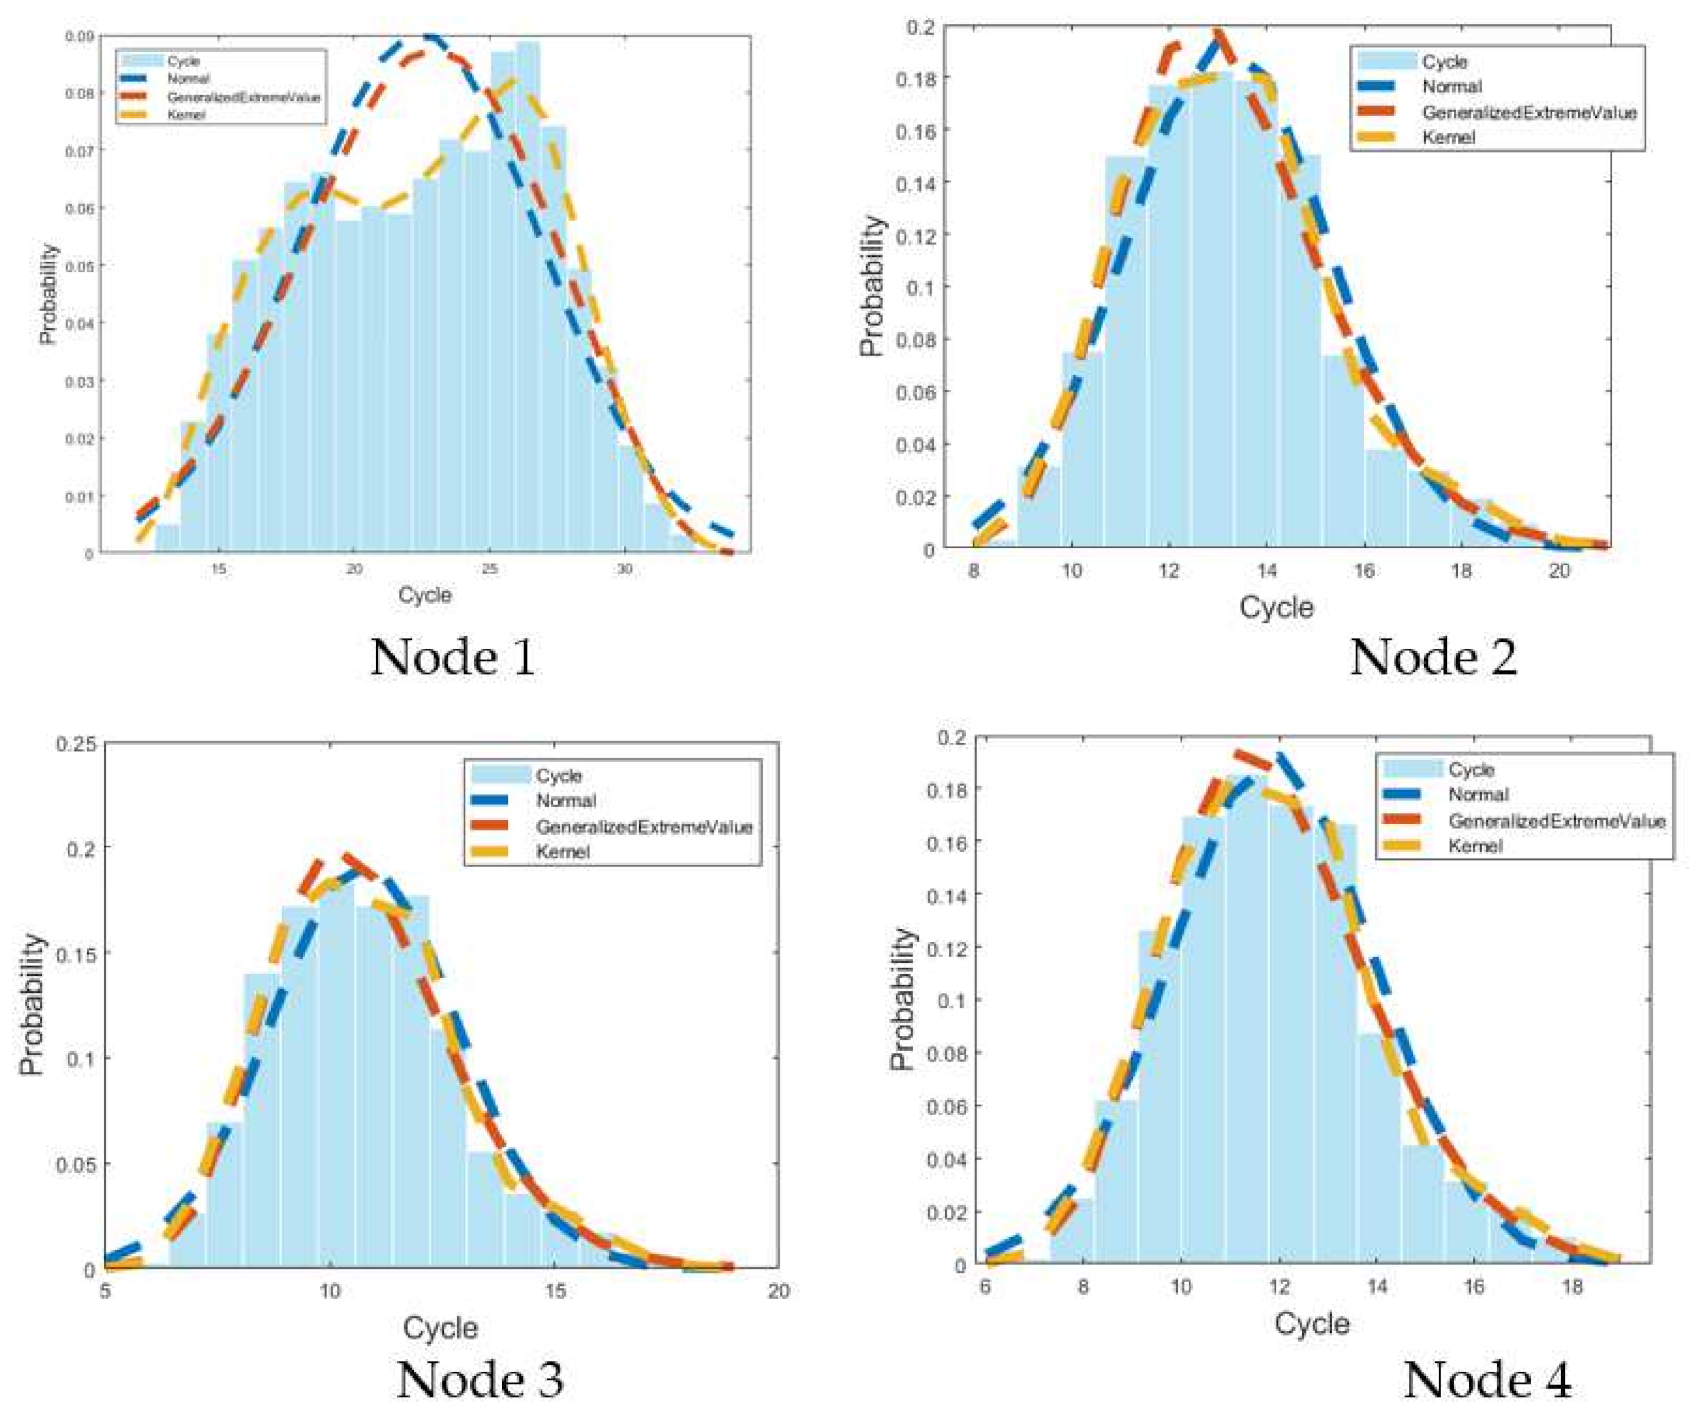
In view of the obtained RBF neural network and joint distribution model parameters of wind velocity and direction, this study predicted the life of each node of the curtain wall supporting structure, as shown in Figure 8.
The degree of fitting is roughly judged by correlation coefficient (R2) and mean square error (MSE), as shown in Table 5. It indicates the kernel distribution has the best fitting effect on nodes among all distributions, whose correlation coefficient is closer to 1 than other distributions, and the mean square error is more closer to 0. Normal distribution and GEV (generalized extreme value) distribution have a slightly poor-fitting effect on node 1, but the fitting effect on other nodes is not significantly different from the kernel distribution.
The chi-square test is an important method for goodness-of-fit and it determines whether a data sample comes from specified probability distributions and parameters are estimated from the data. In the test, data were grouped into different intervals whose actual and theoretical frequencies were calculated, and chi-square test statistic was measured [15].
The chi-square test aims to check the difference level between actual frequency and theoretical frequency; therefore, the core content is to calculate the statistic of the overall difference between actual frequency and theoretical frequency, which is the chi-square distance. This distance is equal to cumulative sum of ratio of square of difference between actual frequency and theoretical frequency to expected frequency [16]:
where stands for actual frequency and is the theoretical frequency based on a hypothesis distribution. When the frequency is large, the statistic is in an approximate chi-square distribution. The bigger chi-square value means longer distance and stronger difference. The table below explains the actual frequency and theoretical frequency calculated by each distribution. For easy comparison, the actual frequency is a positive integer, and the theoretical frequency is accurate to one decimal place. Table 6 lists test frequencies under various hypothetical distributions, including actual and theoretical frequencies. The difference in actual and theoretical frequencies of the three distributions is far from obvious.
Provided that unknown parameters in theoretical distribution need to be replaced by a corresponding estimator, then , statistic distribution is asymptotical to distribution with degrees of freedom, and is the number of intervals of test data. According to the theorem, for a given significance level , critical value is obtained by looking up the distribution table:
Obtain rejection region:
If the measured value of statistic calculated according to the given sample value falls into the rejection region, the null hypothesis is rejected. Otherwise, the difference is considered insignificant and the null hypothesis is accepted.
Propose a hypothesis for statistical data of wind-induced fatigue of curtain wall: fatigue life data obeys normal distribution, generalized extreme value distribution, and kernel distribution. The default intervals are 10, 2 unknown parameters of the normal distribution, 3 unknown parameters of GEV distribution, and 1 unknown parameter of kernel distribution. According to them, the critical value corresponding to the corresponding significance level can be found on the quantile table on the upper side of the chi-square distribution. Table 7 lists the chi-square test parameter calculation and search results.
It shows from the table, values of four selected nodes are all much smaller than , indicating that the null hypothesis is established, and fatigue life data obey the above three distributions. Among them, the calculated value of the chi-square distance of node 1 for three distributions is small, meaning the degree of conformity is good. On the whole, the minimum value is found in the calculation of Node 1 to the kernel distribution, which is consistent with the statistics of life probability distribution in the previous part. The maximum value appears in the calculation of Node 4 to a normal distribution, less than 1, indicating that fatigue life data are in good agreement with the three distributions.
3.3. Distribution Law of Fatigue Life
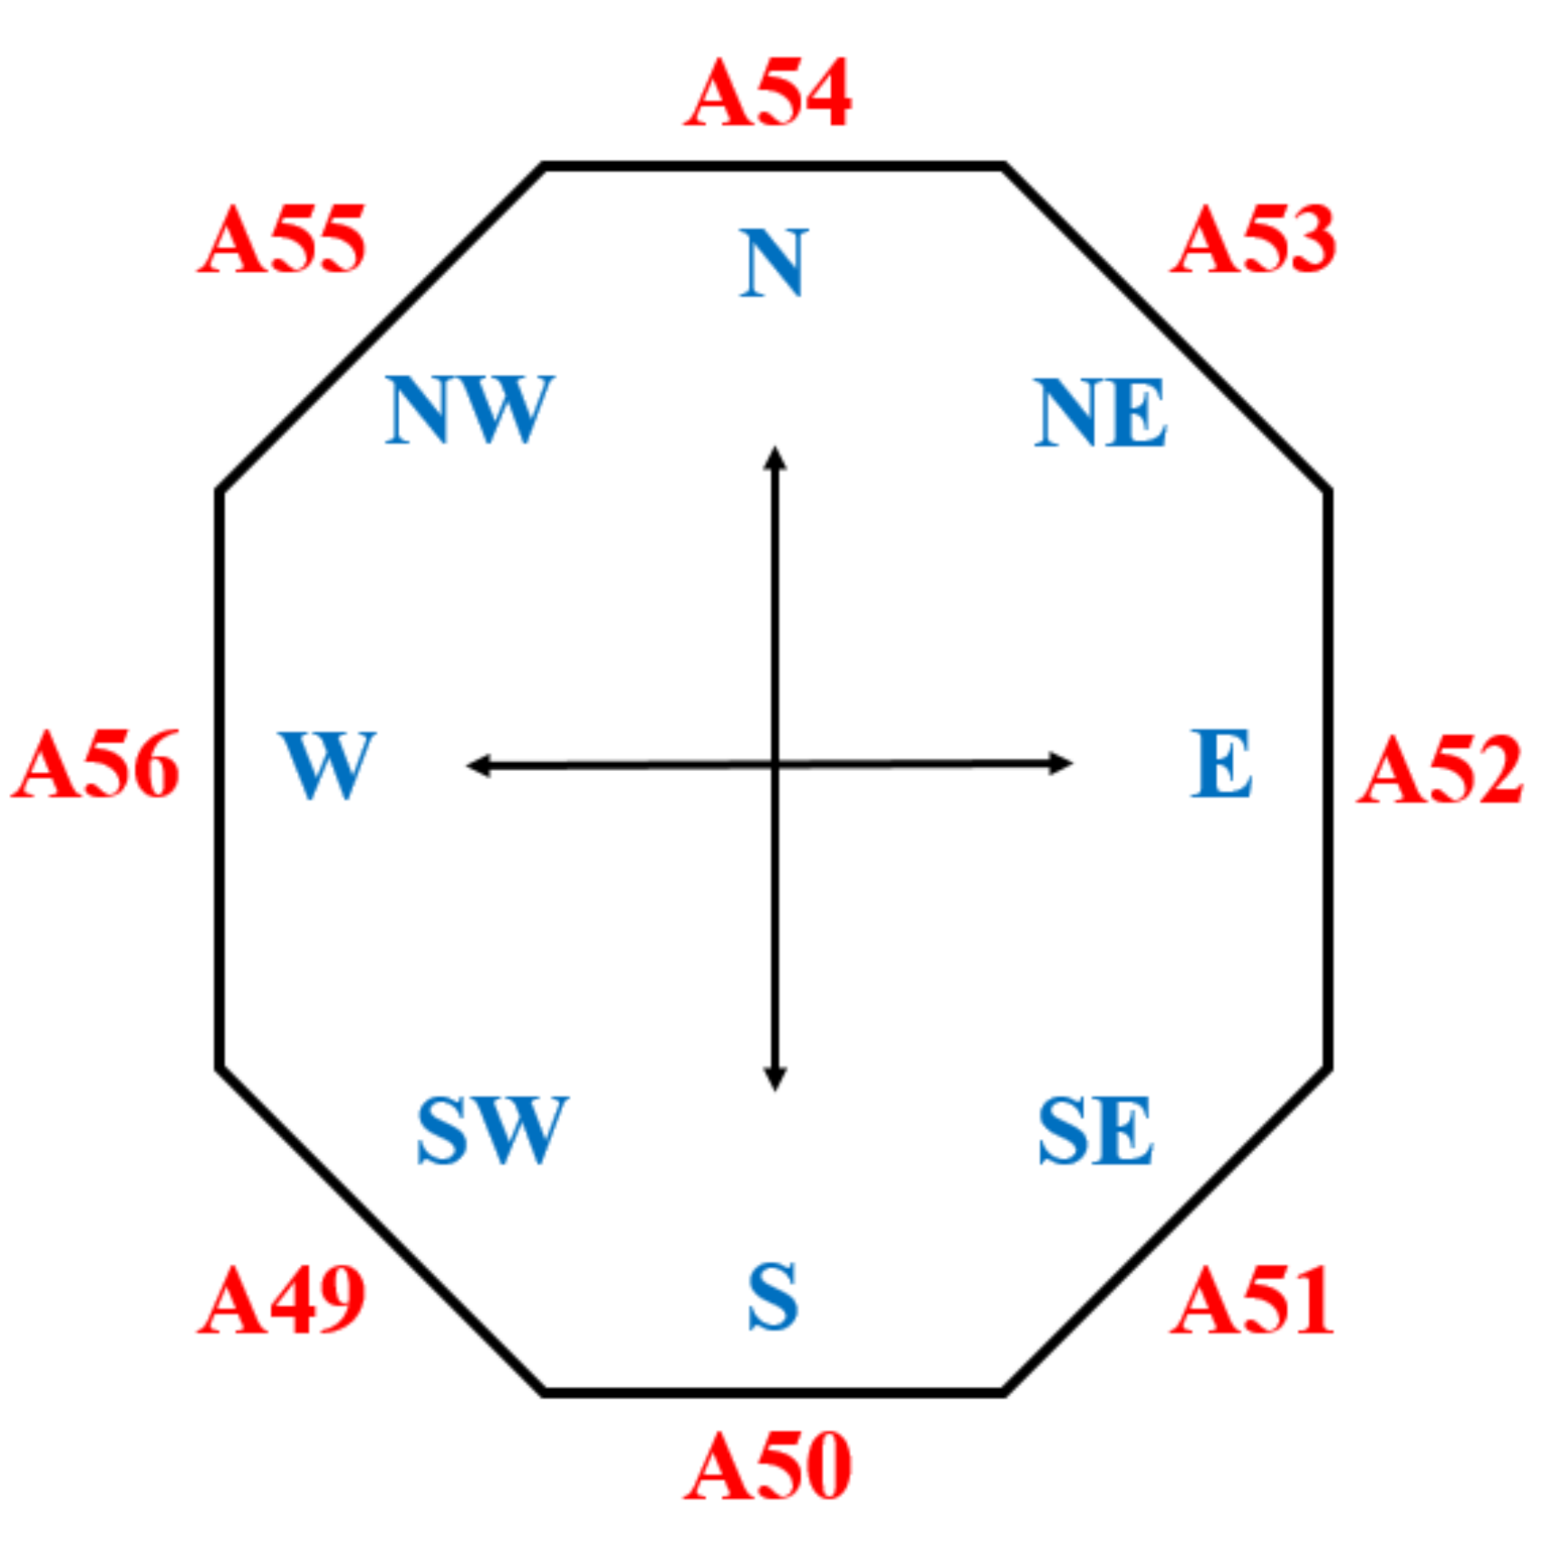
In this study, Node 4 was selected as a representative to analyze the wind-induced fatigue life distribution law of curtain wall supporting structure. Figure 9 describes a schematic diagram of the orientation of each partition, and fatigue analysis is performed on the glass curtain wall in the northwest zone with greater stress.
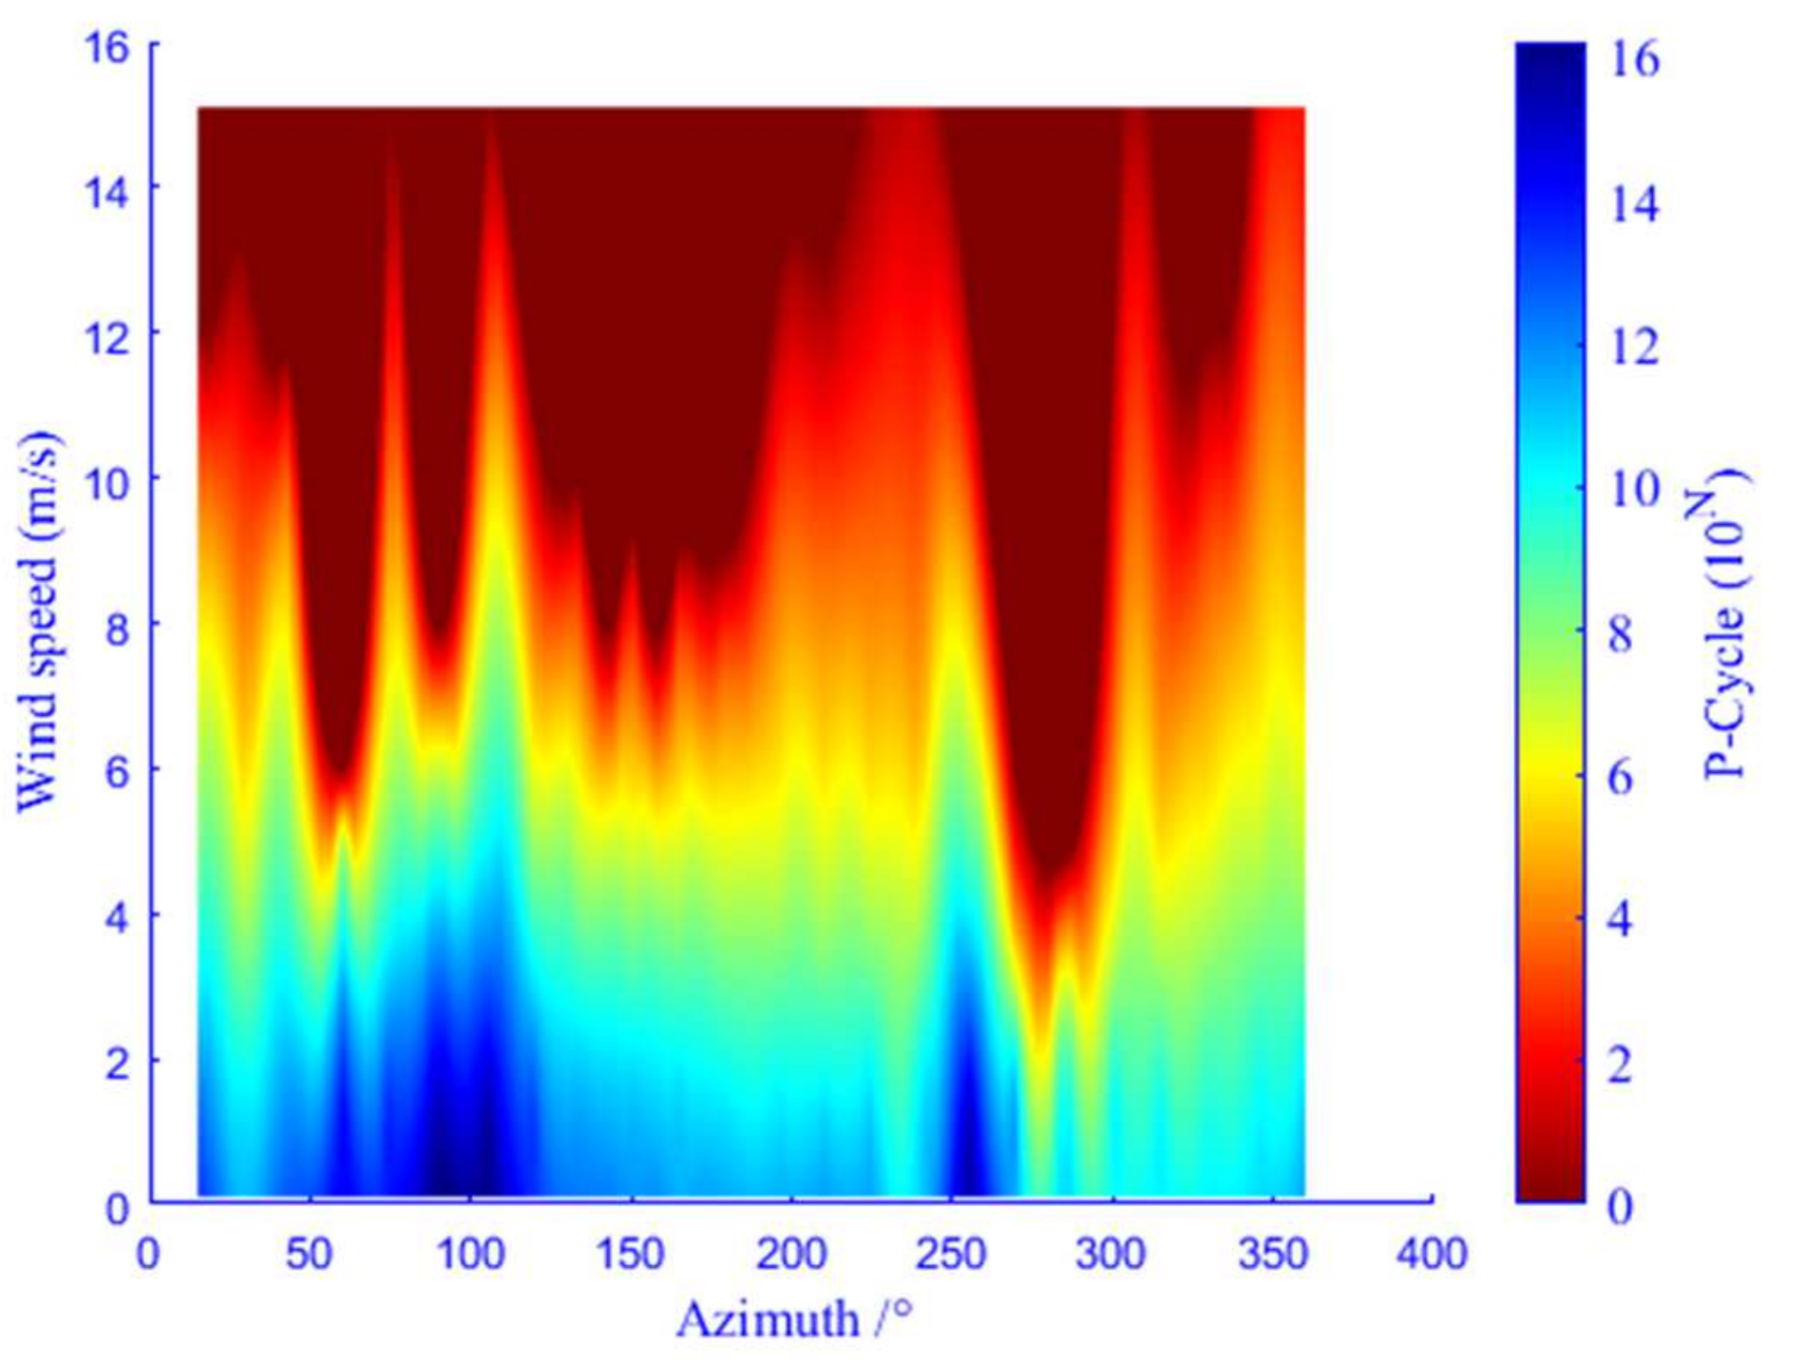
In this paper, the probability life is used to reflect the degree of fatigue damage, and the probability life (P-Cycle) is the product of the probability of the condition (Probability) and the fatigue life (Cycle). In general, the probability life of nodes in different regions is between 0~1016 and obviously distributed in three regions. According to the probability life distribution in the northwest area (Figure 10), working conditions with high probability life (bluish area) mainly face wind velocity 0~5 m/s and an azimuth angle between 30°~120° and 240°~260°. Working conditions with middle probability life (greenish area) mainly experience wind velocity 4~8 m/s and azimuth angle 0°~360°. Wind velocity 8~15 m/s and an azimuth angle 50°~100°, 120°~200°, and 260°~300° are found in working conditions with low probability life (reddish area), and this part accounts for the largest proportion of all probability life conditions.
Table 8 introduces 10 working conditions with shorter probability life at Node 4. On the whole, the probability life of node 4 is distributed between [106, 1011]; the probability of a single working condition is generally below 0.01%, with a maximum of less than 0.02%; the azimuth is distributed between [190°, 365°], and wind velocity is between [8, 12]. According to the calculation, about 95% of fatigue damage takes place in the first 30 working conditions, and the fatigue damage value is between 3.5 × 10⁻³~9.36 × 10⁻². The total damage of node 4 calculated in this paper is about 10−3 orders of magnitude, and the fatigue damage of bolt of curtain wall aluminum calculated in the literature [17] is between 10−3~10−6 orders of magnitude, which is not much different from the total fatigue damage calculated in this paper and can be used as a comparison.
4. Conclusions
This study mainly explores wind-induced fatigue of curtain wall supporting structures, providing a reference case for the wind-induced fatigue analysis of similar structures. The research process and conclusion are listed:
- (1)
- The wind tunnel test and finite element analysis of the curtain wall model show that the maximum wind pressure of the wall partition of Block A is 1.89 kPa, which occurs in the northwest area. The maximum equivalent stress value obtained by static analysis of the curtain wall is 26.173 Mpa, and the connection between structure and aluminum alloy frame is applied with larger stress.
- (2)
- Introduce a joint distribution model to fit local wind velocity and direction. The results indicate that the probability density function of extreme value type II is in good agreement with the local wind velocity and direction distribution. Corresponding parameters are calculated in accordance with the wind velocity probability density model and azimuth probability density model, to form a joint probability density function of wind velocity and direction.
- (3)
- Data are regressed by the radial basis neural network regression algorithm, and the regression deviation is tested. According to findings, fatigue life data obey the normal distribution, generalized extreme value distribution, and kernel distribution; azimuth angles of 50°~100°, 120°~200°, and 260°~300° are found in working conditions with low probability life, and this part accounts for the largest proportion of all probability life conditions. About 95% of fatigue damage is found in the first 30 working conditions, with fatigue damage value between 3.5 × 10⁻³~9.36 × 10⁻².
Author Contributions
Conceptualization, methodology, software, validation, formal analysis, investigation, resources, data curation, writing—original draft preparation, writing—review and editing, visualization, H.L.; supervision, project administration, funding acquisition, Z.L. All authors have read and agreed to the published version of the manuscript.
Funding
The work described in this paper is fully supported by the National Natural Science Foundation of China Project [Grant number: 51678233] and [Grant number: 52178476].
Institutional Review Board Statement
Not applicable.
Informed Consent Statement
Not applicable.
Data Availability Statement
Not applicable.
Conflicts of Interest
The authors declare no conflict of interest.
References
- Sivaprakasam, T.; Kesawan, S.; Mahendran, M.; Stringfellow, J.; Baleshan, B. Full-scale tests of aluminium mullion couples in unitized facades under wind actions. Eng. Struct. 2020, 215, 110653. [Google Scholar] [CrossRef]
- Liang, Q.S.; Fu, J.Y.; Li, Z.; Yan, B.W.; Shu, Z.R.; He, Y.C. Bimodal distribution of wind pressure on windward facades of high-rise buildings induced by interference effects. J. Wind Eng. Ind. Aerodyn. 2020, 200, 104156. [Google Scholar] [CrossRef]
- Hui, C.; Shang, Q.; Liu, P.; Hai, R. Experimental and numerical investigation on load-bearing performance of aluminum alloy upright column in curtain walls under wind pressure. KSCE J. Civ. Eng. 2020, 24, 847–855. [Google Scholar] [CrossRef]
- Yu, Y.; Liu, T.; Zhang, Q.; Yang, B. Wind-induced response of an L-shaped cable support glass curtain wall. Shock. Vib. 2017, 2017, 4163045. [Google Scholar] [CrossRef] [Green Version]
- Ouyang, Z.; Spence, S.M. Performance-based wind-induced structural and envelope damage assessment of engineered buildings through nonlinear dynamic analysis. J. Wind Eng. Ind. Aerodyn. 2021, 208, 104452. [Google Scholar] [CrossRef]
- You, H. Effects of City Growth on Tall Building Cladding Fatigue. Master’s Thesis, University of Western Ontario, London, ON, Canada, 2020. [Google Scholar]
- Chen, J. The Vulnerability Research on Glass Curtain Wall of High-Rise Building by Considering Wind-Induced Internal and External Pressure; Harbin Institute of Technology: Harbin, China, 2018. [Google Scholar]
- Zeng, S. Research on Wind Resistance and Safety Evaluation Method of Glass Curtain Wall; Hunan University: Changsha, China, 2012. [Google Scholar]
- Li, H.; Shu, G.; Lu, R. Analysis on wind-induced fatigue performance of point-supported glass curtain for flexibly supports system. Steel Constr. 2011, 26, 1–6. [Google Scholar]
- Mu, G. Study on Wind-Induced Fatigue of High-Strength Bolts of Lightning Rod Structures; Zhengzhou University: Zhengzhou, China, 2018. [Google Scholar]
- Huang, S.; Huang, M.-F.; Ye, H.-K.; Hu, D.-J. Dynamic Wind-induced Vibration and Fatigue Damage Analysis of Heliostat Structures. Eng. Mech. 2017, 34, 120–130. [Google Scholar]
- Jafari, M.; Sarkar, P.P. Wind-induced response characteristics of a yawed and inclined cable in ABL wind: Experimental-and numerical-model based study. Eng. Struct. 2020, 214, 110681. [Google Scholar] [CrossRef]
- Wu, Y.; Sun, Y.; Zheng, C.-R.; Sun, X.-Y. Wind Engineering and Structural Wind Resistance Design; Harbin Institute of Technology Press: Harbin, China, 2014. [Google Scholar]
- Luo, H.; Li, Z.; Xiong, Q. Study on wind-induced fatigue of heliostat based on artificial neural network. J. Wind Eng. Ind. Aerodyn. 2021, 217, 104750. [Google Scholar] [CrossRef]
- Nan, D. Theoretical Analysis and Research on Reliability Model of CNC Machine Tools; University of Science and Technology Beijing: Beijing, China, 2017. [Google Scholar]
- Ma, X.; Yao, Z.; Wu, T.; Wang, M. Data Analysis Methods and Applications; Posts & Telecom Press: Beijing, China, 2015. [Google Scholar]
- Wei, X.-C.; Cao, Y.-J.; Ye, L.-S.; Zheng, H.-S.; Gao, Y.-Y. Application of two-point supported aluminum plate curtain wall and its fatigue life analysis. In Proceedings of the 2020 National Civil Engineering Construction Technology Exchange Conference, Beijing, China, 21 December 2020; pp. 525–527. [Google Scholar]
Figure 1.
Research process.

Figure 2.
Distribution of wind tunnel experimental models. (A) tower A, 280 m high, the scale ratio is 1:300; (B) tower B, 200 m high, the scale ratio is 1:300; (C) commercial center.
Figure 2.
Distribution of wind tunnel experimental models. (A) tower A, 280 m high, the scale ratio is 1:300; (B) tower B, 200 m high, the scale ratio is 1:300; (C) commercial center.

Figure 3.
Simulation of type B geomorphic boundary layer in wind tunnel.

Figure 4.
Finite element analysis.

Figure 5.
Schematic diagram of glass curtain wall structure and nodes. 1–4 are the selected representative nodes.
Figure 5.
Schematic diagram of glass curtain wall structure and nodes. 1–4 are the selected representative nodes.

Figure 6.
Ncode analysis.


Figure 7.
Training and test of RBF regression.

Figure 8.
Probability distribution statistics of lifespan.

Figure 9.
Partition azimuth.

Figure 10.
Node-azimuth-wind velocity-probability life in northwest region.


Table 1.
Mechanical properties of curtain wall materials.
| Materials | Gravity Density | Elasticity Modulus | Poisson’s Ratio | Coefficient of Linear Expansion | Torsion Modulus |
|---|---|---|---|---|---|
| Glass | 25.6 kN/m3 | 7.20 × 10⁴ MPa | 0.20 | 0.85/10−5 | 2.93 × 10⁴ MPa |
| Aluminum alloy sections | 28.0 kN/m3 | 7.00 × 10⁴ MPa | 0.33 | 2.35/10−5 | |
| Steel | 78.5 kN/m3 | 2.06 × 10⁵ MPa | 0.30 | 1.20/10−5 | |
| Stainless steel | 78.5 kN/m3 | 2.06 × 10⁵ MPa | 0.30 | 1.80/10−5 |
Note: 1 kg/m3 = 0.01 kN/m3.
Table 2.
Parameters of finite element model.
| Project | Parameters | Project | Parameters |
|---|---|---|---|
| Number of nodes | 66,180 | Contact unit | conta174 |
| Number of units | 37,584 | Contact type | bonded |
| Entity unit | solid185 | Grid size | 0.01 m |
| Target Unit | targe170 | Grid division | mapped meshing |
Table 3.
Probability density function parameters of wind velocity at all azimuth angles.
| Wind Direction | (Location Parameter) | (Scale Parameter) | (Shape Parameter) |
|---|---|---|---|
| 1 | −0.102 | 1.198 | 2.107 |
| 2 | −0.032 | 1.107 | 2.083 |
| 3 | −0.090 | 1.107 | 2.006 |
| 4 | −0.147 | 0.686 | 1.475 |
| 5 | 0.017 | 0.675 | 1.361 |
| 6 | −0.095 | 0.674 | 1.311 |
| 7 | −0.011 | 0.695 | 1.338 |
| 8 | −0.038 | 0.694 | 1.346 |
| 9 | −0.076 | 0.830 | 1.704 |
| 10 | −0.085 | 0.882 | 1.749 |
| 11 | −0.133 | 1.037 | 2.104 |
| 12 | −0.159 | 1.163 | 2.190 |
| 13 | −0.065 | 1.207 | 2.222 |
| 14 | −0.069 | 1.317 | 2.085 |
| 15 | 0.062 | 1.012 | 1.672 |
| 16 | 0.178 | 0.735 | 1.387 |
| 17 | −0.005 | 0.545 | 1.079 |
| 18 | −0.207 | 0.448 | 1.200 |
| 19 | −0.112 | 0.468 | 1.157 |
| 20 | 0.067 | 0.659 | 1.398 |
| 21 | 0.015 | 0.992 | 1.921 |
| 22 | −0.099 | 1.282 | 2.789 |
| 23 | −0.039 | 1.529 | 3.227 |
| 24 | 0.064 | 1.530 | 2.663 |
Table 4.
Probability density model parameters of azimuth.
| 0.0099 | −0.0016 | −0.3167 | −0.28 |
Table 5.
Correlation coefficient and mean square error of fitting life of several distributions.
| Node | Normal | GEV | Kernel | |||
|---|---|---|---|---|---|---|
| R2 | MSE | R2 | MSE | R2 | MSE | |
| 1 | 0.8204 | 3.17 × 10⁻⁴ | 0.8660 | 2.38 × 10⁻⁴ | 0.9807 | 3.51 × 10⁻⁵ |
| 2 | 0.9843 | 2.31 × 10⁻⁴ | 0.9824 | 2.52 × 10⁻⁴ | 0.9924 | 1.54 × 10⁻⁴ |
| 3 | 0.9628 | 5.41 × 10⁻⁴ | 0.9655 | 5.26 × 10⁻⁴ | 0.9824 | 3.51 × 10⁻⁴ |
| 4 | 0.9538 | 4.92 × 10⁻⁴ | 0.9713 | 3.36 × 10⁻⁴ | 0.9818 | 2.33 × 10⁻⁴ |
Table 6.
Hypothesis test frequency for life distribution.
| Node | Actual Frequency | Theoretical Frequency | ||
|---|---|---|---|---|
| Normal Distribution | Generalized Extreme Value Distribution | Kernel Density Estimation | ||
| 1 | 12, 11 | 12.7, 10.3 | 12.3, 10.7 | 11.9, 11.1 |
| 2 | 6, 8 | 7.0, 7.0 | 7.6, 6.4 | 7.4, 6,6 |
| 3 | 6, 9 | 7.0, 8.0 | 7.6, 7.4 | 7.4, 7.6 |
| 4 | 7, 7 | 8.7, 5.3 | 5.7, 8.3 | 5.6, 8.4 |
Table 7.
Hypothesis test parameters for life distributions.
| Node | Normal Distribution | Generalized Extreme Value Distribution | Nuclear Distribution | |||
|---|---|---|---|---|---|---|
| 1 | 0.0772 | 14.067 | 0.0167 | 12.592 | 0.0036 | 15.507 |
| 2 | 0.3128 | 0.6958 | 0.5447 | |||
| 3 | 0.2864 | 0.6904 | 0.5598 | |||
| 4 | 0.8864 | 0.0337 | 0.0415 | |||
Table 8.
Some working conditions with shorter probability life of node 4 in northwest area.
| S/N | Azimuth (°) | Wind Velocity (m/s) | Probability | Life (10N) | Probability Life (10N) |
|---|---|---|---|---|---|
| 1 | 75 | 11.1 | 3.69 × 10⁻⁸ | 10.45 | 3.01 |
| 2 | 240 | 10.1 | 2.17 × 10⁻⁵ | 7.76 | 3.10 |
| 3 | 225 | 10.1 | 2.07 × 10⁻⁵ | 7.81 | 3.13 |
| 4 | 300 | 7.1 | 5.89 × 10⁻⁵ | 7.42 | 3.19 |
| 5 | 360 | 12.1 | 1.47 × 10⁻⁴ | 7.04 | 3.21 |
| 6 | 330 | 9.1 | 1.90 × 10⁻⁴ | 6.96 | 3.24 |
| 7 | 30 | 9.1 | 1.03 × 10⁻⁵ | 8.28 | 3.30 |
| 8 | 315 | 8.1 | 1.77 × 10⁻⁴ | 7.12 | 3.36 |
| 9 | 195 | 9.1 | 2.30 × 10⁻⁵ | 8.00 | 3.37 |
| 10 | 15 | 10.1 | 3.64 × 10⁻⁷ | 9.88 | 3.44 |
Publisher’s Note: MDPI stays neutral with regard to jurisdictional claims in published maps and institutional affiliations. |
© 2022 by the authors. Licensee MDPI, Basel, Switzerland. This article is an open access article distributed under the terms and conditions of the Creative Commons Attribution (CC BY) license (https://creativecommons.org/licenses/by/4.0/).
Share and Cite
MDPI and ACS Style
Luo, H.; Li, Z. On Wind-Induced Fatigue of Curtain Wall Supporting Structure of a High-Rise Building. Appl. Sci. 2022, 12, 2547. https://doi.org/10.3390/app12052547
AMA Style
Luo H, Li Z. On Wind-Induced Fatigue of Curtain Wall Supporting Structure of a High-Rise Building. Applied Sciences. 2022; 12(5):2547. https://doi.org/10.3390/app12052547
Chicago/Turabian StyleLuo, Haiyin, and Zhengnong Li. 2022. "On Wind-Induced Fatigue of Curtain Wall Supporting Structure of a High-Rise Building" Applied Sciences 12, no. 5: 2547. https://doi.org/10.3390/app12052547
Note that from the first issue of 2016, this journal uses article numbers instead of page numbers. See further details here.