1. Introduction
Blast furnace (BF) technology is currently evolving towards operative regimes involving smaller and smaller quantities of reducing agents in order to limit carbon dioxide (CO
2) emissions. At the same time, the need to increase productivity has led to increasing BF volumes. Operating conditions characterized by low levels of reducing agents and increasingly large BFs lead to occurrence of undesirable phenomena such as slipping and channeling [
1,
2].
Since these irregularities in the functioning of BF ultimately result in a loss of production and materials and cause variations in the quality of the iron [
3,
4], the analysis and the prevention of the above-mentioned phenomena is of great interest. The authors of [
5] give a list of measures for preventing violations in the run of a specific BF, identified through the analysis of scull slipping and channeling in the BF prior to implementation of these measures. This has encouraged a reduction in the specific consumption of coke and an increase in the productivity of the furnace.
There are several studies available in literature that have led to the formulation of predictive methodologies able to identify the phenomena at an early stage [
6,
7,
8,
9,
10] before they have the opportunity to manifest themselves. For instance, in [
9], a visualization technology mainly made of pressure distribution was developed to predict BF channeling phenomena. With this technology, a prediction can be obtained 10 to 15 min ahead of channeling, allowing sufficient time for the operator to adjust the BF operation in order to avoid the occurrence of channeling. In [
10], statistical processing and pattern classification techniques are applied to various types of sensory information. A plurality of feature quantities, correlated highly with the risks of gas channeling, were defined by data and combined to provide operators with a quantitative index of gas channeling risks.
These methodologies allow the operators to implement countermeasures for preventing major violations in the run of blast furnaces, so as to reduce the frequency with which such episodes of slipping and the channeling occur, however, without being able to prevent them completely.
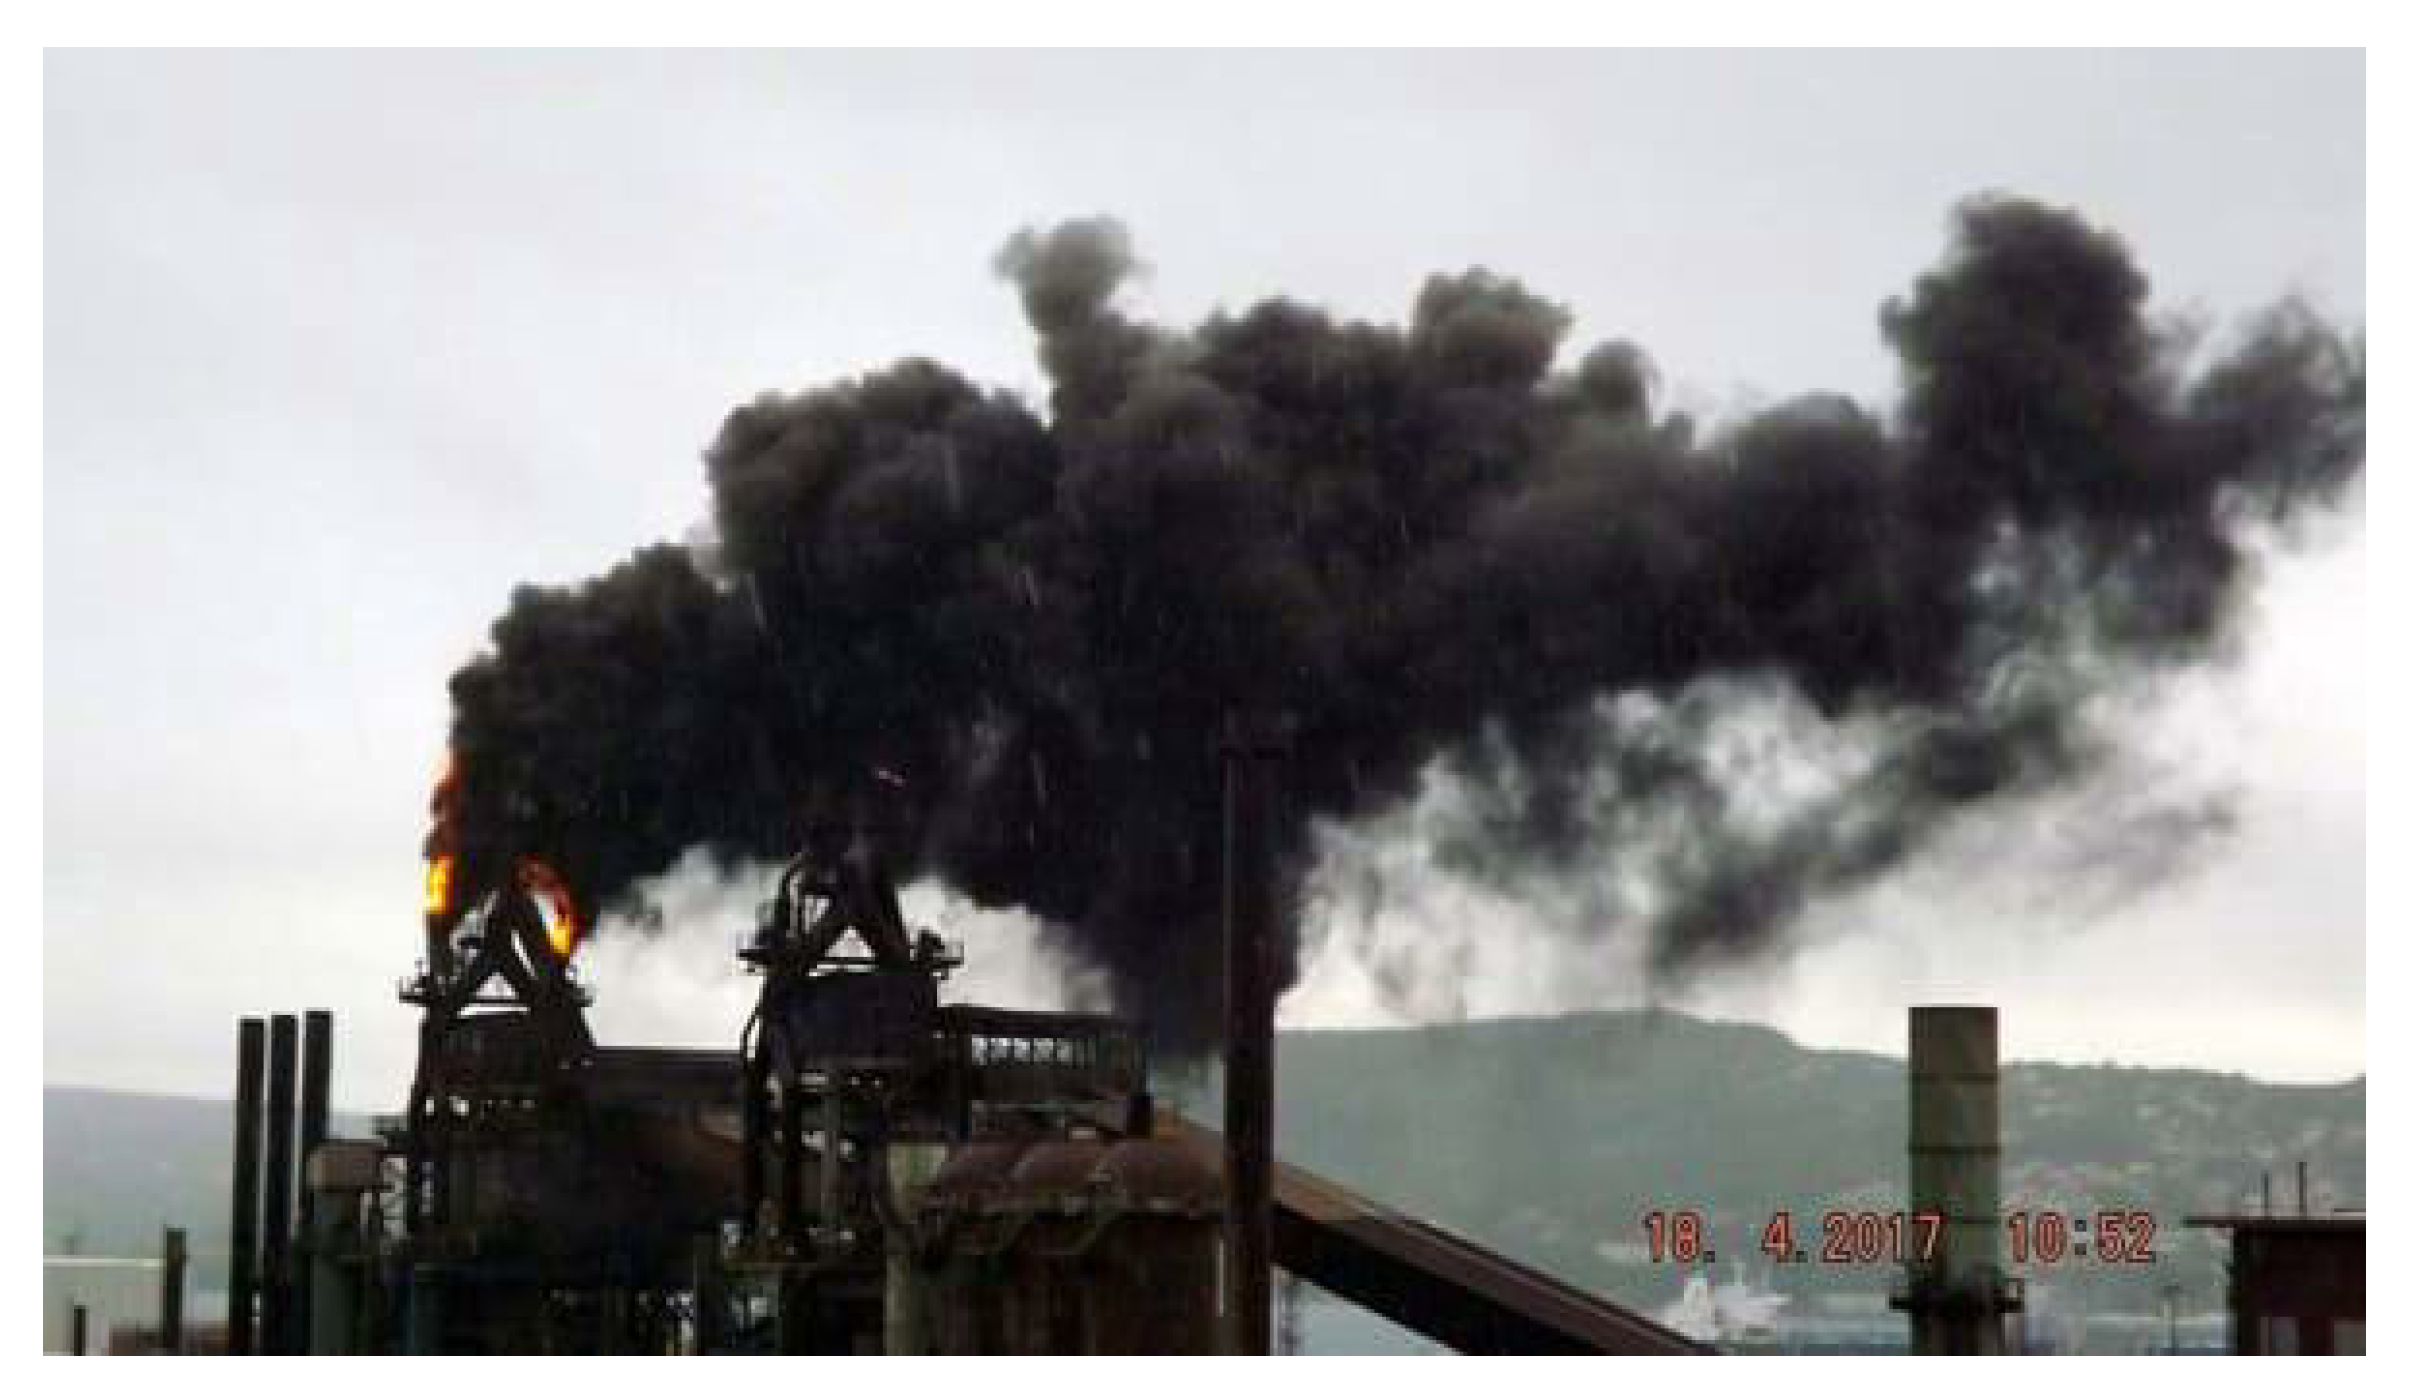
During the furnace slipping, the charged materials fall uncontrollably toward the hearth of the furnace and force the hot gases upward with a sudden overpressure in correspondence of the BF throat (stock line), with the consequent intervention of the emergency valves (bleeders) which have the purpose of venting this overpressure in order to safeguard the integrity of the system. The opening of these valves leads to the release of BF gas to the atmosphere with associated pollutant emission of CO gas and dust. Due to the high temperature of the top gas, flames often generate once in contact with the atmosphere. The result is a very conspicuous emissive phenomenon (
Figure 1), although of short duration (generally less than one minute).
In the study on [
11], it is stated the effects of these emissions on the environment are globally negligible, and this source emits less total particulate than other in-plant air pollution sources. Nevertheless, these emissions pollute the air in the proximity of the plant, hence the need to minimize them.
A possible practice for reducing air pollution involves arrangements for venting gas pressures due to slips and channeling by opening a bleeder communicating directly with the clean side of the gas washer except for BF top overpressures of greater intensity, which require pressure relief directly through the bleeders on the top of the blast furnace [
12].
Inspired by the aforementioned solution, this article reports on the adoption in an existing plant of a controlled release system of the BF mouth overpressure, which makes it possible to minimize the intervention of the emergency valves and the associated uncontrolled release of BF gas into the atmosphere.
The new system has been studied in order to satisfy the following needs:
A sudden reduction in the overpressure inside the furnace before reaching the set value for the top furnace emergency bleeder valves opening;
A limitation of the dirty gas release to the atmosphere;
Treatment of the BF gas before releasing it to the atmosphere, with relevant reduction of dust content and temperature;
Automatic intervention;
Minimization of the plant modifications.
CFD analysis allowed for a comparison of different solutions. Among those ones, the optimal solution has been chosen and implemented, profitable in terms of cost savings and able to reduce the amount of gas relieved into the atmosphere at lower temperature and lower dust content.
The authors want to specify that this system allows reducing only the environmental impact of the events related to the opening of the bleeders. Certainly, it does not reduce the environmental impact of the BF. It is well-known that the BF is the most energy intensive step in the BF/BOF steel-making process, generating large quantities of CO
2. In order to reduce energy use and carbon emissions, alternative iron-making processes must be considered [
13,
14,
15].
2. Description of the Pre-Intervention Plant
The ironmaking plant under examination is Servola Ironmaking Plant [
16,
17] in Trieste, which covers an area of 600,000 m
2, shown in
Figure 2, and it is located close to the sea, from which it receives its main raw materials to be processed (pit coal, iron ore, pellets), delivered by 60,000 ton vessels. Traditionally based on an integrated cycle, the plant closed its steel shop in 2002. Therefore, at the time of the project, it simply manufactures pig iron (both slabs and molten pig iron) and metallurgical coke. In 2015, after the acquisition by the Arvedi Group, a cold rolling mill was installed in the district with a capacity of 500,000 ton/y. Today only the cold rolling mill is in operation and the construction of a new galvanizing line and a new painting line are in progress.
On the industrial site, two twin BFs were installed, but only one (AFO3) was in operation. After that, the blast furnace has been stopped because of the reindustrialization of the harbor area. The characteristics of AFO3 are listed in
Table 1.
The BF AFO3 faced several issues due to the opening of the emergency bleeder valves against overpressure events. Only in 2016, 227 cases of 1 valve opening (for a total time of about 12 min) and 73 cases of 2 valves (for 4 min) were registered. Overall, there were just over 16 min of bleeders’ opening.
2.1. BF Gas Treatment System
Four uptakes allow the hot, dirty gas high in CO content to exit the furnace throat, while bleeder valves protect the top of the furnace from sudden gas pressure surges. The BF gas is treated for reuse in four stages: sedimentation by means of a dust catcher, centrifugal dust extraction by means of a cyclone, cooling and washing by means of scrubbers, and final filtration by means of electro-filters. Once cleaned, the gas goes to gasometer feeding the network (
Figure 3).
The treatment lines, separated for the two BFs, are reunited downstream of the cyclones to supply a battery of scrubbers installed in parallel and initially sized so that one remains constantly in reserve. The decommissioning of one of the two BFs resulted in the halving of the originally planned flow rate with the consequent doubling of the redundant units.
2.2. Emergency Valves
Each BF gas line is equipped with three emergency valves arranged on the main uprights (two bleeder valves with servo-assisted opening DN 500) and at the beginning of the descending section (a counterweight check valve DN 1000) in order to vent any overpressure in the BF throat without propagating to the rest of the line. These valves are calibrated to intervene in sequence according to the opening thresholds shown in
Table 2 (original arrangement).
3. Analyzed Model
The configuration of the new system for BF gas treatment has been engineered with a CFD analysis to find out the most effective solution for reducing the openings of the emergency bleeder valves on the BF top (Bleeder 1 and Bleeder 2), which release dirty gas to the atmosphere, and to minimize modifications on the plant. The concept was to partially by-pass the gas cleaning circuit in order to reduce the localized pressure losses and consequently the BF pressure. The aim was to clean the gas as much as possible and partly send it to the network and partly release it to the atmosphere through a new bleeder valve located downstream the cleaning equipment.
Obviously, this solution is adoptable only for medium gravity events that were anyhow very frequent in the original plant. Around 80% of the top bleeder valves’ openings were caused by medium gravity events. In case of very serious events, the bleeder valves on the BF top have to open. In order to open the bleeder valves on the BF top only in case of a very serious event, their opening threshold, related to the BF throat pressure, are modified, as shown in
Table 2 (new arrangement).
The original scheme of the BF gas-cleaning system is composed by:
Bleeder valves at the BF top (B1 and B2 from now);
One dust catcher;
Two cyclones in parallel;
A DN2800 pipe 60 m long feeding three lines in parallel, each one composed by a wet scrubber and an electro filter (one of these lines is in stand-by);
A gasometer which feeds the network.
The new arrangement considers an additional bleeder valve at the reserve scrubber outlet (B3 from now, on named clean relief valve) and some by-pass circuits, which can be opened or closed by suitable tapping valves, to provide different operating scenarios (
Figure 4). In particular, a new 60 m long pipeline DN800 has been added in order to reduce also the distributed pressure losses of the circuit, if necessary.
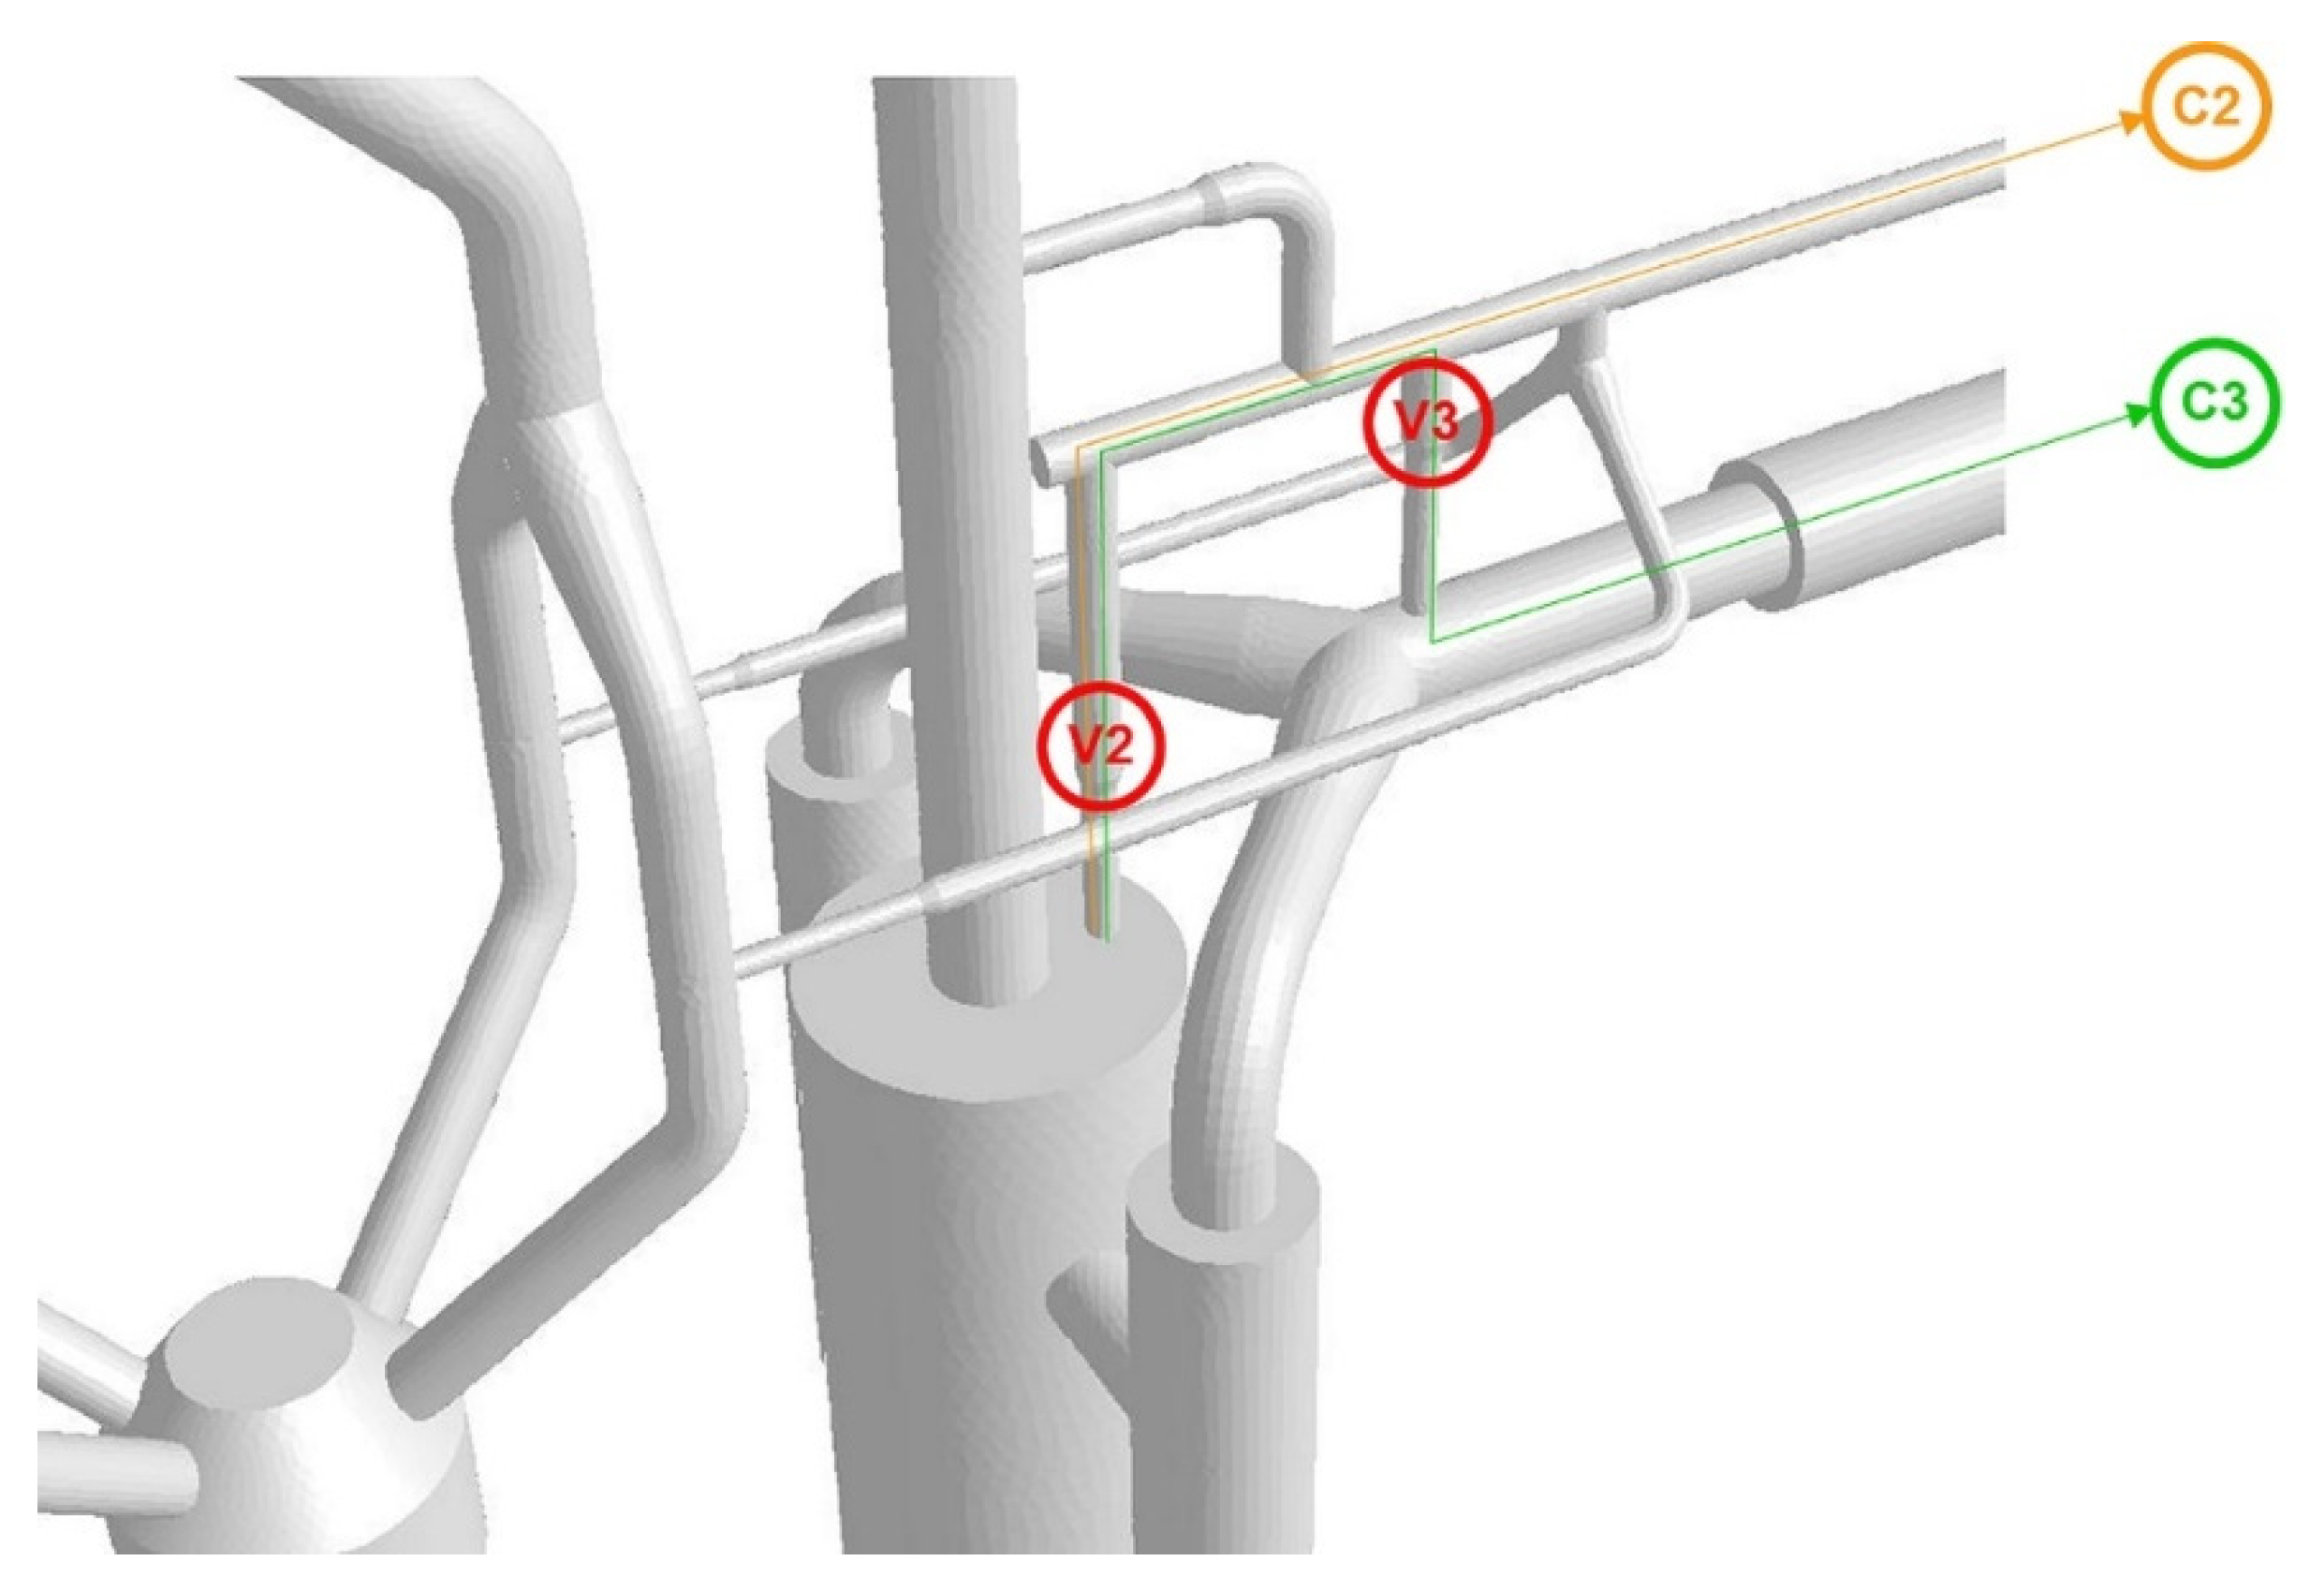
Figure 5 shows a detail of the analyzed model, highlighting the tapping point valves to by-pass one or more sections of the cleaning equipment.
The CFD transient analysis of the described system has been evaluated with the software Ansys Fluent, using the RNG k-epsilon turbulence model. The fluid used is an ideal gas with the properties of AFO gas (specific heat, conductivity, and viscosity functions of temperature and molecular weight). The composition of the ideal gas, given in species mole fractions, is as follows: N2 0.477, CO 0.225, CO2 0.187, H2 0.047, H2O 0.064.
The analyzed model considers:
The nominal diameters and the lengths of the pipes to correctly simulate the distributed pressure losses;
The equipment volumes (not the shape) to simulate the correct expansion volume for the pressure wave;
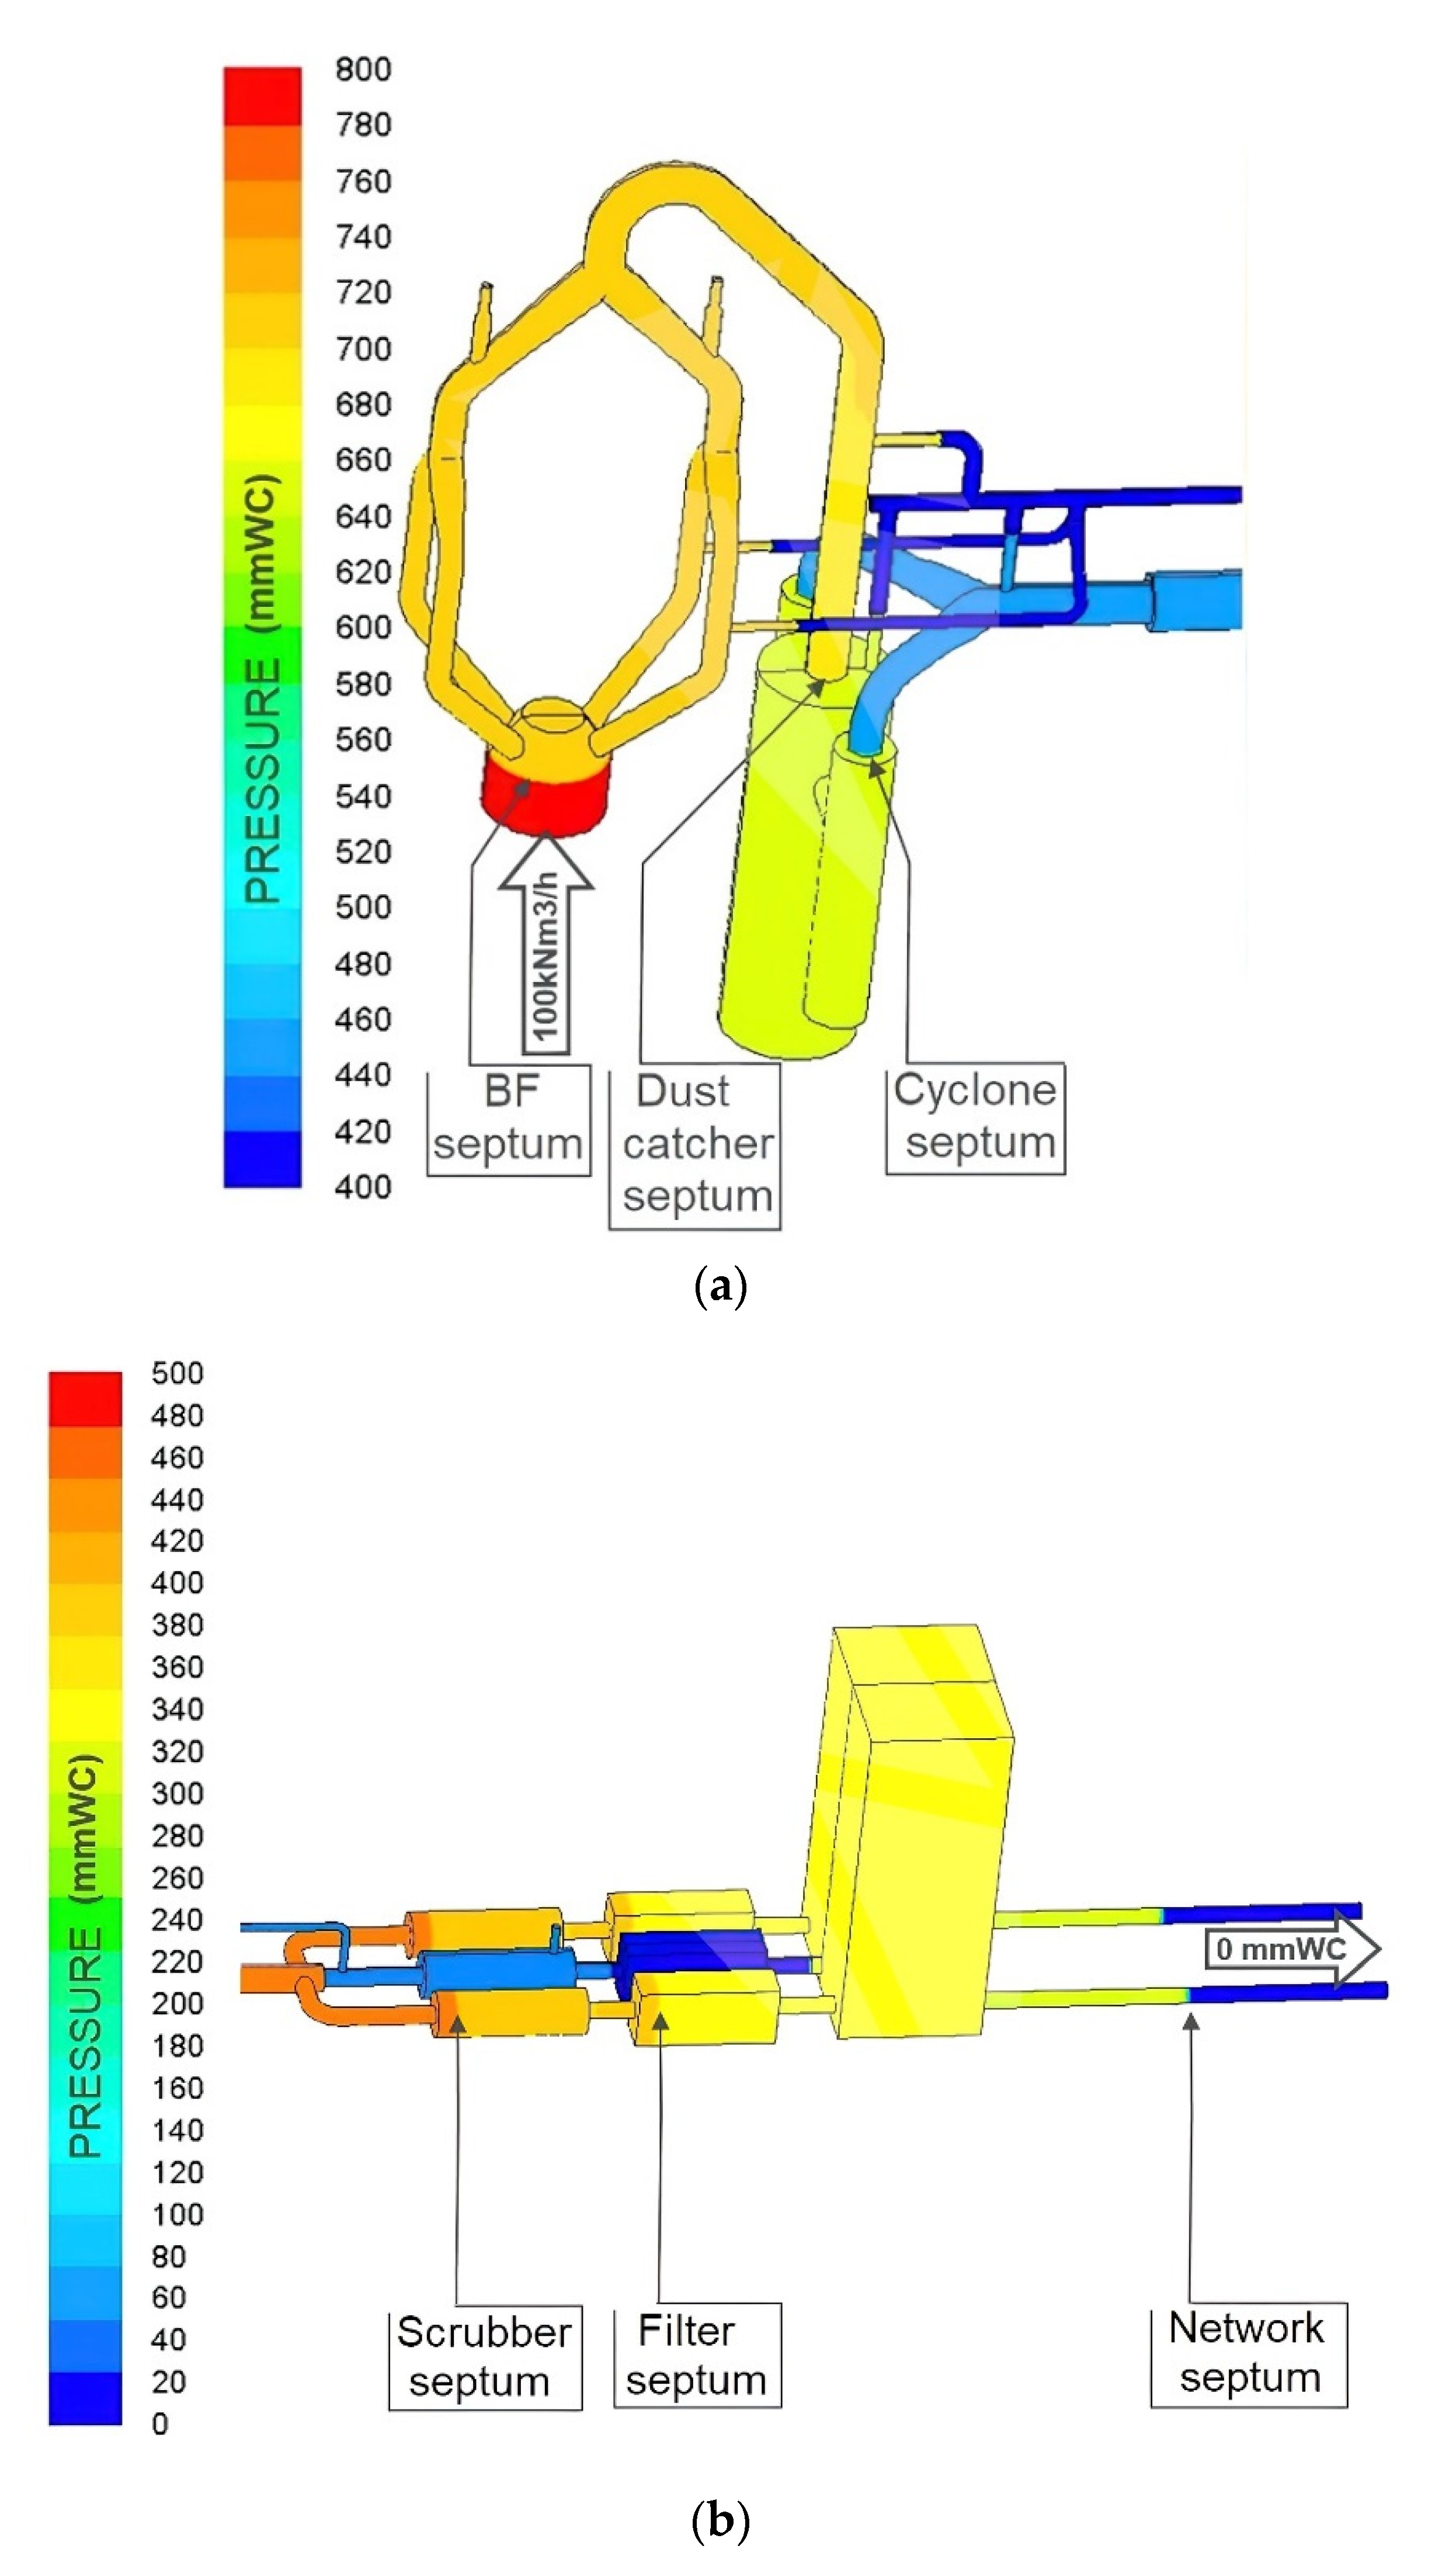
Gas behavior in the equipment is simulated with a simplified model, in particular pressure losses of the equipment are simulated with suitable surfaces (
Figure 6), acting as porous-jump, calibrated on the basis of pressure field values in normal operating conditions;
As long as the operating conditions are normal, all the bleeder and tapping point valves are closed. In case of BF overpressure, only the valves related to the selected circuit open;
Valves of selected circuit start opening when the BF pressure remains over the threshold for 2 s and takes 3 s to open completely (similarly the valves closure);
The valves are surfaces simulated as:
- o
walls when closed;
- o
suitable time-dependent porous-jump during their opening/closure;
- o
interiors when completely opened;
The correlation between pressure losses of valves and their opening degree has been calculated apart with suitable simulations and adopted in the model to define the time-dependent porous-jump;
- o
adiabatic walls;
- o
outlet pressure to the network p = 0 mmWC gauge;
- o
inlet mass-flow: operating conditions are 100 kNm3/h and 100 °C as normal field values. To simulate overpressure events inlet temperature is suddenly increased;
The model uses the symmetry of the system in order to reduce the number of computational cells.
With these assumptions, monitoring the pressure wave along the circuit is possible. For this purpose, some surfaces, acting as pressure measure, are located in the most significant points, as shown in
Figure 4.
The events that generate the overpressure, such as slip and channeling phenomena, are simulated with instantaneous variation of the mouth temperature: This means a different actual volume of gas with a consequent higher pressure on top.
At the initial instant, the gas temperature goes from 100 °C (normal operation) to a higher value and the pressure increases, starting from the normal value of 700 mmWC, with 100 kNm3/h of BF gas flow rate. Three different scenarios for top gas temperature are analyzed:
174 °C (low severity grade);
240 °C (medium severity grade);
342 °C (high severity grade).
Out of simplicity, the simulated events are persistent, i.e., they are not exhausted in time as in reality. This means that the valves continue to open and close.
It is observed that cyclones, due to their high losses of pressure, prevent the reduction of the BF overpressure. In order to clean the gas as much as possible, a circuit that partially bypasses only the cyclones is an effective solution.
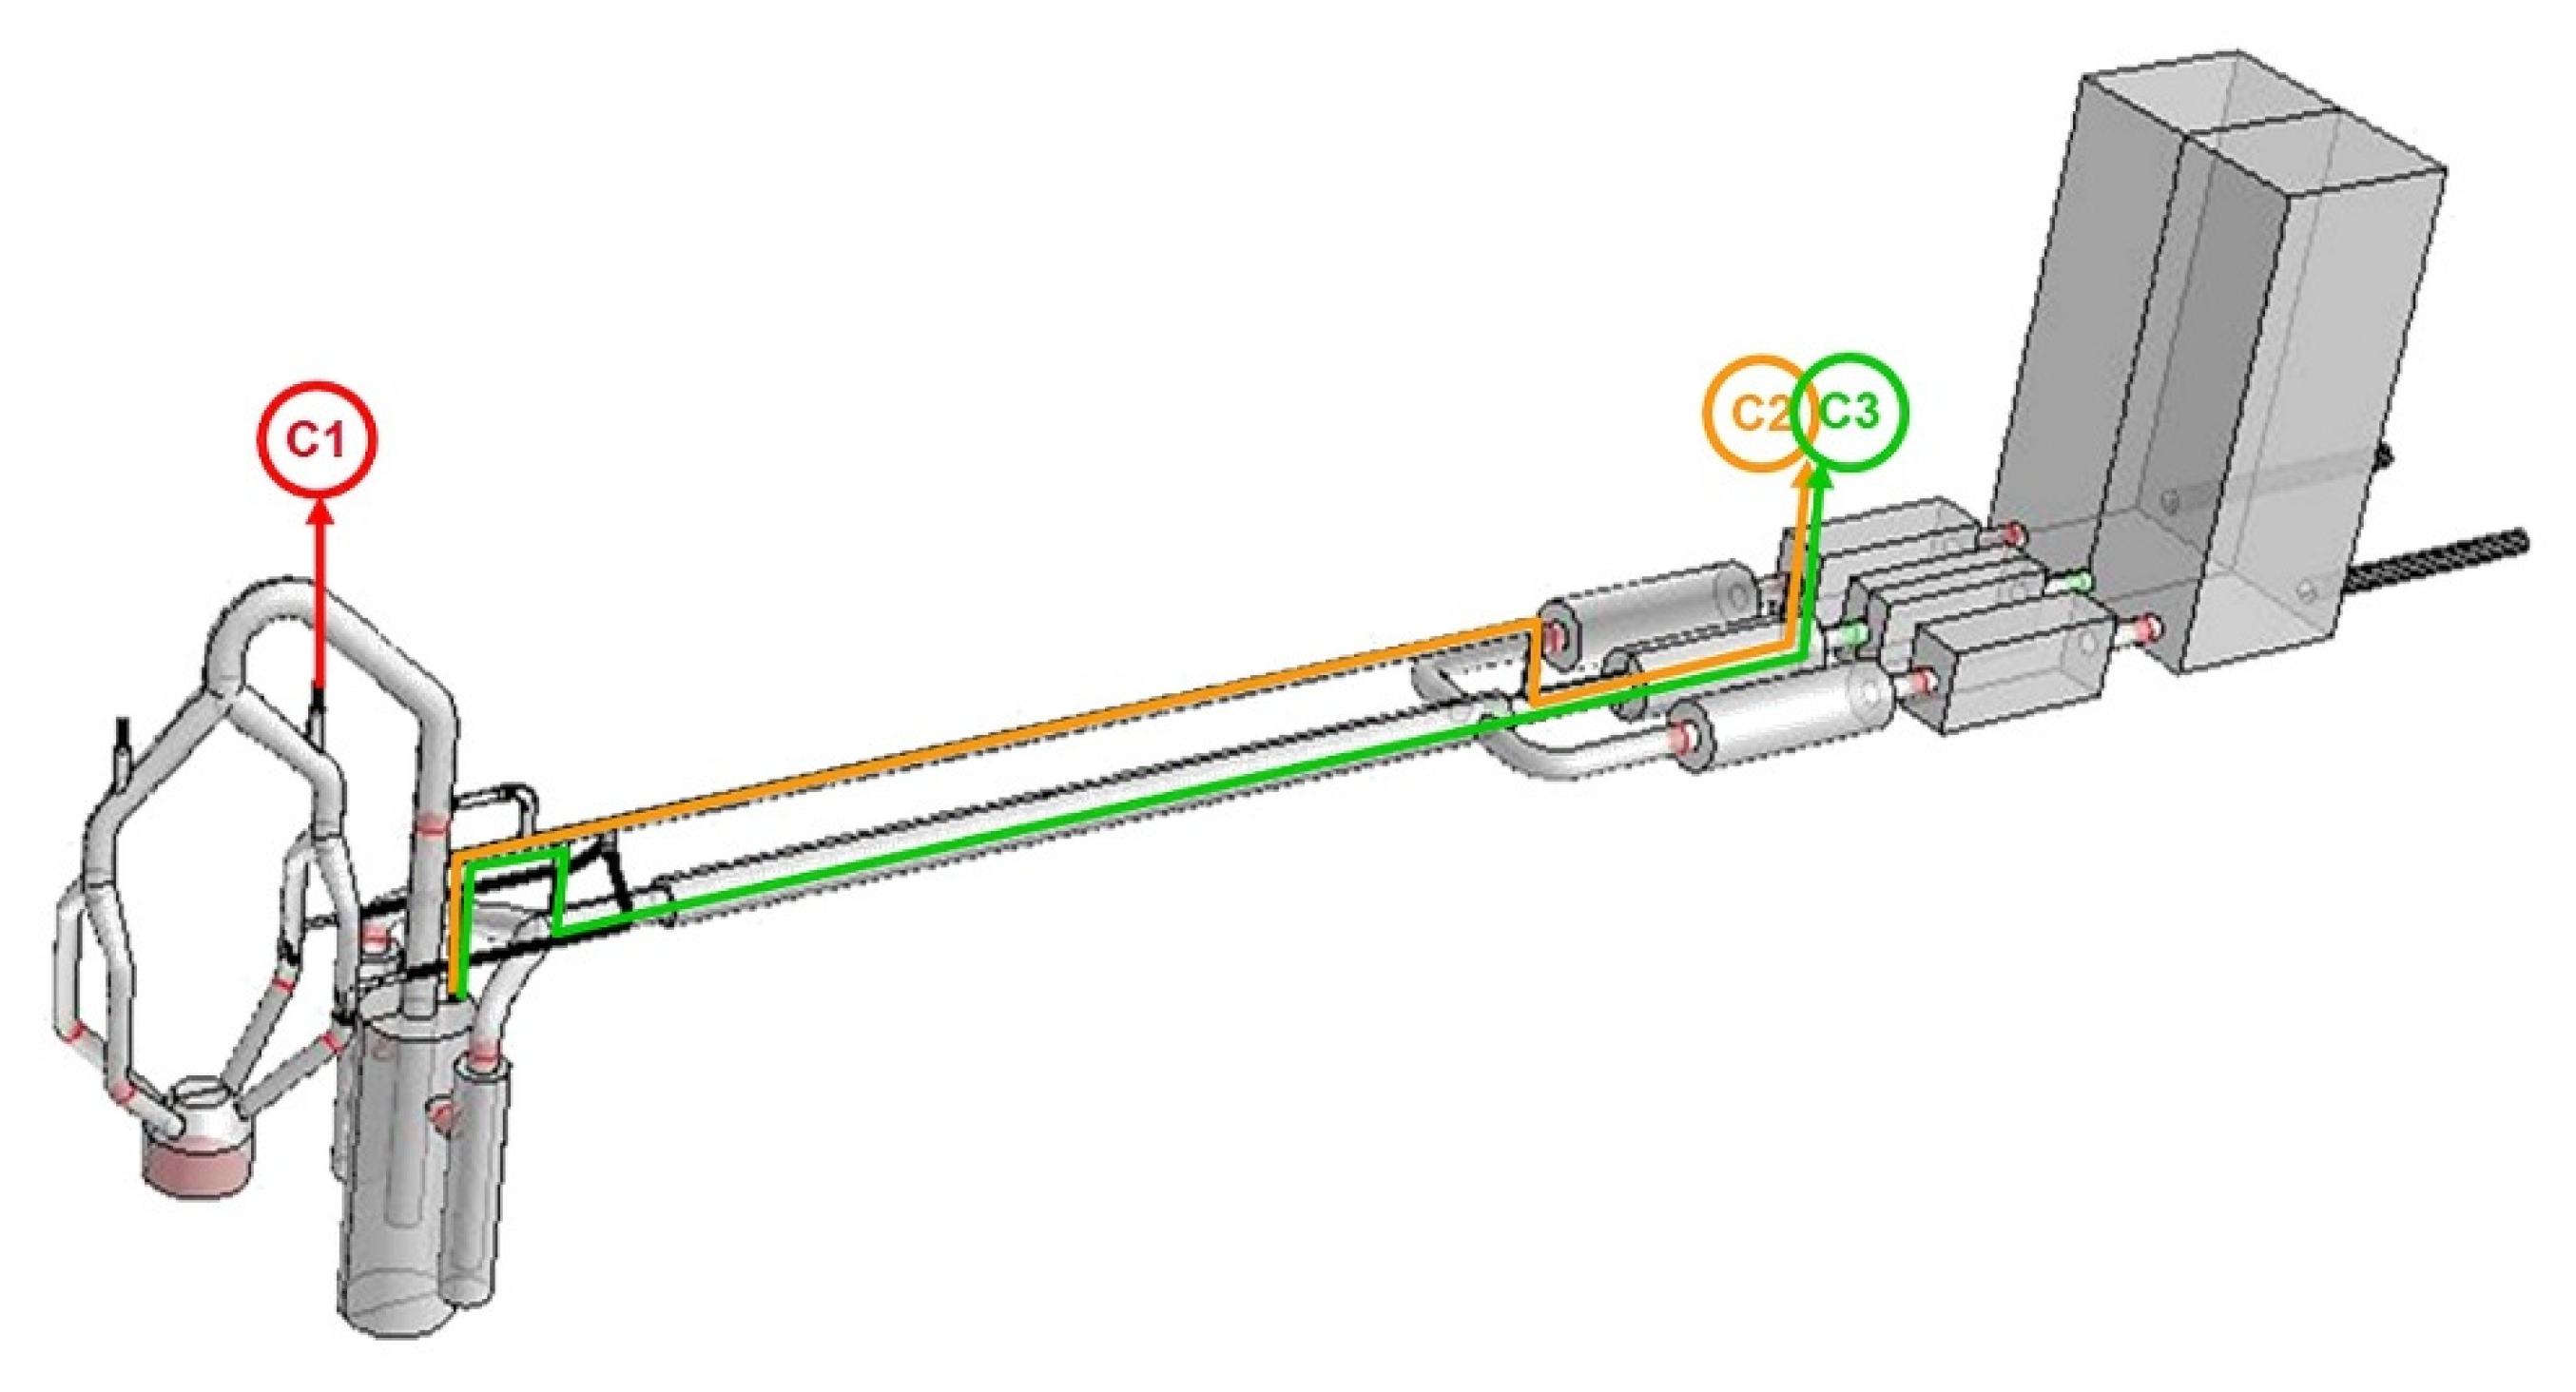
Among all scenarios analyzed, the three more relevant circuits are reported (
Figure 7 and
Figure 8):
The first circuit (C1) simulates the original conditions (all the tapping point valves are closed): bleeder valve B1 set to open at BF top pressure equal to 950 mmWC; in case the pressure continues to rise, at 1050 mmWC, bleeder valve B2 opens, too (any B2 opening is not simulated but only foreseen);
The second circuit (C2) partially bypasses the cyclones and transfers the gas to the reserve scrubber through a new DN800 emergency pipeline. In this case, the spare scrubber is intercepted, flushed with nitrogen and maintained at 50 mmWC under normal conditions. The opening of tapping point valves (V2 and V4) and clean relief valve (B3) is simultaneous and set at the BF top pressure equal to 850 mmWC. If the pressure continues to rise, bleeder valve 1 and bleeder valve 2 open at a BF top pressure equal to 1050 mmWC (any B1 and B2 opening is not simulated but only foreseen);
The third circuit (C3) partially bypasses the cyclones and transfers the gas to the reserve scrubber through the existing common DN2800 pipeline. In this case, the backup scrubber is always connected to the upstream circuit. The opening of tapping valves (V2 and V3) and clean relief valve (B3) is simultaneous and set at the BF top pressure equal to 850 mmWC. If the pressure continues to rise, bleeder valve 1 and bleeder valve 2 open at BF top pressure equal to 1050 mmWC (any B1 and B2 opening is not simulated but only foreseen).
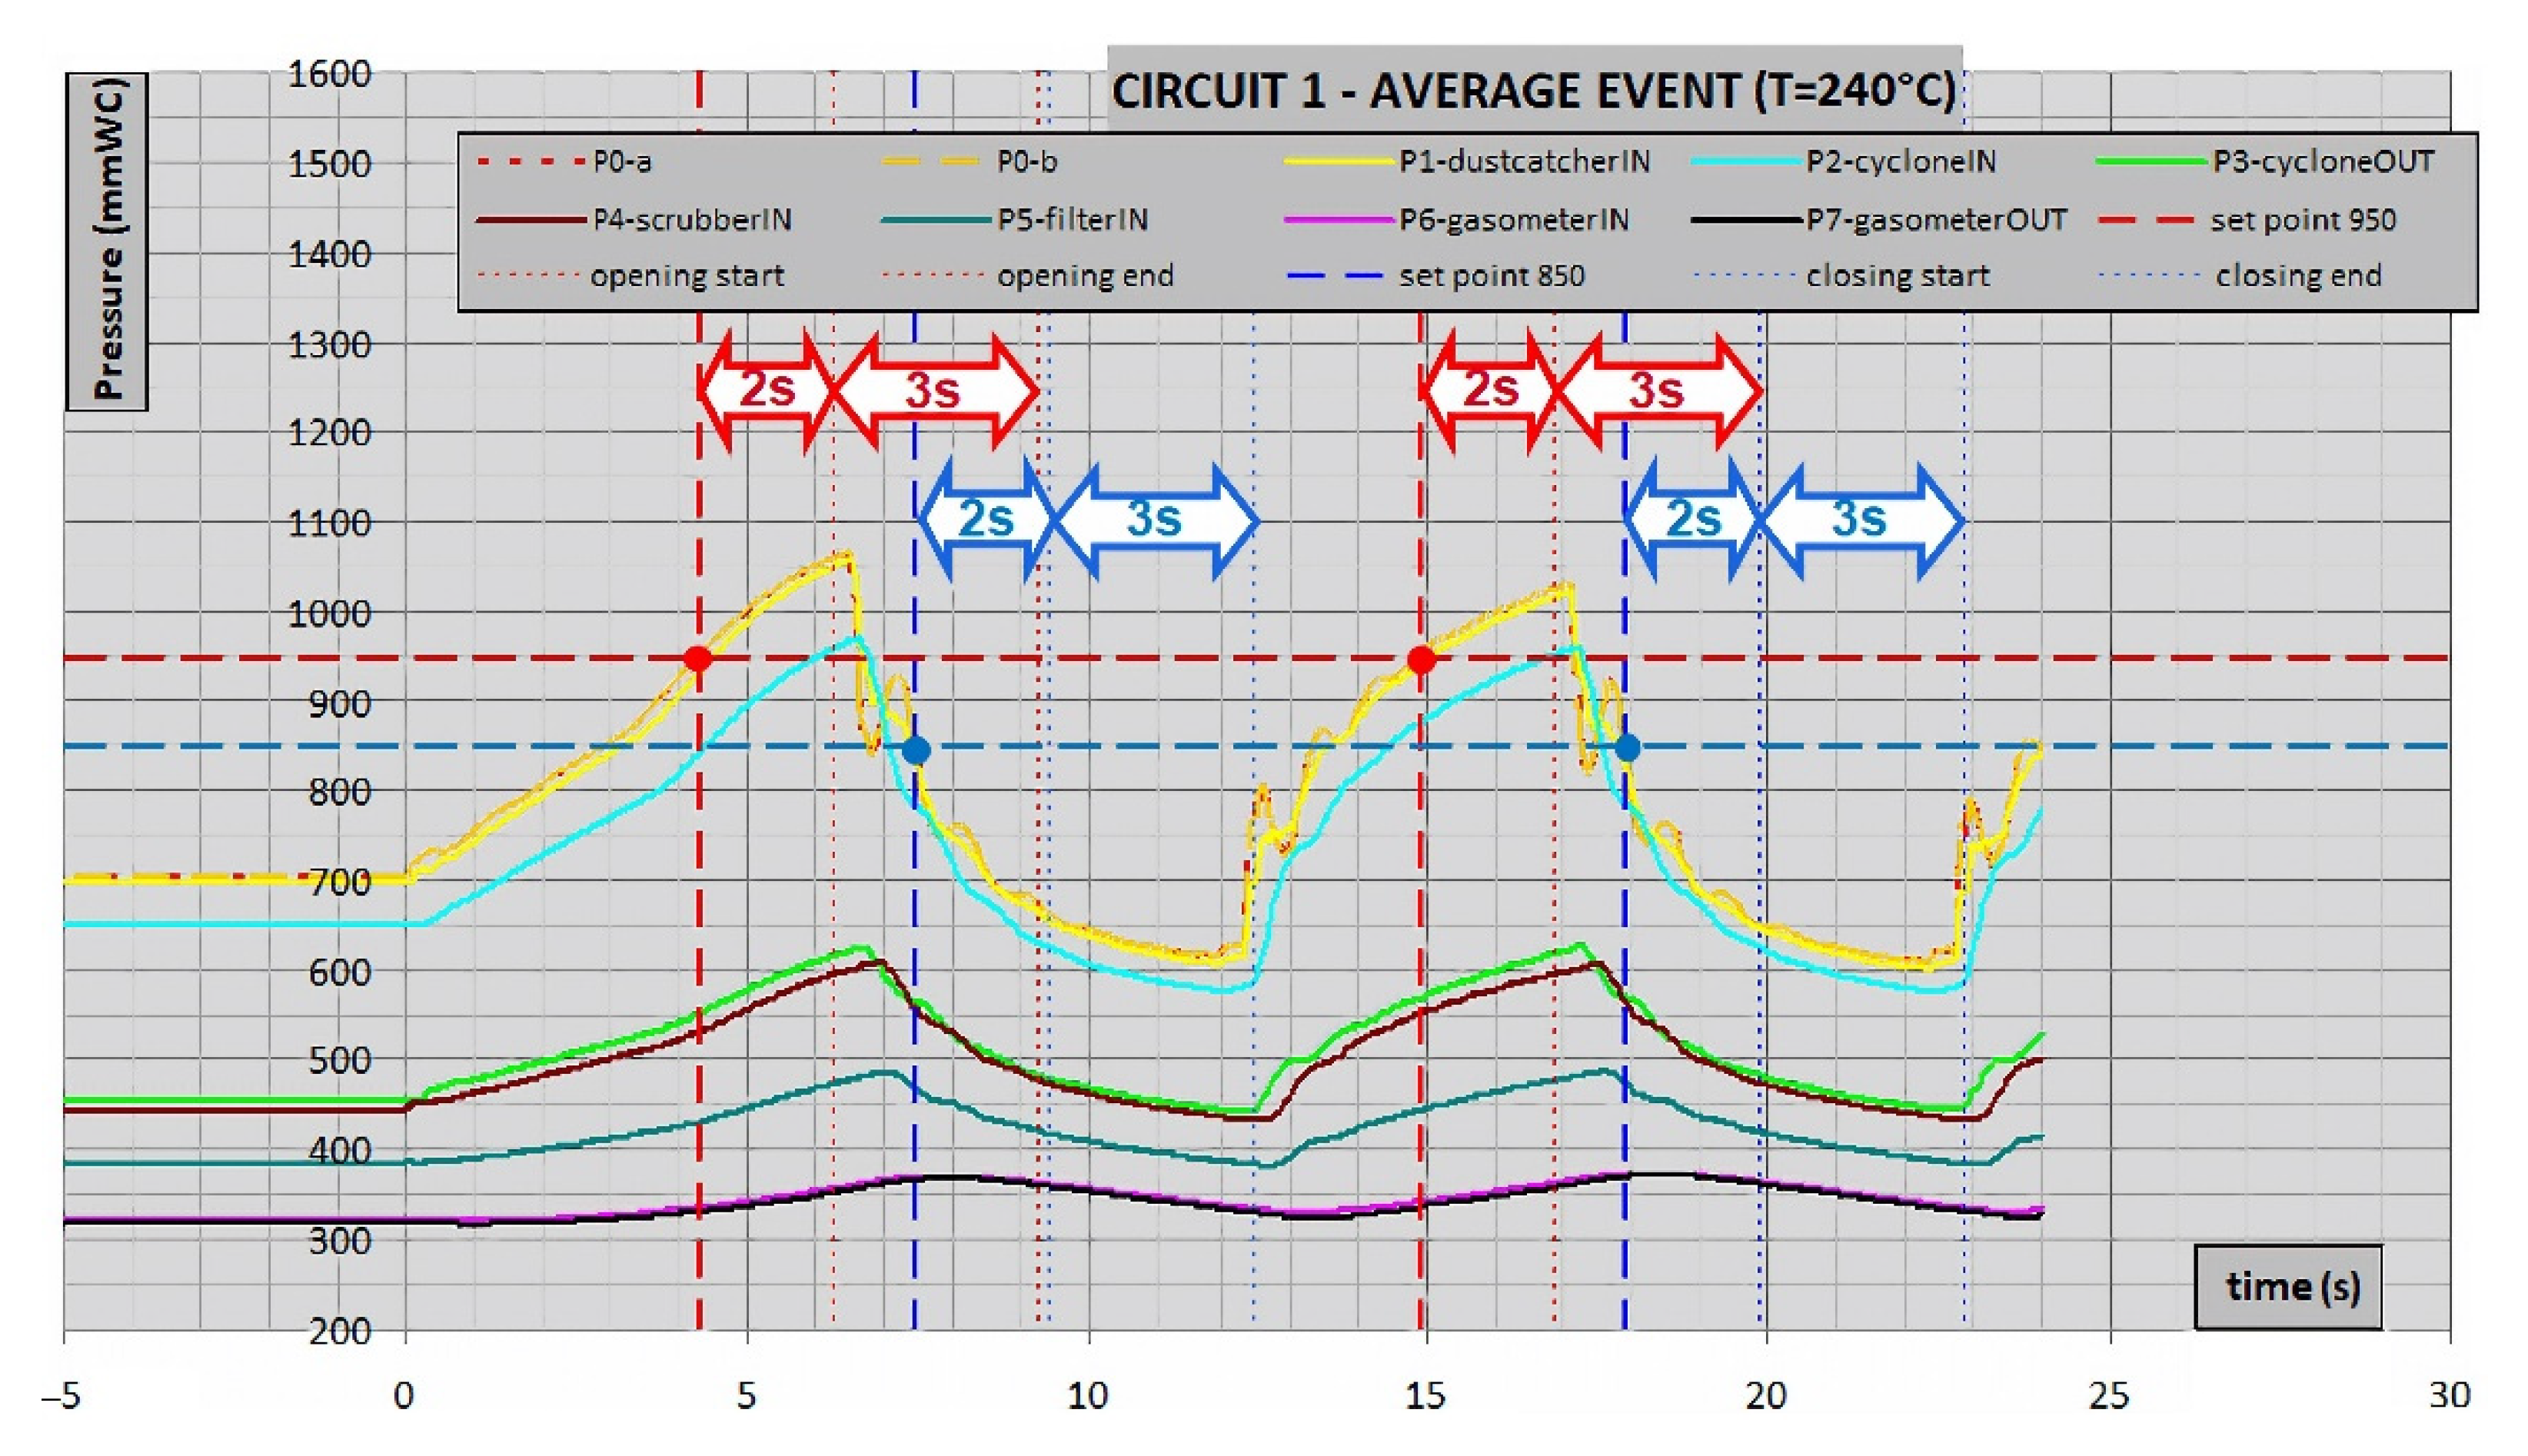
Figure 9 shows the evolution over time of pressure measures along the circuit C1 in the case of a medium severity event when the BF gas temperature goes from 100 °C to 240 °C instantaneously.
The emergency valves do not immediately open when the BF pressure reaches the threshold, and their opening takes few seconds. The simulations have considered this aspect.
Bleeder valve 1 opens when the top pressure exceeds the set point value (950 mmWC) for 2 s, and it opens completely in 3 s following its characteristic curve. It closes in a similar way (set point equal to 850 mmWC). As already explained, the simulated events are persistent, i.e., they are not exhausted in time as in reality. This means that the valves continue to open and close.
4. Results
The results of the CFD simulations are shown below. In particular, the comparison is presented between the pressures measured over time in the most relevant measurement points (
Figure 4) in circuits C1, C2, C3 and the original circuit with no bleeders for different severity grade events.
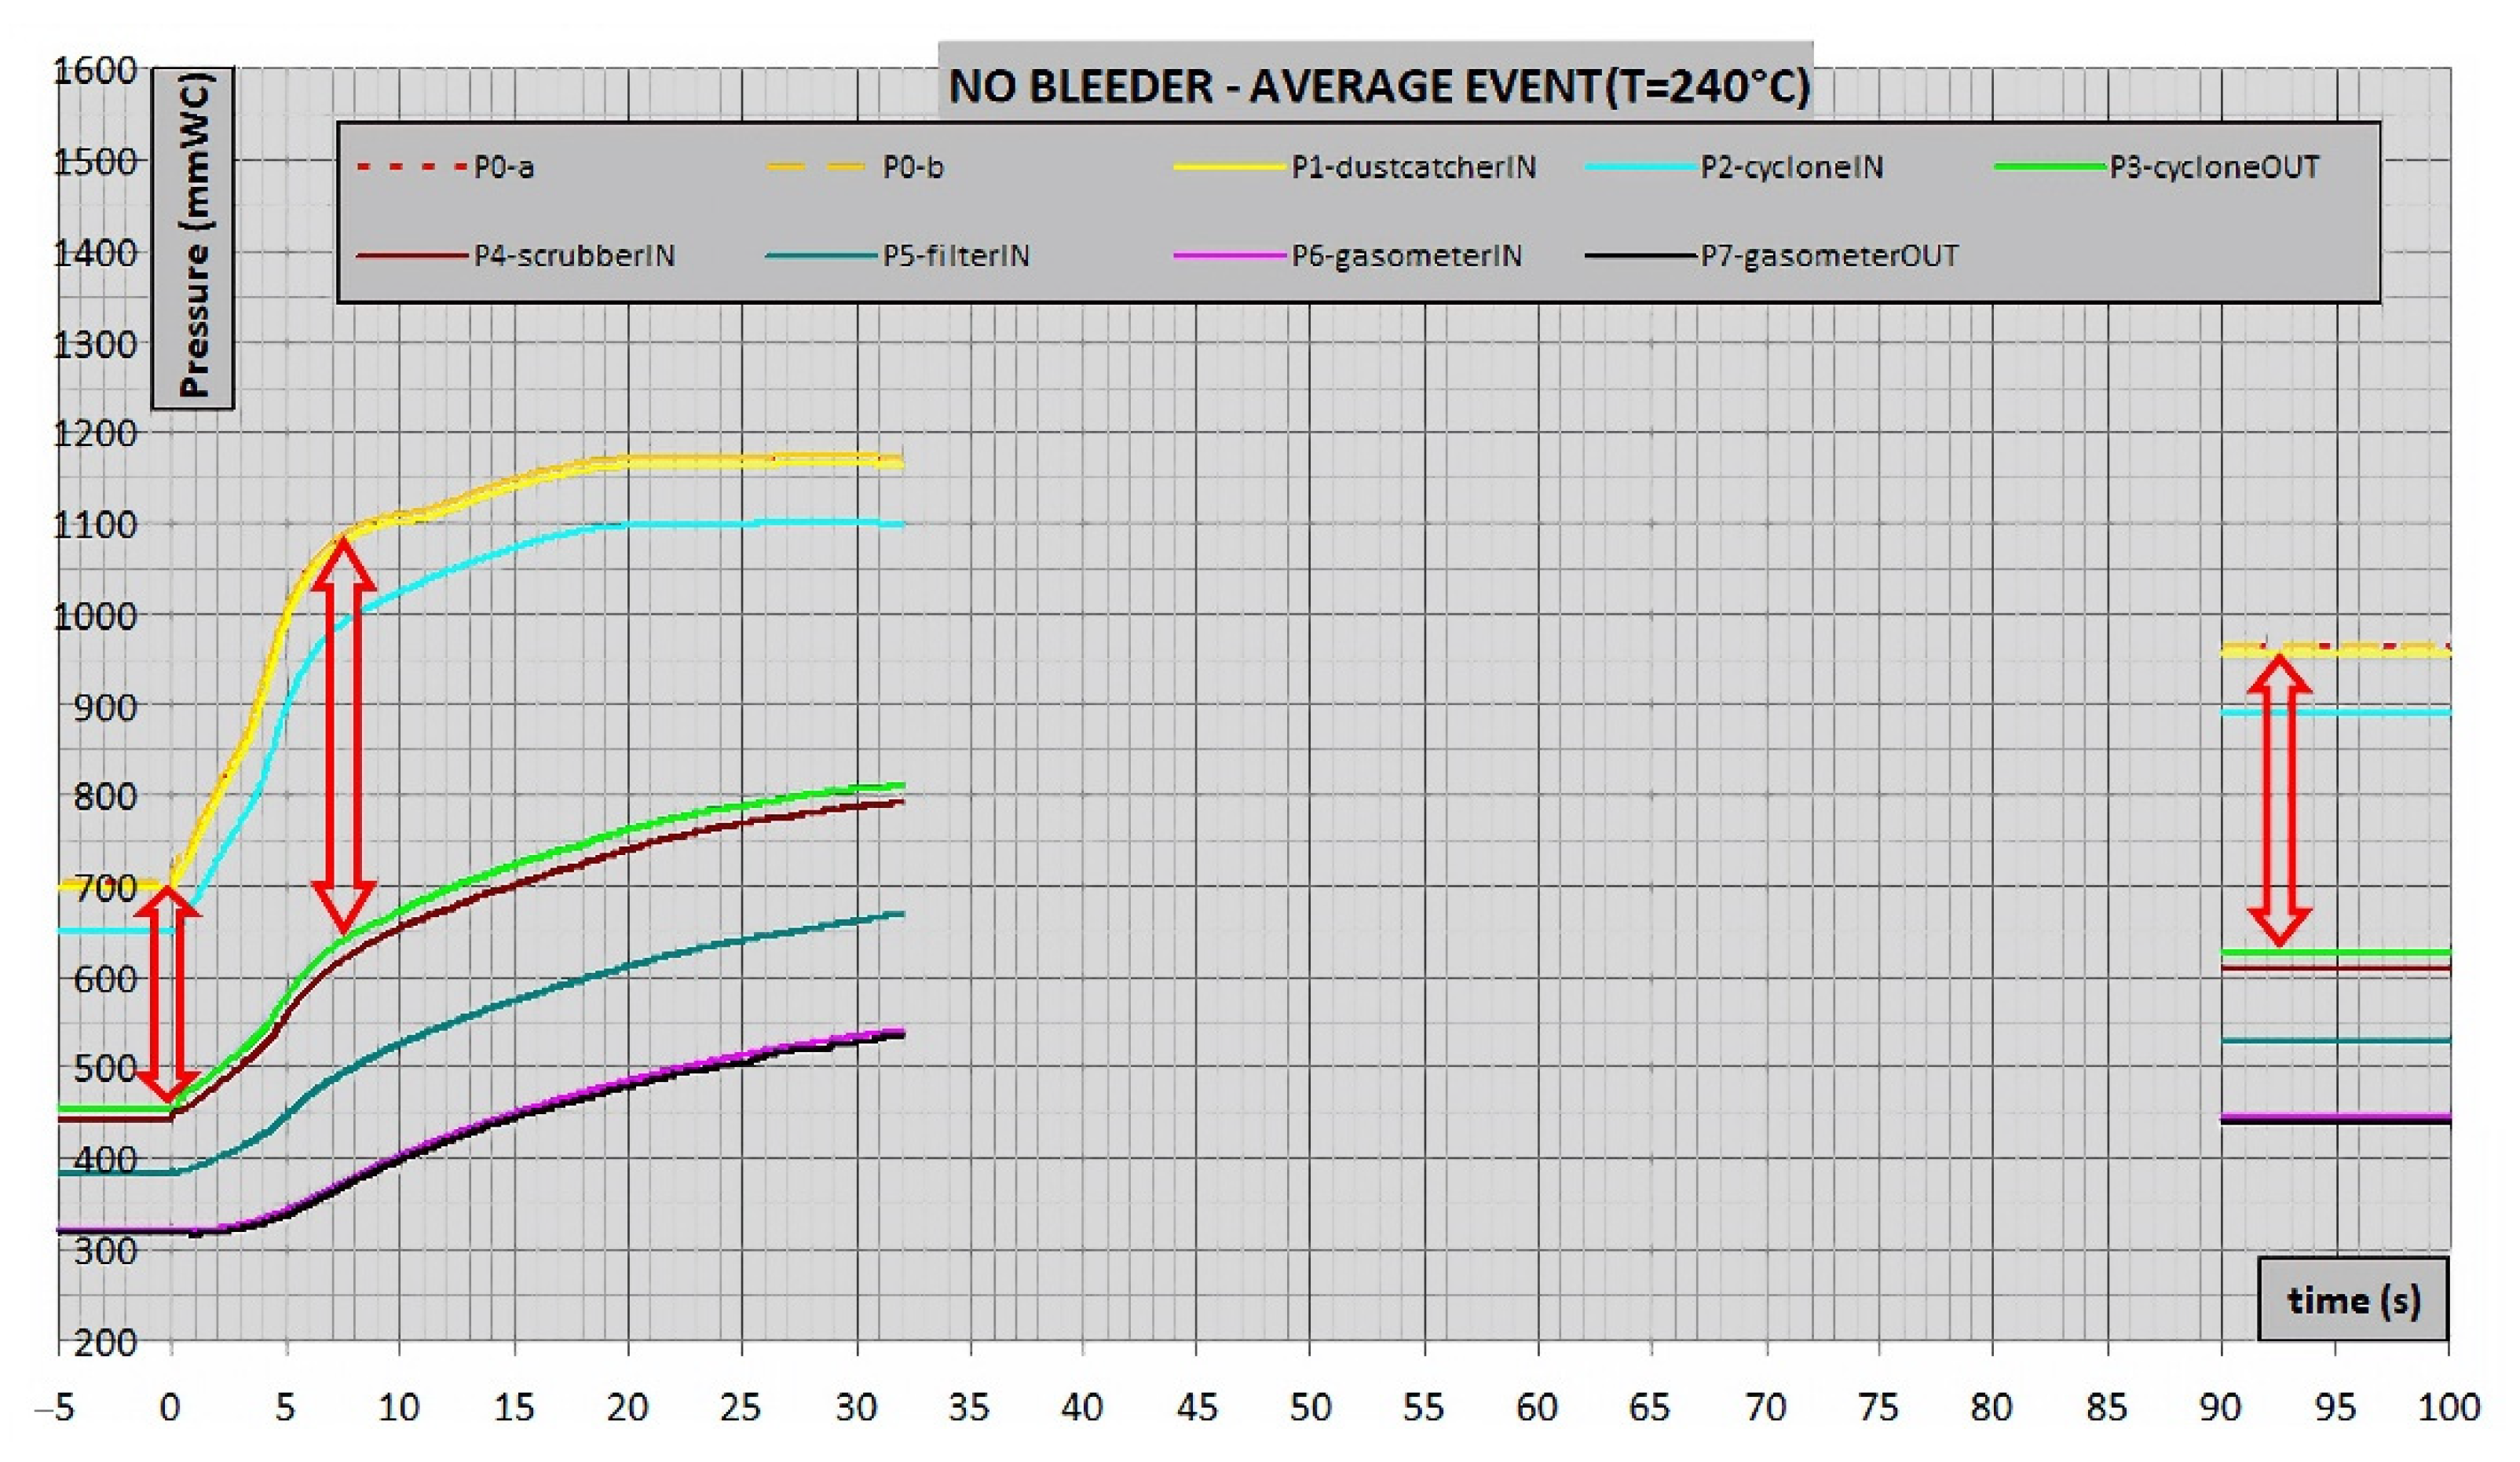
4.1. Original System with No Bleeders
Firstly, the behavior of the original system has been investigated in the hypothesis of absence of emergency bleeders to tune the model. In
Figure 10 and
Figure 11, the case of sudden temperature increase to 240 °C is reported.
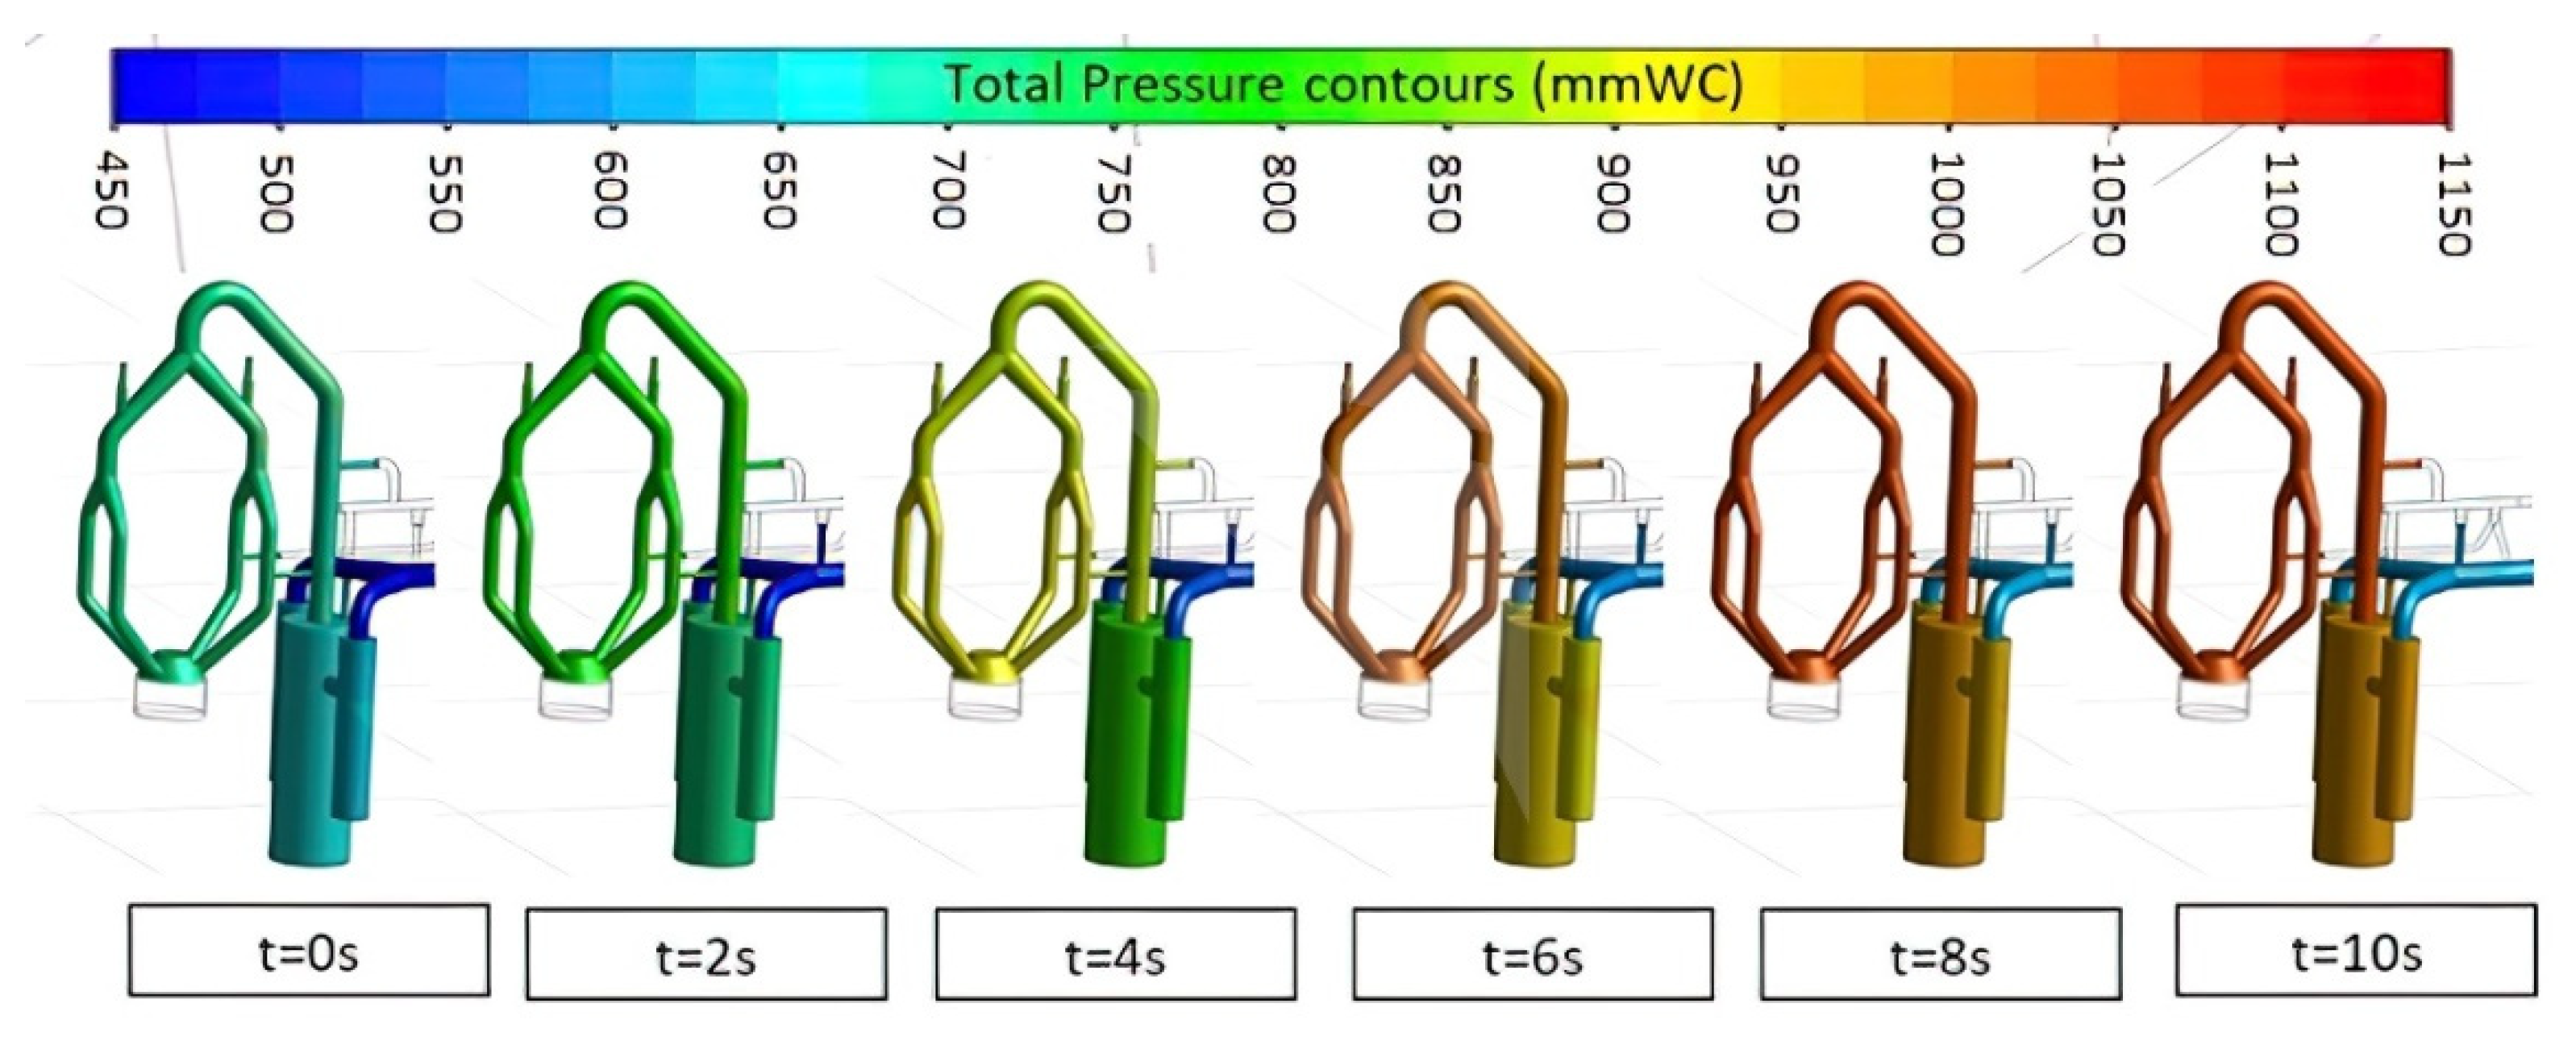
The representation of pressure variation through a 3D model is not so easy and not even useful.
Figure 10 represents pressure on the walls vs. time passed from the start of the overpressure event.
Graphically representing pressure variation on the pressure measure surfaces, as in
Figure 11, is more useful. It can be seen that the pressure at the BF mouth increases up to the maximum value of 1180 mmWC and then slowly decreases until it reaches a new equilibrium condition at 970 mmWC.
The increase in pressure is dampened by pressure drops along the circuit. In particular, it should be noted that cyclones, due to their high pressure drop, constitute a “block” with respect to the pressure increase from the BF upstream but also with respect to any pressure reduction generated by a downstream bleeder. In practice, cyclones constitute a “stop” to the transfer of the disturbance. This means that by washing all the gas in the cyclones before discharging it into the atmosphere, it is impossible to reduce the BF pressure satisfactorily without lowering the pressure in the network too much.
Therefore, it can be concluded that the partial bypassing of the cyclones is the only possible solution.
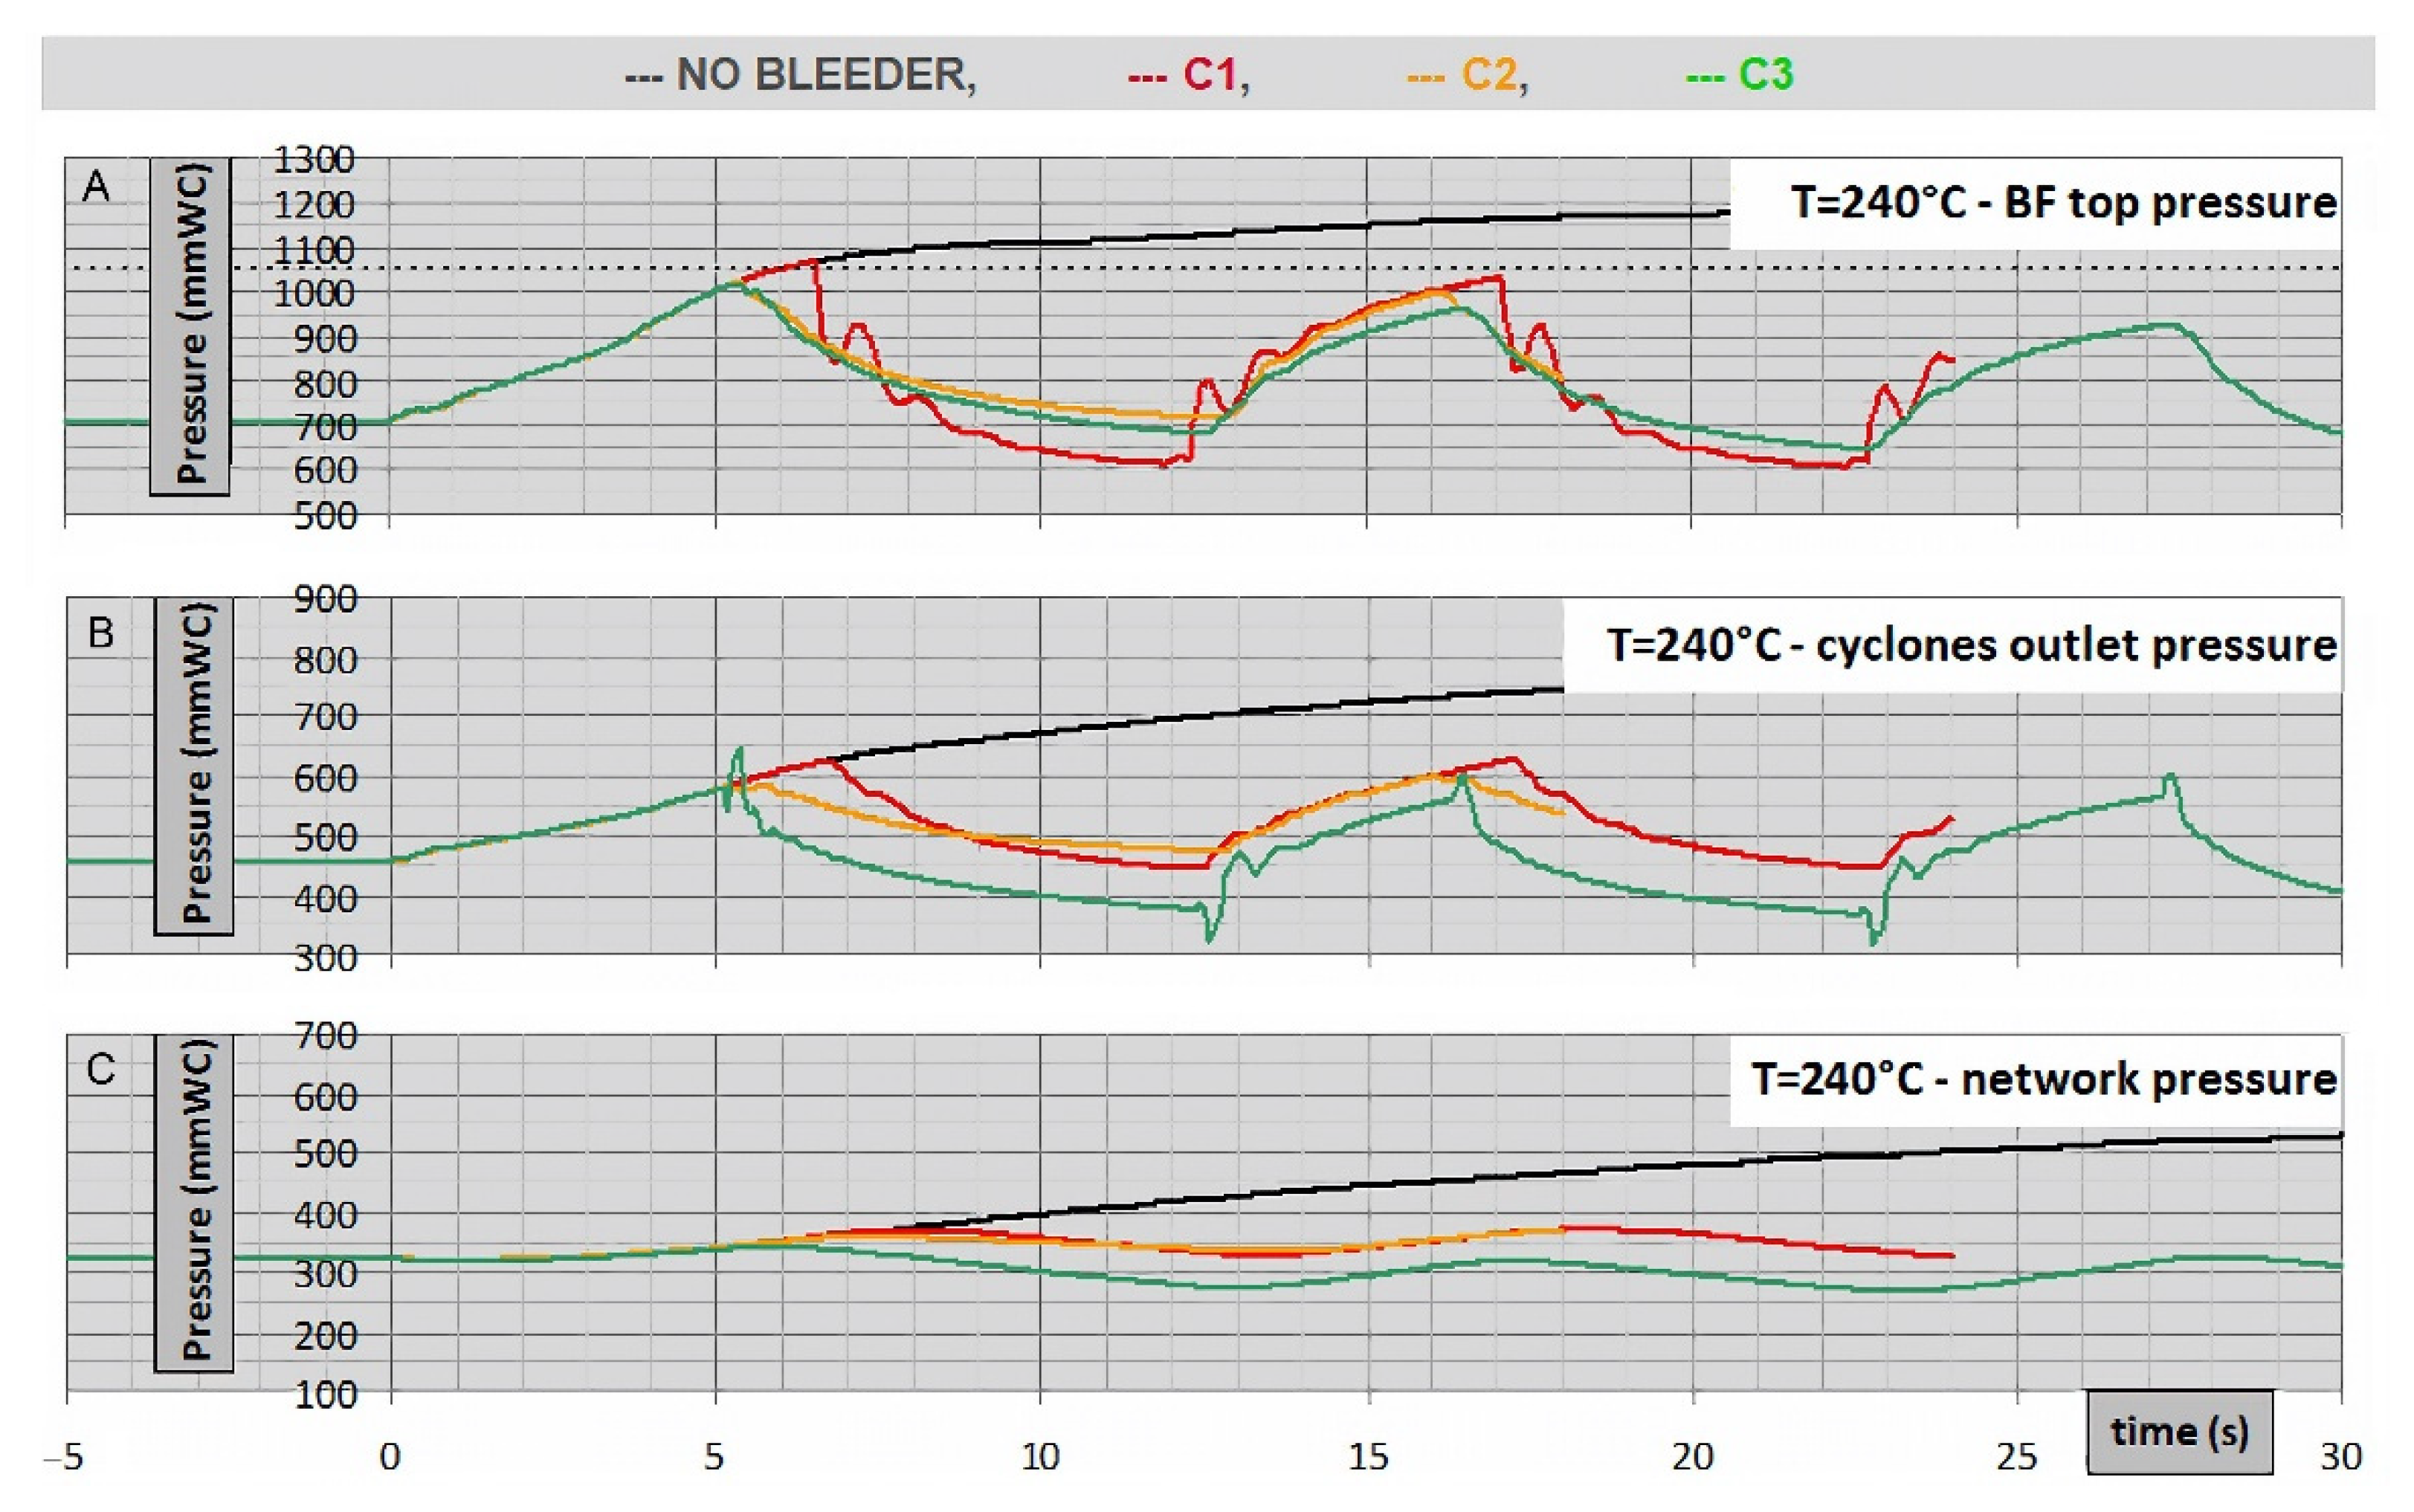
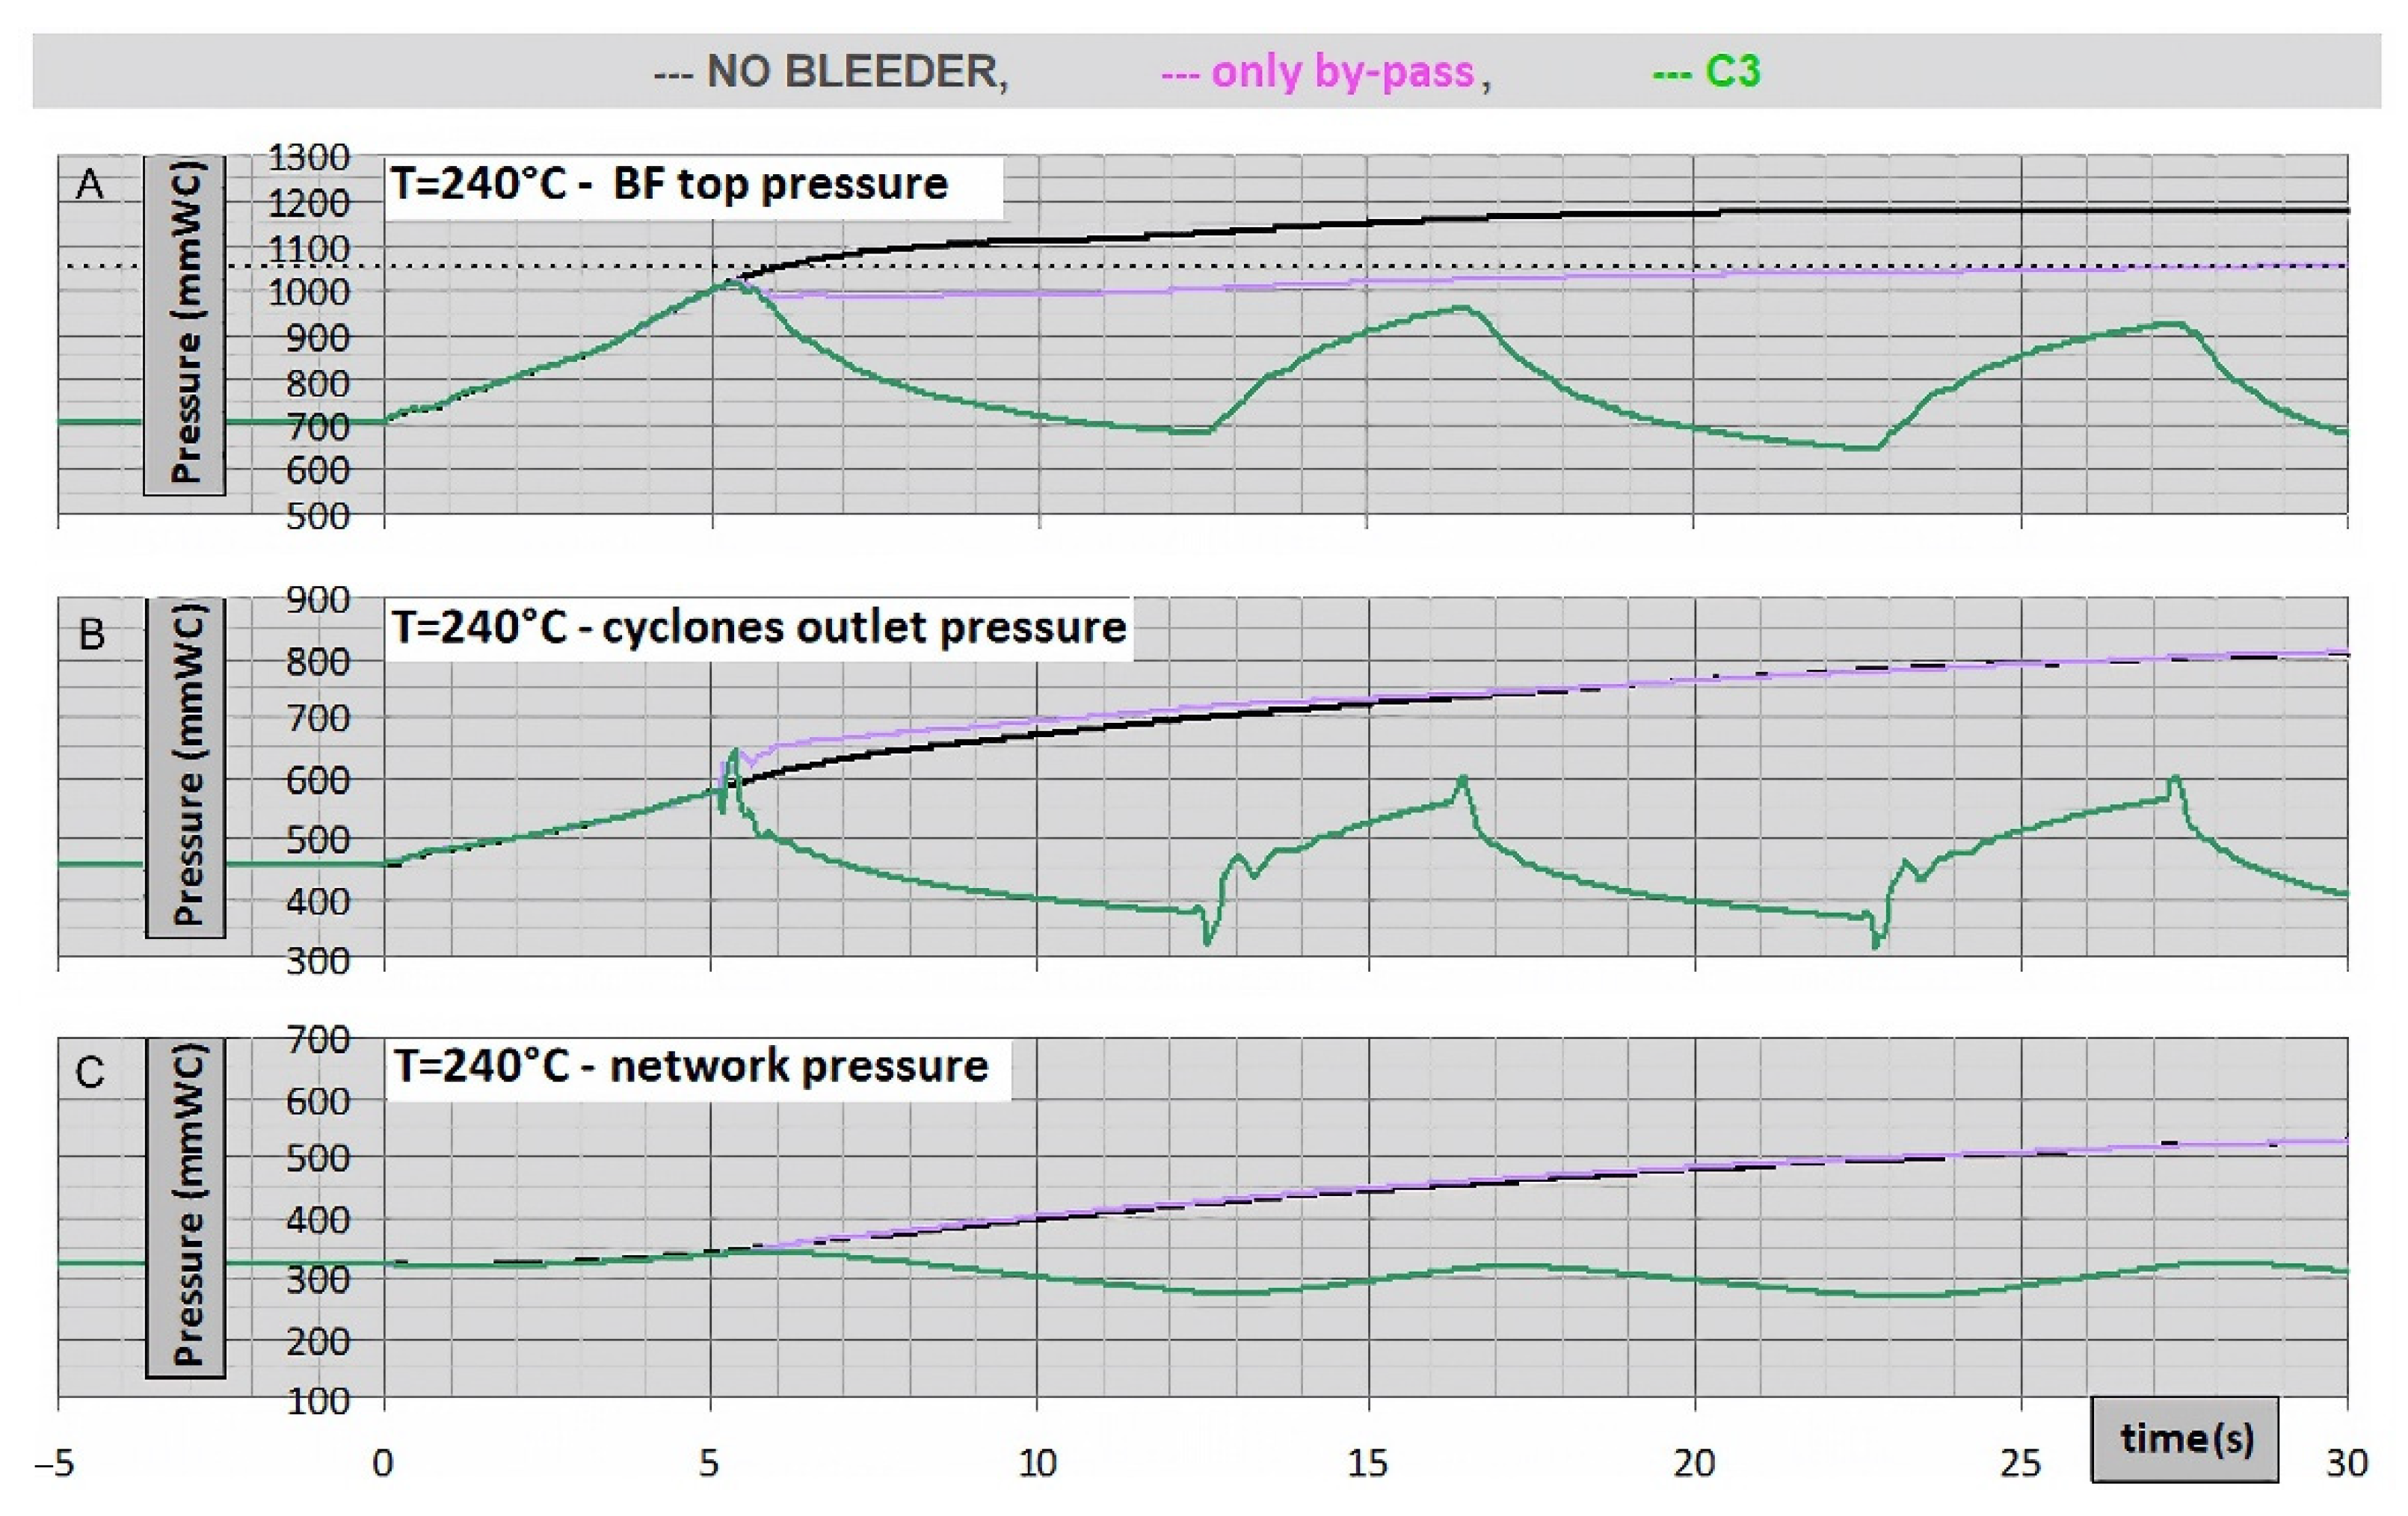
4.2. Medium Severity Grade Event (240 °C)
In case of a medium severity grade event, all circuits keep the BF top pressure under control (without the need of further emergency valve opening set at 1050 mmWC).
Figure 12 shows the evolution over time of pressure when there is a sudden top gas temperature increase to 240 °C.
The existing circuit C1 produces both a pressure excursion and pressure fluctuations at the BF mouth, much higher than those generated by C2 and C3.
Let us note that circuit C3 lowers the network pressure more than C1 and C2. The solution to this problem is illustrated in
Section 5.
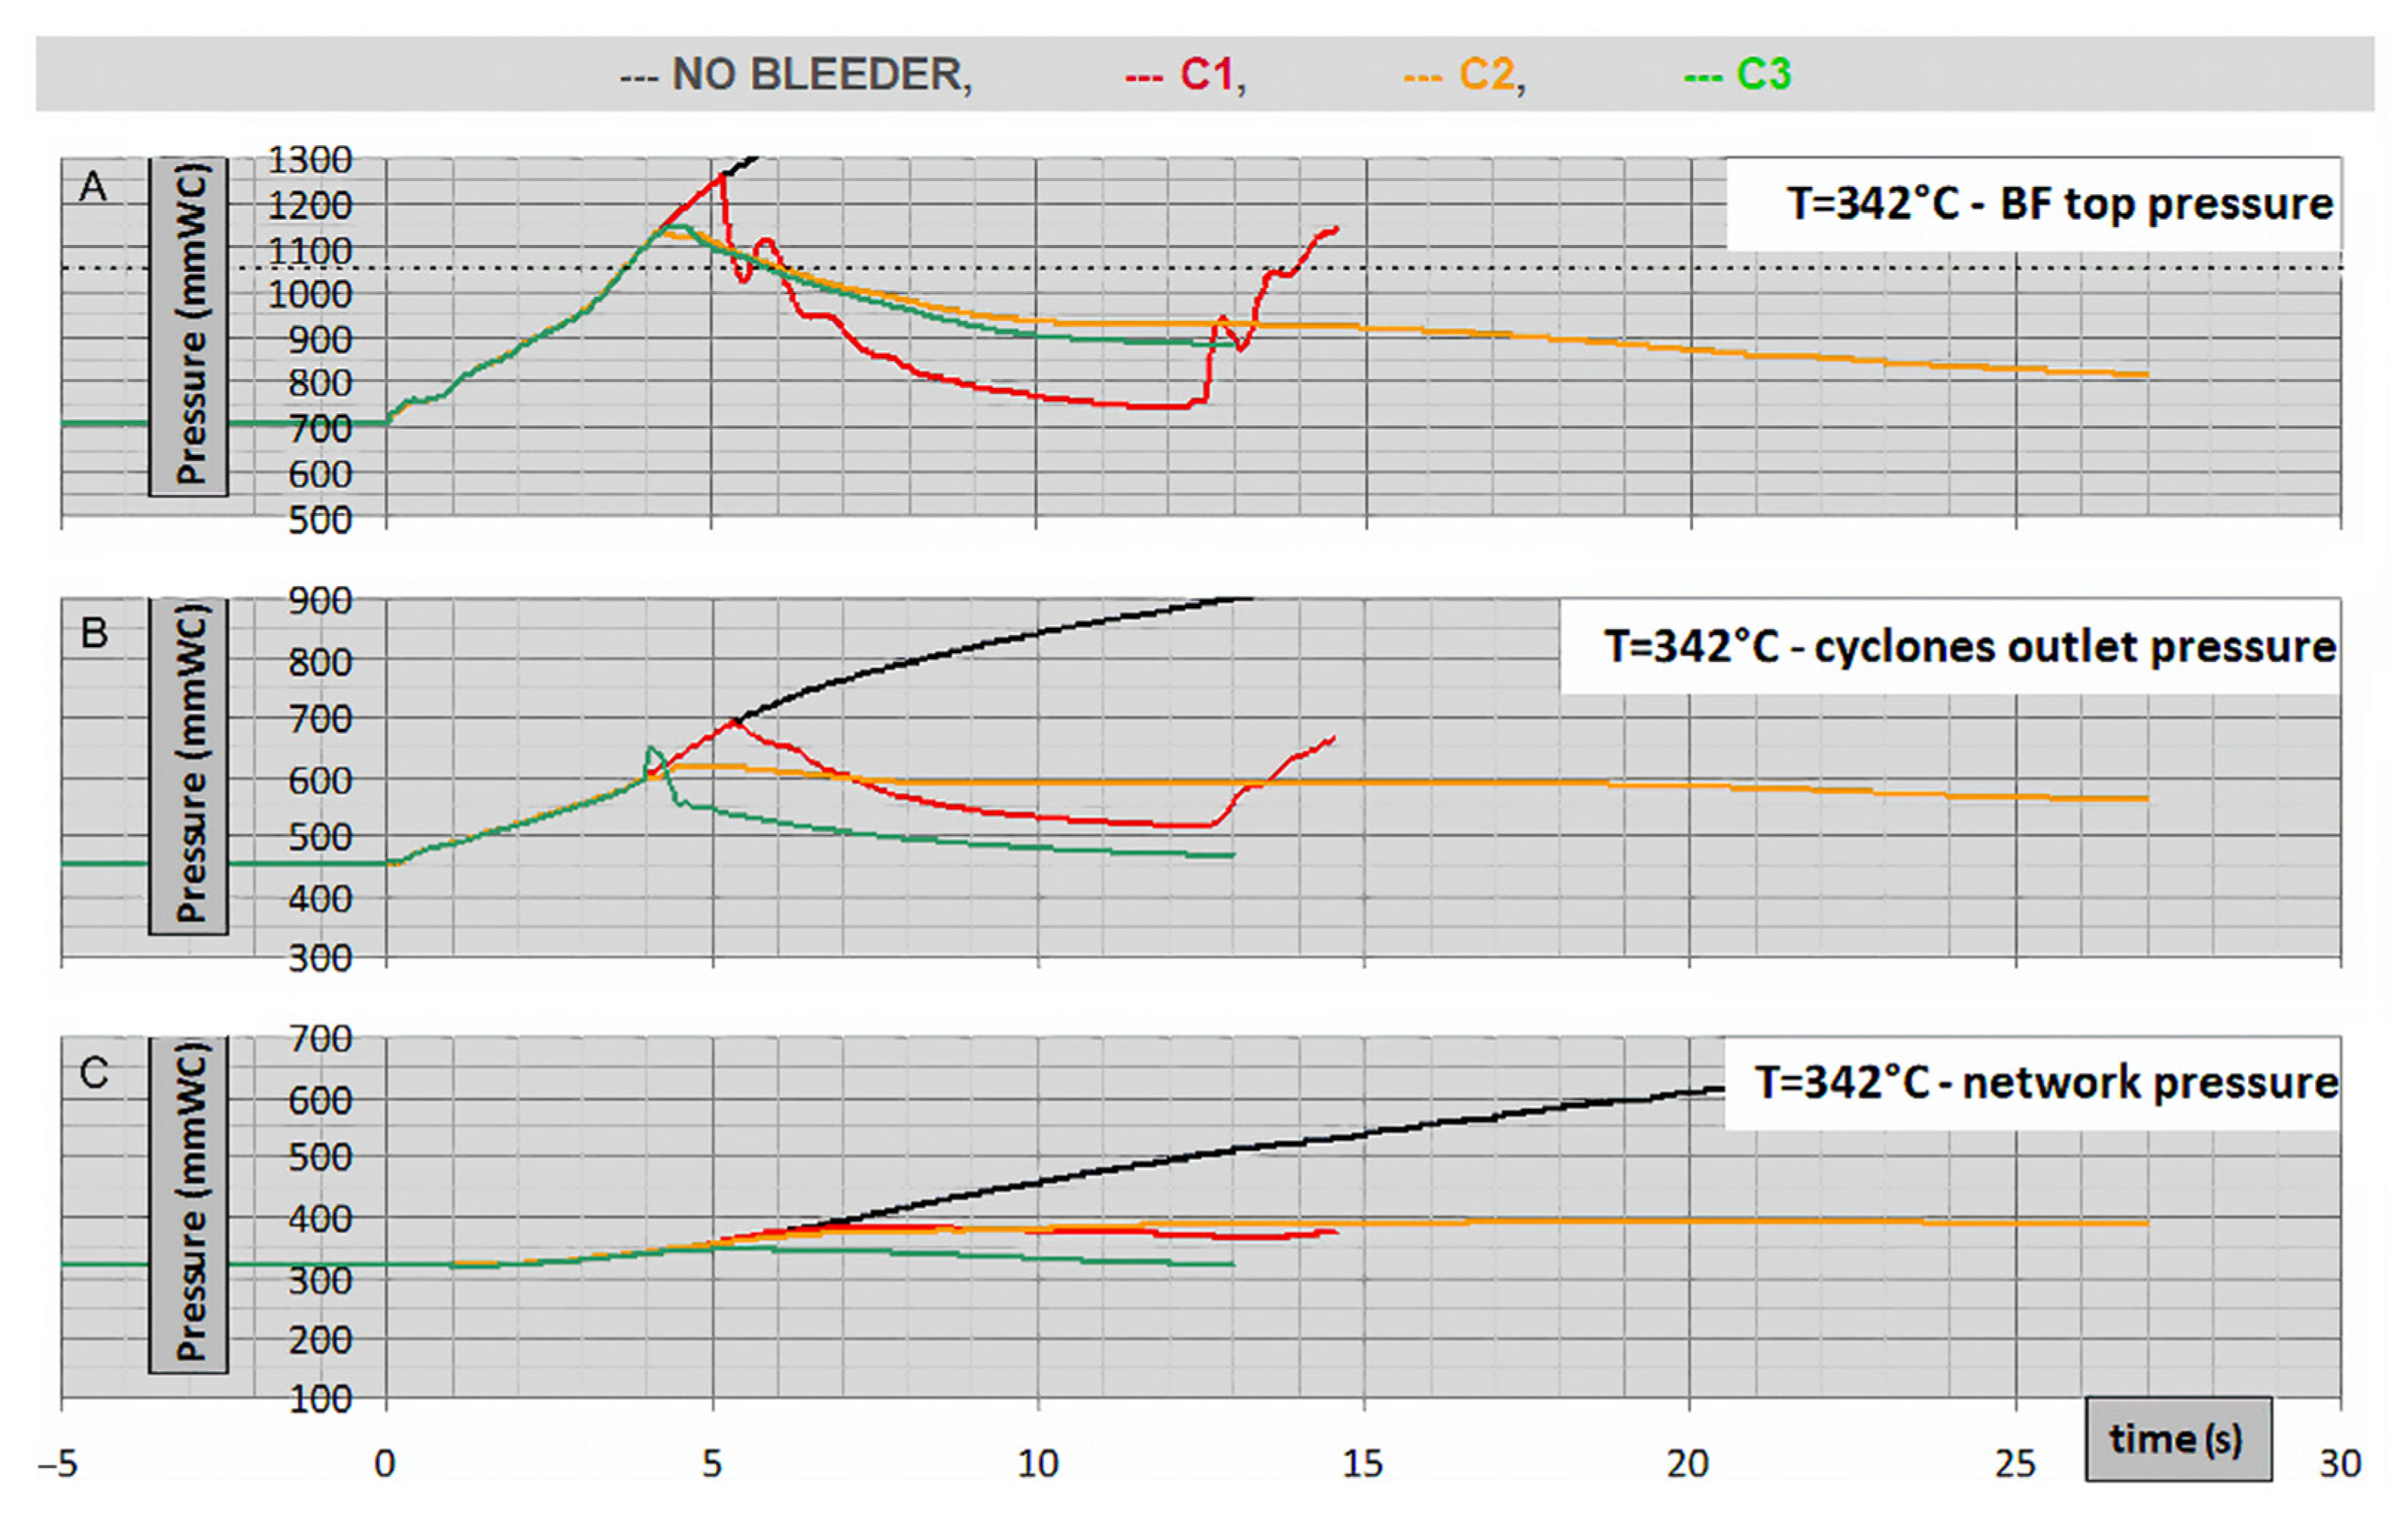
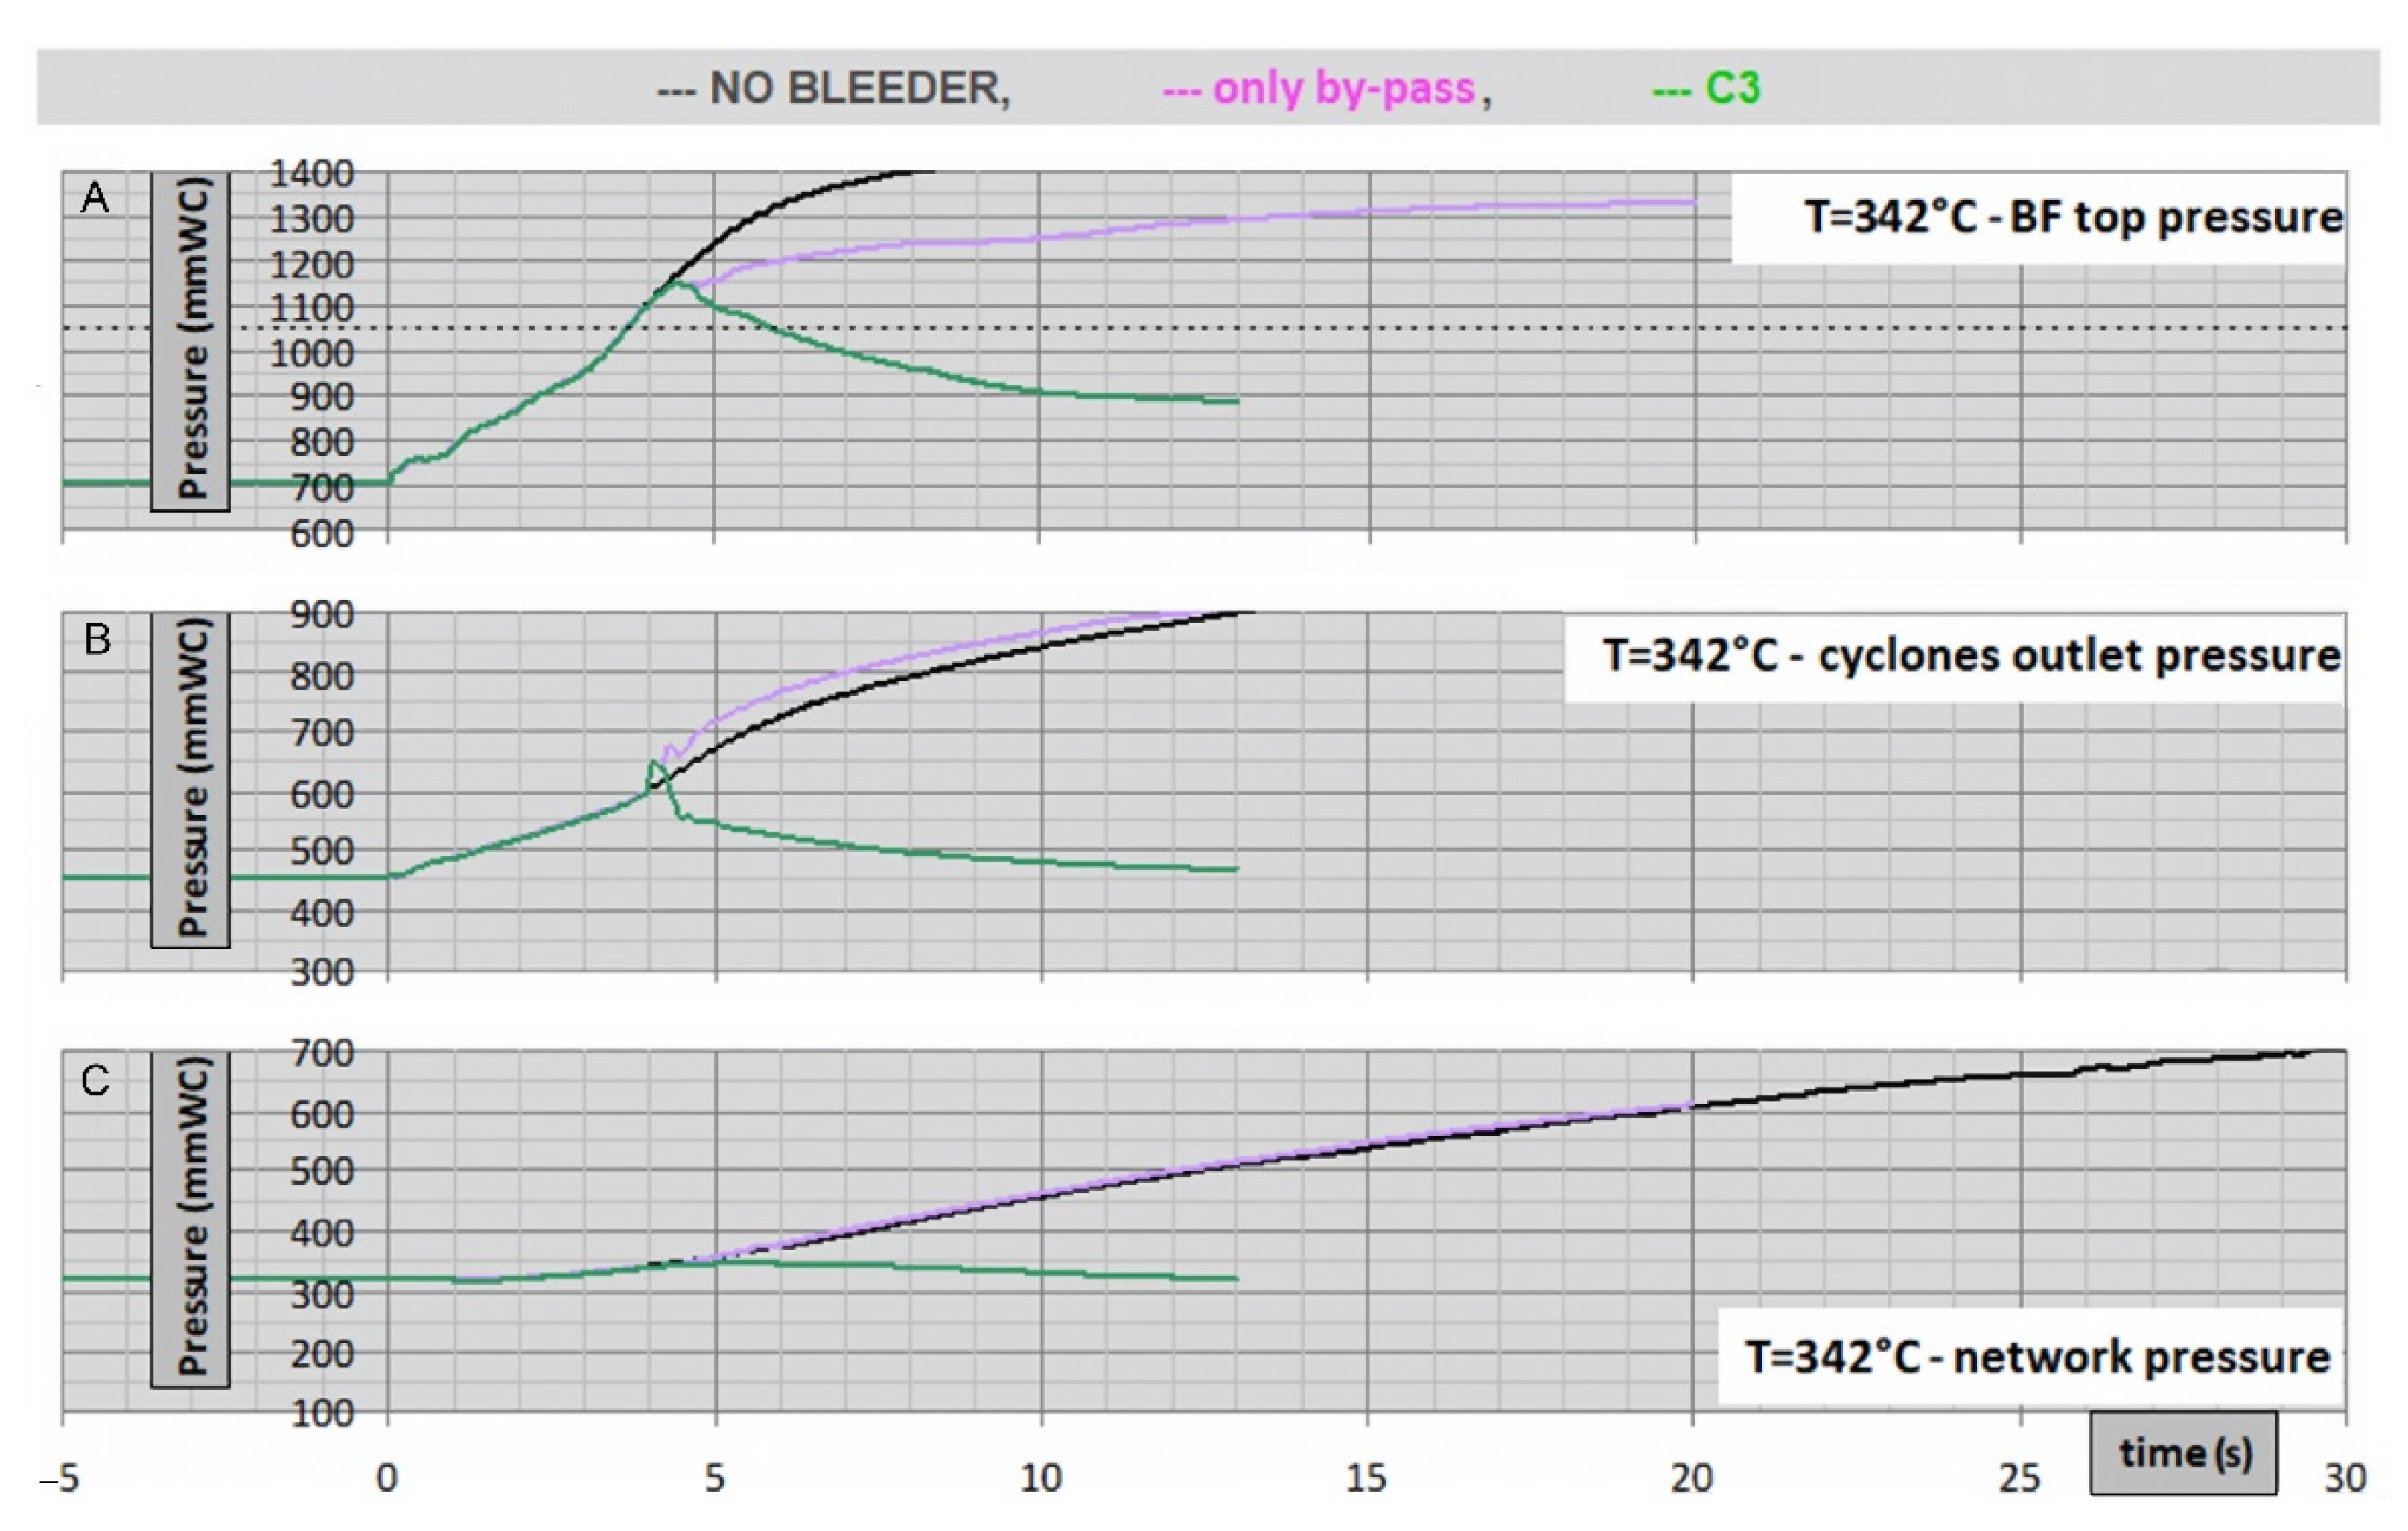
4.3. High Severity Grade Event (342 °C)
Figure 13 shows the evolution over time of pressure when there is a sudden top gas temperature increase to 342 °C. In the case of high severity grade event, circuit C1 struggles to keep the perturbation under control. In the simulations, circuit C2 and C3 do not succeed for about 0.2 s.
In order to better understand the most severe event, it is necessary to separately analyze each circuit.
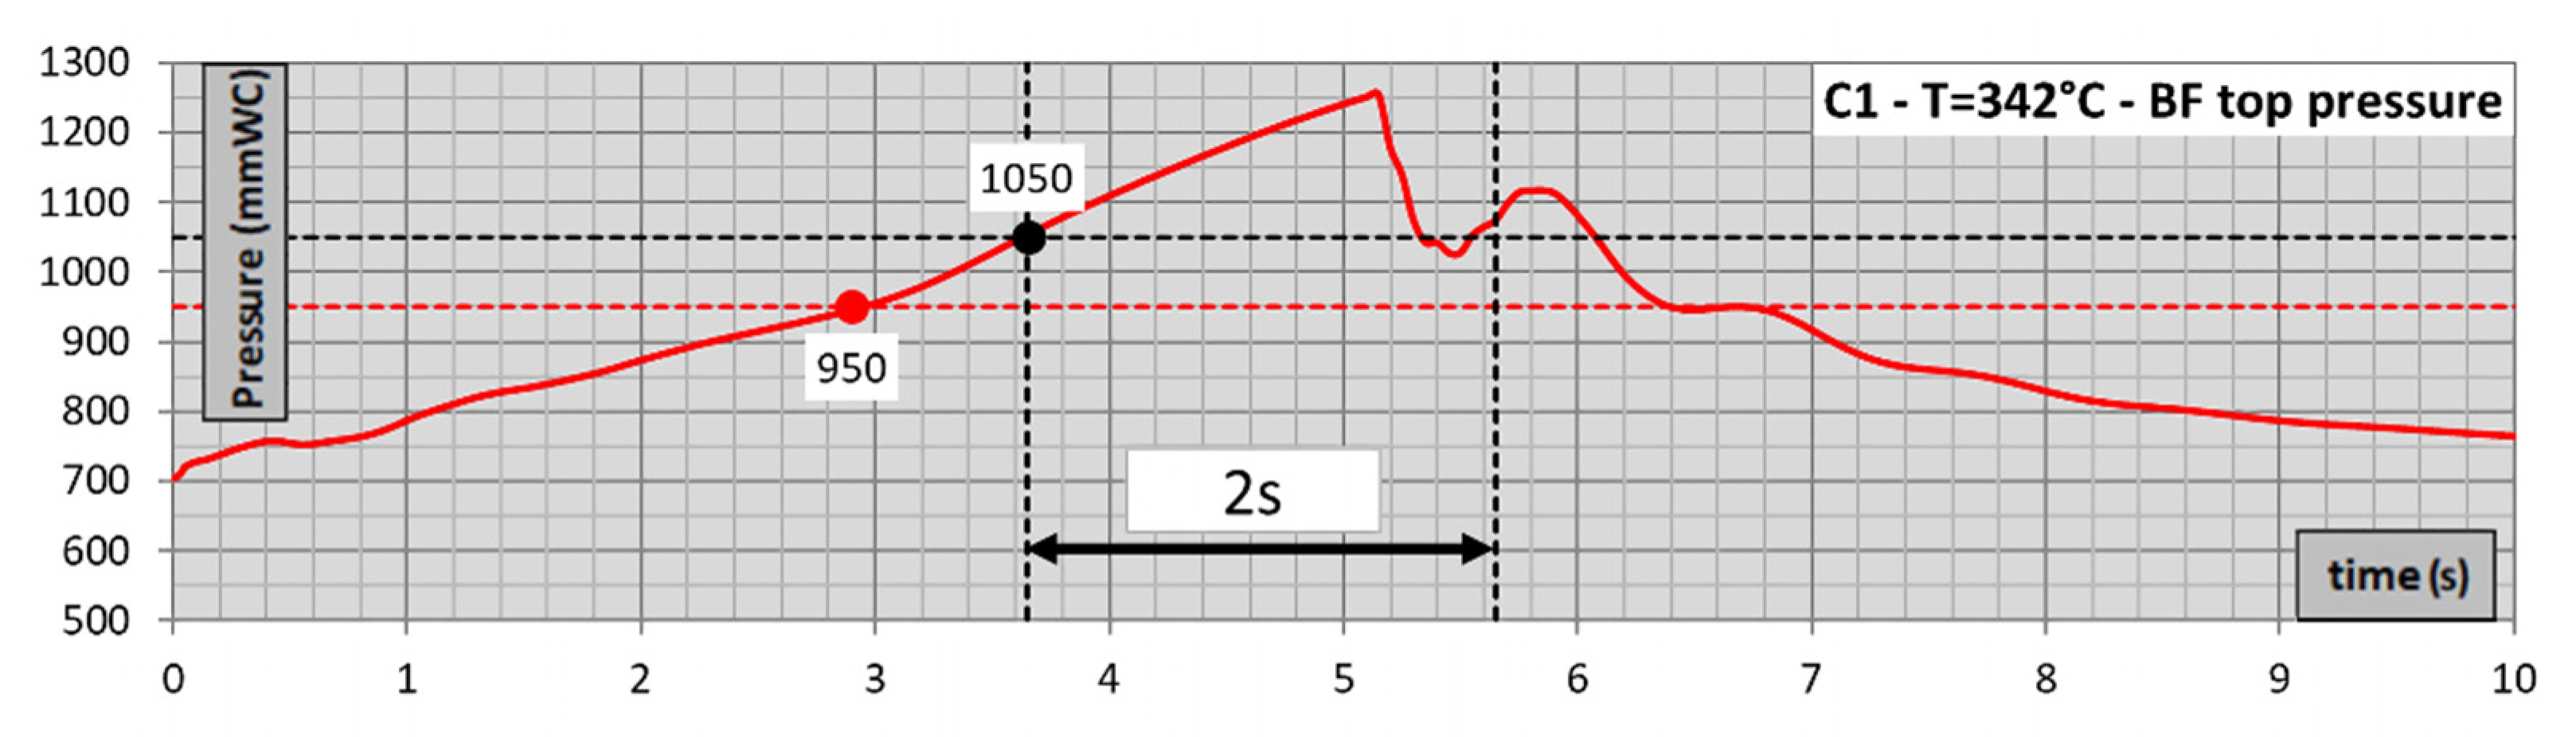
The circuit C1 opens the bleeder B1 at 950 mmWC and, in case the pressure continues to rise, opens the bleeder B2 at 1050 mmWC. All valves start opening when the BF top pressure remained over their threshold for 2 s. The most severe event increases the pressure beyond 1050 mmWC, but before 2 s, the pressure sways around the threshold value and bleeder B2 will not open (
Figure 14).
Circuit C3 (and similarly the circuit C2) opens the bleeder B3 at 850 mmWC and, in case the pressure continues to rise, opens the bleeder B1 and B2 at 1050 mmWC (B1 and B2 opening is not simulated but only foreseen). All valves start opening when the BF top pressure remains over their threshold for 2 s. The most severe event increases the pressure beyond 1050 mm WC, and valves B1 and B2 will open, even if the pressure would drop below the threshold value in 0.2 s (
Figure 15).
This problem will be easily solved in the field by reducing the waiting time for B3 valve opening.
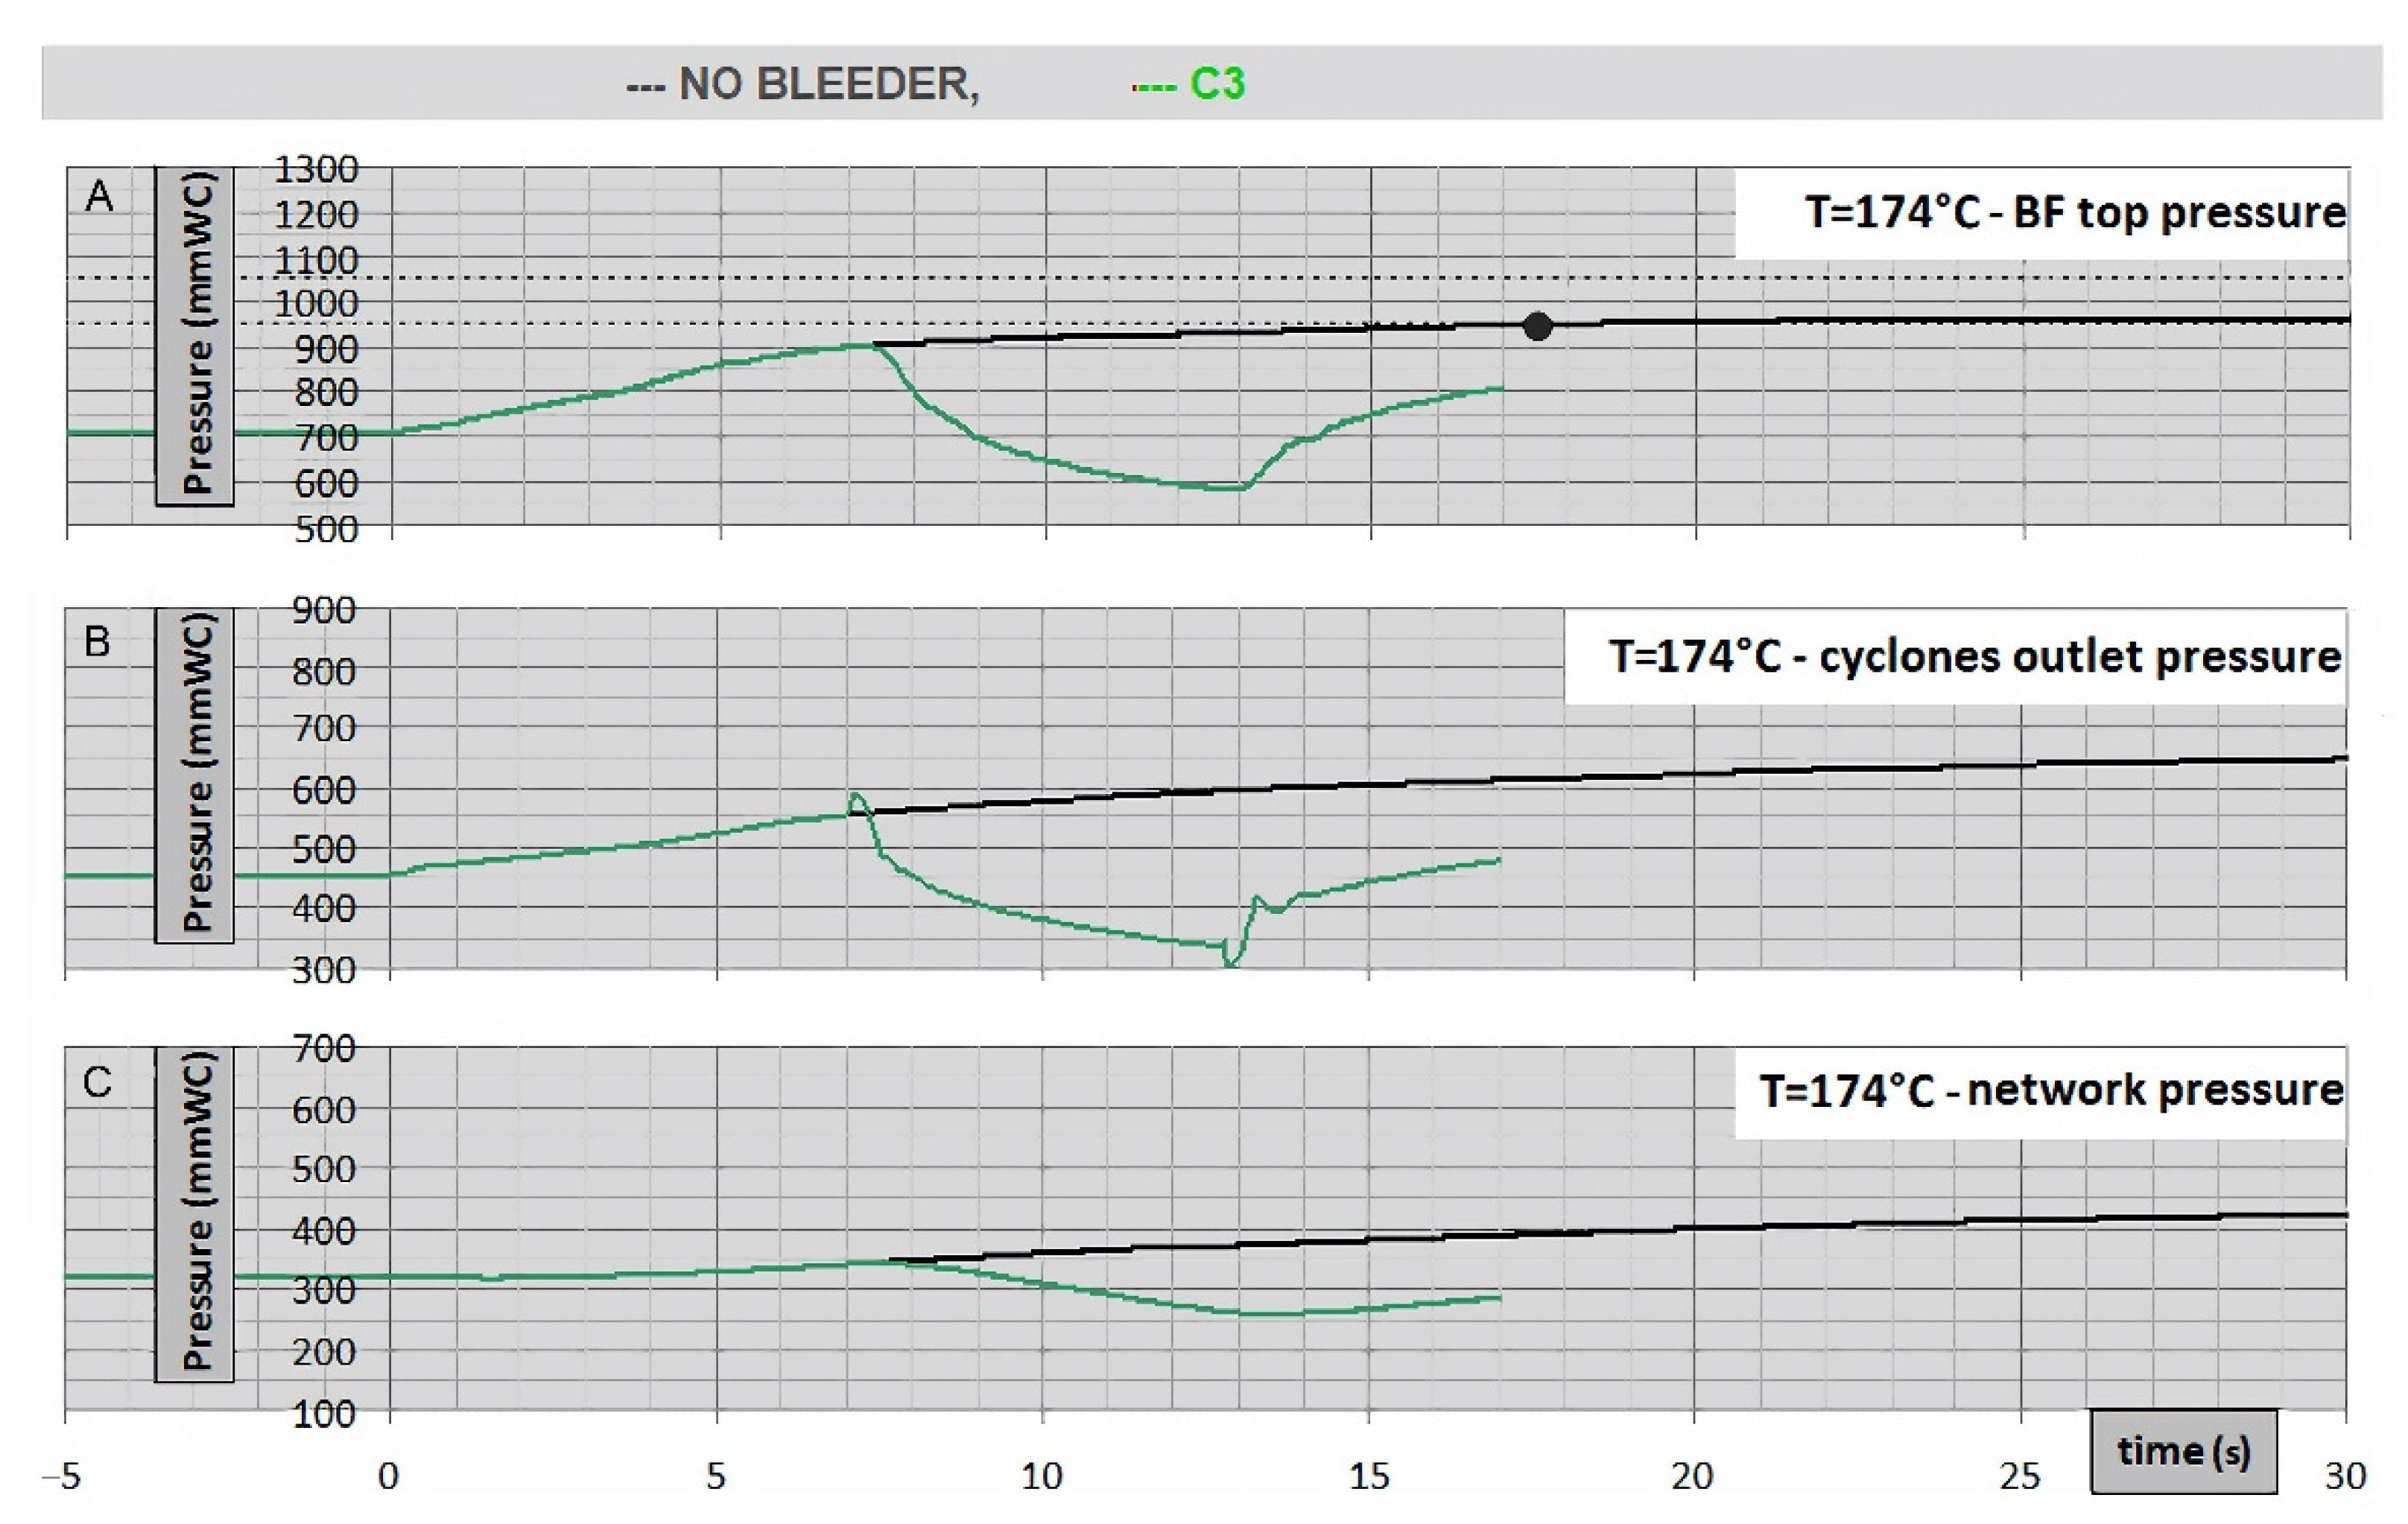
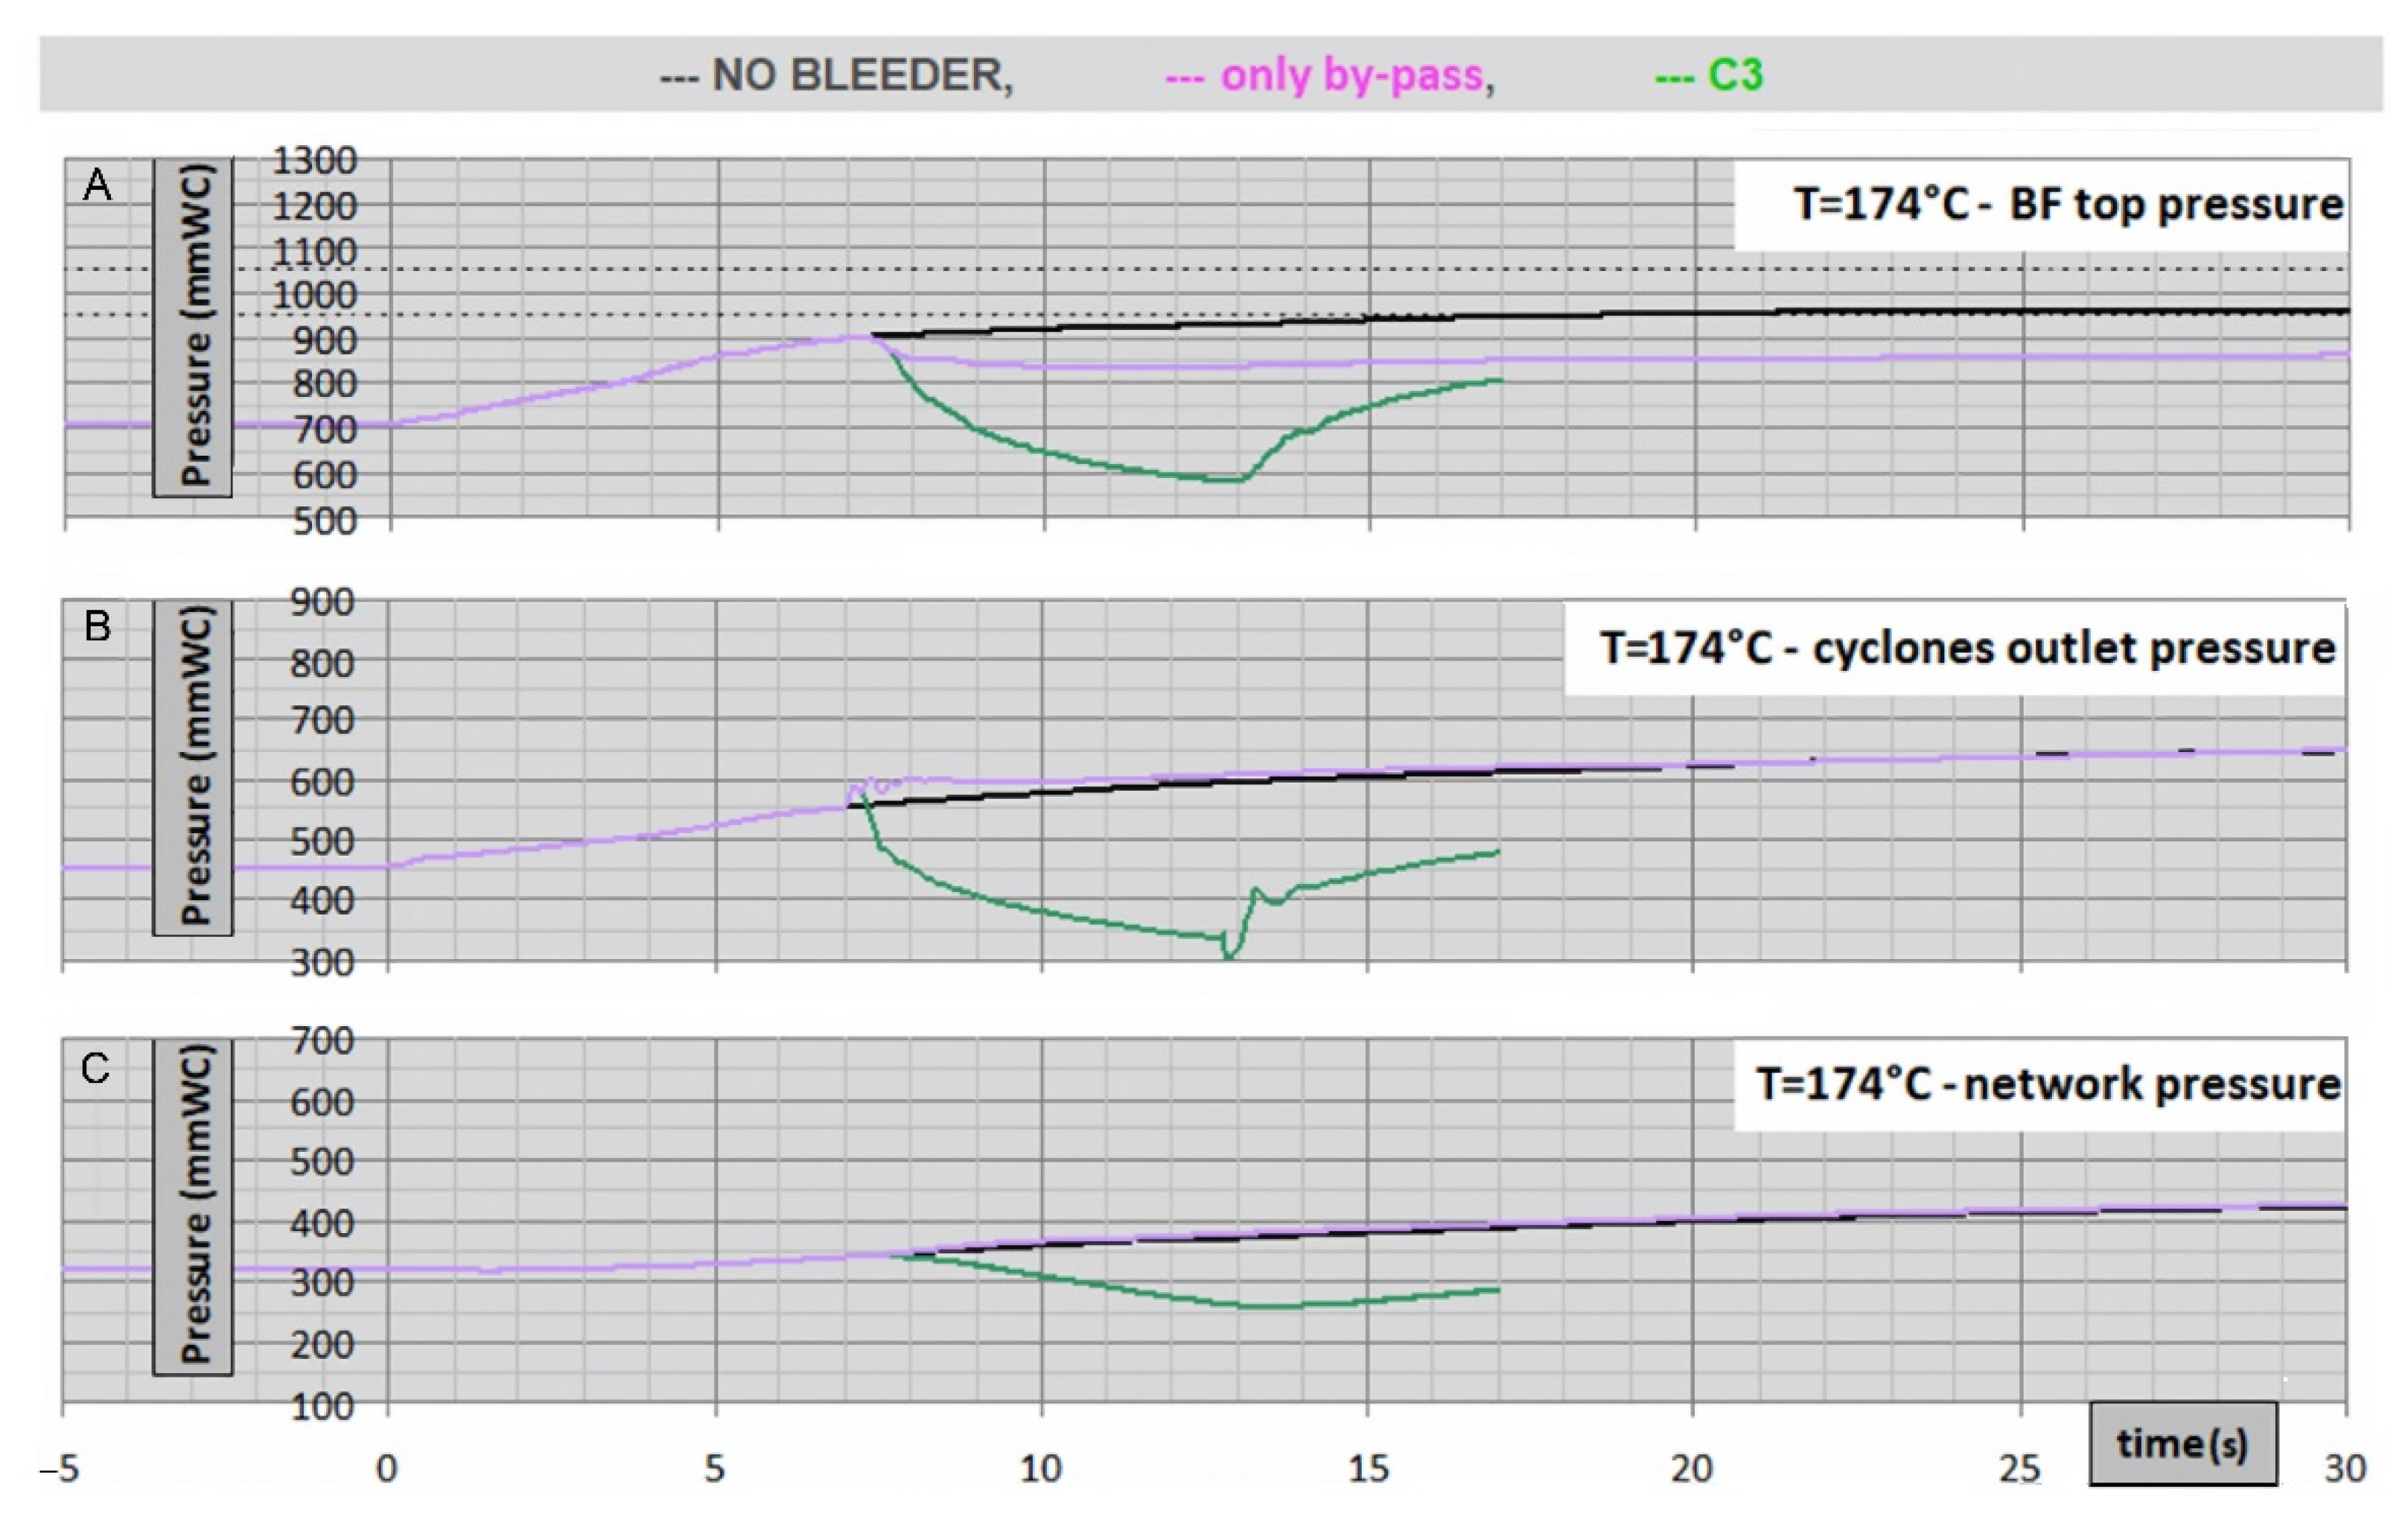
4.4. Minimum Severity Grade (174 °C)
In case of a less serious event, all circuits keep the pressure under control (without the need of further emergency valve opening set at 1050 mmWC).
The circuit C1 was not directly simulated, but the simulation of the no-bleeder circuit highlights that bleeder B1, set at 950 mmWC, would open even in this negligible event.
The circuit C3 achieves the goal of avoiding the release of dirty gas through the BF top bleeder into the atmosphere but lowers the network pressure compared to the operating conditions (
Figure 16). The solution to this problem is presented in
Section 5.
4.5. Considerations on the Analyzed Circuits
In the three considered scenarios, both circuits C2 and C3 achieve the goal of avoiding dirty gas discharge into the atmosphere through the BF top bleeder.
The advantages and disadvantages of the two circuits are:
The circuit C3 discharges cleaner gas into the atmosphere: Circuit C2 discharges directly all the gas that bypassed the cyclones, while circuit C3 mixes the bypassed gas with the clean gas before discharge it.
Circuit C3 introduces partially dirty gas into the network. However, the simulation results show that when the bleeder B3 is open, about 50% of the flow is introduced into the network and the part that bypasses the cyclones is 24%. In conclusion, the quantity of partially dirty gas fed into the network is acceptable (about 12%).
In case of low and medium overpressure, circuit C3 reduces the network pressure compared to the operating conditions. The solution is presented in
Section 5.
Circuit C3 offers the huge advantage of having to provide only about 10 m of DN800 pipe for cyclone by-pass instead of 100 m for the emergency line.
5. Optimal Solution
As a result of considerations made through CFD analysis of the circuits, the third option, circuit C3, has been adopted. This option is profitable in terms of cost savings and optimization of results, reducing the amount of gas relieved into the atmosphere at lower temperature and lower dust content.
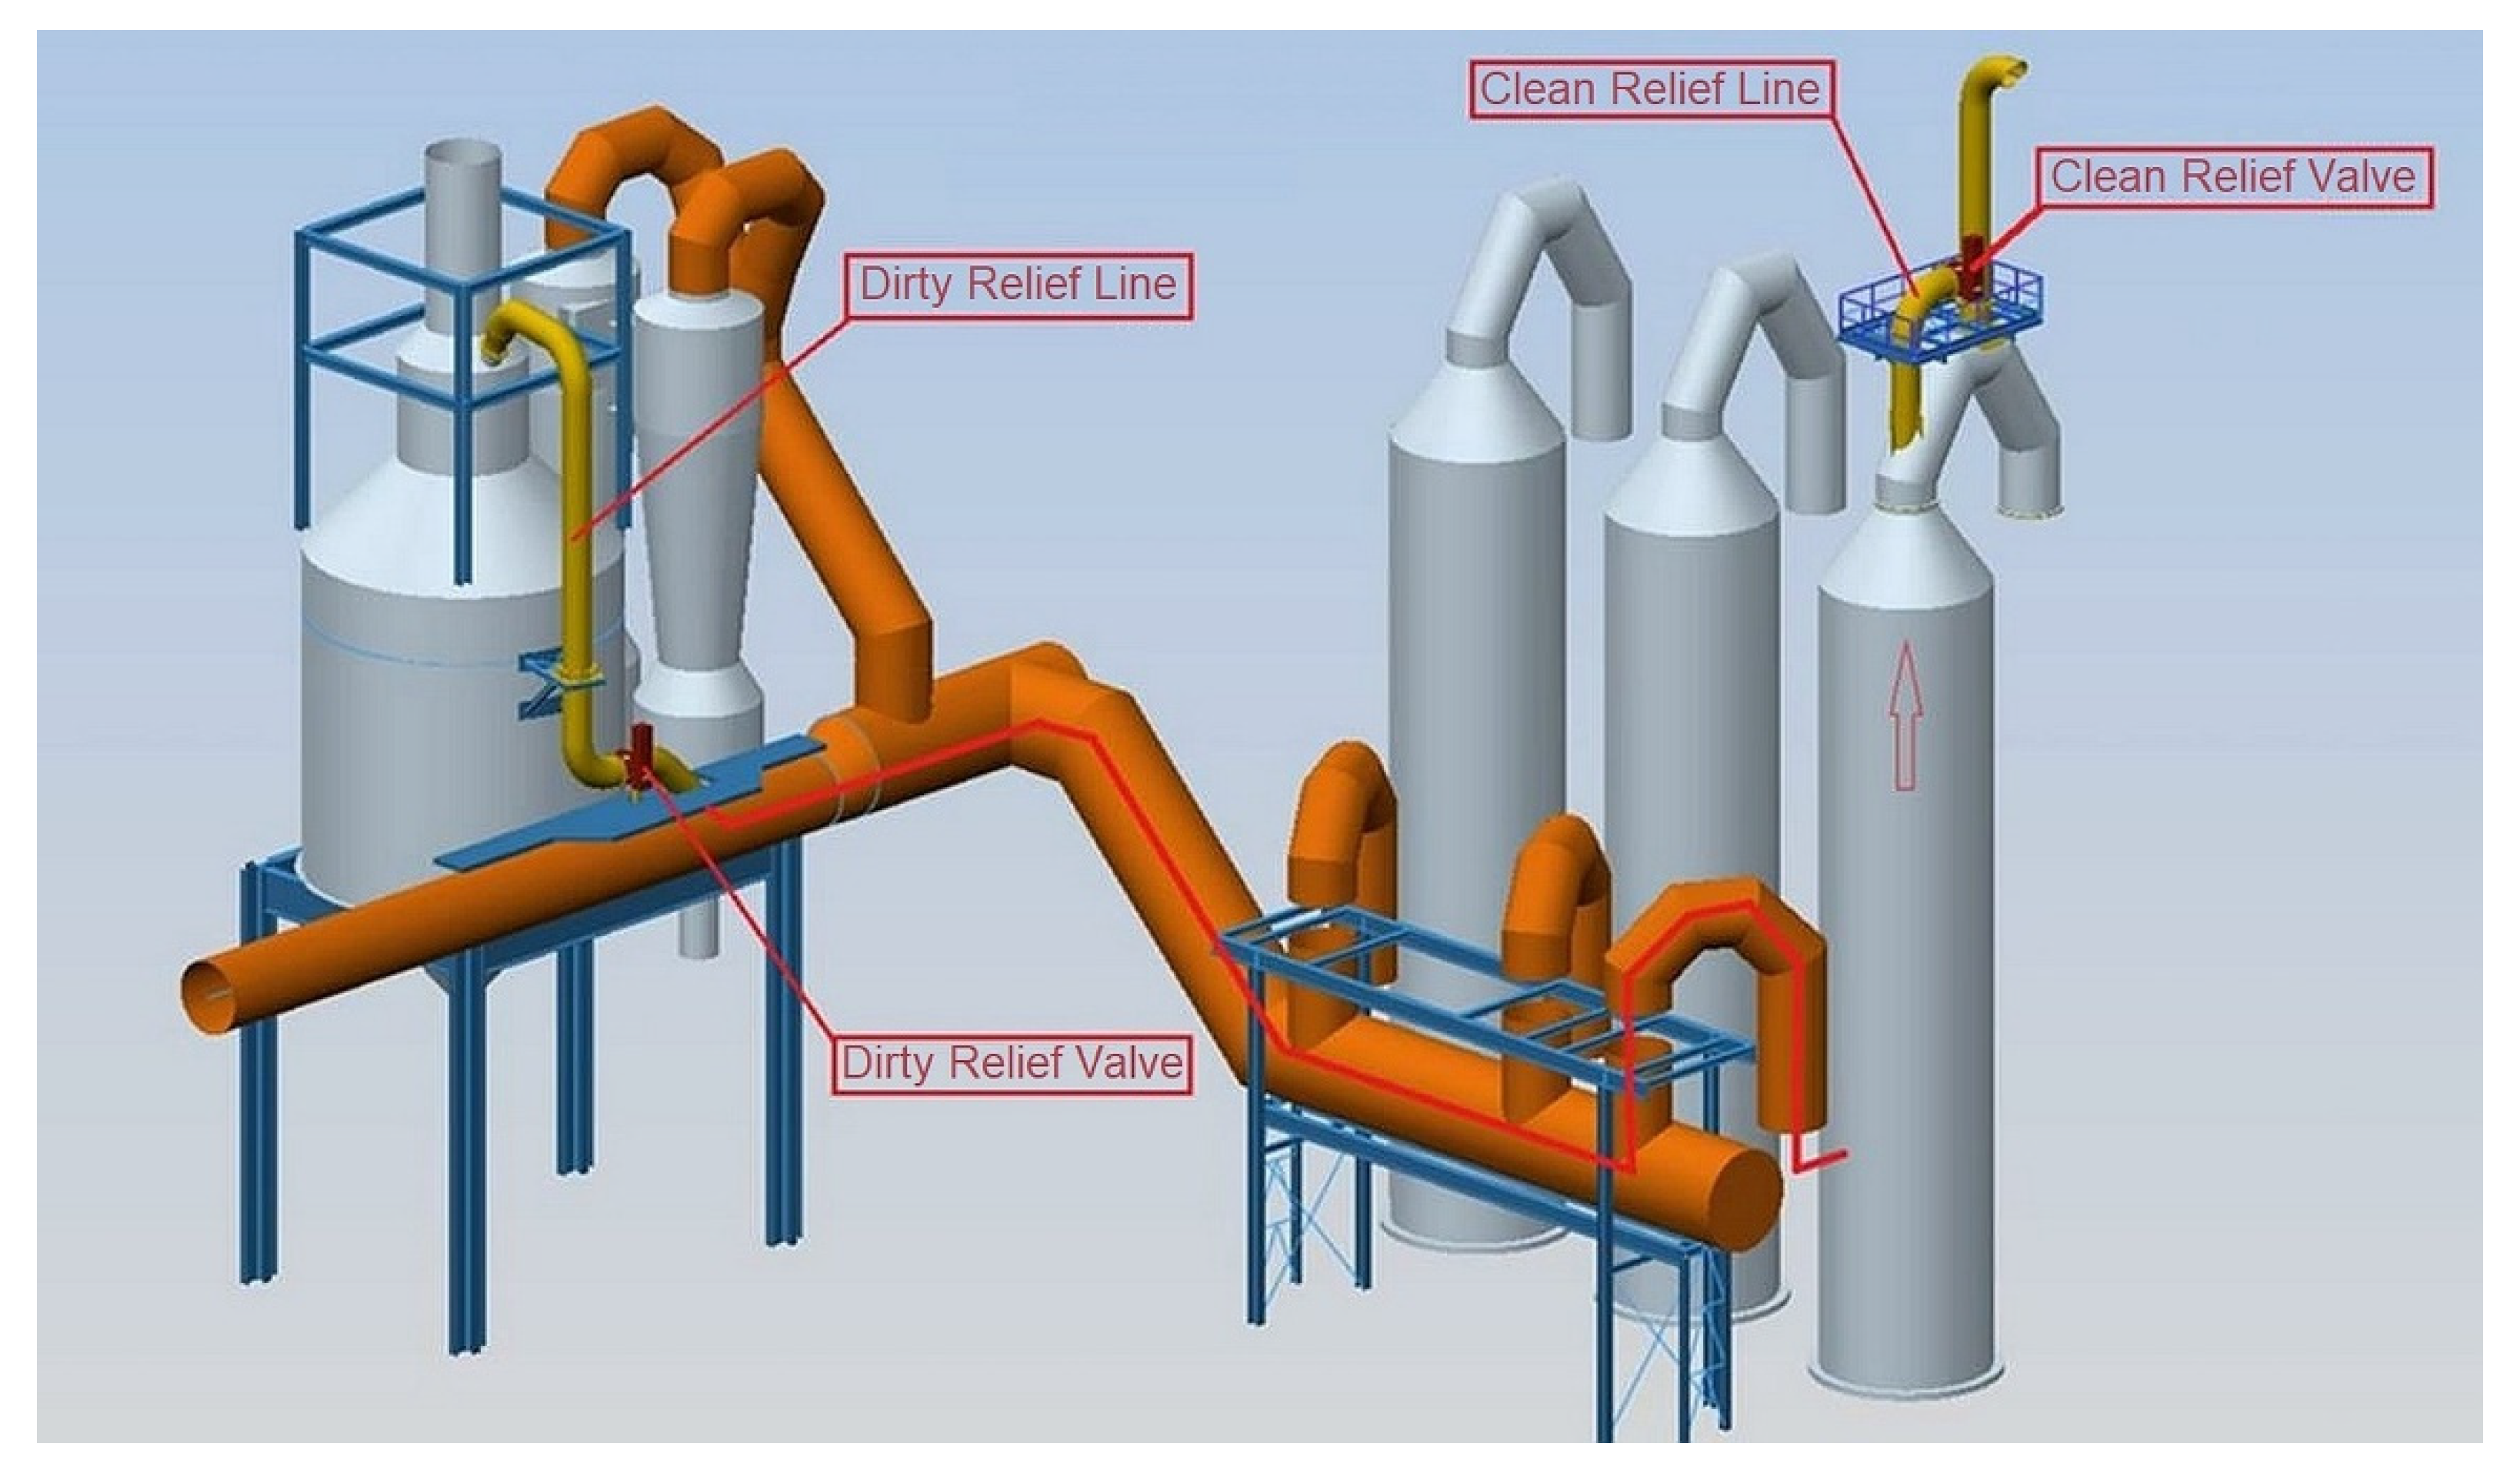
The new configuration introduces one bypass line with hydraulically operated valve (dirty relief valve) on cyclones and a new relief hydraulically operated valve (clean relief valve) to the atmosphere, installed on the top of the wet scrubber standby unit (
Figure 17).
The wet scrubber is connected to the inlet gas circuit and disconnected from the downstream gas network: Water is continuously injected in order to keep the system ready in case of relief valve intervention. In the event of overpressure, the gas is further cleaned and cooled in the wet scrubber before being discharge into the atmosphere.
CFD analysis highlighted that in case of low and medium overpressure, circuit C3 reduces the network pressure (compared to the operating conditions) while discharging the gas to the atmosphere through the clean relief valve. To optimize the design, the effectiveness of the cyclone by-pass (dirty relief valve), without the clean relief valve, has been studied for the three different severe grade events. The behavior in case of overpressure was compared for:
The circuit without any emergency valve;
Circuit C3 with a by-pass opening at 850 mmWC without a clean relief valve;
Circuit C3 with the simultaneous opening of the clean relief valve and by-pass at 850 mmWC.
It is worth noting that the by-pass alone manages to keep the top pressure below 1050 mmWC in case of medium severity events and the network pressure naturally increases in any case.
The combined action of the by-pass and clean relief valve in the atmosphere (C3) covers all cases at best.
In the final arrangement, the intervention of relief valves (dirty and clean) takes place in sequence according to different set point thresholds.
For low overpressures, the opening of the cyclone bypass alone (dirty relief valve) can counteract transient phenomena; in this case, the emission to the atmosphere is zero.
If the overpressure phenomena are greater, the clean relief valve will be opened to the atmosphere: In this case, the exhaust gas is in any case cleaned and cooled by the passage through the scrubber (which, for original design, guarantees a dust content lower than 1 g/Nm3, 20–30 times less than a discharge from the BF top bleeders). In any case, the real phenomena last only a few seconds.
Both relief valves will be electro-hydraulically actuated to have an adequate response time and the combined action of the two valves will be managed completely automatically by the control system. In the same way, valves are closed sequentially once the pressure comes down.
This system is expected to drastically reduce the opening of the BF top bleeders, which will only be necessary in the event of extraordinary and major events.
6. Discussion
The installation of the new equipment was completed at the end of November 2017. The subsequent commissioning and optimization phase lasted about a year. During this phase, the main task was to adjust the response velocity of the hydraulic equipment, in particular the relief valves. The dynamics of the process phenomena leading to overpressure in the upper part of the BF are very rapid. As a result:
A too slow valve response would have led to valve sets too close to normal operating pressure, resulting in an unbearably high number of activations;
A too fast valve response would have led to premature wear of the mechanical and hydraulic components of the system.
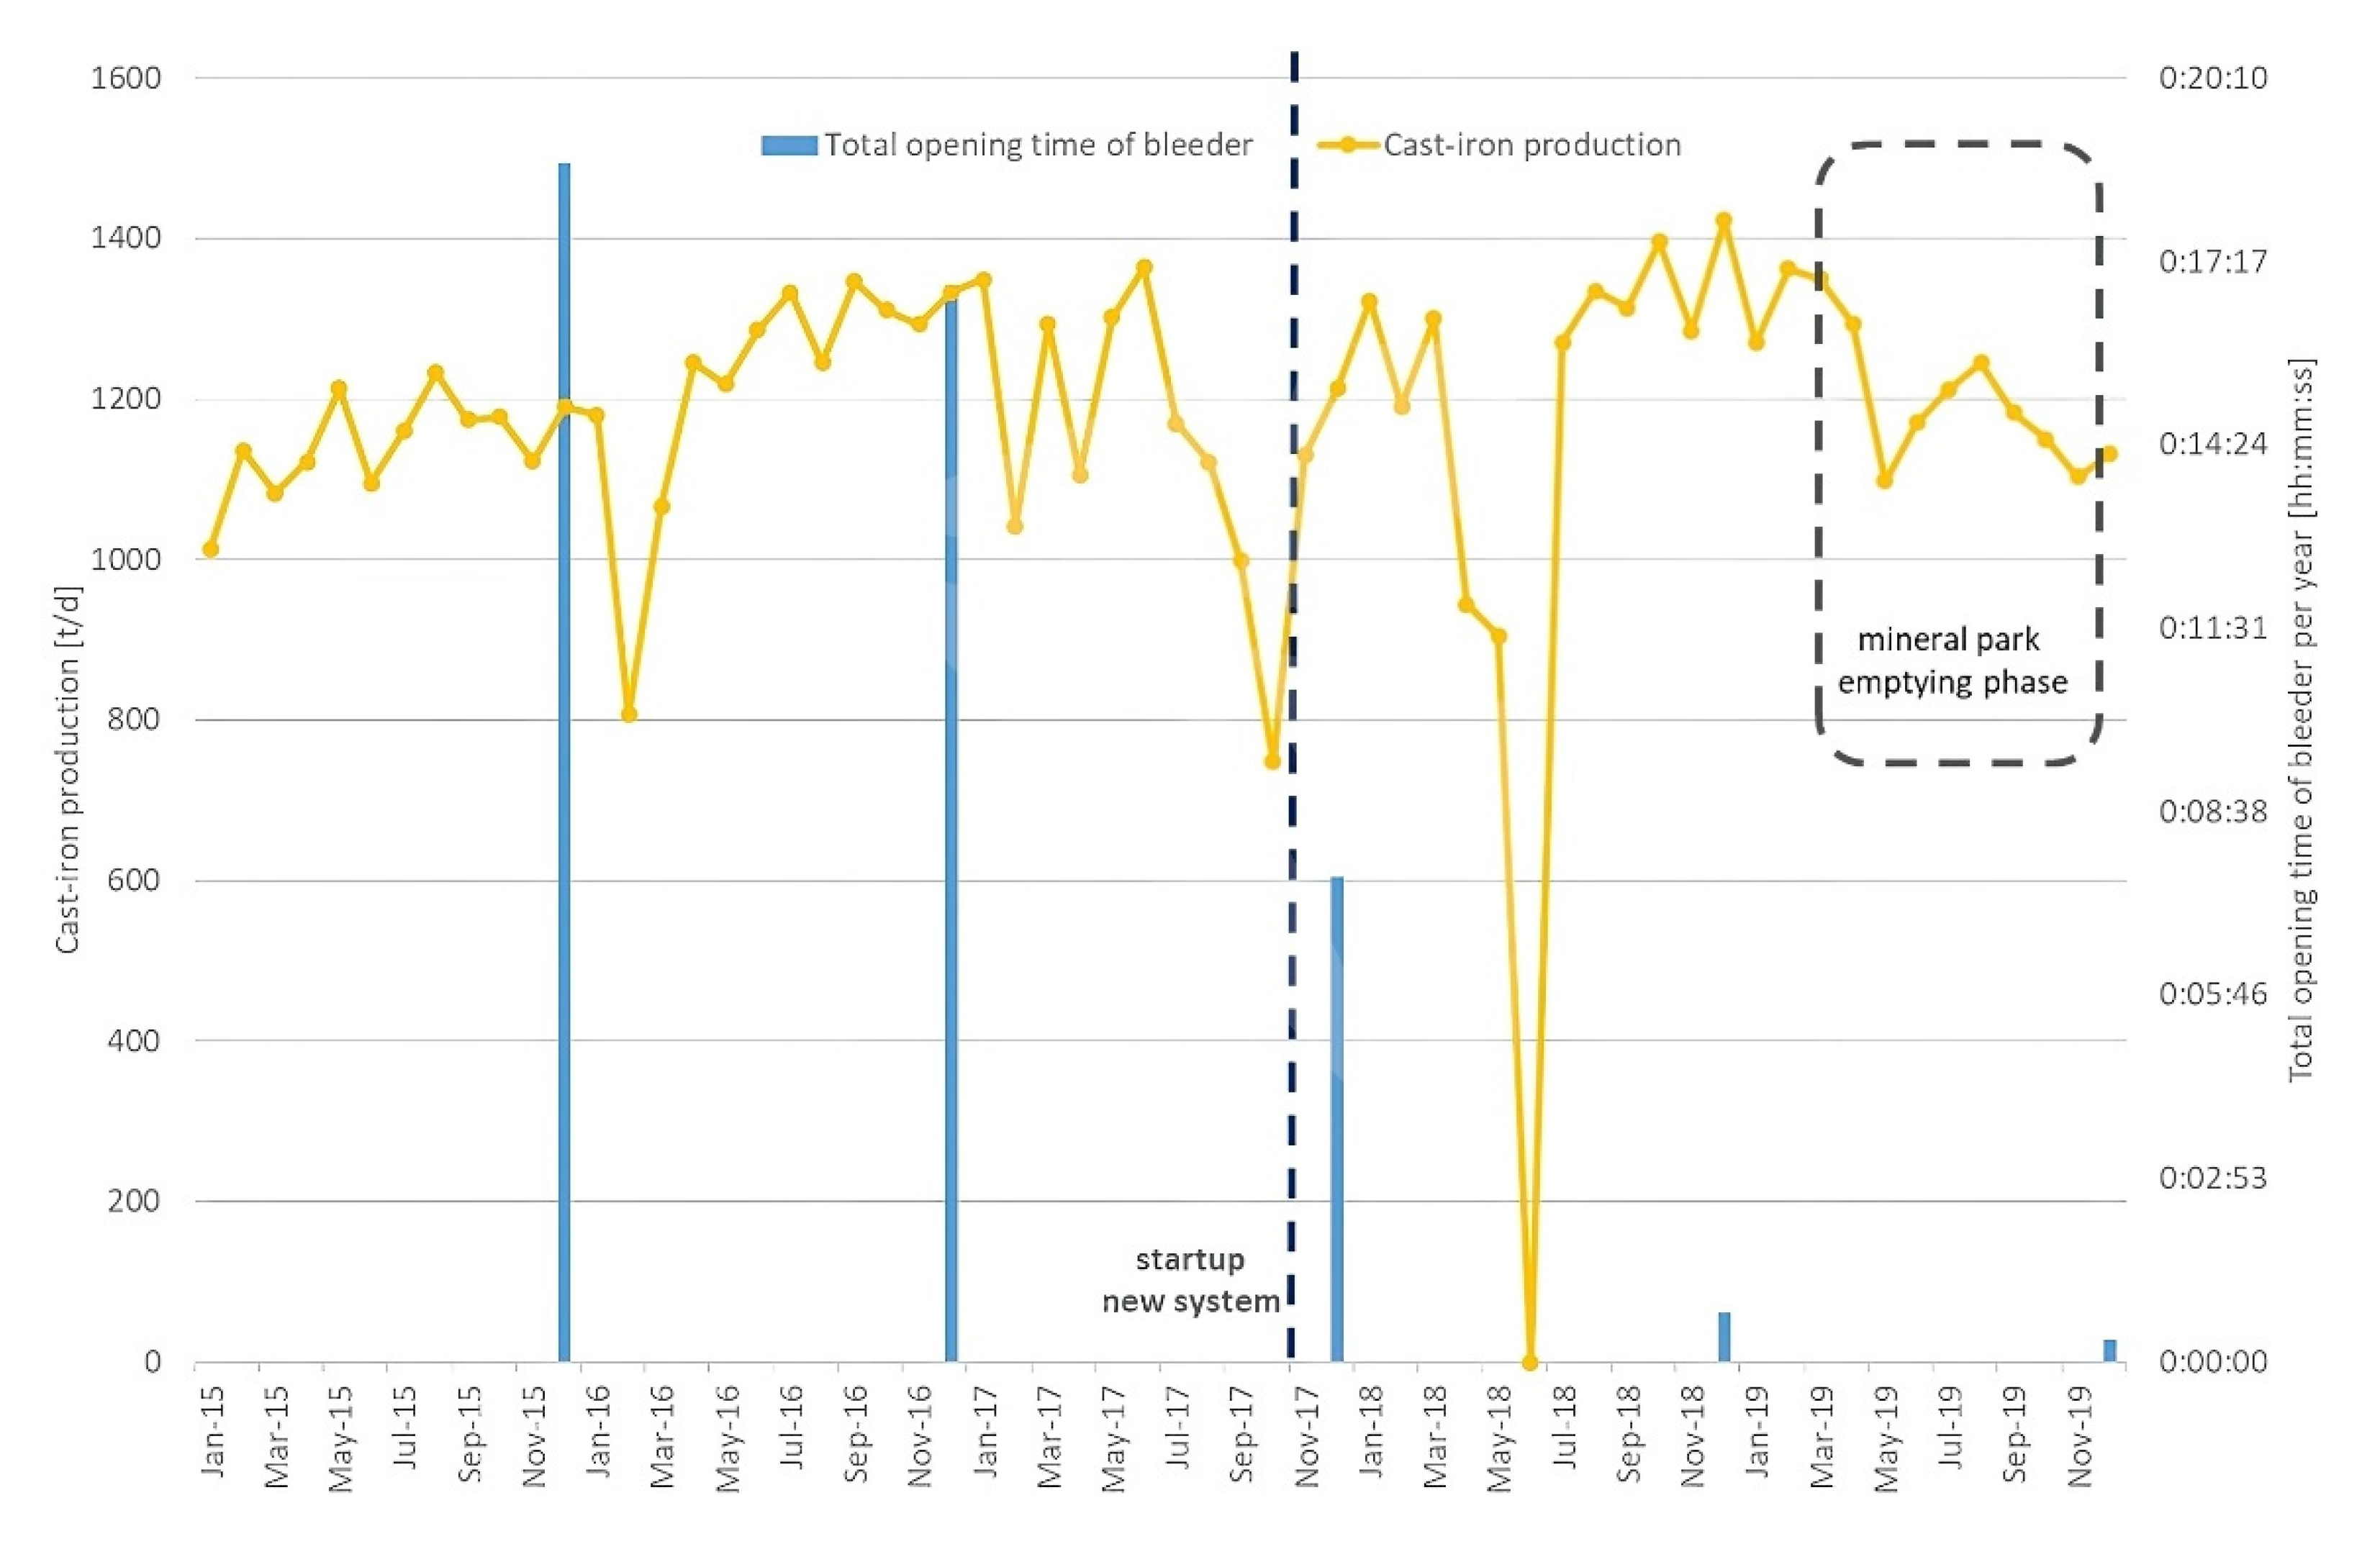
The compromise found allowed to minimize the intervention of the BF top bleeders, as can be seen in
Figure 21. After the installation of the new equipment, the total opening time of the BF top bleeders per year has been reduced by more than 50%, and after the tuning of the equipment in the field, by more than 96%. The result is even more striking if one compares it with the production trend, which in the same period has instead been growing. This testifies to the fact that the good functioning of the system has given the operators the necessary confidence to increase the production level, ensuring nonetheless a minimization of the bleeder valves openings and the associated emissions.
Even in the final part of 2019, the total opening time of the dirty bleeder proved negligible despite the low productivity, considering the need to empty the fossil and mineral parks because of the expected shutdown of the hot area plants, with a consequent deterioration in the quality of the BF charging materials.
7. Conclusions
In this paper, an optimal solution for reducing the opening time of BF top bleeders in an existing BF is presented. The numerous configurations tested by CFD analysis made it possible to outline the final operational solution. This solution involves the construction of a pipeline (DN800) detaching from the dust catcher for partial bypassing of the cyclones, which is able to deliver the flow rate taken directly downstream of them. A servo-assisted valve (dirty relief valve DN800) is installed on this pipeline, calibrated to intervene at 850 mmWC and able to control low critical situations, avoiding the opening of the emergency bleeders at the BF top and keeping the network pressure within the tolerability limit (350 mmWC).
As the critical level increases, the partial bypass of the cyclones is no longer sufficient to prevent the opening of the bleeder and keep the pressure excursions in the network within acceptable limits. To remedy this, an additional servo-assisted valve (clean relief valve DN800) was installed immediately after one of the three scrubbers, through which the previously cooled and cleaned BF gas is released into the atmosphere with almost no visual impact.
It should be remembered that, in the chosen configuration, the safety levels are not affected because the BF mouth bleeders has not been modified or calibrated differently.
During the commissioning phase Paul Wurth and Arvedi specialists made the fine tuning of the valve’s intervention, optimizing the setpoints and control logics in order to limit as much as possible the intervention of emergency bleeders only to the most serious overpressure cases.
After final commissioning of the new relief system, the opening of the emergency bleeder valves has been dramatically reduced with only some events in case of great overpressure phenomena, demonstrating the effectiveness of the adopted solution. The installation of the new equipment has reduced the total opening time of the BF top bleeders per year by more than 50% and after the tuning of the equipment in the field, by more than 96%.


 ,
, 


