
Toward ZEB: A Mathematical Programing-, Simulation-, and AHP-Based Comprehensive Framework for Building Retrofitting


Industrial Engineering Department, College of Engineering, Alfaisal University, Riyadh 11533, Saudi Arabia
Appl. Sci. 2022, 12(4), 2241; https://doi.org/10.3390/app12042241
Submission received: 14 November 2021
/
Revised: 6 February 2022
/
Accepted: 18 February 2022
/
Published: 21 February 2022
(This article belongs to the Special Issue Zero Energy Buildings: From Building Energy Simulation to Indoor Environment Monitoring)
Abstract
:Because of their significant energy consumption and its economic and environmental impacts, existing buildings offer decision makers opportunities and challenges at the same time. In fact, there is a worldwide effort to improve the energy performance of the existing buildings as well as the new ones to achieve zero-energy buildings. In this paper, a framework for retrofitting existing buildings to help achieve the goal of zero-energy buildings is presented. The framework details the different steps required to develop and implement a successful retrofitting plan for both residential and commercial buildings. This includes data collection, life cycle cost calculation, building simulation, and multi-criteria decision making using the analytic hierarchy process (AHP). At the end of the paper, a case study is detailed to show the different steps necessary to select a successful retrofitting plan that reflects the decision maker’s objectives. The case study resulted in a retrofitting plan that offers a yearly energy savings of 30% and a payback period of 2.2 years.
1. Introduction
CO2 emissions, global warming, air pollution, resource depletion, and growing population are serious and threatening challenges facing humanity nowadays. In fact, at the current population growth rate and increasing energy demand for housing and improving quality of living standards, it is predicted that the current primary energy sources will be depleted in less than 134 years [1].
One of the major contributors of CO2 emissions and energy consumers is buildings. For instance, the building sector in the U.S. and Europe represents 39% and 40% of the energy consumption and 38% and 36% of the CO2 emissions, respectively [2].
Buildings consume energy mainly for lighting, electrical equipment, and mainly thermal comfort (cooling, heating), which represent a large proportion of building energy consumption [3].
As a result, governments, private institutions, environmentalists, and researchers around the globe are researching ways to reduce the adverse effects of consuming energy and emitting CO2 by creating strategic plans, national frameworks, building codes, and energy performance rating systems to help existing as well as new buildings become zero-energy buildings (ZEBs).
Actually, zero-energy buildings can be defined as energy-efficient buildings that are able to generate electricity from renewable sources to help satisfy part or all of their demand. Net ZEBs, which are mainly buildings connected to the grid, have different definitions according to the specific country conditions and political and energy targets. In [4], the authors built a definition framework for net ZEBs based on the import/export and the load/generation balances, where the word “net” refers to the building balance between supply and demand.
In general, a ZEB refers to two main strategies [5]:
- ✓
- Minimizing building energy consumption by adopting energy-efficient measures and retrofits for the building envelopes (i.e., insulation), internal conditions (i.e., heat loads), and building service systems (i.e., HVAC);
- ✓
- Generating energy from renewable sources to meet the building energy needs, such as building-integrated photovoltaics (BIPVs), wind turbines, solar thermal sources (solar water heaters), and heat pumps.
In another paper, the authors extend the definition of a ZEB to cover the whole life cycle of the building [6], where the energy used in the building operations and embodied within its systems and components should be satisfied by the building’s renewable energy over its lifetime. To refer to the previous definition, the authors propose the term “life cycle zero energy building” (LC-ZEB), which has an annualized life cycle energy (ALCE) (the sum of the annualized embodied energy (AEE) and the annual energy use (AEU)) that is equal to zero.
Many countries around the world are trying to adopt ZEBs with different levels of commitment. USA, Canada, Japan, and the European Union member states are arguably early adopters of ZEB public policies. For instance, many European public policies support the nearly zero energy building (NZEB) objective (Directives 2010/31/EU and 2018/844/UE) and also support its evolution, such as the Horizon 2020 EU programs, which promote the positive energy building (PEB) model, where buildings produce more energy than their needs and can help fulfill the needs of other buildings that are connected to them [7]. In some other countries (considered developed), such as Australia, a lack of specific policy and support to nearly ZEBs is exhibited and better codes and targeted policies are required to achieve nearly ZEBs, especially with their existing high penetration of renewables [8]. In the case of developed countries, the adoption of ZEBs is still in its early stages. For example, China, as the most populous country and the biggest carbon emitter in the world, has a national standard to promote the development of nearly ZEBs, with 37 local governments having implemented ZEB policies and 13 local governments offering subsidies [5]. However, policies and regulations and a complete system that focuses on the whole life cycle of the ZEB should be implemented.
One of the most effective ways toward ZEBs is building retrofitting, which is defined as a set of physical and operational changes that will minimize a building’s energy consumption [1]. A retrofitting plan may include addition, deletion, removal, or replacement of one or more of a building’s envelope components or electrical equipment. Retrofitting measures may include adding wall insulation, changing electrical equipment to more energy-efficient ones, downsizing the HVAC system according to the cooling load, or investing in renewable energy technologies [9]. For instance, to help achieve net ZEBs for existing buildings, the authors in [10] used the Building Energy Code (BEC) software and Thailand energy code for a building’s retrofitting evaluation along with economic analysis. The authors reported an energy consumption reduction of almost 50%, a 4.36-year discounted payback period (DPP), and a 19% internal rate of return (IRR). In another example [11], the authors investigated the effect of additional internal insulation on energy consumption for heating and cooling in a residential building, where the global cost method and simple payback time were used to assess and compare the economic viability of the retrofit systems. The results show that though internal wall insulation can replace traditional external insulation, the simple payback time is unacceptably long.
To also help achieve net ZEBs, the authors in [12] developed a building retrofitting assessment and optimization model to minimize a retrofitted building’s carbon emissions, economic costs, and energy usage over its life cycle. A three-floor office building was used to show the utility of the approach, which mainly focused on passive options, including improving the envelope’s thermal properties and installing renewable energy devices. A different approach to minimizing energy consumption is to minimize emissions. The authors in the paper [13] conducted a life cycle assessment (LCA) that consisted of evaluating both embodied and operational emissions of different retrofitting scenarios. A case study (an office building in Norway) showed that the CO2-eq associated with the operational energy use was reduced by around 31–34% while the net total CO2-eq could be reduced by up to 52%.
In another study [14], the authors built a decision-making model for optimum energy retrofitting strategies in residential buildings and conducted a case study where four retrofitting plans with different savings-to-investment ratio and payback periods were generated. However, selecting the optimal retrofitting plan is challenging because of many constraints, including budget, comfort requirements (heating and cooling loads), economic benefits (return on investment, payback period, savings-to-investment ratio, etc.), energy savings, and government requirements. In addition, applying an energy efficiency program outside its country of origin proved to be difficult because of the variations in climate, geography, economics, and culture between the countries. For example, the efficacy of the green building rating tools is controversial because it emphasizes the ecological aspect and partly neglects the economic, social, and cultural aspects [15,16]. Consequently, there is a need to develop a framework that decision makers around the world (mainly residential and commercial building owners) can follow in order to achieve the best results out of a retrofitting plan. The motivations behind building such a framework are as follows:
- ✓
- There is no such framework that takes the decision maker through the whole process of developing a retrofitting plan.
- ✓
- Some research papers focus on one type of retrofitting measure and ignore the others, for example, considering the building envelope and ignoring electrical and mechanical equipment [17].
- ✓
- ✓
- The interdependence between the retrofitting strategies should be considered. For instance, changing a building’s envelope (i.e., wall insulation) will result in a need to change its HVAC system.
- ✓
- Generating many retrofitting plans without a ranking process makes it difficult for the decision maker to select the one that best reflects their expectations from the retrofitting project [14].
The primary objective of this study is to bridge the gap in the literature by developing a framework that includes the following:
- ✓
- Collecting data:
- Retrofitting measures that include building envelope measures as well as lighting and electrical equipment;
- Life cycle cost (LCC): To calculate the LCC, all cost components of the retrofitting measures, including investment, operation, maintenance, replacement, and salvage, will be considered.
- ✓
- Building a mathematical model:
- Definition of the decision variables and parameters;
- Definition of the constraints that will consider the thermal and visual comfort, as well as the interdependence between the HVAC and the building envelope.
- ✓
- Building energy consumption forecasting: Developing the simulation model for the building and running simulations for different building envelopes.
- ✓
- Generating different retrofitting plans: For each retrofitting plan, calculating the energy savings as well as the return on investment and the payback period.
- ✓
- Selecting a retrofitting plan: Finding the best retrofitting plan that meets the decision maker objectives using the analytic hierarchy process (AHP).
The rest of the paper is structured as follows:
- Framework: The different components of the framework as well as the case study are presented.
- Results and Discussion: In this part, different retrofitting scenarios, along with their energy savings and financial indicators, are discussed. After introducing the different retrofitting plans, the AHP will be applied to select the best one according to the decision maker objectives.
At the end, conclusions about the developed framework and the case study are presented, as well as recommendations for future studies.
2. Framework
2.1. Data Collection
2.1.1. Energy Retrofitting Strategies
The general description of retrofitting is “the strengthening, upgrading and adding extra equipment to a building” [19]. For a more specific definition, energy retrofitting is the combination of energy-saving measures that are added to the building to make operational and physical changes, which improve the performance by reducing energy consumption. Several energy retrofitting measures can improve building performance at different levels. These measures can be categorized into four groups:
- Energy-efficient equipment measures;
- Heating and cooling demand reduction measures;
- Renewable energy technologies;
- Human behavior.
The selection of multiple retrofitting measures is called a retrofitting strategy or a retrofitting plan [20]. One of the most informative sources where decision makers can obtain different retrofitting measures is international energy retrofitting programs for existing buildings, for instance, LEED v4.1, which is developed by the U.S. Green Building Council [21]; BREEAM [22]; and ENERGY STAR, which is backed by the U.S. Environmental Protection Agency (EPA) [23]. In addition, various types of energy saving measure are identified from books, papers, market experts, architects, contractors, etc.
- ✓
- Energy-efficient equipment measures: Used to improve the energy performance of the building by reducing the energy consumption of the electrical and mechanical equipment. These measures include but are not limited to:
- The replacement of the fuel source for heating and cooling;
- The replacement of lights with energy-efficient ones;
- The use of economy air recycling ductwork;
- The upgrade of the HVAC system;
- The replacement of the electrical equipment with energy-efficient ones.
- ✓
- Heating and cooling demand reduction measures: Used to improve the building envelope to reduce cooling and heating systems’ energy consumption. The components of the building envelope are the roof, walls, windows, and doors, which are considered as thermal barriers between interior and exterior environments. These measures include but are not limited to:
- Thermal insulation for walls and roofs;
- The use of energy-efficient windows, such as a low-E window and double-glazed and triple-glazed windows;
- Sealing of cracks around windows and doors;
- Planting on the roof;
- The use of external and internal shading for fenestrations.
- ✓
- Renewable energy technologies: Used to produce heat and electricity from renewable sources. The renewable energy technologies include the following:
- Solar thermal system;
- Solar photovoltaic/thermal system;
- Geothermal power system;
- Wind power systems.
- ✓
- Human behavior measures: Used to monitor and control the use of energy. This might include the use of energy metering, monitoring, and control units, for instance, installing a programable thermostat to control heating and cooling.
2.1.2. Life Cycle Cost
It is essential to evaluate the economic performance of energy retrofit measures to increase the financial benefits. Life cycle cost (LCC), which is the sum of all costs incurred during the lifetime of an item, allows for the decision maker to compare between different retrofits measures. LCC provides comparisons between the energy retrofit measures that have the same performance but have different initial and operation costs. The primary objective to use LCC analysis is to improve risk management by assessing future expenses to allocate the budget. LCC analysis can be applied as a method to enhance the decision-making tools by providing more sustainable solutions. In the following the different components of LCC will be presented [25].
- Initial Investment Cost
The initial investment cost is the capital required to implement the retrofitting. It includes all the costs of planning, architectural design, structural design, and construction. The initial cost also comprises all the costs of paying for the equipment, such as the purchase price and taxes.
- b.
- Operation and Maintenance Costs
Operation costs include all annual expenses associated with the operation of the building, such as cleaning, electricity, gas and water, administration, property management, and maintenance costs (repair, replacement, and adaptation of the asset).
- c.
- End-of-Life Costs
These include the cost of recycling, decommissioning, demolition, and disposal inspection’s residual value and salvage value.
- d.
- LCC Calculation
LCC is the discounted present value of all future cashflows incurred during the study period [26]. According to the North American leading construction and building cost estimation software and database RSMeans, LCC Equation (1) is as follows [27]:
where, LCC is the total life cycle cost in present value (PV) dollars of a given alternative; I is the initial cost; Repl is the replacement costs in the present value; Res is the residual value (resale value and salvage value); E is the energy costs in the present value; W is the total water costs in the present value; OM&R is total costs of the operation, maintenance, and repair of the present value; and O is the total other costs, such as contract administration costs and salaries, in the present value.
LCC = I + Repl − Res + E + W + OM&R + O
For each year, cash flows (CFs) are calculated and then multiplied by the present value factor (Equation (2)) to convert their values to present values.
where i equals the discount rate and k is the year in which the cashflow is incurred.
PV Factor (P/F, i%, k) = 1/(1 + i)k
The sum of the CFs along the study period is the LCC of the alternative [25].
Several parameters must be identified before calculating the LCC, such as base date, sunk cost, study period, inflation and interest or discount rate, and salvage value. To compare the different retrofitting plans, the same mentioned parameters must be used [28].
- ✓
- Base date: The point in time at which all the retrofitting plan cashflows are discounted. For building retrofitting projects, the base date is when retrofitting plans are generated.
- ✓
- Sunk cost: “[A] cost that has occurred in the past and has no relevance to estimates of future costs and revenues related to the alternatives” [25]. In other words, it should not be included in the LCC calculation. For example, the purchase price of the existing HVAC system is considered as a sunk cost.
- ✓
- Study period: The length of time from the base date to the end date of the economic analysis. For the different retrofitting plans, the study period should be the same. If the retrofitting plans have different life spans, the study period should be equal to the most extended lifespan of the alternative [28].
- ✓
- Discount rate: The factor at which all future (either positive or negative) cashflows are converted to the present value. For the retrofitting project, the discount rate depends on the target rate that building owners or operators are expecting to achieve from implementing the retrofitting measures. This target is known as the minimum attractive rate of return (MARR) [25].
- ✓
- Salvage value: The value of the asset at the time of its disposal or the end of its lifespan and utility. The salvage value is the future value occurring at the end of the asset’s life. The salvage value is calculated by subtracting depreciation (loss in value) from the asset initial value.
- ✓
- Inflation rate: Defined as the average increase in prices of goods and services. For example, inflation should be reflected in future costs, such as purchasing an asset or conducting a maintenance, as prices increase with time.
- ✓
- Energy cost and energy tariffs: The electricity rate (per Kwh) for different types of consumers (industrial, residential, agriculture, etc.) and different consumption levels. For example, the Saudi electricity tariff for residential building is equal to SR 0.18/Kwh and SR 0.3/Kwh for consumption ranges equal to 1–6000 and >6000 Kwh, respectively [29].
2.2. Comparison of Alternatives
There are many indicators that can help the decision maker select the best retrofitting plan, including but not limited to equivalent annual cost, savings-to-investment ratio, net savings, and annual return on investment.
- Equivalent Annual Cost (EAC)
The annual equivalent cost is the LCC divided into equivalent annual cash flows along the study period. This comparison method is recommended when alternatives do not have the same life spans. The EAC can be calculated using the following formula [25]:
A = P[i(1 + i)N/(1 + i)N − 1] = P(A/P, i%, N)
- b.
- Savings-to-Investment Ratio (SIR)
SIR is the ratio of operational savings during the project life to the capital investment costs. For retrofitting plans, this will be the ratio of energy savings to the retrofitting budget, which should be greater than 1 and the higher the better.
- c.
- Net Savings (NS)
NS is the net present value of financial benefits that the retrofitting plan will achieve. It is calculated by subtracting the retrofitting-plan-expected LCC from the current expected LCC (without retrofitting). The NS should be greater than zero and the higher the better.
- d.
- Payback Periods
The payback period is the number of years required for cash inflows to just equal cash outflows. In other words, it is the length of time after which the initial investment is obtained and the shorter the better.
- e.
- Return on Investment
It is the interest rate at which the positive cashflows should be discounted to equal the investment [25]. For the retrofitting plans, the positive cashflows are the energy savings and the investment is the retrofitting plan budget. ROI can be calculated using the following formula, where i% is the unknown ROI:
2.3. Mathematical Model
Although several research papers suggest decision-making models to select the optimum energy retrofitting strategy, the literature shows many limitations in terms of ignoring some cost components or constraints.
For instance, some models ignored the maintenance cost [30], which is a significant operational cost and a component of the LCC. In another study [8], the thermal comfort requirement was ignored. Moreover, many studies consider building envelope measures and neglect electrical and mechanical equipment measures or they neglect the interdependence between them [31], for instance, the effect of the building envelope measures on the adequate HVAC system.
As a result, and in order to achieve a successful energy retrofitting plan, the suggested model should:
- ✓
- Consider all possible measures that are available and within the reach of the decision maker;
- ✓
- Include the comfort constraints such as thermal comfort and visual comfort;
- ✓
- Cover the interdependence between the measures.
- (a)
- Objective Function
While there are multiple options for the objective function, minimizing the life cycle cost is a widely used objective function in many papers as it calculates the overall costs of the retrofitting project or equipment over its lifetime, does not ignore any incurred costs in the future, and ensures the sustainability of the retrofitting project.
For the mathematical model, the energy retrofitting measures are collected and then the life cycle cost is determined for each retrofitting measure. Then, each retrofitting measure will be represented by a binary 0–1 decision variable as follows:
where i represents the retrofitting measure type and j represents the different available options within that type i.
Xij = {1, implement energy retrofitting measure ij; 0, otherwise}
For example,
where i = 1 represents the “replace electrical equipment” retrofitting measure type and j denotes the different options of electrical equipment available.
X1j = {1, Replace the electrical equipment j = (1, 2, 3, …, J); 0, otherwise}
Using the binary decision variables, the resulting objective function is as follows:
- (b)
- Constraints
- ✓
- Thermal Comfort
According to ASHRAE Standard 55, Thermal Environmental Conditions for Human Occupancy, “Thermal comfort is the condition of mind that expresses satisfaction with the thermal environment” [32]. As the downsizing or change of the HVAC system is one of the retrofitting measures, the optimal one should satisfy the building’s cooling and heating loads to maintain the required thermal comfort.
- Cooling Load
Cooling load is defined as “the amount of heat that would need to be removed from the building” while the capacity of the HVAC system is defined as “the ability of the equipment to remove the heat.” In the HVAC industry, the British thermal unit (Btu) and ton refrigeration (TR) are the units used to measure the quantity of heat that should be removed from the space [22]. The cooling load should be calculated in peak summer time when the heat reaches its highest levels in order to select an adequate HVAC system.
The cooling load is the sum of the total sensible loads and latent loads.
- -
- Sensible load is the solar heat gain from the area of exposure, transmission gain (solar radiation through transparent surfaces, such as windows; heat conduction through exterior walls and roofs; and heat conduction through interior partitions, ceilings, and floors), outside air heat gain (load as a result of ventilation and infiltration of outdoor air), and internal load.
- -
- Latent load includes people, appliances, and outside air load.
Formulas on how to calculate the cooling load can be found in [14].
To add the cooling load constraint to the mathematical model, the following constraint can be added:
where j represents the different AC types available.
- Heating Load
Heating load is defined as the amount of heat that would need to be added to a building. Heating load calculations should be performed in the peak winter when temperatures are at their lowest levels. The estimate of the heating load is the sum of the heat loss transmission (through fenestration, opaque walls, roof, and floor) and the outside air heat losses.
Formulas on how to calculate the cooling load can be found in [14].
- ✓
- Visual Comfort Analysis
Since lighting replacement is one of the energy-saving measures, the illumination level should be taken into consideration when retrofitting a building. Visual comfort can be achieved by providing the minimum level of illuminance (density of light in lux or foot-candle (FC)) required by the building [33]. The Illuminating Engineering Society (IES), formerly the IES of North America (IESNA), provides the recommended levels of illumination for different spaces (presented in Table 1) [34].
The illumination is determined by dividing the lumen (light output) of lamps over the area of space in square meters or feet [33]. When replacing old lamps with energy-efficient ones, the illumination level and the required number of lamps should be taken into consideration.
Examples of lamp types, along with their power and lumens, are presented in Table 2.
The following formula is used to calculate the illuminance [34]:
Lux(fc) = Lumens/Area(m2)
To calculate the required number of lighting fixtures needed for a specific area, the following equation will be used [34]:
To add the illumination constraint to the mathematical model, the following constraint can be added:
where j represents the different lamp types available [33].
2.4. Building Energy Forecasting
Building energy consumption forecasting is one of the most important steps for retrofitting projects as it helps the decision maker forecast a building’s energy consumption as well as costs incurred in the future by the building. However, it is a challenging task as it is affected by many factors, including ambient weather conditions, building structure and characteristics, lighting and HVAC systems, occupancy, and occupant behavior. While building energy modeling and simulation is by far the most-used method for building energy consumption forecasting, other methods, including artificial intelligence, are getting more and more popular. For example, to forecast the energy consumption without using building energy modeling (BEM) that enable designers to test and simulate only a limited number of design scenarios because of its extensive calculations and long times, the authors in [35] introduced artificial neural networks (ANNs) to forecast the energy consumption of a building using its descriptive data. The authors reported high accuracy during testing, with errors below 5% for over 99.5% of the testing dataset, which confirms that ANNs are a reliable substitute for BEM during ZEB design and energy consumption forecasting.
In another paper, the research study [36] used artificial neural networks and support vector machines to forecast heating and cooling demands. Results showed that machine-learning-based methods offer accurate and fast predictions and can well substitute the time consuming multi zone dynamic simulation models that heavily depend on several parameters and user calibration.
2.5. Comparisons of Scenarios
Because of the many requirements and complexity of decision making when picking the right retrofitting plan, multi-criteria decision making is needed. In fact, the decision maker might have different objectives in terms of LCC, payback period, return on investment, energy savings, etc., which vary among the different scenarios. This will force the decision maker to prioritize and maybe ignore some of the objectives in order to meet their preferences. Many multi-criteria decision-making methods exist in the literature, including TOPSIS, VIKOR, COPRAS, PROMETHEE II. [37], and the analytic hierarchy process (AHP) [38]. These methods help decision makers rank alternatives based on the developed objectives.
In this research paper, the decision maker is the residential or commercial building owner or operator, the retrofitting plans are the alternatives, and the objectives might be high ROI, high energy savings, minimum investment, minimum energy consumption, etc.
In the developed case study at the end of the paper, the AHP will be used for the ranking of the generated scenarios. First, for each objective i, a weight wi is generated using the pairwise comparison matrix and consistency is checked. Second, the score of each alternative according to each objective is obtained. Finally, the overall score of each alternative is obtained by summing the alternative relative score for each objective multiplied by the objective weight [39]. While there are multiple MCDM methods to rank alternatives, the AHP is chosen because of its simplicity, ability to cover tangible and intangible objectives, and the similarity of the problem to the ones covered in the literature of the building, energy, and construction areas. For instance, in the research conducted by [40], the authors integrated the (SWOT) analysis, the AHP, and (F-TOPSIS) to evaluate strategies for Pakistan’s sustainable energy planning. The SWOT analysis was used to define the factors and sub-factors for sustainable energy planning. Then, the AHP was employed to determine the weights of each factor and sub-factor. Finally, F-TOPSIS was used to rank the sustainable energy strategies. In another study [3], the fuzzy AHP was used to evaluate renewables (i.e., solar, wind, and biomass) according to economic, environmental, technical, and socio-political criteria. The study results show that wind is the most preferable renewable energy source while economic and socio-political are the criteria with the highest weights. More AHP applications in construction management field can be found in the review paper [41], where the authors found that sustainable construction is one of the most popular AHP applications in the area of construction management. The study also suggests that because of the high level of consistency, software availability, and simplicity, AHP can be used alone or integrated with other tools to optimize construction decision making.
3. Framework Application
3.1. Case Study
To show the utility of the framework, a case study pertaining to a residential building in Riyadh, KSA, was conducted. In fact, the Saudi residential market witnessed a significant price increase in the electricity prices starting in 2018 [42], with prices increasing by 260% and 500% for a consumption range of 1–6000 and >6000 Kwh, respectively. The skyrocketed electricity prices pushed residential business owners to rethink their energy consumption and adopt energy retrofitting plans.
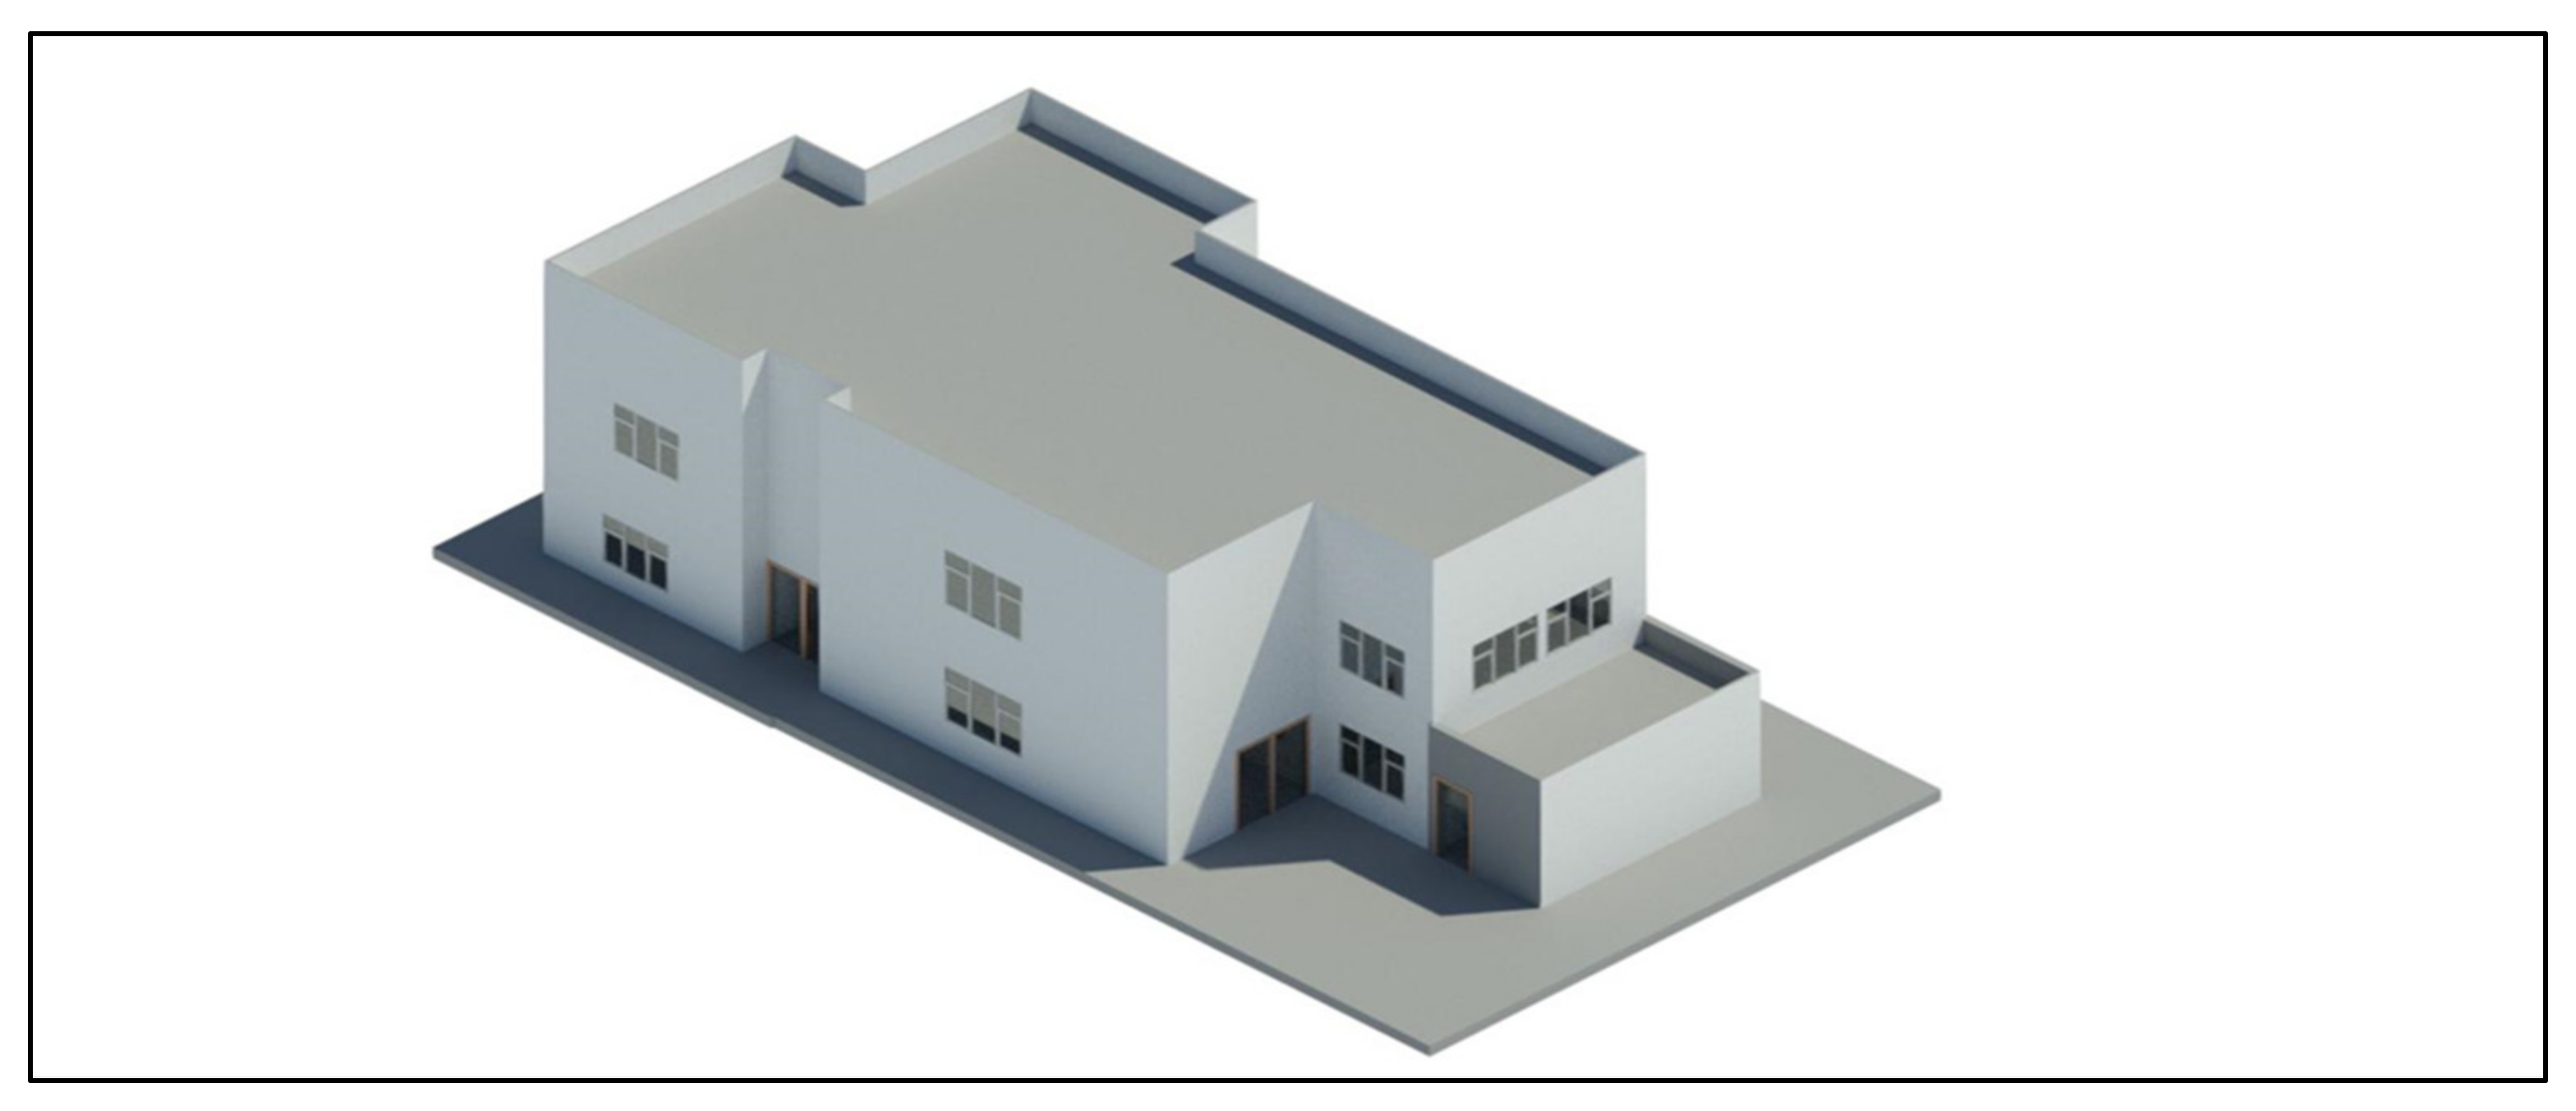
The case study was conducted based on a study period of 20 years, a discount rate of 5%, and covered a residential building (villa), depicted in Figure 1. To construct the 3D model of the residential building and to simulate its energy consumption, BIM Revit 2020 software was used. The residential building is located in the south of Riyadh city, with the following characteristics:
- ➢
- The land area is 350 m2 (3767 ft2).
- ➢
- The total floor area inside the building envelop is 216 m2 (2325 ft2).
- ➢
- The height of the construction area reaches 10 m (107 feet).
- ➢
- The villa is north oriented.
- ➢
- The thickness of the exterior wall is 30 cm (12 inches), and it is built of double blocks walls.
- ➢
- The gap between the double block wall is filled with 5 cm (2 inches) extruded polystyrene boards (XPS).
- ➢
- The roof is insulated with 3 cm XPS boards.
- ➢
- The exterior doors are made of iron that has a thickness of 3 cm (1.2 inches).
- ➢
- For the exterior fenestration, double glazing aluminum windows are used.
Figure 1.
Three-dimensional representation of the residential building.

Despite the high quality of the building envelope, energy consumption is significantly high. The building consumes around 5000 Kwh a month of electrical energy in the summer season. This amount is considered high and heavily affects the electricity bill.
To generate the different retrofitting plans, retrofitting measures were collected from international energy-efficiency programs, such as LEED v4, BREEAM, the Saudi electricity company, and local Saudi contractors and architects.
For each retrofitting measure, the components needed to calculate the LCC (purchase cost, maintenance cost, salvage value, etc.) were determined from local Saudi companies, such as Nefal AC Company, Extra, Sheta and Saif, Electro, Almanea, and Saco. The electricity cost, which heavily affects the operational cost, corresponds to the Saudi electricity company tariffs [42]. Since the case study was conducted based on a horizon of 20 years, the inflation rate was considered to calculate the operation, maintenance, and repair costs. According to data from the Saudi Arabian Monetary Authority [43], the inflation rate was within 2–3% in the preceding 10 years, and this rate was considered for all subsequent years in the study period.
Table 3 shows the LCC calculation, along with yearly cash flows, for the equipment NIKAI Dryer for a discount rate equal to 5%.
3.2. Results and Discussions
- a.
- Generated Retrofitting Plans
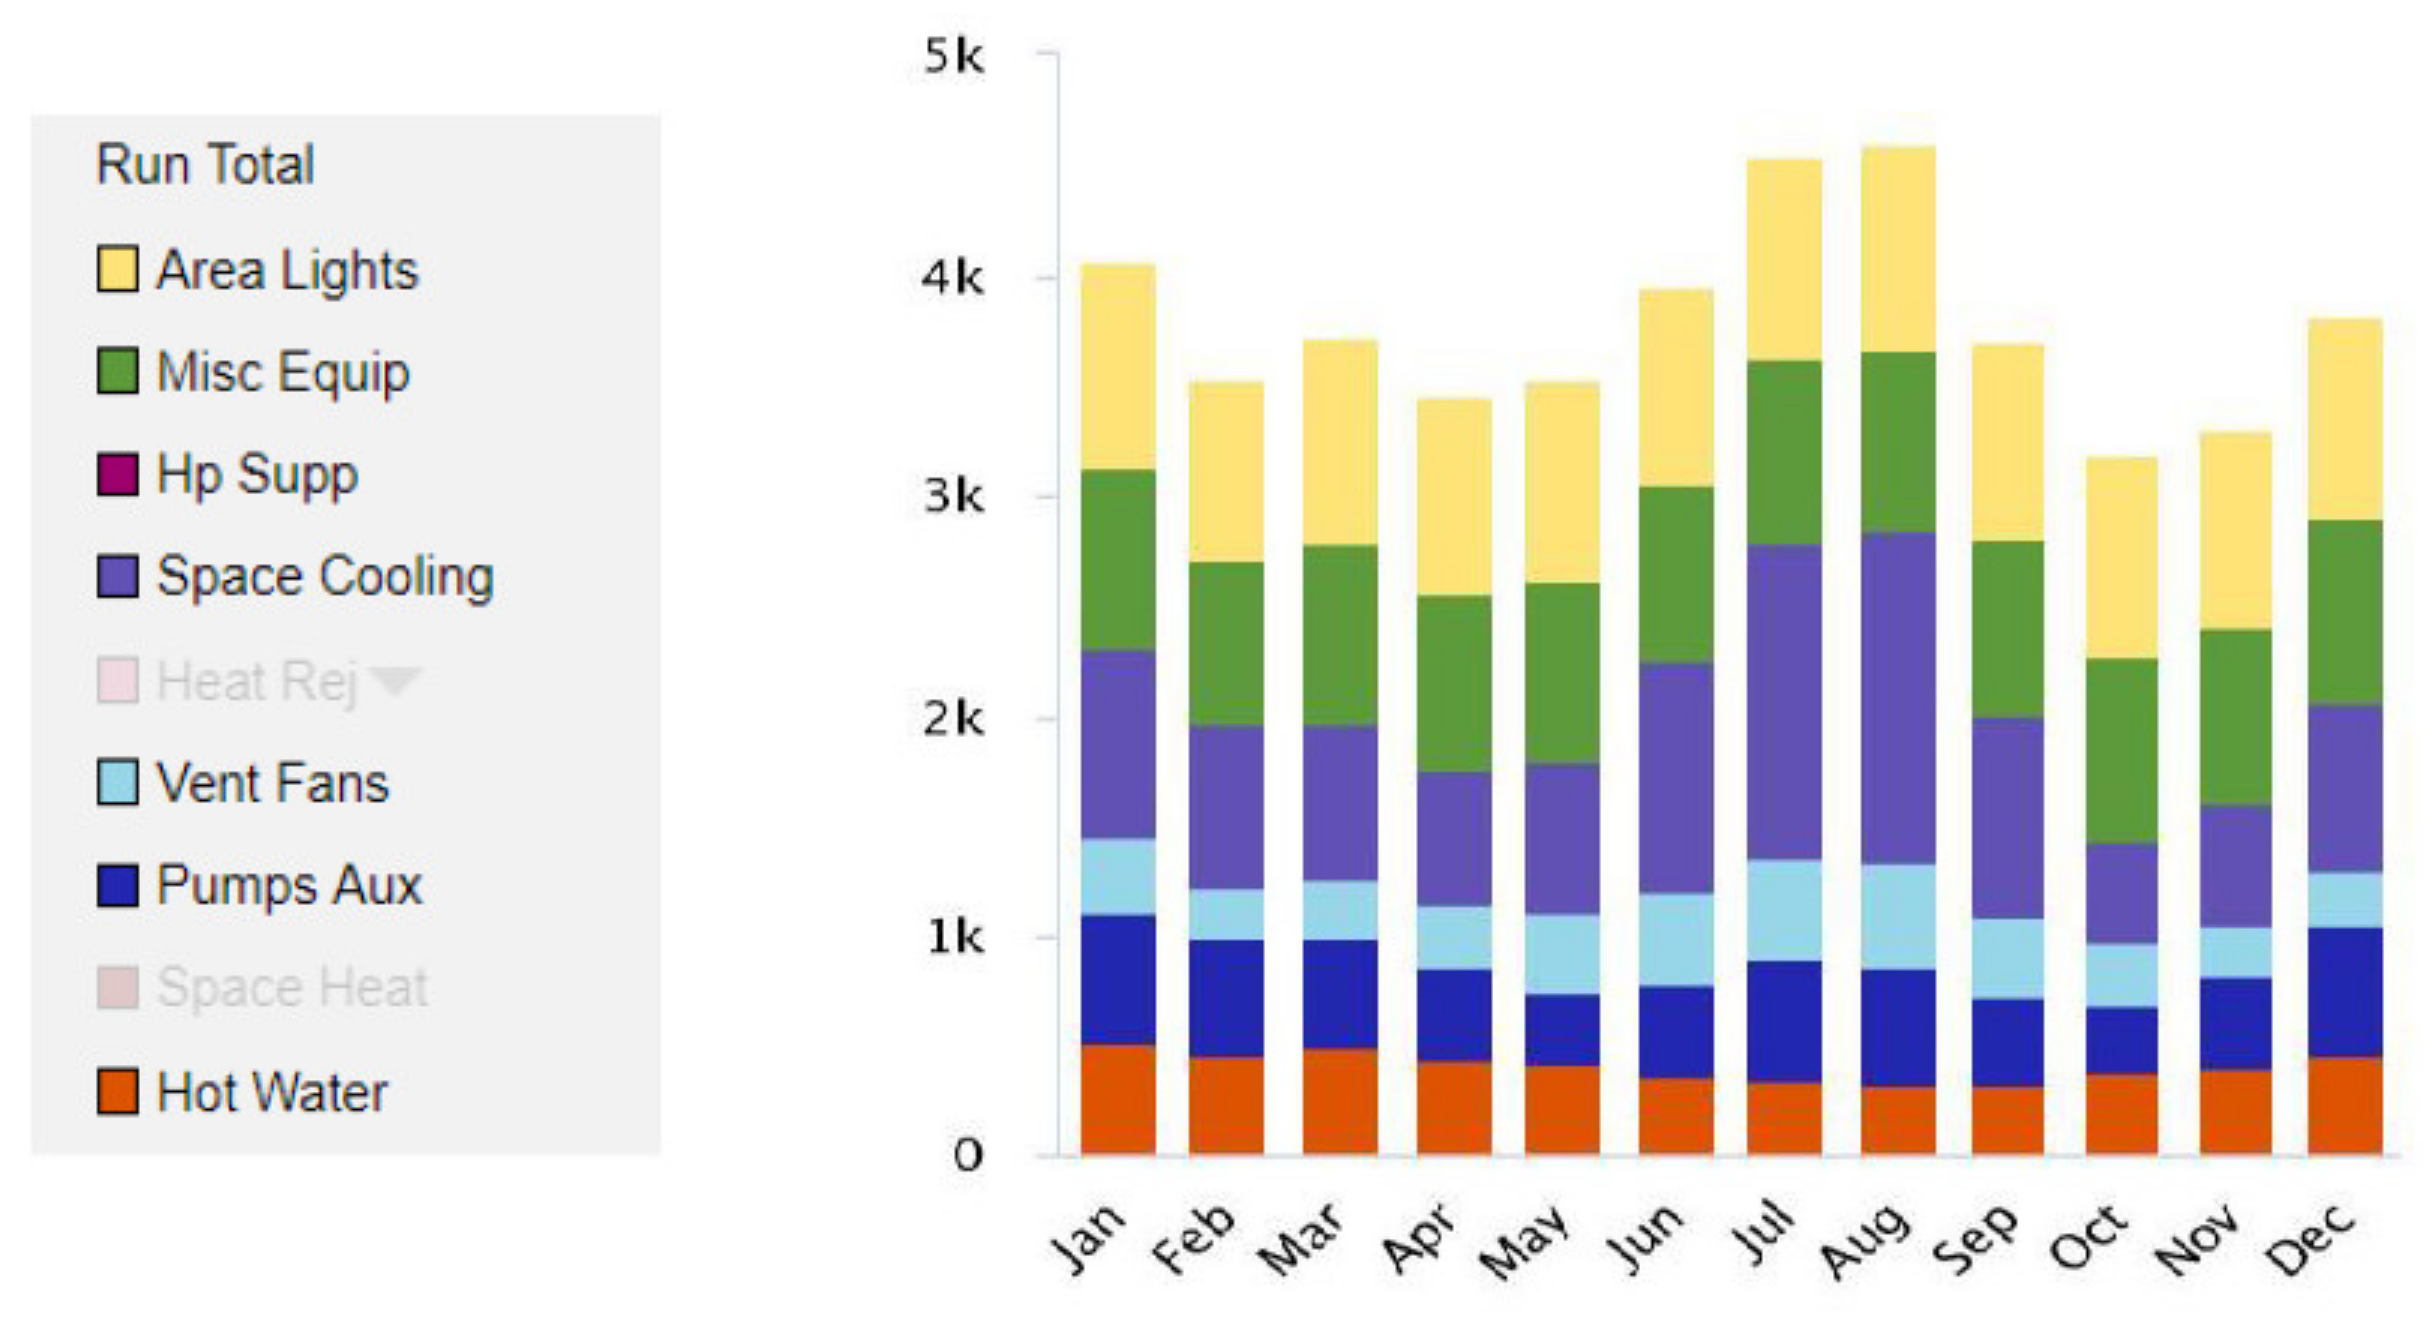
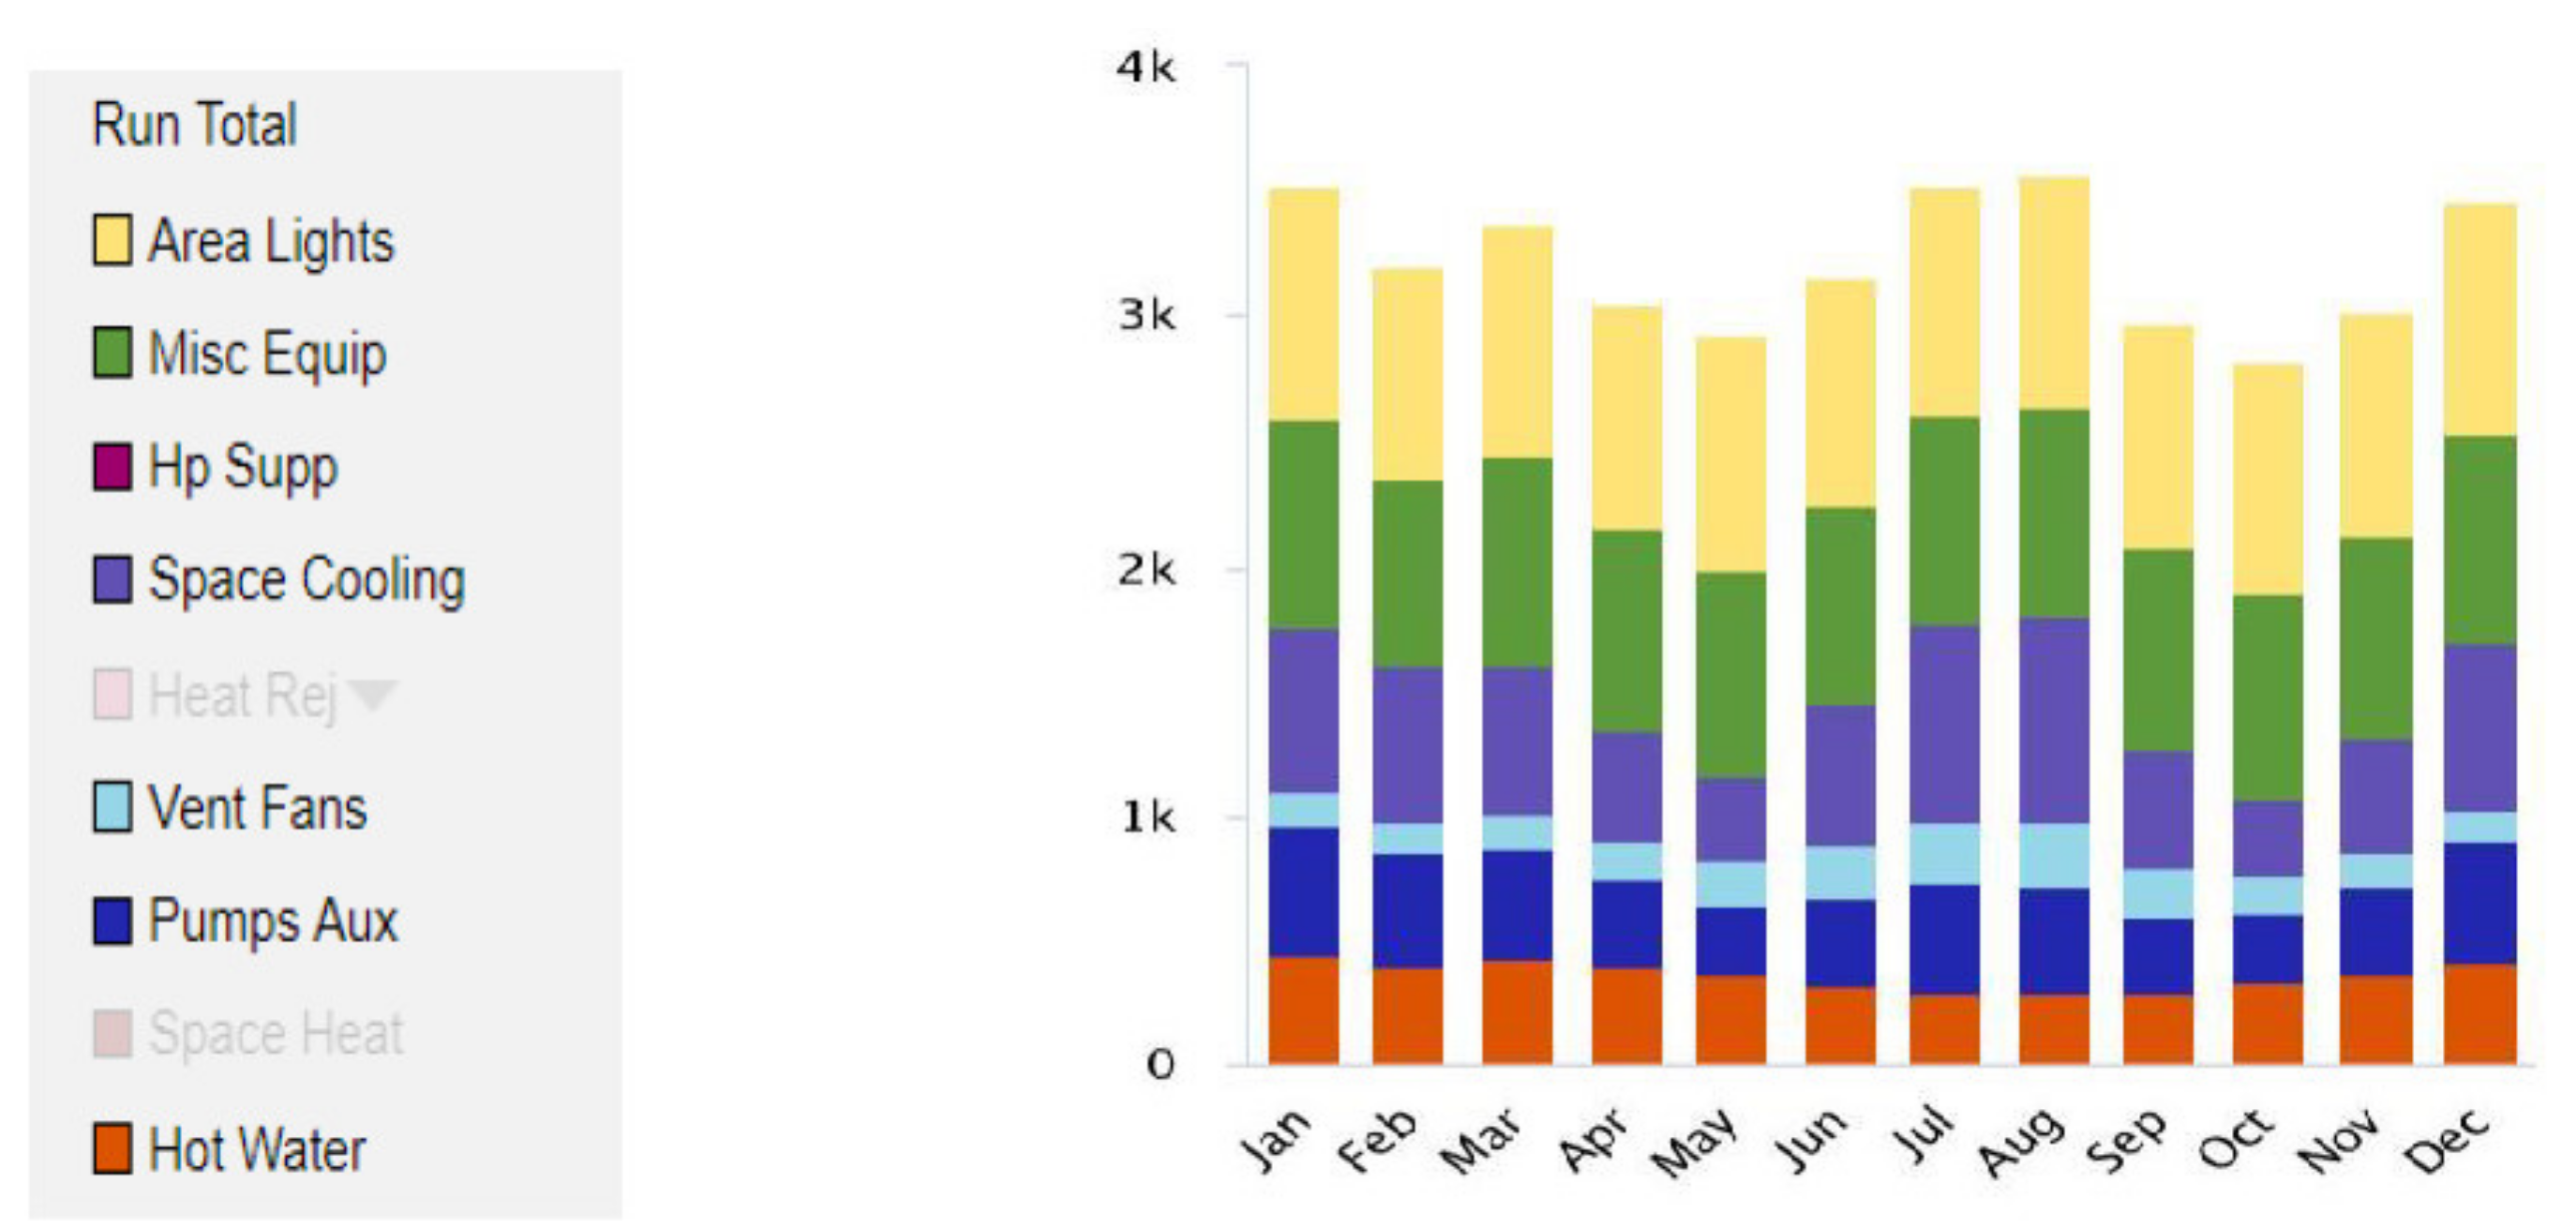
BIM Revit 2020 software was used to construct the 3D model of the building, and the current energy consumption was simulated (Figure 2). The cooling requirement was retrieved from the software after estimating the annual energy consumption after each retrofitting plan (Figure 3). Binary Integer Linear Programming was used to create the model and suggested that for the energy retrofitting strategy, the integer variables should be restricted to 0 or 1. Cooling load parameters and the different alternatives for building retrofitting measures were added to the thermal load constraint to select those corresponding to the optimum air conditioner capacity. Additionally, the needed lamps to reach the required illumination level for each space was added to the illumination constraint.
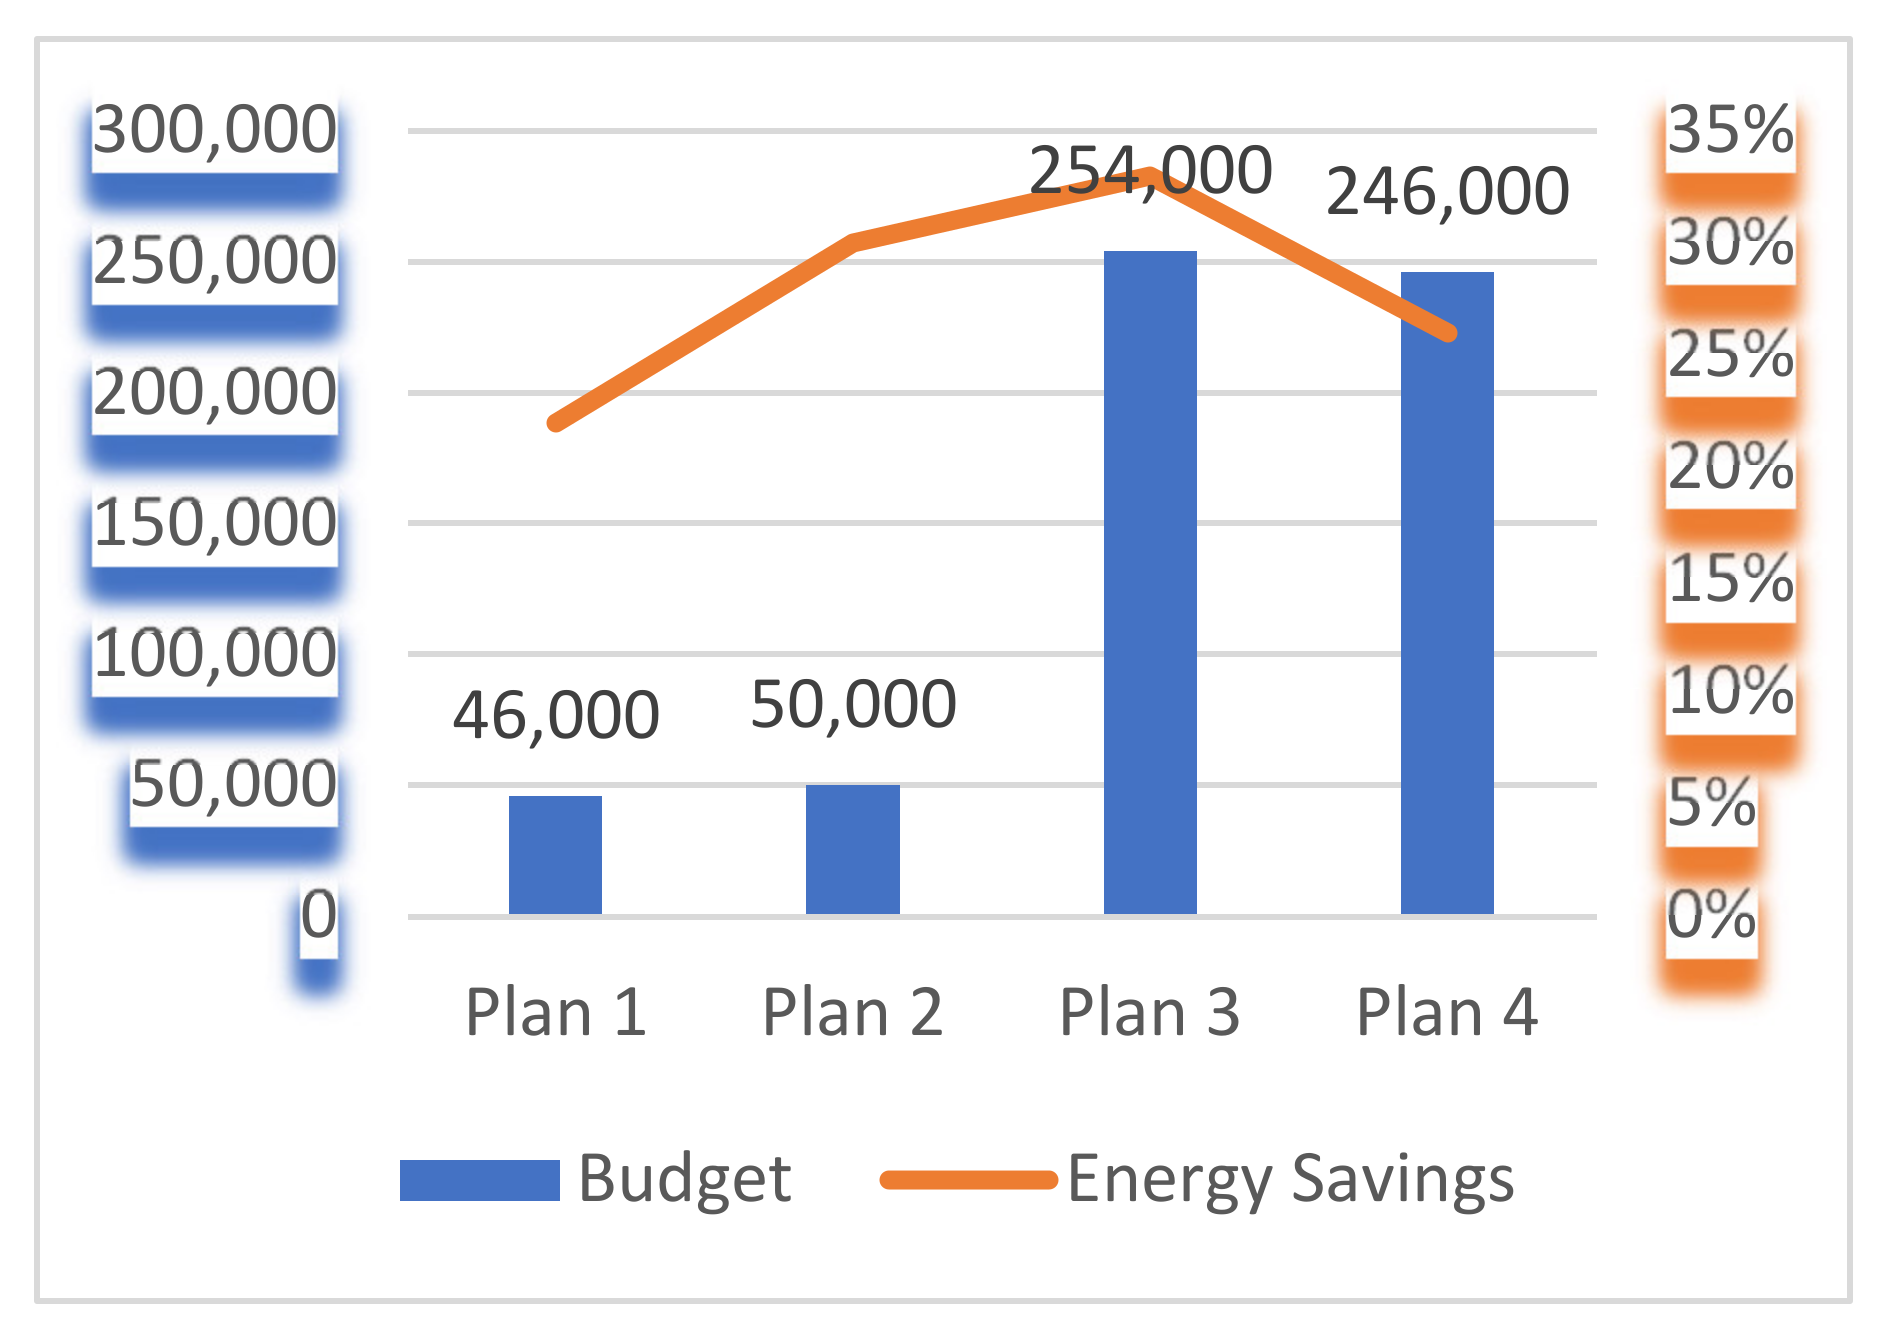
Table 4 presents different retrofitting plans, along with their retrofitting measures, budgets, energy savings, payback period, and return on investment. Retrofitting plans 1 and 2 focus on the electrical equipment, while retrofitting plans 3 and 4 include both building envelope and electrical equipment retrofitting measures. For example, the energy retrofitting plan 3, which includes both building envelope and electrical equipment measures, requires a budget of SR 254,000 (USD 68,000), decreases energy consumption by 33%, and has a payback period of 10.5 years and a ROI equal to 17.3%. The depicted scenarios show that some of the retrofitting measures are adopted in multiple scenarios. This is due to the fact that in every scenario, the most efficient measures are adopted and others are added when the budget increases. For instance, retrofitting plan 3 (with a budget of SR 254,000) adopts the same electrical equipment retrofitting measures as those existing in retrofitting plan 1 (with a budget of SR 50,000).
- b.
- Sensitivity Analysis
The sensitivity analysis was conducted to investigate the effect of the budget on the energy savings, the payback period, and the ROI.
- ✓
- Energy Savings
Figure 4 indicates that the allocation of sufficient budget improves energy savings; however, some energy retrofitting measures may have a limited impact on energy savings while requiring higher investments. For example, the energy savings for retrofitting plan 1, corresponding to the budged of SR 46,000, is equal to 22%, while retrofitting plan 4 energy savings is equal to 26% for a budget of SR 246,000. In fact, for this case study, electrical-equipment-only retrofitting measures (plan 1 and plan 2) lead to greater energy savings than building envelope retrofitting measures (plan 3 and plan 4) while requiring a smaller budget.
- ✓
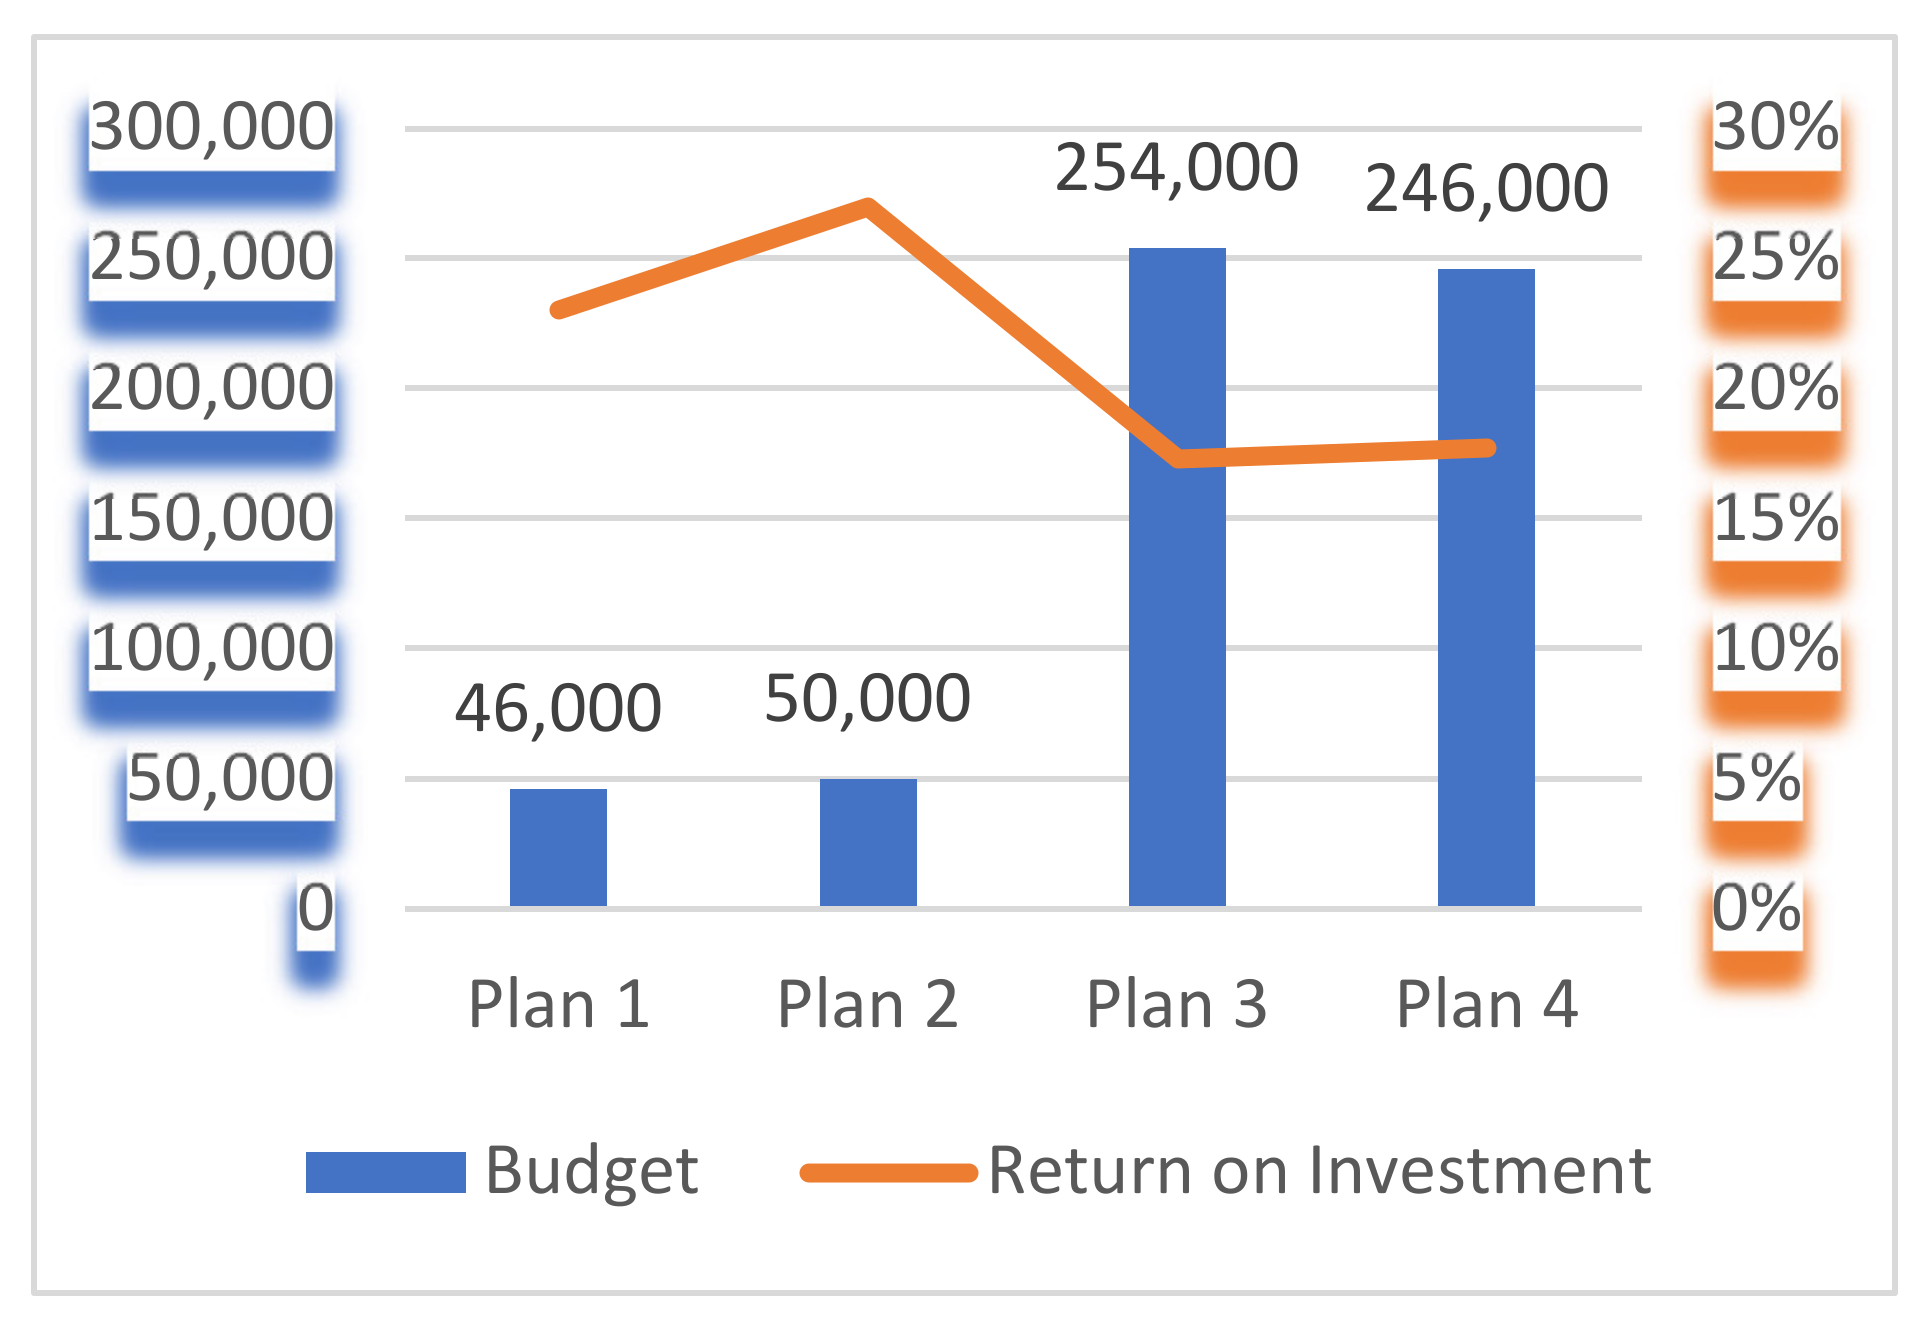
- Return on Investment
In terms of return on investment (Figure 5), electrical-equipment-only retrofitting plans (plan 1 and plan 2) provide an ROI of more than 20% while the retrofitting plans that combine both building envelope and electrical equipment retrofitting measures (plan 3 and plan 4) provide a return on investment of around 17%. From an investment point of view, plans 1 and 2 seem to be more attractive as they require less than a quarter of the budget for plans 1 and 2 while offering a significant and more competitive ROI.
- ✓
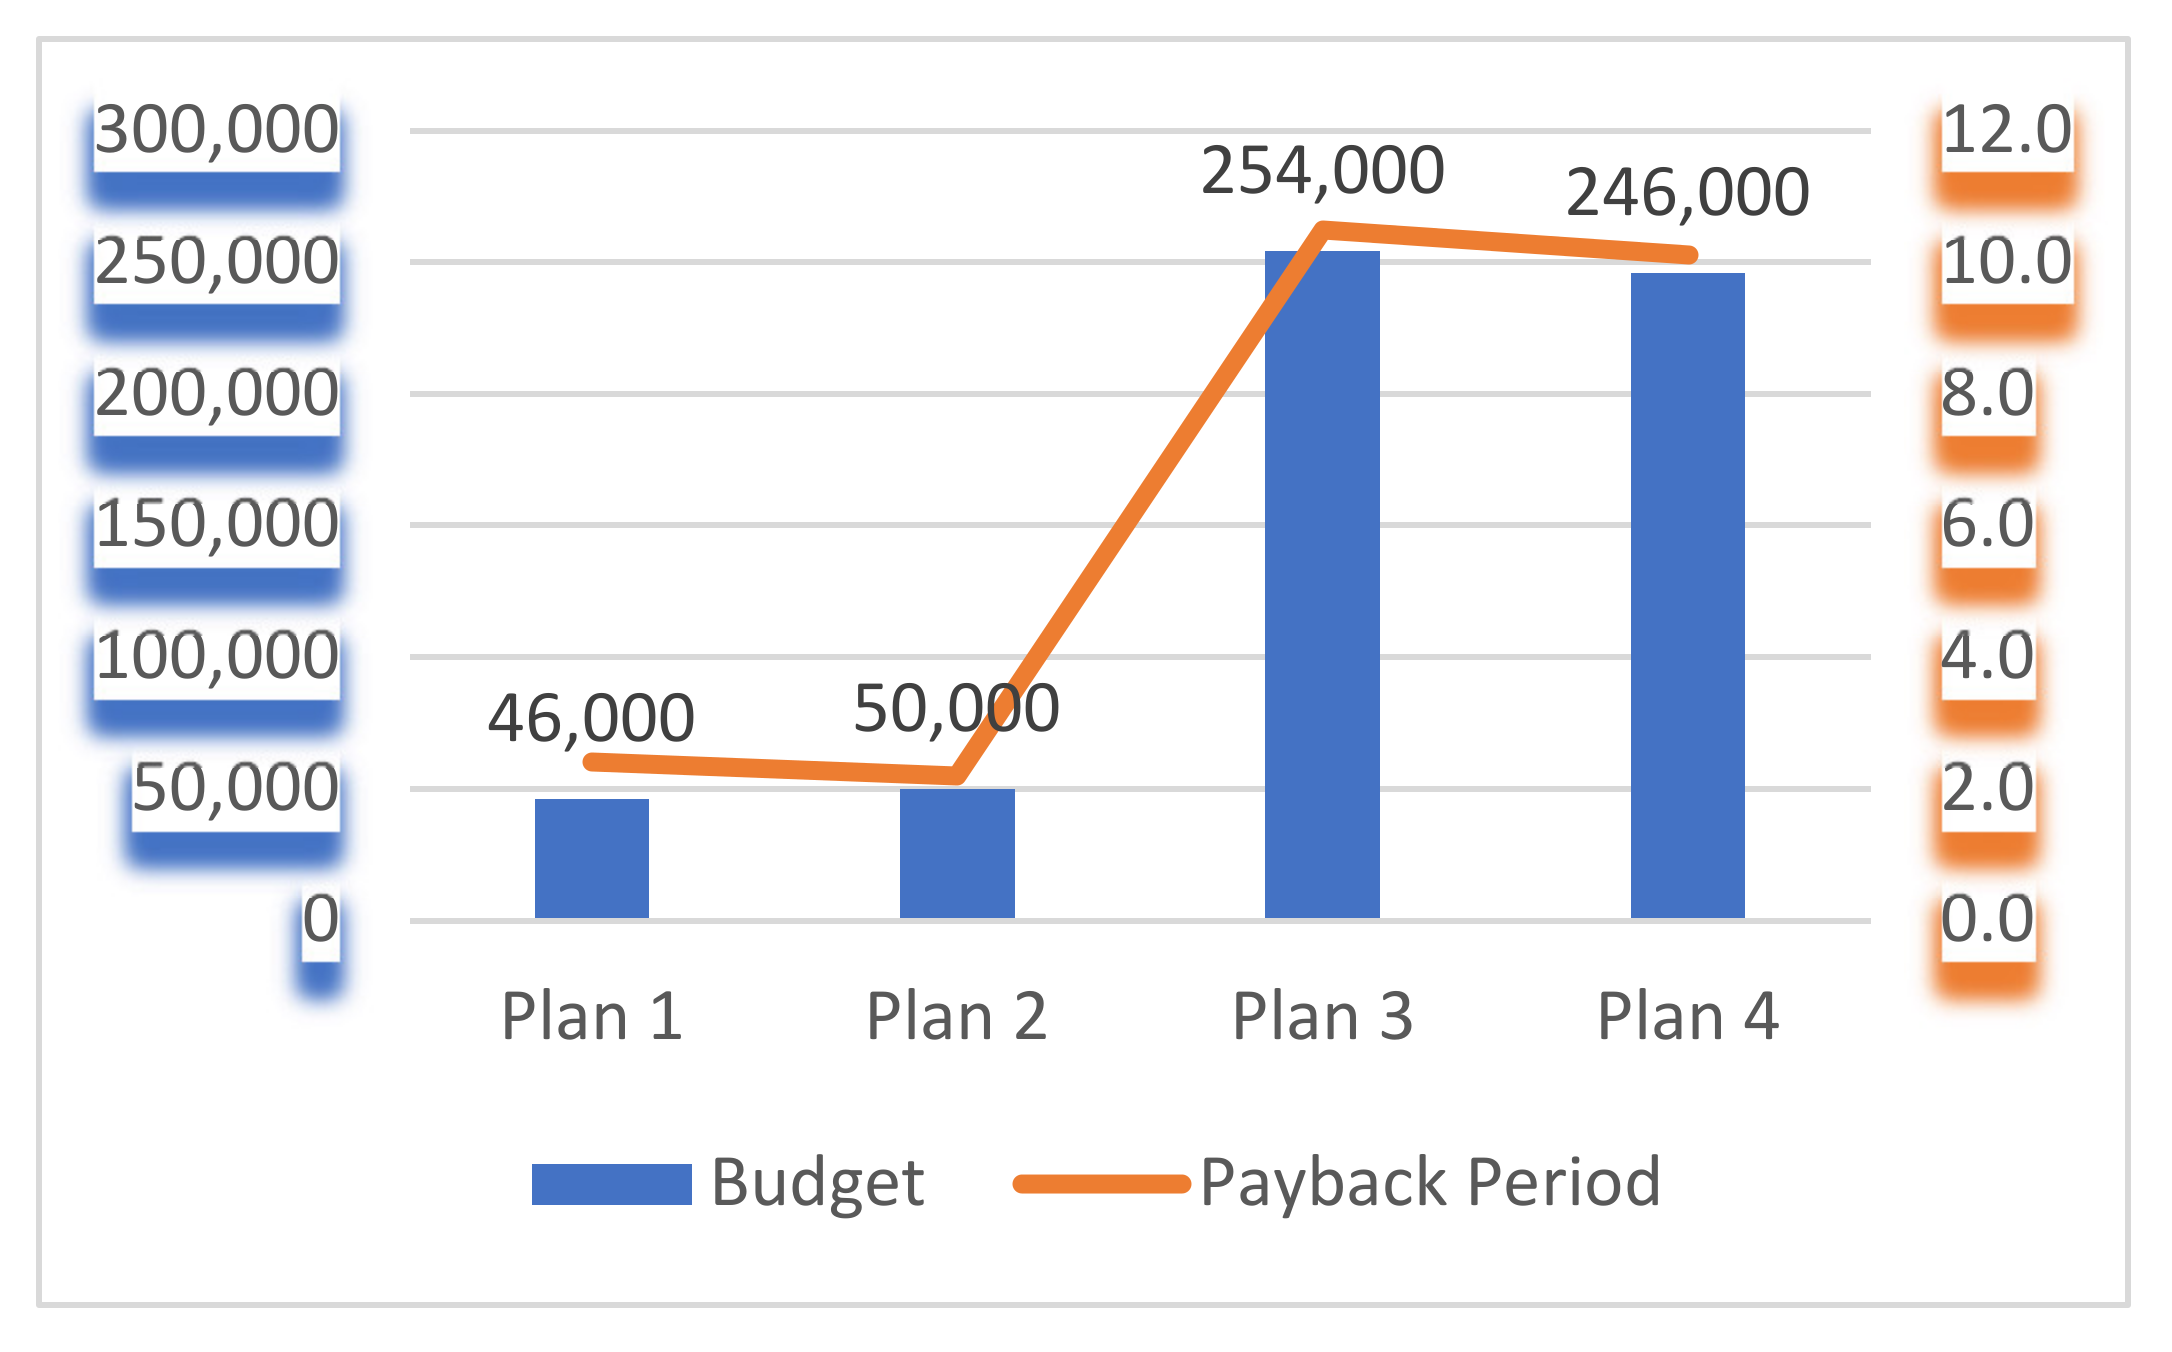
- Payback Period
As expected, plans 1 and 2 (Figure 6) offer the shortest payback periods (2.4 and 2.2 years) compared to retrofitting plans 3 and 4 (around 10 years). This is due to the fact that retrofitting plans 3 and 4 require higher investments than plans 1 and 2 and they include building envelope retrofitting measures, which are not as effective as electrical equipment retrofitting measures.
- c.
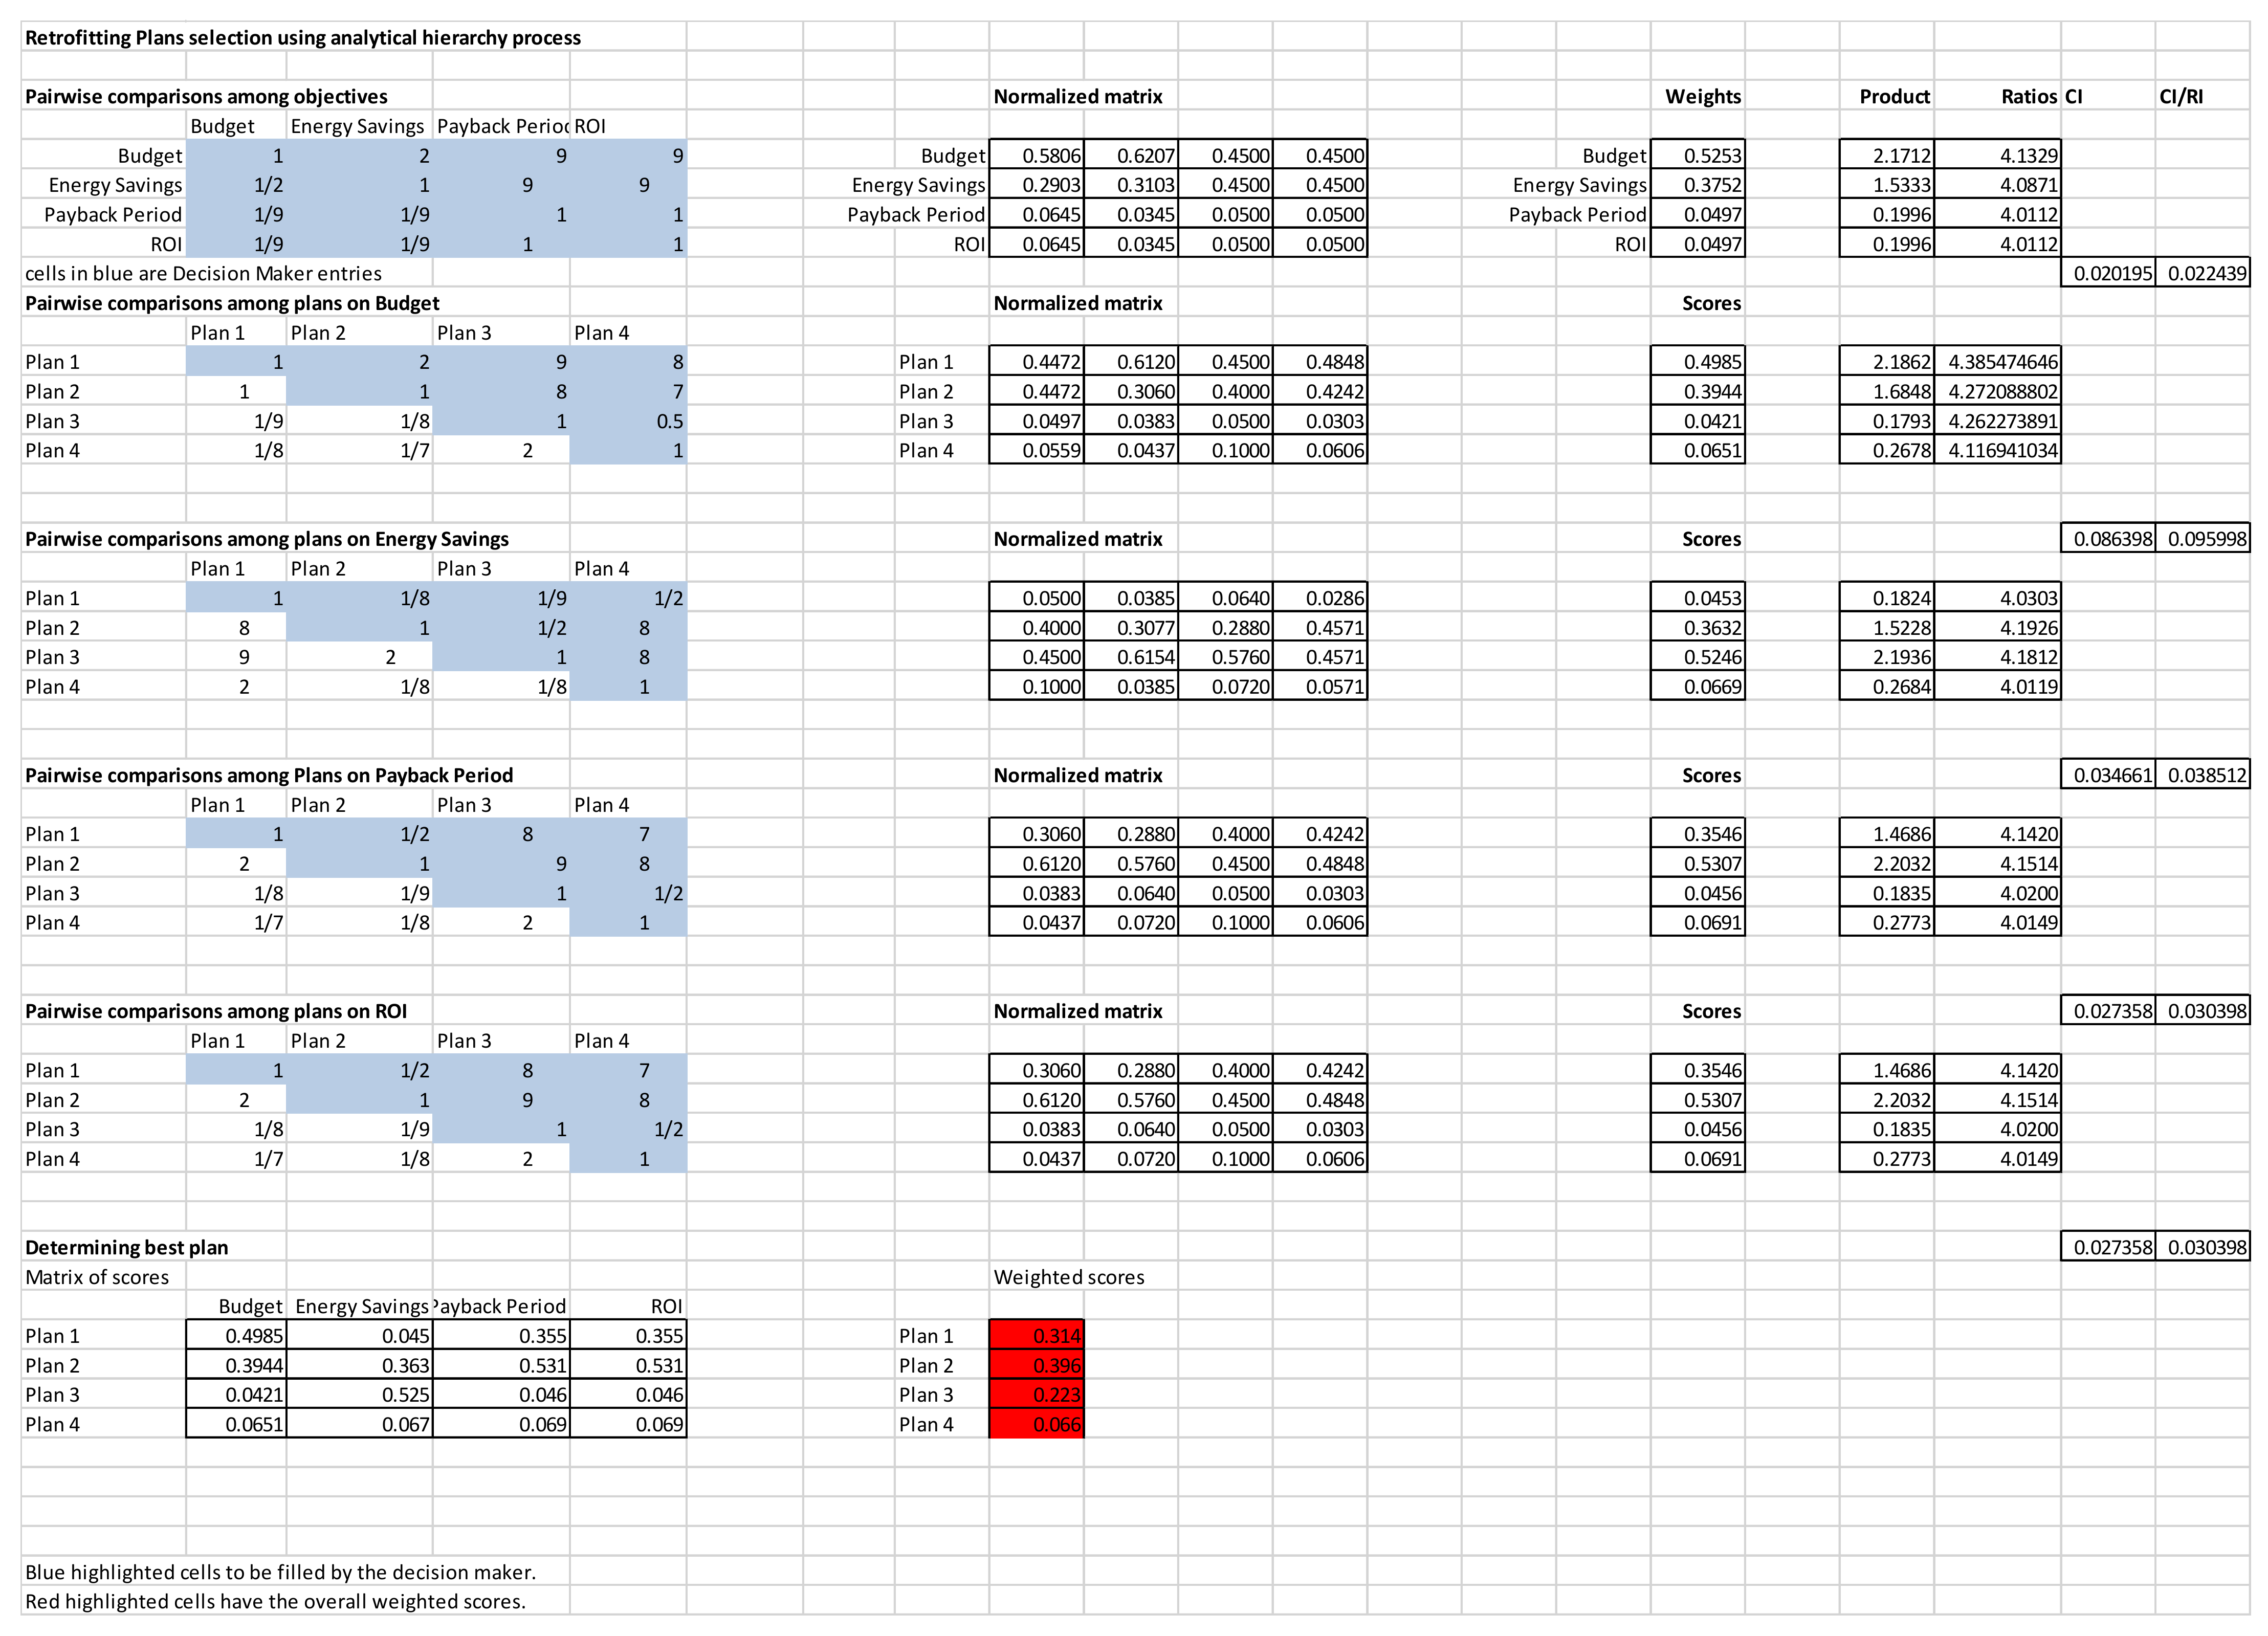
- Retrofitting Plans Ranking using AHP
In this part, AHP will be applied to select the best retrofitting plan among the four retrofitting plans presented in Table 4 according the budget, energy savings, payback period, and ROI criteria.
The AHP pairwise comparison matrices that are filled by the residential building owner (decision maker), the objective weights, the criteria relative scores, as well as the different alternatives overall scores will be discussed in this part.
- ✓
- Objective weights
The retrofitting plans selection process using the AHP started with the calculation of the objective weights by:
The weight calculations show that budget and energy savings are the most important objectives in the selection process while the payback period and the ROI are almost negligeable. In fact, budget and energy savings have weights equal to 0.52 and 0.37, respectively. This is due to the fact that the building owner’s main objective of retrofitting is to decrease the electricity bill at the minimum cost possible.
- ✓
- The retrofitting plans’ relative scores with respect to the different objectives
The same process conducted above to calculate the objectives’ weights was repeated to calculate the relative scores with respect to each objective. This process resulted in four pairwise comparison matrices (one for each objective) that were used to calculate the relative scores. Table 8 represents the pairwise comparison matrix among retrofitting plans in terms of budget, then the resulting matrix is normalized (Table 9), and then the scores are calculated (Table 10). In the end, consistency is checked (CI/RI = 0.095, which is acceptable).
The relative scores with respect to the budget objective show that plans 1 and 2 have the highest scores. Actually, plans 1 and 2 require only SR 46,000 and SR 50,000, respectively, which makes them the most attractive plans in terms of budget when compared to plans (retrofitting plans 3 and 4) that require more than four times the budget needed to implement retrofitting plan 1.
The same process was repeated with other objectives and all related data are detailed in Appendix A.
The different relative scores of retrofitting plans with respect to the different objectives are presented in Table 11.
In the end, the overall scores of the different plans are calculated (depicted in Table 12).
The weighted scores of the different plans show that retrofitting plans 2 and 1 are the best ones, with weighted scores equal to 0.39 and 0.31, respectively. In fact, this result was expected as plans 2 and 1 require the minimum budgets while achieving significant energy savings (30% and 22%), which are the main two objectives of the building owner.
Actually, plans 2 and 1 focus on the electrical equipment (HVAC, lighting, washer, dryer, etc.) within the building and seem to be economically more beneficial than other plans as they offer the highest electricity reduction with the minimum cost needed. Retrofitting plan 3 comes next, with a weighted score equal to 0.22. Finally, the least favorable retrofitting plan is plan 4, with a weighted score equal to 0.066.
It can be concluded that in this case study, the retrofitting plans that include building envelope measures (plans 3 and 4) are not as efficient as the ones that totally focus on the electrical equipment (plans 1 and 2).
4. Conclusions
Buildings represent one of the major energy consumers and contributors of CO2 emissions around the world. Therefore, retrofitting existing buildings to achieve ZEBs by minimizing their energy consumption and satisfying part of their energy needs is of utmost importance. In this paper, a framework for building retrofitting was presented.
The framework covers data collection (energy retrofitting measures, LCC calculation, etc.), mathematical programing, energy consumption forecasting, as well as ranking of retrofitting plans using the AHP. The framework’s objective is to provide decision makers with the necessary steps to conduct a successful energy retrofitting project. To show the application of the framework, a case study pertaining to a residential building in Saudi Arabia was conducted. The case study generated four retrofitting scenarios, and the ranking showed that plans 4 and 3 are the best ones in terms of the decision maker’s considered objectives: budget, energy savings, payback period, and ROI.
The following recommendations can be considered for future research:
- ✓
- Applying the framework to a more sophisticated case study;
- ✓
- Considering methods other than building simulation (i.e., artificial intelligence) for building energy consumption forecasting;
- ✓
- Considering more building occupants’ comfort measures, such as acoustic comfort and indoor air quality;
- ✓
- Considering ranking methods other than the AHP (i.e., TOPSIS) for the retrofitting plans’ ranking;
- ✓
- Considering other multi-criteria decision-making methods to identify the best retrofitting plan, such as goal programing.
Funding
APC was funded by Alfaisal University.
Acknowledgments
This work was supported by Alfaisal University.
Conflicts of Interest
The author declares no conflict of interest.
Appendix A

References
- Qiao, Q.; Yunusa-Kaltungo, A.; Edwards, R.E. Towards developing a systematic knowledge trend for building energy consumption prediction. J. Build. Eng. 2021, 35, 101967. [Google Scholar] [CrossRef]
- Amasyali, K.; El-Gohary, N.M. A review of data-driven building energy consumption prediction studies. Renew. Sustain. Energy Rev. 2018, 81, 1192–1205. [Google Scholar] [CrossRef]
- Wang, Y.; Xu, L.; Solangi, Y.A. Strategic renewable energy resources selection for Pakistan: Based on SWOT-Fuzzy AHP approach. Sustain. Cities Soc. 2020, 52, 101861. [Google Scholar] [CrossRef]
- Sartori, I.; Napolitano, A.; Voss, K. Net zero energy buildings: A consistent definition framework. Energy Build. 2012, 48, 220–232. [Google Scholar] [CrossRef] [Green Version]
- Liu, Z.; Zhou, Q.; Tian, Z.; He, B.J.; Jin, G. A comprehensive analysis on definitions, development, and policies of nearly zero energy buildings in China. Renew. Sustain. Energy Rev. 2019, 114, 109314. [Google Scholar] [CrossRef]
- Hernandez, P.; Kenny, P. From net energy to zero energy buildings: Defining life cycle zero energy buildings (LC-ZEB). Energy Build. 2010, 42, 815–821. [Google Scholar] [CrossRef]
- Magrini, A.; Lentini, G.; Cuman, S.; Bodrato, A.; Marenco, L. From nearly zero energy buildings (NZEB) to positive energy buildings (PEB): The next challenge-The most recent European trends with some notes on the energy analysis of a forerunner PEB example. Dev. Built Environ. 2020, 3, 100019. [Google Scholar] [CrossRef]
- Wells, L.; Rismanchi, B.; Aye, L. A review of Net Zero Energy Buildings with reflections on the Australian context. Energy Build. 2018, 158, 616–628. [Google Scholar] [CrossRef]
- Song, K.; Ahn, Y.; Ahn, J.; Kwon, N. Development of an Energy Saving Strategy Model for Retrofitting Existing Buildings: A Korean Case Study. Energies 2019, 12, 1626. [Google Scholar] [CrossRef] [Green Version]
- Ananwattanaporn, S.; Patcharoen, T.; Bunjongjit, S.; Ngaopitakkul, A. Retrofitted Existing Residential Building Design in Energy and Economic Aspect According to Thailand Building Energy Code. Appl. Sci. 2021, 11, 1398. [Google Scholar] [CrossRef]
- Basińska, M.; Kaczorek, D.; Koczyk, H. Economic and Energy Analysis of Building Retrofitting Using Internal Insulations. Energies 2021, 14, 2446. [Google Scholar] [CrossRef]
- Luo, X.J.; Oyedele, L.O. Assessment and optimisation of life cycle environment, economy and energy for building retrofitting. Energy Sustain. Dev. 2021, 65, 77–100. [Google Scholar] [CrossRef]
- Rabani, M.; Madessa, H.B.; Ljungström, M.; Aamodt, L.; Løvvold, S.; Nord, N. Life cycle analysis of GHG emissions from the building retrofitting: The case of a Norwegian office building. Build. Environ. 2021, 204, 108159. [Google Scholar] [CrossRef]
- Mejjaouli, S.; Alzahrani, M. Decision-making model for optimum energy retrofitting strategies in residential buildings. Sustain. Prod. Consum. 2020, 24, 211–218. [Google Scholar] [CrossRef]
- Kamaruzzaman, S.N.; Lou, E.C.W.; Zainon, N.; Zaid, N.S.M.; Wong, P.F. Environmental assessment schemes for non-domestic building refurbishment in the Malaysian context. Ecol. Indic. 2016, 69, 548–558. [Google Scholar] [CrossRef]
- Oviir, A. Life cycle assessment (LCA) in the framework of the next generation Estonian building standard Building certification as a strategy for enhancing sustainability. Energy Procedia 2016, 96, 351–362. [Google Scholar] [CrossRef] [Green Version]
- Akcay, E.C.; Arditi, D. Desired points at minimum cost in the “Optimize Energy Performance” credit of leed certification. J. Civ. Eng. Manag. 2017, 23, 796–805. [Google Scholar] [CrossRef]
- Michael, M.; Zhang, L.; Xia, X. An optimal model for a building retrofit with LEED standard as reference protocol. Energy Build. 2017, 139, 22–30. [Google Scholar] [CrossRef]
- Gorse, C.; Johnston, D.; Pritchard, M. A Dictionary of Construction, Surveying, and Civil Engineering; Oxford University Press: Oxford, UK, 2012. [Google Scholar]
- Jafari, A.; Valentin, V. An optimization framework for building energy retrofits decision-making. Build. Environ. 2017, 115, 118–129. [Google Scholar] [CrossRef]
- LEED. 2022. Available online: https://www.usgbc.org/leed/v41 (accessed on 6 November 2021).
- BREEAM. 2022. Available online: https://www.breeam.com (accessed on 3 November 2021).
- ENERGY STAR. 2022. Available online: https://www.energystar.gov (accessed on 5 November 2021).
- Ma, Z.; Cooper, P.; Daly, D.; Ledo, L. Existing building retrofits: Methodology and state-of-the-art. Energy Build. 2012, 55, 889–902. [Google Scholar] [CrossRef]
- Sullivan, W.G.; Wicks, E.M.; Koelling, C.P. Engineering Economy; Pearson: London, UK, 2015. [Google Scholar]
- Wang, B.; Xia, X.; Zhang, J. A multi-objective optimization model for the life-cycle cost analysis and retrofitting planning of buildings. Energy Build. 2014, 77, 227–235. [Google Scholar] [CrossRef] [Green Version]
- RSMeans. 2022. Available online: https://www.rsmeans.com (accessed on 5 November 2021).
- Schultz, L.I.; Weber, S.F. Guide to Computing and Reporting the Life-Cycle Cost of Environmental Management Projects; US DOE: Washignton, DC, USA, 2003. [Google Scholar]
- Saudi Electricity Company. 2022. Available online: https://www.se.com.sa/en-us/customers/Pages/TariffRates.aspx (accessed on 5 November 2021).
- Alaidroos, A.; Krarti, M. Optimal design of residential building envelope systems in the Kingdom of Saudi Arabia. Energy Build. 2015, 86, 104–117. [Google Scholar] [CrossRef]
- Fresco Contreras, R.; Moyano, J.; Rico, F. Genetic algorithm-based approach for optimizing the energy rating on existing buildings. Build. Serv. Eng. Res. Technol. 2016, 37, 664–681. [Google Scholar] [CrossRef] [Green Version]
- ASHRAE. 2022. Available online: https://www.ashrae.org/technical-resources/bookstore/standard-55-thermal-environmental-conditions-for-human-occupancy (accessed on 6 January 2021).
- Grondzik, W.T.; Kwok, A.G. Mechanical and Electrical Equipment For Building; John Wiley&Sons: Hoboken, NJ, USA, 2015. [Google Scholar]
- IES. 2022. Available online: https://www.ies.org (accessed on 5 November 2021).
- Pittarello, M.; Scarpa, M.; Ruggeri, A.G.; Gabrielli, L.; Schibuola, L. Artificial Neural Networks to Optimize Zero Energy Building (ZEB) Projects from the Early Design Stages. Appl. Sci. 2021, 11, 5377. [Google Scholar] [CrossRef]
- Godinho, X.; Bernardo, H.; de Sousa, J.C.; Oliveira, F.T. A Data-Driven Approach to Forecasting Heating and Cooling Energy Demand in an Office Building as an Alternative to Multi-Zone Dynamic Simulation. Appl. Sci. 2021, 11, 1356. [Google Scholar] [CrossRef]
- Sałabun, W.; Wątróbski, J.; Shekhovtsov, A. Are MCDA Methods Benchmarkable? A Comparative Study of TOPSIS, VIKOR, COPRAS, and PROMETHEE II Methods. Symmetry 2020, 12, 1549. [Google Scholar] [CrossRef]
- Saaty, T. The Analytic Hierarchy Process; McGraw-Hill International Book Co.: New York, NJ, USA, 1980. [Google Scholar]
- Winston, W.L.; Goldberg, J.B. Operations Research: Applications and Algorithms; Thomson/Brooks/Cole: Belmont, CA, USA, 2004. [Google Scholar]
- Solangi, Y.A.; Tan, Q.; Mirjat, N.H.; Ali, S. Evaluating the strategies for sustainable energy planning in Pakistan: An integrated SWOT-AHP and Fuzzy-TOPSIS approach. J. Clean. Prod. 2019, 236, 117655. [Google Scholar] [CrossRef]
- Darko, A.; Chan, A.P.C.; Ameyaw, E.E.; Owusu, E.K.; Pärn, E.; Edwards, D.J. Review of application of analytic hierarchy process (AHP) in construction. Int. J. Constr. Manag. 2019, 19, 436–452. [Google Scholar] [CrossRef]
- Rabani, M.; Madessa, H.B.; Mohseni, O.; Nord, N. Minimizing delivered energy and life cycle cost using Graphical script: An office building retrofitting case. Appl. Energy 2020, 268, 114929. [Google Scholar] [CrossRef]
- Saudi Arabian Monetary Authority. 2022. Available online: https://www.sama.gov.sa/en-US/Indices/Pages/InflationRate.aspx (accessed on 5 November 2021).
Figure 2.
Energy consumption (in Kwh) before retrofitting.

Figure 3.
Energy consumption (in Kwh) after retrofitting (Plan 1).

Figure 4.
The effect of budget (in SR) on energy savings.

Figure 5.
The effect of budget (in SR) on ROI.

Figure 6.
The effect of budget (in SR) on the payback period (in years).


Table 1.
Required illumination level.
| General Building Area | IES Standards Illumination Level (Lux) |
|---|---|
| Corridors | 100 |
| Lift and stairs | 150 |
| Kitchen | 150 |
| Living rooms general | 50 |
| Bedroom general | 50 |
| Bathroom | 100 |
| Halls and landing | 150 |
Table 2.
Lumens for different lamp types.
| Lamp Type | Power | Lumens |
|---|---|---|
| Incandescent | 60 Watts | 855 |
| CFL | 13 Watts | 750 |
| LED | 13 Watts | 800 |
| PAR 30 halogen lamp | 55 Watts | 960 |
| PAR 30 CFL lamp | 15 Watts | 700 |
| PAR 30 LED lamp | 14 Watts | 850 |
Table 3.
NIKAI Dryer LCC calculation.
| Year | Initial Cost | M & O | Energy Cost | NCF | PV Factor | PV (in SR) |
|---|---|---|---|---|---|---|
| 0 | 1165 | 334.4 | 1499.4 | 1 | 1499.4 | |
| 1 | 344.432 | 344.432 | 0.952381 | 328.0305 | ||
| 2 | 354.76496 | 354.765 | 0.907029 | 321.7823 | ||
| 3 | 365.4079088 | 365.4079 | 0.863838 | 315.6531 | ||
| 4 | 376.3701461 | 376.3701 | 0.822702 | 309.6407 | ||
| 5 | 387.6612504 | 387.6613 | 0.783526 | 303.7427 | ||
| 6 | 399.291088 | 399.2911 | 0.746215 | 297.9572 | ||
| 7 | 411.2698206 | 411.2698 | 0.710681 | 292.2818 | ||
| 8 | 423.6079152 | 423.6079 | 0.676839 | 286.7145 | ||
| 9 | 436.3161527 | 436.3162 | 0.644609 | 281.2533 | ||
| 10 | −65.61 | 449.4056373 | 383.7956 | 0.613913 | 235.6172 | |
| 11 | 1561 | 462.8878064 | 2023.888 | 0.584679 | 1183.325 | |
| 12 | 476.7744406 | 476.7744 | 0.556837 | 265.4858 | ||
| 13 | 491.0776738 | 491.0777 | 0.530321 | 260.429 | ||
| 14 | 505.810004 | 505.81 | 0.505068 | 255.4684 | ||
| 15 | 520.9843041 | 520.9843 | 0.481017 | 250.6024 | ||
| 16 | 536.6138332 | 536.6138 | 0.458112 | 245.829 | ||
| 17 | 552.7122482 | 552.7122 | 0.436297 | 241.1465 | ||
| 18 | 569.2936157 | 569.2936 | 0.415521 | 236.5533 | ||
| 19 | 586.3724241 | 586.3724 | 0.395734 | 232.0475 | ||
| 20 | −88 | 603.9635969 | 515.9636 | 0.376889 | 194.4613 | |
| LCC | 7837.422 |
Table 4.
Different retrofitting plans.
| Retrofitting Plan | Energy Measures | Budget | Energy Savings | Payback | ROI |
|---|---|---|---|---|---|
| Plan 1 Electrical equipment | Replace the old split AC with Gree. | SR 46,000 | 22% | 2.4 | 23% |
| Replace the old washing machine with Samsung. | |||||
| Replace the old dryer with an LG dryer. | |||||
| Plan 2 Electrical equipment | Replace the old split with an LG inverter. | SR 50,000 | 30% | 2.2 | 27% |
| Replace the old washing machine with Gibson. | |||||
| Replace the old dryer with a Nikai dryer. | |||||
| Plan 3 Envelope and electrical | Upgrade with 5 cm polystyrene + 2-layer plaster + profile (wall). | SR 254,000 | 33% | 10.5 | 17.3% |
| Double-pane low E. | |||||
| Upgrade with 5 cm polyurethane foam + tile (roof). | |||||
| Replace the old split with an LG inverter. | |||||
| Replace the old washing machine with Gibson. | |||||
| Replace the old dryer with a Nikai dryer. | |||||
| Plan 4 Envelope and electrical | Upgrade with foam 4 cm and stone 0.023. | SR 246,000 | 26% | 10.1 | 17.7% |
| Double-pane low E. | |||||
| Upgrade with foam 4 cm and tile R 0.017 REM (roof). | |||||
| Replace the old split AC with Gree. | |||||
| Replace the old washing machine with Samsung. | |||||
| Replace the old dryer with an LG dryer. |
Table 5.
Pairwise comparisons among objectives.
| Budget | Energy Savings | Payback Period | ROI | |
|---|---|---|---|---|
| Budget | 1 | 2 | 9 | 9 |
| Energy savings | 1/2 | 1 | 9 | 9 |
| Payback period | 1/9 | 1/9 | 1 | 1 |
| ROI | 1/9 | 1/9 | 1 | 1 |
Table 6.
Normalized matrix.
| Budget | Energy Savings | Payback Period | ROI | |
|---|---|---|---|---|
| Budget | 0.5806 | 0.6207 | 0.4500 | 0.4500 |
| Energy savings | 0.2903 | 0.3103 | 0.4500 | 0.4500 |
| Payback period | 0.0645 | 0.0345 | 0.0500 | 0.0500 |
| ROI | 0.0645 | 0.0345 | 0.0500 | 0.0500 |
Table 7.
Objectives weights.
| Objectives | Weight |
|---|---|
| Budget | 0.5253 |
| Energy savings | 0.3752 |
| Payback period | 0.0497 |
| ROI | 0.0497 |
Table 8.
Pairwise comparisons among plans in terms of budget.
| Plan 1 | Plan 2 | Plan 3 | Plan 4 | |
|---|---|---|---|---|
| Plan 1 | 1 | 2 | 9 | 8 |
| Plan 2 | 1 | 1 | 8 | 7 |
| Plan 3 | 1/9 | 1/8 | 1 | 0.5 |
| Plan 4 | 1/8 | 1/7 | 2 | 1 |
Table 9.
Normalized matrix.
| Plan 1 | Plan 2 | Plan 3 | Plan 4 | |
|---|---|---|---|---|
| Plan 1 | 0.4472 | 0.6120 | 0.4500 | 0.4848 |
| Plan 2 | 0.4472 | 0.3060 | 0.4000 | 0.4242 |
| Plan 3 | 0.0497 | 0.0383 | 0.0500 | 0.0303 |
| Plan 4 | 0.0559 | 0.0437 | 0.1000 | 0.0606 |
Table 10.
Relative scores in terms of budget.
| Plan | Relative Score |
|---|---|
| Plan 1 | 0.4985 |
| Plan 2 | 0.3944 |
| Plan 3 | 0.0421 |
| Plan 4 | 0.0651 |
Table 11.
Matrix of scores.
| Budget | Energy Savings | Payback Period | ROI | |
|---|---|---|---|---|
| Plan 1 | 0.4985 | 0.045 | 0.355 | 0.355 |
| Plan 2 | 0.3944 | 0.363 | 0.531 | 0.531 |
| Plan 3 | 0.0421 | 0.525 | 0.046 | 0.046 |
| Plan 4 | 0.0651 | 0.067 | 0.069 | 0.069 |
Table 12.
Retrofitting plans’ overall scores.
| Plan | Overall Score |
|---|---|
| Plan 1 | 0.314 |
| Plan 2 | 0.396 |
| Plan 3 | 0.223 |
| Plan 4 | 0.066 |
Publisher’s Note: MDPI stays neutral with regard to jurisdictional claims in published maps and institutional affiliations. |
© 2022 by the author. Licensee MDPI, Basel, Switzerland. This article is an open access article distributed under the terms and conditions of the Creative Commons Attribution (CC BY) license (https://creativecommons.org/licenses/by/4.0/).
Share and Cite
MDPI and ACS Style
Mejjaouli, S. Toward ZEB: A Mathematical Programing-, Simulation-, and AHP-Based Comprehensive Framework for Building Retrofitting. Appl. Sci. 2022, 12, 2241. https://doi.org/10.3390/app12042241
AMA Style
Mejjaouli S. Toward ZEB: A Mathematical Programing-, Simulation-, and AHP-Based Comprehensive Framework for Building Retrofitting. Applied Sciences. 2022; 12(4):2241. https://doi.org/10.3390/app12042241
Chicago/Turabian StyleMejjaouli, Sobhi. 2022. "Toward ZEB: A Mathematical Programing-, Simulation-, and AHP-Based Comprehensive Framework for Building Retrofitting" Applied Sciences 12, no. 4: 2241. https://doi.org/10.3390/app12042241
Note that from the first issue of 2016, this journal uses article numbers instead of page numbers. See further details here.