1. Introduction
Within the perspective of Industry 4.0 and the growing digitalization of industrial plants, a proper maintenance management process based on data analysis has now become a focal point not only for cost control but also to maintain a challenging level of competition, thanks to increasing productivity. This necessity goes hand in hand with the needs of a constantly evolving production scenario that has led to more than significant innovations in the field of sensor technology. Current industrial settings are becoming increasingly complex and difficult to manage from a maintenance point of view. The complexity of current production processes, due to the high level of availability requested for the equipment and the high number of components and interacting elements in industrial processes shows the shortcomings of some condition monitoring and Condition-based maintenance (CBM) techniques, currently widely and successfully applied in linear and static processes. Unfortunately, many industrial processes operate under time-varying conditions. In this type of process, the interpretation of the output response of the system depends on the specific moment. Examples are: changes in the loadings of the process; physiological aging of the equipment or drift caused by disturbance [
1]; and different operational steps or production phases within the process that are not easily detectable [
2]. Condition-based maintenance relies on the interpretation of measured values as signals of anomaly situations that suggest maintenance interventions [
3]; in a time-varying process, a value could be expected or anomalous depending on the specific phase of the production. Thus, how to implement proper condition-based maintenance in time-varying processes is currently an open challenge for research. It is worth noting that processes that operate under time-varying conditions are extremely common in the existing industrial scenario. One example is the pharmaceutical sector, with processes such as granulation or processes involving rotating machines in their many applications. The level of complexity in these engineering systems and manufacturing processes is higher than in stationary situations. Managing the reliability of these systems becomes challenging in modern dynamic operational settings. In particular, the difficulties of monitoring time-varying processes are obvious, because the different variability characteristics present within the same process can lead to monitoring with incorrect results [
4], with the consequent failure to identify faults or false alarms [
5]. The model tends to confuse in discerning between intrinsic changes in the nature of the process, dictated precisely by its time-variant nature, and real failure situations. Data management for CBM still appears as an immature research area, with many open challenges at different levels, since several CBM approaches are data-driven [
6]. Entering into the details of the time-varying conditions, it is possible to assert a significant increase of interest in recent years in the field of fault detection and maintenance in general [
7,
8,
9,
10]. As an important remark for the presented research, the application of clustering techniques in the maintenance research gained considerably. The most common motivation for the application of clustering is that supervised learning techniques are not available; in fact, there are many contexts in which access to failure data is limited [
11]. The difficulty of monitoring or rare failure situations lead to unavailability of data to feed supervised machine learning models. In this situations, the unsupervised techniques lead to more reliable results compared to supervised learning methods [
12]. Clustering is the basic task for unsupervised learning and it helps to overcome data shortage problems [
13,
14,
15].
Since the evidence just introduced, the research topic focused on the coexistence of these two themes, namely clustering applied specifically in time-variant contexts. The aim of this review is, therefore, to understand how clustering has, so far, been used to support maintenance in time-variant contexts. Specifically, the purpose is to define the functions that clustering has in this context, the main areas of application and the clustering techniques that have been most investigated and applied. To do this, an approach using the natural language process (NLP) was proposed to support the literature analysis. As will be explained in more detail later in the paper, the contributions selected for analysis were grouped using an NLP technique, highlighting the main themes, and also making it possible to understand which contributions were most representative of a thematic area, without any claim of systematicity. NLP techniques allow the automatic analysis, processing, and synthesis of natural language, here used to present original works of scientific researches or studies. Through this phase of pre-analysis of the papers, they are categorized in topics for a more conscious reading of the contributions, with a significant indication of the most representative papers for each identified topic. Similarly, the identification of any overlapping thematic areas facilitates a “multiple” and parallel reading of the contributions, making it possible to identify the links between thematic areas. It also speeds up the analysis of the literature because only contributions with high values of belonging to a topic can be carefully considered. Finally, the analysis is more objective, because manual keyword labeling and subsequent categorization could be extremely subjective. The approach selected to implement NLP analysis is Latent Dirichlet Allocation (LDA) [
16,
17]. The latter identifies topics and assigns every paper to one or more topic according to probabilistic logic models, thus providing more realistic and elucidative results. The literature proposes some applications of the text mining concept to support literature analysis [
18,
19]. As far as the authors are aware, however, there are no contributions on the application of NLP, specifically LDA, to support literature reviews on the topic specifically under consideration. Consequently, the fruitful applicability of the LDA and its output are considered interesting contribution of this paper.
The sections of this paper are organized as follows.
Section 2 will present the methodology followed, both from the point of view of structuring the literature review and from the point of view of applying the LDA algorithm.
Section 3 will present the evidence extracted from the literature, detailing the different topics identified. Finally, the discussion and conclusions section is presented, highlighting the extracted contents, their possible application in the maintenance field, and possible future developments of the research.
2. Methodology
The literature review considered in this study was carried out on the Scopus database, the largest abstracts and citations database of peer-reviewed literature [
20]. The review has no objective of systematicity, e.g., it does not want to follow the Prisma methodology, because the paper wants to show the results of a review based on NLP. The selected key-search was set targeting a high level of inclusiveness, with regards to the topic. The key-search is (“cluster*” and (“condition based maintenance” OR “fault*” OR “useful life” OR “diagnos*” OR “prognos*” OR “failure”) and (“time var*” OR “non stationary” OR “multi phase” OR “multiphase” OR “process phase”)) in the title, abstract, or keywords fields of the database. The final query has been run-up in September 2021, to present analysis as completely as possible, although the topic was monitored in the last year of research. The choice of keywords was dictated by some specific considerations. Firstly, the term “time var*” was included because the authors wanted to consider contributions that explicitly considered this type of feature in their analyses. In fact, some time-variant processes are occasionally not treated as such, and these contributions were not of interest for this analysis. It has also been noted that the term “non-stationary” is often used to describe the characteristics of signals from time-varying contexts [
21]. The terms “multi phase”, “multiphase” and “process phase” were inserted to investigate the context of multi-phase processes. The term “cluster*” was inserted to identify those contributions that explicitly referred to clustering as a tool used in the contribution, just as the terms “condition based maintenance” OR “fault*” OR “useful life” OR “diagnos*” OR “prognos*” OR “failure” were inserted to circumscribe the field to the field of maintenance.
Subsequently, only contributions in English were selected and following a reading of the abstracts, only contributions with a specific relevance and belonging to the topic were selected. The final analysis was therefore carried out on 72 contributions.
The reading of the contributions and their analysis was carried out by all authors of the paper, first separately and then jointly.
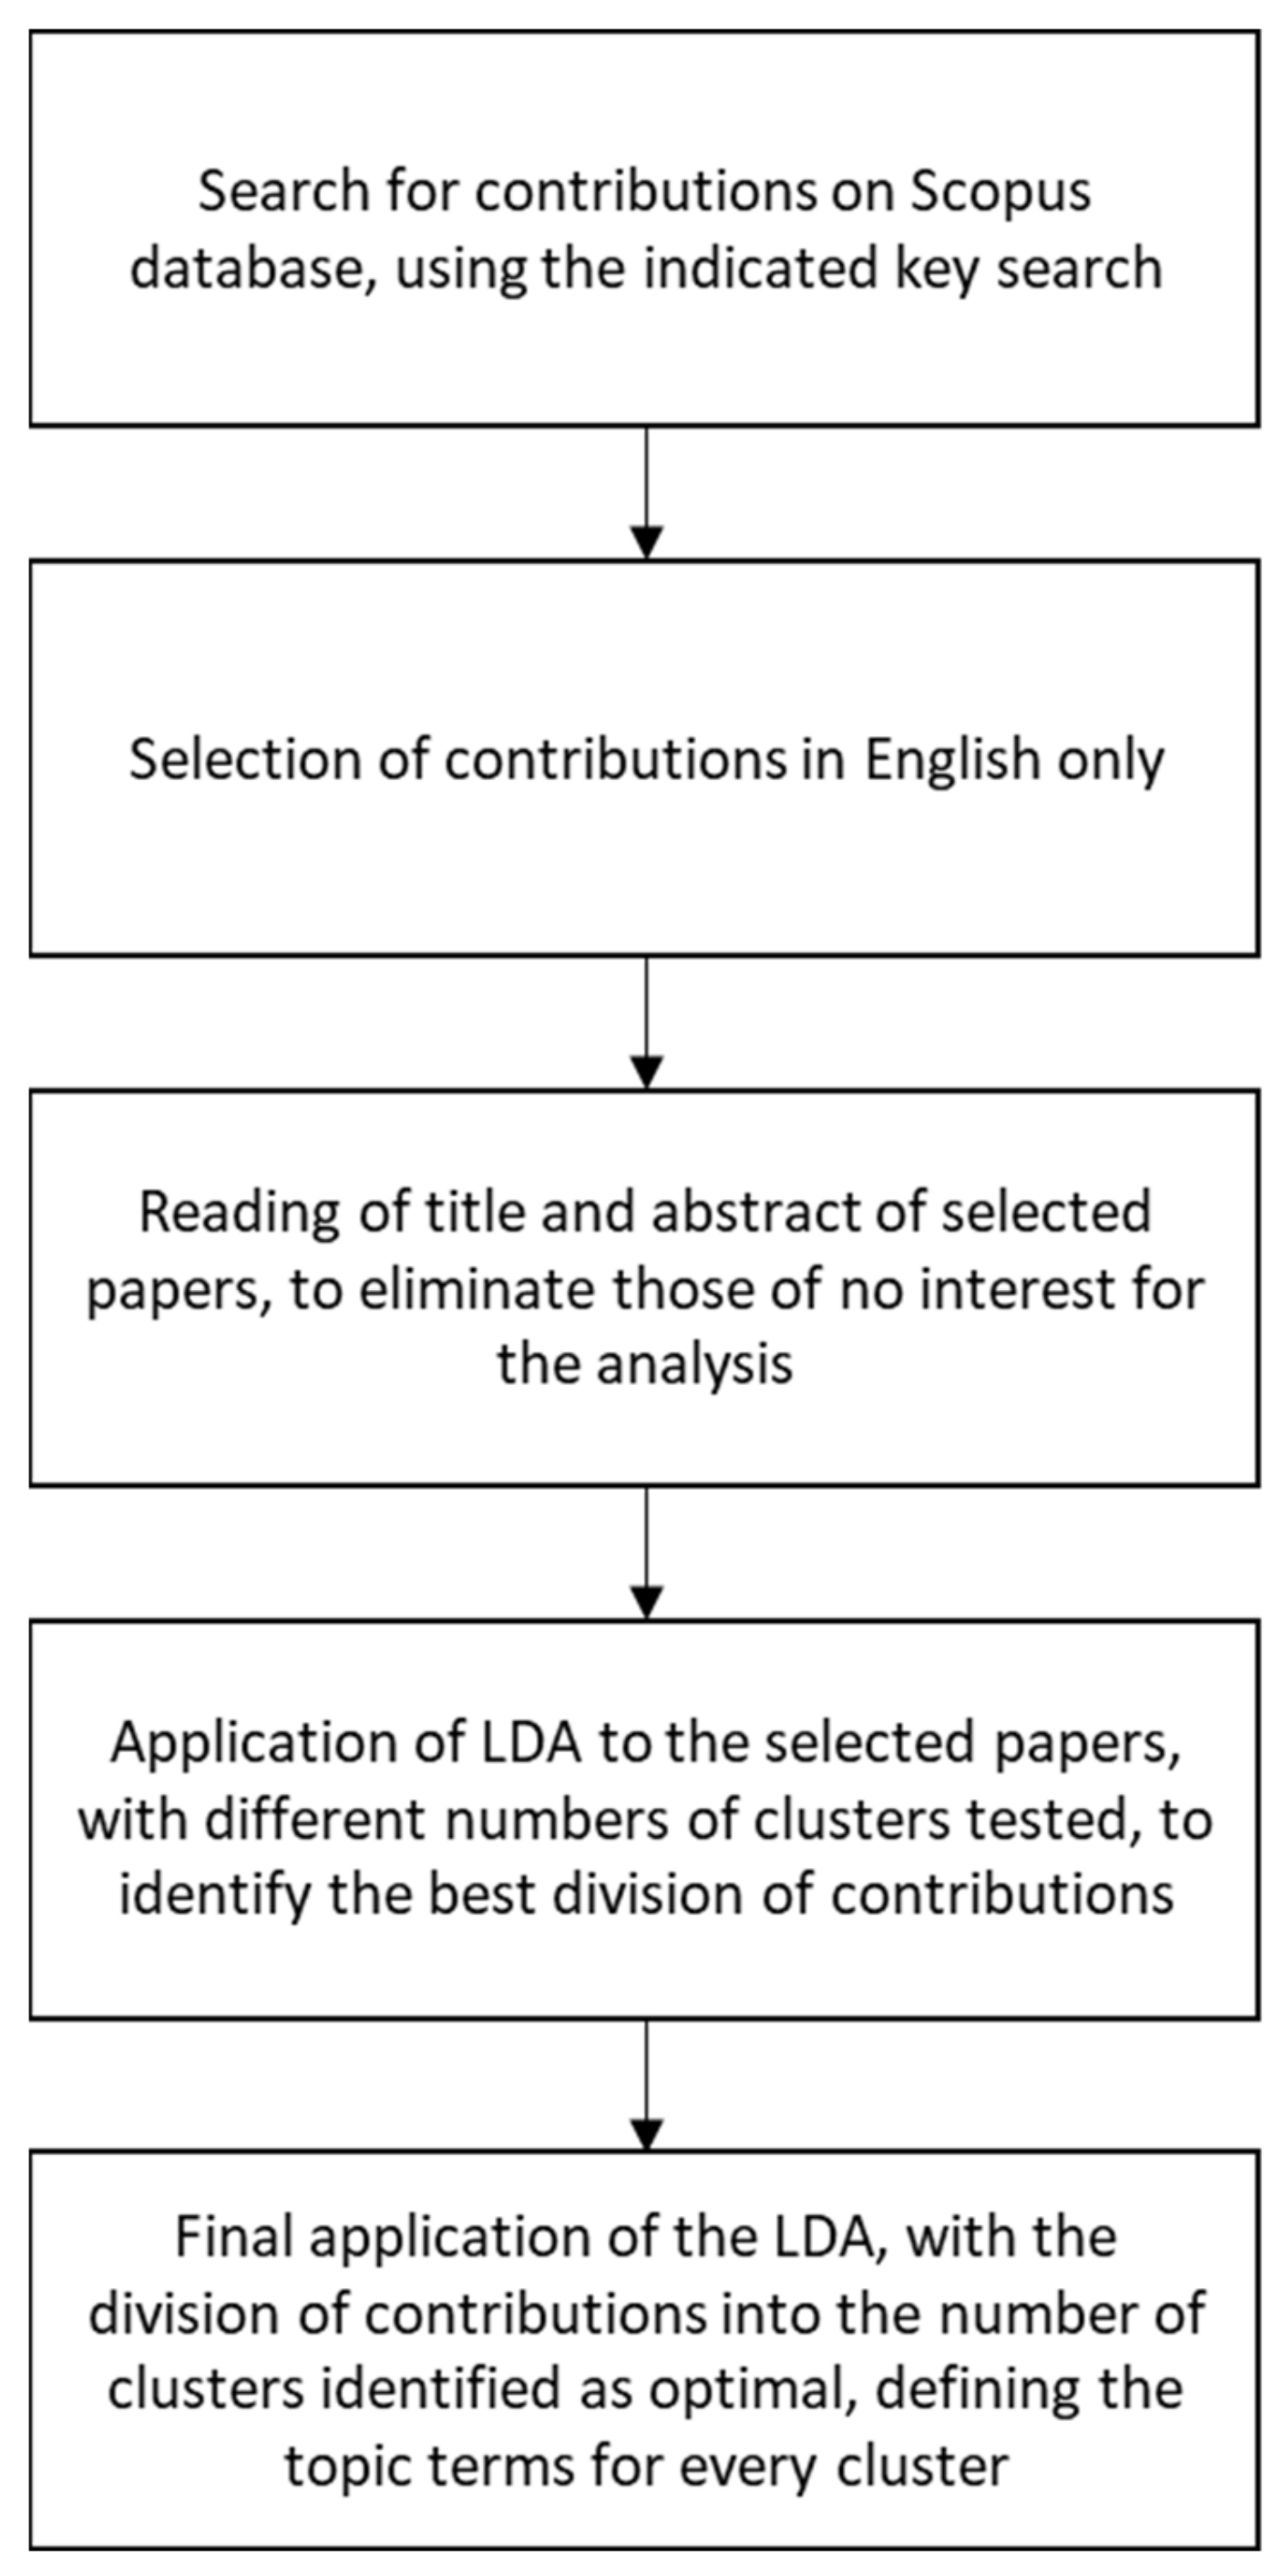
Figure 1 presents a clear step-by-step representation of the literature analysis developed in the paper.
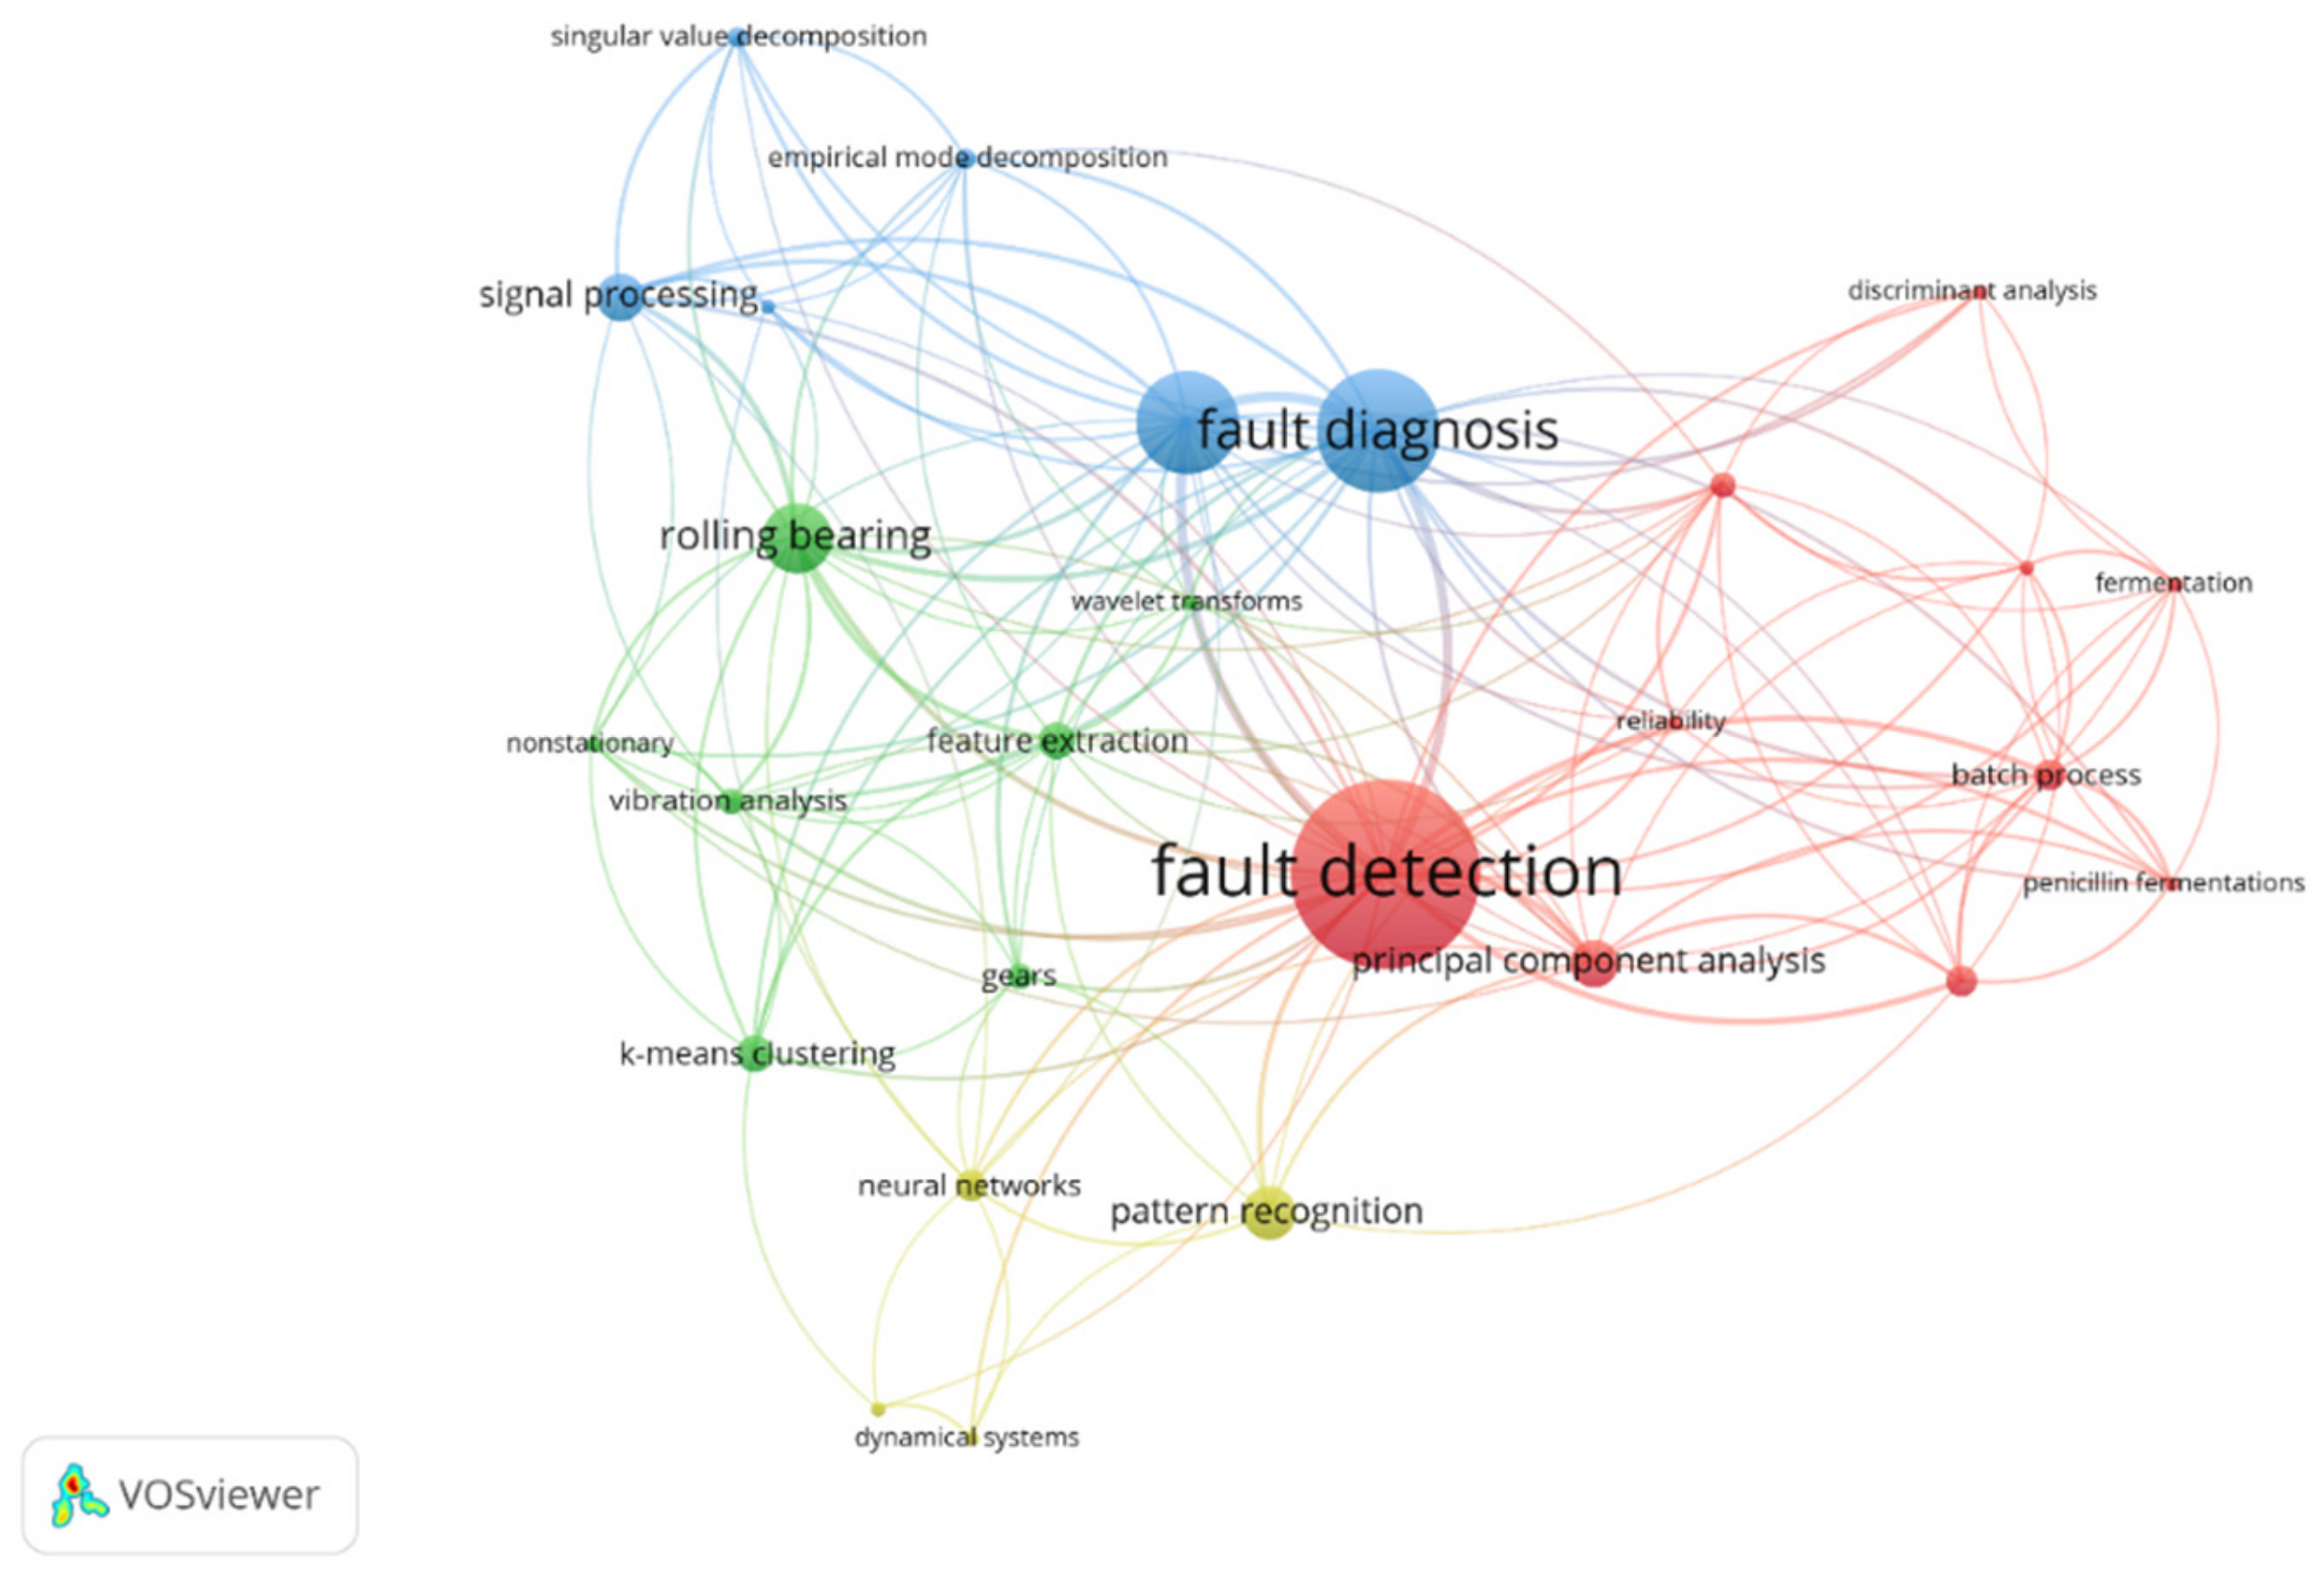
Before proceeding to the actual application of the LDA and the subsequent literature reviews, some graphical analyses were implemented to extract initial information. To do this, the authors made use of VOSviewer, a software tool for constructing and visualizing bibliometric networks. In detail, three analyses were implemented. First, a so-called network visualization was carried out, based on the keywords in the contributions (
Figure 2).
In this type of visualization, items are represented by their label and a circle. The size of the label and the circle represent the weight of the item, meaning that the higher the weight of an item, the larger the label and the circle of the item, while the lines connecting the circles represent a link. In this specific case, the weight is the occurrence of the keyword within the contributions, considering only those that appeared in at least three contributions. This threshold is needed to make the analysis readable by eliminating keywords used only in specific contributions. This is an outline analysis, while the details of the contributions will be shown in the following analysis. Finally, the color of an item is determined by the cluster to which the item belongs. This analysis makes it possible to identify quickly which are the main concepts in the thematic area, as well as the relationships between the words identified. The relationship between the keywords shows four groups of keywords, defined according to their co-occurrence in the documents. The details of the keywords show the most important concepts are the following (by decreasing occurrence):
Fault detection;
Fault diagnosis;
Rolling bearing;
Signal processing;
Empirical mode decomposition;
Vibration analysis;
Support vector machines;
Singular value decomposition;
Neural networks;
Pattern recognition;
K-means clustering;
Gears;
Principal component analysis;
Reliability;
Batch process;
Penicillin fermentation;
Feature extraction;
Wavelet transforms;
Reliability;
Fermentation;
Discriminant analysis.
Moreover, the graphical analysis evidences the connections between the keywords. The “rolling bearings” are closely linked to the concept of “vibration”, “feature extraction” and the “k-means algorithm”. Another connection is available between the concept of “batch processes” and “fermentation processes”, which is also related to the technique of “principal component analysis” and the concept of “discriminant analysis”. Similarly, the “signal processing” forms a cluster with “singular value decomposition” and “empirical mode decomposition”. Finally, as one might expect, the themes of fault diagnosis and fault detection are extremely cross-cutting. This is not surprising, as they are two of the main objectives of condition monitoring. the concept of feature extraction, although important, is less transversal and more circumscribed than the two mentioned above.
A second analysis related to the first one, but with a different point of view, was the one called density visualization (
Figure 3).
This analysis takes up the keywords considered above, but in this visualization the color represents the density of every item. By default, colors range from blue to green to yellow. The larger the number of items in the neighborhood of a point and the higher the weights of the neighboring items, the closer the color of the point is to yellow. For the other way around, i.e., the smaller the number of items in the neighborhood of a point and the lower the weights of the neighboring items, the closer the color of the point is to blue. Evidence are that, apart from fault detection, fault diagnosis and rolling bearings, all other terms have the same density of occurrence.
The extension of the analysis of the weight of words to titles and abstracts extracts a greater number of concepts, application areas, and techniques with relevance to the research area investigated.
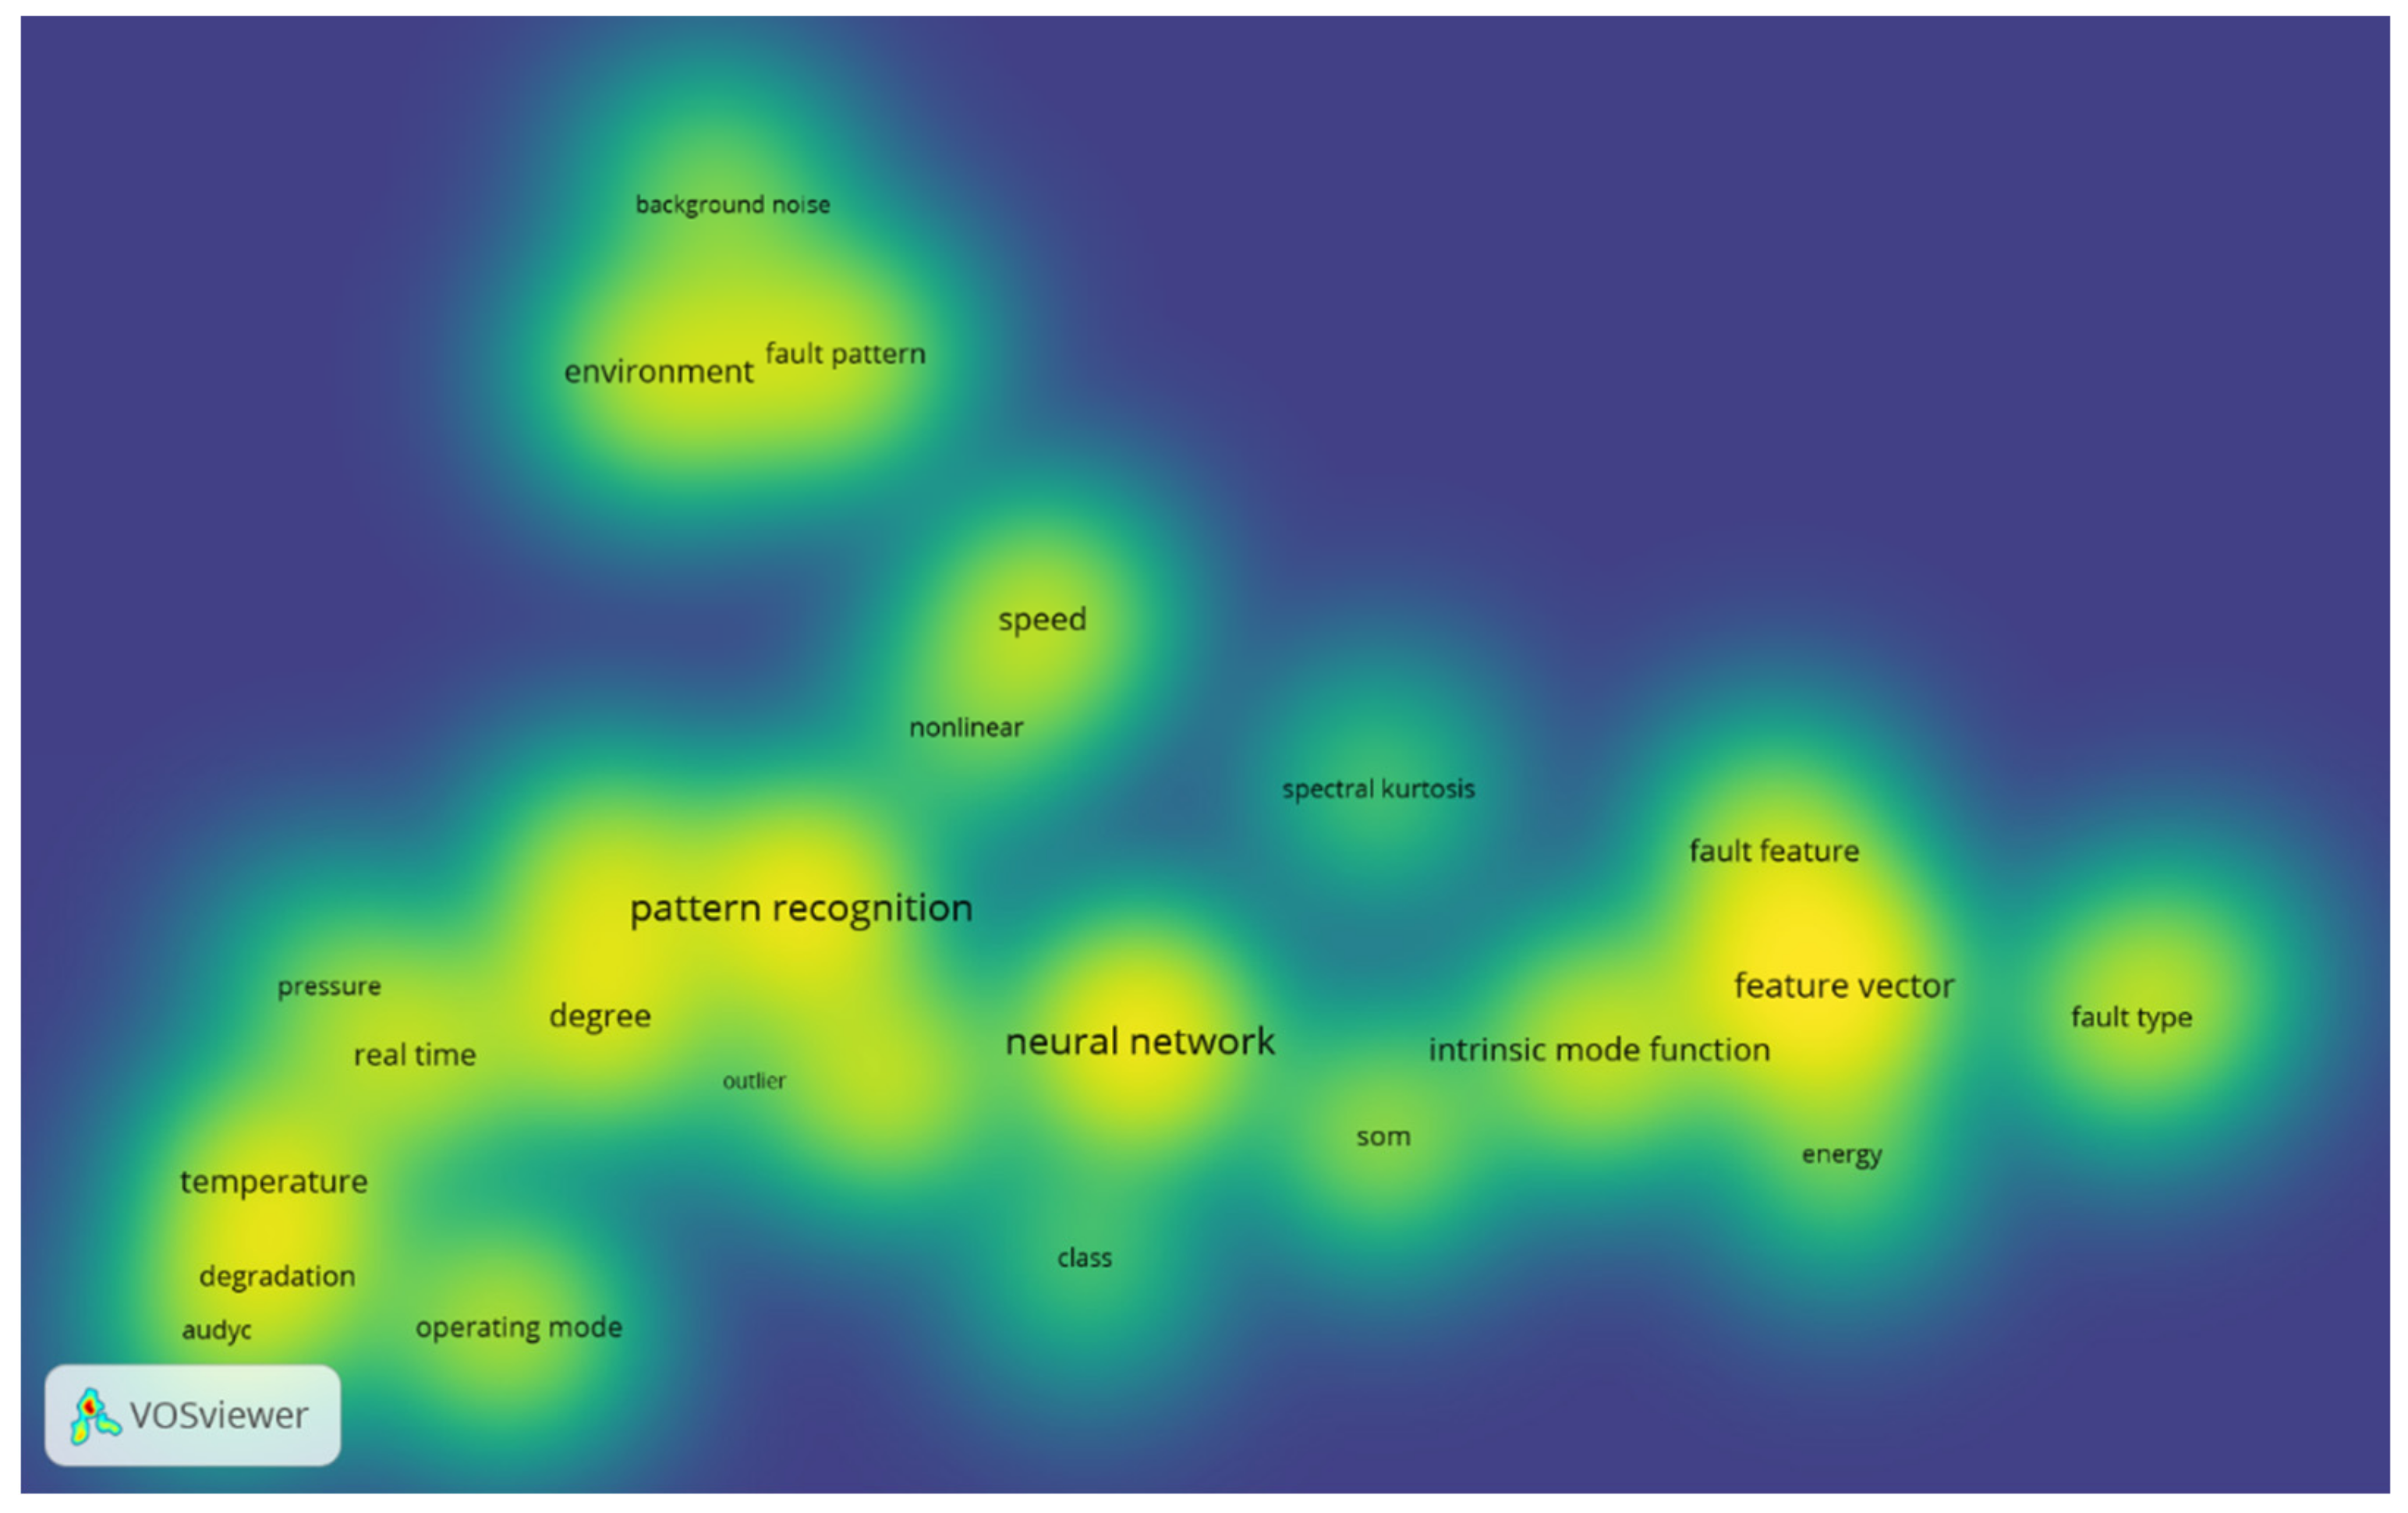
In the third analysis of
Figure 4, it was decided not to consider the words that were already highlighted in the previous analysis. In this way, it was possible to identify several new concepts, more specific than those identified with the keywords. Precisely because of the specificity of these terms, it was decided not to consider the relationships between the words, as done in
Figure 3, since it this could lead to unhelpful and misleading considerations. Indeed, considering the thematic breadth, nuances and connections would be lost. In this analysis, specific process parameters can be identified, such as speed, pressure, temperature, or energy. Beyond that, the problem of background noise becomes apparent, related to the concept of the working environment and the non-linear processes. If attention is focused, however, on the concept of fault detection and fault diagnosis, some more peculiar concepts emerge, including: pattern recognition; degradation; class, meaning fault class; degree, meaning the level of gravity of a fault; fault feature; feature vector; fault pattern; fault type; or operating mode. As far as techniques and methods are concerned, the presence of the AUDyC algorithm, the spectral kurtosis, the self-organizing maps, and the intrinsic mode function is revealed. Finally, the concept of real-time application and outlier is identified by the analysis. This analysis is a first investigation of the thematic area, based on the occurrence of terms. Thus, through the LDA, it will be possible to analyze the contributions in more depth, also showing the thematic connections. The results obtained from this first investigation, however, already allow a wide-ranging vision of themes that are present and treated in the selected contributions.
A geographical analysis of contributions shows that publications still take place in very scattered and varied journals, just as no specific cluster is currently identified for authors. For this reason, it was decided to shift the focus to the afferent nations of the research centers, as shown in
Figure 5.
This analysis shows an incredible preponderance of China on this research topic. It is necessary to clarify that the sum of the occurrences of contributions for countries is greater than the number of total contributions because the same contribution belongs to more countries when cross-national research teams have been found in the literature. These are:
Canada–Italy
Canada–France
Switzerland–Italy
China–Japan
France–Italy
Colombia–France
China–Hong Kong
3. LDA Application
Before going into detail about the results obtained from the literature review, it is important to give a brief introduction to understand the LDA and its application. Following what is also shown by [
17], this research applied the five steps for the application of LDA. The first four steps implement the essential text pre-processing stage: tokenization; sparse terms removal and stop-words removal; stemming and lemmatization; and N-grams tagging. At the end of these text pre-processing stages, there is a final stage, called text features extraction. Specifically, it is to underline that LDA has been applied to a new text generated by the merge of title, abstract and keywords. The LDA was proposed by [
16], and is currently one of the most widely used techniques for document analysis and topic assignment. Given an analyzed text,
D, which is identified with the term corpus, with
M documents, in which a specific document
d has
words, for each document in
D the LDA algorithm provides the following generative process [
16]:
- 1.
Select a multinomial distribution for topic t (t ∈{1,…, T}) from a Dirichlet distribution with parameter β;
- 2.
Select a multinomial distribution for document d (d ∈{1,…, M}) from a Dirichlet distribution with parameter α;
- 3.
For a word (n ∈ {1,…, }) in document d,
- ◦
Select a topic from ;
- ◦
Select a word from .
The assumption behind the LDA technique is that a document is written by authors as a set of different topics and each document has its peculiar distribution of topics [
17]. Two parameters characterize the LDA:
α, that represents, considering each of the topics identified in the document, the probability that the document under consideration belongs to each of the topics;
β, that represents, considering each of the tokens, what is the probability that the topic under consideration contains each of the tokens.
In the process presented above, the only variables observed are the words in the documents.
φ and
θ are latent variables and α and β are hyperparameters [
22]. The next step is to calculate and maximize the probability of the observed data
D, which following what has been proposed in the previous contribution [
22], follows (1):
An issue to be considered, if attention is drawn to (1), is that of exact inference in LDA, which turns out to be intractable due to the coupling between
θ and
φ [
22]. Some approximate algorithms are used in this respect, such as variational inference [
16] or Markov chain Monte Carlo [
23].
The optimum number of topics is chosen using a perplexity score, a statistical measure of how well a statistical model describes a dataset, with lower perplexity denoting a better probabilistic model [
22], and a coherence score that represents the semantic similarity between high scoring words in the topic value [
24].
To define perplexity, it evaluates how well the dataset is described by the statistical model. Perplexity is defined as (2) [
16]:
For the coherence score, higher values are sought, considering that the value moves between 0 and 1. In the specific case of this research, the analysis works on text strings of abstract, title, and keywords.
The coherence score (3) is calculated considering [
25]:
where
The final coherence score is the result of the arithmetic mean of all .
3.1. Tokenization
To proceed with the analysis of a written text, it is paramount to identify the units that compose it, specifically the linguistic ones. The linguistic units into which the text being analyzed is broken down are called tokens, hence the term tokenization. There is no single way to define what a token is within the considered text. This choice depends on the objectives of the research and the structure of the text. In the specific case of this contribution, it was decided to consider spaces as token delimiters. In order to clean the text, all punctuation has been removed. It will then be these remaining units that will go on to define, after being processed, the thematic areas of interest in the analyzed domain.
3.2. Sparse Terms Removal and Stop-Words Removal
After the identification of the tokens that make up the analyzed text, a further phase must be implemented to eliminate superfluous words. The term superfluous, which is then captured in the terms “stop words”, refers to two concepts of words. On the one hand, there are words that in themselves do not convey any meaning of their own, such as adverbs or articles, and on the other, words which have no meaning in the analysis being implemented. In the details of this contribution, for example, all words that do not refer to algorithms, fields of application, or functionalities of the techniques identified were eliminated. In this type of analysis, therefore, it is relevant to identify which objectives are being pursued, to be able to guide the various steps that make up the analysis. On the contrary, sparse terms are instead those that occur in less than 1% of the documents [
17]. In general, to avoid problems when analyzing the text, it is a good rule of thumb to eliminate words present in the search key. In the research presented in this contribution, the stop words removal has been performed twice: immediately after the tokenization phase and after the stemming and lemmatization phase, which will be presented in the following paragraphs.
3.3. Stemming & Lemmatization
For the definition of stemming and lemmatization, reference is made to [
26]. Stemming is the procedure of reducing a word to its germ, i.e., to the terminological root of that term. Lemmatization is directly linked to the stemming phase. Specifically, it uses part of speech tagging for each identified word, (e.g., verb, noun, etc.). The phases are directly linked because the lemmatization phase allows the definition of the tags to be attributed to the tokens identified previously. Subsequently, based on the lemmatization, specific stemming rules are applied to the tokens.
3.4. N-Grams Tagging
The term N-grams refers to a group of N words that often appear together in the analyzed document. In this contribution are considered only sequences of two words, i.e., b-grams, and sequences of three words, i.e., tri-grams.
3.5. Text Features Extraction
This phase permits the definition of the importance of the remaining terms, following the implementation of the steps presented above. This extraction is based on two concepts:
How many times a word appears in each document;
How much a word appears in documents, giving little weight to those that appear in many and more weight to those that appear in a few.
4. Findings from the Literature Review
After discussing the application steps of the LDA, this section of the paper will go into detail about the evidence found in the literature review. Beyond this, the results obtained by applying LDA will be evaluated, defining whether the categorization of contributions obtained corresponds to the real content of the papers.
The analysis carried out with the LDA led to the definition of four clusters within the analyzed thematic area. This value was defined because of the highest coherence score obtained. As explained above, each contribution was assessed, resulting in a value being assigned to each of the four identified topics. Each paper was attributed to the topic with higher membership value. The graphical display of the topics, following the proposal in [
27], represents how the application of the LDA clustered the thematic area. Each bubble represents a topic, considering that the bigger the bubble, the more prevalent the topic. This mean that in
Figure 6 the size of the bubbles represents, for the 30 most frequent terms derived from the linguistic analysis, how relevant (in complexity) the specific topics are in the definition of these terms. A model is considered effective when the bubbles are fairly big, non-overlapping and scattered throughout the chart instead of being clustered in one quadrant. To be more specific, the identified topics are plotted in a two-dimensional space, where the centers are determined by calculating the distances between the topics. The inter-topic distances are then projected using multidimensional scaling onto a two-dimensional space [
28]. The authors decided to utilize the default settings [
27], which are Jensen–Shannon divergence for computing inter-topic distances and Principal Components for scaling the set of inter-topic distances. The clustering of the identified topics is clear and well-defined, but the identified thematic sub-areas do not have points in common. From this initial observation it can be deduced that, according to the logic of the LDA, the terminology makes it easy to identify specific thematic areas, which certainly have their own peculiarities, but also points of contact with other topics.
At first glance, it can already be seen that, apart from topic 2 which has the most contributions, the other three topics has similar size. All acronyms are detailed in
Appendix A, so as not to create difficulties in reading the paper.
The next step check how the selected keywords describe areas of interest, also considering the coherence between them and the papers labeled with them. A first comparison shows that some keywords are present in several clusters, indicating thematic transversality. An obvious example is that of the keywords “diagnosis”, “detect”, “pattern”, and “extract”. These keywords are objective, in the sense of the objective being pursued in the research in which they are encountered. This plurality should not come as a surprise, as it is quite evident that these activities occur in various fields of application and with different techniques. In general, considering also that each paper is allocated to each of the tasks with a specific percentage of membership, it is important to consider that the allocations are indicative of the topic that is mostly contained in that contribution. However, some contributions present transversal themes and have been allocated to a specific contribution either because of the connection with the other themes of the selected topic or because that particular thematic area is predominant in it. In general, therefore, this clustering cannot be considered watertight compartmentalization since the various thematic areas talk to each other. Another point of attention is the application context. For example, the term “bear” (the root of the word “bearing”) is present in three clusters, just as the term gearbox is present in two. This is not an error in categorizing the contributions, but the evidence that bearings and gearboxes are often case studies to test algorithms, and widespread components.
For the same reason, after a careful reading of the papers, some contributions were moved from one topic to another, based on the authors’ considerations. Considering the proportion between the number of contributions and papers moved by the authors, this is not considered a limitation of the model. Some words may be misinterpreted by the model.
In general, therefore, the predominant role of the LDA in this type of research, from the experience gained for the analysis presented in this contribution, is to highlight points of attention not only within individual clusters but of the thematic field in general. This makes it possible to understand trends within the research, but also how the same theme may have been approached with different modalities.
In the following paragraphs, the different topics will be analyzed without mentioning all the selected contributions as some of them deal with related issues and would be redundant, making the reading of the paper more difficult. Moreover, considering that the application of the LDA allows a membership probability of the contributions to the specific topic, it is possible to describe each topic only through the contributions with the highest levels of belonging. The topics are summarized with an ideal title, considering its most recognizable characteristic, but without claiming to summarize in the ideal title all the aspects of the topic papers.
4.1. Topic 1—Chemical Context
The predominant role in this topic is played by chemical plants, which are the focus of research in various ways. This is not surprising, as the literature shows that chemical processes tend to be the ones with the most time-varying characteristics. Interestingly, in the chemical context, clustering helped several applications, such as the identification of fault subclasses in contexts where faults exhibit time-varying characteristics [
29]. Similarly, in penicillin production processes, clustering has been used to identify the specific production stage in the batch process [
30]. This contribution also ties in with the keywords in topic 2, in which phase partitioning is applied with clustering. In this contribution [
30], it is highlighted that the analyzed process belongs to the world of chemical processes, while in topic 2 the focus is on phase recognition, and the production process assumes a pure case study. Moreover, this contribution [
30] is the only one applying the AdTsPCA. As further analysis of the chemical context, more specifically petrochemicals, clustering allows the identification of the operating modes present in the process, based on a process variable highlighting the change, to develop specific models for the operating modes identified [
31]. Entering into the field of water distribution and treatment, clustering again showed interesting performance. In general, water distribution systems are assimilated to chemical plants because of the frequent use of chemical substances to ensure water potability. These systems are fragile due to their high number of components. There are several flow regimes, and clustering allows their modeling and recognition, through self-organizing maps and the analysis of pressure [
32]. Similarly, wastewater treatment processes have also seen the application of clustering applied to predict the trend of the data pattern, specifically the fuzzy c-means [
33]. Considering instead the bearing analyses attributed to this cluster, they are mainly based on the analysis of impulsive vibration signals. In this case, clustering is a generalization of k-means, to support the separation of the impulsive components of the vibration signals [
34]. Finally, the fault diagnosis of gearboxes is treated by considering vibrations [
35]. It is to mention the proposal of the innovative AdTsPCA technique [
30] in this topic. The last two concepts available are the recursiveness of some of the proposed algorithms and methods [
29,
31,
33] and the use of multifractal spectrum parameters as fault features [
35]. The issue of non-linearity is transversal to the various topics and not specific to this one, suggesting a future research developments.
4.2. Topic 2—Multiphase Processes and Variable Batch Time Production
This topic presents the highest number of contributions. This makes it more complex to analyze. The first theme in this topic is phase partitioning, which is closely linked to the concept of the batch and the concept of the production phase. Batch processes often have the characteristic of being multi-phase and clustering algorithms focus on this. An interesting algorithm is the density peaks clustering [
36] that manages not only the individual phases but also the transition between them. A problem in phase partitioning is that some techniques, such as fuzzy c-means clustering, require an a priori definition of the number of phases to be identified. This is not always possible. To overcome this limitation, an adaptive fuzzy c-means is proposed [
37]. The variable batch duration time leads to a difficult or impossible phase analysis based on its duration. Sequence-constraint fuzzy c-means handles this situation [
2]. In this contribution, in addition to uneven batch durations, attention is also paid to the identification of steady and transitional phases within production batches. This latter feature is also the focus of analysis in other contributions, which propose, for example, kernel entropy component analysis as an algorithm for phase partitioning [
38], based on the divergence of kernel entropy. Specific subjects in this topic are bearings, data denoising, and vibrations. Bearings, as mentioned above, have been a much-investigated subject, with focuses on specific characteristics. Bearing-related contributions use vibration as a central parameter and the problem of noise and its consequent data denoising as a research focus. In these contributions, with an unusual application, a k-means clustering helps to evaluate the efficacy of the proposed model (e.g., a denoising model) [
39]. Another contribution, again with the help of k-means, suggests the application of K-SVD-based sparse representation method clustering to implement dictionary learning and extract information from vibration impulses [
40]. Another contribution proposes the application of clustering based on spectrum overlap coefficient and kurtosis index to implement the extraction of periodic pulses from bearing vibration signals [
41]. This last contribution highlights another of the keywords presented for this topic, namely the topic of periodic impulses, which are signals that presumably indicate the presence of a fault [
41]. Other concepts that appear in this topic are the previously mentioned data denoising, signal decomposition, self-organizing maps, and wavelet transforms. Specifically, there are some contributions with the joint application of signal decomposition approaches and self-organizing maps for fault diagnosis, with the ensemble empirical mode decomposition [
42] as well as wavelet transform [
43,
44]. Another contribution in this topic highlighting the presence of noise is [
45], in which spectrum entropy clustering is applied to extract features to be used for fault diagnosis analysis in a gear system. Another solution proposes the application of a recursive clustering algorithm for diagnostic analysis [
46]. Clustering for noise management is important because it allows analyses to be implemented without having prior knowledge of the process, e.g., applying the algorithm of mean shift clustering [
47]. Two other keywords that carry a common concept are kurtosis and spectral kurtosis (SK). One of the previously mentioned contributions already highlighted the concept of kurtosis, specifically by using a kurtosis index for the process of extracting periodic vibration impulses [
41]. In another contribution, kurtosis is used to create two indicators of the health status of a grinding chatter, defining a kind of kurtosis possibility density function benchmark to compare the kurtosis of the test data. In this context, clustering, specifically k-means, has the role of assessing the goodness of the results [
48]. Spectral kurtosis was also used for diagnostic purposes in a gearbox, defining a diagnostic feature. Here too, clustering takes on a controlling role, being used to define the probability of a correct diagnosis [
49]. Among the keywords, k-means also stands out, as among the clustering algorithms present in this one, it is the one with the highest number of hits. In this topic, as in topic 1, some of the proposed solutions involve a recursive approach [
46].
4.3. Topic 3—General Power Generation and Transmission
In this topic, we found several contributions about power generation and transmission, with the exclusion of photovoltaic applications (see Topic 4). The application of clustering on faults data led to a discriminant model in detecting the defects of power transmission lines using k-means, improving inspections rules and safety [
50]. The latter is a non-negligible issue in this context. The topic includes contributions explicitly linked to prognosis analyses. The role of clustering is exploratory, to extract information that sets the probability of failure occurrence over a specific time frame [
51,
52]. Interestingly, these two contributions share two important points: the first is the clustering algorithm used, i.e., AUto-adaptive and Dynamical Clustering, and the second is the concept of slow fault evolution. The slow evolution of a failure tends to be more problematic to analyze, making it necessary to structure the entire analysis on this specific characteristic. Research into the fault management of wind turbines is becoming increasingly important, and here too the concept of clustering and variability overtime is being investigated. Wind turbines present a high level of complexity due to the high variability of their operating conditions. Based on this, clustering, e.g., k-means, is proposed for identifying the operating conditions of wind turbines [
53]. The topic of bearings is also addressed, with more contributions. Bearings are one of the most-investigated areas in the condition maintenance literature. In this topic, compared to, e.g., topic 1, it is addressed without focusing on impulsive signals that can be extracted from vibration measurements. In this sub-area, while still using vibration analysis, clustering takes on a more diagnostic role, used as a tool to identify the nature of the fault [
54]. Similar analyses, using the same algorithm but with different parameters, specifically the energy ratios of the intrinsic mode functions of the bearings, have also been carried out in other research projects [
55]. The same parameter is found, with the same diagnostic objectives, in other contributions to bearing analysis [
56]. In the theme of slowly evolving faults, a contribution on temperature controllers shows the application of the AUto-adaptive and Dynamical Clustering technique to estimate the probability of occurrence of a fault. This gives insight about the algorithm performance [
57]. The analysis on the techniques highlights the fuzzy c-means technique, mainly applied for the bearings monitoring [
54,
55], and different contexts [
58]. The same contributions and [
56,
59] show a fruitful application of the decomposition of monitored signals into intrinsic mode functions, to use some extracted information as a discriminative feature within the analysis. Another important technique in this topic is the empirical mode decomposition, for the decomposition of monitored signals [
54,
55,
56,
59,
60]. The temperature theme, highlighted among the keywords, relates to the topic of temperature controller monitoring [
51,
57].
4.4. Topic 4—Intelligent Diagnosis
The last identified topic is now analyzed. The first highlighted content is photovoltaic (PV) systems. Considering the energy context, power generation appears as descriptive of the topic, as in Topic 3. The currents generated and present in PVs have non-stationary characteristics. In this case, the LOF (local outlier factor) technique is used not only to identify the fault, but also to assess its degree of severity [
61]. It is interesting that this technique appears to be applied only in the context of photovoltaic installations, despite being an established technique in the study of anomaly identification. In this context, clustering is proposed to apply a wavelet cluster-based bandpass filtering in the data pre-processing phase to obtain the fault-sensitive envelope signal for hydraulic pumps [
62]. This topic considers ageing gearboxes, already presented in topic 1. As with the bearings, some differences have led to their separate analysis. In this topic, different techniques are used for the detection and diagnosis of gearbox faults, such as series wavelet analysis and fuzzy clustering method [
63]. Analyses always start with vibration analysis, but then evolve with different techniques. This deviates from the characteristics outlined in the contribution assigned to topic 1. In addition, bearings and gears are explicitly considered separately in this contribution, which was not made explicit in the previous contributions allocated in other topics. In this topic, the analyses of gearboxes are closely linked to those of conveyor belts. Clustering is here applied considering not only the most common vibration analyses [
64], but also some temperature analyses [
65]. Taking up one of the terms highlighted as representative of this topic, namely the concept of decision making, this is explicitly stressed in the context of conveyor belts [
64,
65]. Another recurring theme in topic 4 is bearings. In this case, the commonality in this subgroup of articles is that local mean decomposition is applied to the analysis of bearing health [
66,
67,
68]. The cluster takes on the role of a tool for fault diagnosis [
66] or a technique to support fractional lower order p-function optimization [
67,
68]. The topic 4 applications of clustering in fault diagnosis focus on the analysis of inrush current and internal faults [
69]. The latter relates to the concept of “internal faults”, which is considered representative of this topic. Techniques that characterized topic 4 are curvilinear component analysis (CCA), applied in the field of bearings [
70] and PCA, which is used for dimensionality reduction and elimination of collinearity, where clustering is instead used to identify known or new events [
71].
5. Discussion and Conclusions
Following the analysis of the four topics, conclusions can be drawn not only on the current state of clustering research, but also on the current role of LDA in this type of analysis. Starting from the analysis of the literature, it is interesting and important to note that, although research is evolving, there are still many scenarios and contexts to be investigated. In detail, although some sectors such as chemicals and petrochemicals present some analyses, there is more of a tendency to analyze specific components rather than industrial processes in their entirety. The main exception to this is batch processes, where clustering tends to identify the sub-phases or operations modes of the process. In general, however, it is possible to say that clustering has mainly the purpose of helping to extract information for further analysis or has the role of a diagnostic tool. The application of the LDA shows that time-variant contexts often present evidence of non-linear trends. This is clear studying the keywords extracted by the LDA algorithm, where the word “non-linear” is present in all four topics. The same applies to the term “fuzzy”, which is present in all four topics; fuzzy clustering encompasses numerous techniques that are highly applied in various contexts. As also mentioned during the contribution, bearings, consistent with maintenance analyses in general, are the most common mechanical element studied in time-varying situations. Another piece of evidence is that k-mean and fuzzy c-means clustering are the most widely used clustering algorithms, due to their widespread use and ease of application compared to other techniques. However, their limitations are also emphasized, and new solutions are proposed.
Some further evidence stands out. First, researchers still do not give particular attention to the multi-component systems, which are extremely prevalent in real industrial contexts, and mechanical systems are commonly considered as a single element. In general, except for PCA, multivariate statistical techniques related to clustering are scarcely present. This ties in with the evidence that the contributions present little insights to deal with the process non-linearities.
The results of the application of LDA could certainly be considered positive. As mentioned in the introduction phase, some contributions were shifted between the various clusters, but this did not compromise the successful implementation of the LDA. LDA, regardless of the topic allocation, made it possible to have a view of some thematic areas of interest and peculiar techniques, before reading the studies. Based on this, the reading of the papers was certainly more conscious and rational. The reason is two-fold. Firstly, the reading of the papers focuses on the concepts expressed by the keywords of the specific topic, allowing us to identify, for example, correlations between techniques and application contexts that otherwise could have been missed. Similarly, having already extracted the keywords of all the topics, it was easy to identify incorrect allocations, as well as transversal themes between the various topics. In addition, considering a cross-cutting theme such as bearings, it was possible to quickly identify small thematic sub-areas within the larger theme. In addition, the availability of a measure for every content of the contribution to the topic lets the researcher start with those with higher values of belonging. In this way, when the contributions with a lower level of belonging were read, it was possible to identify immediately whether it was necessary to modify their allocation and whether they took up a theme already presented in other read contributions. In general, therefore, the application of LDA should be seen as a valid pre-processing phase for the subsequent literature reviews. The issue of topic clustering is interesting and relevant, but, according to the authors, the most important outcome is the definition of keywords, as a guide for the reading of the contributions. For this reason, extreme emphasis must be given to the stop words that are inserted, which will outline how the keywords will then be defined. Therefore, the aim of the review is a priority before starting LDA, to insert in the stop words the terms that do not fit into the search. This process is iterative, because only with subsequent applications of the LDA will there be a global and complete overview of the words to be eliminated.
As regards the analysis of future research developments in clustering applied to time-varying process monitoring, some interesting insights emerged. Certainly, it is worthwhile to further emphasize the concept of non-linearity of processes by analyzing various specific monitoring techniques for handling this feature, such as kernel principal component analysis. Phase partitioning and identification of the operating modes of a process emerge as promising research areas for clustering. The idea, which is relevant to the test, is to use clustering to divide the whole production process into steps or activities, overcoming the most common batch view. What differentiates this approach from the identification of operational modes is two-fold: firstly, the use of all the variable measured in the process and not just a few of these; secondly, a conceptual difference lead from the recognition of process phases by operational modes to a recognition of the trends sufficiently homogeneous to be analyzed together with a dedicated model, suggesting a process phase. Different operational modes could be analyzed jointly, just as the same operational mode in different configurations. Finally, considering the actual limitations in the application of techniques such as canonical variate analysis and multivariate statistics in general for time-varying processes, a possible research development could be to use clustering as a pre-processing stage for these techniques. The two last proposed research scenarios can converge into one, considering the recognition of the process phases with clustering just as a pre-processing step for multivariate statistics.


