
Altered Dynamic Functional Connectivity of Cuneus in Schizophrenia Patients: A Resting-State fMRI Study

 ,
,  ,
, 
Abstract
:1. Introduction
2. Materials and Methods
2.1. Participants
2.2. Data Preprocessing
2.3. Regions of Interest Definition and Network
2.4. Static Resting-State Functional Connectivity
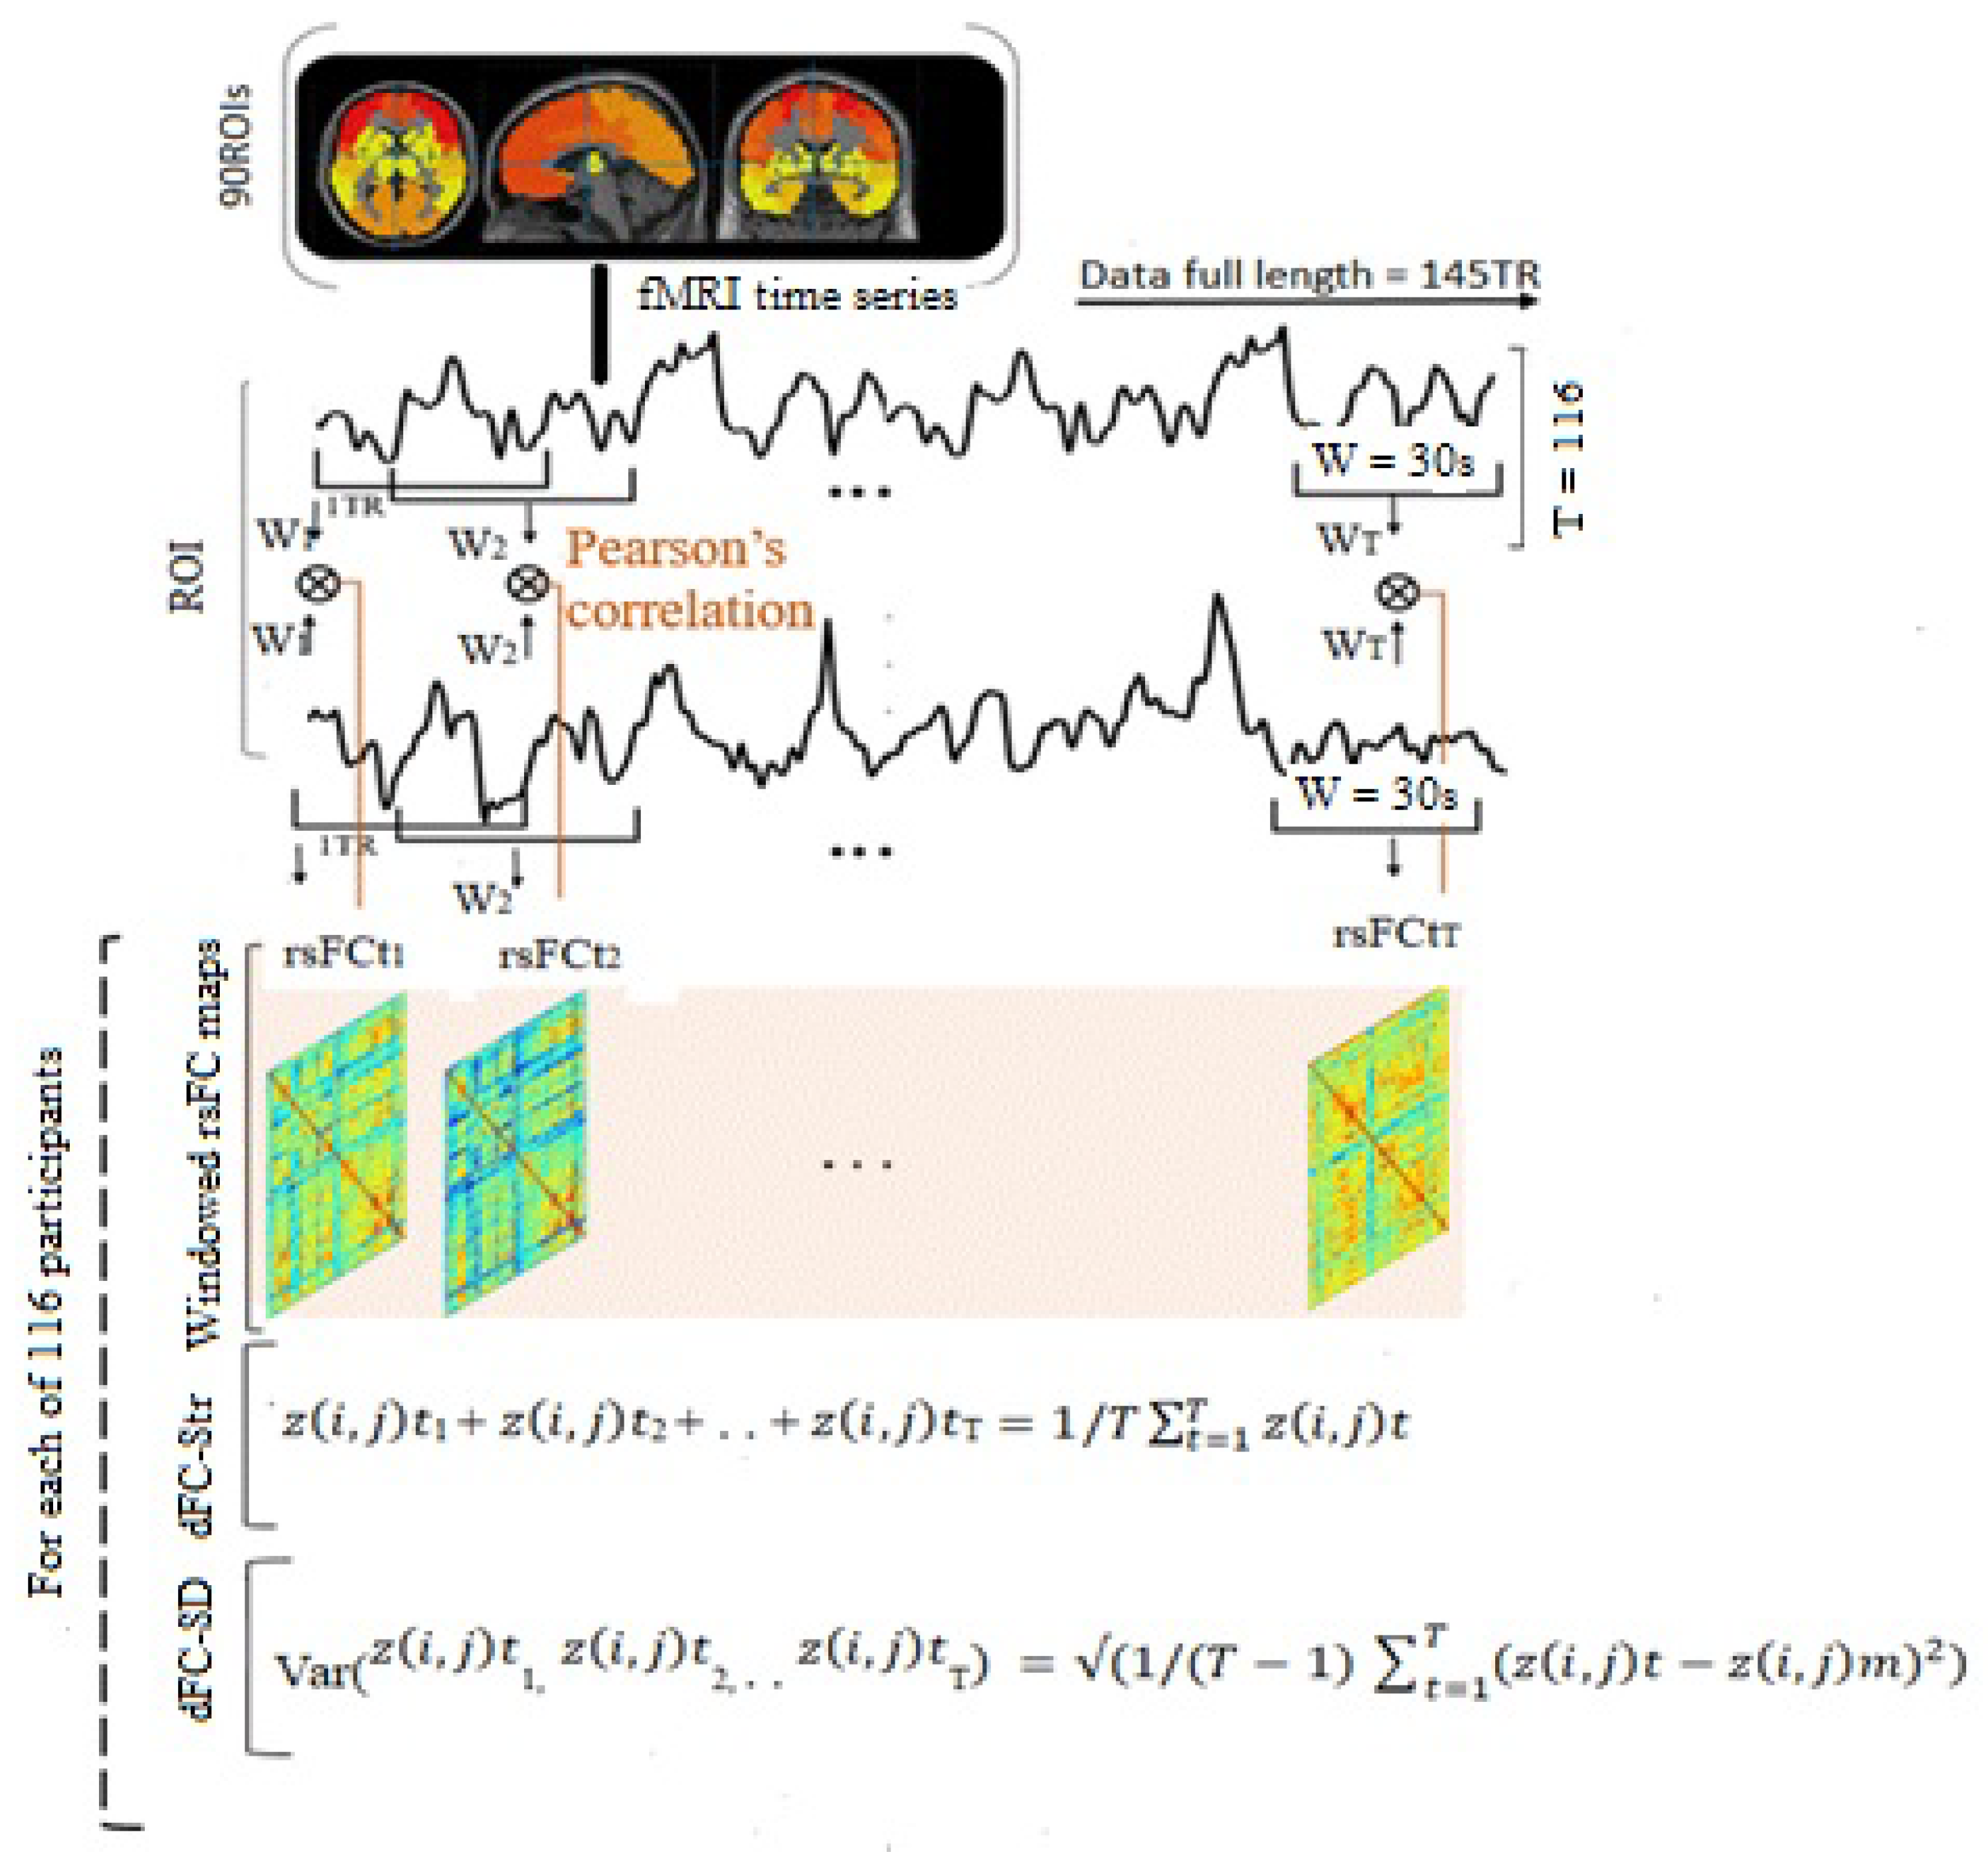
2.5. Dynamic Resting-State Functional Connectivity
2.6. Measurements of the Dynamic Characteristics
2.7. Characterization of dFC States’ Property
2.8. Statistical Analyses
3. Results
3.1. Participants’ Demographic and Neuropsychological Evaluation
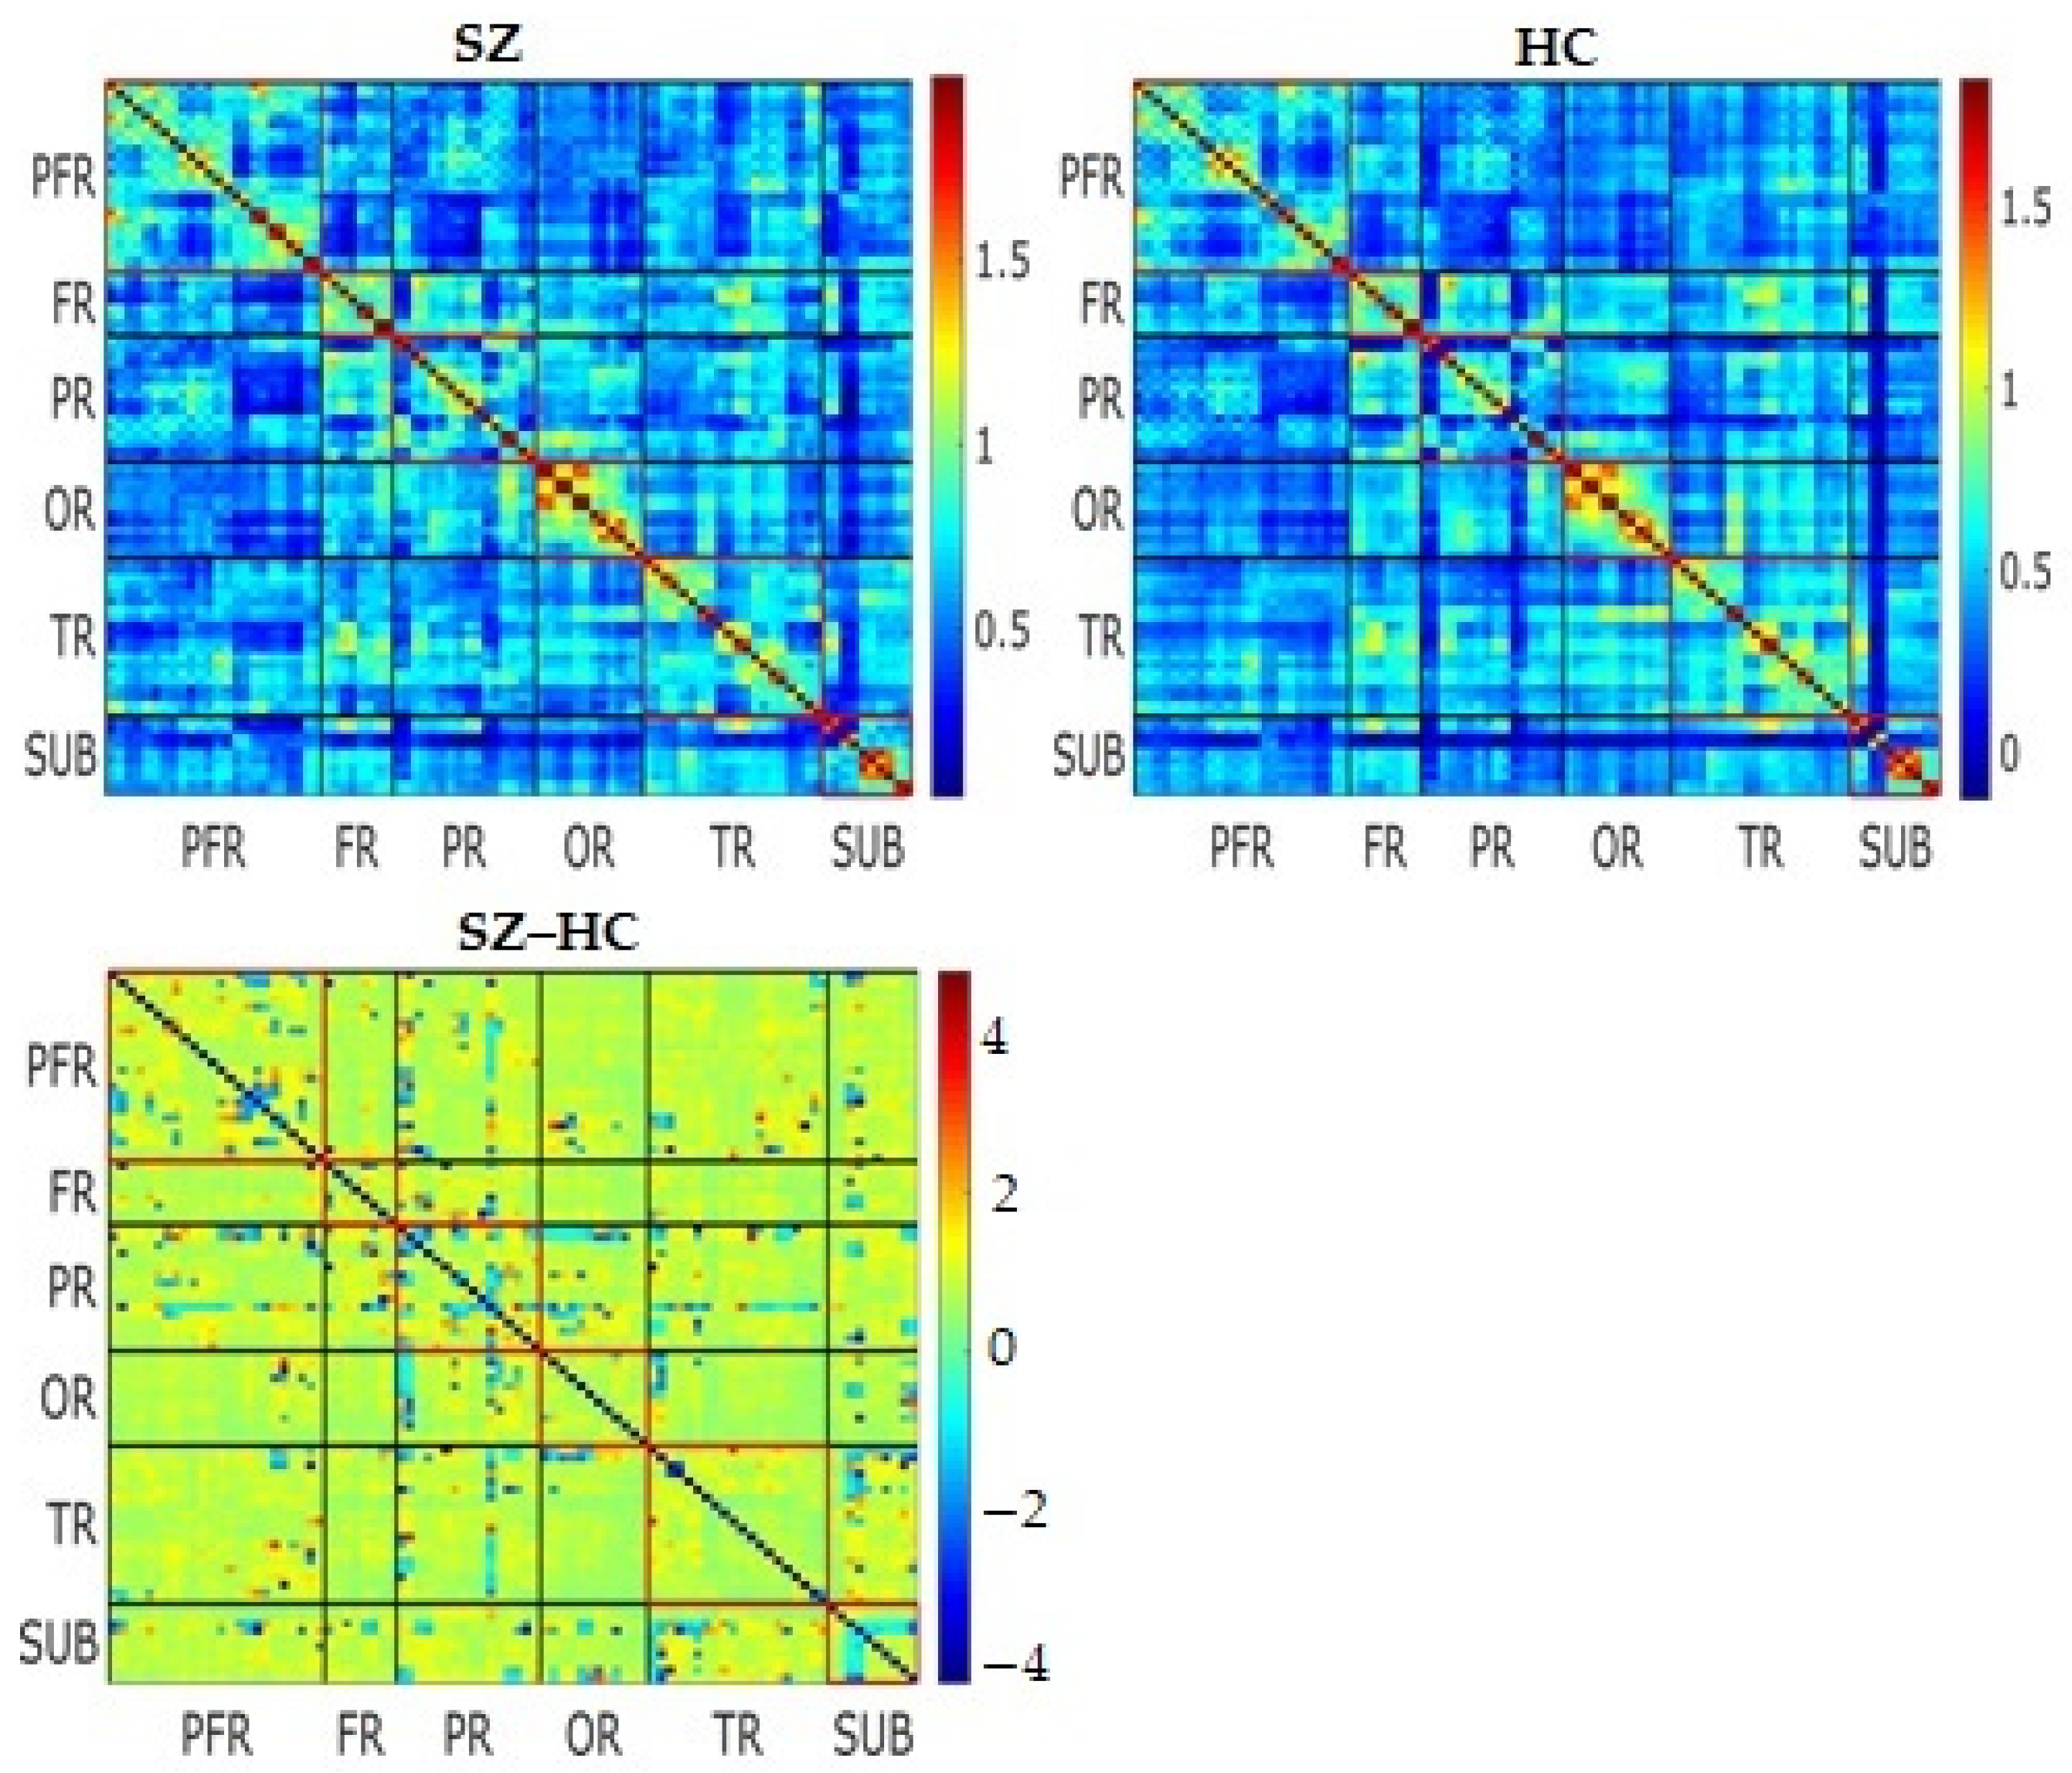
3.2. Static Functional Connectivity
3.3. Dynamic Functional Connectivity
4. Discussion
Limitations
5. Conclusions
Supplementary Materials
Author Contributions
Funding
Informed Consent Statement
Data Availability Statement
Acknowledgments
Conflicts of Interest
References
- Weber, S.; Johnsen, E.; Kroken, R.A.; Løberg, E.-M.; Kandilarova, S.; Stoyanov, D.; Kompus, K.; Hugdahl, K. Dynamic Functional Connectivity Patterns in Schizophrenia and the Relationship With Hallucinations. Front. Psychiatry 2020, 11, 227. [Google Scholar] [CrossRef]
- Tanaka, M.; Tóth, F.; Polyák, H.; Szabó, Á.; Mándi, Y.; Vécsei, L. Immune Influencers in Action: Metabolites and Enzymes of the Tryptophan-Kynurenine Metabolic Pathway. Biomedicines 2021, 9, 734. [Google Scholar] [CrossRef]
- Volkow, N.D. Substance Use Disorders in Schizophrenia—Clinical Implications of Comorbidity. Schizophr. Bull. 2009, 35, 469–472. [Google Scholar] [CrossRef] [PubMed] [Green Version]
- Goff, D.C.; Henderson, D.C.; Amico, E. Cigarette smoking in schizophrenia: Relationship to psychopathology and medication side effects. Am. J. Psychiatry 1992, 149, 1189–1194. [Google Scholar] [CrossRef] [PubMed]
- Rog, J.; Błażewicz, A.; Juchnowicz, D.; Ludwiczuk, A.; Stelmach, E.; Kozioł, M.; Karakula, M.; Niziński, P.; Karakula-Juchnowicz, H. The Role of GPR120 Receptor in Essential Fatty Acids Metabolism in Schizophrenia. Biomedicines 2020, 8, 243. [Google Scholar] [CrossRef] [PubMed]
- Freyhan, F.A. Course and outcome of schizophrenia. Am. J. Psychiatry 2006, 112, 161–169. [Google Scholar] [CrossRef] [PubMed]
- Häfner, H.; der Heiden, W.A. The course of schizophrenia in the light of modern follow-up studies: The ABC and WHO studies. Eur. Arch. Psychiatry Clin. Neurosci. 1999, 249, S14–S26. [Google Scholar] [CrossRef] [PubMed]
- Tsang, H.W.H.; Leung, A.Y.; Chung, R.C.K.; Bell, M.; Cheung, W.-M. Review on vocational predictors: A systematic review of predictors of vocational outcomes among individuals with schizophrenia: An update since 1998. Aust. N. Z. J. Psychiatry 2010, 44, 495–504. [Google Scholar] [CrossRef] [PubMed]
- Komatsu, H.; Watanabe, E.; Fukuchi, M. Psychiatric Neural Networks and Precision Therapeutics by Machine Learning. Biomedicines 2021, 9, 403. [Google Scholar] [CrossRef]
- Kim, J.; Kim, Y.-K. Crosstalk between Depression and Dementia with Resting-State fMRI Studies and Its Relationship with Cognitive Functioning. Biomedicines 2021, 9, 82. [Google Scholar] [CrossRef] [PubMed]
- Biswal, B.; Yetkin, F.Z.; Haughton, V.M.; Hyde, J.S. Functional connectivity in the motor cortex of resting human brain using echo-planar MRI. Magn. Reson. Med. 1995, 34, 537–541. [Google Scholar] [CrossRef]
- Smitha, K.A.; Akhil Raja, K.; Arun, K.M.; Rajesh, P.G.; Thomas, B.; Kapilamoorthy, T.R.; Kesavadas, C. Resting state fMRI: A review on methods in resting state connectivity analysis and resting state networks. Neuroradiol. J. 2017, 30, 305–317. [Google Scholar] [CrossRef] [PubMed]
- Mathalon, D.H.; Ford, J.M. Divergent approaches converge on frontal lobe dysfunction in schizophrenia. Am. J. Psychiatry 2008, 165, 944–948. [Google Scholar] [CrossRef] [PubMed] [Green Version]
- Mazoyer, B.; Zago, L.; Mellet, E.; Bricogne, S.; Etard, O.; Houdé, O.; Crivello, F.; Joliot, M.; Petit, L.; Tzourio-Mazoyer, N. Cortical networks for working memory and executive functions sustain the conscious resting state in man. Brain Res. Bull. 2001, 54, 287–298. [Google Scholar] [CrossRef]
- Damaraju, E.; Allen, E.A.; Belger, A.; Ford, J.M.; McEwen, S.; Mathalon, D.H.; Mueller, B.A.; Pearlson, G.D.; Potkin, S.G.; Preda, A.; et al. Dynamic functional connectivity analysis reveals transient states of dysconnectivity in schizophrenia. NeuroImage Clin. 2014, 5, 298–308. [Google Scholar] [CrossRef] [PubMed] [Green Version]
- Balogh, L.; Tanaka, M.; Török, N.; Vécsei, L.; Taguchi, S. Crosstalk between Existential Phenomenological Psychotherapy and Neurological Sciences in Mood and Anxiety Disorders. Biomedicines 2021, 9, 340. [Google Scholar] [CrossRef] [PubMed]
- Jiang, R.; Calhoun, V.D.; Zuo, N.; Lin, D.; Li, J.; Fan, L.; Qi, S.; Sun, H.; Fu, Z.; Song, M.; et al. Connectome-based individualized prediction of temperament trait scores. Neuroimage 2018, 183, 366–374. [Google Scholar] [CrossRef] [PubMed]
- Hsu, W.-T.; Rosenberg, M.D.; Scheinost, D.; Constable, R.T.; Chun, M.M. Resting-state functional connectivity predicts neuroticism and extraversion in novel individuals. Soc. Cogn. Affect. Neurosci. 2018, 13, 224–232. [Google Scholar] [CrossRef] [Green Version]
- Rosenberg, M.D.; Finn, E.S.; Scheinost, D.; Papademetris, X.; Shen, X.; Constable, R.T.; Chun, M.M. A neuromarker of sustained attention from whole-brain functional connectivity. Nat. Neurosci. 2015, 19, 165–171. [Google Scholar] [CrossRef] [Green Version]
- Chang, C.; Glover, G.H. Time-frequency dynamics of resting-state brain connectivity measured with fMRI. Neuroimage 2010, 50, 81–98. [Google Scholar] [CrossRef] [Green Version]
- Hutchison, R.M.; Womelsdorf, T.; Gati, J.S.; Everling, S.; Menon, R.S. Resting-state networks show dynamic functional connectivity in awake humans and anesthetized macaques. Hum. Brain Mapp. 2013, 34, 2154–2177. [Google Scholar] [CrossRef] [PubMed]
- Du, Y.; Fryer, S.L.; Fu, Z.; Lin, D.; Sui, J.; Chen, J.; Damaraju, E.; Mennigen, E.; Stuart, B.; Loewy, R.L.; et al. Dynamic functional connectivity impairments in early schizophrenia and clinical high-risk for psychosis. Neuroimage 2018, 180, 632–645. [Google Scholar] [CrossRef]
- He, H.; Luo, C.; He, C.; He, M.; Du, J.; Biswal, B.B.; Yao, D.; Yao, G.; Duan, M. Altered Spatial Organization of Dynamic Functional Network Associates With Deficient Sensory and Perceptual Network in Schizophrenia. Front. Psychiatry 2021, 12, 687580. [Google Scholar] [CrossRef] [PubMed]
- Calhoun, V.D.; Miller, R.; Pearlson, G.; County, B. The Chronnectome: Time-Varying Connectivity Networks as the Next Frontier in fMRI Data Discovery. Neuron 2014, 84, 262–274. [Google Scholar] [CrossRef] [Green Version]
- Hutchison, R.M.; Womelsdorf, T.; Allen, E.A.; Bandettini, P.A.; Calhoun, V.D.; Corbetta, M.; Della Penna, S.; Duyn, J.H.; Glover, G.H.; Gonzalez-Castillo, J.; et al. Dynamic functional connectivity: Promise, issues, and interpretations. Neuroimage 2013, 80, 360–378. [Google Scholar] [CrossRef] [PubMed] [Green Version]
- Rashid, B.; Arbabshirani, M.; Damaraju, E.; Cetin, M.; Miller, R.; Pearison, G.; Calhoun, V.D. Classification of schizophrenia and bipolar patients using static and dynamic resting-state fMRI brain connectivity. Neuroimage 2016, 134, 645–657. [Google Scholar] [CrossRef] [PubMed] [Green Version]
- Cetin, M.S.; Houck, J.M.; Rashid, B.; Agacoglu, O.; Stephen, J.M.; Sui, J.; Canive, J.; Mayer, A.; Aine, C.; Bustillo, J.R.; et al. Multimodal Classification of Schizophrenia Patients with MEG and fMRI Data Using Static and Dynamic Connectivity Measures. Front. Neurosci. 2016, 10, 466. [Google Scholar] [CrossRef] [PubMed] [Green Version]
- Breakspear, M.; Terry, J.R.; Friston, K.J.; Harris, A.W.F.; Williams, L.M.; Brown, K.; Brennan, J.; Gordon, E. A disturbance of nonlinear interdependence in scalp EEG of subjects with first episode schizophrenia. Neuroimage 2003, 20, 466–478. [Google Scholar] [CrossRef]
- Friston, K.J. The disconnection hypothesis. Schizophr. Res. 1998, 30, 115–125. [Google Scholar] [CrossRef]
- Pearlson, G.D.; Marsh, L. Structural brain imaging in schizophrenia: A selective review. In Biological Psychiatry; Elsevier: Amsterdam, The Netherlands, 1999; Volume 46, pp. 627–649. [Google Scholar]
- Calhoun, V.D.; Sui, J.; Kiehl, K.; Turner, J.; Allen, E.; Pearlson, G. Exploring the psychosis functional connectome: Aberrant intrinsic networks in schizophrenia and bipolar disorder. Front. Psychiatry 2012, 2, 75. [Google Scholar] [CrossRef] [PubMed] [Green Version]
- Whitfield-Gabrieli, S.; Thermenos, H.W.; Milanovic, S.; Tsuang, M.T.; Faraone, S.V.; McCarley, R.W.; Shenton, M.E.; Green, A.I.; Nieto-Castanon, A.; LaViolette, P.; et al. Hyperactivity and hyperconnectivity of the default network in schizophrenia and in first-degree relatives of persons with schizophrenia. Proc. Natl. Acad. Sci. USA 2009, 106, 1279–1284. [Google Scholar] [CrossRef] [Green Version]
- Salvador, R.; Sarró, S.; Gomar, J.J.; Ortiz-Gil, J.; Vila, F.; Capdevila, A.; Bullmore, E.; McKenna, P.J.; Pomarol-Clotet, E. Overall brain connectivity maps show cortico-subcortical abnormalities in schizophrenia. Hum. Brain Mapp. 2010, 31, 2003–2014. [Google Scholar] [CrossRef] [PubMed]
- Fornito, A.; Zalesky, A.; Pantelis, C.; Bullmore, E.T. Schizophrenia, neuroimaging and connectomics. Neuroimage 2012, 62, 2296–2314. [Google Scholar] [CrossRef]
- Ding, K.; Liu, Y.; Yan, X.; Lin, X.; Jiang, T. Altered functional connectivity of the primary visual cortex in subjects with amblyopia. Neural Plast. 2013, 2013, 612086. [Google Scholar] [CrossRef] [PubMed]
- Li, S.; Li, P.; Gong, H.; Jiang, F.; Liu, D.; Cai, F.; Pei, C.; Zhou, F.; Zeng, X. Intrinsic functional connectivity alterations of the primary visual cortex in primary angle-closure glaucoma patients before and after surgery: A resting-State fMRI study. PLoS ONE 2017, 12, e0170598. [Google Scholar] [CrossRef] [PubMed] [Green Version]
- Su, T.; Yuan, Q.; Liao, X.L.; Shi, W.Q.; Zhou, X.Z.; Lin, Q.; Min, Y.L.; Li, B.; Jiang, N.; Shao, Y. Altered intrinsic functional connectivity of the primary visual cortex in patients with retinal vein occlusion: A resting-state fMRI study. Quant. Imaging Med. Surg. 2020, 10, 958–969. [Google Scholar] [CrossRef] [PubMed]
- Cohen, R.A. Cuneus. In Encyclopedia of Clinical Neuropsychology; Springer: New York, NY, USA, 2011; pp. 756–757. [Google Scholar]
- Laycock, R.; Cross, A.J.; Lourenco, T.; Crewther, S.G. Dorsal stream involvement in recognition of objects with transient onset but not with ramped onset. Behav. Brain Funct. 2011, 7, 34. [Google Scholar] [CrossRef] [Green Version]
- Parker, J.G.; Zalusky, E.J.; Kirbas, C. Functional MRI mapping of visual function and selective attention for performance assessment and presurgical planning using conjunctive visual search. Brain Behav. 2014, 4, 227–237. [Google Scholar] [CrossRef]
- Noguchi, Y.; Inui, K.; Kakigi, R. Temporal dynamics of neural adaptation effect in the human visual ventral stream. J. Neurosci. 2004, 24, 6283–6290. [Google Scholar] [CrossRef] [PubMed] [Green Version]
- Zeki, S. The disunity of consciousness. Trends Cogn. Sci. 2003, 7, 214–218. [Google Scholar] [CrossRef]
- Haldane, M.; Cunningham, G.; Androutsos, C.; Frangou, S. Structural brain correlates of response inhibition in Bipolar Disorder I. J. Psychopharmacol. 2008, 22, 138–143. [Google Scholar] [CrossRef] [PubMed]
- Crockford, D.N.; Goodyear, B.; Edwards, J.; Quickfall, J.; El-Guebaly, N. Cue-induced brain activity in pathological gamblers. Biol. Psychiatry 2005, 58, 787–795. [Google Scholar] [CrossRef]
- PDeweerd, P.; Iii, M.R.P.; DeSimone, R.; Ungerleider, L.G. Loss of attentional stimulus selection after extrastriate cortical lesions in macaques. Nat. Neurosci. 1999, 2, 753–758. [Google Scholar] [CrossRef] [PubMed]
- Calhoun, V.D.; Adali, T.; Pearlson, G.D.; Pekar, J.J. A method for making group inferences from functional MRI data using independent component analysis. Hum. Brain Mapp. 2001, 14, 140–151. [Google Scholar] [CrossRef]
- Calhoun, V.D.; Liu, J.; Adali, T. A review of group ICA for fMRI data and ICA for joint inference of imaging, genetic, and ERP data. Neuroimage 2009, 45, S163–S172. [Google Scholar] [CrossRef] [Green Version]
- Calhoun, V.D.; Adali, T. Multisubject independent component analysis of fMRI: A decade of intrinsic networks, default mode, and neurodiagnostic discovery. IEEE Rev. Biomed. Eng. 2012, 5, 60–73. [Google Scholar] [CrossRef] [Green Version]
- Leonardi, N.; Richiardi, J.; Gschwind, M.; Simioni, S.; Annoni, J.M.; Schluep, M.; Vuilleumier, P.; Van De Ville, D. Principal components of functional connectivity: A new approach to study dynamic brain connectivity during rest. Neuroimage 2013, 83, 937–950. [Google Scholar] [CrossRef] [PubMed] [Green Version]
- Allen, E.A.; Damaraju, E.; Plis, S.M.; Erhardt, E.B.; Eichele, T.; Calhoun, V.D. Tracking whole-brain connectivity dynamics in the resting state. Cereb. Cortex 2014, 24, 663–676. [Google Scholar] [CrossRef] [PubMed]
- Cordes, D.; Haughton, V.; Carew, J.D.; Arfanakis, K.; Maravilla, K. Hierarchical clustering to measure connectivity in fMRI resting-state data. Magn. Reson. Imaging 2002, 20, 305–317. [Google Scholar] [CrossRef]
- Li, X.; Zhu, D.; Jiang, X.; Jin, C.; Zhang, X.; Guo, L.; Zhang, J.; Hu, X.; Li, L.; Liu, T. Dynamic functional connectomics signatures for characterization and differentiation of PTSD patients. Hum. Brain Mapp. 2014, 35, 1761–1778. [Google Scholar] [CrossRef] [Green Version]
- Lohmann, G.; Margulies, D.S.; Horstmann, A.; Pleger, B.; Lepsien, J.; Goldhahn, D.; Schloegl, H.; Stumvoll, M.; Villringer, A.; Turner, R. Eigenvector centrality mapping for analyzing connectivity patterns in fMRI data of the human brain. PLoS ONE 2010, 5, e10232. [Google Scholar] [CrossRef] [PubMed]
- Norman, K.A.; Polyn, S.M.; Detre, G.J.; Haxby, J. V Beyond mind-reading: Multi-voxel pattern analysis of fMRI data. Trends Cogn. Sci. 2006, 10, 424–430. [Google Scholar] [CrossRef] [PubMed]
- Zhu, F.; Kapitan, J.; Tranter, G.E.; Pudney, P.D.A.; Isaacs, N.W.; Hecht, L.; Barron, L.D. Residual structure in disordered peptides and unfolded proteins from multivariate analysis and ab initio simulation of Raman optical activity data. Proteins Struct. Funct. Bioinform. 2008, 70, 823–833. [Google Scholar] [CrossRef] [PubMed]
- Achard, S.; Salvador, R.; Whitcher, B.; Suckling, J.; Bullmore, E. A resilient, low-frequency, small-world human brain functional network with highly connected association cortical hubs. J. Neurosci. 2006, 26, 63–72. [Google Scholar] [CrossRef] [PubMed]
- Buckner, R.L.; Sepulcre, J.; Talukdar, T.; Krienen, F.M.; Liu, H.; Hedden, T.; Andrews-Hanna, J.R.; Sperling, R.A.; Johnson, K.A. Cortical hubs revealed by intrinsic functional connectivity: Mapping, assessment of stability, and relation to Alzheimer’s disease. J. Neurosci. 2009, 29, 1860–1873. [Google Scholar] [CrossRef] [PubMed] [Green Version]
- A Mini Review on Different Methods of Functional-MRI Data Analysis. Available online: https://www.fortunejournals.com/articles/a-mini-review-on-different-methods-of-functionalmri-data-analysis.html (accessed on 17 May 2021).
- COBRE. Available online: http://fcon_1000.projects.nitrc.org/indi/retro/cobre.html (accessed on 29 October 2020).
- Yan, C.G.; Wang, X.D.; Zuo, X.N.; Zang, Y.F. DPABI: Data Processing & Analysis for (Resting-State) Brain Imaging. Neuroinformatics 2016, 14, 339–351. [Google Scholar] [CrossRef]
- SPM12 Software-Statistical Parametric Mapping. Available online: https://www.fil.ion.ucl.ac.uk/spm/software/spm12/ (accessed on 29 September 2020).
- MATLAB-MathWorks-MATLAB & Simulink. Available online: https://www.mathworks.com/products/matlab.html (accessed on 28 September 2020).
- Friston, K.J.; Williams, S.; Howard, R.; Frackowiak, R.S.J.; Turner, R. Movement-related effects in fMRI time-series. Magn. Reson. Med. 1996, 35, 346–355. [Google Scholar] [CrossRef] [PubMed]
- Ashburner, J. A fast diffeomorphic image registration algorithm. Neuroimage 2007, 38, 95–113. [Google Scholar] [CrossRef]
- Biswal, B.B. Resting state fMRI: A personal history. Neuroimage 2012, 62, 938–944. [Google Scholar] [CrossRef]
- He, C.; Chen, Y.; Jian, T.; Chen, H.; Guo, X.; Wang, J.; Wu, L.; Chen, H.; Duan, X. Dynamic functional connectivity analysis reveals decreased variability of the default-mode network in developing autistic brain. Autism Res. 2018, 11, 1479–1493. [Google Scholar] [CrossRef] [PubMed]
- Xin, Q.; Ortiz-Terán, L.; Diez, I.; Perez, D.L.; Ginsburg, J.; El Fakhri, G.; Sepulcre, J. Sequence Alterations of Cortical Genes Linked to Individual Connectivity of the Human Brain. Cereb. Cortex 2018, 29, 3828–3835. [Google Scholar] [CrossRef]
- Power, J.D.; Barnes, K.A.; Snyder, A.Z.; Schlaggar, B.L.; Petersen, S.E. Spurious but systematic correlations in functional connectivity MRI networks arise from subject motion. Neuroimage 2012, 59, 2142–2154. [Google Scholar] [CrossRef] [PubMed] [Green Version]
- Tzourio-Mazoyer, N.; Landeau, B.; Papathanassiou, D.; Crivello, F.; Etard, O.; Delcroix, N.; Mazoyer, B.; Joliot, M. Automated anatomical labeling of activations in SPM using a macroscopic anatomical parcellation of the MNI MRI single-subject brain. Neuroimage 2002, 15, 273–289. [Google Scholar] [CrossRef]
- Wang, K.; Liang, M.; Wang, L.; Tian, L.; Zhang, X.; Li, K.; Jiang, T. Altered functional connectivity in early Alzheimer’s disease: A resting-state fMRI study. Hum. Brain Mapp. 2007, 28, 967–978. [Google Scholar] [CrossRef]
- Preti, M.G.; Bolton, T.A.W.; Van De Ville, D. The dynamic functional connectome: State-of-the-art and perspectives. Neuroimage 2017, 160, 41–54. [Google Scholar] [CrossRef] [PubMed]
- Shakil, S.; Lee, C.H.; Keilholz, S.D. Evaluation of sliding window correlation performance for characterizing dynamic functional connectivity and brain states. Neuroimage 2016, 133, 111–128. [Google Scholar] [CrossRef] [Green Version]
- Li, Y.; Zhu, Y.; Nguchu, B.A.; Wang, Y.; Wang, H.; Qiu, B.; Wang, X. Dynamic Functional Connectivity Reveals Abnormal Variability and Hyper-connected Pattern in Autism Spectrum Disorder. Autism Res. 2020, 13, 230–243. [Google Scholar] [CrossRef] [PubMed]
- Yu-Feng, Z.; Yong, H.; Chao-Zhe, Z.; Qing-Jiu, C.; Man-Qiu, S.; Meng, L.; Li-Xia, T.; Tian-Zi, J. Altered baseline brain activity in children with ADHD revealed by resting-state functional MRI. Brain Dev. 2007, 29, 83–91. [Google Scholar] [CrossRef]
- Vidaurre, D.; Smith, S.M.; Woolrich, M.W. Brain network dynamics are hierarchically organized in time. Proc. Natl. Acad. Sci. USA 2017, 114, 12827–12832. [Google Scholar] [CrossRef] [Green Version]
- Benjamini, Y.; Hochberg, Y. Controlling the False Discovery Rate: A Practical and Powerful Approach to Multiple Testing. J. R. Stat. Soc. Ser. B Methodol. 1995, 57, 289–300. [Google Scholar] [CrossRef]
- Genovese, C.R.; Lazar, N.A.; Nichols, T. Thresholding of Statistical Maps in Functional Neuroimaging Using the False Discovery Rate. Neuroimage 2002, 15, 870–878. [Google Scholar] [CrossRef] [PubMed] [Green Version]
- Wang, J.; Wang, X.; Xia, M.; Liao, X.; Evans, A.; He, Y. GRETNA: A graph theoretical network analysis toolbox for imaging connectomics. Front. Hum. Neurosci. 2015, 9, 386. [Google Scholar]
- Aine, C.J.; Bockholt, H.J.; Bustillo, J.R.; Cañive, J.M.; Caprihan, A.; Gasparovic, C.; Hanlon, F.M.; Houck, J.M.; Jung, R.E.; Lauriello, J.; et al. Multimodal Neuroimaging in Schizophrenia: Description and Dissemination. Neuroinformatics 2017, 15, 343–364. [Google Scholar] [CrossRef] [PubMed]
- Wang, L.; Alpert, K.I.; Calhoun, V.D.; Cobia, D.J.; Keator, D.B.; King, M.D.; Kogan, A.; Landis, D.; Tallis, M.; Turner, M.D.; et al. SchizConnect: Mediating neuroimaging databases on schizophrenia and related disorders for large-scale integration. Neuroimage 2016, 124, 1155–1167. [Google Scholar] [CrossRef] [PubMed] [Green Version]
- Xiang, Y.; Wang, J.; Tan, G.; Wu, F.X.; Liu, J. Schizophrenia Identification Using Multi-View Graph Measures of Functional Brain Networks. Front. Bioeng. Biotechnol. 2020, 7, 479. [Google Scholar] [CrossRef]
- Yang, B.; Chen, Y.; Shao, Q.-M.; Yu, R.; Li, W.-B.; Guo, G.-Q.; Jiang, J.-Q.; Pan, L. Schizophrenia Classification Using fMRI Data Based on a Multiple Feature Image Capsule Network Ensemble. IEEE Access 2019, 7, 109956–109968. [Google Scholar] [CrossRef]
- Wang, H.L.S.; Rau, C.L.; Li, Y.M.; Chen, Y.P.; Yu, R. Disrupted thalamic resting-state functional networks in schizophrenia. Front. Behav. Neurosci. 2015, 9, 45. [Google Scholar] [CrossRef] [Green Version]
- Yu, T.; Li, Y.; Fan, F.; Cao, H.; Luo, X.; Tan, S.; Yang, F.; Zhang, X.; Shugart, Y.Y.; Hong, L.E.; et al. Decreased Gray Matter Volume of Cuneus and Lingual Gyrus in Schizophrenia Patients with Tardive Dyskinesia is Associated with Abnormal Involuntary Movement. Sci. Rep. 2018, 8, 12884. [Google Scholar] [CrossRef] [PubMed] [Green Version]
- Mané, A.; Falcon, C.; Mateos, J.J.; Fernandez-Egea, E.; Horga, G.; Lomeña, F.; Bargalló, N.; Prats-Galino, A.; Bernardo, M.; Parellada, E. Progressive gray matter changes in first episode schizophrenia: A 4-year longitudinal magnetic resonance study using VBM. Schizophr. Res. 2009, 114, 136–143. [Google Scholar] [CrossRef]
- Zhou, P.; Wang, J.; Li, T.; Wang, N.; Xian, J.; He, H. Abnormal interhemispheric resting-state functional connectivity in primary open-angle glaucoma. In Proceedings of the 2016 38th Annual International Conference of the IEEE Engineering in Medicine and Biology Society (EMBC), Orlando, FL, USA, 16–20 August 2016; pp. 4055–4058. [Google Scholar] [CrossRef]
- Ye, L.; Wei, R.; Huang, X.; Shi, W.Q.; Yang, Q.C.; Yuan, Q.; Zhu, P.W.; Jiang, N.; Li, B.; Zhou, Q.; et al. Reduction in interhemispheric functional connectivity in the dorsal visual pathway in unilateral acute open globe injury patients: A resting-state fMRI study. Int. J. Ophthalmol. 2018, 11, 1056–1060. [Google Scholar] [CrossRef] [PubMed]
- Huang, X.; Li, D.; Li, H.J.; Zhong, Y.L.; Freeberg, S.; Bao, J.; Zeng, X.J.; Shao, Y. Abnormal regional spontaneous neural activity in visual pathway in retinal detachment patients: A resting-state functional MRI study. Neuropsychiatr. Dis. Treat. 2017, 13, 2849–2854. [Google Scholar] [CrossRef] [PubMed] [Green Version]
- Giakoumatos, C.I.; Tandon, N.; Shah, J.; Mathew, I.T.; Brady, R.O.; Clementz, B.A.; Pearlson, G.D.; Thaker, G.K.; Tamminga, C.A.; Sweeney, J.A.; et al. Are structural brain abnormalities associated with suicidal behavior inpatients with psychotic disorders? J. Psychiatr. Res. 2013, 47, 1389–1395. [Google Scholar] [CrossRef] [PubMed] [Green Version]
- Minzenberg, M.J.; Lesh, T.A.; Niendam, T.A.; Yoon, J.H.; Cheng, Y.; Rhoades, R.N.; Carter, C.S. Control-related frontal-striatal function is associated with past suicidal ideation and behavior in patients with recent-onset psychotic major mood disorders. J. Affect. Disord. 2015, 188, 202–209. [Google Scholar] [CrossRef]
- Tohid, H.; Faizan, M.; Faizan, U. Alterations of the occipital lobe in schizophrenia. Neurosciences 2015, 20, 213–224. [Google Scholar] [CrossRef] [PubMed] [Green Version]
- Tordesillas-Gutierrez, D.; Ayesa-Arriola, R.; Delgado-Alvarado, M.; Robinson, J.L.; Lopez-Morinigo, J.; Pujol, J.; Dominguez-Ballesteros, M.E.; David, A.S.; Crespo-Facorro, B. The right occipital lobe and poor insight in first-episode psychosis. PLoS ONE 2018, 13, e0197715. [Google Scholar] [CrossRef] [PubMed] [Green Version]
- Glahn, D.C.; Laird, A.R.; Ellison-Wright, I.; Thelen, S.M.; Robinson, J.L.; Lancaster, J.L.; Bullmore, E.; Fox, P.T. Meta-Analysis of Gray Matter Anomalies in Schizophrenia: Application of Anatomic Likelihood Estimation and Network Analysis. Biol. Psychiatry 2008, 64, 774–781. [Google Scholar] [CrossRef] [PubMed] [Green Version]
- Argyelan, M.; Ikuta, T.; Derosse, P.; Braga, R.J.; Burdick, K.E.; John, M.; Kingsley, P.B.; Malhotra, A.K.; Szeszko, P.R. Resting-state fMRI connectivity impairment in schizophrenia and bipolar disorder. Schizophr. Bull. 2014, 40, 100–110. [Google Scholar] [CrossRef] [PubMed] [Green Version]
- Lynall, M.E.; Bassett, D.S.; Kerwin, R.; McKenna, P.J.; Kitzbichler, M.; Muller, U.; Bullmore, E. Functional connectivity and brain networks in schizophrenia. J. Neurosci. 2010, 30, 9477–9487. [Google Scholar] [CrossRef] [Green Version]
- Phillips, O.R.; Nuechterlein, K.H.; Asarnow, R.F.; Clark, K.A.; Cabeen, R.; Yang, Y.; Woods, R.P.; Toga, A.W.; Narr, K.L. Mapping corticocortical structural integrity in schizophrenia and effects of genetic liability. Biol. Psychiatry 2011, 70, 680–689. [Google Scholar] [CrossRef] [Green Version]
- Andreasen, N.C.; Flashman, L.; Flaum, M.; Arndt, S.; Swayze, V.; O’leary, D.S.; Ehrhardt, J.C.; Yuh, W.T.C. Regional Brain Abnormalities in Schizophrenia Measured With Magnetic Resonance Imaging. JAMA 1994, 272, 1763–1769. [Google Scholar] [CrossRef] [PubMed]
- Bilder, R.M.; Wu, H.; Bogerts, B.; Degreef, G.; Ashtari, M.; Alvir, J.M.J.; Snyder, P.J.; Lieberman, J.A. Absence of regional hemispheric volume asymmetries in first-episode schizophrenia. Am. J. Psychiatry 1994, 151, 1437–1447. [Google Scholar] [CrossRef] [Green Version]
- Bilder, R.M.; Wu, H.; Bogerts, B.; Ashtari, M.; Robinson, D.; Woerner, M.; Lieberman, J.A.; Degreef, G. Cerebral volume asymmetries in schizophrenia and mood disorders: A quantitative magnetic resonance imaging study. Int. J. Psychophysiol. 1999, 34, 197–205. [Google Scholar] [CrossRef]
- Achim, A.M.; Lepage, M. Episodic memory-related activation in schizophrenia: Meta-analysis. Br. J. Psychiatry 2005, 187, 500–509. [Google Scholar] [CrossRef] [PubMed] [Green Version]
- Fusar-Poli, P.; Perez, J.; Broome, M.; Borgwardt, S.; Placentino, A.; Caverzasi, E.; Cortesi, M.; Veggiotti, P.; Politi, P.; Barale, F.; et al. Neurofunctional correlates of vulnerability to psychosis: A systematic review and meta-analysis. Neurosci. Biobehav. Rev. 2007, 31, 465–484. [Google Scholar] [CrossRef]
- Li, H.; Chan, R.C.K.; McAlonan, G.M.; Gong, Q.Y. Facial emotion processing in schizophrenia: A meta-analysis of functional neuroimaging data. Schizophr. Bull. 2010, 36, 1029–1039. [Google Scholar] [CrossRef] [PubMed] [Green Version]
- Kottaram, A.; Johnston, L.; Ganella, E.; Pantelis, C.; Kotagiri, R.; Zalesky, A. Spatio-temporal dynamics of resting-state brain networks improve single-subject prediction of schizophrenia diagnosis. Hum. Brain Mapp. 2018, 39, 3663–3681. [Google Scholar] [CrossRef] [PubMed] [Green Version]
- Fu, Z.; Iraji, A.; Turner, J.A.; Sui, J.; Miller, R.; Pearlson, G.D.; Calhoun, V.D. Dynamic state with covarying brain activity-connectivity: On the pathophysiology of schizophrenia. Neuroimage 2021, 224, 117385. [Google Scholar] [CrossRef] [PubMed]
- Ma, S.; Calhoun, V.D.; Phlypo, R.; Adali, T. Dynamic changes of spatial functional network connectivity in healthy individuals and schizophrenia patients using independent vector analysis. Neuroimage 2014, 90, 196–206. [Google Scholar] [CrossRef] [Green Version]
- Zhang, Y.; Guo, G.; Tian, Y. Increased Temporal Dynamics of Intrinsic Brain Activity in Sensory and Perceptual Network of Schizophrenia. Front. Psychiatry 2019, 10, 484. [Google Scholar] [CrossRef] [Green Version]
- Bhinge, S.; Long, Q.; Calhoun, V.D.; Adali, T. Spatial Dynamic Functional Connectivity Analysis Identifies Distinctive Biomarkers in Schizophrenia. Front. Neurosci. 2019, 13, 1006. [Google Scholar] [CrossRef]
- Nguyen, T.T.; Kovacevic, S.; Dev, S.I.; Lu, K.; Liu, T.T.; Eyler, L.T. Dynamic functional connectivity in bipolar disorder is associated with executive function and processing speed: A preliminary study. Neuropsychology 2017, 31, 73–83. [Google Scholar] [CrossRef] [Green Version]
- Ding, Y.; Ou, Y.; Su, Q.; Pan, P.; Shan, X.; Chen, J.; Liu, F.; Zhang, Z.; Zhao, J.; Guo, W. Enhanced Global-Brain Functional Connectivity in the Left Superior Frontal Gyrus as a Possible Endophenotype for Schizophrenia. Front. Neurosci. 2019, 13, 145. [Google Scholar] [CrossRef]
- Fusar-Poli, P.; Allen, P.; McGuire, P. Neuroimaging studies of the early stages of psychosis: A critical review. Eur. Psychiatry 2008, 23, 237–244. [Google Scholar] [CrossRef]
- Kinney, D.K.; Matthysse, S. Genetic transmission of schizophrenia. Annu. Rev. Med. 1978, 29, 459–473. [Google Scholar] [CrossRef]
- Zhang, S.; Li, C.S.R. Functional networks for cognitive control in a stop signal task: Independent component analysis. Hum. Brain Mapp. 2012, 33, 89–104. [Google Scholar] [CrossRef] [Green Version]
- Bluhm, R.L.; Clark, C.R.; Mcfarlane, A.C.; Moores, K.A.; Shaw, M.E.; Lanius, R.A. Default network connectivity during a working memory task. Hum. Brain Mapp. 2011, 32, 1029–1035. [Google Scholar] [CrossRef]
- Law, I.; Svarer, C.; Rostrup, E.; Paulson, O.B. Parieto-occipital cortex activation during self-generated eye movements in the dark. Brain 1998, 121, 2189–2200. [Google Scholar] [CrossRef] [Green Version]
- Levy, D.L.; Holzman, P.S.; Matthysse, S.; Mendell, N.R. Eye tracking and schizophrenia: A selective review. Schizophr. Bull. 1994, 20, 47–62. [Google Scholar] [CrossRef] [Green Version]
- Yang, E.; Tadin, D.; Glasser, D.M.; Hong, S.W.; Blake, R.; Park, S. Visual context processing in schizophrenia. Clin. Psychol. Sci. 2013, 1, 5–15. [Google Scholar] [CrossRef] [PubMed] [Green Version]
- Dakin, S.; Carlin, P.; Hemsley, D. Weak suppression of visual context in chronic schizophrenia. Curr. Biol. 2005, 15, R822–R824. [Google Scholar] [CrossRef] [Green Version]
- Meltzer, H.Y.; McGurk, S.R. The effects of clozapine, risperidone, and olanzapine on cognitive function in schizophrenia. Schizophr. Bull. 1999, 25, 233–255. [Google Scholar] [CrossRef] [Green Version]
- Sambataro, F.; Blasi, G.; Fazio, L.; Caforio, G.; Taurisano, P.; Romano, R.; Di Giorgio, A.; Gelao, B.; Bianco, L.L.; Papazacharias, A.; et al. Treatment with olanzapine is associated with modulation of the default mode network in patients with schizophrenia. Neuropsychopharmacology 2010, 35, 904–912. [Google Scholar] [CrossRef] [Green Version]
- Hindriks, R.; Adhikari, M.H.; Murayama, Y.; Ganzetti, M.; Mantini, D.; Logothetis, N.K.; Deco, G. Can sliding-window correlations reveal dynamic functional connectivity in resting-state fMRI? Neuroimage 2016, 127, 242–256. [Google Scholar] [CrossRef] [PubMed] [Green Version]
- Leonardi, N.; Van De Ville, D. On spurious and real fluctuations of dynamic functional connectivity during rest. Neuroimage 2015, 104, 430–436. [Google Scholar] [CrossRef] [Green Version]
- Mokhtari, F.; Akhlaghi, M.I.; Simpson, S.L.; Wu, G.; Laurienti, P.J. Sliding window correlation analysis: Modulating window shape for dynamic brain connectivity in resting state. Neuroimage 2019, 189, 655–666. [Google Scholar] [CrossRef]


| Schizophrenia (n = 72) | Healthy Controls (n = 74) | p-Value | |
|---|---|---|---|
| Age (years) Sex (Female/Male) Handed-ness Right/Left/Both | 38.17 ± 13.89 | 35.82 ± 11.58 | 0.270 1 |
| 14/58 | 23/51 | 0.106 2 | |
| 60/10/2 | 71/1/2 | 0.106 2 | |
| IQ | (n = 68) | (n = 67) | |
| Verbal | 97.88 ± 16.73 | 106.79 ± 11.16 | <0.001 1 |
| Performance | 102.68 ± 16.64 | 114.03 ± 12.32 | <0.001 1 |
| Sum | 99.59 ± 16.86 | 108.33 ± 11.83 | <0.001 1 |
| PANSS (n = 72) | |||
| Positive scale | 14.96 ± 4.83 | ||
| Negative scale | 14.53 ± 4.83 | ||
| General | 29.22 ± 8.34 | ||
| Education (years) | 12.99 ± 1.84 | 13.52 ± 1.75 | 0.089 1 |
| Illness duration (years, n = 71) | 16.03 ± 12.41 |
| Diagnosis (DSM Code) | Number |
|---|---|
| Patients: Dementia of the Alzheimer’s type, with late onset, with delirium (290.3) | 1 |
| Disorganized type (295.1) | 3 |
| Catatonic type (295.2) | 1 |
| Paranoid type (295.3) | 41 |
| Residual type (295.6) | 12 |
| Bipolar type I (295.7) | 1 |
| Depresses type (295.7) | 1 |
| Schizoaffective Disorder type (295.7) | 5 |
| Undifferentiated type (295.9) | 5 |
| Bipolar Disorder type I, Most Recent Episode Mixed, In Full Remission (296.4) | 1 |
| Unspecified type schizophrenia chronic state (295.92) | 1 |
| Healthy Controls: Major Depressive Disorder, Single Episode, In Partial Remission (296.26) | 1 |
| Depressive Disorder type, Not Otherwise Specified (311) | 1 |
| Other Healthy Controls (none) | 72 |
| Time/Windows | 44 s (22 TRs) | 60 s (30 TRs) | 100 s (50 TRs) | 150 s (75 TRs) | 290 s (145 TRs) | |
|---|---|---|---|---|---|---|
| Connections | ||||||
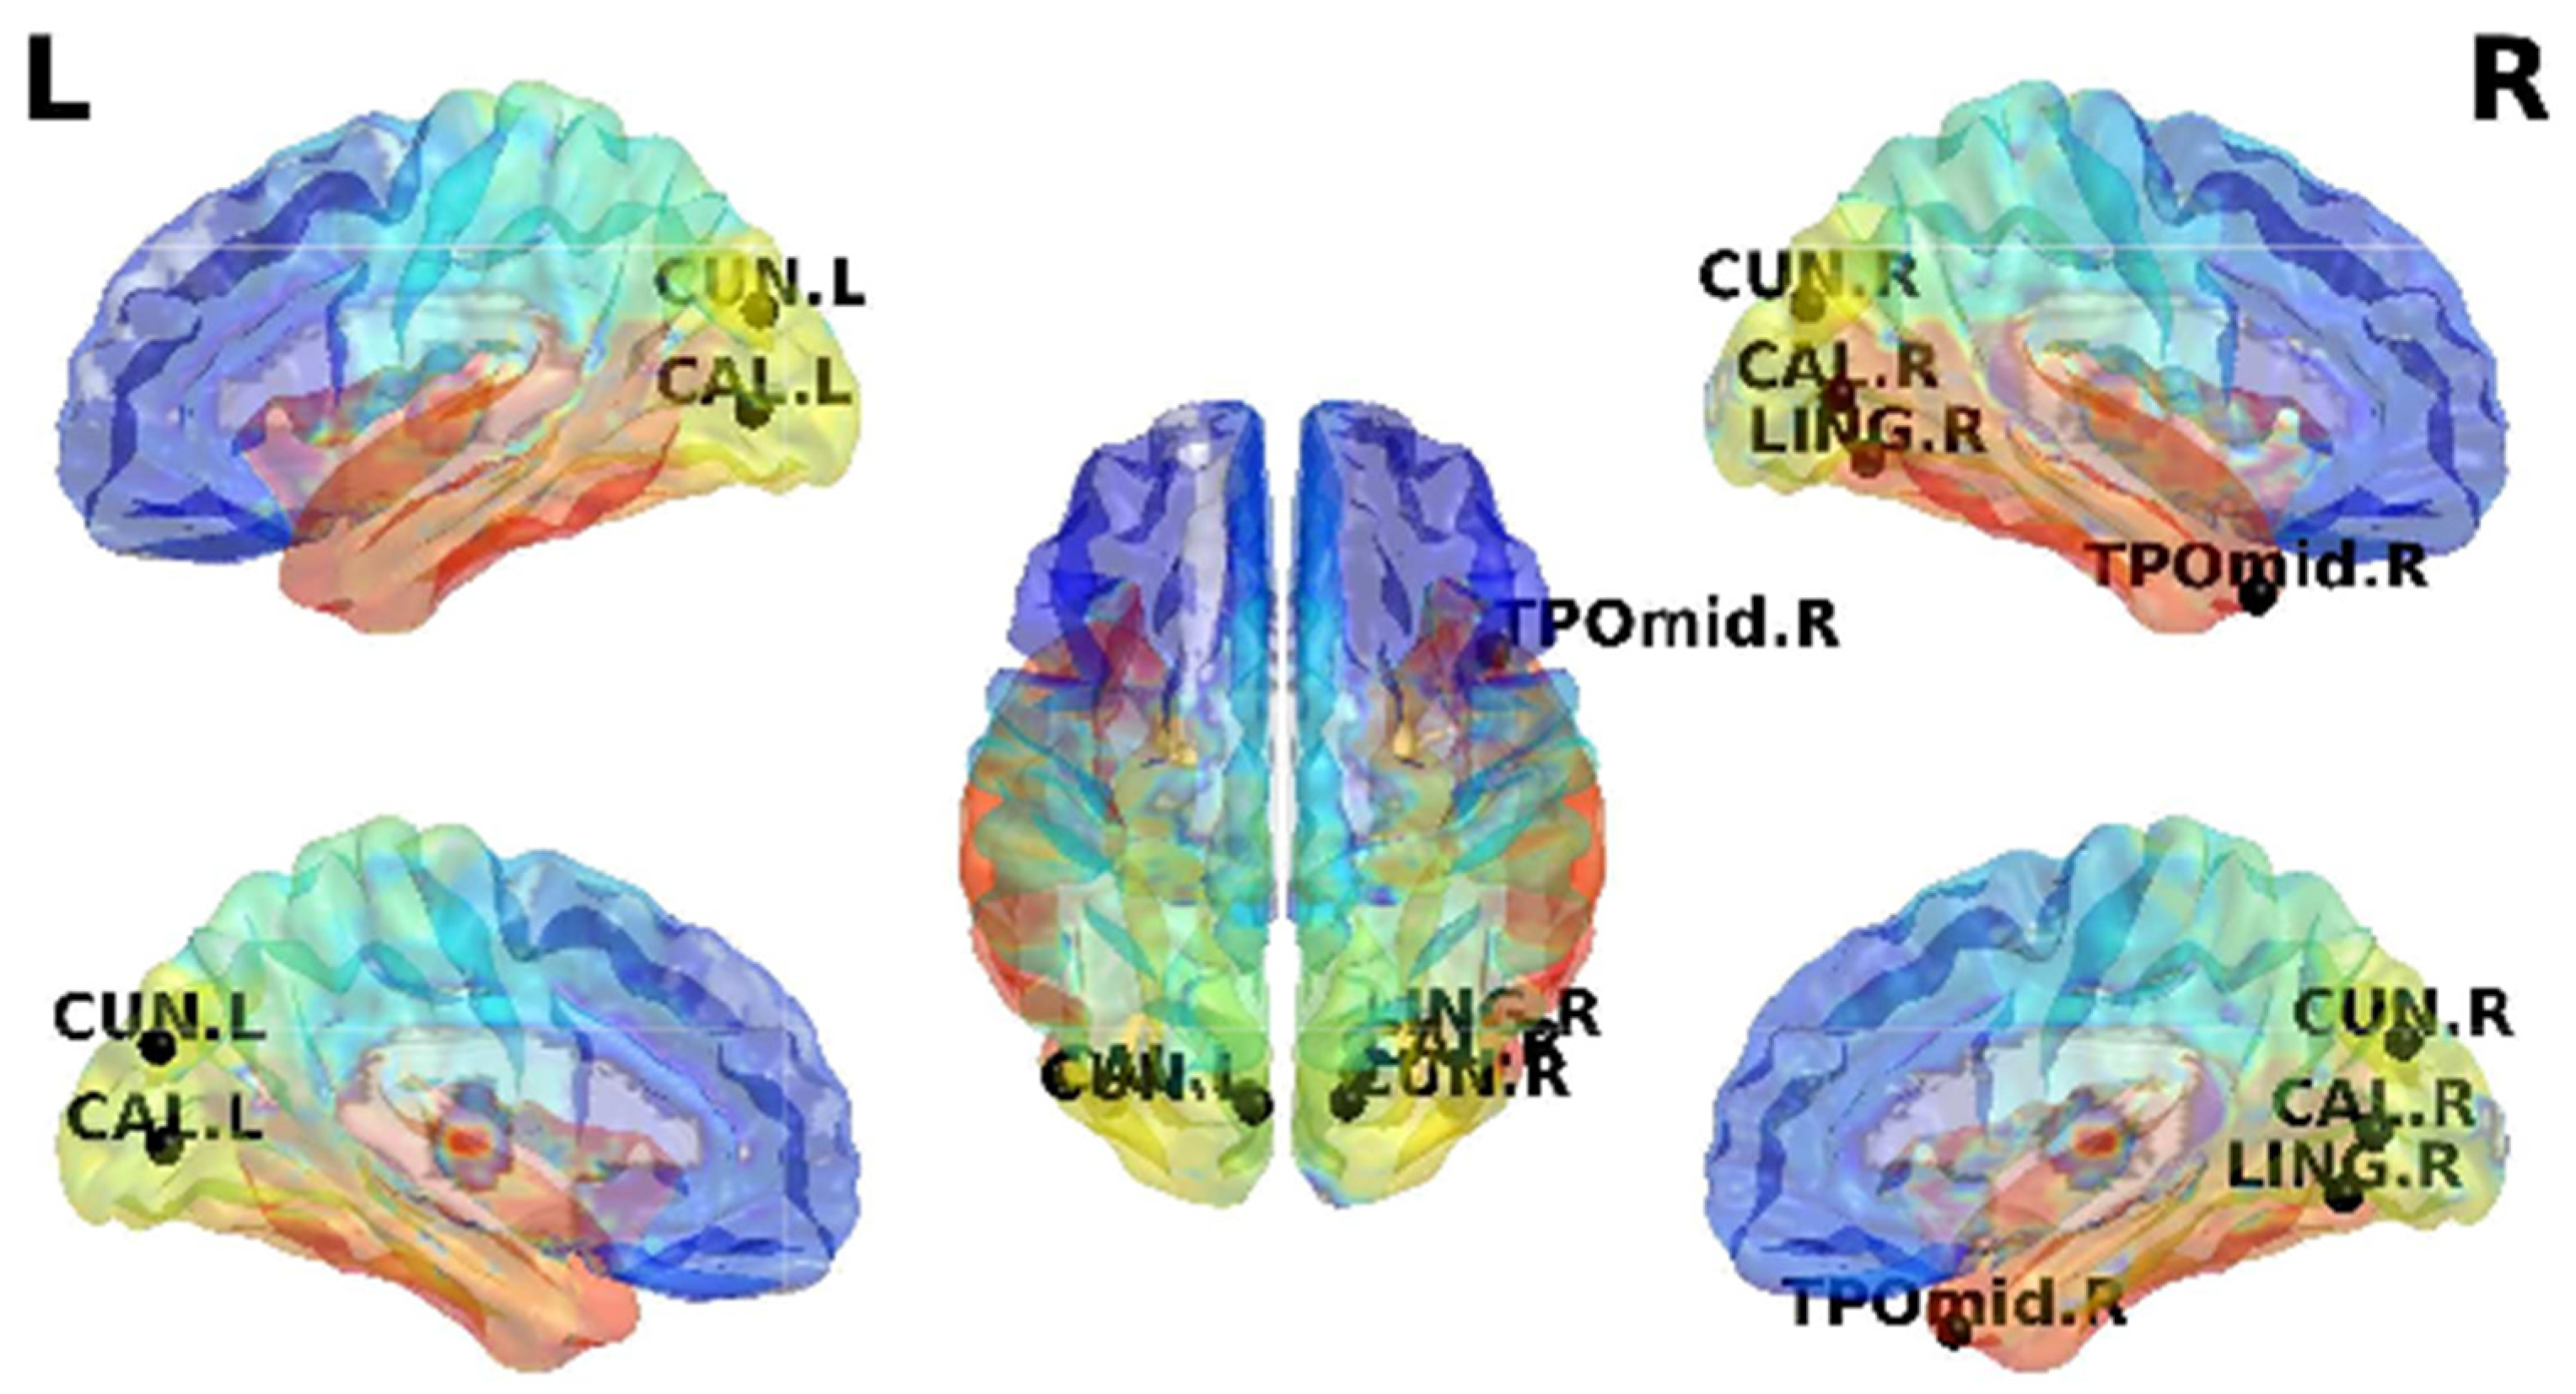
| CUN.L-CAL.R | 6.17 × 10⁻⁶ | 5.68 × 10⁻⁶ | 6.13 × 10⁻⁶ | 6.33 × 10⁻⁶ | - | |
| CUN.R-CAL.R | 1.53 × 10⁻⁵ | 1.56 × 10⁻⁵ | 4.60 × 10⁻⁵ | - | - | |
| LING.R-CUN.R | 1.89 × 10⁻⁵ | 1.98 × 10⁻⁵ | 2.40 × 10⁻⁵ | 2.12 × 10⁻⁵ | - | |
| TPOmid.R-CUN.R | 4.72 × 10⁻⁵ | 4.89 × 10⁻⁵ | 2.58 × 10⁻⁵ | 2.80 × 10⁻⁵ | - | |
Publisher’s Note: MDPI stays neutral with regard to jurisdictional claims in published maps and institutional affiliations. |
© 2021 by the authors. Licensee MDPI, Basel, Switzerland. This article is an open access article distributed under the terms and conditions of the Creative Commons Attribution (CC BY) license (https://creativecommons.org/licenses/by/4.0/).
Share and Cite
Nyatega, C.O.; Qiang, L.; Adamu, M.J.; Younis, A.; Kawuwa, H.B. Altered Dynamic Functional Connectivity of Cuneus in Schizophrenia Patients: A Resting-State fMRI Study. Appl. Sci. 2021, 11, 11392. https://doi.org/10.3390/app112311392
Nyatega CO, Qiang L, Adamu MJ, Younis A, Kawuwa HB. Altered Dynamic Functional Connectivity of Cuneus in Schizophrenia Patients: A Resting-State fMRI Study. Applied Sciences. 2021; 11(23):11392. https://doi.org/10.3390/app112311392
Chicago/Turabian StyleNyatega, Charles Okanda, Li Qiang, Mohammed Jajere Adamu, Ayesha Younis, and Halima Bello Kawuwa. 2021. "Altered Dynamic Functional Connectivity of Cuneus in Schizophrenia Patients: A Resting-State fMRI Study" Applied Sciences 11, no. 23: 11392. https://doi.org/10.3390/app112311392