
Polymerization and Collision in High Concentrations for Brownian Coagulation


1
Laboratory of Aerosol Science and Technology, China Jiliang University, Hangzhou 310000, China
2
College of Modern Science and Technology, China Jiliang University, Yiwu 322000, China
*
Authors to whom correspondence should be addressed.
Appl. Sci. 2021, 11(15), 6815; https://doi.org/10.3390/app11156815
Submission received: 15 May 2021
/
Revised: 19 July 2021
/
Accepted: 21 July 2021
/
Published: 24 July 2021
(This article belongs to the Special Issue Multiphase Flows in Microfluidics: Fundamentals and Applications)
Abstract
:Aggregation always occurs in industrial processes with fractal-like particles, especially in dense systems (the volume fraction,). However, the classic aggregation theory, established by Smoluchowski in 1917, cannot sufficiently simulate the particle dynamics in dense systems, particularly those of generat ed fractal-like particles. In this article, the Langevin dynamic was applied to study the collision rate of aggregations as well as the structure of aggregates affected by different volume fractions. It is shown that the collision rate of highly concentrated particles is progressively higher than that of a dilute concentration, and the SPSD (self-preserving size distribution) is approached (). With the increase in volume fraction, , the SPSD broadens, and the geometric standard is 1.54, 1.98, and 2.73 at . When the volume fraction, , is higher, the radius of gyration is smaller with the same cluster size (number-based), which means the particle agglomerations are in a tighter coagulation. The fractal-like property Df is in the range of 1.60–2.0 in a high-concentration system. Knowing the details of the collision progress in a high-concentration system can be useful for calculating the dynamics of coagulating fractal-like particles in the industrial process.
1. Introduction
The coagulation of nanoparticles in the air or industrial processes is an inevitable outcome; in such a process, the total particle number decreases but the mean size of the particles increases [1,2,3]. In 1927, Smoluchowski established a governing equation for describing the coagulation process, which was later called the Smoluchowski equation (SE) or coagulation equation [4]. SE is suitable for a system where one spherical particle forms once two particles collide and the volume fraction of the system, , is limited ( [5]. The basis of this SE is Einstein’s theory of particle diffusion in the flow field, which focuses on many assumptions and restrictive conditions in the process of Stokes’s steady-state force on particles and Van’t Hoff’s calculation of osmotic pressure. However, when the multiphase system is far away from the dilute phase conditions (, the distance between adjacent particles will decrease accordingly. When the distance between particles reaches the magnitude of the particle-free path, the correlation between particles cannot be ignored—that is, the SE is no longer applicable [6].
The coagulation of nanoparticles in dense conditions happens in many industrial processes. For dealing with the ultrafine particles emitted from exhaust pipes [7], dust particle agglomerations formed of clusters [8], emulsions [9], and particle coagulations, the aerosol process has been described by the Smoluchowski theory of Brownian aggregation, which refers to the random motion in a fluid [10]. It is believed that the process of particle collision mostly depends on the grain size, the concentration of particles, and the transport coefficients in the mechanism.
Early examples of research into Brownian aggregation include research on the effect of bulk stress [11]; fluid shear involving polymerization [10]; the influence of transport on the coagulation rate, such as diffusion consistency [7] and fluid viscosity shear [12]; transition regime; and the mass transfer function of the Knudsen number [13]. Such approaches, however, have failed to address the dense particulate system (effect fraction ). Simultaneously, a high solid concentration is common in industrial production—for instance, flame, plasma, and laser material synthetic technology works on high particle concentrations [14], the aerosol of aggregating clusters [15], and TiO2 aerosol agglomerate at high solid concentrations [16].
The research results of Heine and Pratsinis [15] confirmed that the classical Smoluchowski theory is limited to cases where the particle volume concentration is less than 0.1%. When the particle volume concentration is higher than this value, the collision frequency between particles is higher than the predicted value given by the Smoluchowski theory, and the collision frequency of the particles in the system is a function of the volume rate of the particles in the system. The larger the particle volume ratio is, the higher the collision frequency of the system particles is and the greater the deviation between the real situation and the predicted value of the classical Smoluchowski theory is. Based on the numerical simulation results of Langevin dynamics (LD), Heine and Pratsinis [15] and Trzeciak et al. [6] give fitting expressions for the collision frequency between particles in the dense phase state. However, although the expressions they gave are quite different in form, they do not deviate from the framework of classical Smoluchowski theory. They are all modified expressions of the classical theory, and the fitting expressions cannot be interpreted in a strictly physical meaning. It should be pointed out that Trzeciak et al. (2006) studied monodisperse systems, while Heine and Pratsnis studied polydisperse systems, but the LD simulation gave very similar results. Both Heine and Pratsinis [15] and Trzeciak et al. [6] deal with spherical particles. While in real coagulation systems, particles are normally displayed as fractal-like agglomerates or aggregates, the collision rate and dynamics of aggregates are absolutely different from those of spherical particles. Thus, it is necessary to study collisions among particles due to coagulation when these particles appear in aggregate form.
Although several methods currently exist for the measurement of collision in an aggregation, numerical simulation is currently the most popular method for investigating the particle aggregation process [11]. The Monte Carlo method [17,18] and the Moment Method [19,20,21,22,23,24] are currently the most useful methods for investigating particle dynamics. Whilst it is quite complicated to predict the trajectory tracking in the motion process of every particle with the growth of particles for aggregation, the molecular dynamics method is calculated by following the movement of particles on the molecular scale [25]. The solvent molecules are not explicitly included in the simulation but contribute to the dynamics of Brownian particles collectively as a random force. This reduces the dimensionality of the problem, making the Langevin Dynamic (L-D) less computationally intensive than the corresponding numerical simulations [26].
Here, in this article, the collision of particles affected by the volume fraction is investigated. The evolution of the population of clusters is studied in different particle volume fractions (). The nature of agglomerate particle dynamics is described using monomers in implicit solvent. Emphasis is placed on the attainment of self-preserving size distributions (SPSDs). The characterization of fractal-like structures dominated by Brownian coagulation is then discussed. The relationship of the radius of gyration and the fractal dimension () is investigated in the different volume fractions. Finally, a summary of the fractal aggregates distribution range and fractal-like structures in the nanoscales is given in detailed aggregates.
2. Materials and Methods
We consider particles as exclusively spheres; sphere–sphere collisions have occurred in the random motion. The force of particle j acting on particle i is defined by the Langevin Dynamic equation.
where is the conservative force of atom i given by atom j computed; is the friction term proportional to the particle’s velocity; Fr is the force due to implicit solvent atoms bumping into the particle, which represents the randomicity of Brownian motion; is the unit vector of direction of ri to rj. Equation (1) is the motion of the particles in the simulating procedure and the MD simulation.
where is the velocity of particle i; m is the mass of the particle; is the Boltzmann constant; is the temperature; is the timestep size; is a Gaussian random number; is the friction rate between nanoparticles and implicit solvent fluid; f is the friction constant, which equals the mass of the particle multiplied by the friction rate [26].
The force corresponding to the potential function is:
The Lennard-Jones (L-J) potential equation describes both the attractive force and repulsive force [27,28], where the former part of Equation (6) expresses the repulsive effect while the latter expresses the attraction.
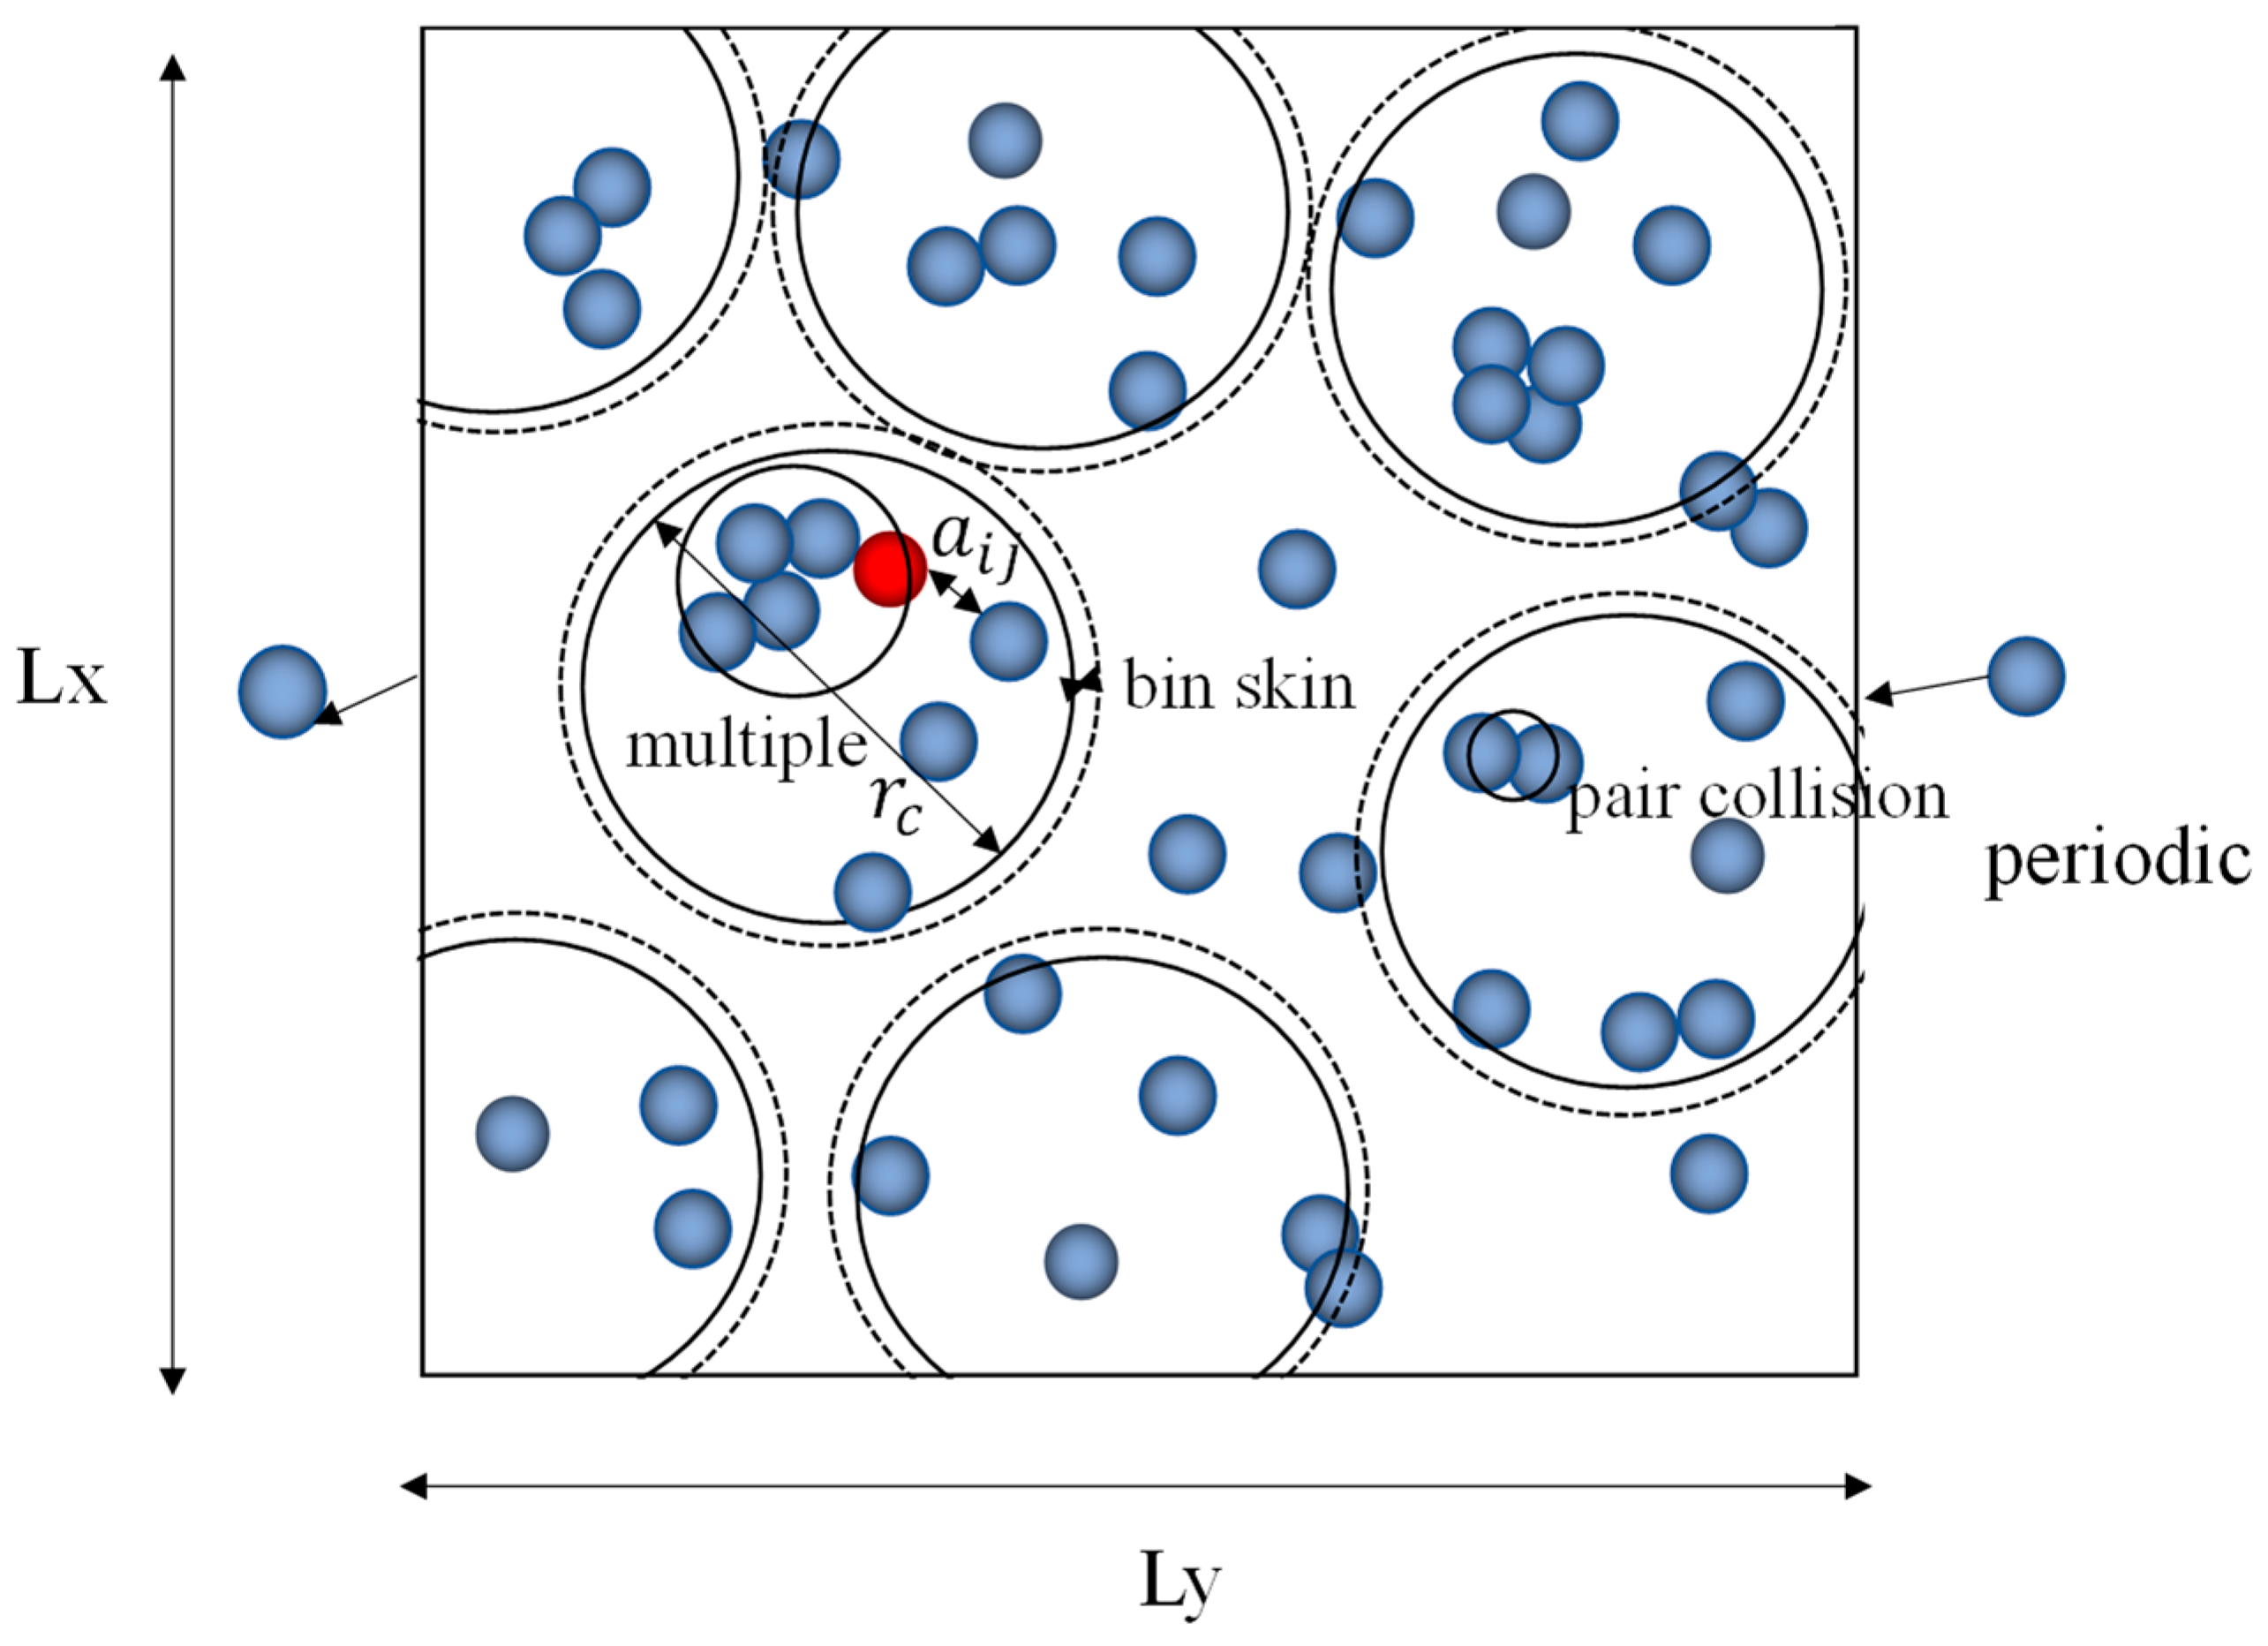
The aggregation in the L-D simulation is completed with the collision of pair particles (or multiple), occurring once two (or multiple) particles contact or overlap (Figure 1). In the initial state, all nanoparticles in the fluid environment are in a simple cubic distribution, and the distances between the particles are equal. It is not necessary to consider the effects of gravity coagulation and shear coagulation due to the small size of the nanoparticles [29]. In order to facilitate the calculation, all particles in the simulation system are divided into neighbor lists. A concentric circle in the cutoff distance, rc, is constructed to calculate the interaction force between particles.
The simulation boundary condition is periodic and the neighbor list store with rc. The statistic of collision in unit time of particle I could be described by:
where is the collision diameter with particle i and particle j;. The particles were sampled under the steady state. In order to make the list effective in continuous time steps and increase the fault tolerance rate, bin skin is added out of the cutoff distance, which is generally set to 0.3 or 0.4. All particles in the neighbor list should be calculated at collision (Figure 1). Each particle is regarded as the center particle, i, and the surrounding particles are regarded as the collision particle, j. It is supposed that each particle has an effective cross-section when the collision particle contacts with the center particle, which is determined by the effect diameter (Figure 1). For analysis, the number of aggregations is counted once particles, excepting the center particle, are in the effective cross-section. The center particle is also in the flow state. As depicted in Figure 1, the random movement of particle j with radius enters the range of influencing spheres.
In this article, the definition for dilution and dense condition from the reference [2] is accepted, such that the volume fraction is a dilute concentration while is a high concentration. The volume fraction at the dilute concentration in classic coagulation theory is:
where is the domain volume. The primary particles turn into the new cluster with the center of mass, radius of gyration, and velocity due to the collision and growth of particles. The fractal agglomerates are formed when agglomerates account for more than 15% of the system concentration. Because of the sharp decrease in the concentration of the number of particles, the probability of Brownian collisions is very low, which is consistent with the self-preserving size distributions [16].
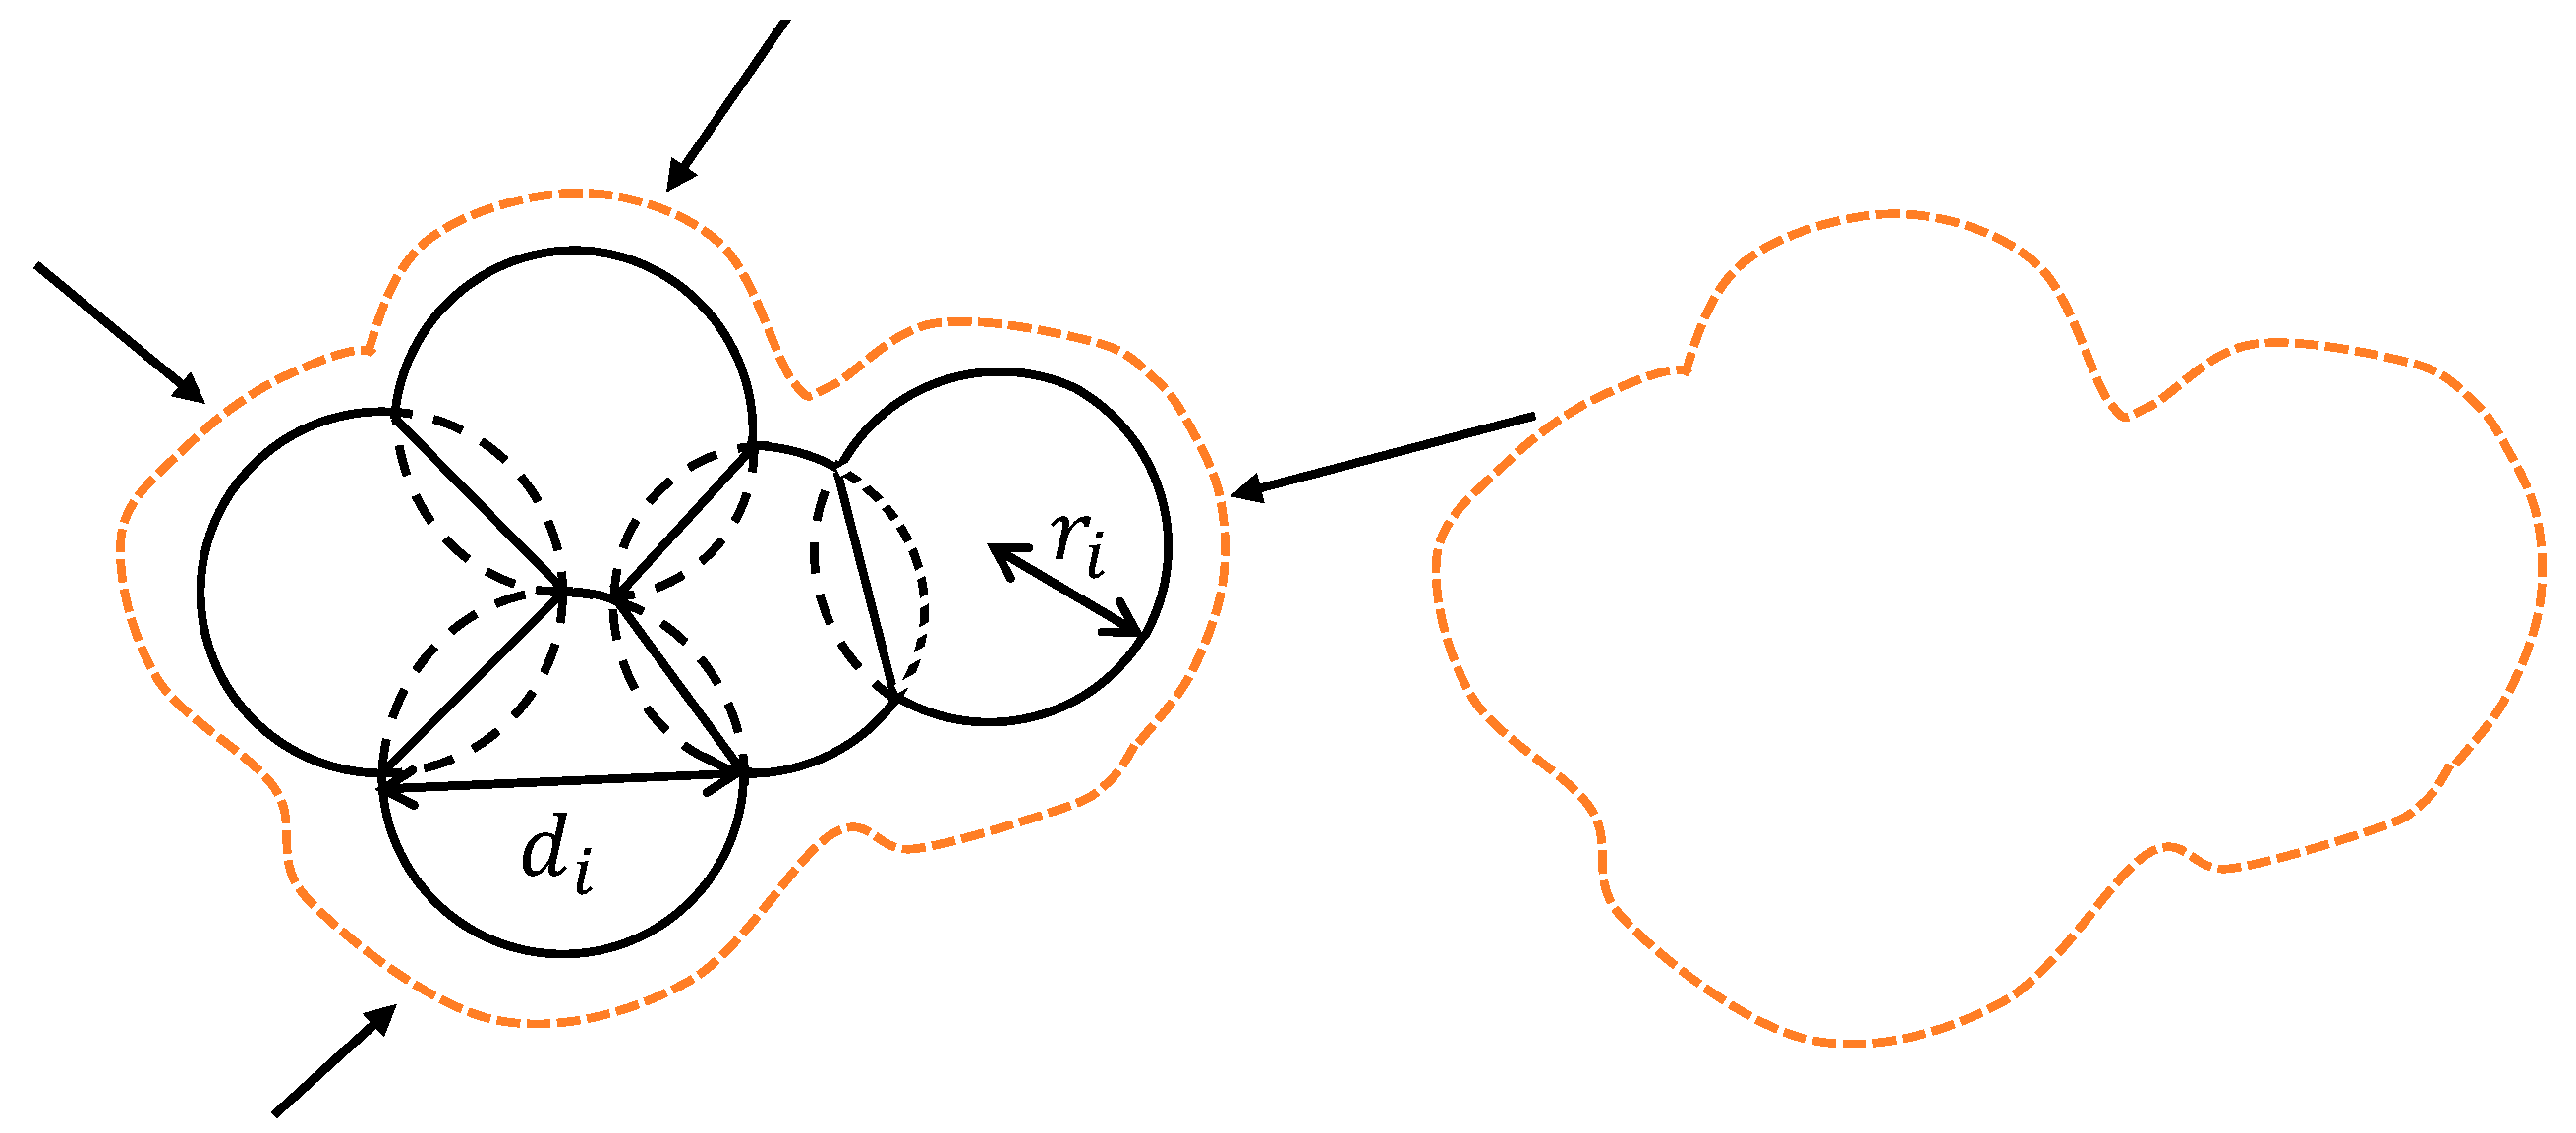
With the collision of Brownian motion, the monomers polymerize into aggregation with short living for the hard model. The clusters, composed of monomers, are identified by the position statistics of each primary particle (Figure 2). Accounting for the size of non-spherical aggregates on a long time length, the diameter of the aggregate is shown in Figure 2, in which particle rotation during collision is neglected. The cluster consists of many monomers with different degrees of overlap, and the circle of the clusters could roughly indicate the size of it (Figure 2). The growth of the aggregate structure via particle–particle collisions is formed by the coagulation of primary diameter . In particular, fractal aggregates are investigated by the radius of gyration [30,31,32,33]:
Here, for fractal-like aggregates, is the number of particles in the aggregates; the is the fractal per factor (also described as the structure coefficient), which is always roughly 1.5 for and this increases with the overlapping of primary monomers; is the fractal dimension, which is typically assumed to be [28]. The ability to track the individual particle position is permitted to calculate the radius of gyration without assuming the values and . The is the diameter of gyration, which consists of primary particles at the position of (, and is given by:
where denotes the center of mass. One monomer acting on another only in a single point is assumed, while several aggregates have a certain degree of overlapping. Additionally, the fractal dimension could be described among the radius of gyration:
where is the initial radius of particles.
3. Results and Discussion
In all cases, particles are placed by sample cubic unit cell in the periodic boundary conditions. Note that the employed box size changes to accommodate different volume fractions , as in Equation (7), whilst keeping a constant number of particles . In particular, the domain box size is 2.79641e + 07, 1.39919e + 07, 6.99583e + 06, or 4.66159e + 06 when the volume fraction is equal to 0.05, 0.1, 0.2, or 0.3, respectively. The particles are initially monodispersed, in diameter, with a density of 2.2 . The particles are randomly placed in a box without overlapping and touching. They will grow by Brownian motion and aggregate in the implicit solvent at T = . The temperature of LD simulation is modified by modifying the force without performing time integration. Therefore, specific time integration (NVE ensemble) must be used to fix the velocity and position of particles.
3.1. Splitting Time Step
The length of the operator splitting time step size affects the accuracy and stability of the coupling between the gas phase and particle population balance [34]. If the running step is too long, the balance of the system could be broken and lead to a sinking term in the particle phase [35]. Due to the principle of molecular dynamics simulation, fs(10−12 s) is generally selected as the timestep scale and it is converted to units of ns(10−9 s) to fit the overall scale of nanoparticles. The small timestep could increase the calculation cost; moreover, the timestep should be small enough so that the force on a particle can be assumed to be constant during the timestep [36]. Thus, choosing an appropriate time step is necessary to investigate convergence behavior.
In order to ensure the practical significance of the sampling results, a sufficiently substantial number of particles was used to operate with multi-running for convergence. The number of particles before collision (n) is , and the total time length (L) is 60 ns. The cluster is in a self-preserving distribution based on Brownian collision, while the particle population is balanced [37], which is reasonably used as an examination standard for the convergence of the system in different timestep sizes.
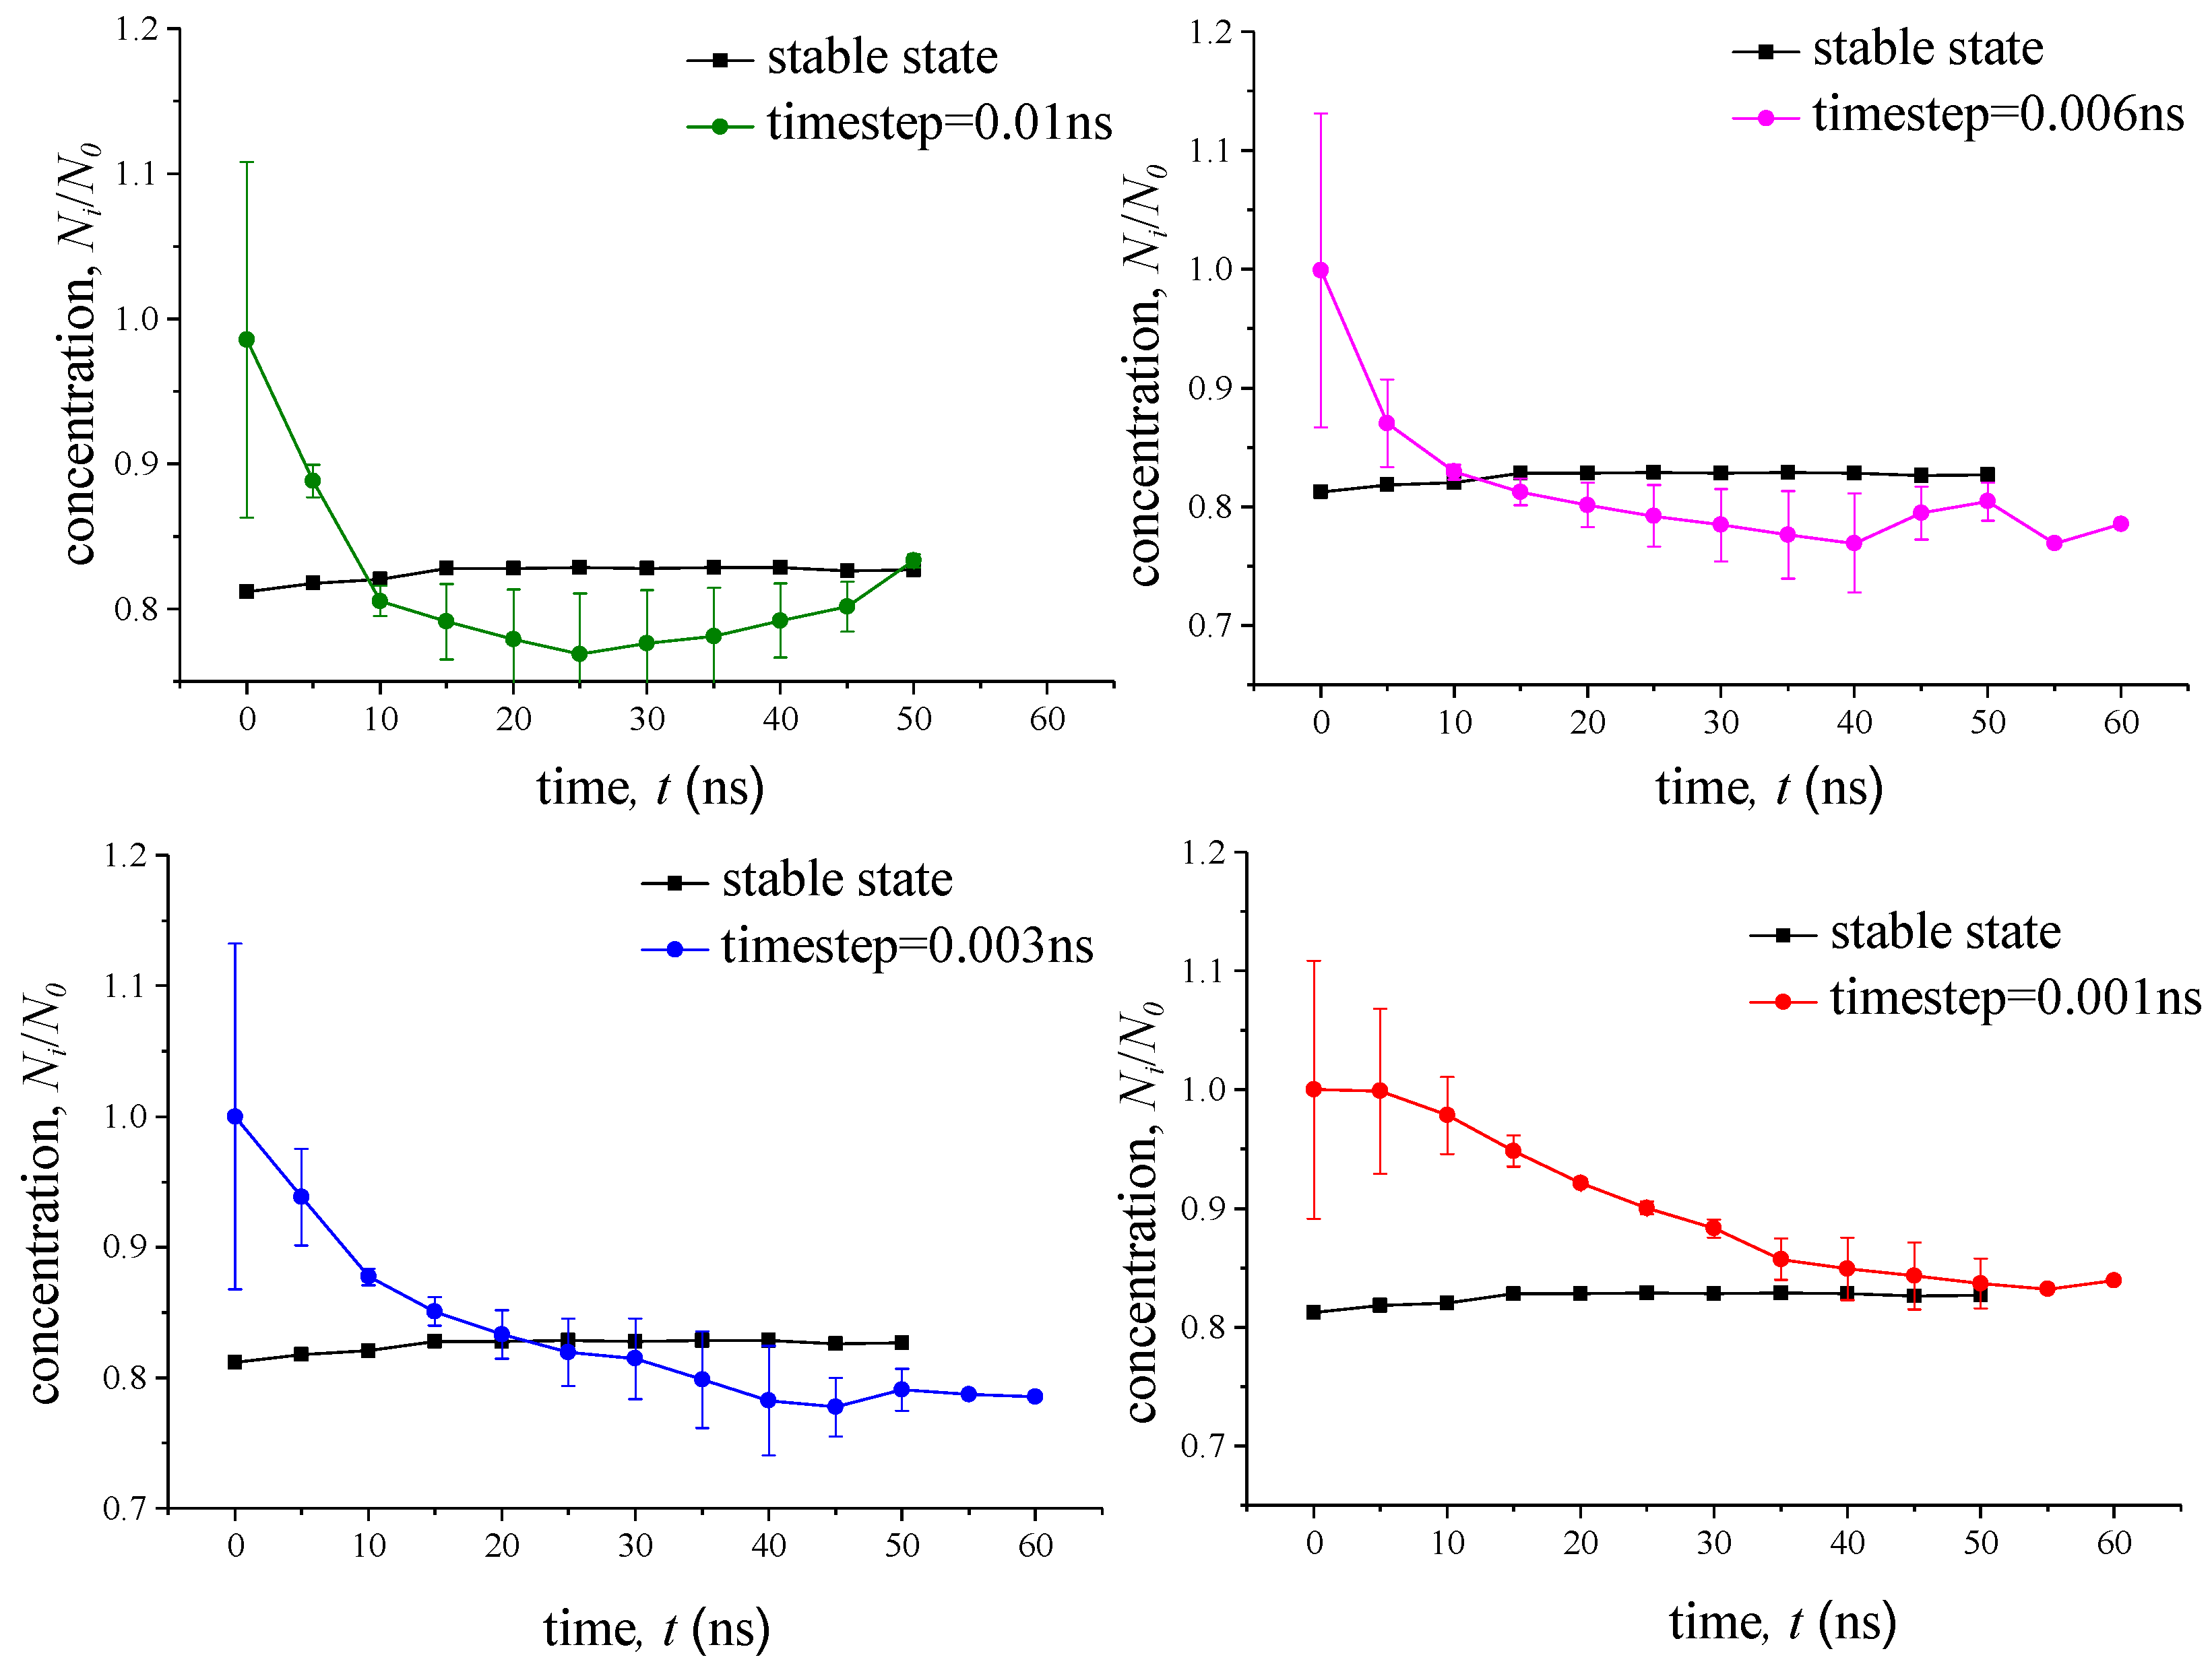
Figure 3 describes the cluster concentration based on the different time step sizes in the same simulation range (L = 60 ns). It can be seen that the convergence is finally completed within 45 ns in addition to the disturbance of the end acquisition time, which is the error of the acquisition method for molecular dynamics. When the timestep size is 0.001, the growth trend of the curve line is smoother, and it takes longer for it to reach convergence. Compared to the stable stage with other timesteps, the smaller the timestep size is, the less disturbance there is with the sampling.
The average value of the cluster distribution with different timesteps is taken as a stable value to solve the error of random operation with different timesteps:
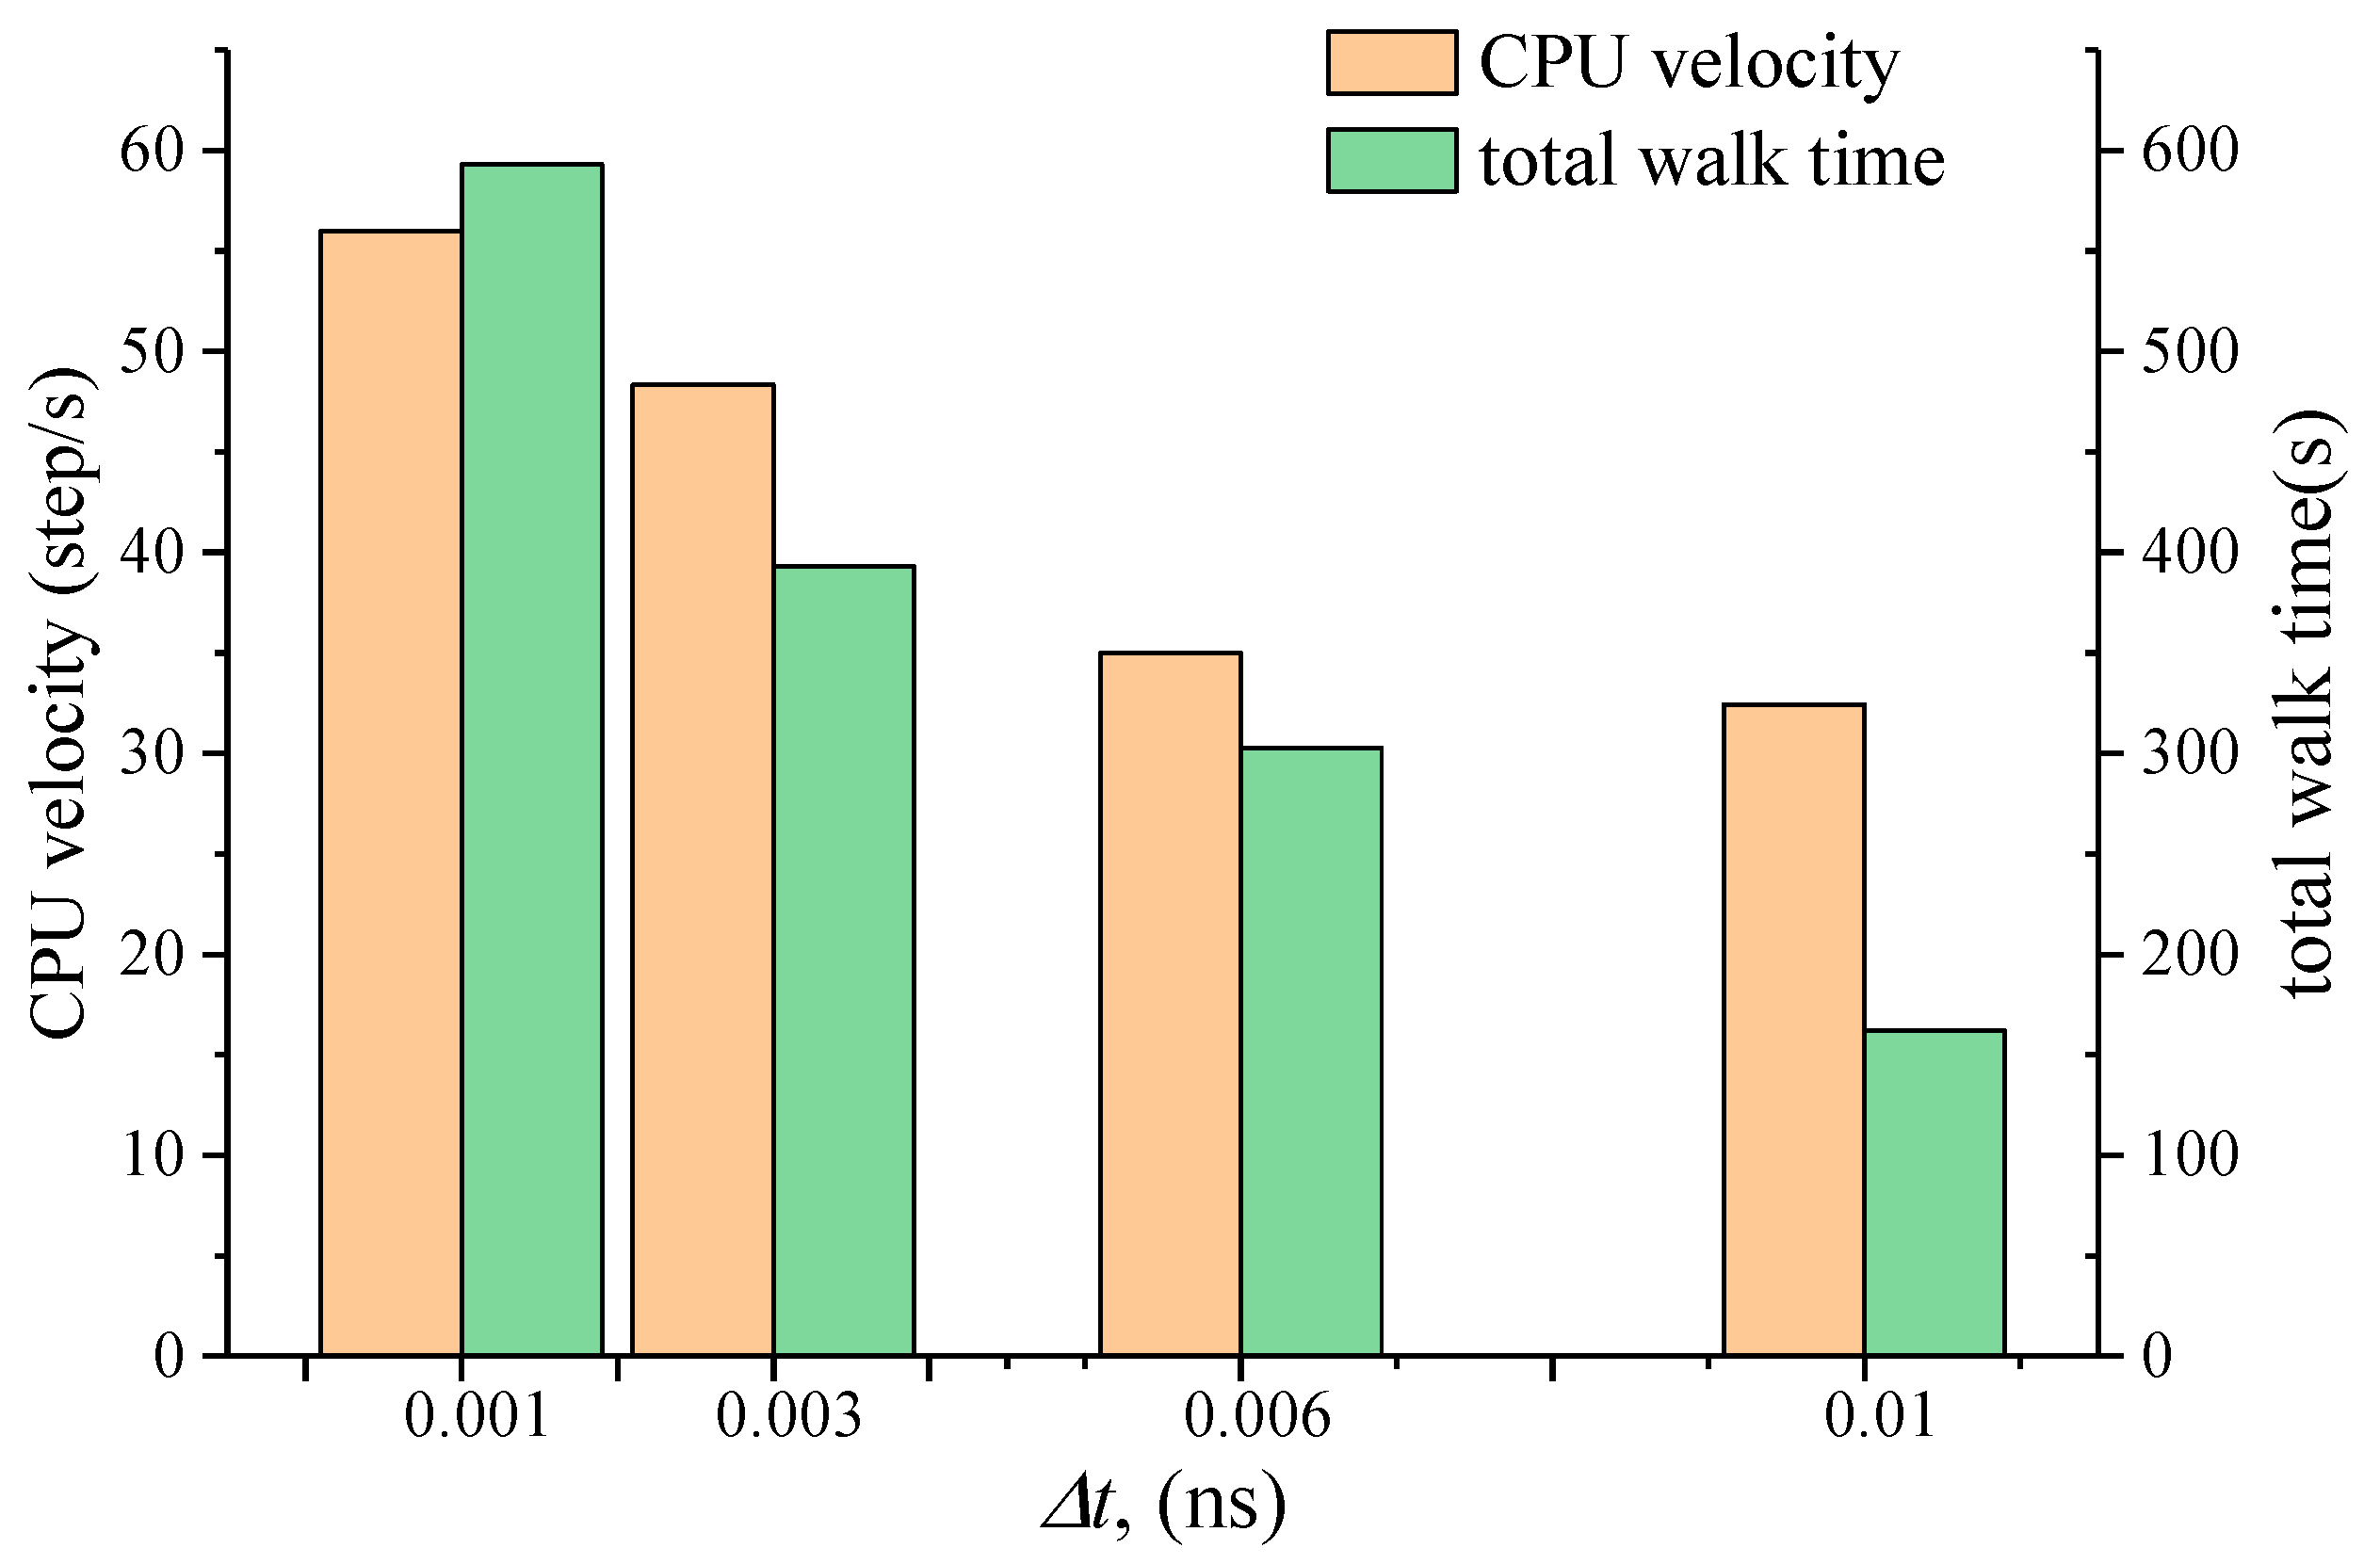
where represents the cluster distribution at each timestep. The results of errors are shown in Figure 3. It is found that the convergence of different timesteps is roughly the same under the long range of simulation time. The smaller timestep has been tending to lower error in the stable range. Figure 4 is the CPU calculating time with various timestep scales, which indicates more simulation time in a smaller timestep. The CPU total running time is in the controllable range even if the timestep is 0.001 ns. As discussed above, it is a better choice if the timestep of simulation is 0.001 ns and the whole time range L is 60 ns.
3.2. Particle Collisions at Different Volume Fractions
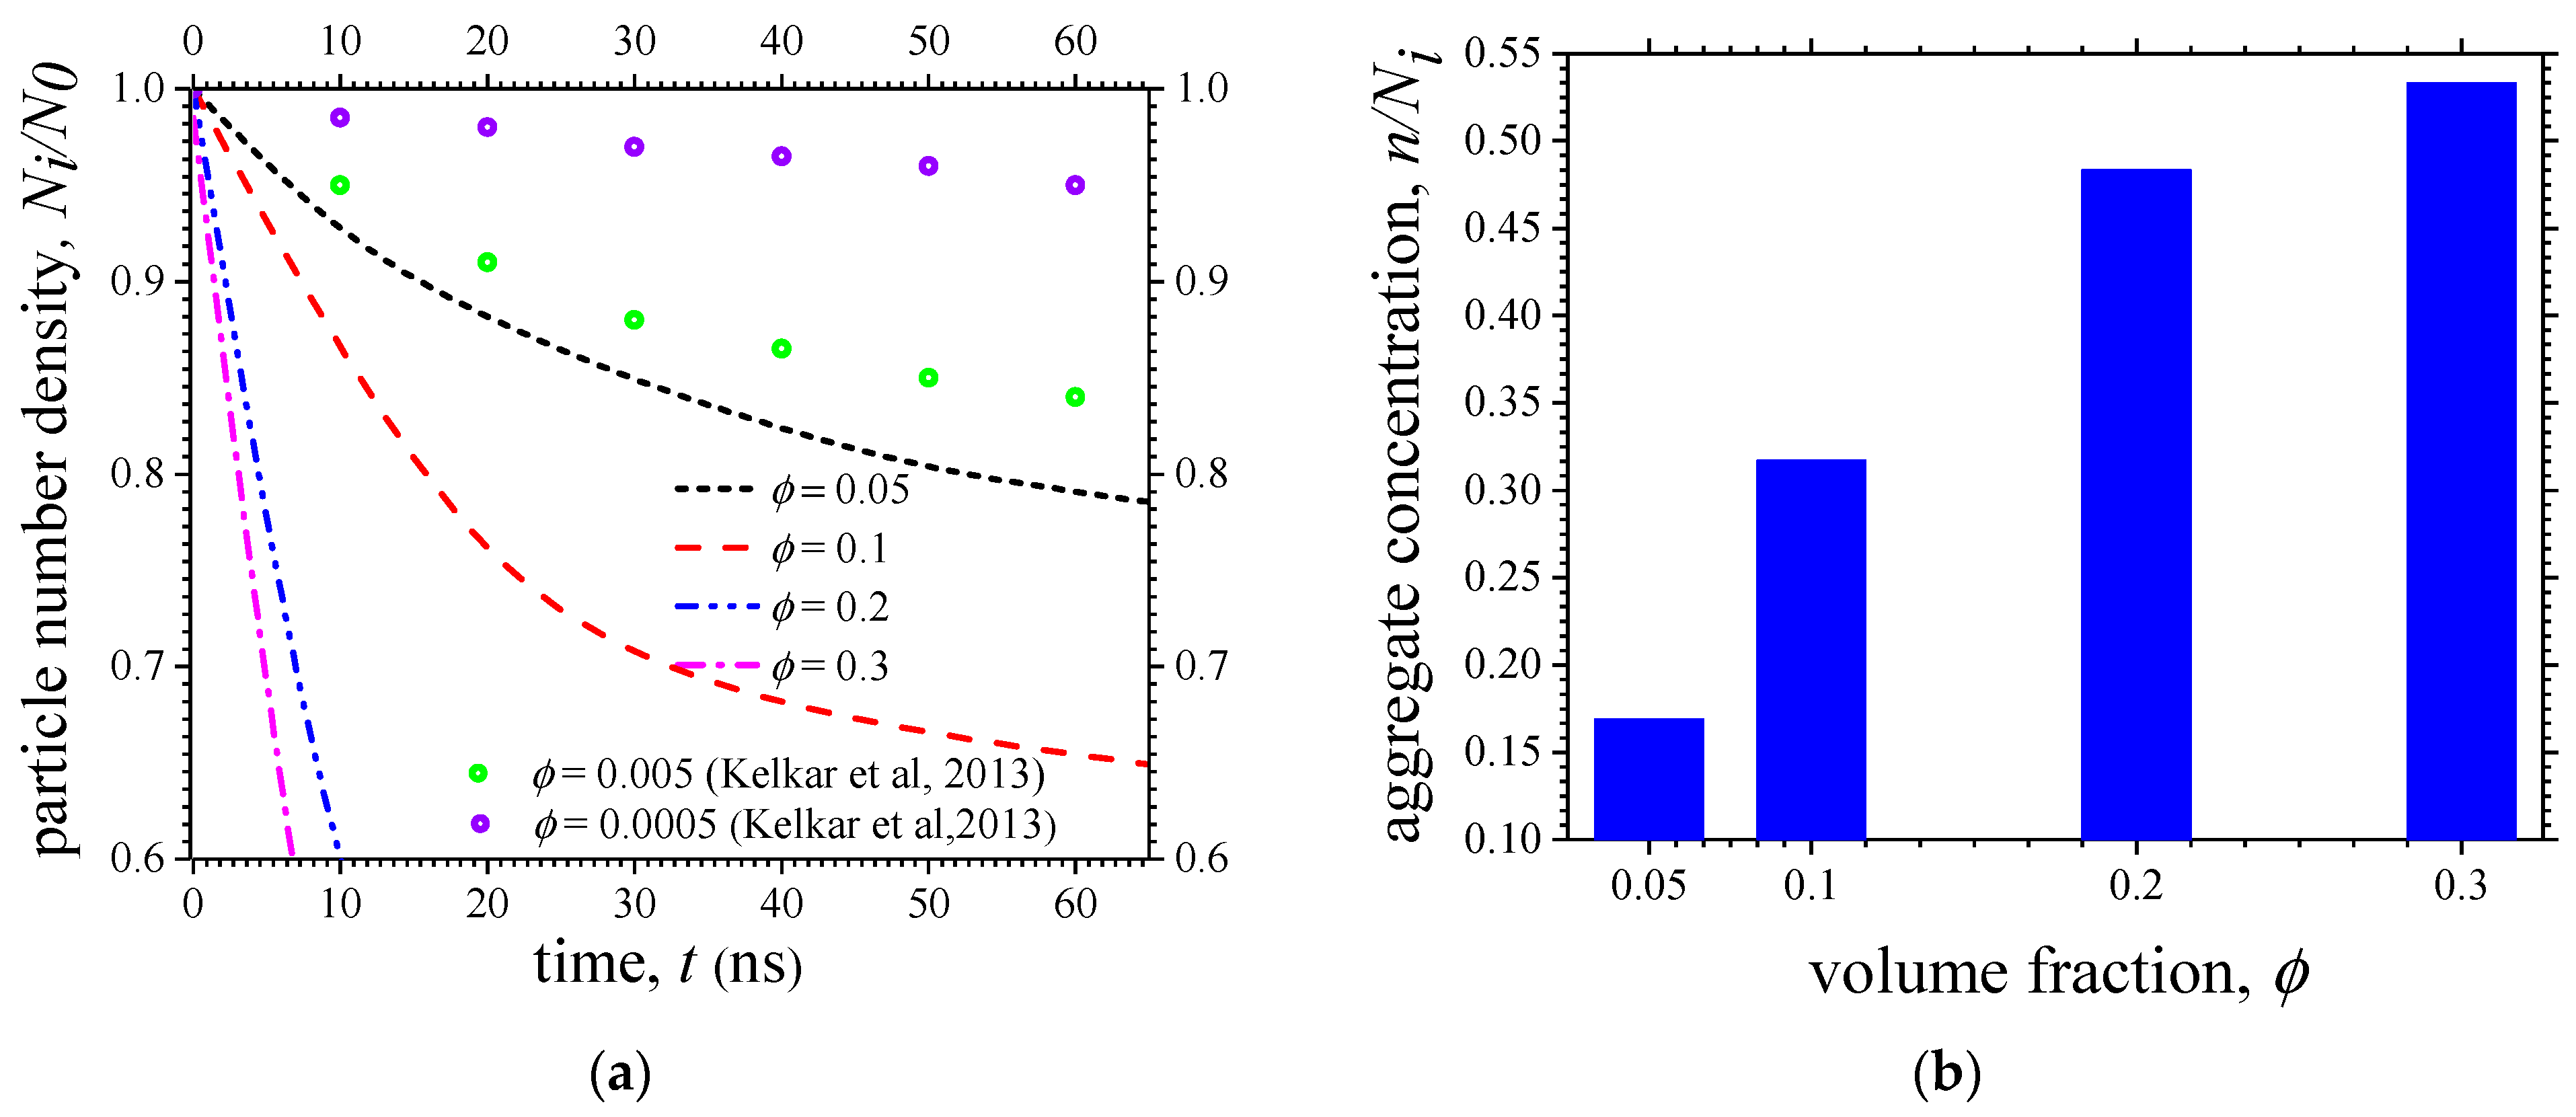
The number of particle clusters with the occurrence of collisions is shown in Figure 5. N0 is the initial number of particles (N0 = 100,000); Ni represents the population of particle clusters, and the initial monomers are regarded as one cluster (Ni ≤ N0). In addition, highly concentrated fractal-like aggregates undergoing coagulation develops SPSDs only temporarily, and they approach gelation at an effective agglomerate concentration of about [10]. All the clusters are monomers before the collision. In Figure 5a, the scaled number concentration of clusters is when the time is at 0 ns. The number of clusters decreases rapidly in an earlier period, but finally it stabilizes with the evolution of time. Figure 5a also shows the larger volume fraction in the initial condition, the faster decay rate of the aggregate number. In the figure, the evolution of particle numbers with time is also displayed by implementing classical steady-state Smoluchowski model using Brownian Dynamics Simulations (BDS) in the volume fraction, [36]. It is clear that the decay of particle numbers in the BDS is much slower than that in the present simulation, which indicates that the collision rate in dense conditions is much larger than that in the dilute condition. Figure 5b shows all the aggregates concentrations in the cases that are more than 15% so that all the systems can be developed into SPSDs.
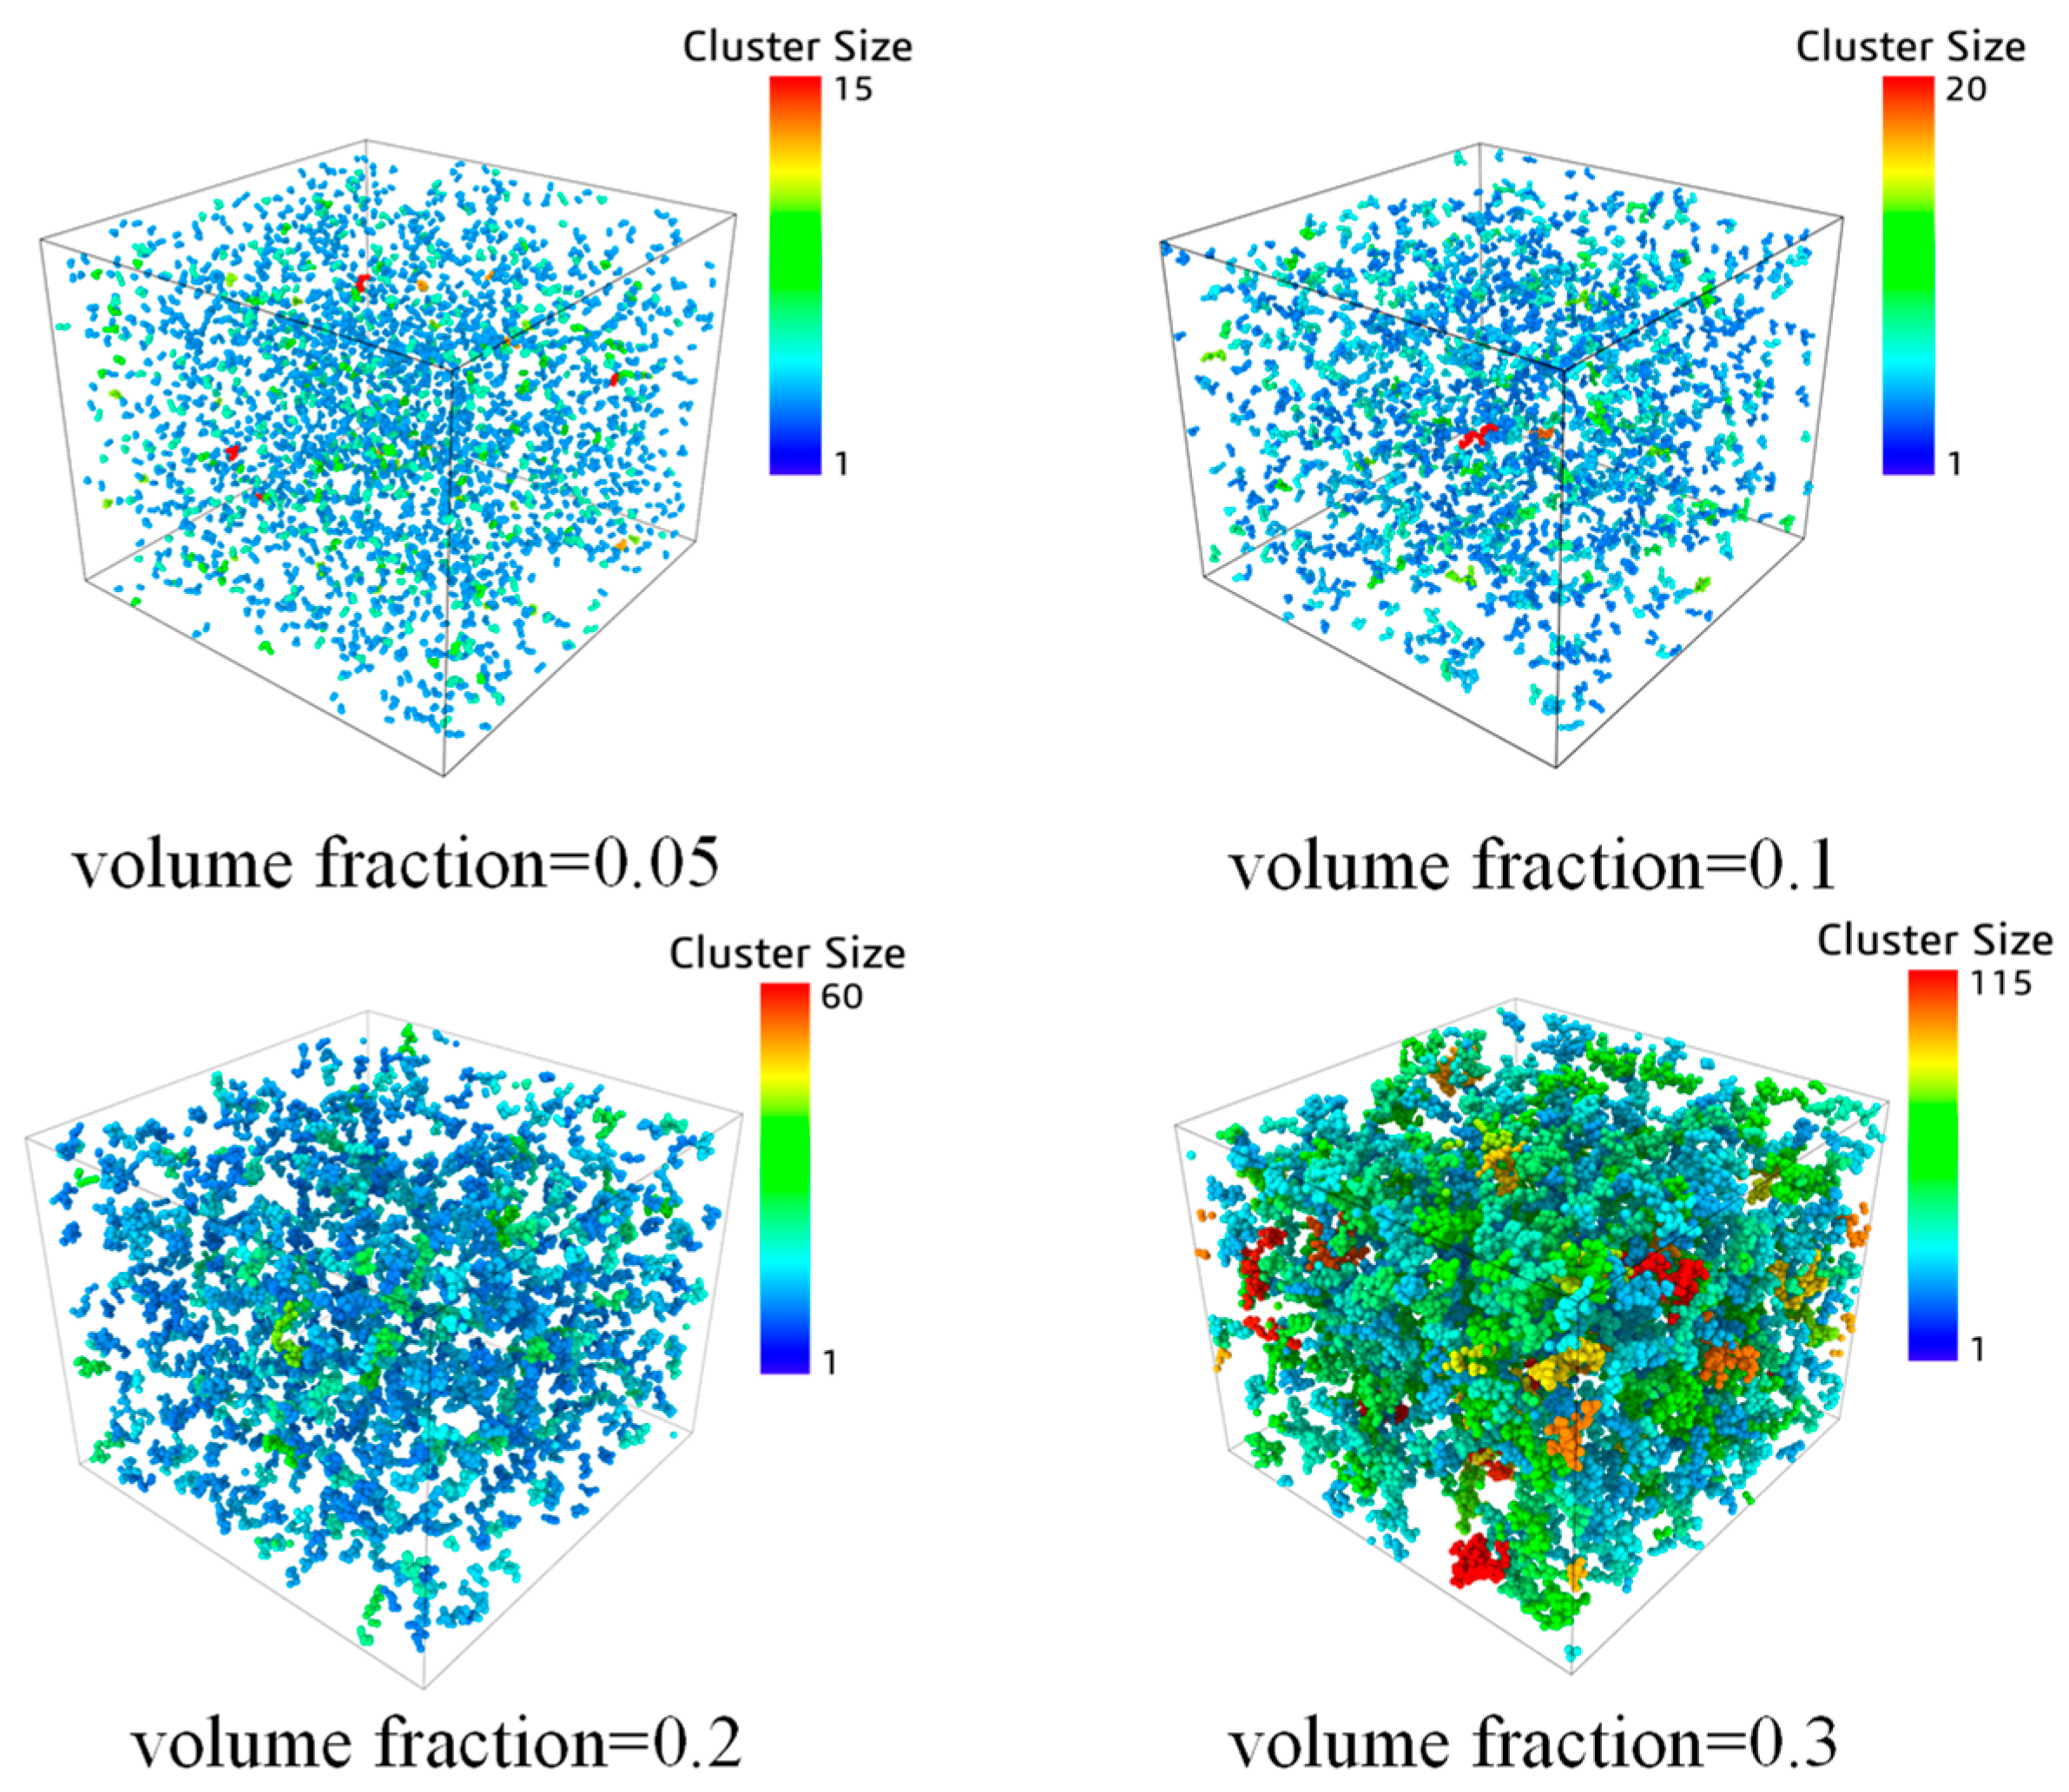
Figure 6 shows the static structural “snapshot” of aggregate systems at the same time point, t = 100 ns, from the different volume fractions (). For the convenience of the visualization and analysis of the simulation data, the calculated data in the present study are rendered according to cluster size (number based) by OVITO [38]. In order to note the form of aggregates clearly, the clusters with only one monomer are restricted to transparent states. Among all the investigated cases, the system with initial volume fraction , has the least probability of occurrence of aggregates; in contrast, the system with the initial volume fraction has the greatest probability. From the static structural “snapshot” shown in Figure 6, it can also be found that at the larger volume fractions, the aggregates are composed of more monomers and the fractal-like form is more obvious. This is consistent with the finding that the coagulation kinetic in the dense condition is faster than those at dilute concentrations [10].
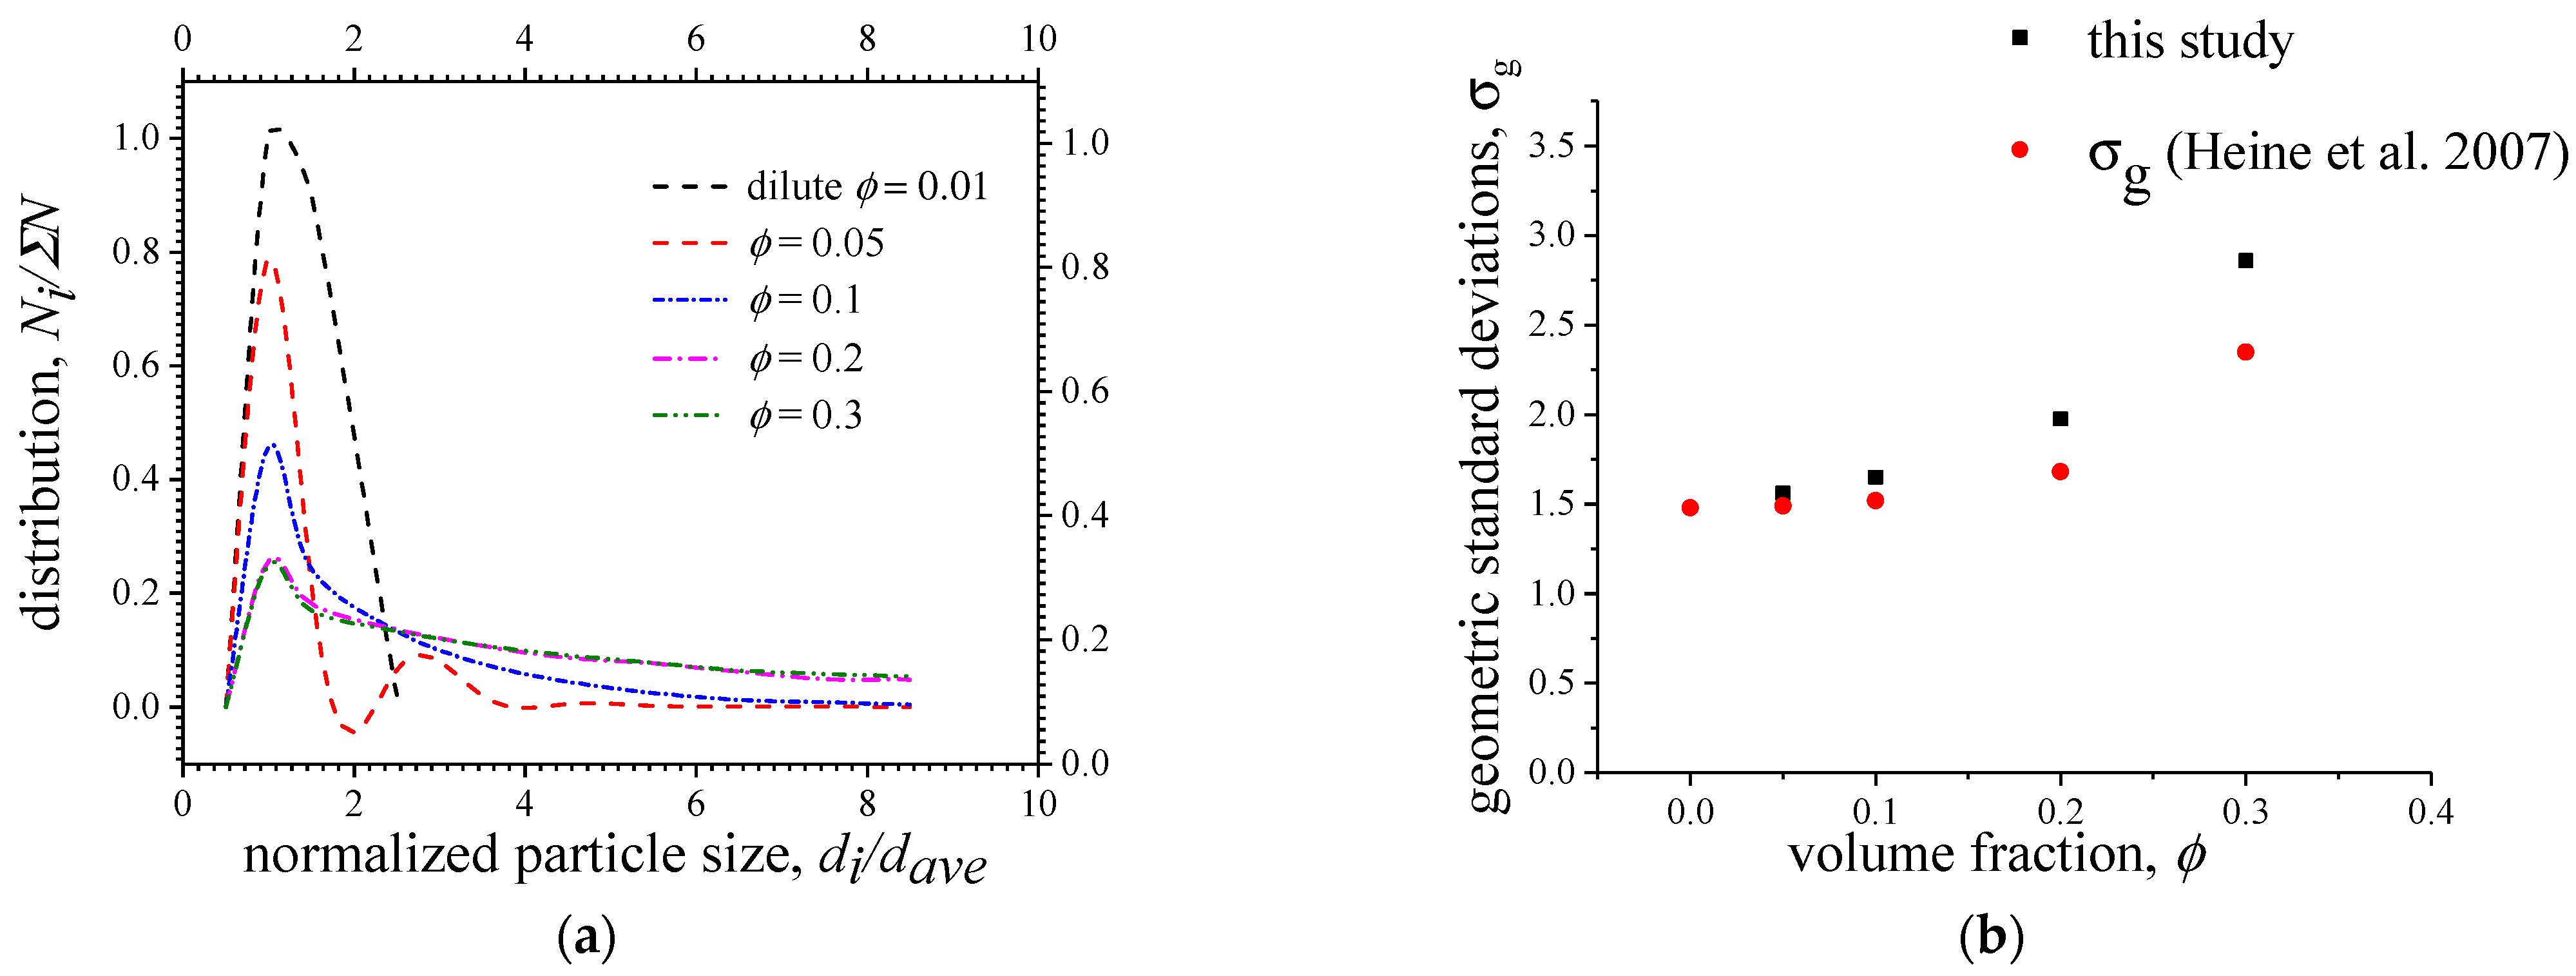
Figure 7a is the normalized particle number size distributions at the same time t = 100 ns, generated from various solid volume fractions. In the figure, di represents the number-based size of aggregates i, and the monomer seems as di = 1; dave is the number based geometric mean diameter. The distribution is closer to dilute concentration when the volume fraction is 0.05. As compared to the dilute particle system, the system with a higher volume fraction shows a wider distribution of numbers. It implies that under dense conditions, particles have more probability to collide, as shown in Equation (7).
Figure 7b is the number-based average geometric standard deviations as the function of different volume fractions, as the function of different volume fractions, . As a comparison, the calculation data from Heine and Pratsinis [10] is displayed. When , the present LD simulation and Heine and Pratsinis’s work match for the geometric standard deviations (). The present LD simulation agrees well with Heine and Pratsinis’ data under the dilute condition; with an increase in the volume fraction, the deviation between the two works increases. This is because in Heine and Pratsinis’s work [10], the complete coalescence process for spherical particles is considered, while in the present work the aggregate process for fractal-like particles is considered. By comparing the two works, it can be concluded that the number distribution for the aggregate process has a broader distribution than that for spherical particle coagulation.
3.3. Cluster Analysis of Collision Particles
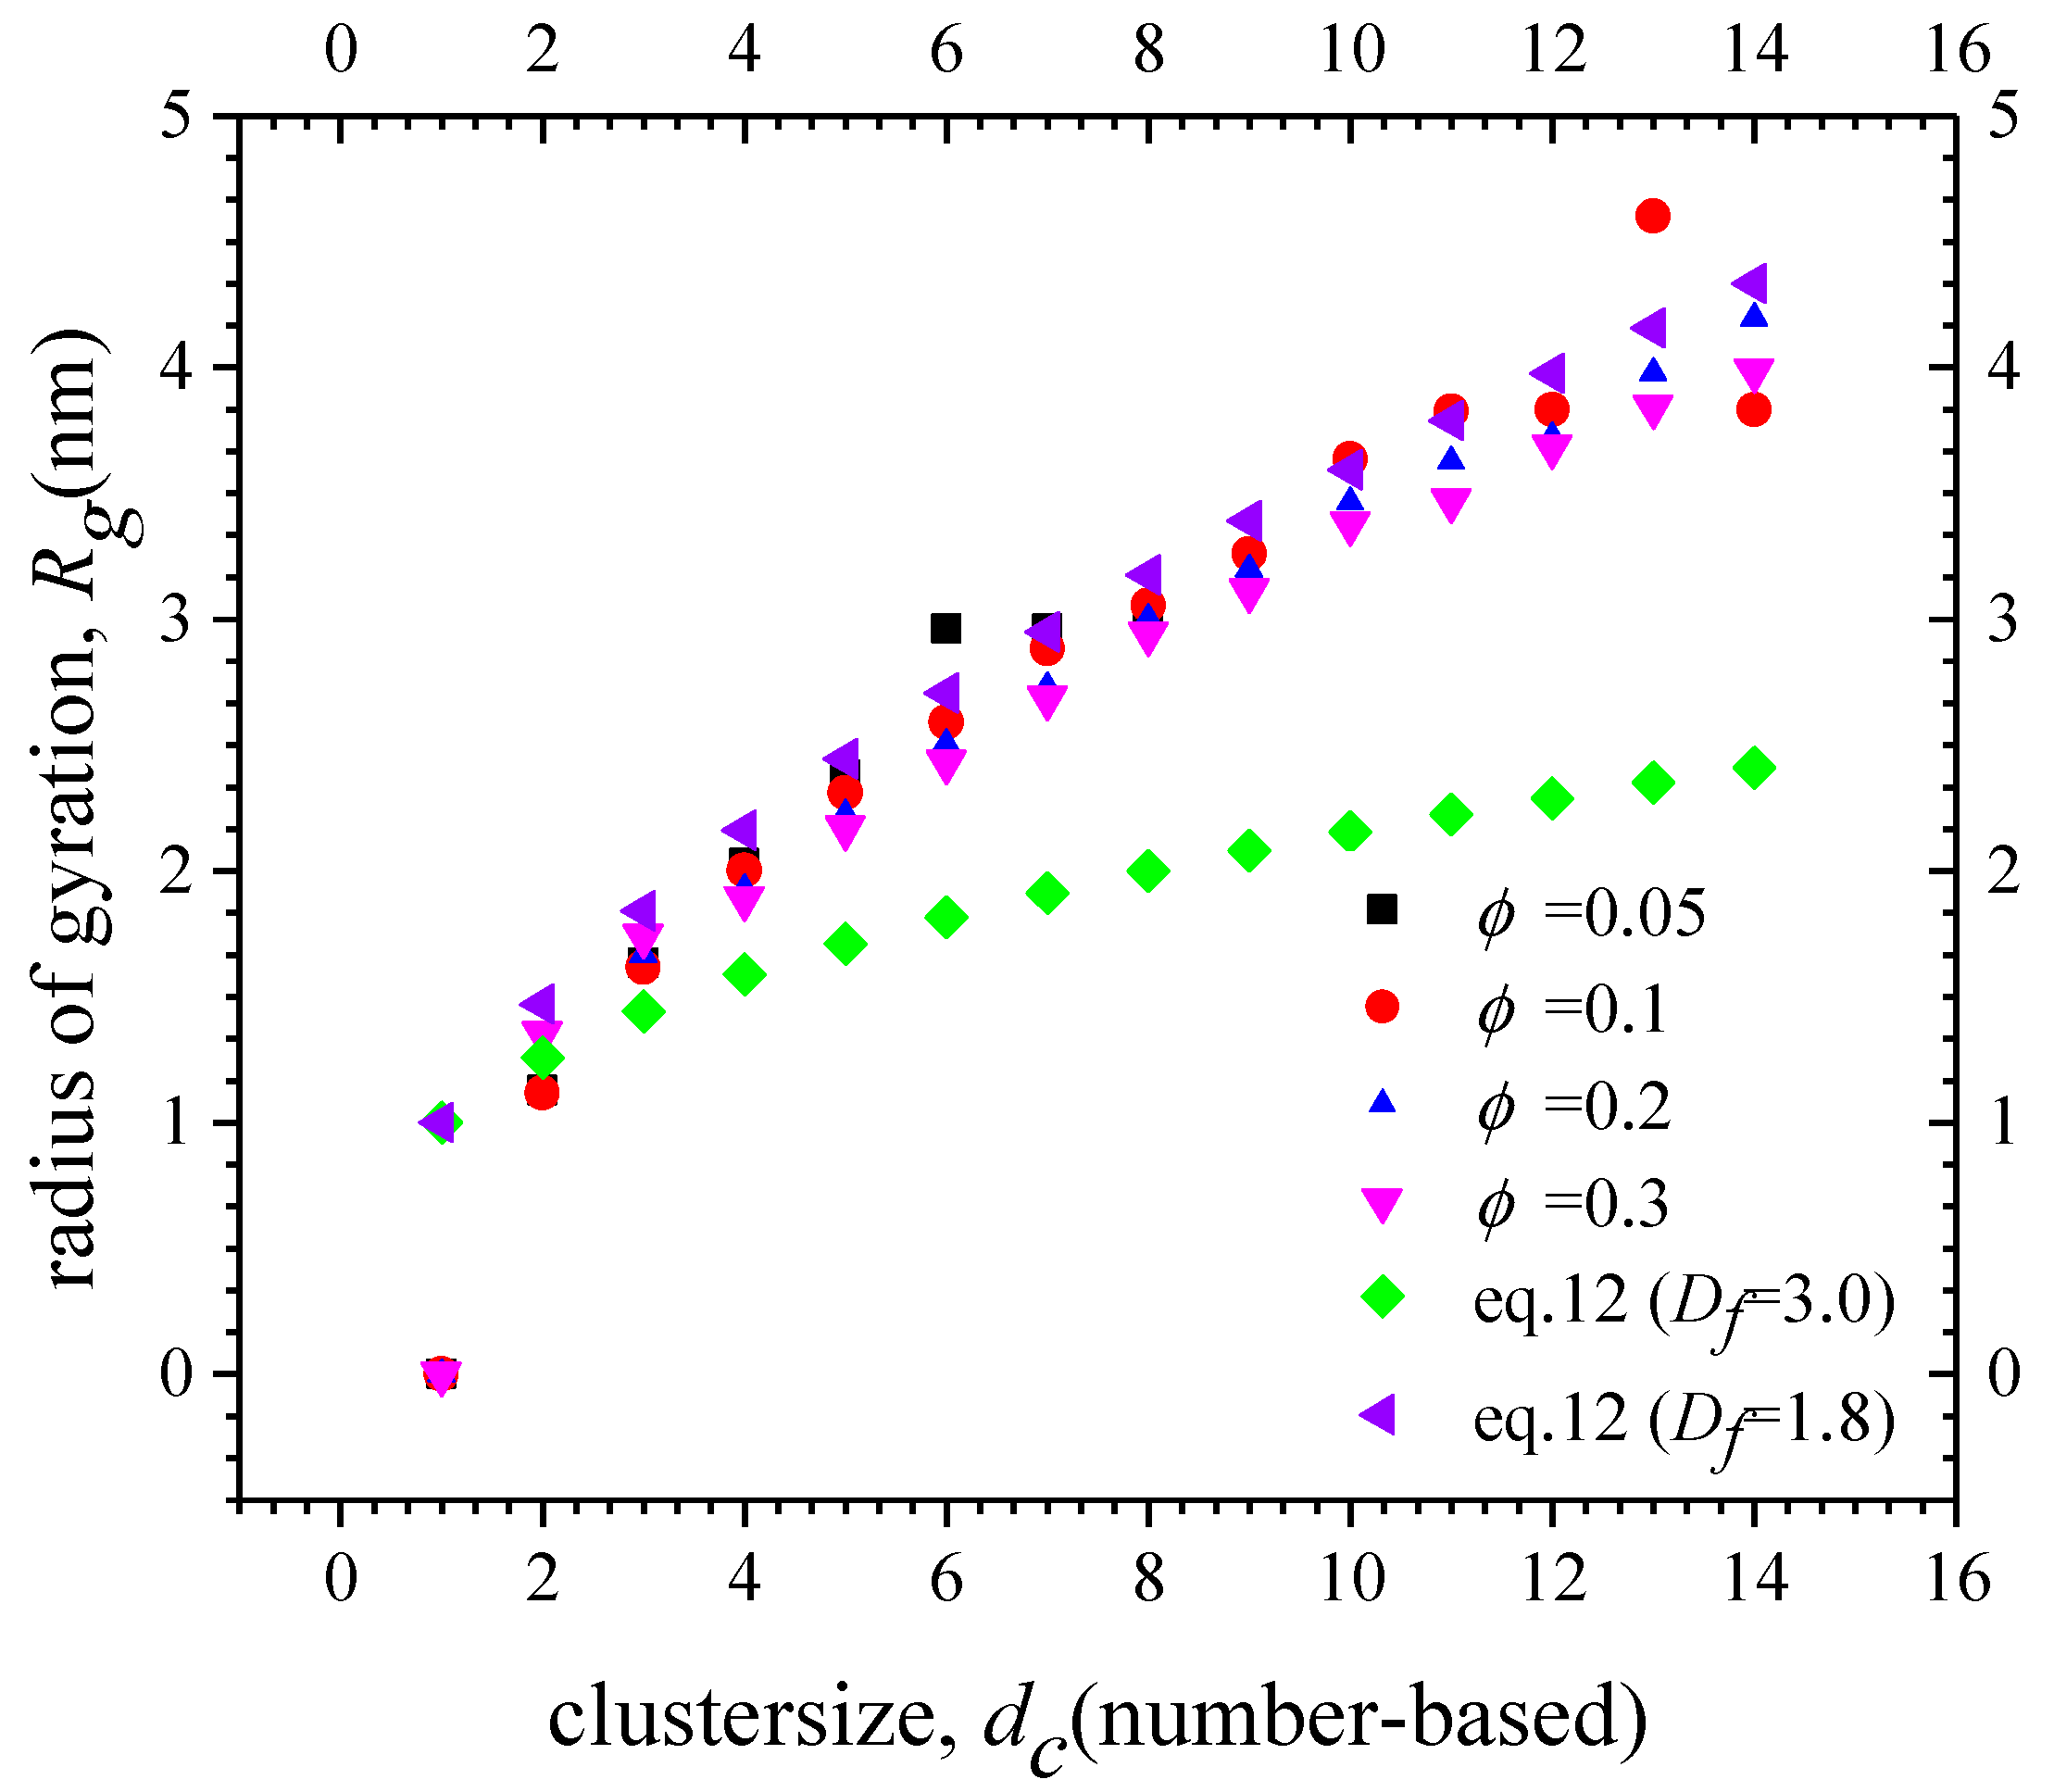
The relationship between the radius of gyration and the cluster size of aggregates at different volume fractions is studied (Figure 8). When the volume fraction, , is higher, the radius of gyration is smaller with the same cluster size (number-based), which means the aggregates are in a tighter structure. When the monomers in aggregations are less than two, the radius of gyration of clusters is less than the initial radius ( = 1.5) in all the volume fractions. An increasing particle concentration results in clusters with larger collision diameters and a higher degree of aggregate, which is consistent with Grass [39]. Assuming the , with fractal dimensions and according to Equation (12), the radius of gyration as the function of cluster sizes is displayed in the green and purple scatters. The results of different volume fractions are between 1.8 to 2.0 when the agglomerations appear in a fractal-like structure. Agglomerates containing about 10 to 30 primary particles on average attain their asymptotic fractal dimension, Df, of 1.91 or 1.78 by ballistic or diffusion-limited cluster–cluster agglomeration, corresponding to coagulation in the free molecular or continuum regimes, respectively [40]. The transition of Df from three (initial monomers) to its asymptotic 1.78 or 1.91 occurs as particle coalescence upon collision slows down by increasing particle size. The aggregates have not rigorously attained a fractal-like structure when the volume fraction because such structures have not reached sufficiently large sizes.
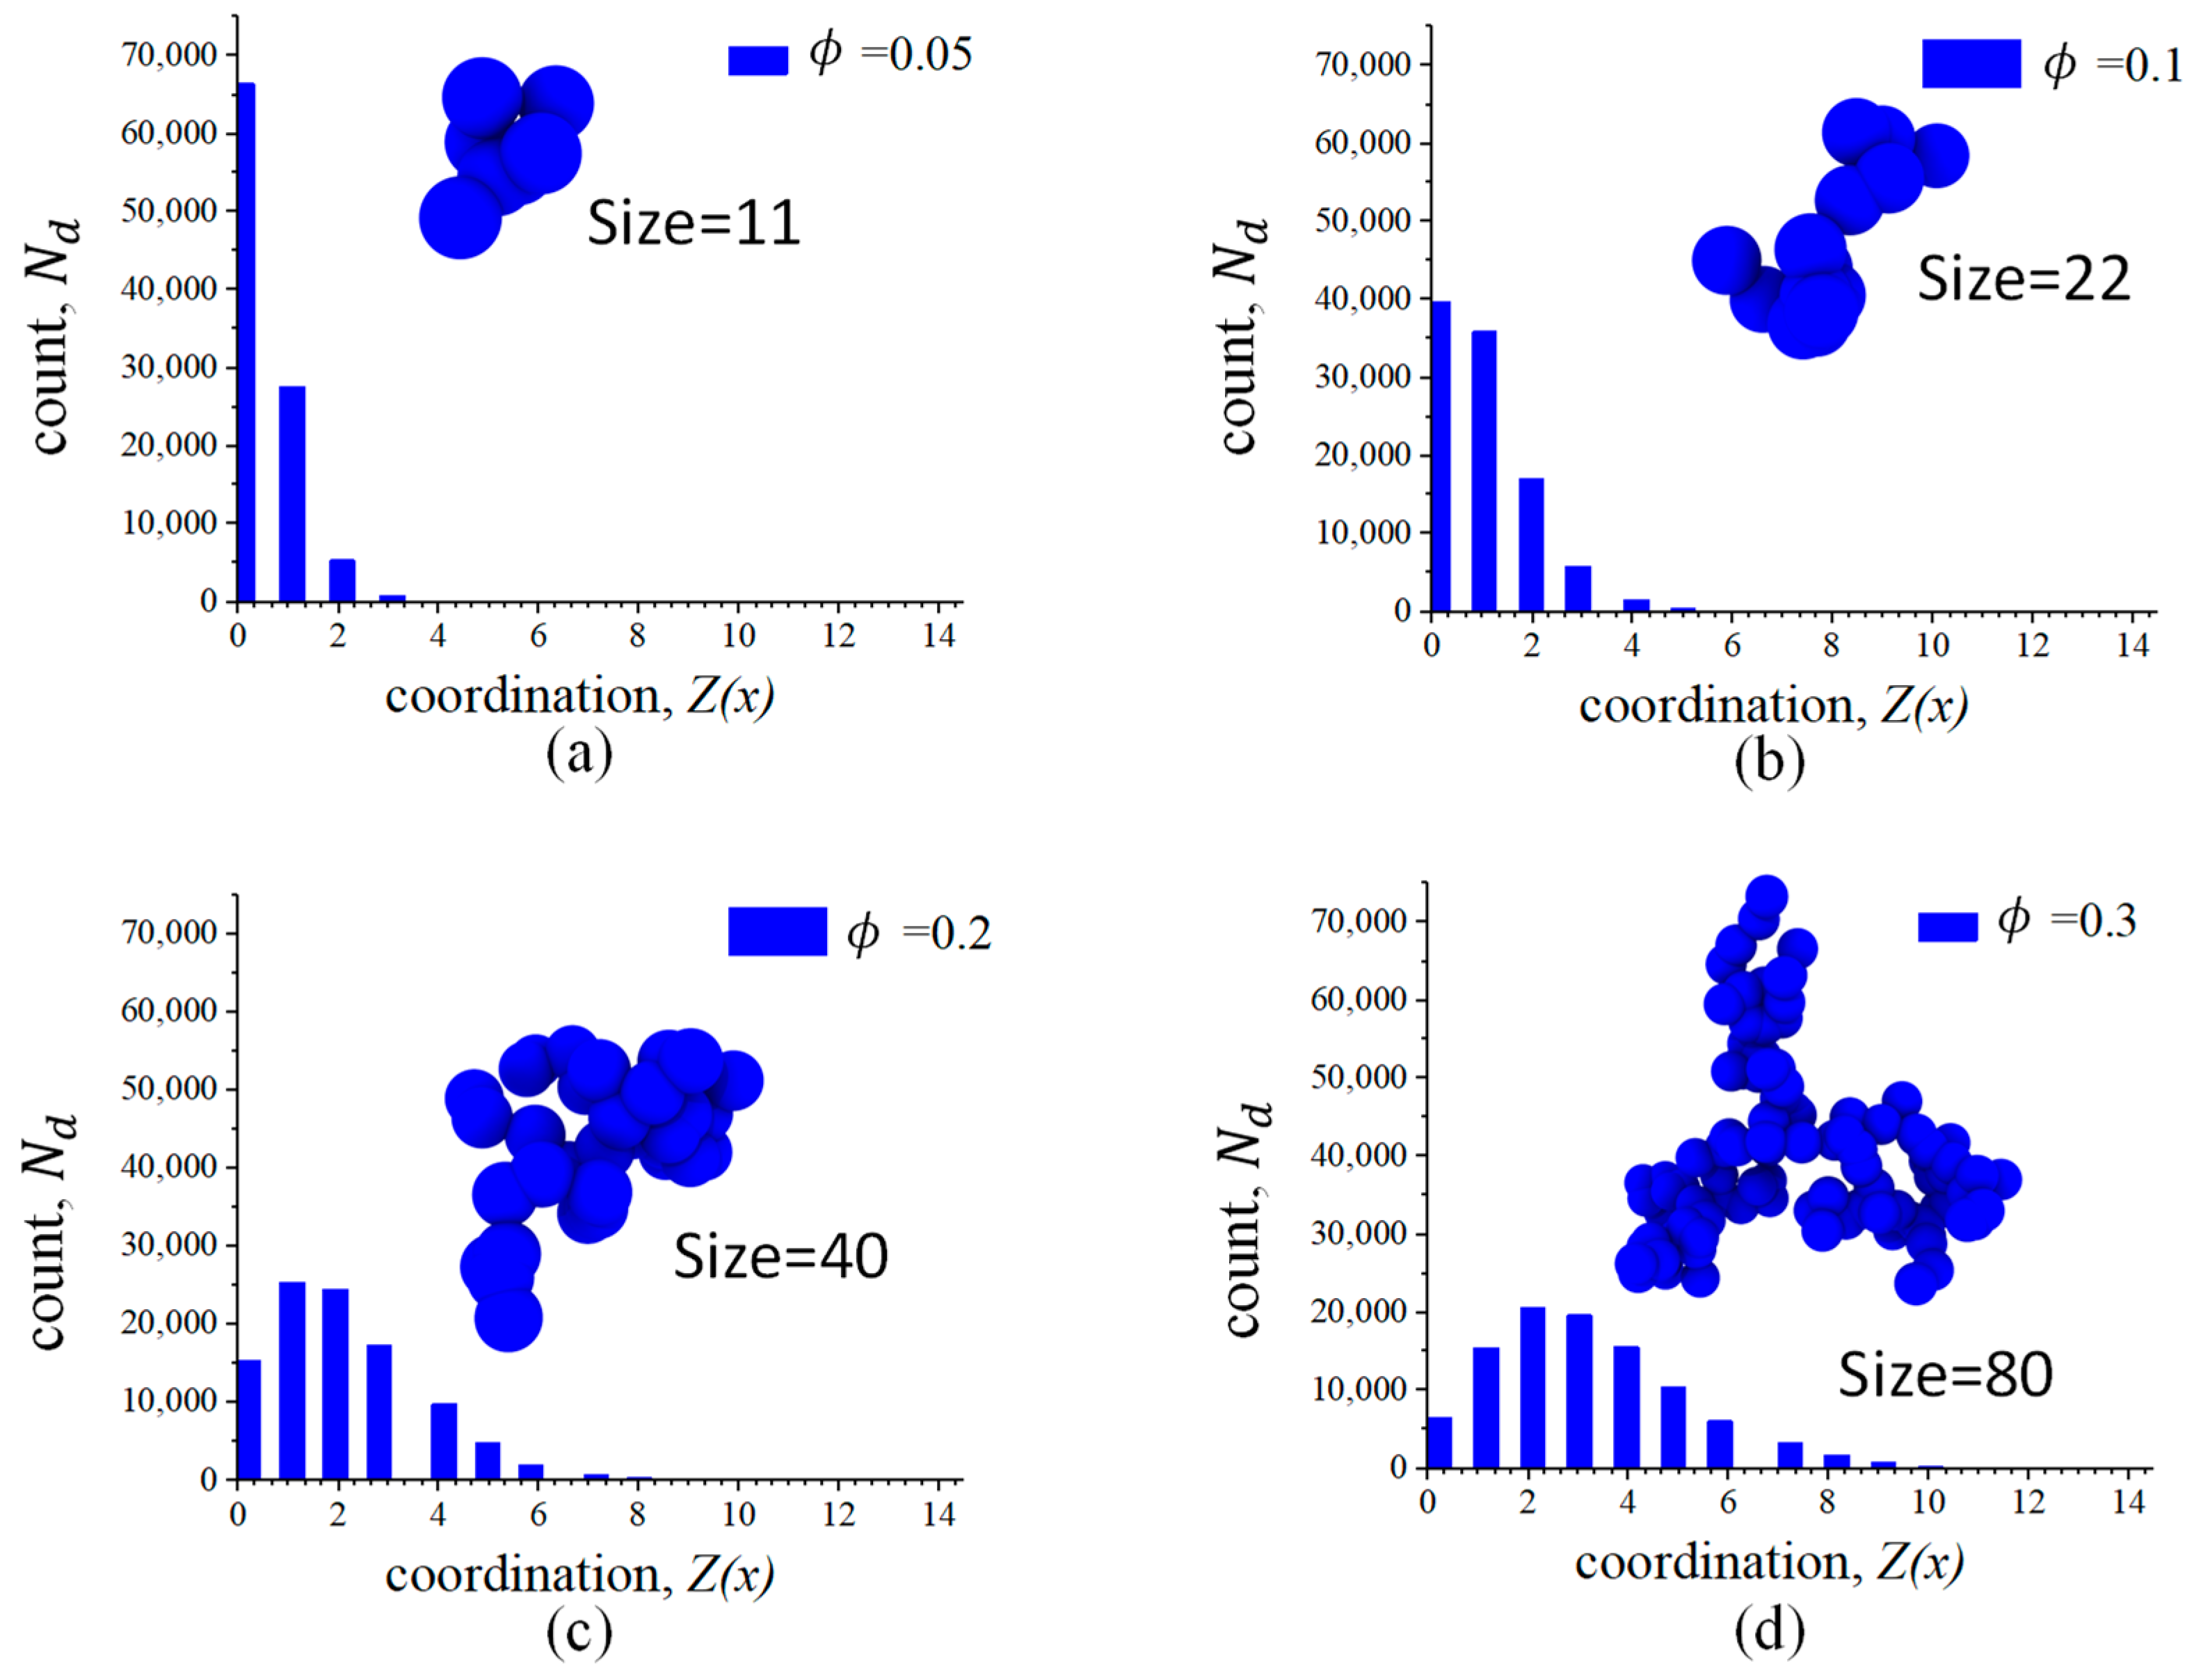
The particle j coordination number in the range of of particle i with different volume fractions is shown in Figure 9. Here, Z(x) indicates the average number of contacts per monomer, and is the count that indicates the number of monomers whose coordination number is Z(x). When the volume fractions are more than 0.1, the distributions of coordination numbers are similar, but the coordination numbers are more aggregated with single connected particles (value 1). The aggregation of monomers formed with a larger geometric diameter and wider distribution as the increase in the volume fraction, which means that the polydisperse of coagulation is higher with the denser system. Teichmann and Van also found that the coordination number (i.e., the average number of contacts per monomer) increases with the compression of aggregates [41].
Figure 10 shows the power-law relationship between the radius of gyrations and the number of monomers in each aggregate under stable conditions. The slope of the straight line is the fractal dimension of the cluster, and the length of the straight line is the size distribution width of the cluster [40]. With an increase in the volume fraction, the aggregates cluster tends to be a fractal-like structure and the fractal dimension in the range of 1.614–2.060. The aggregate structure and Df both depend on the ratio of collision time. Under the restrictive condition, tc >, monomers evolve into fractal-like aggregates immediately upon collision. Lower Df exhibits an increased cross surface area, which leads to a faster collision among aggregates and monomers. Hence, the aggregate system achieves its SPSD faster with a decreasing Df [42]. For agglomerates, the primary particles stick upon inter-particle collision, forming fractal-like agglomerates with Df = 1.9 [42,43,44]. When the volume fractions are higher, the Df of aggregates formed by collision is closer to 1.9.
4. Conclusions
The effect of the particle volume fraction on particle collision and growth by Brownian coalescence in the dense system was investigated using LD simulation. Self-preserving particle size distributions (SPSDs) were obtained at all investigated particle volume fractions from 0.05 to 0.3. With the increase in , the SPSD broadens, and the geometric standard deviation becomes 1.54, 1.98, and 2.73 at .
Aggregates formed by particle collision have significant differences for the volume fraction with the same initial particle size . When the volume fraction is higher, the radius of gyration is smaller with the same cluster size (number-based), which means that the particle agglomerations are in a tighter coagulation. With the increase in the volume fraction, the aggerates tend to be fractal agglomeration and the fractal dimension in the range of 1.614–2.060. When the volume fraction is high, the agglomeration from the collision develops fractal-like structures.
A summary of the fractal aggregate distribution range and fractal-like structures in the nanoscales is given, which could be applied to progress design for multi-collision nanoclusters. Finally, the detailed size distributions can be readily used with the dynamics of industrial progress design, air pollution, and meteorology.
Author Contributions
Conceptualization, M.Y.; methodology, M.Y.; software, X.W.; validation, X.W. and Y.L.; formal analysis, T.W.; investigation, M.Y.; resources, T.W.; data curation, X.W.; writing-original draft preparation, X.W.; writing-review and editing, Y.L.; visualization, X.W. All authors have read and agreed to the published version of the manuscript.
Funding
This research was funded by National Natural Science Foundation of China (11872353, 91852102).
Institutional Review Board Statement
Not applicable.
Informed Consent Statement
Not applicable.
Data Availability Statement
Raw data are available on request.
Acknowledgments
The authors thank the National Natural Science Foundation of China (11872353, 91852102) for their support.
Conflicts of Interest
The authors declare no conflict of interest.
References
- Yu, M.; Lin, J. Nanoparticle-laden flows via moment method: A review. Int. J. Multiph. Flow 2010, 36, 144–151. [Google Scholar] [CrossRef]
- Liu, S.; Lin, J.-Z. Numerical Simulation of Nanoparticle Coagulation in a Poiseuille Flow Via a Moment Method. J. Hydrodyn. 2008, 20, 1–9. [Google Scholar] [CrossRef]
- Lin, J.-Z.; Yu, M.-Z.; Nie, D.-M. On the nanoparticulate flow. J. Hydrodyn. 2016, 28, 961–970. [Google Scholar] [CrossRef]
- Pratsinis, S.E. Flame aerosol synthesis of ceramic powders. Prog. Energy Combust. Sci. 1998, 24, 197–219. [Google Scholar] [CrossRef]
- Heine, M.C.; Pratsinis, S.E. High Concentration Agglomerate Dynamics at High Temperatures. Langmuir 2006, 22, 10238–10245. [Google Scholar] [CrossRef] [PubMed]
- Trzeciak, T.M.; Podgórski, A.; Marijnissen, J.C. Brownian coagulation in dense systems: Thermal non-equilibrium effects. J. Aerosol Sci. 2014, 69, 1–12. [Google Scholar] [CrossRef]
- Thajudeen, T.; Gopalakrishnan, R., Jr.; Christopher, J.H., Jr. The Collision Rate of Nonspherical Particles and Aggregates for all Diffusive Knudsen Numbers. Aerosol Sci. Technol. 2012, 46, 1174–1186. [Google Scholar] [CrossRef]
- Blatz, P.J.; Tobolsky, A.V. Note on the Kinetics of Systems Manifesting Simultaneous Polymerization-Depolymerization Phenomena. J. Phys. Chem. 1945, 49, 77–80. [Google Scholar] [CrossRef]
- Batchelor, G.K. The effect of Brownian motion on the bulk stress in a suspension of spherical particles. J. Fluid Mech. 1977, 83, 97–117. [Google Scholar] [CrossRef]
- Heine, M.C.; Pratsinis, S.E. Brownian Coagulation at High Concentration. Langmuir 2007, 23, 9882–9890. [Google Scholar] [CrossRef] [PubMed]
- Sheldon, K.F. Smoke, Dust, and Haze: Fundamentals of Aerosol Dynamics. Physics Today 1977, 30, 58–59. [Google Scholar]
- Ketzel, M.; Berkowicz, R. Modelling the fate of ultrafine particles from exhaust pipe to rural background: An analysis of time scales for dilution, coagulation and deposition. Atmos. Environ. 2004, 38, 2639–2652. [Google Scholar] [CrossRef]
- Ringl, C.; Urbassek, H.M. A LAMMPS implementation of granular mechanics: Inclusion of adhesive and microscopic friction forces. Comput. Phys. Commun. 2012, 183, 986–992. [Google Scholar] [CrossRef]
- Buesser, B.; Heine, M.; Pratsinis, S. Coagulation of highly concentrated aerosols. J. Aerosol Sci. 2009, 40, 89–100. [Google Scholar] [CrossRef]
- Sorensen, C.; Hageman, W.B.; Rush, T.J.; Huang, H.; Oh, C. Aerogelation in a Flame Soot Aerosol. J. Aerosol Sci. 1998, 29, S623–S624. [Google Scholar] [CrossRef]
- Heine, M.C.; Pratsinis, S.E. Agglomerate TiO2 Aerosol Dynamics at High Concentrations. Part. Part. Syst. Charact. 2007, 24, 56–65. [Google Scholar] [CrossRef]
- Fry, D.; Sintes, T.; Chakrabarti, A.; Sorensen, C.M. Enhanced Kinetics and Free-Volume Universality in Dense Aggregating Systems. Phys. Rev. Lett. 2002, 89, 148301. [Google Scholar] [CrossRef] [Green Version]
- Gimel, C.J.; Durand, D.; Nicola, T.I. Transition between flocculation and percolation of a diffusion-limited clus-ter-cluster aggregation process using three-dimensional Monte Carlo simulation. Phys. Rev. B Condens. Matter 1995, 51, 11348–11357. [Google Scholar] [CrossRef] [PubMed]
- Arias-Zugasti, M. Adaptive orthogonal collocation for aerosol dynamics under coagulation. J. Aerosol Sci. 2012, 50, 57–74. [Google Scholar] [CrossRef]
- Liu, S.; Chan, T.L.; Liu, H. Numerical simulation of particle formation and evolution in a vehicle exhaust plume using the bimodal Taylor expansion method of moments. Particuology 2019, 43, 46–55. [Google Scholar] [CrossRef]
- Yu, M.; Lin, J.; Chan, T.L. A New Moment Method for Solving the Coagulation Equation for Particles in Brownian Motion. Aerosol Sci. Technol. 2008, 42, 705–713. [Google Scholar] [CrossRef]
- Yu, M.; Lin, J. Solution of the agglomerate Brownian coagulation using Taylor-expansion moment method. J. Colloid Interface Sci. 2009, 336, 142–149. [Google Scholar] [CrossRef]
- Yu, M.; Lin, J. Taylor-expansion moment method for agglomerate coagulation due to Brownian motion in the entire size regime. J. Aerosol Sci. 2009, 40, 549–562. [Google Scholar] [CrossRef]
- Yu, M.; Liu, Y.; Lin, J.; Seipenbusch, M. Generalized TEMOM Scheme for Solving the Population Balance Equation. Aerosol Sci. Technol. 2015, 49, 1021–1036. [Google Scholar] [CrossRef] [Green Version]
- Drew, M.G. The art of molecular dynamics simulation. Comput. Biol. Chem. 1996, 20, 489. [Google Scholar] [CrossRef]
- Erban, R. From Molecular Dynamics to Brownian Dynamics. Proc. Math. Phys. Eng. Sci. 2014, 470, 20140036. [Google Scholar] [CrossRef] [Green Version]
- Tahery, R.; Modarress, H. Lennard-Jones Energy Parameter for Pure Fluids from Scaled Particle Theory. Iran. J. Chem. Chem. Eng. Int. Engl. Ed. 2007, 26, 1–9. [Google Scholar]
- Maitland, G.; Rigby, M.; Smith, E.; Wakeham, W.; Henderson, D. Intermolecular Forces: Their Origin and Determination. Phys. Today 1983, 36, 57–58. [Google Scholar] [CrossRef]
- Wang, K.; Yu, S.; Peng, W. An analytical solution of the population balance equation for simultaneous Brownian and shear coagulation in the continuum regime. Adv. Powder Technol. 2020, 31, 2128–2135. [Google Scholar] [CrossRef]
- Poulin, P.; Stark, H.; Lubensky, T.C.; Weitz, D.A. Novel Colloidal Interactions in Anisotropic Fluids. Science 1997, 275, 1770–1773. [Google Scholar] [CrossRef] [Green Version]
- Brasil, A.M.; Farias, T.L.; Carvalho, M.D.G.; Koylu, U.O. Numerical characterization of the morphology of aggregated particles. J. Aerosol Sci. 2001, 32, 489–508. [Google Scholar] [CrossRef]
- Schneider, T.; Stoll, E. Molecular-dynamics study of a three-dimensional one-component model for distortive phase transitions. Phys. Rev. B 1978, 17, 1302–1322. [Google Scholar] [CrossRef]
- Xiong, C.; Friedlander, S.K. Morphological properties of atmospheric aerosol aggregates. Proc. Natl. Acad. Sci. USA 2001, 98, 11851–11856. [Google Scholar] [CrossRef] [Green Version]
- Lindberg, C.S.; Manuputty, M.Y.; Yapp, E.K.; Akroyd, J.; Xu, R.; Kraft, M. A detailed particle model for polydisperse aggregate particles. J. Comput. Phys. 2019, 397, 108799. [Google Scholar] [CrossRef]
- Vemury, S.; Pratsinis, S.E. Self-preserving size distributions of agglomerates. J. Aerosol Sci. 1995, 26, 175–185. [Google Scholar] [CrossRef]
- Kelkar, A.V.; Dong, J.; Franses, E.I.; Corti, D.S. New models and predictions for Brownian coagulation of non-interacting spheres. J. Colloid Interface Sci. 2013, 389, 188–198. [Google Scholar] [CrossRef] [PubMed]
- Lister, J.D.; Smit, D.J.; Hounslow, M. Adjustable discretized population balance for growth and aggregation. AIChE J. 1995, 41, 591–603. [Google Scholar] [CrossRef]
- Stukowski, A. Visualization and analysis of atomistic simulation data with OVITO–the Open Visualization Tool. Model. Simul. Mater. Sci. Eng. 2010, 18, 2154–2162. [Google Scholar] [CrossRef]
- Grass, R.N.; Tsantilis, S.; Pratsinis, S.E. Design of high-temperature, gas-phase synthesis of hard or soft TiO2 agglomerates. AIChE J. 2006, 52, 1318–1325. [Google Scholar] [CrossRef]
- Goudeli, E.; Eggersdorfer, M.L.; Pratsinis, S.E. Coagulation–Agglomeration of Fractal-like Particles: Structure and Self-Preserving Size Distribution. Langmuir 2015, 31, 1320–1327. [Google Scholar] [CrossRef]
- Arakawa, S.; Tatsuuma, M.; Sakatani, N.; Nakamoto, T. Thermal conductivity and coordination number of compressed dust aggregates. Icarus 2019, 324, 8–14. [Google Scholar] [CrossRef] [Green Version]
- Teichmann, J.; Van, D. Cluster models for random particle aggregates—Morphological statistics and collision distance. Spat. Stat. 2015, 12, 65–80. [Google Scholar] [CrossRef]
- Koch, W. The effect of particle coalescence on the surface area of a coagulating aerosol. J. Colloid Interface Sci. 1990, 20, 891–894. [Google Scholar] [CrossRef]
- Eggersdorfer, M.L.; Pratsinis, S.E. Agglomerates and aggregates of nanoparticles made in the gas phase. Adv. Powder Technol. 2014, 25, 71–90. [Google Scholar] [CrossRef]
Figure 1.
Neighbor list and collision progress.

Figure 2.
The aggregates composed of monomers and the circle of the cluster.

Figure 3.
Aggregates concentration with time range (L = 60 ns).

Figure 4.
The CPU velocity and total walk time in the same running range.

Figure 5.
Agglomeration concentration with the change in particle numbers: (a) the evolution of particle numbers with time; (b) the effective agglomerate concentration in the system.
Figure 5.
Agglomeration concentration with the change in particle numbers: (a) the evolution of particle numbers with time; (b) the effective agglomerate concentration in the system.

Figure 6.
Collision results of primary particles from different volume fraction.

Figure 7.
(a) Normalized particle size distributions; (b) geometric standard deviations with different volume fractions.
Figure 7.
(a) Normalized particle size distributions; (b) geometric standard deviations with different volume fractions.

Figure 8.
Agglomeration compactness under different initial particle sizes.

Figure 9.
Coordination number analysis with different volume fractions: (a) 0.05; (b) 0.1; (c) 0.2; (d) 0.3.
Figure 9.
Coordination number analysis with different volume fractions: (a) 0.05; (b) 0.1; (c) 0.2; (d) 0.3.

Figure 10.
The fractal dimension and monomers number in the aggregates with different volume fractions.
Figure 10.
The fractal dimension and monomers number in the aggregates with different volume fractions.

Publisher’s Note: MDPI stays neutral with regard to jurisdictional claims in published maps and institutional affiliations. |
© 2021 by the authors. Licensee MDPI, Basel, Switzerland. This article is an open access article distributed under the terms and conditions of the Creative Commons Attribution (CC BY) license (https://creativecommons.org/licenses/by/4.0/).
Share and Cite
MDPI and ACS Style
Wang, X.; Liu, Y.; Wu, T.; Yu, M. Polymerization and Collision in High Concentrations for Brownian Coagulation. Appl. Sci. 2021, 11, 6815. https://doi.org/10.3390/app11156815
AMA Style
Wang X, Liu Y, Wu T, Yu M. Polymerization and Collision in High Concentrations for Brownian Coagulation. Applied Sciences. 2021; 11(15):6815. https://doi.org/10.3390/app11156815
Chicago/Turabian StyleWang, Xiaoyue, Yueyan Liu, Taiquan Wu, and Mingzhou Yu. 2021. "Polymerization and Collision in High Concentrations for Brownian Coagulation" Applied Sciences 11, no. 15: 6815. https://doi.org/10.3390/app11156815
Note that from the first issue of 2016, this journal uses article numbers instead of page numbers. See further details here.