
Safety Evaluation of a RC Structure with Multiple Openings under High Water Depth Inundations


1
Department of architecture, Shinshu University, 4-17-1 Wakasato, Nagano 380-8553, Japan
2
Mitsuya G home, 2-11-6, Inada, Nagano 381-0042, Japan
*
Author to whom correspondence should be addressed.
Appl. Sci. 2021, 11(9), 4297; https://doi.org/10.3390/app11094297
Submission received: 28 March 2021
/
Revised: 28 April 2021
/
Accepted: 6 May 2021
/
Published: 10 May 2021
(This article belongs to the Section Civil Engineering)
Abstract
:Experimental and numerical studies were conducted to examine the resistance of a newly developed residential building to inundations. Natural disasters including inundations have occurred frequently in recent decades. Once inundations submerge urban areas, water may remain there for days. This can cause substantial economic and social costs. Flood hazards have been widely discussed and investigated. However, sufficient research contributions have not been made on the behaviour of individual buildings under inundations. The objective of the research was to develop a prototype residential building in which residents can stay during inundations without the need of evacuation. A 3-m water depth was the target for safety evaluation in this research. This paper dealt with three tasks. First, three-point bending tests were performed on window components. Second, a hydrostatic pressure test was carried out on a full-scale reinforced concrete (RC) specimen. Third, taking advantage of the preceding two tasks, numerical simulations were performed to examine the behaviour of the prototype building under hydrostatic and hydrodynamic pressures. The experiments and numerical analyses showed that the prototype building had sufficient resistance and waterproofness against the inundations of a 3-m water depth. This research contributed to the improvements of the safety of RC structures against inundations and flood-risk reduction in urban areas.
1. Introduction
Natural disasters are major threats to urban areas, including droughts, earthquakes, hurricanes, inundations, tornadoes, tsunamis and volcanic eruptions [1,2,3,4,5]. Heavy rainfall may induce inundations to occur in coastal and riverfront zones close to which populated areas often exist [2]. Inundations cause considerable economic and social costs [1]. Risk assessment is often taken advantage of to reduce such costs [6]. Different assessment approaches have been proposed and examined according to risk types, disaster size, flow types and assessment concerns [7,8,9,10,11,12,13]. It is helpful to take into account recurrence intervals for the accurate estimations of flood risk levels [14]. However, risk assessment may not be accurate when the data of past floods are not sufficient [15].
The studies of the behaviour of structures under inundations often consider water depths and duration as damage controlling parameters [16]. The actions of inundations on structures are categorised into five types: hydrostatic, hydrodynamic, erosion, buoyancy and debris actions [16,17,18,19,20,21,22]. As for high-tide floods including tsunamis, in addition to the above-mentioned five actions, impulsive actions need to be taken into account [23]. Wave-tank tests showed that forces acting on buildings were highly influenced by flow angles to buildings [24], building shapes [25,26] and building arrangement [27]. According to the flow angles, forces can be 10 times larger than hydrostatic pressures normal to a building surface [28]. Impact pressures due to impulsive actions were found to be distributed linearly in a vertical direction [29]. The impact pressures could be 10–12 times higher than the hydrostatic pressures [30].
Analytical and numerical studies have been carried out to examine behaviour under inundations. Two load combinations are usually considered for structural analysis [17,31]. One assumes that the loads consist of hydrostatic and hydrodynamic pressures [32]. The other considers that the loads are divided into hydrostatic, hydrodynamic and impulsive forces [33]. Hydrodynamic analysis may show accurate results by taking into account accumulative effects due to a series of floods [34]. The behaviour of concrete structures was influenced by interaction between flows and buildings [35]. Debris flows were highly influenced by building density [36,37]. Impact pressures increase in the vertical and horizontal direction as the water depth increases [29]. Microscale numerical analysis showed that the stresses in concrete specimens were irregularly distributed even under hydrostatic pressures due to the heterogeneity of concrete at microscopic levels [38].
In addition to structural safety, the waterproofness of buildings is a key concern during and after the occurrence of inundations [20,33]. Waterproof construction techniques were discussed for masonry structures [39,40] and for concrete structures [22]. Recently, experimental investigations were performed to identify the causes of the waterproofing failures of concrete structures [41]. Experiments showed that cracks were the major factor in water leaks for concrete structures [42]. Concrete bonding waterstops were found to be useful to improve the waterproofness of buildings [43].
This paper proposed a prototype two-storey residential building that is safe against inundations of a 3-m water depth. The ground-storey is built of reinforced concrete (RC) and the first storey of timber. The present research focused on the behaviour of the ground-storey under hydrostatic and hydrodynamic pressures. To this aim, the research consisted of three tasks. First, three-point bending tests were conducted on laminated glass and PMMA plates that were used for windows of the prototype building. Second, a full-scale specimen was subject to hydrostatic pressures of a 3-m water depth. The specimen included a door and windows of the prototype building. Hydrostatic pressures were applied by filling water inside the specimen. The deformation of the windows was measured. In addition, the causes of water leaks around the door and windows were investigated and waterproof measures were taken. Third, taking into account results obtained from the previous two tasks, numerical analysis was performed to examine the capacity and behaviour of the prototype building under hydrostatic and hydrodynamic pressures. Studies have been performed to improve the safety of buildings that experience hydraulic pressures including their waterproofness. However, still comprehensive methodologies for the assessment of buildings under hydraulic pressures have not been established and further research contributions are necessary [17]. This paper provided insights on experimentally and numerically effective approaches to study the behaviour of buildings under inundations.
2. Research Methodologies
2.1. Description of the Prototype Residential Building
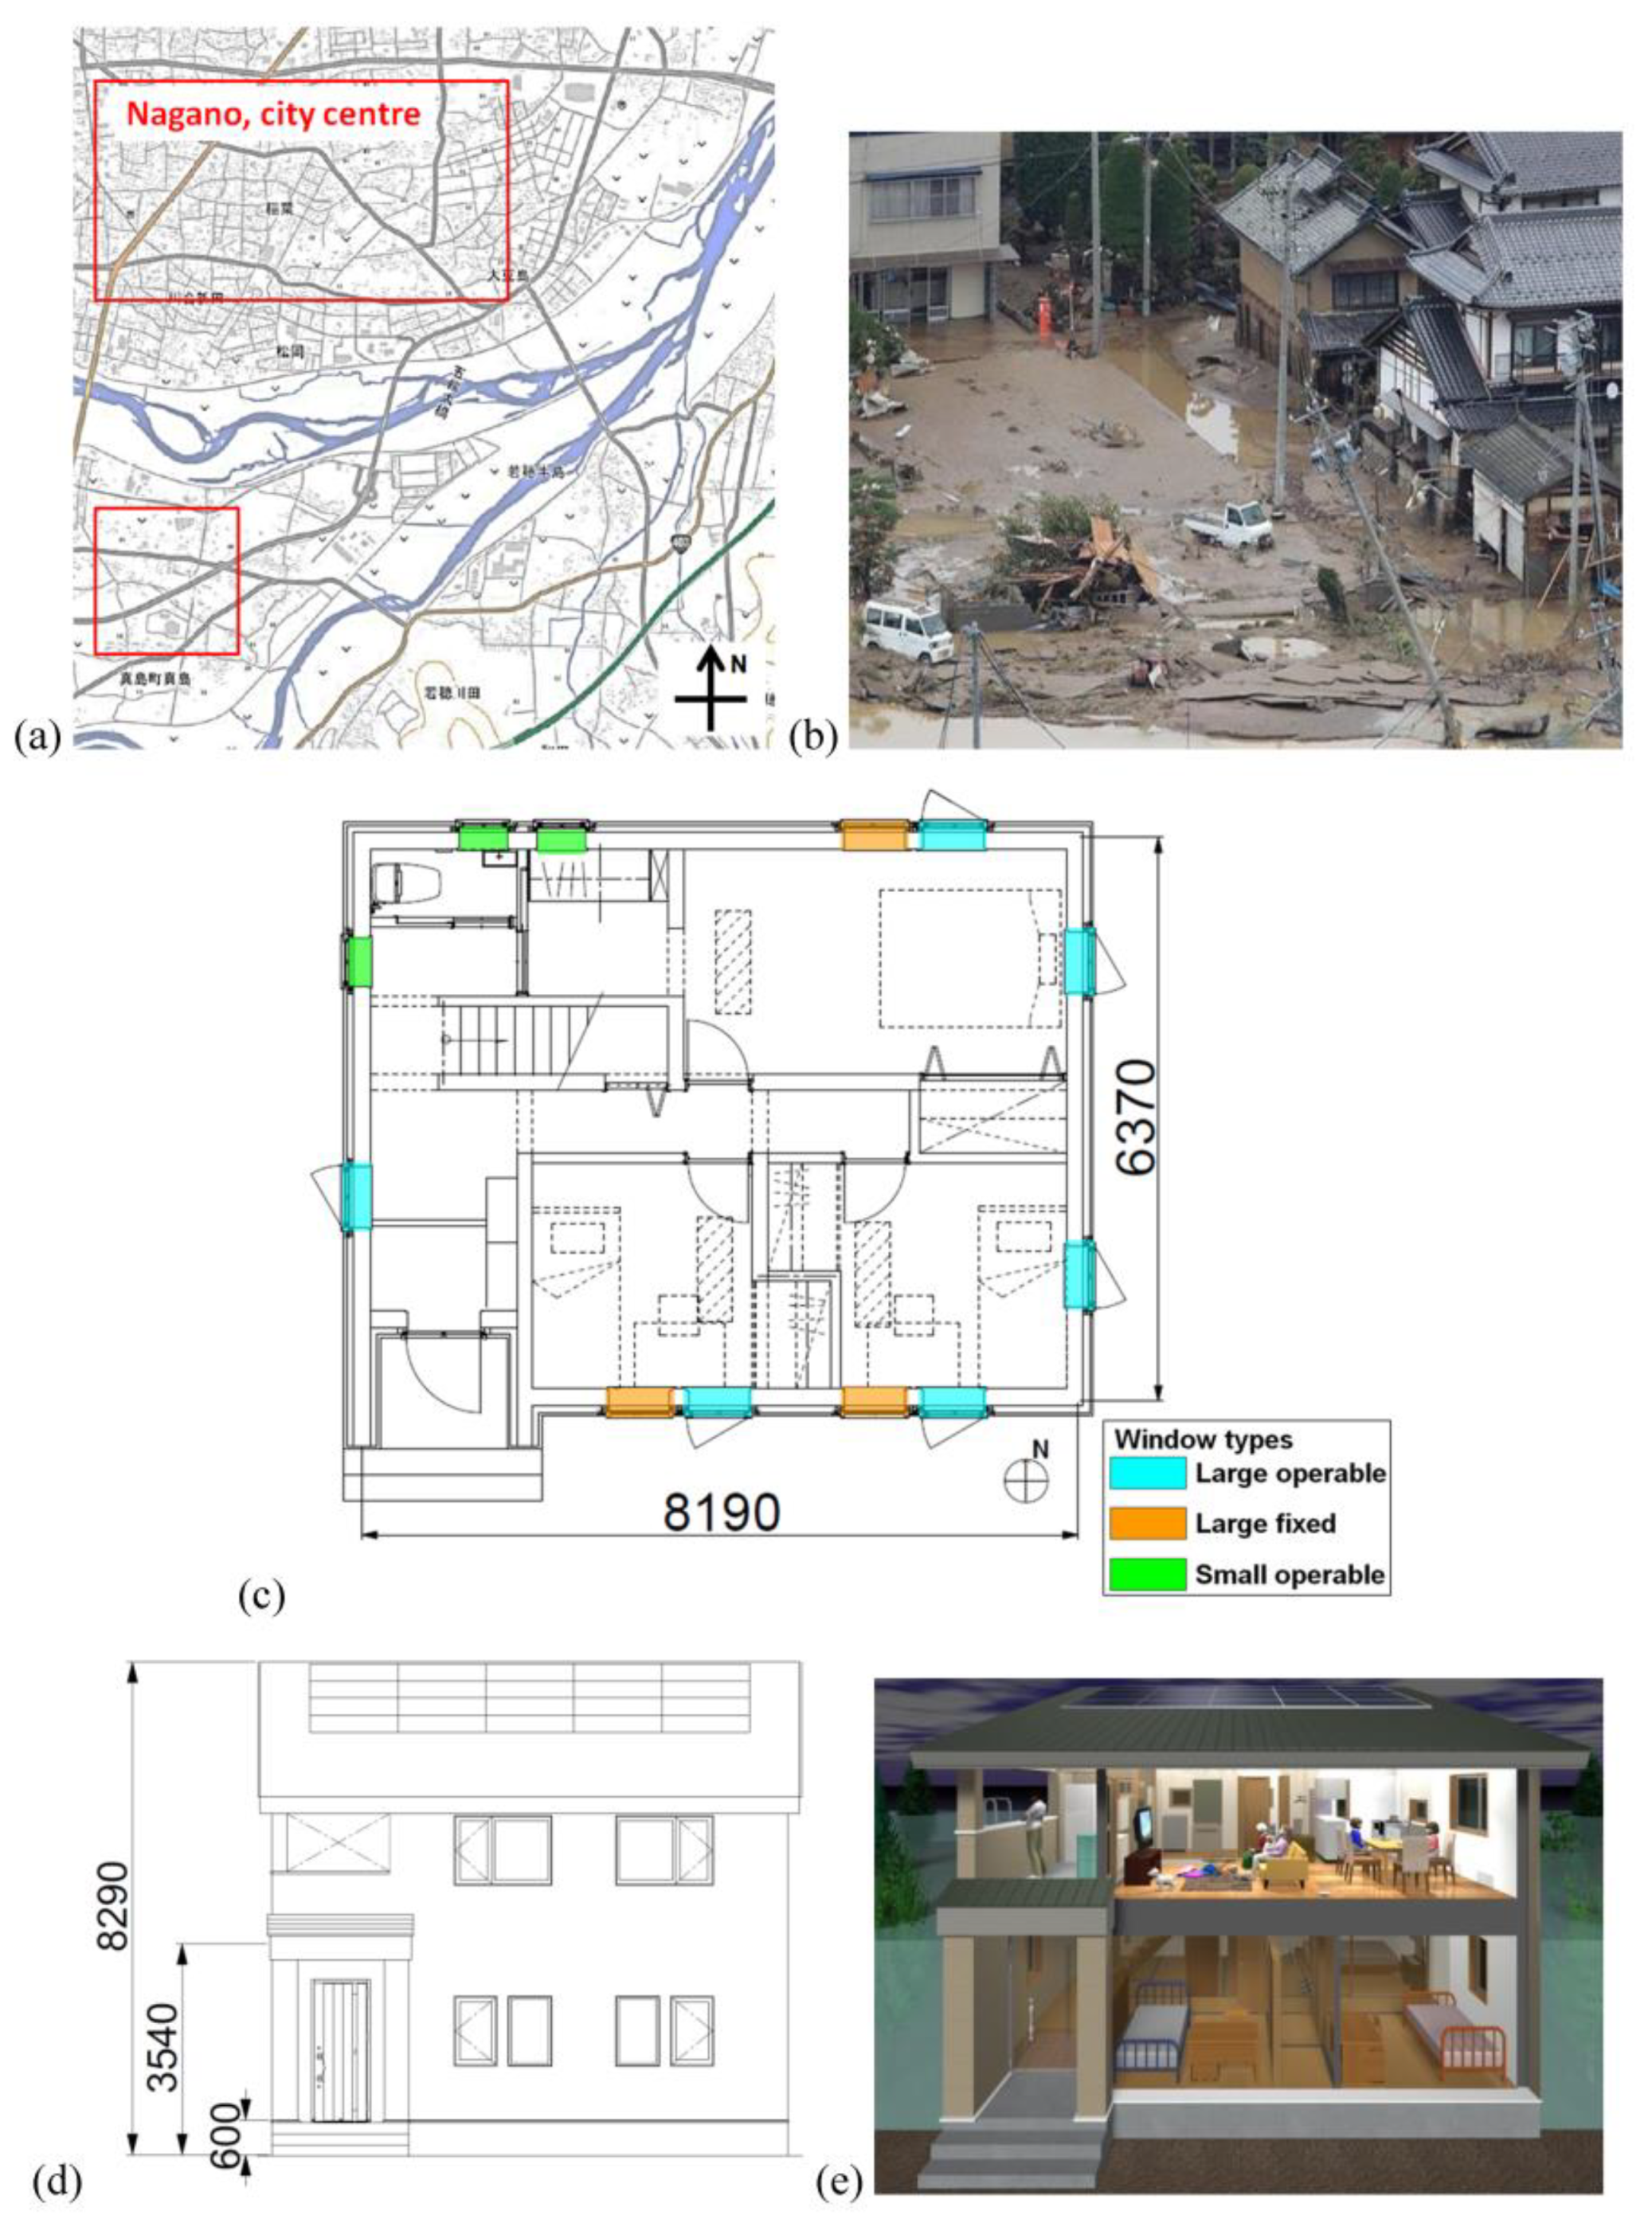
Flood-resistant residential buildings are planned to be constructed in a city surrounded by rivers in Nagano prefecture, Japan. Possible construction sites are at least 1 km away from the rivers (Figure 1a). In the figure, the red rectangles show the possible sites. The city is positioned in hill terrain and no threat of tsunamis is present. Nonetheless, flood risks are considered high. In fact, a severe flood disaster occurred in 2019 [44] (Figure 1b).
This paper proposed a prototype two-storey residential building. The ground storey is built of RC while the first storey of timber. Mixed RC/timber structures are attracting attention in Japan and other countries [45,46,47]. It is added that the building is constructed using typical building materials and products so that it does not require substantial additional costs, compared to conventional residential buildings. The present research focused on the behaviour of the ground-storey. The dimensions are 6.37 × 8.19 m2 in plan (Figure 1c). The exterior walls are 0.4 m thick while the interior ones 0.2 m. The entrance door is located at 0.6 m high above the ground level (Figure 1d). The height of the ground storey is 3.54 m and the total height of the building is 8.29 m. There are two types of windows: large ones and small ones. The large windows are located at 1.39 m high above the ground level while the small ones at 1.84 m high. In the south elevation, an entrance door, two large windows and two small ones are present. Two large windows are placed in the east elevation. The north elevation has two large windows and two small ones. The east elevation has a large and small window. The windows are either operable or fixed as shown in Figure 1c.
The building is aimed to withstand the inundations of a 3-m water depth, taking into account the flood hazard assessment of the possible sites [48]. During the occurrence of inundations, residents can spend days in the first storey till rescue teams come or water is gone (Figure 1e). It is noted that the building has sufficient self-weight against the buoyancy forces of a 3-m water depth. The self-weight is 2200 kN and the buoyancy forces are equal to 1724 kN.
2.2. Description of the Specimen
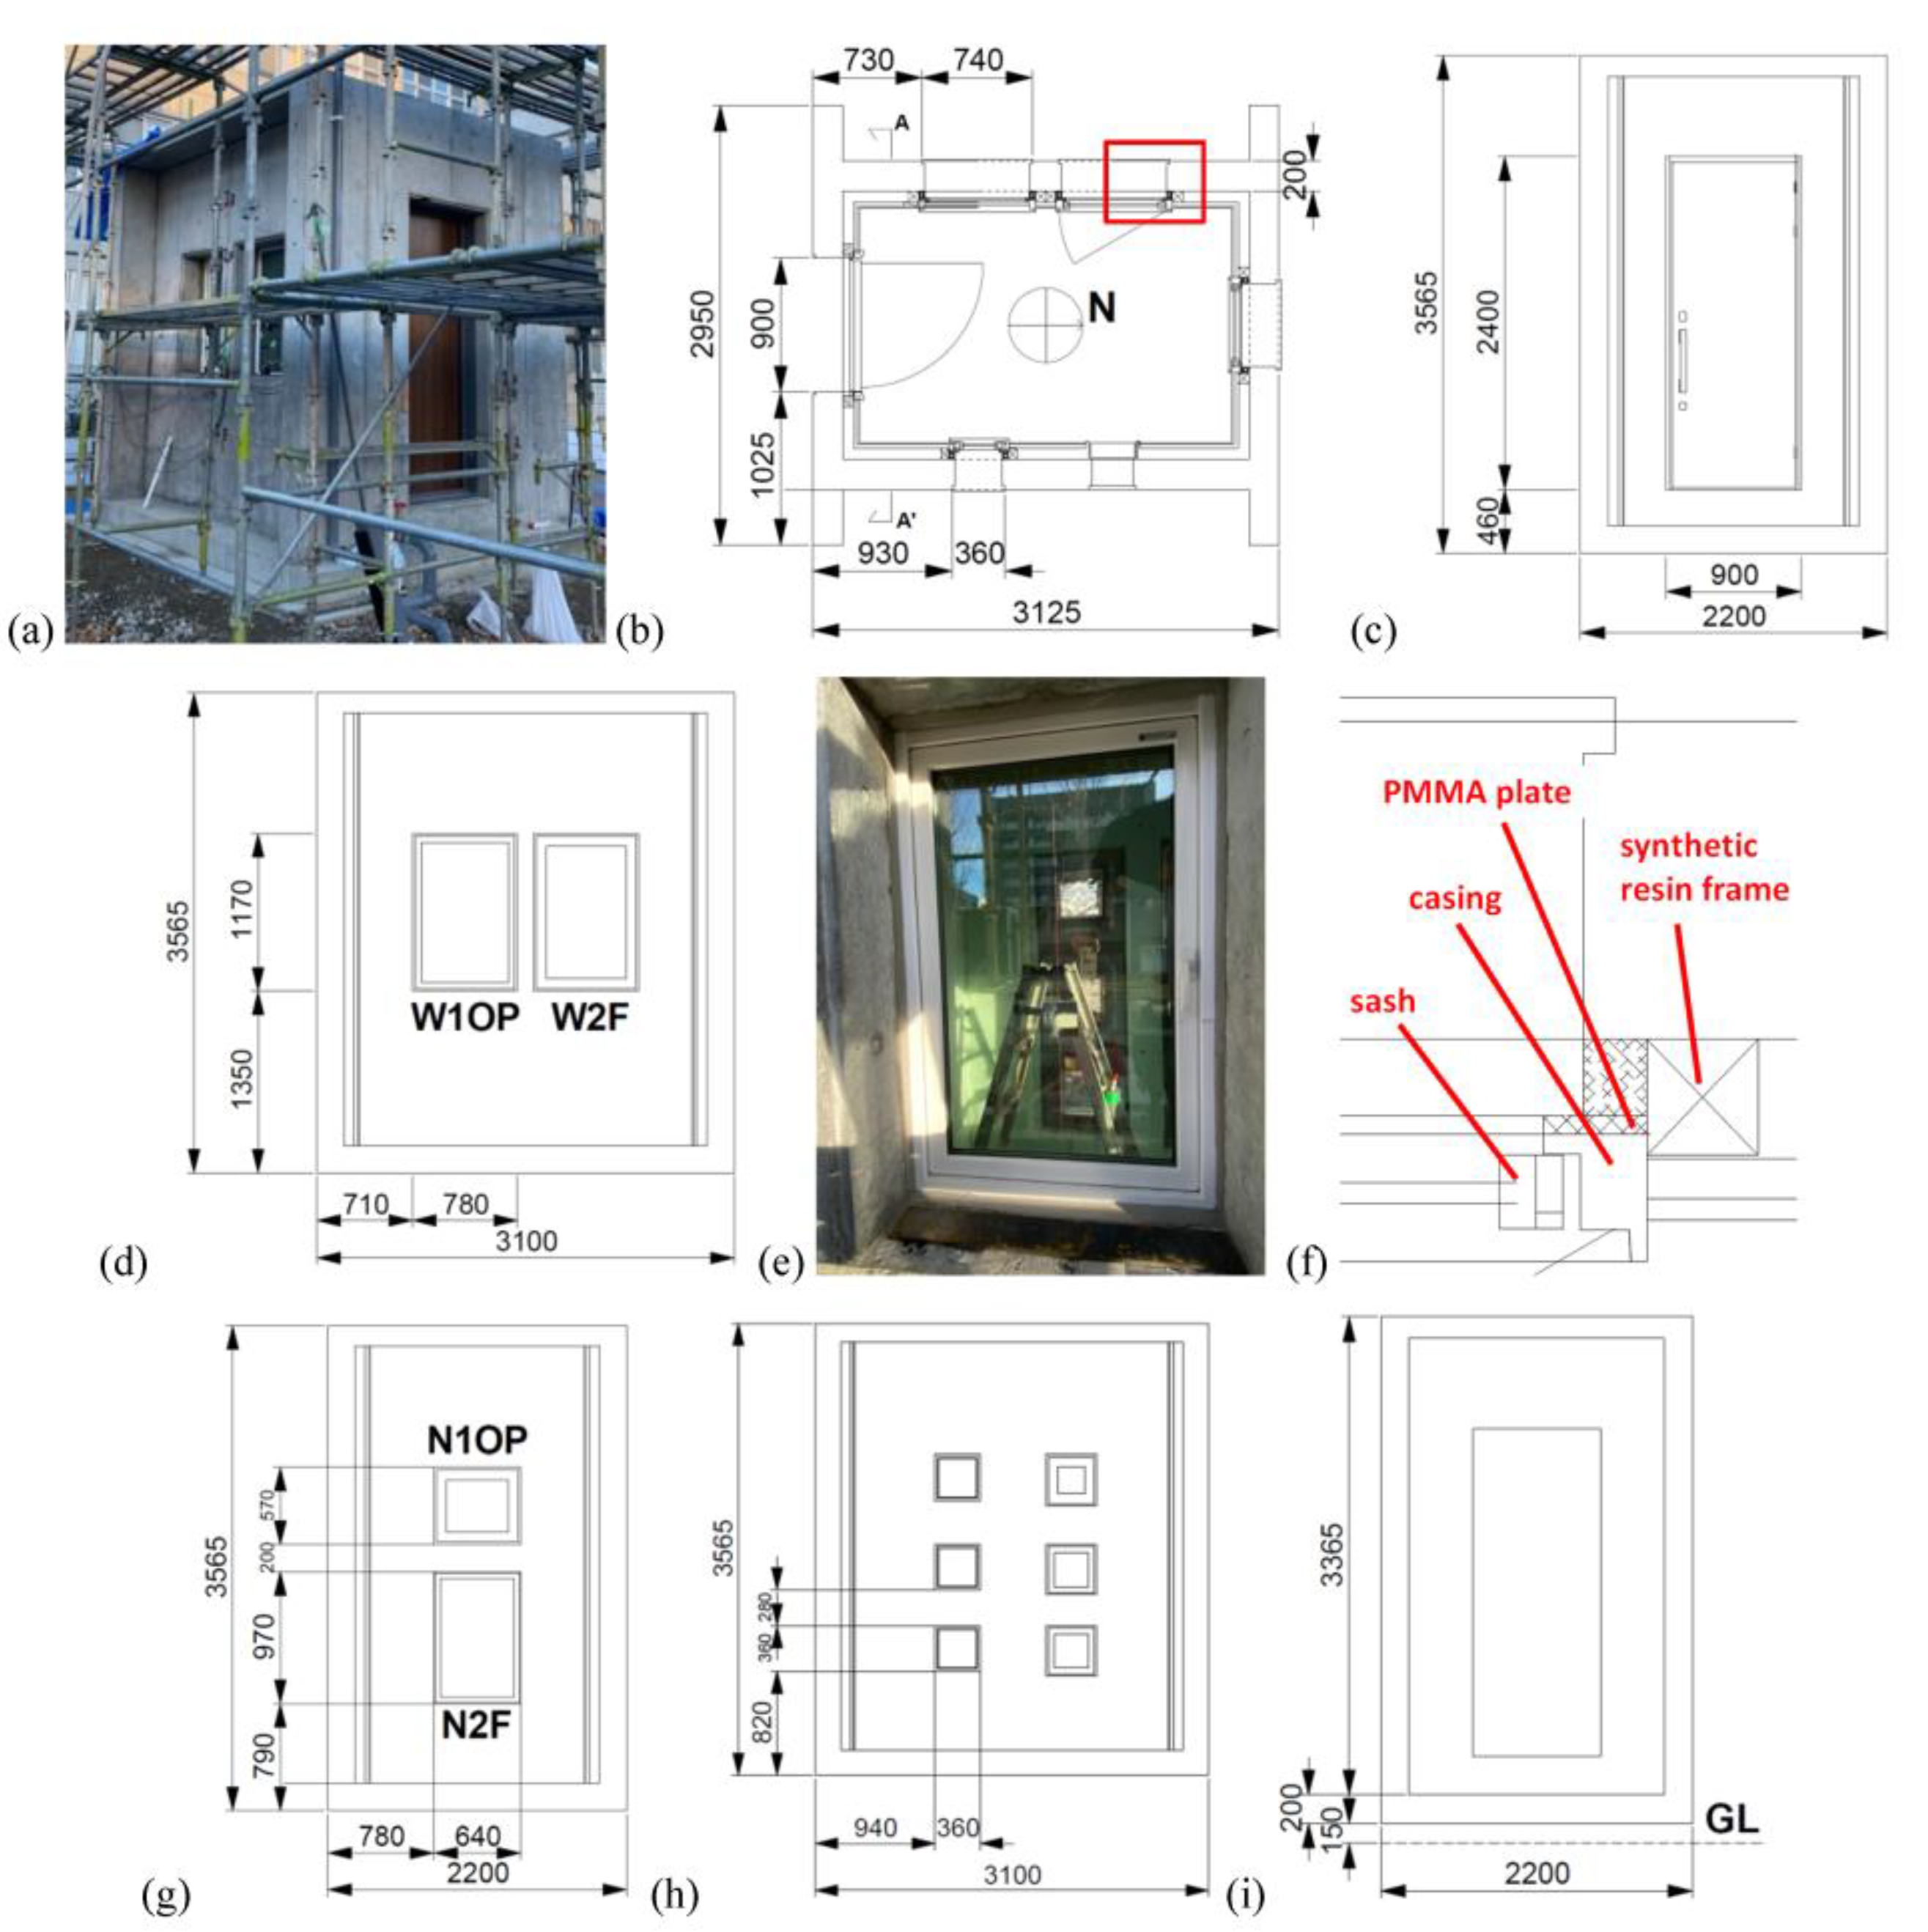
A full-scale specimen was composed of four walls with different openings (Figure 2a). The dimensions of the specimen were 3.0 × 3.1 m2 in plan and 3.55 m in height (Figure 2b). The specimen was placed on RC foundations. Their height was equal to 0.35 m (Figure 2i). The walls were 0.2 m thick. They were built of RC. The walls of the specimen were inside out. In other words, the interior sides of the specimen were in fact the exterior ones of the building. This approach allowed the test to be performed efficiently without the need of an excessive amount of water. The design compressive strength of the used concrete was 21 MPa. In this experiment, its water-cement ratio was less than 50% so that it was sufficiently watertight. The reinforcement bars were composed of SD295A [50]. Φ13 bars were located horizontally and vertically with spacing equal to 200 mm.
In the south elevation, an entrance door was located (Figure 2c). It was the same door as the prototype building. The door was composed of rigid polyurethane foam and was covered with metallic panels. Such a door was typically used for residential buildings in Japan. The dimensions were 2.4 × 1.0 m2 in elevation. The depth was 50 mm. In the west elevation, two windows of the same dimensions were placed horizontally (Figure 2d). The dimensions of the windows were 1.17 × 0.78 m2 in elevation. Their dimensions were the same as those of the large windows of the prototype building. One on the right side was fixed while the other was operable. The operable window is shown in Figure 2e. In the north elevation, two windows of the same width were located vertically (Figure 2g). The top window was operable while the bottom fixed. The dimensions of the top window were 0.57 × 0.64 m2 while those of the bottom 0.97 × 0.64 m2. The dimensions of the top window were the same as those of the small windows of the prototype building. The windows were double-glazing. The thickness of the panes was 6 mm and 7.5 mm. The distance between the panes was 12 mm. The exterior panes consisted of monolithic glass while the interior panes contacting water of laminated glass. They were composed of two 3-mm-thick glass panes and a 1.5-mm-thick interlayer laminate sheet. The sashes and casings of the windows were made of synthetic resins. It is noted that measures were taken to minimise the deformation of the windows. Figure 2f shows details around the operable window in the west elevation (red rectangle area in Figure 2b). 12-mm polymethyl methacrylate (PMMA) plates and synthetic resin frames were placed to restrain the deformation of the window casings. Space between the PMMA plate and frame was filled with cement mortar (mesh square shape in Figure 2f). They were used for the north and west windows. In the east elevation, six glass-blocks were positioned (Figure 2h). Their dimensions were 0.2 × 0.35 × 0.35 m3. In Figure 2d,g, alphanumeric codes are placed (e.g., W1OP). They denote the positions and conditions of the windows. For instance, the W1OP window means that it was positioned in the west wall and was operable. The codes are used in Section 3 and Section 4 to indicate the concerned windows.
2.3. Description of the Research Procedures
This research consisted of three stages. First, three-point bending tests were carried out on PMMA and laminated glass that were used for windows. Second, a hydrostatic pressure test was carried out on a full-scale specimen. Hydrostatic pressures were applied by filling water inside the specimen. The target water depth was 3 m. The deflection was measured on both sides of the windows. In addition, the causes of water leaks around openings were investigated and waterproof measures were taken. The third stage of the research dealt with numerical analysis. Two types of analyses were performed. First, the above-mentioned hydrostatic pressure test was simulated to compare the behaviour between the real structure and the numerical model. Second, the behaviour of the prototype building was analysed under flowing water. Water flows were simulated as hydrodynamic pressures.
3. Experimental Results
3.1. Three-Point Bending Tests
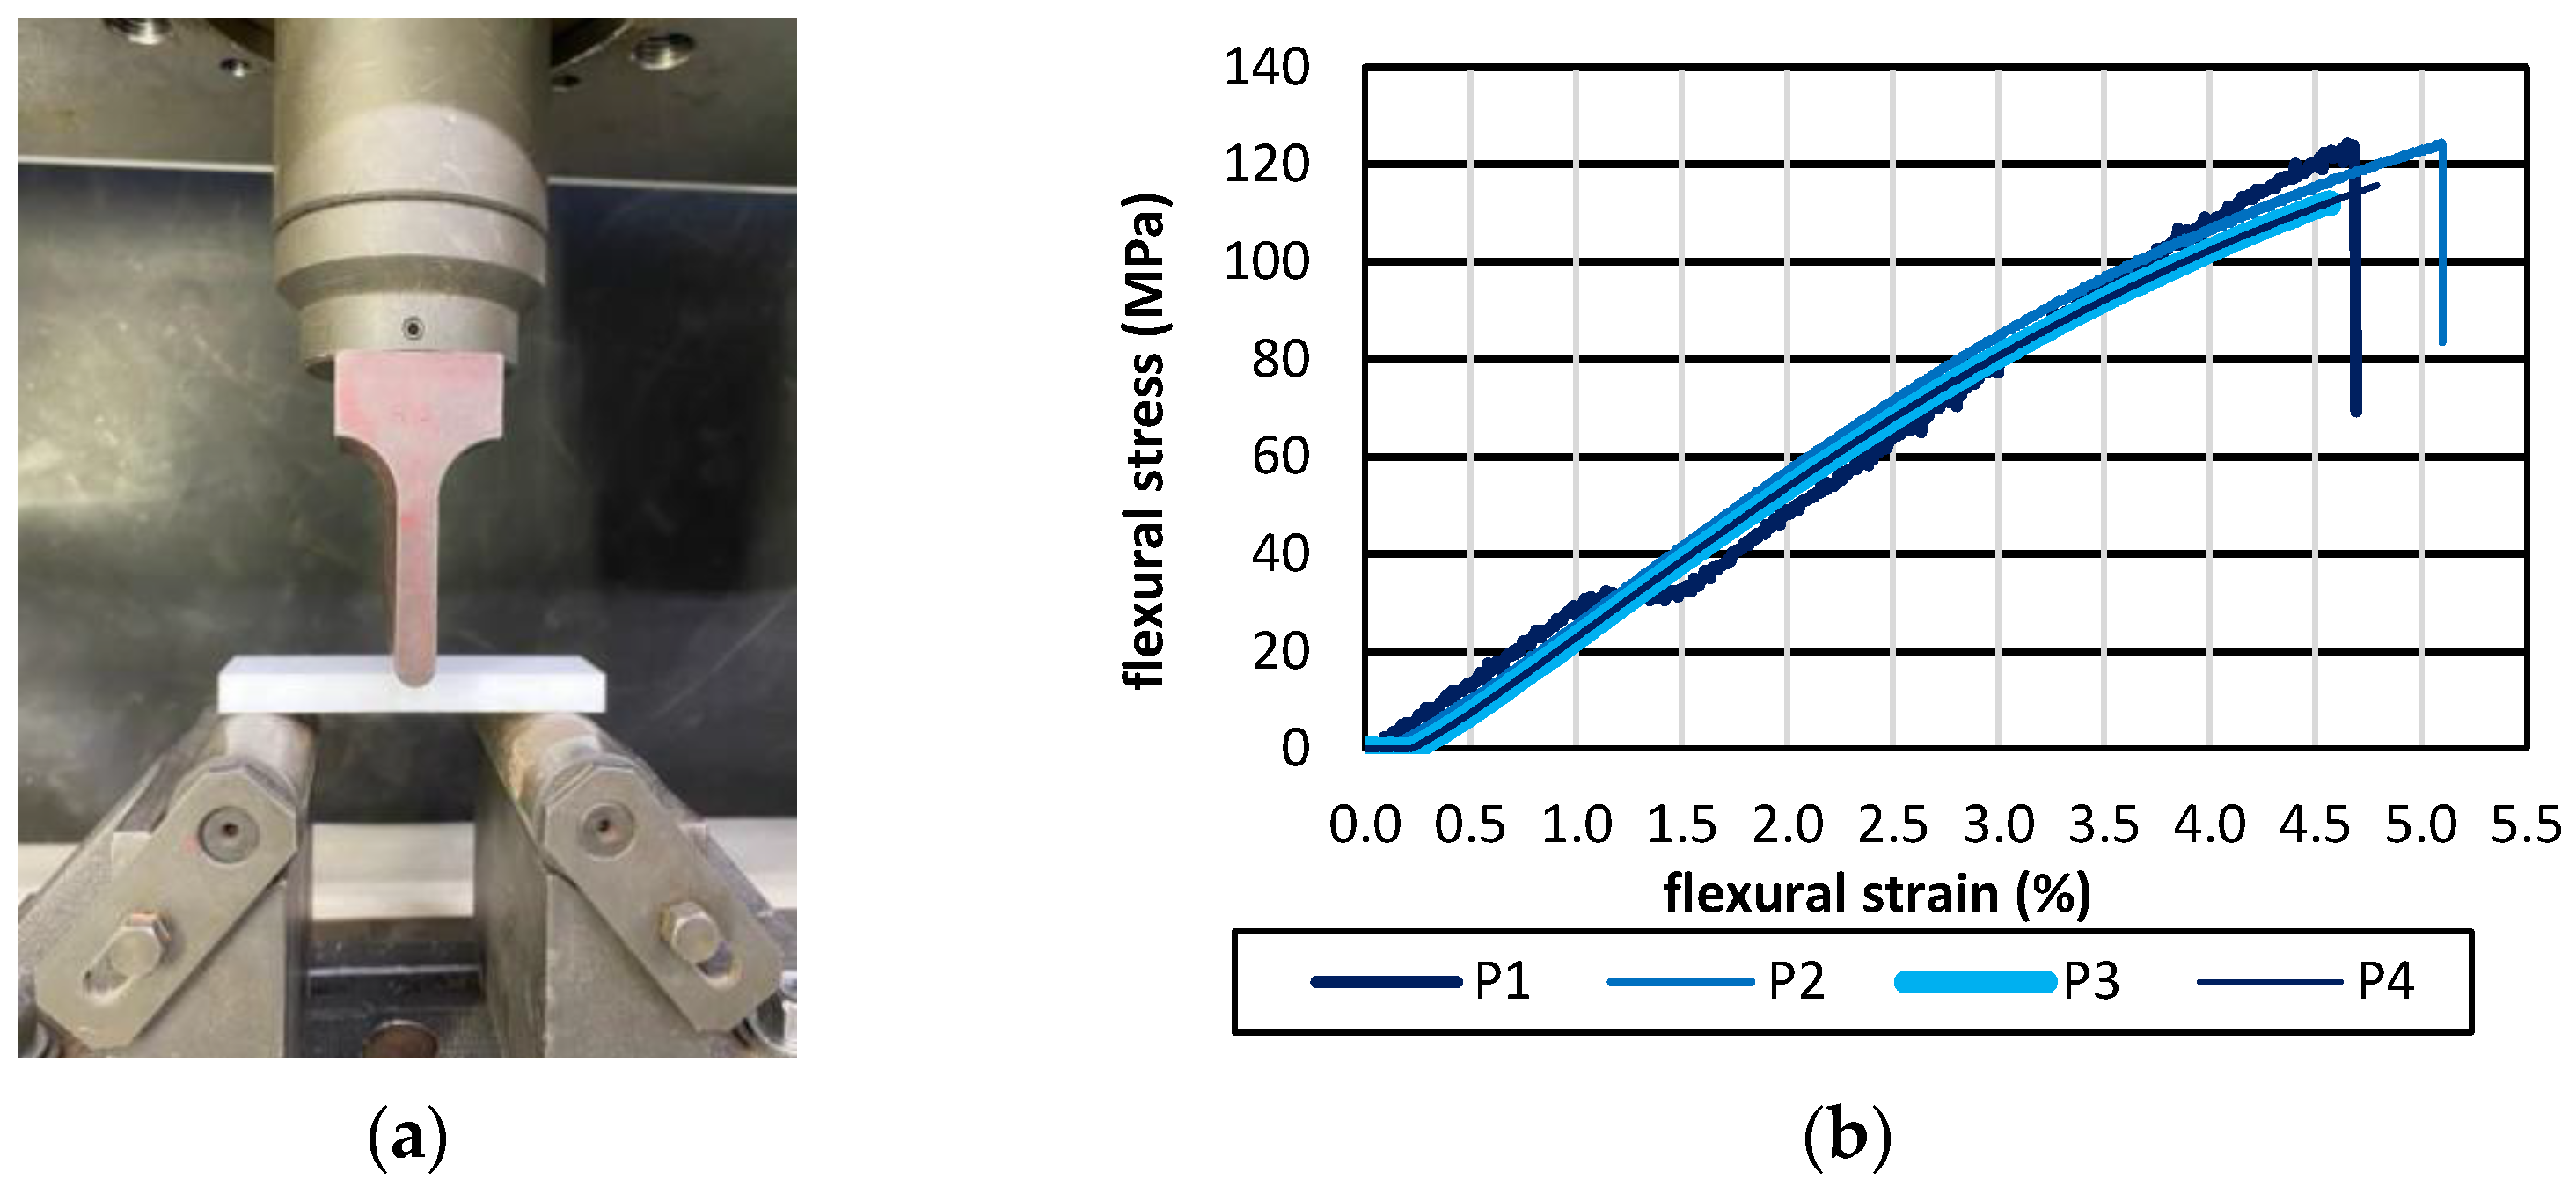
Three-point bending tests were performed on PMMA and laminated glass. The tests were performed, taking into account Japanese and ISO standard [51,52]. A 250-kN universal testing machine was used [53]. The dimensions of the specimens were 10 × 20 × 100 mm3 (Figure 3a). The support span was 80 mm. Four specimens (P1-P4) were tested. At the maximum loading, the specimens were split into half. Figure 3b shows the stress-strain relations at the mid-spans of the specimens. The flexural strength was 119.2 MPa on average (Figure 3b). The average flexural modulus was 2.5 GPa.
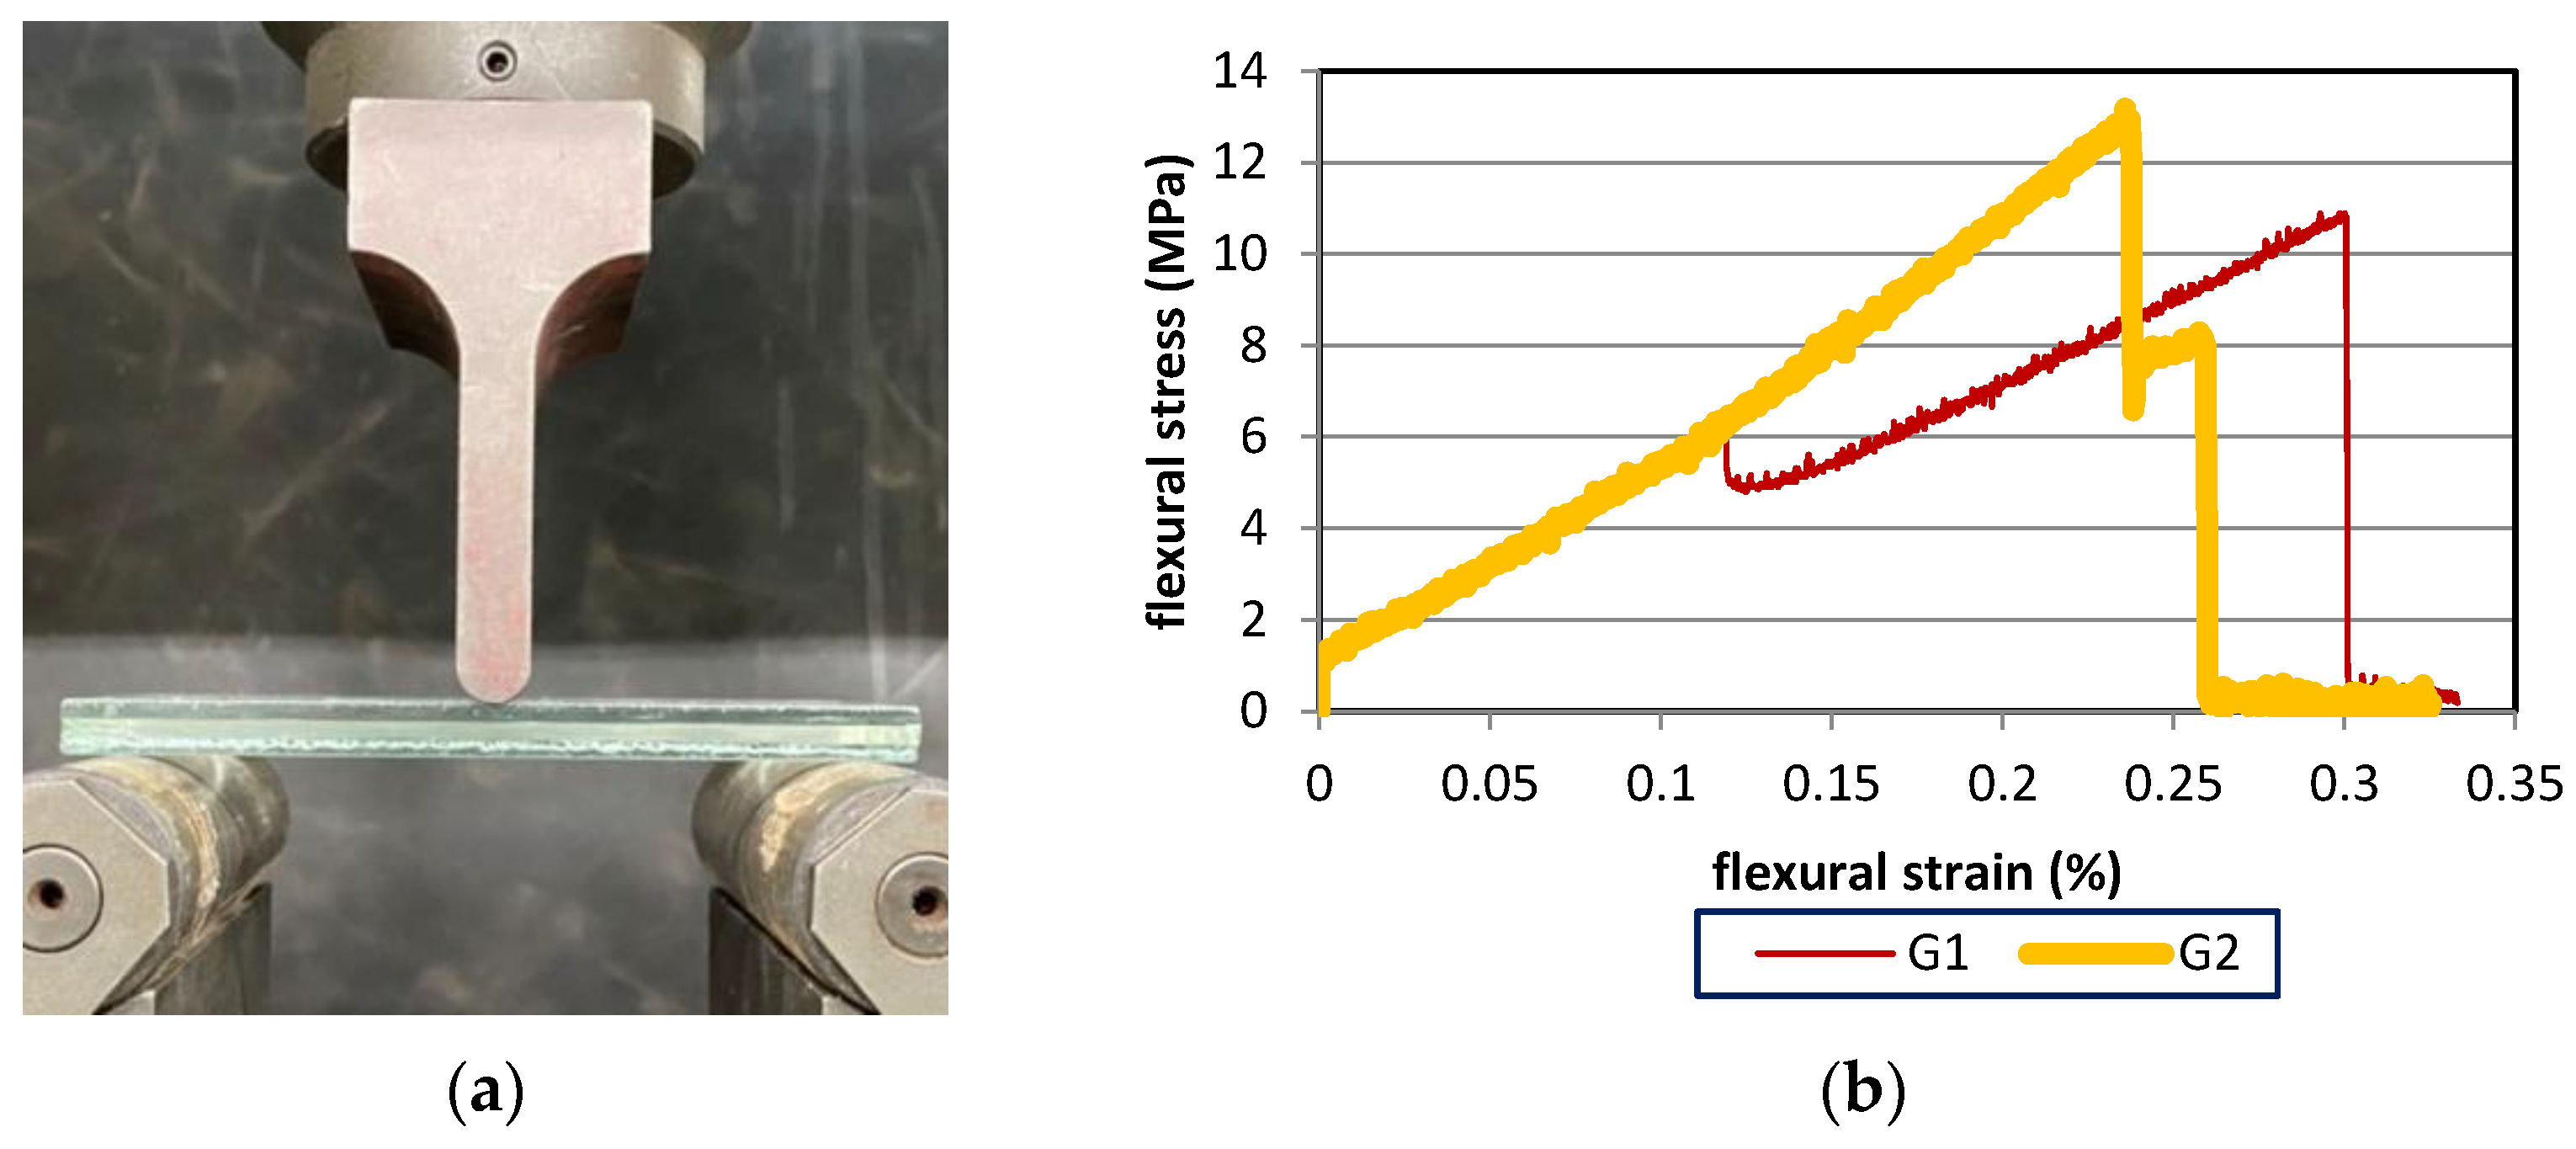
The laminated glass was examined, using the same testing machine. The dimensions of the specimens were 7.5 × 50 × 120 mm3 (Figure 4a). The support span was 100 mm. Three specimens (G1-G3) were tested. Failure was seen at the bottom of the specimens. Specimen G1 showed the drop of the stress during the loading. It was caused by the emergence of cracks on the top surface of the specimen. Figure 4b presents the stress-strain relations of specimens G1 and G2 at the mid-spans. The flexural strength was equal to 12.0 MPa on average. The average flexural modulus was 5.1 GPa. Compared to monolithic glass, low flexural stiffness was observed due to a flexible interlayer laminate sheet (Figure 4b).
3.2. Hydrostatic Pressure Test
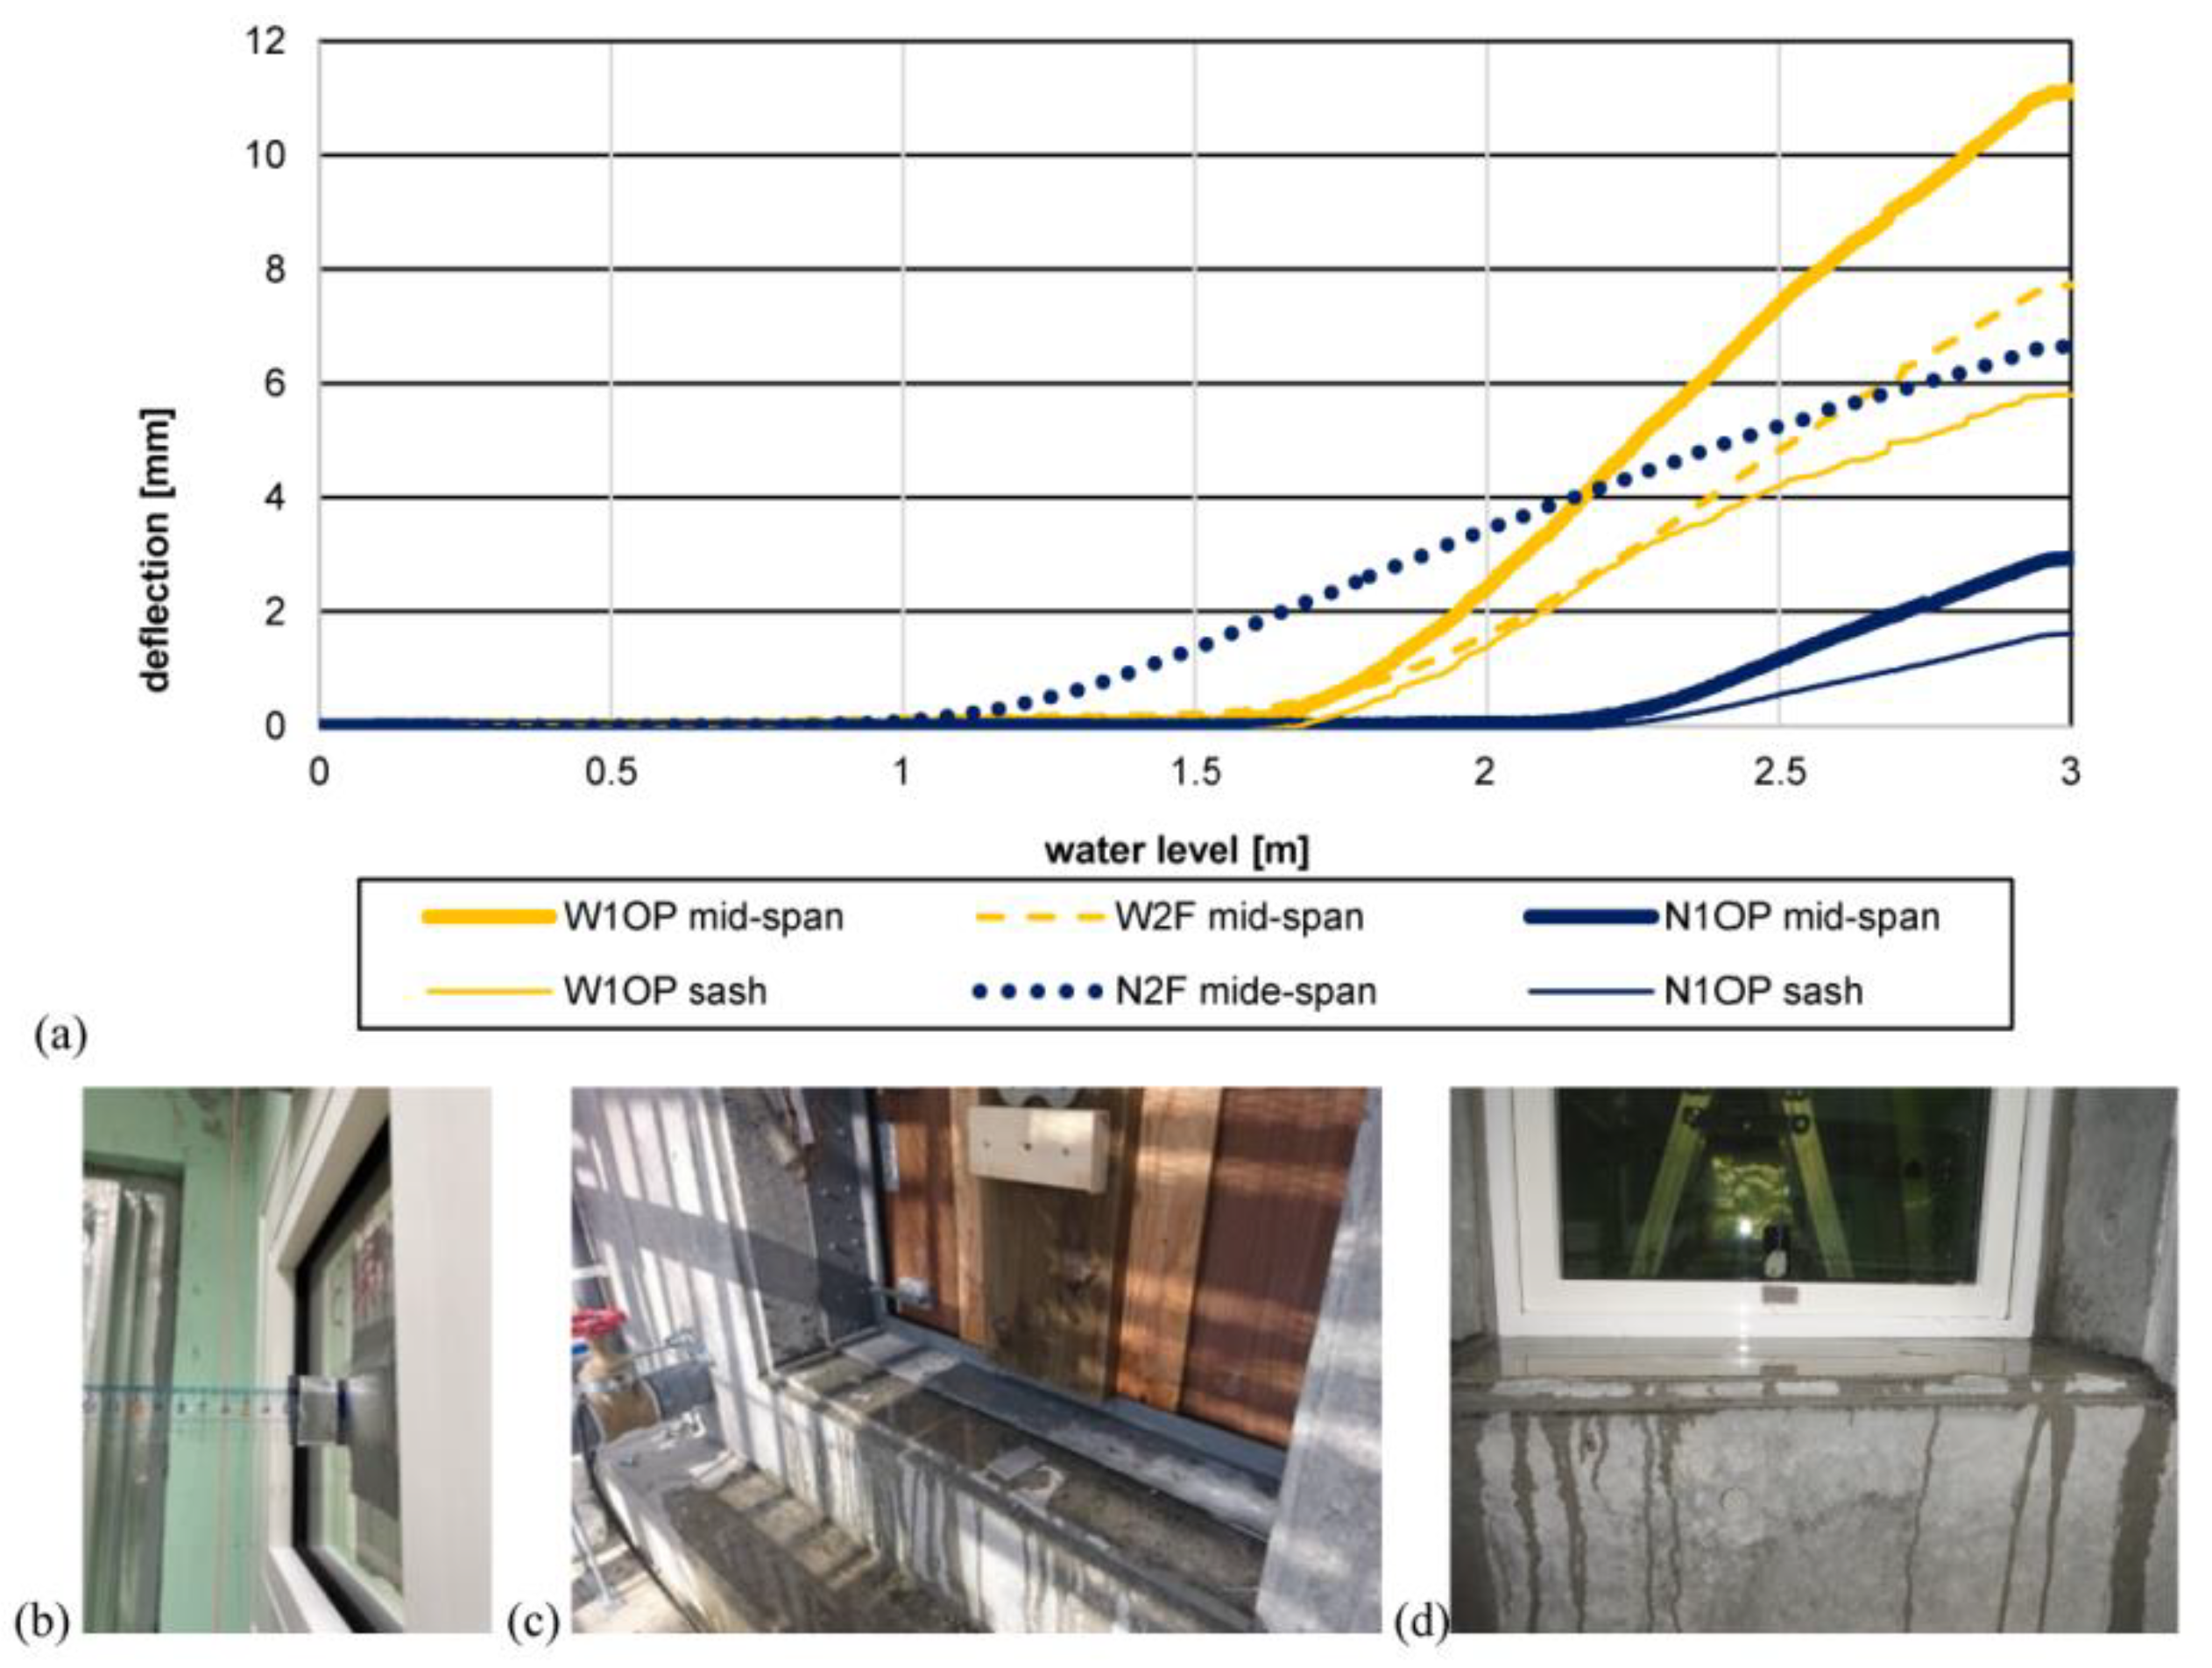
A hydrostatic pressure test was conducted by filling water inside the specimen. As the specimen was located on 0.35 m foundations, the water was filled up to 2.65 m to simulate the hydrostatic pressures of a 3-m water depth. Deflection was measured at the exterior and interior sides of the north and west windows. It was measured at heights equal to 0.24, 0.44 and 0.46 m above the bottoms of the casings of N1OP, N2F and the west windows, respectively. In the measured positions, the maximum deflection was observed according to beam deflection calculations. Displacement transducers were used to measure the deflection of the exterior sides of the windows. Plastic rulers were attached to the interior sides of the windows, using plastic angles (Figure 5b). As for the operable windows, the displacement transducers and plastic rulers were located at the mid-spans of the panes and at the sashes. As for the fixed windows, they were placed at the mid-spans of the panes and at the casings.
Relations between the deflection of the exterior sides of windows and water depths are shown in Figure 5a. The panes and sashes of the operable windows showed noticeable deflection. On the other hand, the casings were deformed little. The maximum deflection at the different measured points of the interior sides of windows is presented in Table 1. As expected, the interior sides showed larger maximum values than the exterior ones due to contact with water.
An endurance test was performed on the same specimen after the hydrostatic pressure test. Water was kept at a 3-m water depth for 24 h. During the test, no failure of the windowpanes was observed. Nonetheless, water leaks were observed around the bottoms of the west windows and north operable window in addition to the bottom of the entrance door (Figure 5c,d).
3.3. Waterproof Measures Applied to the Specimen
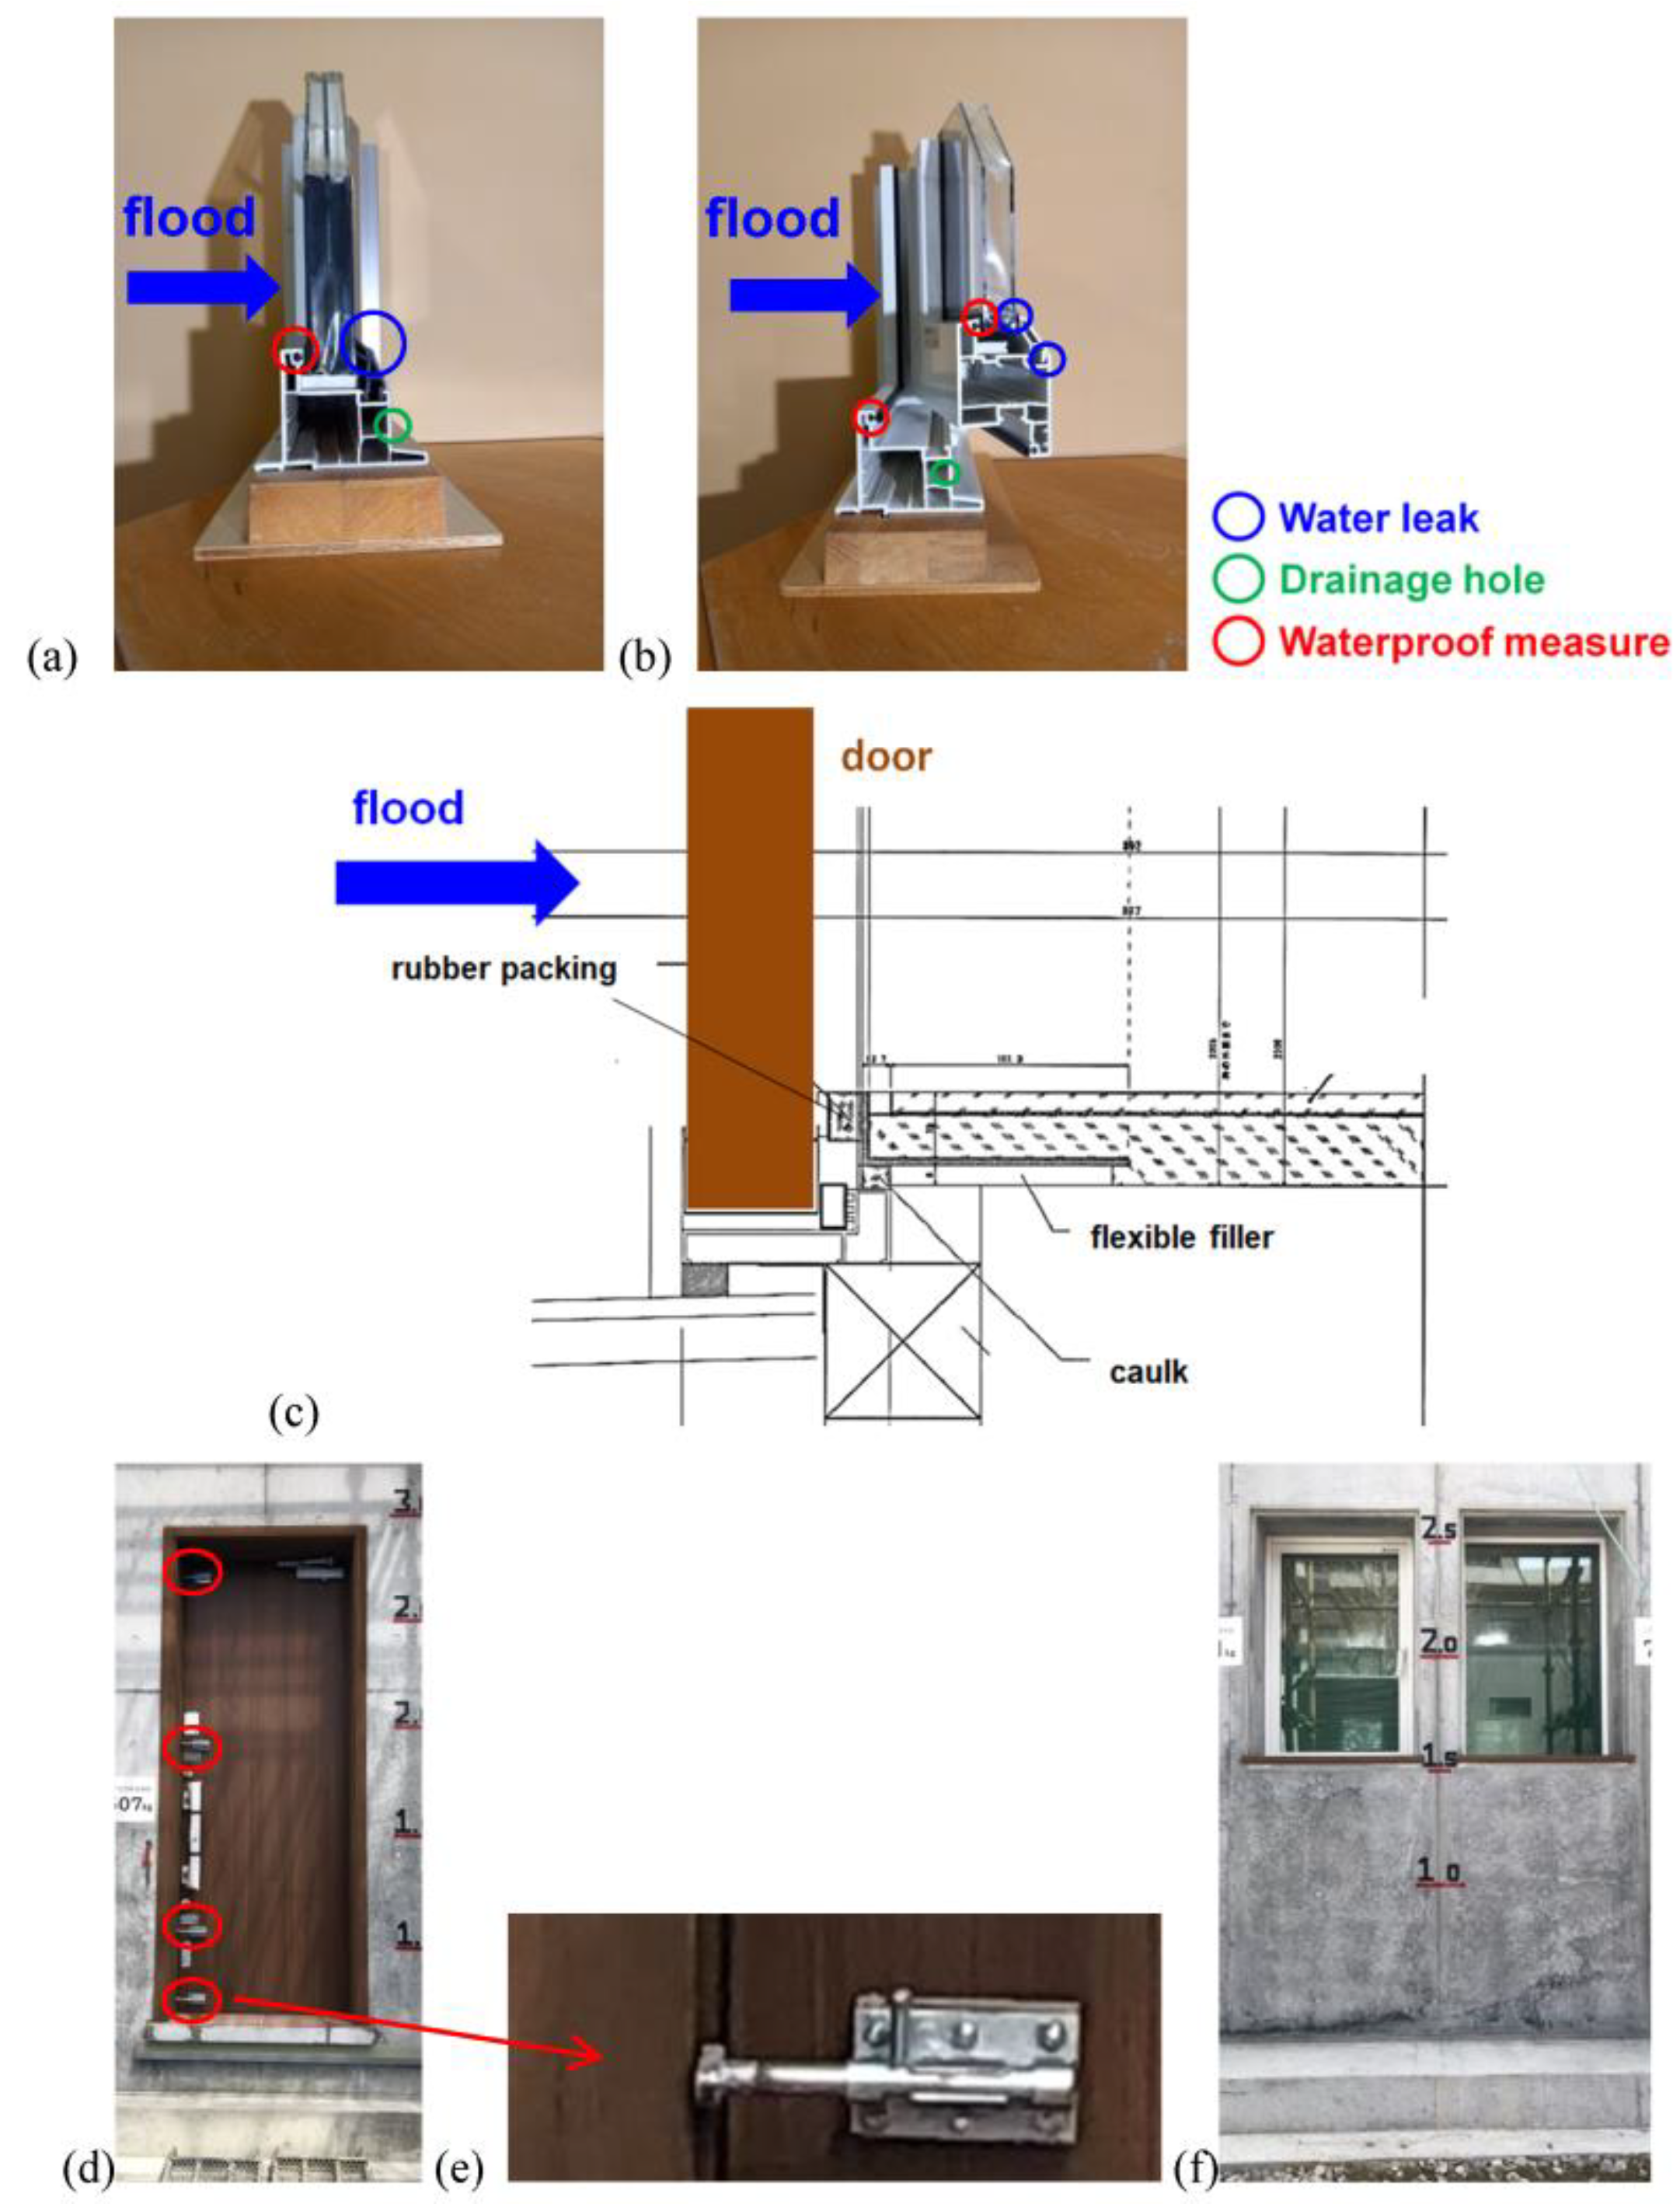
The causes of water leaks around openings were investigated to improve the waterproofness of the specimen. As for the west fixed window, water leaked through rubber packing between a pane and casing (Figure 6a). The operable windows showed water leaks from gaps between a pane and sash and those between a sash and casing (Figure 6b). Water also leaked from the crescent locks of the operable windows once the inside of the casings were filled with water. To prevent these water leaks, caulk was applied to the packings. In addition, the drainage holes of the windows were covered with waterproof tape.
Water leaks around the door occurred due to three causes. First, gaps existed between the door frame and wall. Second, the rubber packing of the door sill was not sufficiently tight. Third, gaps appeared around the head jamb and door handle when the door was significantly deformed by hydrostatic pressures. As for the first water leak, the gaps were filled with caulk. The second was solved by improving waterproofness around the door sill with caulk and flexible filler as shown in Figure 6c. As for the third, the water leak around the head jamb was prevented by tightening rubber packing and applying caulk. The water leak around the door handle was prevented by four metal fastening plates attached to the door along the side of the door handle (red circles in Figure 6d,e). After the above mentioned waterproof measures were adopted, the waterproofing of the windows and of the door was significantly improved (Figure 6d,f).
4. Numerical Simulation
4.1. Description of the Numerical Model
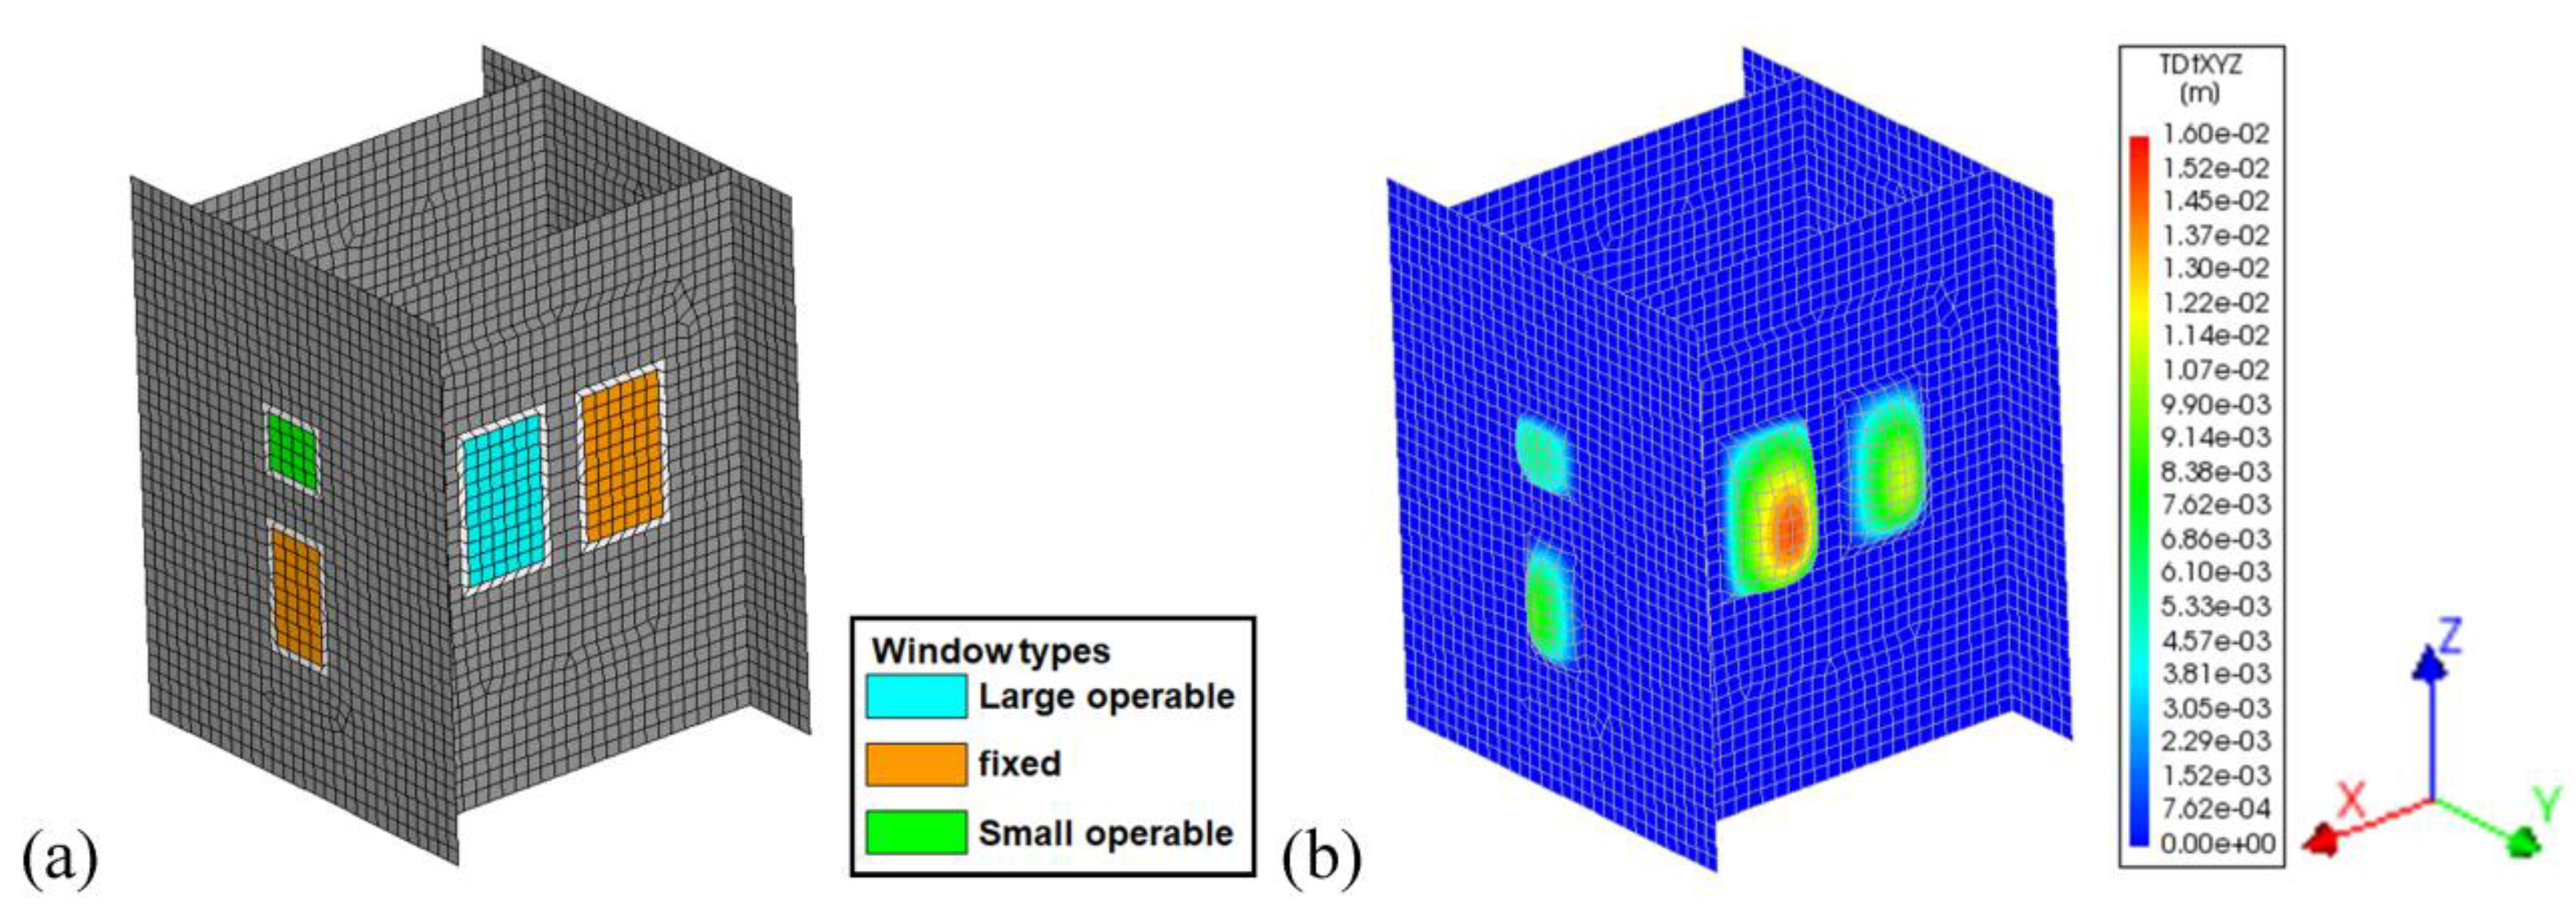
Numerical analysis was performed to simulate the hydrostatic pressure test discussed in Section 3.2 and to examine the behaviour of the prototype building under flowing water. A commercial package, TNO DIANA, was used [54]. The specimen was discretised with 4403 nodes and 4187 four-node quadrilateral shell elements (Figure 7a), considering the recent studies of RC structures [55]. The model was composed of glass blocks, laminated glass, PMMA plates and RC walls. The windows were discretised as laminated glass and PMMA plates. The double-glazed windows were considered to be single-pane ones as the analyses focused on the behaviour of the panes contacting water. Only the PMMA plates were considered for the window frames since it was presumed that the movement of the sashes and casings were governed by the PMMA plates (see, Figure 2f). As for the operable windows, hinged connections were adopted to the boundaries between the plates and walls and to those between the plates and panes, taking into account the state of panes and plates as shown in Figure 2f. The model was fully constrained at the bottoms of the structure. Geometrical and material nonlinearities were considered. Sensitivity analysis was performed to study the influences of the mesh size.
The material parameters are presented in Table 2. For RC and glass blocks, typical properties were considered [56,57,58]. The values of laminated glass were determined, taking into account the material characterisation tests discussed in Section 3.1 and publications on laminated glass [59,60,61,62,63,64]. As for The values of PMMA was determined, considering the material characterisation tests presented in Section 3.1 and recent experimental studies of PMMA [63,64]. As for the door, the modulus of elasticity was selected, considering the used materials as discussed in Section 2.2.
As for failure criteria, a smeared crack model was adopted. Rotating total strain-based crack model was adopted to RC, glass blocks, laminated glass and PMMA. This model considers the orientation of cracks co-rotates with the axes of principal strains [65,66]. In other words, it is based on the coaxial stress-strain approach that evaluates the stress-strain relationships in the principal directions of strains. As for uniaxial behaviour, linear tension softening was adopted to RC. Tensile fracture energy was equal to 100 N/m. Parabolic hardening was considered in compression. Compressive fracture energy was 30,000 N/m, taking into account recent publications [56,57,58]. Brittle behaviour was adopted to glass blocks, laminated glass and PMMA in tension, based on experimental studies [62,63]. Constant hardening was considered for the three materials in compression [64,67]. As for the door, linear elasticity was adopted.
4.2. Simulation of the Hydrostatic Pressure Test
Hydrostatic pressures were applied to the model (Figure 7b). Comparison is made between the numerical analysis and the test presented in Section 3.2 in terms of the deflection of the windows. The deflection of the sides of the panes contacting water was compared. The numerical model and real structure showed good agreement in most of the measured points (Table 3). However, the values of the W2F window were slightly different. The difference would be derived from possible construction defects that were not included in the model. In addition, small gaps may have existed between windows and a wall. At the 3-m water depth, the hydrostatic loads on the N1OP, N2F and west windows were equal to 2.9 kN, 11.0 kN and 7.9 kN in turn.
The capacities of sole windows were examined. The models of the windows were taken from the entire model. Distributed loads were applied uniformly over each window. The windows were simply supported at their edges. The observed maximum deflection of the N1OP, N2F, W1OP and W2F windows was 27.3 mm, 29.4 mm, 17.0 mm and 19.4 mm, in turn. At this state, the corresponding loads were 77.4 kN, 110.6 kN, 15.6 kN and 15.5 kN for N1OP, N2F, W1OP and W2F, respectively. Taking into account the deflection of the sole windows, the pane of W1OP was close to failure (15.4 mm vs. 17.0 mm).
4.3. Resistance of the Prototype Building to HYDRODYNAMIC Pressure
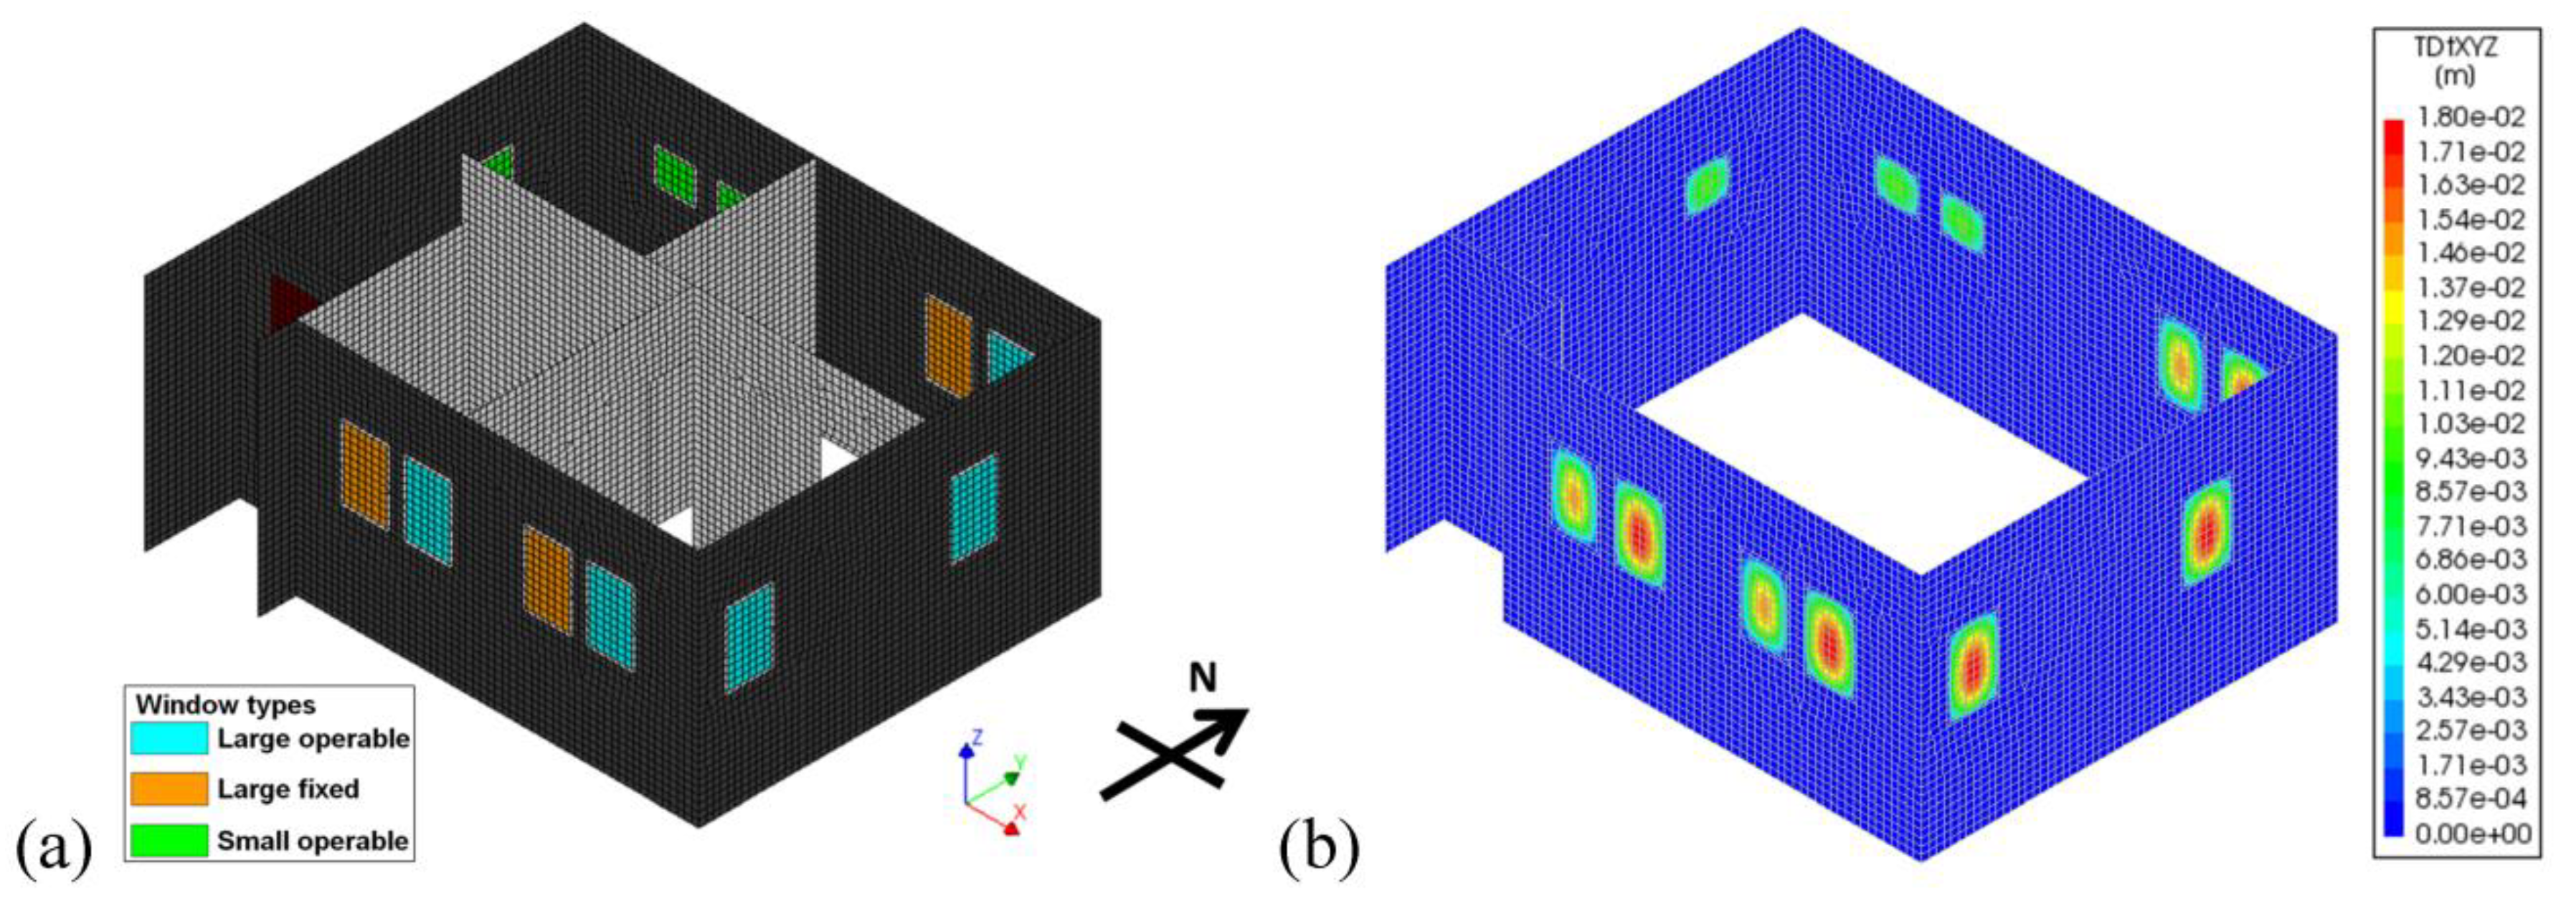
Taking advantage of the results discussed in Section 4.2, the behaviour of the prototype building under hydrodynamic pressures was examined. The prototype building was introduced in Section 2.1. The ground floor of the building was discretised. As shown in Figure 8a, the Y axis was parallel with the NS direction of the prototype building. The model had three types of windows. There were large-operable, large-fixed and small operable ones as discussed in Section 2.1 (see, Figure 1c). The model was composed of 14,209 nodes and 13,319 four-node quadrilateral shell elements (Figure 8a). The model was fully constrained at the bottoms of the structure. The same material parameters and failure criteria as discussed in Section 4.1 were adopted.
Two analyses were performed. As the first analysis, hydrodynamic pressures from nonbreaking waves were applied to the model. They were added to the hydrostatic pressures by increasing the assumed water depth. This approach is considered appropriate in case the flow velocity is lower than 3 m/s [40,68]. The study focused on zones at least 1 km away from rivers as discussed in Section 2.1 and the flow velocity of inundations usually does not exceed 3 m/s in such zones [69,70]. In addition, this value is the expected lower bound as a design flow velocity for 3-m level flows [33]. For these reasons, the flow velocity was considered equal to 3 m/s in this analysis. The equivalent surcharge height, dh was calculated in the following Equation (1).
where:
is the velocity of a fluid flow.
is the gravitational acceleration.
The surcharge height was equal to 0.6 m and therefore the resultant water depth was 3.6 m in the considered analysis. The deflection was 18.1 mm, 15.5 mm and 10.2 mm at the mid-spans of the large operable, large fixed and small windows, respectively. The RC walls showed very little deformation. The maximum deflection was observed in the large operable windows (Figure 8b). At this state, the loads acting on the large and small windows were equal to 15.2 kN and 6.8 kN, respectively. The large operable windows were close to failure at the considered flow velocity, taking into account the allowable deflection of the sole windows discussed in Section 4.2.
As the second analysis, dynamic pressures from nonbreaking waves were applied to the north elevation (see, Figure 8a). The north elevation was selected as it had all three types of the windows: i.e., large operable, large fixed and small operable windows. The purpose of the analysis was to examine the influences of equations on results. The model was subject to the hydrostatic and hydrodynamic pressures. In this analysis, the hydrodynamic pressures were calculated according to Equation (2) [33].
where:
is a horizontal drag load acting on a wall due to hydrodynamic pressures.
is the density of a fluid (=1000 kg/m3 for water).
is a drag coefficient (=1.25 in this analysis).
is a surface area experiencing the drag load.
The surface area was calculated by multiplying the width of the wall normal to the flow by the water depth. The flow velocity was considered equal to 3 m/s like the previous analysis. The resultant hydrodynamic load was 136.6 kN. The load was uniformly distributed over the surface areas. The value was 5.6 kN/m2. It was added to the hydrostatic pressures of the 3-m water depth. The deflection of the large operable, large fixed and small operable windows was 18.5 mm, 16.0 mm and 10.8 mm, in turn. Like the previous analysis, the wall presented very little deformation. The maximum deflection was observed at the mid-spans of the large operable window. The loads acting on the large and small windows were 15.1 kN and 6.7 kN, in turn. Both analyses showed very similar results.
5. Concluding Remarks
This paper discussed the behaviour of a newly developed residential building under hydrostatic and hydrodynamic pressures. A hydrostatic pressure test was performed by filling water inside the specimen. This approach permitted the execution of the test without the need of excessive amount of water. The behaviour of windows and water leaks around openings was paid attention to. Laminated glass showed low flexural modulus, compared to monolithic glass. PMMA plates and synthetic resin frames were placed around the window casings to minimise the deformation of the windows. Water leaks around openings were prevented by applying caulk and tightening rubber packing. Numerical analysis was carried out to evaluate the behaviour of the prototype building under inundations. Two approaches were considered to examine the behaviour of the building under flowing water. One approach added surcharge height to the hydrostatic pressures. The other considered hydrodynamic pressures as uniformly distributed loads. They were added to the hydrostatic pressures. In both approaches, the building could stand the nonbreaking waves of the inundations of a 3 m depth with the flow velocity of 3 m/s.
Although different approaches have been proposed for the estimation of hydraulic pressures, further studies are suggested to accurately characterise forces caused by flowing water. It would permit analysis to examine the behaviour of buildings under high-velocity inundations that cause complex hydraulic actions including breaking and turbulent flows. This paper focused on macro-scale numerical analysis. Micro-scale analysis may be helpful to closely observe the behaviour of windows. However, to perform such analysis, detailed experiments are required including bond behaviour between components.
Author Contributions
Conceptualization, Y.E. and T.Y.; methodology, Y.E. and T.Y.; software, Y.E.; validation, Y.E.; formal analysis, Y.E.; investigation, Y.E. and T.Y.; resources, Y.E. and T.Y.; data curation, Y.E. and T.Y; writing—original draft preparation, Y.E.; writing—review and editing, Y.E.; visualization, Y.E.; supervision, Y.E.; project administration, Y.E. and T.Y.; funding acquisition, Y.E. All authors have read and agreed to the published version of the manuscript.
Funding
Japan Society for the Promotion of Science (Tokyo), grant number: 18KK0124.
Institutional Review Board Statement
Not applicable.
Informed Consent Statement
Not applicable.
Data Availability Statement
Not applicable.
Conflicts of Interest
The authors declare no conflict of interest.
References
- Gu, D. Exposure and Vulnerability to Natural Disasters for World’s Cities. United Nations Department of Economic and Social Affairs, Population Division, Technical Paper. 2019. Available online: https://www.un.org/en/development/desa/population/publications/pdf/technical/TP2019-4.pdf (accessed on 6 May 2021).
- Funari, M.F.; Spadea, S.; Lonetti, P.; Fabbrocino, F.; Luciano, R. Visual programming for structural assessment of out-of-plane mechanisms in historic masonry structures. J. Build. Eng. 2020, 31, 101425. [Google Scholar] [CrossRef]
- D’Ayala, D.F.; Elide, T. Three-dimensional analysis of masonry vaults using limit state analysis with finite friction. Int. J. Archit. Herit. 2011, 5, 140–171. [Google Scholar] [CrossRef] [Green Version]
- Bencardino, F.; Mattia, N.; Salvatore, V. Experimental investigation and numerical analysis of bond behavior in SRG-strengthened masonry prisms using UHTSS and stainless-steel fibers. Fibers 2020, 8, 8. [Google Scholar] [CrossRef] [Green Version]
- Pilon, P.J. Guidelines for Reducing Flood Losses; United Nations International Strategy for Disaster Reduction (UNISDR): Geneva, Switzerland, 2002. [Google Scholar]
- Brody, S.D.; Zahran, S.; Highfield, W.E.; Grover, H.; Vedlitz, A. Identifying the impact of the built environment on flood damage in Texas. Disasters 2008, 32, 1–18. [Google Scholar] [CrossRef]
- Thouret, J.-C.; Antoine, S.; Magill, C.; Ollier, C. Lahars and debris flows: Characteristics and impacts. Earth Sci. Rev. 2020, 201, 103003. [Google Scholar] [CrossRef]
- Bormudoi, A.; Nagai, M. Perception of risk and coping capacity: A study in Jiadhal Basin, India. Int. J. Disaster Risk Reduct. 2017, 21, 376–383. [Google Scholar] [CrossRef]
- D’Ayala, D.; Galasso, C.; Putrino, V.; Fanciullacci, D.; Barucco, P.; Fanciullacci, V.; Bronzino, C.; Zerrudo, E.; Manalo, M.; Fradiquela, C.; et al. Assessment of the multi-hazard vulnerability of priority cultural heritage structures in the Philippines. In Proceedings of the International Conference on Natural Hazards & Infrastructure, Chania, Greece, 28–30 June 2016. [Google Scholar]
- Haque, A.; Jahan, S. Impact of flood disasters in Bangladesh: A multi-sector regional analysis. Int. J. Disaster Risk Reduct. 2015, 13, 266–275. [Google Scholar] [CrossRef]
- Godfrey, A.; Ciurean, R.L.; Van Westen, C.J.; Kingma, N.C.; Glade, T. Assessing vulnerability of buildings to hydro-meteorological hazards using an expert based approach—An application in Nehoiu Valley, Romania. Int. J. Disaster Risk Reduct. 2015, 13, 229–241. [Google Scholar] [CrossRef]
- Seifert, I.; Botzen, W.J.W.; Kreibich, H.; Aerts, J.C.J.H. Influence of flood risk characteristics on flood insurance demand: A comparison between Germany and the Netherlands. Nat. Hazards Earth Syst. Sci. 2013, 13, 1691–1705. [Google Scholar] [CrossRef] [Green Version]
- US Army Corps of Engineers (USACE). Risk-Based Analysis for Flood Damage Reduction Studies; Manual; Lulu Press: Morrisville, NC, USA, 2015; EM 1110-2-1619.
- Elmer, F.; Thieken, A.H.; Pech, I.; Kreibich, H. Influence of flood frequency on residential building losses. Nat. Hazards Earth Syst. Sci. 2010, 10, 2145–2159. [Google Scholar] [CrossRef] [Green Version]
- Hammond, M.; Chen, A.; Djordjević, S.; Butler, D.; Mark, O. Urban flood impact assessment: A state-of-the-art review. Urban. Water J. 2015, 12, 14–29. [Google Scholar] [CrossRef] [Green Version]
- Kelman, I.; Spence, R. An overview of flood actions on buildings. Eng. Geol. 2004, 73, 297–309. [Google Scholar] [CrossRef]
- Cantelmo, C.; Cuomo, G. Hydrodynamic loads on buildings in floods. J. Hydraul. Res. 2021, 59, 61–74. [Google Scholar] [CrossRef]
- Macabuag, J.; Raby, A.; Pomonis, A.; Nistor, I.; Wilkinson, S.; Rossetto, T. Tsunami design procedures for engineered buildings: A critical review. Proc. Inst. Civ. Eng. Civ. Eng. 2018, 171, 166–178. [Google Scholar] [CrossRef] [Green Version]
- American Society of Civil Engineers. Flood Resistant Design and Construction; American Society of Civil Engineers: Reston, VA, USA, 2015. [Google Scholar]
- Chapter 16, building code. In City and County of Honolulu; Honolulu City Council: Hololulu, HI, USA, 2013.
- Yeh, H.H.; Robertson, I.; Preuss, J. Development of Design Guidelines for Structures That Serve as Tsunami Vertical Evacuation Sites; Department of Natural Resources, Division of Geology and Earth Resources: Olympia, WA, USA, 2005. [Google Scholar]
- Uniform Building Code. International Building Code; International Code Council: Itasca, IL, USA, 1997. [Google Scholar]
- Bandara, K.; Dias, W. Tsunami wave loading on buildings: A simplified approach. J. Natl. Sci. Found. Sri Lanka 2012, 40, 211. [Google Scholar] [CrossRef]
- Postacchini, M.; Zitti, G.; Giordano, E.; Clementi, F.; Darvini, G.; Lenci, S. Flood impact on masonry buildings: The effect of flow characteristics and incidence angle. J. Fluids Struct. 2019, 88, 48–70. [Google Scholar] [CrossRef]
- Jansen, L.; Korswagen, P.; Bricker, J.; Pasterkamp, S.; de Bruijn, K.; Jonkman, S. Experimental determination of pressure coefficients for flood loading of walls of Dutch terraced houses. Eng. Struct. 2020, 216, 110647. [Google Scholar] [CrossRef]
- Foster, A.S.; Rossetto, T.; Allsop, W. An experimentally validated approach for evaluating tsunami inundation forces on rec-tangular buildings. Coast. Eng. 2017, 128, 44–57. [Google Scholar] [CrossRef]
- Sogut, E.; Sogut, D.V.; Farhadzadeh, A. Effects of building arrangement on flow and pressure fields generated by a solitary wave interacting with developed coasts. Adv. Water Resour. 2019, 134, 103450. [Google Scholar] [CrossRef]
- Chuang, W.-L.; Chang, K.-A.; Kaihatu, J.; Cienfuegos, R.; Mokrani, C. Experimental study of force, pressure, and fluid velocity on a simplified coastal building under tsunami bore impact. Nat. Hazards 2020, 103, 1093–1120. [Google Scholar] [CrossRef]
- Xiao, S.; Li, H. Impact of Flood on a Simple Masonry Building. J. Perform. Constr. Facil. 2013, 27, 550–563. [Google Scholar] [CrossRef]
- Thusyanthan, N.I.; Madabhushi, S.P.G. Tsunami wave loading on coastal houses: A model approach. Proc. Inst. Civ. Eng. Civ. Eng. 2008, 161, 77–86. [Google Scholar] [CrossRef] [Green Version]
- Dias, W.P.; Mallikarachchi, H.M. Tsunami-Planning and design for disaster mitigation. Struct. Eng. 2006, 84, 25. [Google Scholar]
- USACE. Coastal Engineering Technical Note. Coast. Eng. 1990, 12, 91. [Google Scholar]
- Federal Emergency Management Agency. Coastal Construction Manual: Principles and Practices of Planning, Siting, De-signing, Constructing and Maintaining Residential Buildings in Coastal Areas; Diane Publishing: Darby, PA, USA, 2011.
- Becker, A.B.; Johnstone, W.M.; Lence, B.J. Wood Frame Building Response to Rapid-Onset Flooding. Nat. Hazards Rev. 2011, 12, 85–95. [Google Scholar] [CrossRef]
- Milanesi, L.; Pilotti, M.; Belleri, A.; Marini, A.; Fuchs, S. Vulnerability to Flash Floods: A Simplified Structural Model for Masonry Buildings. Water Resour. Res. 2018, 54, 7177–7197. [Google Scholar] [CrossRef]
- Gao, L.; Zhang, L.; Chen, H. Two-dimensional simulation of debris flow impact pressures on buildings. Eng. Geol. 2017, 226, 236–244. [Google Scholar] [CrossRef]
- Mead, S.R.; Magill, C.; Lemiale, V.; Thouret, J.C.; Prakash, M. Examining the impact of lahars on buildings using numerical mod-elling. Nat. Hazards Earth Syst. Sci. 2017, 17, 703–719. [Google Scholar] [CrossRef] [Green Version]
- Cui, J.; Hao, H.; Shi, Y. Study of concrete damage mechanism under hydrostatic pressure by numerical simulations. Constr. Build. Mater. 2018, 160, 440–449. [Google Scholar] [CrossRef] [Green Version]
- USACE. Flood Proofing Tests: Tests of Materials and Systems for Flood Proofing Structures; US Army Coastal Engineering Research Center: Vicksburg, MI, USA, 1988.
- USACE. Shore Protection Manual; US Army Coastal Engineering Research Center: Vicksburg, MI, USA, 1984; Volume 1.
- Tuns, I.; Tamas, F.L.; Mantulescu, M. Waterproofing solution of an existing basement against water under hydrostatic pressure. Case study. Bull. Transilv. Univ. Braşov. 2017, 10, 211–218. [Google Scholar]
- Mydin, M.A.; Nawi, M.N.; Munaaim, M.A. Assessment of waterproofing failures in concrete buildings and structures. MCRJ Spec. Issue 2017, 2, 166–179. [Google Scholar]
- Cho, B.H.; Nam, B.H.; Seo, S.; Kim, J.; An, J.; Youn, H. Waterproofing performance of waterstop with adhesive bonding used at joints of underground concrete structures. Constr. Build. Mater. 2019, 221, 491–500. [Google Scholar] [CrossRef]
- Geospatial Information Authority of Japan (GIAJ). Geospatial Information Authority of Japan. Available online: https://www.gsi.go.jp/ENGLISH/ (accessed on 28 March 2021).
- Koshihara, M. Exploration of the possibilities of mixed timber/RC structures. Archit. Technol. 2017, 11, 76–79. [Google Scholar]
- Cheung, K.C.K. Multi-Storey Timber and Mixed Timber–RC/Steel Construction in USA. Struct. Eng. Int. 2008, 18, 122–125. [Google Scholar] [CrossRef]
- Gallo, P.Q.; Carradine, D.M.; Bazaez, R. State of the art and practice of seismic-resistant hybrid timber structures. Holz Als Roh- Und Werkst. 2021, 79, 5–28. [Google Scholar] [CrossRef]
- Nagano City Council. Nagano City Map Information. Available online: https://www2.wagmap.jp/nagano/Portal (accessed on 28 March 2021).
- Japanese Ministry of Land, Infrastructure, Transport and Tourism. Available online: https://www.mlit.go.jp/en/ (accessed on 28 March 2021).
- Steel Bars for Concrete Reinforcement; Japanese Industrial standard (JIS) JIS G 3112; Japanese Standard Association: Tokyo, Japan, 2010.
- Fine ceramics (advanced ceramics, advanced technical ceramics)—Test Method for Flexural Strength of Mon-Olithic Ceramics at Room Temperature; International Organization for Standardization (ISO) ISO 14704; International Organization for Standardization: Genève, Switzerland, 2008.
- Testing Method for Flexural Strength (Modulus of Rupture) of Fine Ceramics at Room Temperature; JIS. JIS R 1601; Japanese Standard Association: Tokyo, Japan, 1994.
- Shimadzu Corporation. Autograph AGS-X Series. 2015. Available online: https://www.ssi.shimadzu.com/sites/ssi.shimadzu.com/files/Products/literature/testing/C224-E057B.pdf (accessed on 6 May 2021).
- Ferreira, D.; Manie, J. DIANA Documentation Release 10; DIANA FEA: Delft, The Netherlands, 2019. [Google Scholar]
- Zucca, M.; Valente, M. On the limitations of decoupled approach for the seismic behaviour evaluation of shallow multi-propped underground structures embedded in granular soils. Eng. Struct. 2020, 211, 110497. [Google Scholar] [CrossRef]
- Dashti, F.; Dhakal, R.P.; Pampanin, S. Numerical Modeling of Rectangular Reinforced Concrete Structural Walls. J. Struct. Eng. 2017, 143, 04017031. [Google Scholar] [CrossRef]
- Behnam, H.; Kuang, J.; Samali, B. Parametric finite element analysis of RC wide beam-column connections. Comput. Struct. 2018, 205, 28–44. [Google Scholar] [CrossRef]
- Howard, S. Materials Data Book, 2003 ed.; Cambridge University: Cambridge, UK, 2003. [Google Scholar]
- Rodichev, Y.; Veer, F.; Strizhalo, V.; Soroka, E.; Shabetia, A. Structural Strength of Laminated Glass. In Challenging Glass 6; TU Delft: Delft, The Netherlands, 2018; Volume 6, pp. 453–462. [Google Scholar]
- Akter, S.T.; Khani, M. Characterisation of Laminated Glass for Structural Applications. Master’s Thesis, Linnaeus University, Växjö, Sweden, 2013. [Google Scholar]
- Morison, C. The Resistance of Laminated Glass to Blast Pressure Loading and the Coefficients for Single Degree of Freedom Analysis of Laminated Glass; Cranford University: Cranford, UK, 2010. [Google Scholar]
- Ivanov, I.V. Analysis, modelling, and optimization of laminated glasses as plane beam. Int. J. Solids Struct. 2006, 43, 6887–6907. [Google Scholar] [CrossRef] [Green Version]
- Nasraoui, M.; Forquin, P.; Siad, L.; Rusinek, A.; Dossou, E. Mechanical behaviour of PMMA: Influence of temperature and confining pressure. In Proceedings of the DYMAT 2009 9th International Conferences on the Mechanical and Physical Behaviour of Materials under Dynamic Loading, Brussels, Belgium, 7–11 September 2009; EDP Sciences, 2009. Volume 2, pp. 1103–1108. [Google Scholar]
- Zhang, J.; Jin, T.; Wang, Z.; Zhao, L. Experimental investigation on yield behavior of PMMA under combined shear–compression loading. Results Phys. 2016, 6, 265–269. [Google Scholar] [CrossRef] [Green Version]
- Vecchio, F.J.; Collins, M.P. The modified compression-field theory for reinforced concrete elements subjected to shear. ACI J. 1986, 83, 219–231. [Google Scholar]
- Selby, R.G.; Vecchio, F.J. A constitutive model for analysis of reinforced concrete solids. Can. J. Civil Eng. 1997, 24, 460–470. [Google Scholar] [CrossRef]
- Aiello, S.; Campione, G.; Minafò, G.; Scibilia, N. Compressive behaviour of laminated structural glass members. Eng. Struct. 2011, 33, 3402–3408. [Google Scholar] [CrossRef]
- USACE. Flood-Proofing Regulations; USACE: Washington, DC, USA, 1995.
- Wallingford, H.R. R&D Outputs: Flood Risks to People Phase 2; FD2321/TR2 Guidance Document; Flood Hazard Research Centre; Middlesex University Risk & Policy Analysts Ltd., Department for Environment, Food and Rural Affairs: London, UK, 2006. [Google Scholar]
- Suetsugu, T. Reduction of Water-Related Hazards by Reviewing Case Studies; Kajima Institute Publishing: Tokyo, Japan, 2016. [Google Scholar]
Figure 1.
Development of the prototype residential building (a) overview of the considered area [48], (b) partial submersion of residential buildings during the flood of 2019 [49], (c) ground floor plan of the prototype building (unit: mm) (d) south elevation and (e) perspective building during a flood.

Figure 2.
Tested specimen (unit: mm): (a) the specimen, (b) plan, (c) south elevation, (d) west elevation, (e) operable window in the west elevation, (f) its cross section, (g) north elevation, (h) east elevation and (i) AA’ cross section.
Figure 2.
Tested specimen (unit: mm): (a) the specimen, (b) plan, (c) south elevation, (d) west elevation, (e) operable window in the west elevation, (f) its cross section, (g) north elevation, (h) east elevation and (i) AA’ cross section.

Figure 3.
Three point bending test of PMMA: (a) performed test and (b) stress-strain relations.

Figure 4.
Three-point bending test of laminated glass: (a) performed test and (b) stress-strain relations.
Figure 4.
Three-point bending test of laminated glass: (a) performed test and (b) stress-strain relations.

Figure 5.
Hydrostatic pressure test: (a) relations between water depths and deflection of the exterior pane of the windows at different points, (b) ruler used for the measurement, water leak from the entrance door (c) and from the west operable window (d).
Figure 5.
Hydrostatic pressure test: (a) relations between water depths and deflection of the exterior pane of the windows at different points, (b) ruler used for the measurement, water leak from the entrance door (c) and from the west operable window (d).

Figure 6.
Waterproof measures: (a) fixed window, (b) operable window, (c) door sill, state after applying the waterproof measures (d,e) door and (f) west windows.
Figure 6.
Waterproof measures: (a) fixed window, (b) operable window, (c) door sill, state after applying the waterproof measures (d,e) door and (f) west windows.

Figure 7.
Hydrostatic analysis of the specimen: (a) numerical model and (b) deformation distribution contours at the 3-m water depth.
Figure 7.
Hydrostatic analysis of the specimen: (a) numerical model and (b) deformation distribution contours at the 3-m water depth.

Figure 8.
Hydrodynamic analysis of the prototype building: (a) numerical model and (b) deformation distribution contours at the 3-m water depth.
Figure 8.
Hydrodynamic analysis of the prototype building: (a) numerical model and (b) deformation distribution contours at the 3-m water depth.


Table 1.
Maximum deflection of the interior pane of the glazed windows.
| (mm) | W1OP | W2F | N1OP | N2F |
|---|---|---|---|---|
| sash | 8.4 | - | 3.1 | - |
| pane | 16 | 10 | 6.4 | 10 |
Table 2.
Adopted material properties.
| RC | Glass Blocks | Laminated Glass | PMMA | Door | |
|---|---|---|---|---|---|
| Modulus of elasticity (GPa) | 22 | 50 | 4 | 2.5 | 50 |
| Compressive strength (MPa) | 21 | 1000 | 1000 | 100 | - |
| Tensile strength (MPa) | 1.5 | 50 | 15 | 100 | - |
| Density (kg/m3) | 2400 | 2500 | 2500 | 1200 | 1600 |
| Poisson ratio (-) | 0.2 | 0.22 | 0.22 | 0.37 | 0.25 |
Table 3.
Comparison of deflection between the numerical model and real structure.
| (mm) | W1OP | W2F | N1OP | N2F |
|---|---|---|---|---|
| experiment | 16 | 10 | 6.4 | 10 |
| numerical | 15.4 | 9.3 | 5.8 | 11.8 |
Publisher’s Note: MDPI stays neutral with regard to jurisdictional claims in published maps and institutional affiliations. |
© 2021 by the authors. Licensee MDPI, Basel, Switzerland. This article is an open access article distributed under the terms and conditions of the Creative Commons Attribution (CC BY) license (https://creativecommons.org/licenses/by/4.0/).
Share and Cite
MDPI and ACS Style
Endo, Y.; Yasue, T. Safety Evaluation of a RC Structure with Multiple Openings under High Water Depth Inundations. Appl. Sci. 2021, 11, 4297. https://doi.org/10.3390/app11094297
AMA Style
Endo Y, Yasue T. Safety Evaluation of a RC Structure with Multiple Openings under High Water Depth Inundations. Applied Sciences. 2021; 11(9):4297. https://doi.org/10.3390/app11094297
Chicago/Turabian StyleEndo, Yohei, and Takaharu Yasue. 2021. "Safety Evaluation of a RC Structure with Multiple Openings under High Water Depth Inundations" Applied Sciences 11, no. 9: 4297. https://doi.org/10.3390/app11094297
Note that from the first issue of 2016, this journal uses article numbers instead of page numbers. See further details here.