
Mining Textual and Imagery Instagram Data during the COVID-19 Pandemic
by
 , ,
, ,
Dimitrios Amanatidis
1 ,
,
Ifigeneia Mylona
2,*,
Irene (Eirini) Kamenidou
2,
Spyridon Mamalis
2 and
Aikaterini Stavrianea
3 1
Faculty of Sciences and Technology Hellenic Open University, 26335 Patras, Greece
2
Department of Management Science and Technology, International Hellenic University, 65404 Kavala, Greece
3
Department of Communication and Media Studies, National and Kapodistrian University of Athens, 10559 Athens, Greece
*
Author to whom correspondence should be addressed.
Appl. Sci. 2021, 11(9), 4281; https://doi.org/10.3390/app11094281
Submission received: 5 April 2021
/
Revised: 4 May 2021
/
Accepted: 6 May 2021
/
Published: 9 May 2021
(This article belongs to the Special Issue New Trends in Social Computing and Its Applications)
Abstract
:Instagram is perhaps the most rapidly gaining in popularity of photo and video sharing social networking applications. It has been widely adopted by both end-users and organizations, posting their personal experiences or expressing their opinion during significant events and periods of crises, such as the ongoing COVID-19 pandemic and the search for effective vaccine treatment. We identify the three major companies involved in vaccine research and extract their Instagram posts, after vaccination has started, as well as users’ reception using respective hashtags, constructing the datasets. Statistical differences regarding the companies are initially presented, on textual, as well as visual features, i.e., image classification by transfer learning. Appropriate preprocessing of English language posts and content analysis is subsequently performed, by automatically annotating the posts as one of four intent classes, thus facilitating the training of nine classifiers for a potential application capable of predicting user’s intent. By designing and carrying out a controlled experiment we validate that the resulted algorithms’ accuracy ranking is significant, identifying the two best performing algorithms; this is further improved by ensemble techniques. Finally, polarity analysis on users’ posts, leveraging a convolutional neural network, reveals a rather neutral to negative sentiment, with highly polarized user posts’ distributions.
1. Introduction
Social media has radically changed the way that society consumes and produces information today [1]. Organizations are presented with significant opportunities, as social media contributes to decreasing costs, improving brand awareness, and increasing sales [2]. Social media has introduced platforms such as Facebook, Instagram, and Twitter [3], thus greatly enriching businesses’ means of reaching out to their consumers [4]. The most popular social networking services in the USA are Snapchat, Instagram, and Facebook, with a high degree of acceptance, particularly in the case of younger users [5]. Among the different features that social media offer, interactivity, connectivity, and sharing are identified as the most important ones in [6]. Currently, the number of social media users around the world exceeds two billion. Table 1, redrawn from [7], lists the most popular social media platforms and their associated registered users.
1.1. Instagram
Instagram is described in [8] as a highly accepted and world-wide image-based social media application and as a trendy tool enabling rapid image and comment sharing across a user’s media channels; at the same time, it invites likes or dislikes by interested followers. It is a social network rapidly gaining popularity [9], also highlighted as a social photography ‘app’ designed to run on a smartphone [10].
Selfies are associated with Instagram as people take selfie photos by using the camera of their smartphone [11] and they can then easily upload them. Instagram is a new form of social media that offers users the opportunity to communicate their experiences by sharing photos and videos [12,13,14,15] and it has been recognized as ‘highly visual social media’ [16]. Photos are very powerful means of conveying emotions, sharing feelings and thoughts, or simply visualizing a random incident [17]. Photos are often uploaded with hashtags. Instagram functions very much like Twitter as it uses the terms following and follower and users can add comments related to the photos uploaded [18]. When adding a caption to an image, users very frequently make use of the ‘@’ symbol, so that other users are mentioned [19].
Instagram users can also add filters to videos and pictures and distribute them to other media [9,19]. Brands have easy access to people and share their exclusive point of view, and companies can use Instagram to sell ideas [20]. It encourages e-WOM (online word of mouth) as it is solely based on the concept of sharing orally and allows users to interact [21]. Young people use Instagram to create visually sophisticated feeds by editing their photos [22]. Brands’ relationships with consumers can be effectively enhanced with Instagram advertisements [23].
1.2. COVID-19 and Social Media
The Severe Acute Respiratory Syndrome Coronavirus 2 (SARS-CoV-2) pandemic has caused a great change in the world, due to its extensive and fast spread in November 2019 [24]. The SARS-CoV-2 virus represents a huge health crisis of global proportions [25,26]. The coronavirus disease 2019 (COVID-19) is a new disease that has affected the global community; it resulted in 1,037,430 deaths as of 5 October 2020 [27], while by 6 February 2021, this number reached 2,294,534. Various symptoms characterize the disease, with their appearance ranging from 2 to 14 days after virus exposure [28]. According to World Health Organization (WHO), the most common COVID-19 symptoms are mild or higher fever, persisting dry cough, and sense of tiredness. Other, not so common symptoms include aches and pains, nasal congestion, headache, conjunctivitis, sore throat, diarrhea, and loss of taste or smell. As stated in [29], ‘the disease affects the respiratory tract and disease severity can range from very mild rhinorrhea, to severe acute respiratory distress syndrome’. The contagion of the disease COVID-19 is mainly conducted in places of human congregation, e.g., sports venues, bars, restaurants, beaches, and airports [25]. Masks, physical distancing, hand hygiene, and adequate ventilation are the main measures [30] that all governments have taken in order to prevent the spreading of the disease.
Dealing with a situation of the extent of a pandemic like this, has been extremely difficult for all countries. The COVID-19 pandemic is not only a health crisis, it has generated unprecedented and disturbing socio-economic and cultural repercussions and asymmetries. To deal with the coronavirus pandemic and its consequences, most countries have created special committees. The dire economic situation in Greece in recent years had already seriously affected and weakened the economic and social sectors in the country, and consequently has had a serious, destructive impact on the public health system; the necessity to strengthen the health system was urgent. With the appearance of the first COVID-19 case, a Government Committee of Infectologists was appointed to deal with the oncoming health crisis in the country. It is a flexible and small-member reporting body whose task is to immediately evaluate any new data and act for the timely management of any emergency or regular need that arises, to ensure the health of the population while trying to minimize the consequences on the economy [31].
In the attempt to bring the current COVID-19 pandemic under control, some measures must be taken, both at effective prevention level and at therapy level [32]. Medicines and vaccines have been intensely tested but emphasis has been placed on the mass production of an effective vaccine to control the current COVID-19 pandemic and stop coronavirus infections [33]. In some cases, collaboration among biotechnology and pharmaceutical companies has been essential to achieve a better and quicker result [34]. The vaccine is a challenge for all stakeholders and this has been the first time that a vaccine has been researched and developed at such a rapid pace [29]. The main companies that undertook the obligation to produce the COVID-19 vaccine were Pfizer/BioNTech, Moderna, AstraZeneca, Novavax, Johnson & Johnson, Sinovac Biotech, CanSino Biologics, Sinopharm, and R-Pharm.
Most governments have adopted and implemented protective measures for public health safety, including physical distancing between persons and the use of masks. As there is a strong relationship between social media and the various government structures [35], very often those measures were communicated to the public through communication channels such as social media platforms, like Twitter, Facebook [36], and virtual communities that promote the discussion on the critical necessity for acting towards the prevention of the COVID-19. During a pandemic, social media ideally facilitates the prompt spread of new and important information, sharing the experiences of diagnostic treatment and follow-up protocol [37], and provides patients with information about COVID-19 [38,39]. Social media can also be exploited by medical experts so that they can quickly contradict false or fake information with accurate advice [40].
1.3. Similar Studies
A similar study [41] to the one presented here was conducted by Kim and Kim in the USA, where the use of Instagram is explored. They case-studied the Centers for Disease Control in South Korea, analyzing the content of their Instagram photos using Microsoft Azure Cognitive Services. Results showed that the largest classes of photos were those of ‘text’ and ‘people’. The authors also found out that images having more human faces or human faces taking up most of the image area did not achieve a high user engagement level with respect to the other images. Additionally, there was a negative association with images with faces expressing positive or neutral emotions and user engagement.
Corey and MacLean in their study [42] about the disease in the United States, found that social media in general, and Instagram in particular, form a potential venue where the public can be educated on human papillomavirus vaccines (HPV) and the vaccination process. Posts’ analysis revealed an association of HPV with cancer (35%) and prevention of HPV (32%). With posts scoring more ‘likes’, it was more probable to mention cancer (p = 0.016), as well as HPV screening (p = 0.041). With posts that did mention the HPV and were anti-vaccine, the probability of mentioning prevention or cancer was rather low (p < 0.001), on both cases.
In a work focusing on the pandemic evolution in Italy, La Gatta et al. [43], employ a combination of Graph Convolutional Neural Networks (GCNs) and Long-Short-Term Memory Networks (LSTMs) to infer the parameters of the epidemiological models SIR and SIRD (Susceptible, Infected, Recovered, Deceased). A dynamic graph is exploited to model the coronavirus spread, with vertices representing places and edges corresponding to the respective spread due to movement of infected individuals. Their derived model correctly predicts the contagion curve and is also capable of projecting the total number of infected individuals under different scenarios of varying contact rate.
Sentiment Analysis (SA) or Opinion Mining, as is occasionally called, is the process where text documents are analyzed to detect specific ‘affects’ or other emotion patterns towards a related product or service. It can be considered as a sub-topic on the intersection of natural language processing (NLP) and text/web mining disciplines [44]. Analyzing sentiment may find significant applications, as in [45], where the authors detect a person’s mood and emotions, as well as its general personality traits and propose a recommender system for music. Personality characteristics are measured using questionnaires and text mining algorithms on social media streams, in the context of the Big Five (OCEAN) Model: openness, conscientiousness, extraversion, agreeableness, and neuroticism.
1.4. Aims of the Study
The main objectives of this study are:
- Identify the key stakeholders in COVID-19 vaccine research and investigate the content of their Instagram posting, as well as how this is perceived by users;
- Detect any similarities/differences between the respective companies posting on both textual and visual features;
- Detect any similarities/differences between the respective users’ perception, by means of hashtags;
- Perform user posts’ intent classification, to explore a potential predictive modelling application for detecting what users desire to post;
- Perform user posts’ sentiment analysis, to quantify their feelings and opinions.
As shown later, the only companies offering vaccine with an Instagram account are Pfizer, Astrazeneca, and Johnson & Johnson. Pfizer Inc. is an American multinational pharmaceutical corporation that was founded 172 years ago in New York City. Pfizer, one of the largest pharmaceutical companies in the world, in cooperation with BioNTech created a vaccine that is based on mRNA technology. This technology introduces part of the genetic material of the SARS-CoV-2 virus in the form of messenger RNA (mRNA) [46].
AstraZeneca is a science-led biopharmaceutical company producing innovative medicines that are used by millions of patients around the world [47]. The AZD1222 vaccine is ‘a replication-deficient simian adenovirus vector, containing the full-length codon-optimized coding sequence of SARS-CoV-2 spike protein along with a tissue plasminogen activator (tPA) leader sequence’ [48].
Johnson & Johnson is multinational company that was founded in 1886 in USA. Their range of products includes medical devices, pharmaceuticals, and consumer goods [49]. The Johnson & Johnson vaccine is ‘based on the virus’s genetic instructions for building the spike protein. Unlike the Pfizer-BioNTech and Moderna vaccines, which store the instructions in single-stranded RNA, the Johnson & Johnson vaccine uses double-stranded DNA’ [50].
2. Materials and Methods
National health agencies, as of January 2021, have approved [51] six vaccines for public use, including:
- Tozinameran from US-German cooperation Pfizer–BioNTech;
- BBIBP-CorV by Chinese Sinopharm;
- CoronaVac by Chinese Sinovac;
- Ad5-nCoV by Chinese CanSino Biologics;
- mRNA-1273 by US Moderna and its partner Johnson and Johnson;
- Gam-COVID-Vac by Russian Gamaleya Research Institute.
The three Chinese vaccines have been approved for use solely within China. The Russian one has been approved in Russia, Belarus, and Argentina and the Moderna–Johnson and Johnson vaccine for North America use (US and Canada). On the other hand, the Pfizer vaccine has had a wider adoption, having secured the approval of EU countries, the UK, US, and Canada, and 14 other countries on different continents. Among others, there is also the Oxford vaccine from British–Swedish Astrazeneca. Authorization and planning strategies differ among individual countries.
Only three of these companies have an Instagram account: Pfizer (pfizerinc), AstraZeneca (Astrazeneca) and Johnson and Johnson (jnj). The dates that these accounts have been created can be retrieved by the ‘About…’ option found on Instagram mobile application only. Moreover, at the time of writing (27 December 2020) their posts/and rate of posting, followers and following are shown on Table 2:
Using Instaloader [52], an open-source tool for downloading Instagram images and videos along with their captions and other metadata, we extracted all of Table 2 posts from the three official company accounts. Each post consists of a .txt file with the post text, one or more images and/or videos (.jpg/.mp4) and a .json file containing additional metadata about the post.
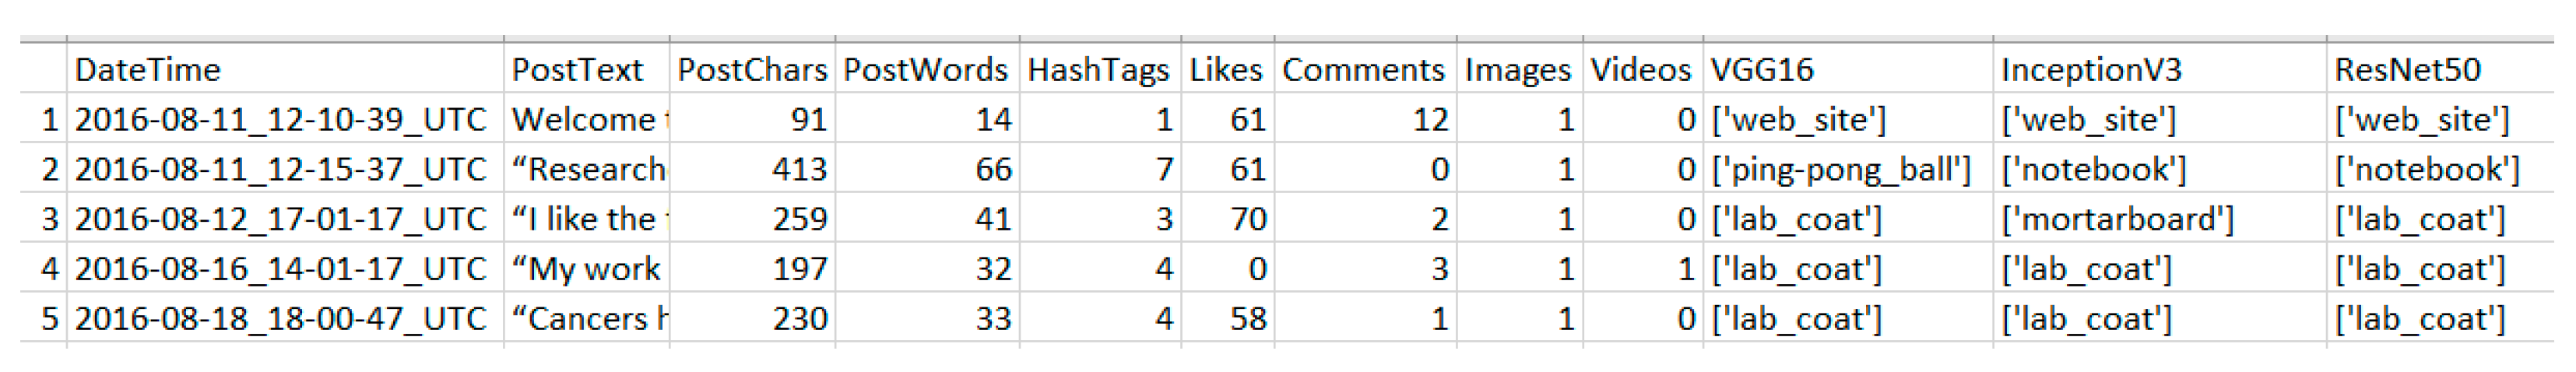
We have developed a generic Python script to iteratively process all posts’ files as these reside in separate account folders and extract various post statistics. Using regular expressions in metadata files’ text, we also find and report comments, likes, and other related information. Comments and likes can be seen as the two most important actions that a user may engage in regarding a post and are the best representatives of active and passive interactions respectively. Post data and metadata information are arranged in a Pandas dataframe with features as columns:
- DateTime, the date and time of post in UTC standard;
- PostText, the text body of the post;
- PostChars, the number of post characters;
- PostWords, the number of post words;
- HashTags, contained in post;
- Likes, the number of likes scored;
- Comments, the number of comments made;
- Images, the number of uploaded images;
- Videos, the number of uploaded videos, if any;
- VGG16, image classification output from pretrained VGG16 model, as a list in case of more images;
- InceptionV3, image classification output from pretrained InceptionV3 model, as a list in case of more images;
- ResNet50, image classification output from pretrained ResNet50 model, as a list in case of more images.
For the last three columns, we employ a process known as Transfer Learning where deep pretrained neural network models can be downloaded and used as a starting point to build models for different than the original classification or regression tasks, based usually on image or text features. There are usually three different approaches on how to utilize the pretrained models:
- Pretrained models used directly as classifiers in an application to classify new images;
- Pretrained models used as feature extractors, with features subsequently be used as input to another model;
- Pretrained models used for better weight initialization of the new integrated model.
The first approach is naturally the simplest and less time-consuming one. Approaches 2 and 3 need new models to be designed and re-training is essential. In our case we opted for the first approach, but chose three different computer vision convolutional neural network models, perhaps the three most popular ones:
- VGG16 [53] from Oxford Visual Geometry Group, where 16 refers to the number of layers, with VGG19 also available. Innovative for introducing consistent and repeating structural blocks
- InceptionV3 [54] where inception modules, blocks of parallel convolutional layers with different sized filters are introduced
- ResNet50 [55] where residual modules are introduced. These employ unweighted, shortcut connections that memorize, e.g., input to later layers in the network architecture
These models are available under Keras and can be downloaded pre-trained on ImageNet. ImageNet is a large visual database, popular as a benchmark for visual object recognition tasks. ImageNet comprises 14 million color images and more than 20,000 object classes. To be used as standalone classifiers in our case some preprocessing has to be performed. The complete flow is as follows:
Load each image and resize it according to model (224 × 224 for VGG16 and ResNet50, 299 × 299 for InceptionV3)
- Convert the color image to a Numpy array
- Extract the three (or four in case of .png) color channels and reshape as a single one-dimensional array
- Depending on model, scale pixel RGB intensities into either [0,1] (torch framework mode), [−1,+1] (tensorflow framework mode) or zero-center BGR intensities unscaled (caffe framework mode). These are internal details of the preprocess_input function, implemented differently for each model
- Use the model to make predictions (probabilities) for all classes
- Choose the highest probability as the most likely predicted result
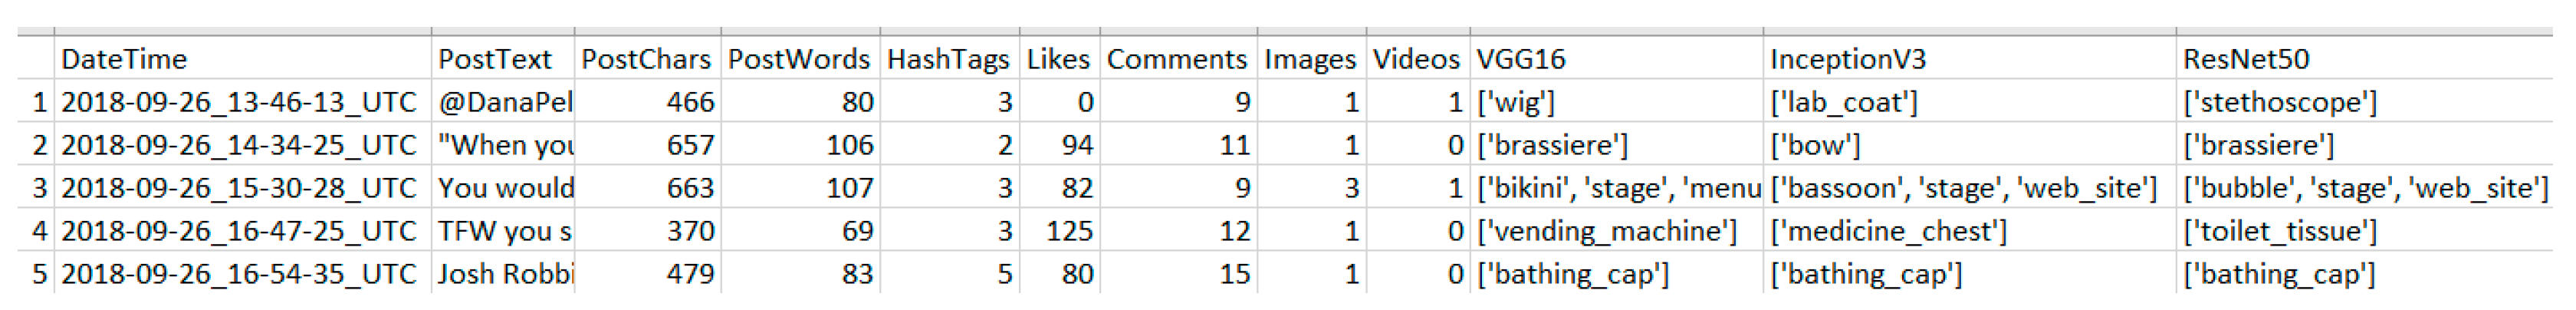
The dataframe is also saved in .csv format for further processing. We have run the script for the three official Instagram accounts and results (top five rows only) are shown in Figure 1, Figure 2 and Figure 3. The three classification models have not been optimized or tuned in any way. The models do not always agree with their prediction and there are quite a few cases where results are far from realistic. However, they correctly recognize people, e.g., in lab coats or scientific instruments.
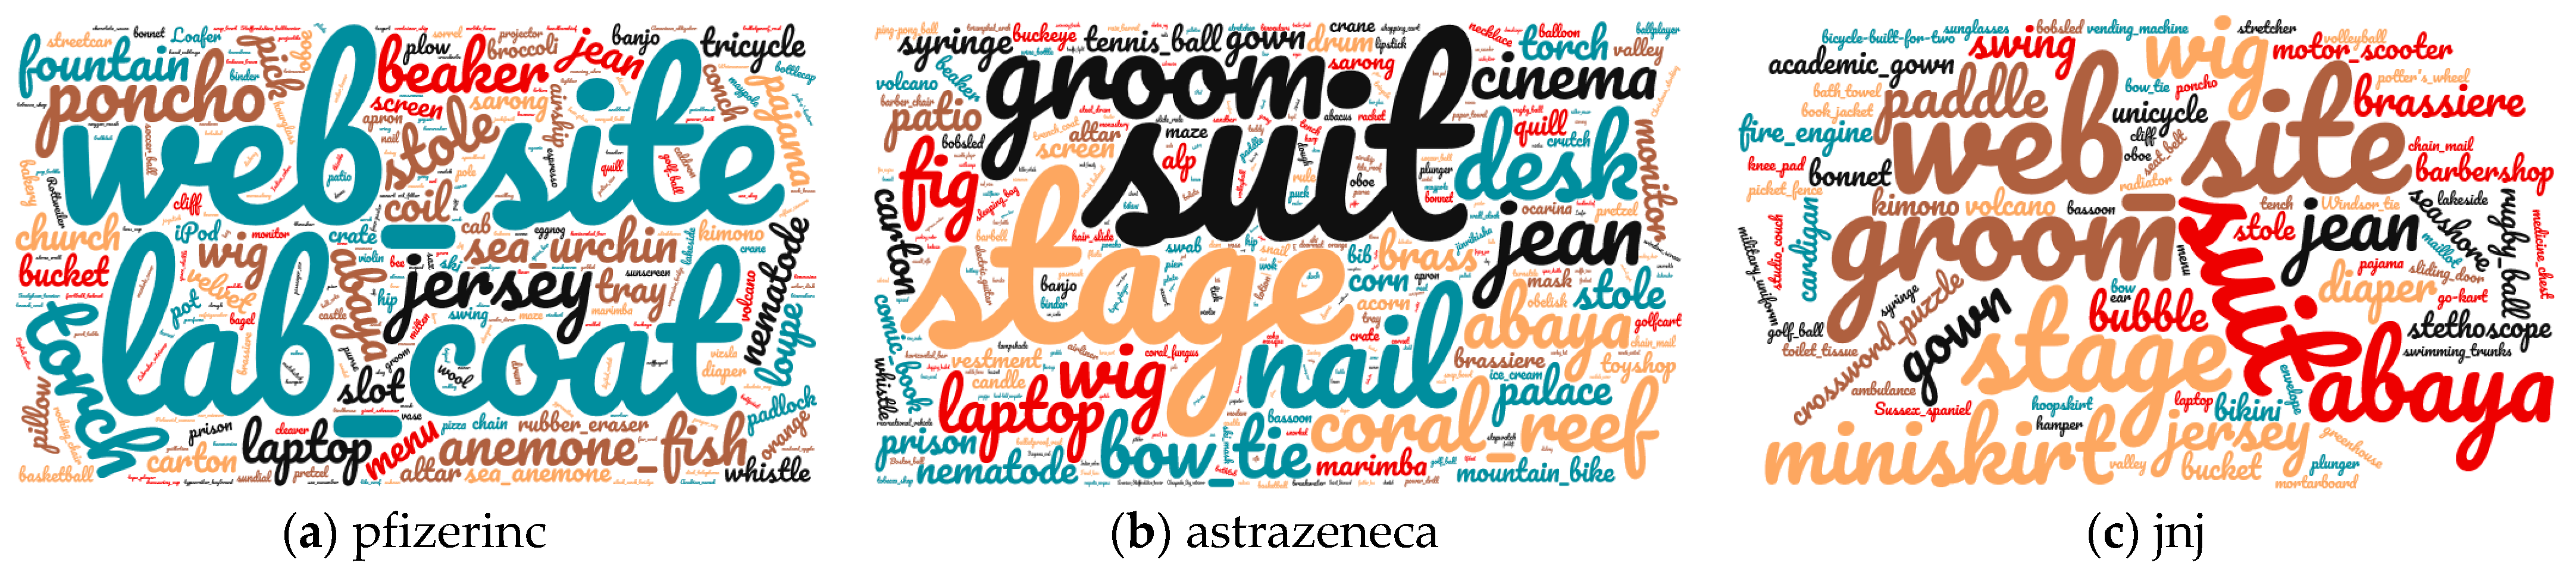
A quick way to gain insight of the images used in the companies’ posts is via word clouds, as seen on Figure 4, generated from all three model predictions for each company. It can be observed that companies post photos of their employees or other persons very frequently, thereby classifying the images as clothing items or another prop. They also upload graphic images which are identified accordingly, e.g., ‘web_site’.
By manual inspection of the results, we can confirm that there are cases where all three models agree in their ImageNet class predictions, cases where two of them agree and others where there is disagreement between them. There are also cases where all three models fail to correctly identify the image objects. As an example, the following Figure 5 depicts images in pfizerinc posts where: (a) there is correct classification by all three models; (b) there is disagreement by one model; and (c) all of the models disagree, while at the same time none of them correctly identifies the image class.
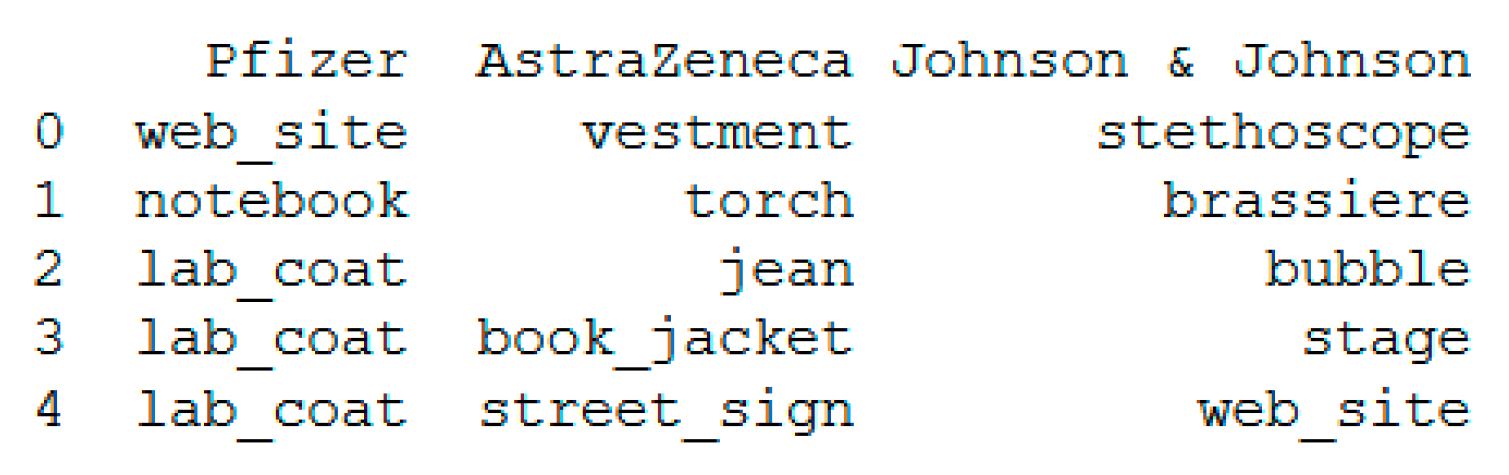
The models’ prediction for the object classes were structured together in a new dataframe to facilitate the quantitative assessment of results. The models’ responses were merged in a single prediction in cases of total agreement (3/3) and partial agreement (2/3) with a simple voting scheme. For the cases of complete disagreement, we have opted to keep the prediction made by the Resnet50 model as it slightly outperforms InceptionV3 in accuracy for the ImageNet classification task (https://paperswithcode.com/sota/image-classification-on-imagenet (accessed on 29 January 2021)). By accounting for multiple-image posts, we end up with a dataframe having 536 predicted image classes for pfizerinc, 1365 predicted image classes for astrazeneca and 64 predicted image classes for jnj. The top five rows for this new dataframe are shown on Figure 6:
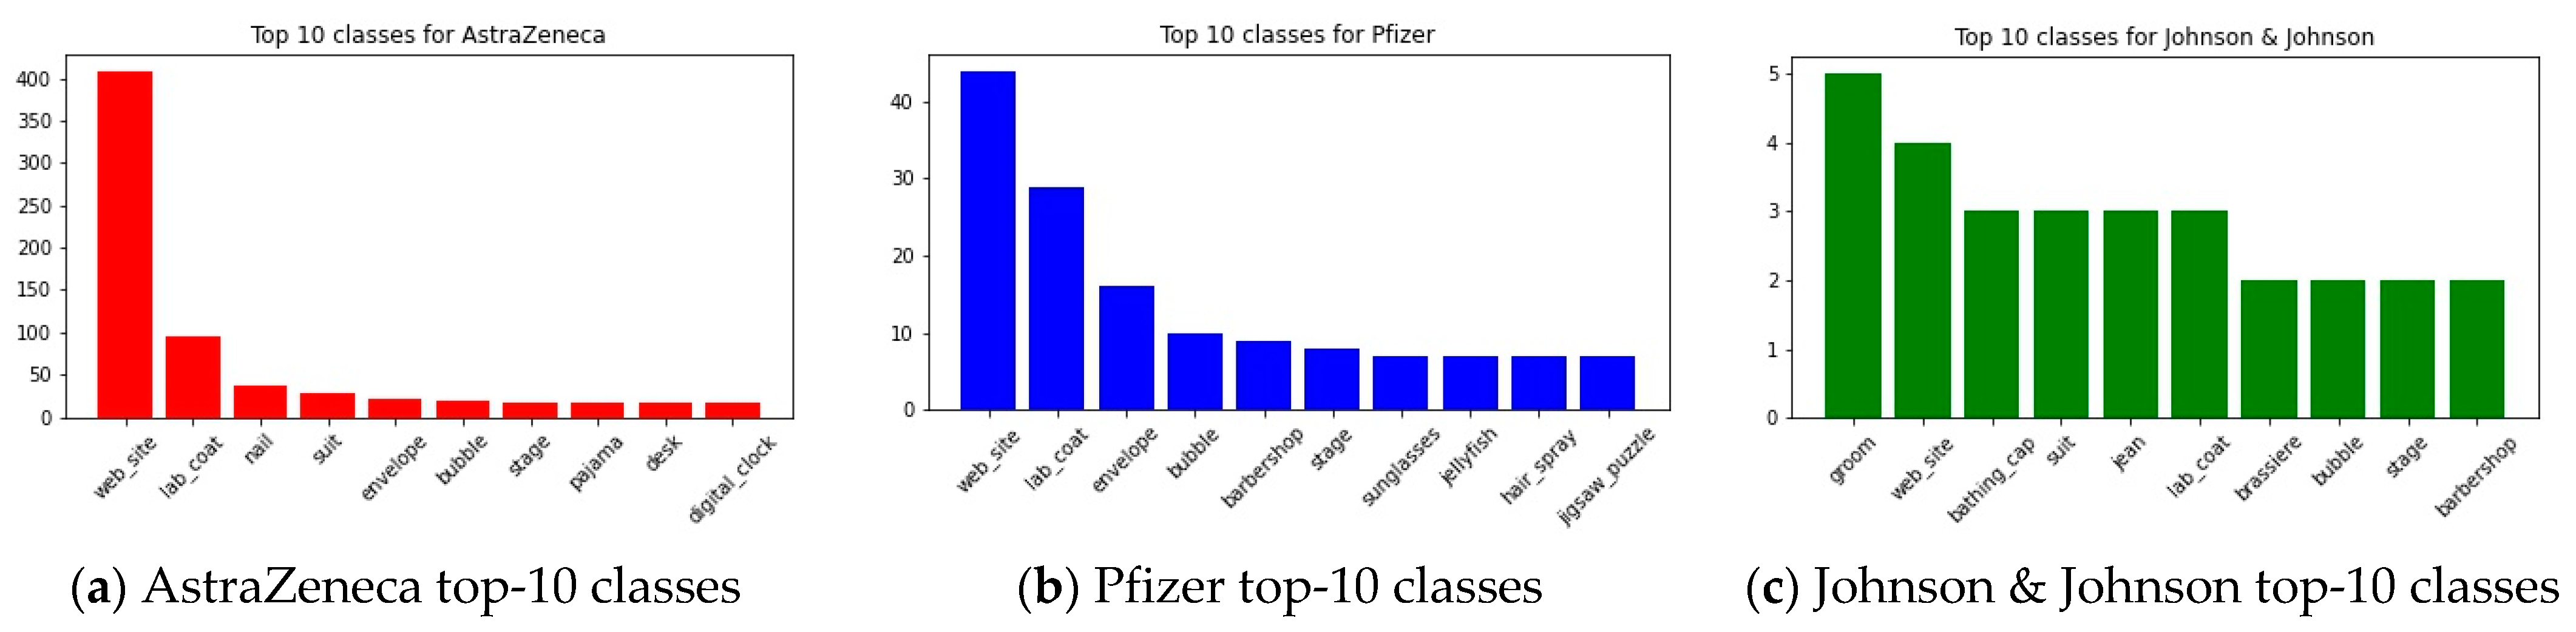
Creating dictionaries for the images’ classes, we can plot the top-10 most common encountered classes for the three companies, as shown on Figure 7. We can infer that AstraZeneca mostly post synthetic images with some text superimposed, thus classified as ‘web_site’, followed by clothing items (‘lab_coat’) which denotes the presence of a human. The same applies to Pfizer, with results however following a flatter distribution. Johnson & Johnson, on the other hand, prefer posting images of humans, although their number of posts is significantly lower.
Rather than just classifying the images in posts (and in fact single objects), it would be interesting to employ automatic caption generation, a process to textually describe the whole image scene. As Instagram is to a large extent image-powered (vs, e.g., Twitter) and images are naturally information-richer, this approach would result in more information being extracted and perhaps facilitate even sentiment analysis to be performed on images, rather than just text. Automatic caption generation is a particularly challenging active research application area field that lies on the intersection of natural language processing and computer vision. This task is significantly harder than image classification as it requires detecting all objects in a scene and how they relate to each other. We have had some initial experimentation with different encoder-decoder architectures, where a Convolutional Neural Network usually encodes the images and a Recurrent Neural Network, e.g., a LSTM (Long Short Term Memory) network, is employed to act as encoder/decoder between the text sequence and its vector representation. However, results were not that satisfactory and as extensive tuning and re-training with a GPU is needed; we opted not to pursue this approach any further.
3. Results
Reverting to textual information, Table 3 displays the mean and standard deviation (in parentheses) values for the associated dataset features for the three companies. Although there is some difference in the number of posts for each company, it can be observed that while Johnson & Johnson is significantly less active in posting than the other two companies, they do post longer messages. Their messages also contain more hashtags, receive more likes and comments, and are richer (or at least as rich) in images and videos.
The official companies’ posts are a means of gaining insight into how their social media strategy expresses their policies, how it informs and promotes their products and services. Some degree of user perception can be measured with likes and comments, as these are the most user-familiar ways of passive and active interaction. The number of likes does carry an inherent positive sign; however, comments do not necessarily do so. Thus, in order to measure users’ perception we subsequently downloaded posts containing the three respective hashtags: #pfizer, #astrazeneca, and #jnj. We opted to download these posts for December 2020 and onwards, as it is the month just before and during the first vaccinations took place. We also opted to download posts only from public accounts. The total number of anytime hashtag-containing posts are (as of 27 December 2020); 99.519 for #pfizer, 26.222 for #astrazeneca, and 118.282 for #jnj. It is interesting that #jnj is significantly adopted by users, although the company Instagram profile is not as active as the other two. This may be justified by the company’s more recognizable brand and wider product range. For December 2020, we ended up with 646 public posts for #pfizer, 738 public posts for #astrazeneca, and 70 public posts for #jnj.
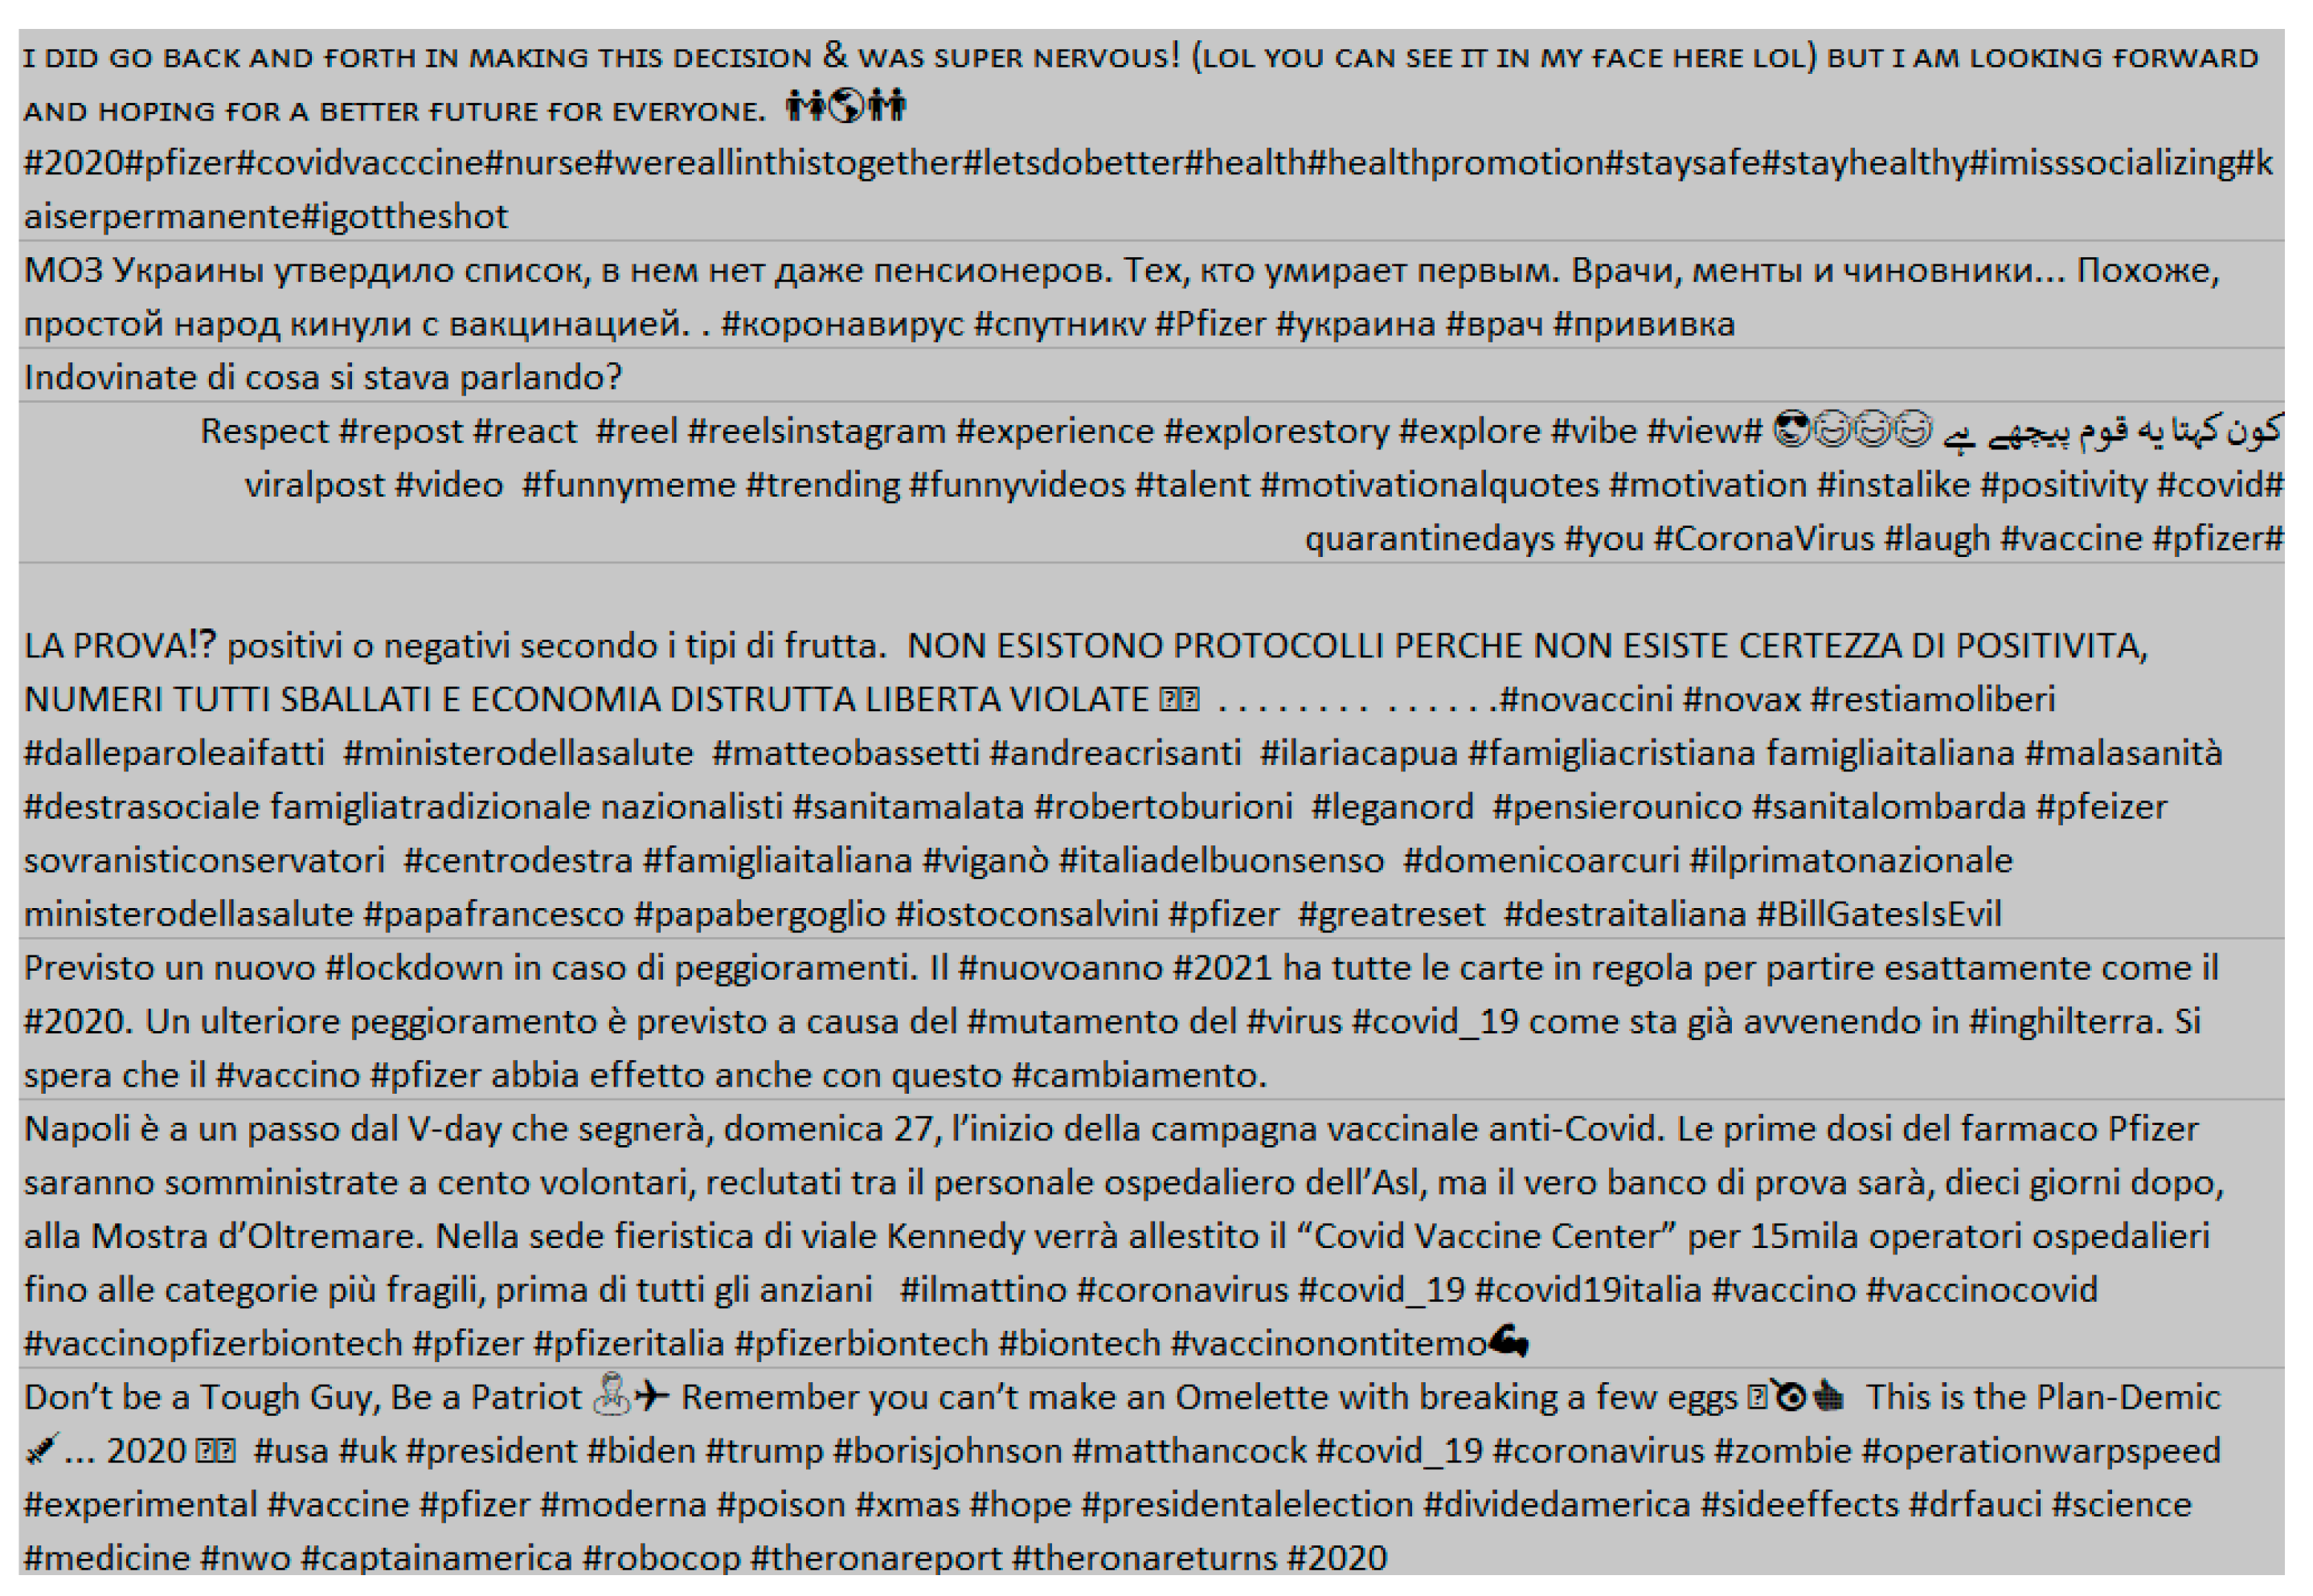
As before, using a similar Python script we have constructed a single dataframe, consisting of all the three hashtag containing user posts text, i.e., 1454 rows. The reason for doing so is partially due to #jnj being underrepresented and to the fact that we would like to increase our sample size for training purposes, as discussed later. Having a first look at the user posts we observe that there are different post languages and that the use of emojis is quite frequent, as seen in Figure 8, so although emojis could be utilized, some preprocessing is deemed essential:
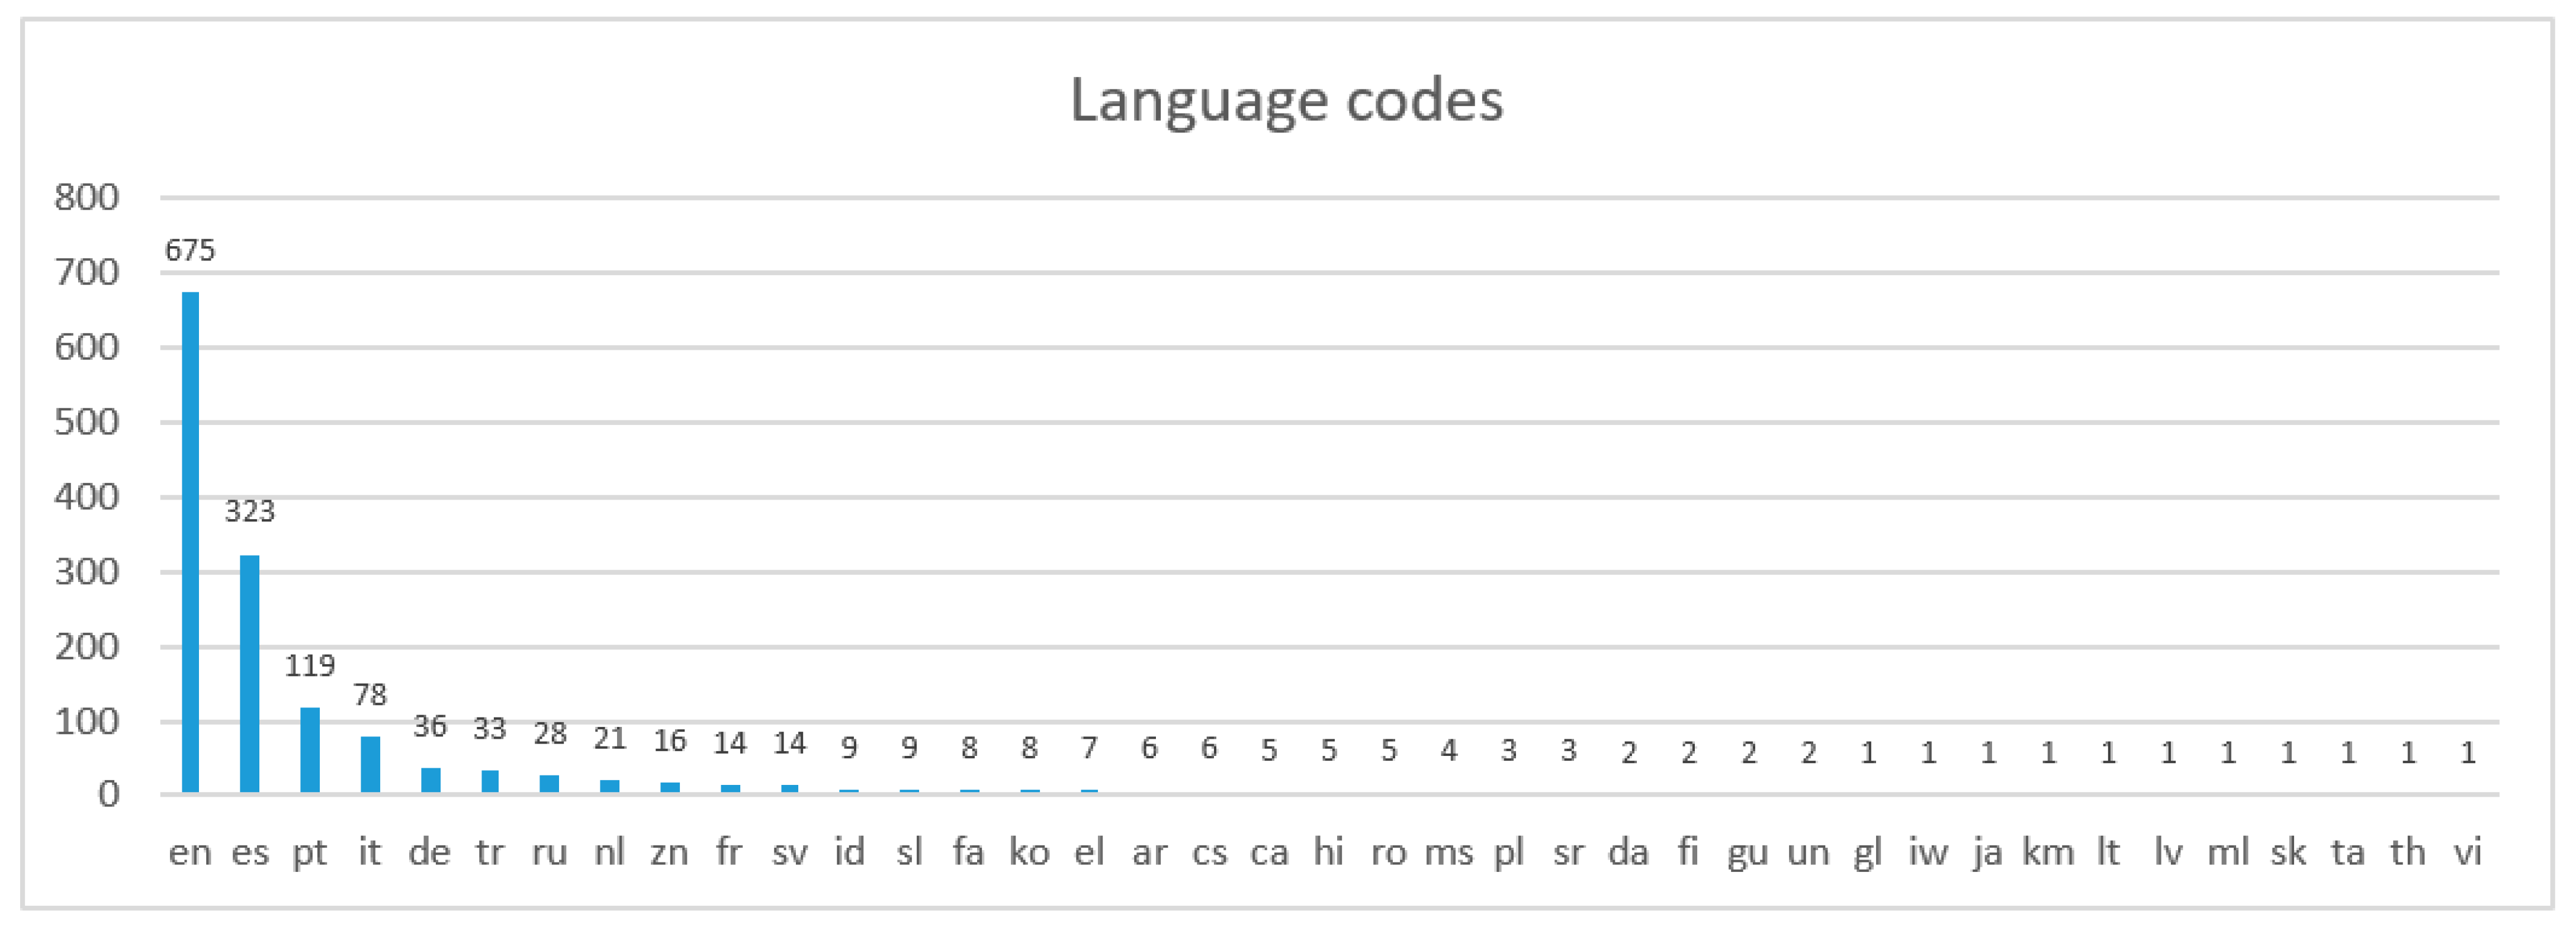
Google’s Python module CLD2 (Compact Language Detection) is based on a Naive Bayesian classifier and can identify up to three languages in a document and their associated probabilities. Keeping the highest probability for each post we detected its language, except for two unidentified language posts (‘un’) and results are shown in Figure 9:
Detecting the English language for a post does not necessarily imply that it is completely free of non-English words and characters. In our study, this was shown later when we performed text ‘cleaning’. Our first preprocessing step was to filter out non-English language posts, so the new dataframe consisted of 675 English language posts: 339 for #pfizer, 291 for #astrazeneca, and 45 for #jnj. Our aim here was to classify users’ communication intents. Intent classification differs from sentiment and opinion mining, as it focuses on futuristic action rather than the current state of feelings [56]. Four intent classes were specified, motivated by the works of [57,58] and were partially adopted and modified to fit in our context:
- ‘Acknowledge’ (ACK), for generic statements, reporting facts and sharing experience
- ‘Advise’ (ADV), for suggestions, recommendations, giving guidelines or offering help
- ‘Seek’ (SEK), for seeking help, advice, comments, or answers
- ‘Express’ (EXP), for any kind of expression, feeling, or thought, positive or negative (hybrid intent-sentiment)
These were label-encoded, leading to a multi-label classification problem, with all the challenges this may entail (most notably imbalanced classification). To construct the necessary annotated dataset, we employed INCEpTION [59], an open-source semantic annotation tool which enables automatic text labelling at different levels; word entities, sentences or larger documents. After manual annotation of 100 posts, the tool’s recommender subsystem, a multi-token sequence classifier based on OpenNLP NER (named entity recognition) model, proposed the remaining post labels, which were human-inspected and either accepted or corrected. Degree of acceptance was quite high. Table 4 displays the annotation results for the three hashtag containing posts, with ACK and SEK being larger and smaller respectively for #pfizer and #astrazeneca. The case of #jnj is different as there were a lot of EXP posts and by manual inspection we did verify that there were not as many COVID-19-related posts, but other cosmetic product related ones. As vocabulary is also different, this may have had its impact on the annotation process:
The 675 annotated English posts were further preprocessed by the following text ‘cleaning’ pipeline steps, where string handling routines and NLTK (Natural Language Tool Kit) were mostly utilized:
- Substitute any other, possibly remaining, words containing language characters, accents, etc., with their closest ASCII equivalent, as user posts can be very noisy (e.g., changing the Greek word ‘ελληνικά’ to ‘ellenika’);
- Remove URLs in posts, as they are also frequently used, using regular expressions;
- Tokenize text and remove punctuation, using NLTK regular expressions tokenizer;
- Convert all tokens to lower case, using python’s string method;
- Normalize text, using NLTK lemmatization for verbs, nouns and adjectives;
- Remove tokens than contain non-alphabetic characters, e.g., numbers, using python’s string method;
- Remove English ‘stop words’, words of less importance that appear quite frequently in natural speech, using NLTK;
- Remove any remaining non-English, or English un-normalized words (e.g., ‘amigo’, ‘yeaah’, ‘lol’) that may have survived in post, using NTLK corpus.
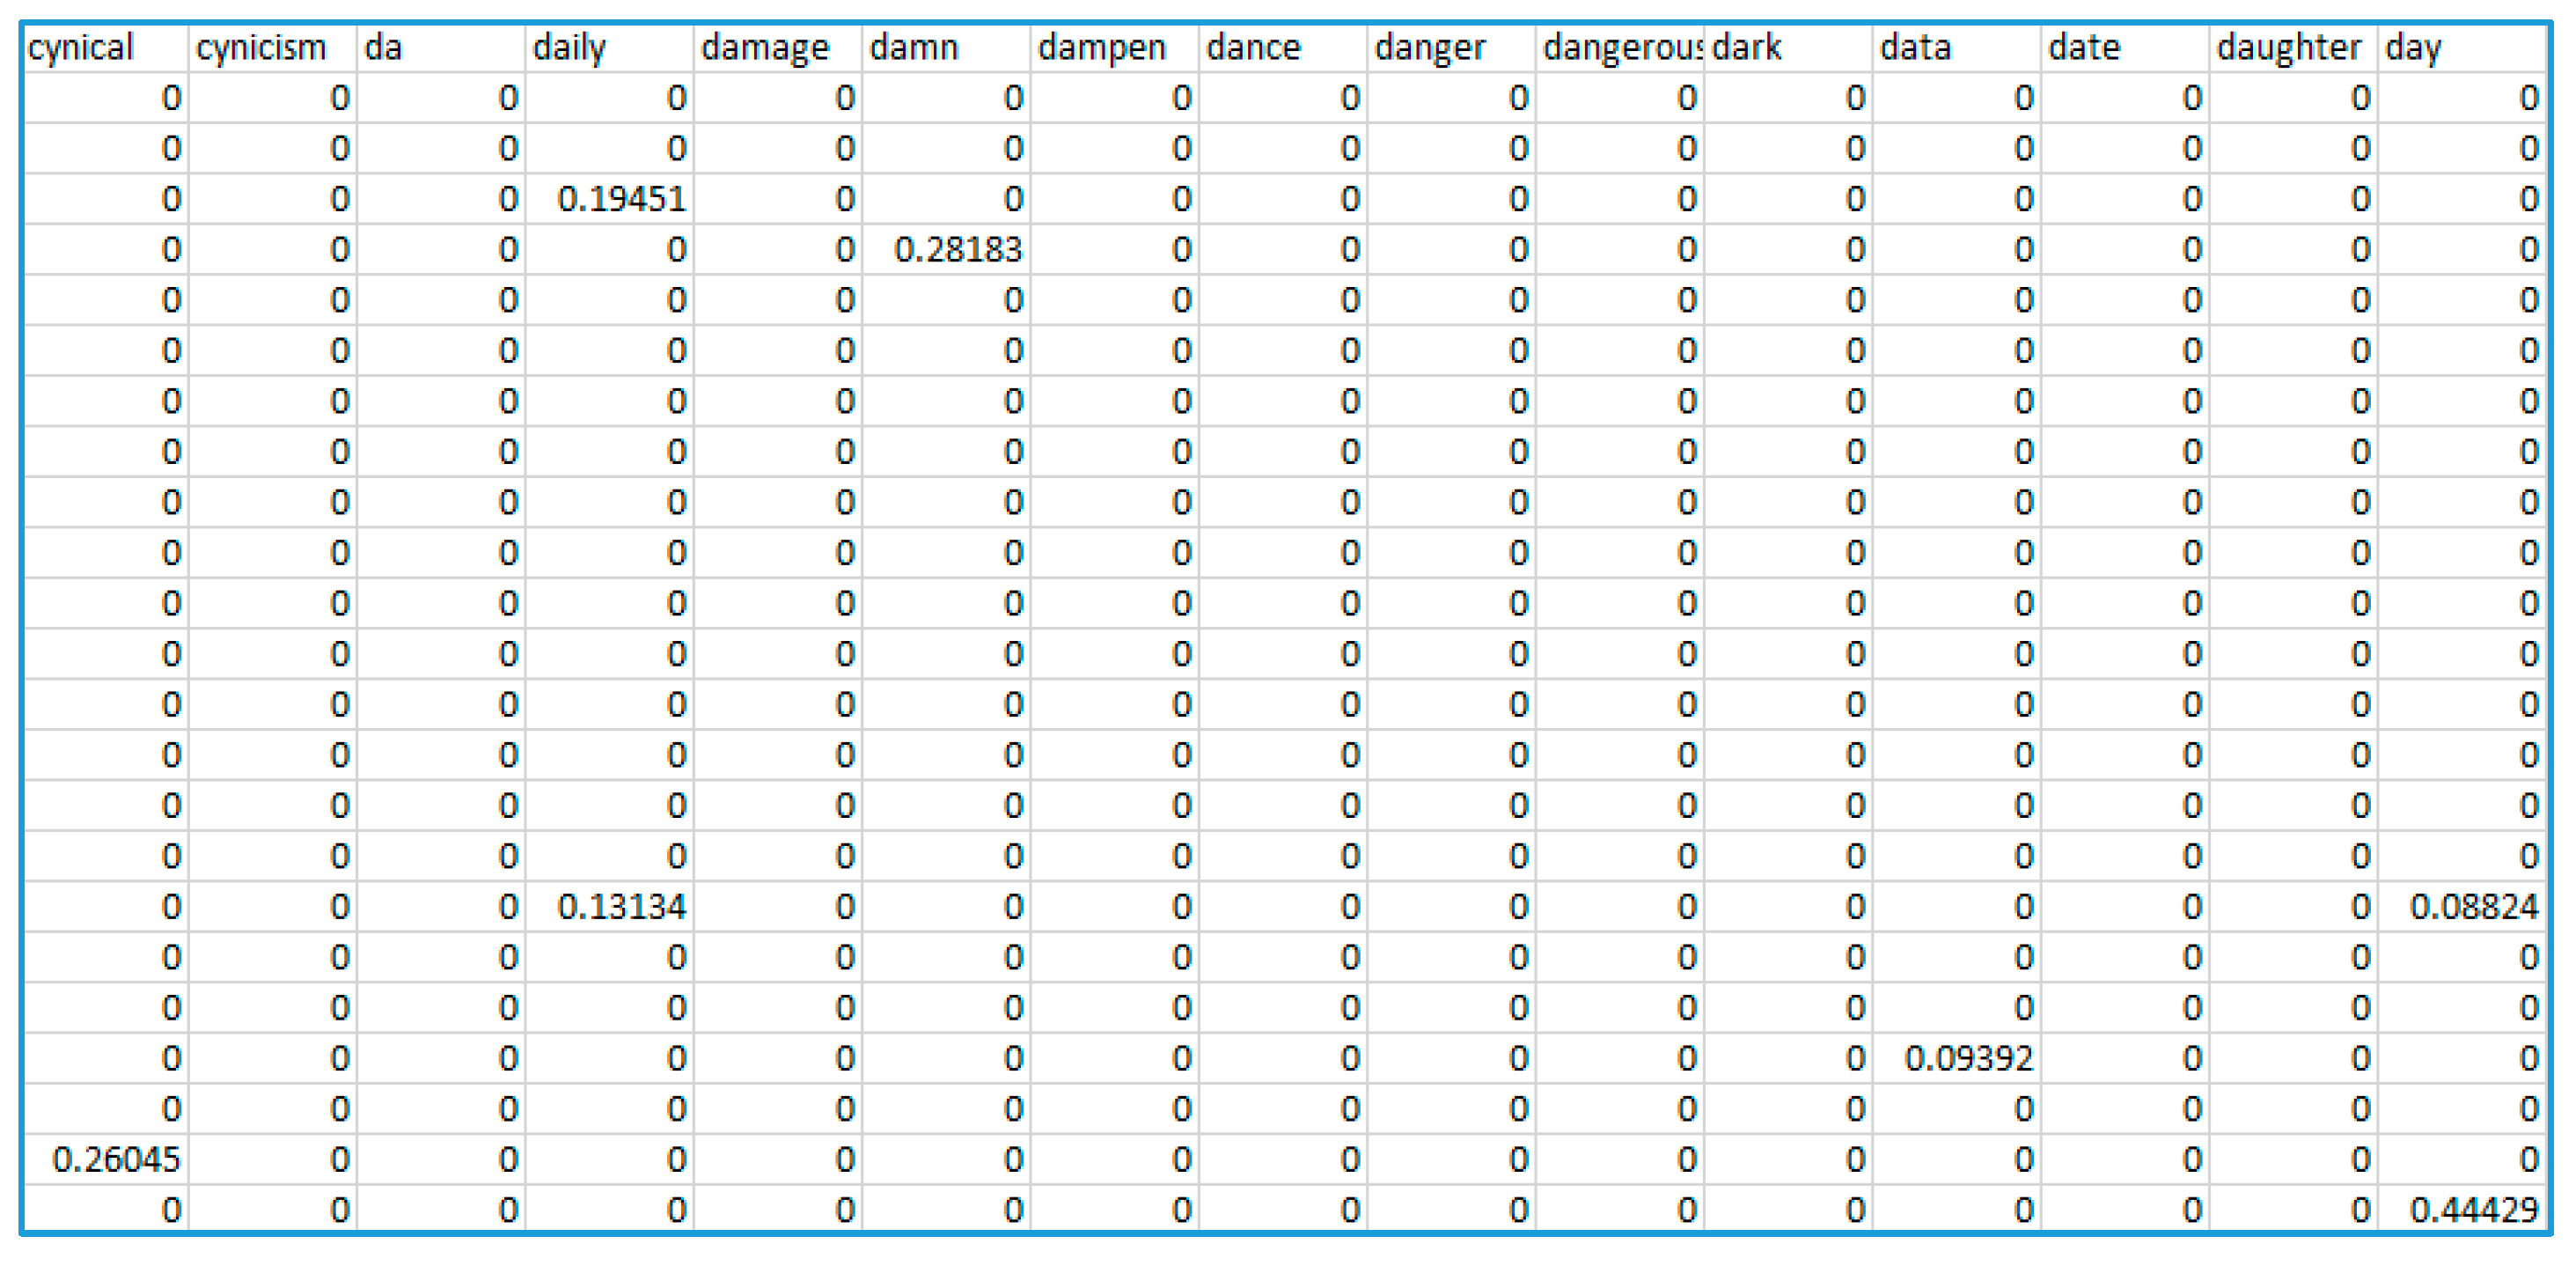
Stemming and lemmatization are the most popular normalization methods. Stemming refers to the process of transforming derivatives words to their root; however, with some undesired effects, e.g., trouble→troubl. Lemmatization refers to the process of grouping different word forms together, so that they can be analyzed under a single ‘lemma’, e.g., ‘better’ and ‘best’ could be lemmatized as ‘good’. The last is an example of adjective lemmatization. Lemmatization can also be applied to nouns (tables→table) and verbs (giving→give). Finally, the most important step of text preparation that was carried out was vectorization, a process that converts words (or tokens) to numerical feature representations. Popular vectorization approaches can utilize different models; Bag-of-Words (BoW) term frequency model, L1-normalized term frequency model, and L2-normalized TF-IDF (Term Frequency—Inverse Document Frequency) model. More recently, models that employ word embeddings are considered; Word2Vec/Doc2Vec (Google), GloVe (Stanford University) and fastText (Facebook). In our case, the corpus of 675 posts was TF-IDF vectorized using scikit-learn feature extractor. An excerpt from the vectorized, sparse dataset is shown in Figure 10. The vocabulary (attributes) consisted of 3024 words:
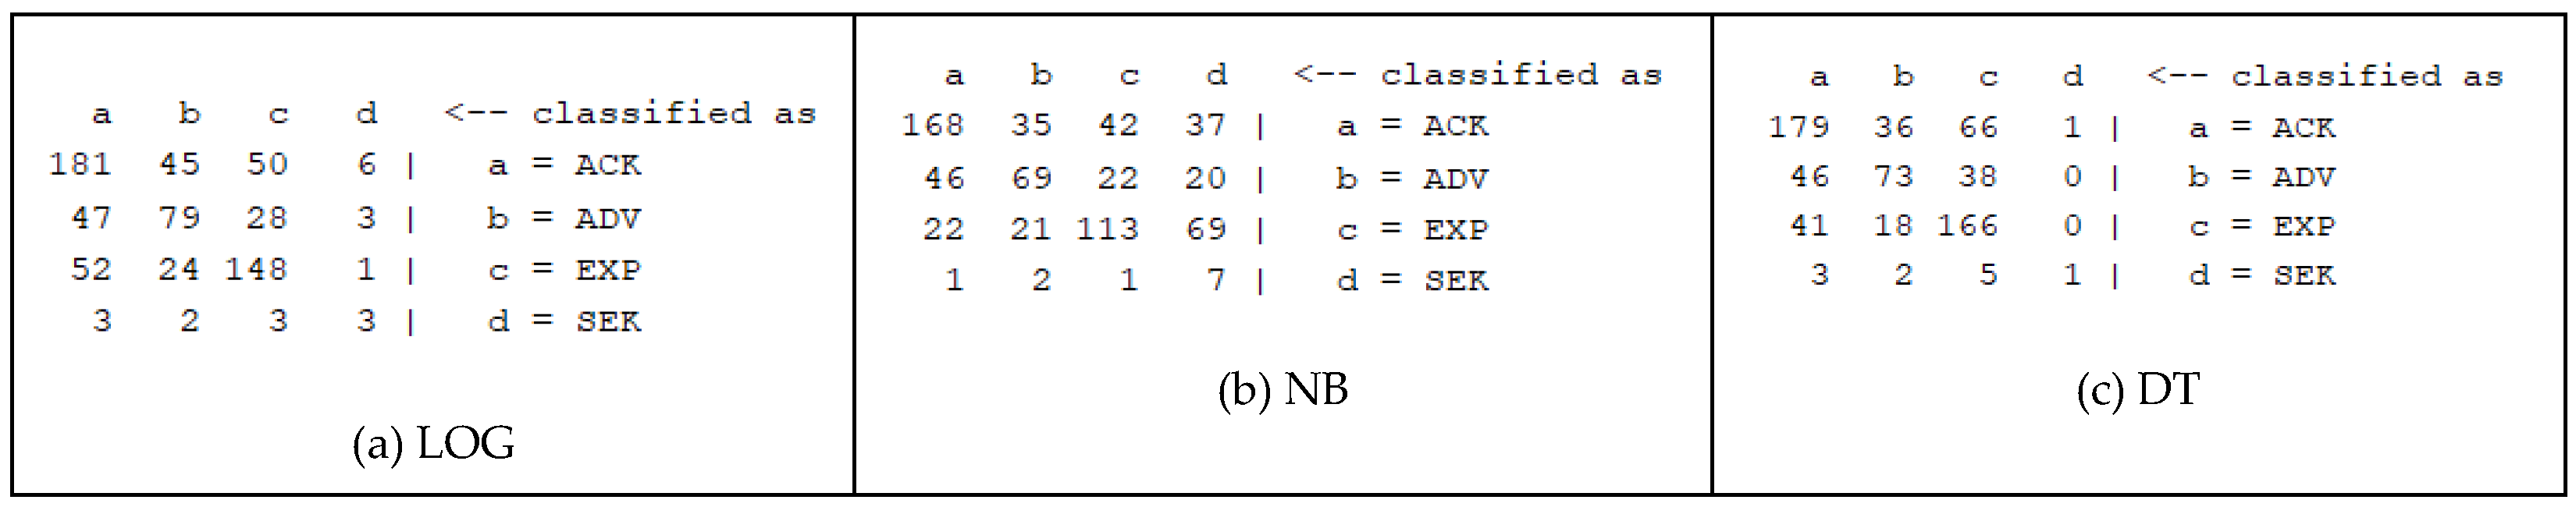
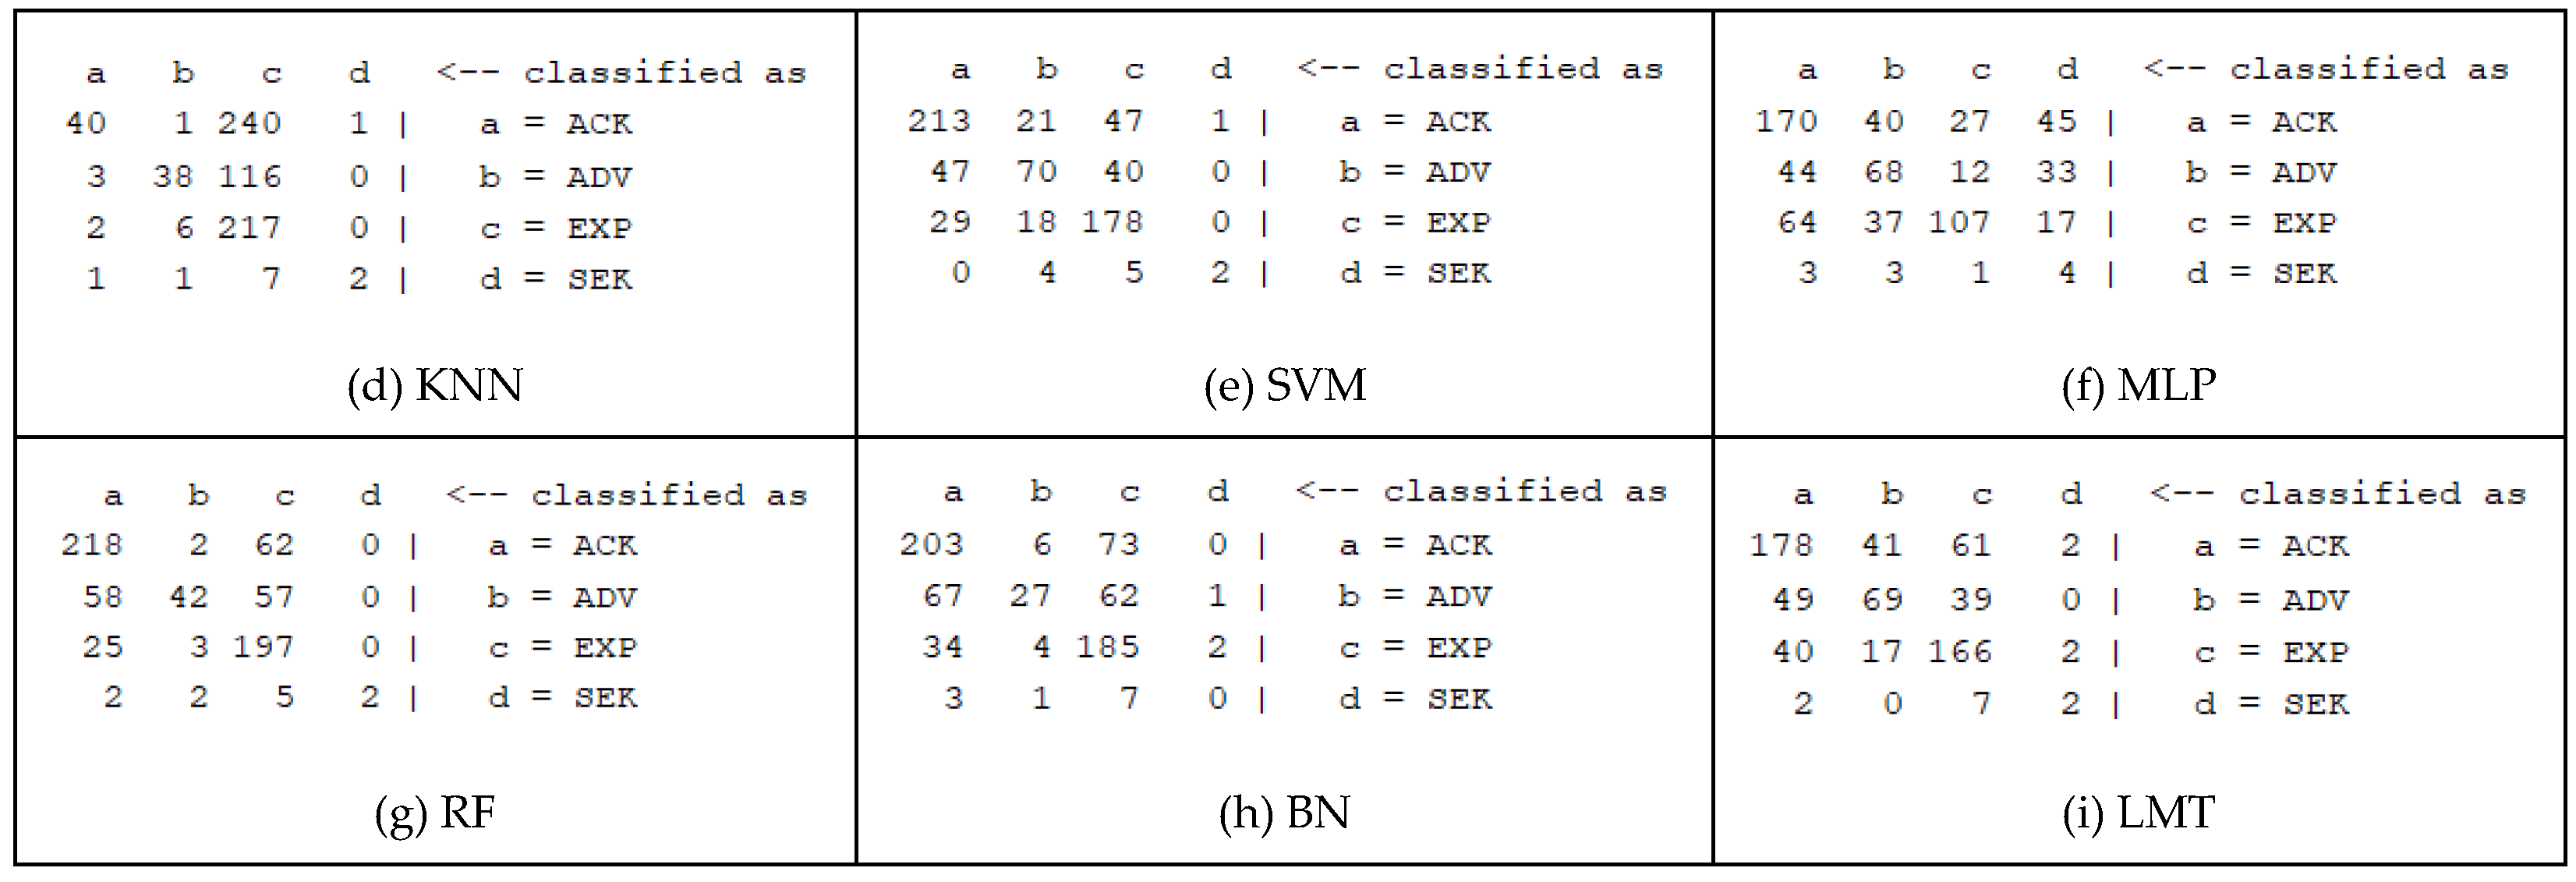
The final vectorized and annotated dataset was split, using 10-fold cross validation, into two subsets for training and testing respectively. These subsets were used to train nine weka classifiers with their default configuration: one linear one, Logistic Regression (LOG), seven non-linear ones, Naïve Bayes (NB), C4.5 Decision Tree (DT), k-Nearest Neighbour (KNN), Support Vector Machine (SVM), Multi-Layer Perceptron (MLP), Bayes Net (BN), Logistic Model Tree (LMT), and one ensemble classifier, Random Forest (RF). The objective here was to evaluate the classifiers’ performance and choose the best suited algorithm for building a predictive model. The baseline performance was set by using the Zero-Rule (ZR) classifier which simply predicts the dataset class mode. In our case this was ‘ACK’ with 282 instances over a total of 675, thus an accuracy of 41.8%. Results are reported on Table 5. Reducing the vocabulary by keeping only the, e.g., 1000 top words, did not improve the accuracy. Similarly, considering bigrams as well as unigrams led to worse results. However, it would be expected to improve with more data, i.e., more posts. Further individual parameter tuning for each algorithm might have also yielded better results. Different metrics are also reported (weighted averages) such as: Mathews Correlation Coefficient (MCC), Receiver Operating Characteristic (ROC) area, F-measure (harmonic precision-recall mean), and Cohen’s Kappa metric, with the last two suggested as more appropriate for imbalanced classification tasks. Confusion matrices (Figure 11) are also useful for showing the numbers of true and false predictions for each class.
From these initial results we can infer that the SVM and RF classifiers seem more promising and require further investigation. In fact, a simple voting (averaging probability rule) scheme derived from these two classifiers gave a joint accuracy of 69.3%, with improvements in all other metrics as well. Other popular ensemble techniques are bootstrap aggregation (bagging, as in RF), boosting, and stacked generalization. Boosting the SVM or the RF classifier alone, did not improve the accuracy, with either 10 or 100 models. Stacking the two classifiers, with logistic regression as the meta-classifier rule, yielded an accuracy of 70.5%.
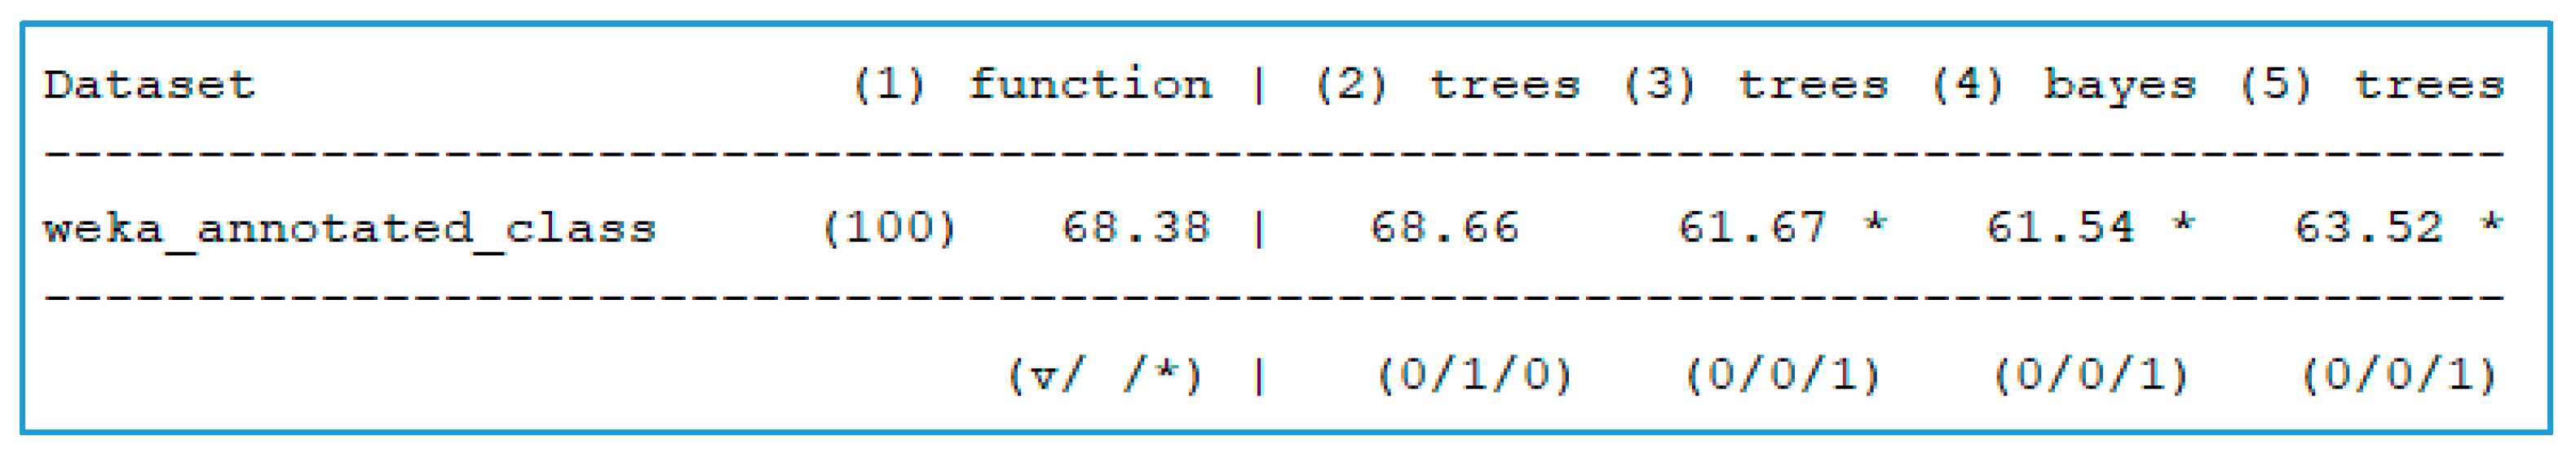
To validate our initial algorithm ranking, we design a controlled experiment where the top 5 classifiers (SVM, RF, DT, BN and LMT) were further analyzed. With the experiment, a result dataset of 500 rows was created (5 algorithms ×10-fold cross validation × 10 times run) and statistical tests (corrected paired T-tests) could be carried out on different performance evaluation metrics. The base algorithm was SVM. Reasonable assumptions about Gaussian distributions were made and significance level was set to 0.05. Figure 12 shows that all four algorithms have worse accuracy than SVM, with results being significant (at the 0.05 confidence level, as denoted by the '*' symbol next to results) for DT, BN, and LMT. Thus, SVM and RF (with not significantly different results, as denoted by the absence of any symbol) are indeed the best choices, with accuracies as shown and standard deviations of 4.83 and 4.66 respectively. Similar controlled experiments can be set out for individual algorithm parameter tuning.
Therefore, in a potential, real-world application the finalized (trained on the entire dataset) model could be leveraged to automatically classify new posts as they are uploaded, e.g., in real-time or daily and automatically predicting and classifying the users’ communication intents for a company’s monitoring purposes and beneficiary goals.
With sentiment analysis, very frequently apart from opinion mining, the process also extracts the expression attributes, e.g., polarity, subject, and opinion holder. Subjectivity/Objectivity classification can also be performed, as well as retrieval of direct/comparative and explicit/implicit opinions. There have also been research efforts to detect affects within text. A list of six basic emotions is given in [60]: happiness, sadness, surprise, anger, disgust, and fear. Ekman later expanded his list [61] to include pride, shame, embarrassment, and excitement, while other researchers have additionally considered trust and anticipation [62], or guilt and shyness [63]. More recently, 27 discrete emotions were identified by self-reporting, in a study by Keltner and Cowen [64].
Obviously, text must be vectorized if any sentiment analysis is to be performed. With Bag-Of-Words models, the ordering of words is not considered, thereby producing sparse numerical arrays for word representations. However, with Embedding models the position of words is learned from text, based on surrounding words and dense vector word projections are obtained. In the context of this work we trained a Convolution Neural Network (CNN) on the IMDB dataset for 100 epochs, under Keras, which supports Embedding layers. The CNN consisted of the following sequential layers and respective hyperparameter settings:
- Embedding layer where input_dim = 100,000, output_dim = 32, input_length = 1000;
- Conv1D layer with filters = 32, kernel_size = 3, size = ‘same’, activation = ‘relu’;
- MaxPooling1D layer with pool_size = 2, strides = 2;
- Flatten layer where the previous layer’s 2d output is flattened to a 1d vector;
- Dense layer with 500 fully connected units, activation = ‘relu’;
- Dense layer with a single output neuron, activation = ‘sigmoid’.
The CNN model was configured to utilize logarithmic loss (binary_crossentropy) and the ADAM optimization procedure. There was a total of ~11M trainable parameters and without any further hyperparameter tuning, it achieved an accuracy of 86.6%. Deploying the model on the 675 English language posts, we obtained a list of sentiment polarity scores, with values in interval [0,1] (negative to positive respectively). The overall sentiment was 0.38, neutral to negative, with a rather large standard deviation however of 0.45. Results for posts corresponding to the three hashtags are shown on Table 6 and distributions in Figure 13. Posts made for #pfizer seem to be more positive than the other two hashtags and standard deviations are in all cases large. Distributions are also highly polarized towards the ends of the interval, with many positive and negative results. In any case, one does not have to neglect the fact that users’ short posts are very frequently full of peculiarities and cannot be considered as ‘proper text’.
4. Discussion
In this paper, we performed an analysis of textual and visual features regarding the Instagram posts of the three vaccine-offering companies, during the onset period of the first vaccinations. Our results can be compared with other studies, e.g., [41], as we too found out that the companies post images of people to a large extent and users highly discuss the arrival of the vaccines and engage in opinion sharing with respect to their success.
Our research has shown that only three companies have an active account on Instagram, i.e., Pfizer, Astrazeneca, and Johnson & Johnson. Astrazeneca has had an Instagram account longer than the other two, and has had the most posts and the highest rate of posting, but the lowest number of followers. By descriptive statistics, we infer that Johnson & Johnson post less frequently than Pfizer and Astrazeneca, but when they do post, their posts are lengthier. Moreover, their posts contain more hashtags, receive more likes and comments, thus having a greater impact on users. This can be attributed to the fact that Johnson & Johnson is a larger company with a wider range of products, e.g., cosmetics. Their posts additionally include more images and videos. Regarding the images posted, the study has shown that all three companies upload photos of their employees or other persons, classifying the images as clothing items or props, e.g., stethoscope or microscope. Moreover, the image classification outputs from the three models have been organized as a dataset enabling the quantitative and qualitative assessment of results, which is demonstrated and discussed. AstraZeneca mostly post synthetic images followed by images of humans. The same applies to Pfizer, with results however following a flatter distribution. Johnson & Johnson on the other hand, prefer posting images of humans, although their number of posts is significantly lower.
With respect to the user posts, these are to a large extent written in English, with Spanish, Portuguese, and Italian following. After filtering out non-English language posts and preprocessing, the automatic annotation process has shown that the ‘acknowledge’ class is the largest, with ‘expression’ and ‘advice’ following and a very small size for the ‘seek’ class. Thus, users’ post intent was mainly devoted to making generic statements, reporting facts, and sharing their experiences, which in this context meant their experiences after vaccination. Users do not seem to be seeking help or advice about COVID-19 or vaccination process. For the predictive modelling application, results have shown that the best performing algorithms for intent classification, were equally Support Vector Machines and Random Forest, significantly better than the rest of the suite of algorithms examined. Finally, polarity analysis on users’ posts, leveraging a convolutional neural network, reveals a rather neutral to negative sentiment, with highly polarized user posts’ distributions.
Possible future extensions to this work include: investigation of other social media platforms, for example Facebook and Twitter; investigation of other vaccine producing companies, e.g., Moderna and augment the dataset with more recent posts; employment of automatic caption generation to retrieve the textual description of the image scene rather than mere object classification; performance of sentiment analysis on other affects as well, rather than just polarity; carrying out parameter tuning to improve model’s performance, as in all of the algorithms used in this work we have mostly opted to stick to the default configurations. Due to the tremendous increase in the data volumes being produced [65,66,67,68] and the big data explosion, an investigation on the use of big data from the social media platforms could be of great importance.
Author Contributions
Conceptualization, D.A., I.M. and I.K.; Methodology, D.A., I.M., I.K. and A.S.; Software, D.A.; Validation, D.A., S.M. and I.K.; Formal Analysis, D.A., I.M., I.K. and A.S.; Investigation, D.A. and I.M.; Resources, D.A. and I.M.; Data Curation, D.A.; Writing—Original Draft Preparation, D.A., S.M. and A.S.; Writing—Review & Editing, D.A., S.M. and A.S.; Visualization, D.A.; Supervision, I.M., I.K., S.M. and D.A.; Project Administration, I.M., I.K., S.M. and D.A. All authors have read and agreed to the published version of the manuscript.
Funding
This research received no external funding.
Institutional Review Board Statement
Not applicable.
Informed Consent Statement
Not applicable.
Data Availability Statement
Datasets (raw or processed) and results are available from the authors upon request.
Conflicts of Interest
The authors declare no conflict of interest.
References
- Hays, S.; Page, S.J.; Buhalis, D. Social media as a destination marketing tool: Its use by national tourism organisations. Curr. Issues Tour. 2013, 16, 211–239. [Google Scholar] [CrossRef]
- Dwivedi, Y.K.; Ismagilova, E.; Hughes, D.L.; Carlson, J.; Filieri, R.; Jacobson, J.; Jain, V.; Karjaluoto, H.; Kefi, H.; Krishen, A.S.; et al. Setting the future of digital and social media marketing research: Perspectives and research propositions. Int. J. Inf. Manag. 2020, 102168. [Google Scholar] [CrossRef]
- Hanika, I.M.; Miranti, A. Social Media and Fake News in 2017 Jakarta Governor Election. In Proceedings of the 5th International Conference on Education & Social Sciences (ICESS), “The Asia Network: Bringing Time, Space and Social Life Together”, Semarang, Indonesia, 26–27 July 2017. [Google Scholar]
- Srivastava, R.; Chawla, S.; Popat, V. Social Media a New Platform for Mass Marketing. Adv. Innov. Res. 2020, 7, 238. [Google Scholar]
- Saunders, J.F.; Eaton, A.A. Snaps, selfies, and shares: How three popular social media platforms contribute to the sociocultural model of disordered eating among young women. Cyberpsychol. Behav. Soc. Netw. 2018, 21, 343–354. [Google Scholar] [CrossRef] [Green Version]
- Amanatidis, D.; Mylona, I.; Mamalis, S.; Kamenidou, I.E. Social media for cultural communication: A critical investigation of museums’ Instagram practices. J. Tour. Herit. Serv. Mark. JTHSM 2020, 6, 38–44. [Google Scholar]
- Most Popular Social Networks Worldwide as of October 2020, Ranked by Number of Active Users. Available online: https://www.statista.com/statistics/272014/ (accessed on 29 January 2021).
- Hanan, H.; Putit, N. Express marketing of tourism destinations using Instagram in social media networking. Hosp. Tour. 2013, 471. [Google Scholar] [CrossRef]
- Liebhart, K.; Bernhardt, P. Political storytelling on Instagram: Key aspects of Alexander Van der Bellen’s successful 2016 presidential election campaign. Media Commun. 2017, 5, 15–25. [Google Scholar] [CrossRef] [Green Version]
- Zappavigna, M. Social media photography: Construing subjectivity in Instagram images. Vis. Commun. 2016, 15, 271–292. [Google Scholar] [CrossRef]
- Trulline, P.; El Karimah, K. Selfie Women’s Photo on Instagram (Virtual Etnography Study Post Photos Selfie on Instagram). In Proceedings of the 5th International Conference on Education & Social Sciences (ICESS), “The Asia Network: Bringing Time, Space and Social Life Together”, Semarang, Indonesia, 26–27 July 2017. [Google Scholar]
- Weilenmann, A.; Hillman, T.; Jungselius, B. Instagram at the museum: Communicating the museum experience through social photo sharing. In Proceedings of the SIGCHI Conference on Human Factors in Computing Systems, Paris, France, 27 April–2 May 2013; pp. 1843–1852. [Google Scholar]
- Tyer, S. Instagram: What Makes You Post? Pepperdine J. Commun. Res. 2016, 4, 14. [Google Scholar]
- Anagnostopoulos, C.; Parganas, P.; Chadwick, S.; Fenton, A. Branding in pictures: Using Instagram as a brand management tool in professional team sport organisations. Eur. Sport Manag. Q. 2018, 18, 413–438. [Google Scholar] [CrossRef]
- Hunt, D.S.; Lin, C.A.; Atkin, D.J. Communicating social relationships via the use of photo-messaging. J. Broadcasting Electron. Media 2014, 58, 234–252. [Google Scholar] [CrossRef]
- Marengo, D.; Longobardi, C.; Fabris, M.A.; Settanni, M. Highly-visual social media and internalizing symptoms in adolescence: The mediating role of body image concerns. Comput. Hum. Behav. 2018, 82, 63–69. [Google Scholar] [CrossRef]
- Terttunen, A. The Influence of Instagram on Consumers’ Travel Planning and Destination Choice. Bachelor’s Thesis, Haaga-Helia University, Helsinki, Finland, 2017. [Google Scholar]
- Kusuma, K. Activities of the Cyber Public Relations of O Chanel TV in Promoting their Company on the Instagram Social Media. Am. J. Humanit. Soc. Sci. Res. AJHSSR 2018, 2, 50–56. [Google Scholar]
- Hu, Y.; Manikonda, L.; Kambhampati, S. What we instagram: A first analysis of instagram photo content and user types. In Proceedings of the International AAAI Conference on Web and Social Media, Ann Arbor, MI, USA, 1–4 June 2014; Volume 8. [Google Scholar]
- Singh, M. Instagram Marketing—The Ultimate Marketing Strategy. Adv. Innov. Res. 2020, 7, 379. [Google Scholar]
- Latiff, Z.A.; Safiee, N.A.S. New business set up for branding strategies on social media–Instagram. Procedia Comput. Sci. 2015, 72, 13–23. [Google Scholar] [CrossRef] [Green Version]
- Manovich, L. The aesthetic society: Instagram as a life form. In Data Publics: Public Plurality in an Era of Data Determinacy; Mörtenböck, P., Mooshammer, H., Eds.; Routledge: London, UK, 2020. [Google Scholar]
- Gaber, H.R.; Wright, L.T.; Kooli, K. Consumer attitudes towards Instagram advertisements in Egypt: The role of the perceived advertising value and personalization. Cogent Bus. Manag. 2019, 6, 1618431. [Google Scholar] [CrossRef]
- Fouda, A.; Mahmoudi, N.; Moy, N.; Paolucci, F. The COVID-19 pandemic in Greece, Iceland, New Zealand, and Singapore: Health policies and lessons learned. Health Policy Technol. 2020, 9, 510–524. [Google Scholar] [CrossRef] [PubMed]
- Morens, D.M.; Fauci, A.S. Emerging pandemic diseases: How we got to COVID-19. Cell 2020, 182, 1077–1092. [Google Scholar] [CrossRef]
- Matarese, A.; Gambardella, J.; Sardu, C.; Santulli, G. miR-98 regulates TMPRSS2 expression in human endothelial cells: Key implications for COVID-19. Biomedicines 2020, 8, 462. [Google Scholar] [CrossRef]
- COVID-19 Map. Johns Hopkins Coronavirus Resource Center. Available online: https://coronavirus.jhu.edu/map.html (accessed on 29 January 2021).
- Kamenidou, I.E.; Stavrianea, A.; Liava, C. Achieving a Covid-19 free country: Citizens preventive measures and communication pathways. Int. J. Environ. Res. Public Health 2020, 17, 4633. [Google Scholar] [CrossRef] [PubMed]
- Koirala, A.; Joo, Y.J.; Khatami, A.; Chiu, C.; Britton, P.N. Vaccines for COVID-19: The current state of play. Paediatr. Respir. Rev. 2020, 35, 43–49. [Google Scholar] [CrossRef] [PubMed]
- Lerner, A.M.; Folkers, G.K.; Fauci, A.S. Preventing the spread of SARS-CoV-2 with masks and other “low-tech” interventions. JAMA 2020, 324, 1935–1936. [Google Scholar] [CrossRef] [PubMed]
- CoVid19.gov.gr. Τα μέτρα της Κυβέρνησης για την αντιμετώπιση του κορονοϊού. Available online: https://covid19.gov.gr/ (accessed on 29 January 2021).
- O’Callaghan, K.P.; Blatz, A.M.; Offit, P.A. Developing a SARS-CoV-2 vaccine at warp speed. JAMA 2020, 324, 437–438. [Google Scholar] [CrossRef]
- Dai, L.; Zheng, T.; Xu, K.; Han, Y.; Xu, L.; Huang, E.; An, Y.; Cheng, Y.; Li, S.; Liu, M.; et al. A universal design of betacoronavirus vaccines against COVID-19, MERS, and SARS. Cell 2020, 182, 722–733. [Google Scholar] [CrossRef]
- Corey, L.; Mascola, J.R.; Fauci, A.S.; Collins, F.S. A strategic approach to COVID-19 vaccine R&D. Science 2020, 368, 948–950. [Google Scholar]
- Chen, Q.; Min, C.; Zhang, W.; Wang, G.; Ma, X.; Evans, R. Unpacking the black box: How to promote citizen engagement through government social media during the COVID-19 crisis. Comput. Hum. Behav. 2020, 110, 106380. [Google Scholar] [CrossRef]
- Saire, J.C.; Panford-Quainoo, K. Twitter Interaction to Analyze Covid-19 Impact in Ghana, Africa from March to July. arXiv 2020, arXiv:2008.12277. [Google Scholar]
- González-Padilla, D.A.; Tortolero-Blanco, L. Social media influence in the COVID-19 pandemic. Int. Braz. J. Urol. 2020, 46, 120–124. [Google Scholar] [CrossRef] [PubMed]
- Adly, A.S.; Adly, A.S.; Adly, M.S. Approaches based on artificial intelligence and the internet of intelligent things to prevent the spread of COVID-19: Scoping review. J. Med. Internet Res. 2020, 22, e19104. [Google Scholar] [CrossRef]
- Kushner, J. The Role of Social Media during a Pandemic. Available online: https://bit.ly/34mOPcK (accessed on 8 May 2021).
- Malecki, K.; Keating, J.A.; Safdar, N. Crisis communication and public perception of COVID-19 risk in the era of social media. Clin. Infect. Dis. 2020, 72, 697–702. [Google Scholar] [CrossRef] [PubMed]
- Kim, Y.; Kim, J.H. Using photos for public health communication: A computational analysis of the Centers for Disease Control and Prevention Instagram photos and public responses. Health Inform. J. 2020, 26, 2159–2180. [Google Scholar] [CrossRef] [PubMed]
- Basch, C.H.; MacLean, S.A. A content analysis of HPV related posts on instagram. Hum. Vaccines Immunother. 2019, 15, 1476–1478. [Google Scholar] [CrossRef] [PubMed]
- La Gatta, V.; Moscato, V.; Postiglione, M.; Sperli, G. An Epidemiological Neural network exploiting Dynamic Graph Structured Data applied to the COVID-19 outbreak. In IEEE Transactions on Big Data; IEEE: Piscataway, NJ, USA, 2020. [Google Scholar]
- AbdelFattah, M.; Galal, D.; Hassan, N.; Elzanfaly, D.; Tallent, G. A Sentiment Analysis Tool for Determining the Promotional Success of Fashion Images on Instagram. Int. J. Interact. Mob. Technol. 2017, 11, 66–73. [Google Scholar] [CrossRef] [Green Version]
- Moscato, V.; Picariello, A.; Sperli, G. An emotional recommender system for music. In IEEE Intelligent Systems; IEEE: Piscataway, NJ, USA, 2020. [Google Scholar]
- Information about the Pfizer-BioNTech COVID-19 Vaccine. Available online: https://www.cdc.gov/coronavirus/2019-ncov/vaccines/different-vaccines/Pfizer-BioNTech.html (accessed on 29 January 2021).
- AstraZeneca-Research-Based Bio-Pharmaceutical Company. Available online: https://www.astrazeneca.com/ (accessed on 29 January 2021).
- Arashkia, A.; Jalilvand, S.; Mohajel, N.; Afchangi, A.; Azadmanesh, K.; Salehi-Vaziri, M.; Fazlalipour, M.; Pouriayevali, M.H.; Jalali, T.; Nasab, S.D.M.; et al. Severe acute respiratory syndrome-coronavirus-2 spike (S) protein based vaccine candidates: State of the art and future prospects. Rev. Med. Virol. 2020, e2183. [Google Scholar] [CrossRef] [PubMed]
- About Johnson & Johnson. Available online: https://www.jnj.com/about-jnj (accessed on 29 January 2021).
- How the Johnson & Johnson Vaccine Works. Available online: https://www.nytimes.com/interactive/2020/health/johnson-johnson-covid-19-vaccine.html (accessed on 29 January 2021).
- COVID-19 Vaccine. Available online: https://en.wikipedia.org/wiki/COVID-19_vaccine (accessed on 29 January 2021).
- Instaloader. Available online: https://instaloader.github.io/ (accessed on 29 January 2021).
- Simonyan, K.; Zisserman, A. Very deep convolutional networks for large-scale image recognition. arXiv 2014, arXiv:1409.1556. [Google Scholar]
- Szegedy, C.; Vanhoucke, V.; Ioffe, S.; Shlens, J.; Wojna, Z. Rethinking the inception architecture for computer vision. In Proceedings of the IEEE Conference on Computer Vision and Pattern Recognition, Las Vegas, NV, USA, 26 June–1 July 2016. [Google Scholar]
- He, K.; Zhang, X.; Ren, S.; Sun, J. Deep residual learning for image recognition. In Proceedings of the IEEE Conference on Computer Vision and Pattern Recognition, Las Vegas, NV, USA, 26 June–1 July 2016. [Google Scholar]
- Adekotujo, A.S.; Lee, J.; Enikuomehin, A.O.; Mazzara, M.; Aribisala, S.B. Bi-lingual Intent Classification of Twitter Posts: A Roadmap. In International Conference in Software Engineering for Defense Applications; Springer: Cham, Germany, 2018. [Google Scholar]
- Purohit, H.; Dong, G.; Shalin, V.; Thirunarayan, K.; Sheth, A. Intent classification of short-text on social media. In Proceedings of the 2015 IEEE International Conference on Smart City/Socialcom/Sustaincom (Smartcity), Chengdu, China, 19–21 December 2015. [Google Scholar]
- Saha, T.; Saha, S.; Bhattacharyya, P. Tweet act classification: A deep learning based classifier for recognizing speech acts in twitter. In Proceedings of the 2019 International Joint Conference on Neural Networks (IJCNN), Budapest, Hungary, 14–19 July 2019. [Google Scholar]
- Inception. Available online: https://inception-project.github.io/ (accessed on 29 January 2021).
- Ekman, P. Are there basic emotions? Psychol. Rev. 1992, 99, 550–553. [Google Scholar] [CrossRef] [PubMed]
- Ekman, P. Emotions inside out. 130 years after Darwin’s ‘The Expression of the Emotions in Man and Animal. Ann. N. Y. Acad. Sci. 2003, 1000, 1–6. [Google Scholar] [CrossRef]
- Plutchik, R. The circumplex as a general model of the structure of emotions and personality. In Circumplex Models of Personality and Emotions; Plutchik, R., Conte, H.R., Eds.; American Psychological Association: Washington, DC, USA, 1997. [Google Scholar]
- Izard, C.E.; Libero, D.Z.; Putnam, P.; Haynes, O.M. Stability of emotion experiences and their relations to traits of personality. J. Personal. Soc. Psychol. 1993, 64, 847. [Google Scholar] [CrossRef]
- Cowen, A.S.; Keltner, D. Self-report captures 27 distinct categories of emotion bridged by continuous gradients. Proc. Natl. Acad. Sci. USA 2017, 114, E7900–E7909. [Google Scholar] [CrossRef] [Green Version]
- Souravlas, S.; Anastasiadou, S. Pipelined Dynamic Scheduling of Big Data Streams. Appl. Sci. 2020, 10, 4796. [Google Scholar] [CrossRef]
- Souravlas, S.; Anastasiadou, S.; Katsavounis, S. More on Pipelined Dynamic Scheduling of Big Data Streams. Appl. Sci. 2021, 11, 61. [Google Scholar] [CrossRef]
- Anastasiadou, S.; Kofou, I. Incorporating Web 2.0 Tools into Greek Schools. Int. J. Technol. Learn. 2013, 20, 11–23. [Google Scholar]
- Kofou, I.; Anastasiadou, S. Language and Communication Needs Analysis in Intercultural Education. Int. J. Divers. Educ. 2013, 12, 15–64. [Google Scholar] [CrossRef]
Figure 1.
pfizer account posts metadata.

Figure 2.
astrazeneca account posts metadata.

Figure 3.
jnj account posts metadata.

Figure 4.
Word clouds for pfizerinc (a), astrazeneca (b) and jnj (c) profiles.

Figure 5.
Examples of models’ predictions level of agreement.

Figure 6.
Predicted image classes.

Figure 7.
Top-10 classes for the three companies.

Figure 8.
An excerpt from users’ posts.

Figure 9.
Posts’ language codes.

Figure 10.
An excerpt from the vectorized dataset.

Figure 11.
Confusion matrices.


Figure 12.
T-test results (1-SVM, 2-RF, 3-DT, 4-BN, 5-LMT).

Figure 13.
Polarity distributions.


Table 1.
Social media platforms and registered users in January 2021 (millions).
| Facebook—2740 | YouTube—2291 | WhatsApp—2000 | FB Messenger—1300 |
| Instagram—1221 | WeChat—1213 | TikTok—689 | QQ—617 |
| Douyin—600 | Sina Weibo—511 | Telegram—500 | Snapchat—498 |
| Kuaishou—481 | Pinterest—442 | Reddit—430 | Twitter—353 |
Table 2.
Companies accounts details.
| Pfizerinc (21 April 2016) | Astrazeneca (21 May 2013) | Jnj (17 August 2017) | |
|---|---|---|---|
| posts | 390 (rate: 6.8 posts/month) | 1309 (rate: 14.2 posts/month) | 33 (rate: 0.8 posts/month) |
| followers | 67,800 | 23,600 | 32,600 |
| following | 273 | 551 | 338 |
Table 3.
Mean and standard deviation (in parentheses) values for the three companies.
| Characters | Words | Hashtags | Likes | Comments | Images | Videos | |
|---|---|---|---|---|---|---|---|
| Pfizer (390 posts—since 4/2016) | 272.6 (152.7) | 41.9 (24.0) | 3.6 (3.9) | 203.7 (364.9) | 17.5 (57.7) | 1.4 (1.3) | 0.4 (0.5) |
| Astrazeneca (1309 posts—since 5/2013) | 177.2 (99.8) | 26.8 (15.4) | 2.4 (2.6) | 43.2 (73.5) | 1.8 (7.0) | 1.0 (0.4) | 0.1 (0.2) |
| Johnson & Johnson (33 posts—since 8/2017) | 1168.8 (736.1) | 198.0 (127.9) | 3.9 (1.8) | 301.0 (287.5) | 139.1 (586.7) | 1.9 (1.5) | 0.3 (0.4) |
Table 4.
Annotation results.
| #pfizer | #astrazeneca | #jnj | Totals | |
|---|---|---|---|---|
| ACK | 155 | 120 | 7 | 282 |
| ADV | 81 | 67 | 9 | 157 |
| SEK | 6 | 4 | 1 | 11 |
| EXP | 97 | 100 | 28 | 225 |
| Totals | 339 | 291 | 45 | 675 |
Table 5.
Classifiers’ evaluation metrics.
| LOG | NB | DT | KNN | SVM | MLP | RF | BN | LMT | |
|---|---|---|---|---|---|---|---|---|---|
| Accuracy (%) | 60.4 | 52.9 | 62.1 | 44.0 | 68.6 | 51.7 | 68.0 | 61.5 | 61.5 |
| MCC | 0.409 | 0.394 | 0.422 | 0.269 | 0.523 | 0.349 | 0.523 | 0.412 | 0.414 |
| ROC area | 0.777 | 0.763 | 0.704 | 0.618 | 0.790 | 0.702 | 0.854 | 0.766 | 0.772 |
| F-measure | 0.609 | 0.572 | 0.614 | 0.373 | 0.677 | 0.549 | 0.652 | 0.576 | 0.609 |
| Kappa | 0.407 | 0.344 | 0.419 | 0.163 | 0.516 | 0.310 | 0.498 | 0.394 | 0.412 |
Table 6.
Mean and standard deviation polarity values.
| Overall | #pfizer | #astrazeneca | #jnj | |
|---|---|---|---|---|
| mean | 0.38 | 0.42 | 0.34 | 0.39 |
| standard deviation | 0.45 | 0.46 | 0.44 | 0.43 |
Publisher’s Note: MDPI stays neutral with regard to jurisdictional claims in published maps and institutional affiliations. |
© 2021 by the authors. Licensee MDPI, Basel, Switzerland. This article is an open access article distributed under the terms and conditions of the Creative Commons Attribution (CC BY) license (https://creativecommons.org/licenses/by/4.0/).
Share and Cite
MDPI and ACS Style
Amanatidis, D.; Mylona, I.; Kamenidou, I.; Mamalis, S.; Stavrianea, A. Mining Textual and Imagery Instagram Data during the COVID-19 Pandemic. Appl. Sci. 2021, 11, 4281. https://doi.org/10.3390/app11094281
AMA Style
Amanatidis D, Mylona I, Kamenidou I, Mamalis S, Stavrianea A. Mining Textual and Imagery Instagram Data during the COVID-19 Pandemic. Applied Sciences. 2021; 11(9):4281. https://doi.org/10.3390/app11094281
Chicago/Turabian StyleAmanatidis, Dimitrios, Ifigeneia Mylona, Irene (Eirini) Kamenidou, Spyridon Mamalis, and Aikaterini Stavrianea. 2021. "Mining Textual and Imagery Instagram Data during the COVID-19 Pandemic" Applied Sciences 11, no. 9: 4281. https://doi.org/10.3390/app11094281
Note that from the first issue of 2016, this journal uses article numbers instead of page numbers. See further details here.