
A Review of Requirements for Gamma Radiation Detection in Space Using CubeSats


1
Division of Science, New York University Abu Dhabi, Saadyat Island, Abu Dhabi 129188, United Arab Emirates
2
Center for Astro Particle, and Planetary Physics, New York University Abu Dhabi, Saadyat Island, Abu Dhabi 129188, United Arab Emirates
3
YahSat Space Lab, Department of Electrical Engineering and Computer Science, Khalifa University of Science and Technology, Abu Dhabi 127788, United Arab Emirates
*
Author to whom correspondence should be addressed.
Appl. Sci. 2021, 11(6), 2659; https://doi.org/10.3390/app11062659
Submission received: 11 February 2021
/
Revised: 8 March 2021
/
Accepted: 10 March 2021
/
Published: 16 March 2021
(This article belongs to the Special Issue Development and Application of Particle Detectors)
Abstract
:Initially intended as student-led projects at universities and research institutions, the CubeSats now represent a unique opportunity to access space quickly and in a cost-effective fashion. CubeSats are standard and miniaturized satellites consisting of multiple identical units with dimensions of about and very limited power consumption (usually less than a few W). To date, several hundreds of CubeSats have been already launched targeting scientific, educational, technological, and commercial needs. Compact and highly efficient particle detectors suitable for payloads of miniaturized space missions can be a game changer for astronomy and astroparticle physics. For example, the origin of catastrophic astronomical events can be pinpointed with unprecedented resolution by measuring the gamma-ray coincidence signals in CubeSats flying in formations, and possibly used as early warning system for multi messenger searches. In this paper, we will discuss and analyze the main features of a CubeSat mission targeting intense and short bursts of gamma-rays.
1. Introduction
The aim of this work is to provide an overview about gamma-ray detection in space by means of instruments on-board CubeSat spacecrafts. CubeSat missions represent a relatively new way of accessing space by typically investing a few hundred thousands USD, including the launch costs.
CubeSats were originally proposed by Professor Jordi Puig-Suari at California Polytechnic State University (Cal Poly) and Professor Bob Twiggs at Stanford University’s Space Systems Development Laboratory (SSDL) to “develop a pico-satellite standard that significantly reduces the cost and development time of student satellites” [1]. Ever since, the concept gained significant attention and has led to several universities and “new space” companies around the world adopting the standard with over 1500 CubeSats already launched and several hundreds of them expected to be launched in next two years [2].
Although initially intended for education purposes, CubeSats nowadays are increasingly being developed by commercial and governmental entities [3]. The technological advances leading to miniaturization of components, development of lighter and stronger materials suitable for space environment, and increasing efficiency of power generation and power storage systems have led to the so-called “new space” paradigm and has ushered the new era of wider private sector engagement in space activities.
The evolution of CubeSats played a crucial role in this paradigm shift as they provided cheaper and faster ways to demonstrate novel technologies for space applications [4]. The unprecedented selection of miniaturized electronic components offering high performance at low power budget, new cost-effective photosensing technologies that are largely accessible, along with the development of additive manufacturing techniques, made CubeSats the ideal tools for the investigation of astronomical and atmospheric events involving the emission of high energy photons.
Detection of gamma-rays in space earned more and more relevance over the last sixty years [5]. This was initiated with the deployment of constellations of satellites for homeland security and nuclear proliferation monitoring, and it quickly opened a new era in science with the serendipitous detection of Gamma-Ray Bursts (GRB) [6,7,8,9,10,11,12], lately evolving into a diverse population of gamma-ray detectors already orbiting (or planned to orbit) around the Earth at various elevations to accommodate the science targets for various applications such as cosmology, general relativity, astroparticle physics, astrophysics, high energetic atmospheric physics, etc. However, most of these detectors are either bulky or require significant power making them not suitable for inclusion in small satellite missions.
Modern instruments for gamma-ray detection are often required to provide timing and spectroscopic details of collected events. This is usually achieved by instrumenting the payload with multiple and optically independent scintillating crystals coupled to a photosensing technology, that is typically based on the use of Photomultiplier Tubes (PMT), Avalanche Photodiodes (APD) and, more recently, Silicon Photomultipliers (SiPM) and Multi-Pixel Photon Counters (MPPC) and with custom designed readout electronics. Using CubeSats as platform opens up new possibilities for sending compact gamma-ray detectors in space, possibly creating constellations with the capability of detecting GRBs or other transient gamma ray emissions such as Terrestrial Gamma Ray flashes (TGFs) [13], or as atmospheric radiation monitors [14,15].
The paper outlines recommendations for a candidate detector as core instrument of (2U or larger) CubeSat missions targeting gamma-rays and orbiting in Low-Earth Orbit (LEO). This payload would be comprised of state-of-the-art sensors with pronounced spectroscopic performances (resolution of 5–10% at ) and timing (a few time resolution), that would allow detection of TGFs and GRBs and possibly function as early warning system for multi-messenger science, if operated in constellation [16].
The targeted capital investment required for the realization of the 1U gamma-ray detector payload presented in this paper is in the order of 30k USD. The technical characteristics of the satellite bus, along with operations and data streaming will also be discussed.
This paper is organized as follows. Section 2 reports the main CubeSat subsystems along with a general overview of typical mission constraints. In Section 3, the layout of a gamma-ray detector fitting in 1U of CubeSats orbiting at LEO altitudes is presented. A discussion about suitable operating scenarios for a CubeSat sensitive to gamma-rays is reported in Section 4. In Section 5, the detector simulation and the performance assessment for tagging distinctive gamma-ray events is discussed. Finally, mechanical and thermal analysis of the payload are presented in Section 6 to demonstrate the validity of the payload design to withstand launch and space environments.
2. Cubesat Specifications and Constraints
The main motivation behind developing the CubeSat specification was to develop a standard interface with the launch vehicle to deploy nano-satellites without affecting the primary payload. The P-POD, the original CubeSat deployer, was designed to hold the CubeSats safely by interfacing over sliding rails at the corners [17]. However, the popularity of the CubeSats has grown so significantly that there are now programs to develop vehicles dedicated for CubeSat launches [18].
Satellites comprise of various subsystems that are optimally interfaced to accomplish the space mission. The satellite is often treated as combination of payload and bus. The bus is designed to support the payload operation to achieve the mission objectives. The general subsystems of the bus include Mechanical System (MES), Electrical Power System (EPS), Communication System (COM), Attitude Determination and Control System (ADCS), and On-Board Computer (OBC). Other subsystems like propulsion and active thermal control may be required depending on the system requirements.
2.1. Mechanical Subsystem
The Mechanical subsystem provides structural support for the entire satellite. The materials used must have high strength and very low outgassing properties. High-quality aluminum alloys are often used. It includes the supporting frame of the nano-satellite, and supporting fixtures for various subsystems and fasteners. The structure and other mechanical components should be designed to support the entire satellite to withstand the different launch environment loads such as the quasi-static loads and the different vibrations.
2.2. Electrical Power Subsystem
The Electrical Power Subsystem provides electrical power and consists of solar cells, batteries, a power distribution unit, and a power conditioning unit. Batteries are used in tandem with solar cells to support various operation modes. Lithium-ion batteries are widely popular in nano-satellites, as they have higher energy densities [3]. Commercial vendors are providing solar cells with more than 30% efficiency and a variety of configurations including body-mounted panels and deployable panels [19]. For missions requiring more power, deployable solar panels are preferred.
2.3. Communication Subsystem
The Communication Subsystem is used to establish communication between the satellite and the ground station. Early educational satellites primarily utilized amateur frequencies in the very high frequency (VHF) and ultra-high frequency (UHF) ranges with a maximum data rate of 9600 bps. Considering that a satellite operating in the low-Earth orbit (LEO) has a line of sight contact with the ground station roughly of the order of around 10 min, the total data that can be downlinked is less than 1 MB and should also cater to the requirements of obtaining satellite telemetry data.
For missions requiring more capacity, commonly S-band transmitters offering data rates of 0.5–2 Mbps are normally used. Some advanced S-band transmitters can provide up to 8 Mbps. X-band transmitters are utilized in missions requiring very high data rates (>50 Mbps).
However, power requirement can be prohibitively high for utilizing X-band transmitters in constrained systems like CubeSats. Higher frequencies such as Ku-band are also being utilized mainly on an experimental basis [19].
2.4. On-Board Computer
The On-Board Computer operates and controls the satellite by handling multiple parallel tasks and functions, depending on the operation modes. The OBC interfaces between the subsystems and controls the data flow. Typical data bus architectures like I2C, UART, and CAN are often used for the communication between OBC and subsystems. High-speed bus architectures like CAN are preferred for missions requiring high data rate and high data volume communication with the OBC.
2.5. Attitude Determination and Control Subsystem
The Attitude Determination and Control Subsystem consists of sensors that determine the attitude, and actuators that control it to point in the required direction. Attitude determination requires the usage of external references, such as the sun, Earth’s horizon, stars, and the local magnetic field, and the corresponding sensors are used as per the accuracy requirements. High-speed gyroscopes are also used to provide a short-term spin rate along different axes. Different reference measurements must be used to accurately specify the orientation of a CubeSat; therefore, multiple sensors are used simultaneously [20]. Actuators, such as magnetorquers and reaction wheels, are employed for attitude control.
The attitude determination and control has in general a critical impact on the satellite operations, for example, to maximize the solar energy collection, to fulfill the requirements of directional data transmission systems, and to comply with the scientific requirements of the mission. The detector layout presented in this paper does not require the finest attitude satellite determination and control; however. its knowledge might be relevant for specific searches (for example for TGF science). As reported in Table 1, the attitude control accuracy is typically within 1 deg.
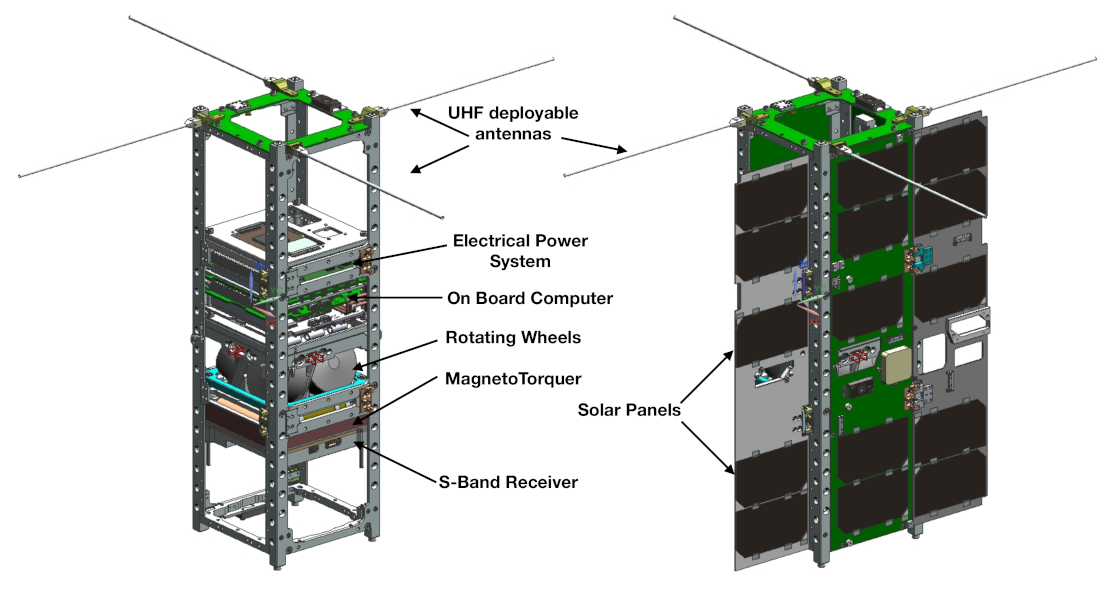
Figure 1 shows, as an example, the LIGHT-1 3U CubeSat mainframe. LIGHT-1 (former RAADsat [21]) is the United Arab Emirates mission aiming at detecting Terrestrial Gamma-Ray Flashes and expected to be launched by the end of 2021.
Vendors now provide highly standardized Commercially Off-The-Shelf (COTS) components and platforms [19]. Being smaller in size and with several design constraints, CubeSats have only a limited capacity to support scientific missions requiring significant resources in terms of mass, volume power, and data rates. Table 1 summarizes some constraints and approximate available resources for payloads. Only 3U, 6U, and 12U are chosen for comparison based on the requirements of the payloads proposed in this work.
3. Gamma Radiation Detection Strategy and Reference Detector
Given the limited resources available on-board a CubeSat spacecraft, the detection strategy must be carefully designed by taking into account mission weight and size budgets, power limitations, orbital characteristics (radioactivity and temperature variation), and the gamma-ray energy range of interest.
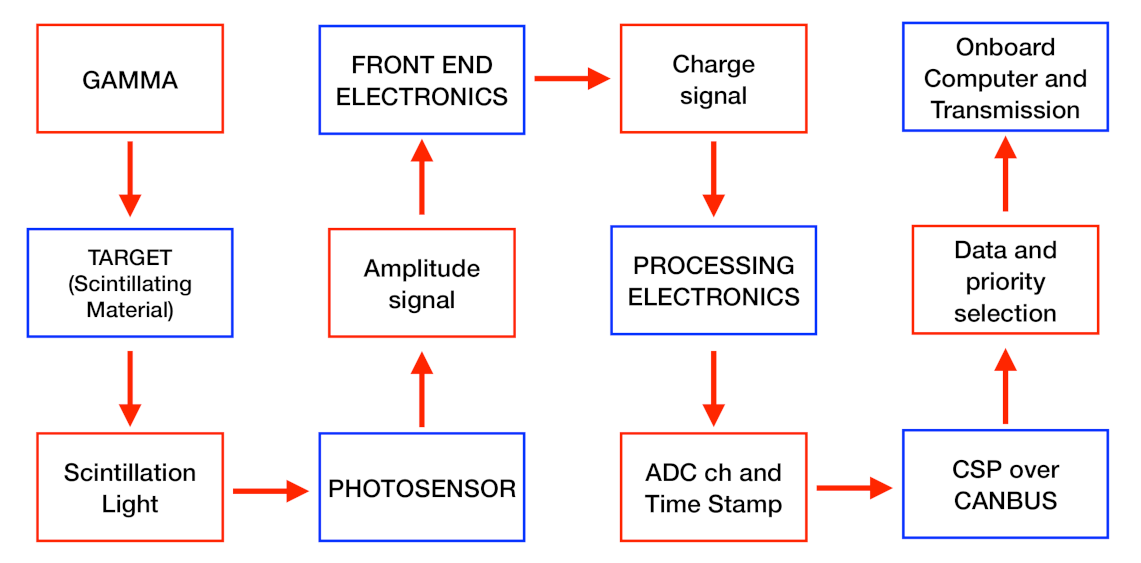
In this paper, we present the case of a gamma-ray detector with spectroscopic capability over a wide energy range (from 20 keV up to tens of MeV) and sub-microseconds event time stamping. The basic operations are illustrated in the flow chart reported in Figure 2.
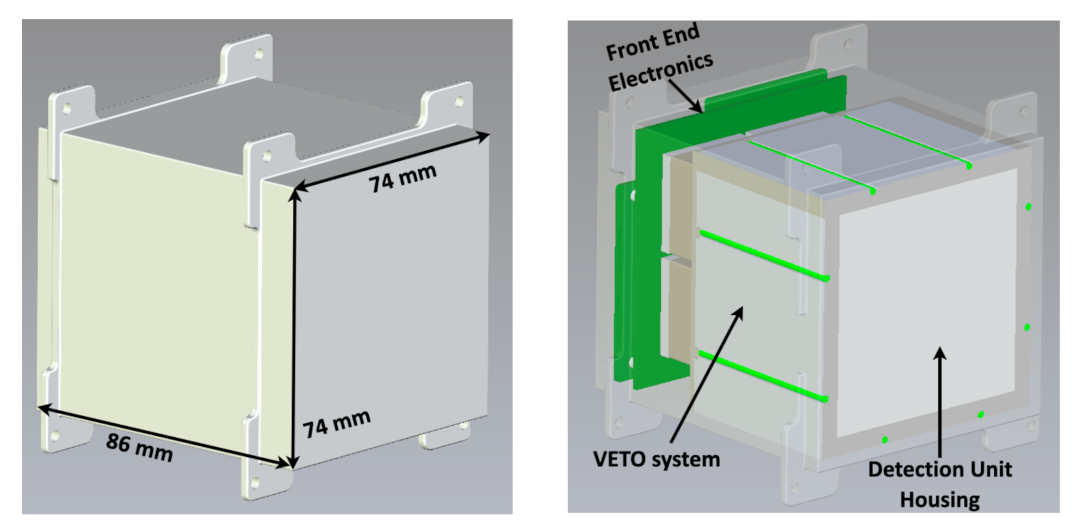
The reference gamma-ray detector is housed in a thick wall aluminum box as shown in Figure 3 and fits in volume of a CubeSat frame.
For a payload fitting in volume, the overall mass unit should not exceed , however small deviations are possible, depending on the launch vehicle. The overall weight is in general constrained by the characteristics of the deployment mechanism.
It is generally a good practice to implement redundancy features, especially for CubeSat missions where the failure rate is sensibly higher than standard space missions. When possible, it is therefore recommended to use multiple detection units rather than one single channel. The core of the gamma-ray detector presented in this paper is shown in Figure 4. It consists of a detection array of four optically independent scintillating crystals, each one of dimensions, encapsulated in an aluminum casing with overall dimensions of and equipped with a 2 mm thick quartz window for the photosensor coupling. In order to tag charged particle-induced events, a rejection layer (VETO) made out of 5 mm thick plastic scintillator tiles coupled to ASD-NUV1C-P-40 SiPM (manufactured by Advansid) has been introduced (see Figure 3 Right).
3.1. The Detection Target
In this section, we present the performance offered by different choices of scintillating crystals considered for building the detection target. Table 2 reports a selection of possible target candidates, along with their main characteristics.
For a given volume, the higher the density, the more efficient is the detector. However, higher densities translate into heavier payloads. Given the weight constraints typical of a CubeSat missions, the use of heavy targets could prevent the usage of other satellite subsystems. It is therefore necessary to determine the best trade-off between the required detection capabilities of the science case and the needs of the supporting infrastructure functional to the mission operations.
The intrinsic radioactivity can also be a nuisance parameter when operating a gamma-ray detector on-board a CubeSat mission. An internal conversion would mimic a gamma-ray interaction (the typical event in which there is no VETO fired and energy deposited in one or more target channels). A standard technique in order to kill this contribution consists in building up a series of coincidence patterns between two or more detection channels.
However, due to power constraints and the limited number of detection channels that can be operated in a CubeSat, this approach can possibly affect the overall detection capabilities of the instrument, especially when the science case demands for single gamma-ray observations.
Hygroscopy is a key parameter to look at when selecting the scintillating crystal as target for the detection unit. Although the satellite operates in high vacuum environment typical of the orbit, the handling process of an exposed hygroscopic crystal must be approached with extreme care and as minimal condition, nitrogen or dry air atmosphere is required at each step of assembling and testing. This of course poses an extra layer of complexity in terms of instrument design, assembling procedure, operations, and realization costs. Nevertheless, hygroscopic crystals can be used when encapsulated in metal boxes (usually aluminum) and sealed by a transparent quartz window for the photosensor coupling. This of course has an impact on the overall weight of the payload and in the hardware detection threshold of the gamma-ray detector that increases because of the thickness of the passive material. On the other hand, the use of encapsulating enclosures offer several advantages if compared to bare crystals: it improves the mechanical robustness of the core detector and protects the deployment mechanism and the satellite subsystems in case of major accidents (for example, breakage and fragmentation of the crystal), preventing the spreading of debris.
In order to assess and compare the detection efficiency of a selection of suitable targets, a GEANT4 simulation has been performed.
An event in which a gamma-ray crosses unseen by the VETO and interacts with the target, is considered detected. The efficiency is therefore evaluated by measuring the ratio between the detected events and the total number of events entering the payload.
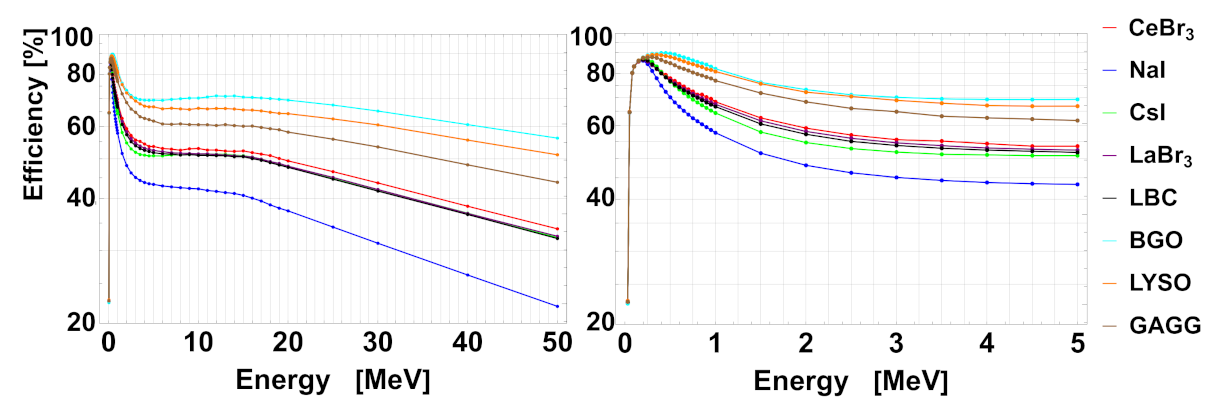
Figure 5 shows the detection efficiency as a function of the energy of a detector equipped with different scintillating crystals.
As expected, the efficiency detection depends on the physical properties of the target (density, atomic number, etc.). Below , the largest fraction of gamma-rays gets absorbed by the surrounding passive materials.
For a NaI (BGO) target, the efficiency curve shows a maximum value of () at around () and becomes () at . At highest energy, the apparent efficiency drop is mainly due to the high penetration power of gamma-rays and to the interactions of secondary particles with the VETO, mimicking a charged particle induced event.
3.2. Photosensors
To scrutinize and select the appropriate photosensing technology for the mission, the detector parameters must be carefully evaluated and contextualized based on the typical constraints (power consumption, size and weight, reliability, and compatibility to space environment) posed by CubeSat missions. A typical choice is the use of standard, compact Photomultiplier Tubes (PMT). Recently, a more compact, lightweight option has been made available through Multi-Pixel Photon Counters (MPPC) or Silicon Photomultipliers (SiPM). For the purpose of this paper, the two sensing technologies have been evaluated.
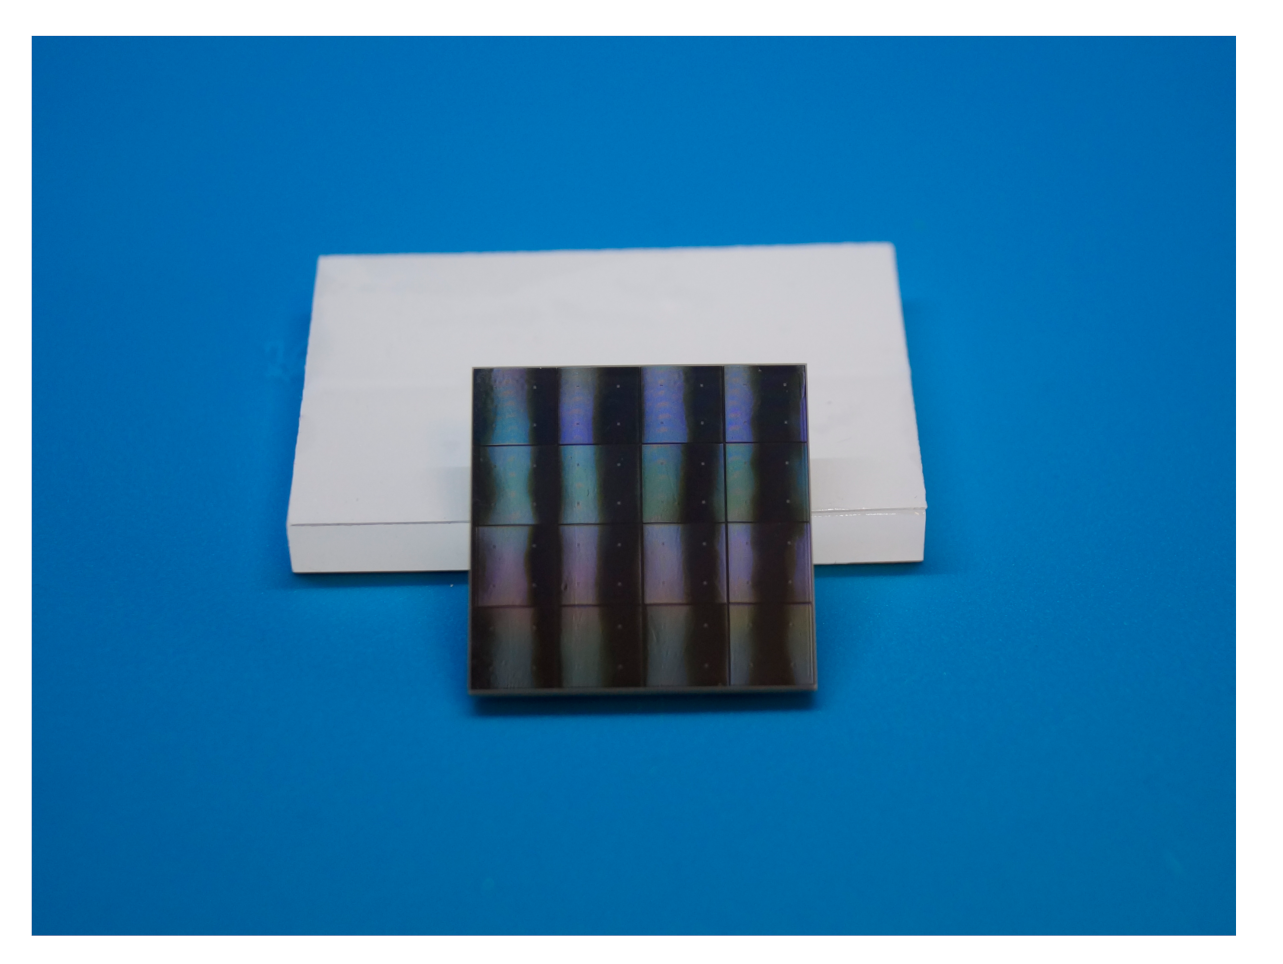
To obtain an efficient mechanism of light collection and energy conversion, the spectral sensitivity of the ideal photosensor is required to match the emission spectrum of the scintillating target. Nowadays, most of the manufacturers can provide devices sensitive to a wide range of wavelengths. For example, the typical spectral response of the Hamamatsu S13361-6050NE-04 MPPC series (Figure 6) is in the range of 320 to 900 nm and peaked at .
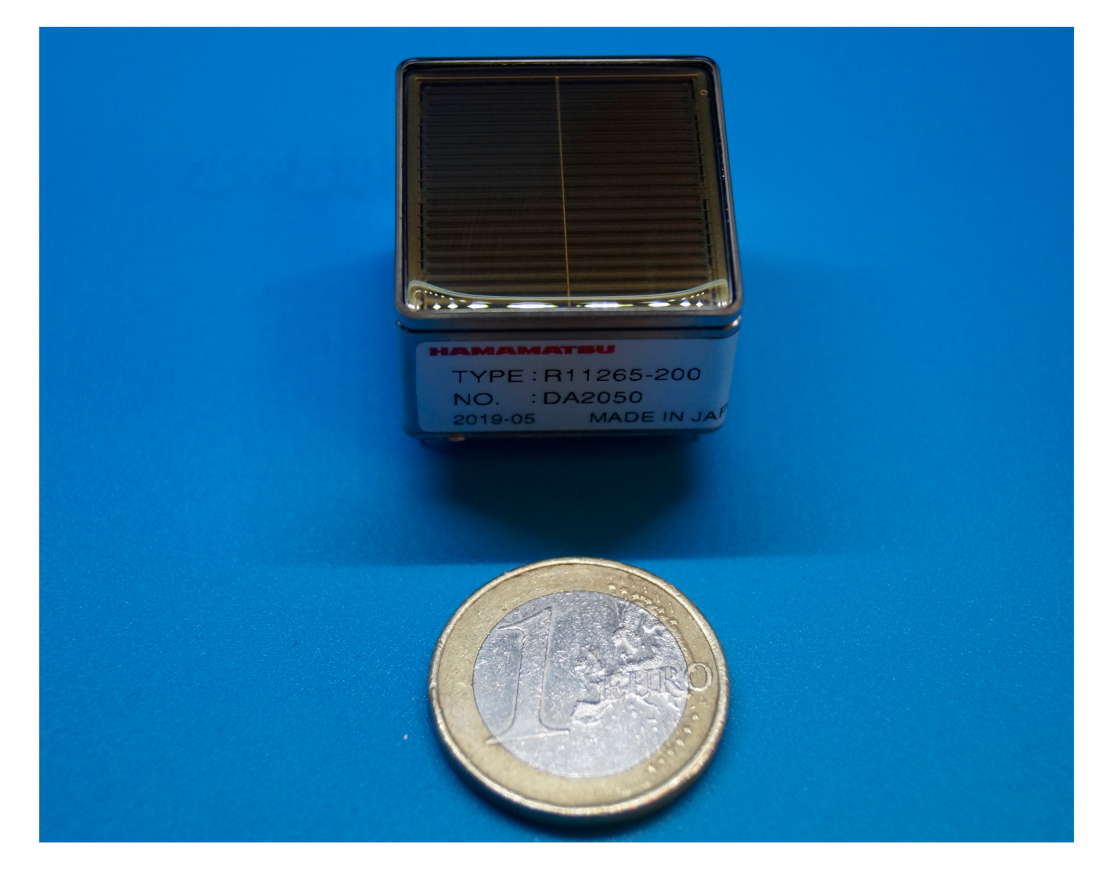
Narrower spectral responses are typical of PMTs instead: the Hamamatsu R11265-200 (in Figure 7) is sensitive to 300–650 nm, with maximum sensitivity at .
In Table 3, the most relevant device parameters are reported. From the optical point of view, both PMT and MPPC offer very similar performances. However, due to the stringent mission requirements, their intrinsic characteristics need to be carefully investigated.
The physical properties of the device can play a role in constraining the size and weight of the target. For the reference detector under discussion, a R11265-200 PMT-based readout would take 12% of the available volume, contributing with about ∼100 g to the overall mass budget, posing severe constraint on the selection of the target in terms of size and weight. The lightness and compactness of S13361-6050NE-04 MPPCs instead make this device the ideal choice when heavier and larger detection targets are needed.
From the mechanical point of view, a MPPC might be the ideal candidate for a gamma-ray detector mounted on a CubeSat spacecraft; however, its electrical and physical properties pose severe limitations on its use. The major concern when operating a MPPC is the Dark Counting Rate (DCR) that can easily be of the order of several per detection channel at room temperature and at operating conditions (typically a few V above the breakdown voltage). Afterpulses (AP) and Crosstalk (CT) typical of such kind of device might contribute in worsening the detection performance too.
A further aspect to take into account when operating MPPCs is the variation of the functional parameters with temperature: as a consequence, a temperature-driven feedback is recommended in order to prevent strong gain fluctuations along the various region of the orbit. Although this action can happen at the level of the spacecraft operations by implementing an active system to control and stabilize the payload temperature, the CubeSat power constraint forbids the use of such adaptive control. Therefore, a more sustainable approach is to actively correct the biasing voltage implementing the temperature feedback at the level of payload electronics. Note that DCR strongly depends on the temperature variations and cannot be constrained by implementing actions based on temperature feedback.
One additional key parameter to be taken into consideration is the power supply system used to operate the photosensors. In this respect, the use of MPPCs is generally smoother because these devices are typically biased at less than 60 V. The use of PMTs instead is in general considered risky because high voltage is required to operate the device and to reach adequate gains. In order to operate PMTs in space environment, safety actions to prevent and mitigate electric discharges must be implemented. Electrical arcing might be facilitated by the satellite components outgassing in presence of high electric fields or by high ionization due to exceptional radiation intensity typical of specific regions of the orbit such as South Atlantic Anomaly.
Nowadays, off-the-shelf products suitable for aerospace applications are largely available; however, the choice needs to reflect the specific requirements of the payload. The Momentive RTV615 is a clear silicon rubber compound that offers high dielectric strength (), low viscosity that allows for an easy pouring and low density () for easing the constraints on the mass budget, and it is vibration-tolerant and flexible at the lowest temperature (down to ).
While the Momentive RTV615 can be a good encapsulating option for most of the applications, it is possible that the heat generated in the payload board needs to be dissipated or radiated outside. The Epoxies 50-3185 NC (cured with Catalyst 30), a filled epoxy composite, is an excellent option when the application requires an encapsulant that offers high dielectric strength (), optimal mechanical properties and vibration tolerance, and high thermal conductivity (). However, its fairly high density () can pose restrictions in its use when mass budget is concerned. The use of encapsulants is generally also recommended for improving the mechanical stability of the payload subjected to the vibration stress typical of the launch phase.
3.3. Readout Electronics
Both front end (FE) and controller (CTRL) electronics must be able to operate in the typical conditions of the space environment, even though with less stringent operative standards compared to longer life, higher altitude missions.
The main characteristics of custom designed electronics for the instrumentation of a payload of CubeSat missions are
- low cost,
- low power operation,
- temperature compliant components (),
- rad-hard components when possible, and
- vibration-tolerant components (i.e., automotive standard).
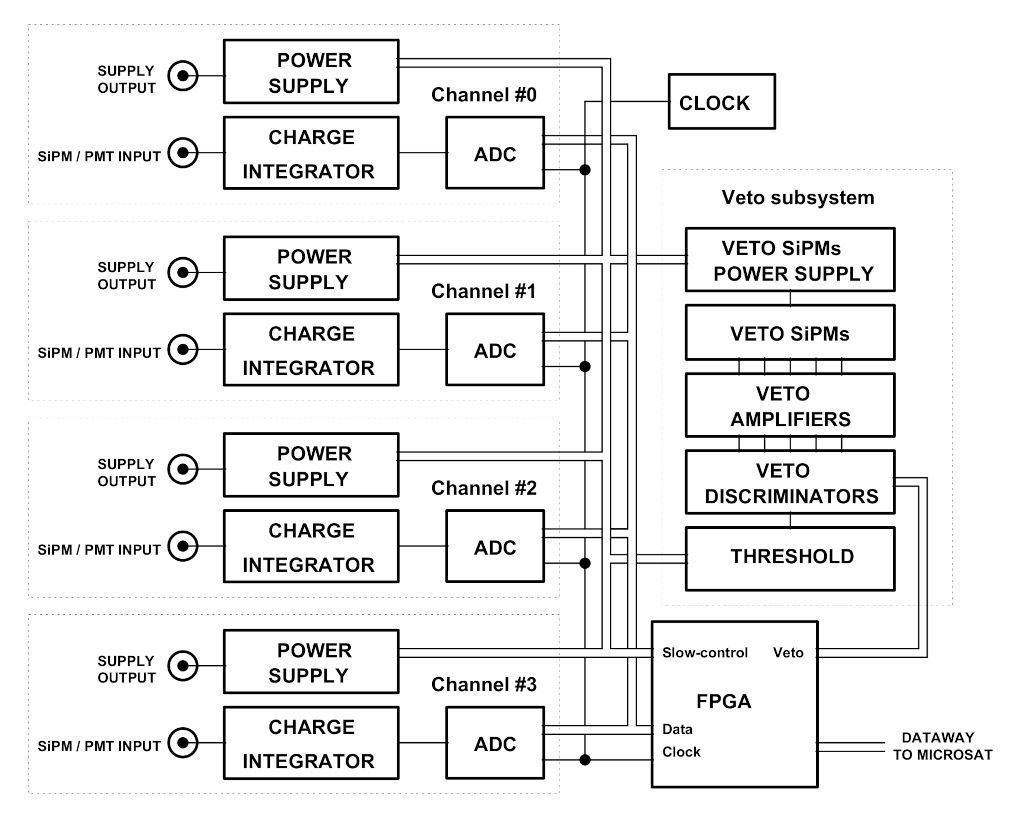
Based on the aforementioned, the electronics concept adopted in this paper is reported in Figure 8.
The proposed electronics is designed for charge integration and time stamping of the signal generated by a photosensor, with the charge proportional to the energy released in the event. It must also be able to assign an event priority based on the science case and to tag nuisance events (i.e., charged particle interactions). The power supply circuit needed to operate the photosensor array is embodied in the PCB and actively controlled through a slow-control system continuously running.
The use of waveform digitizers capable of coping with the typical time response of MPPCs and PMTs would require a high sampling rate (order of ∼1 GS/s), and so it would have a higher power requirement which may not be available due to the constraints in CubeSats. Measuring the charge becomes a viable option. The charge integrators (CI; one stage per each photosensor) need to be designed according to the required sensitivity, energy dynamics and decay-time tailored around the time characteristics of the scintillator - photosensor choice. Each CI produces a charge signal output that is in turn sampled (at few tens of ) by an Analogue to Digital Converter (ADC). To get the charge value (proportional to the energy released in the interaction) and the event time stamp, the ADC digital output must be processed and evaluated by an algorithm running at the FPGA level.
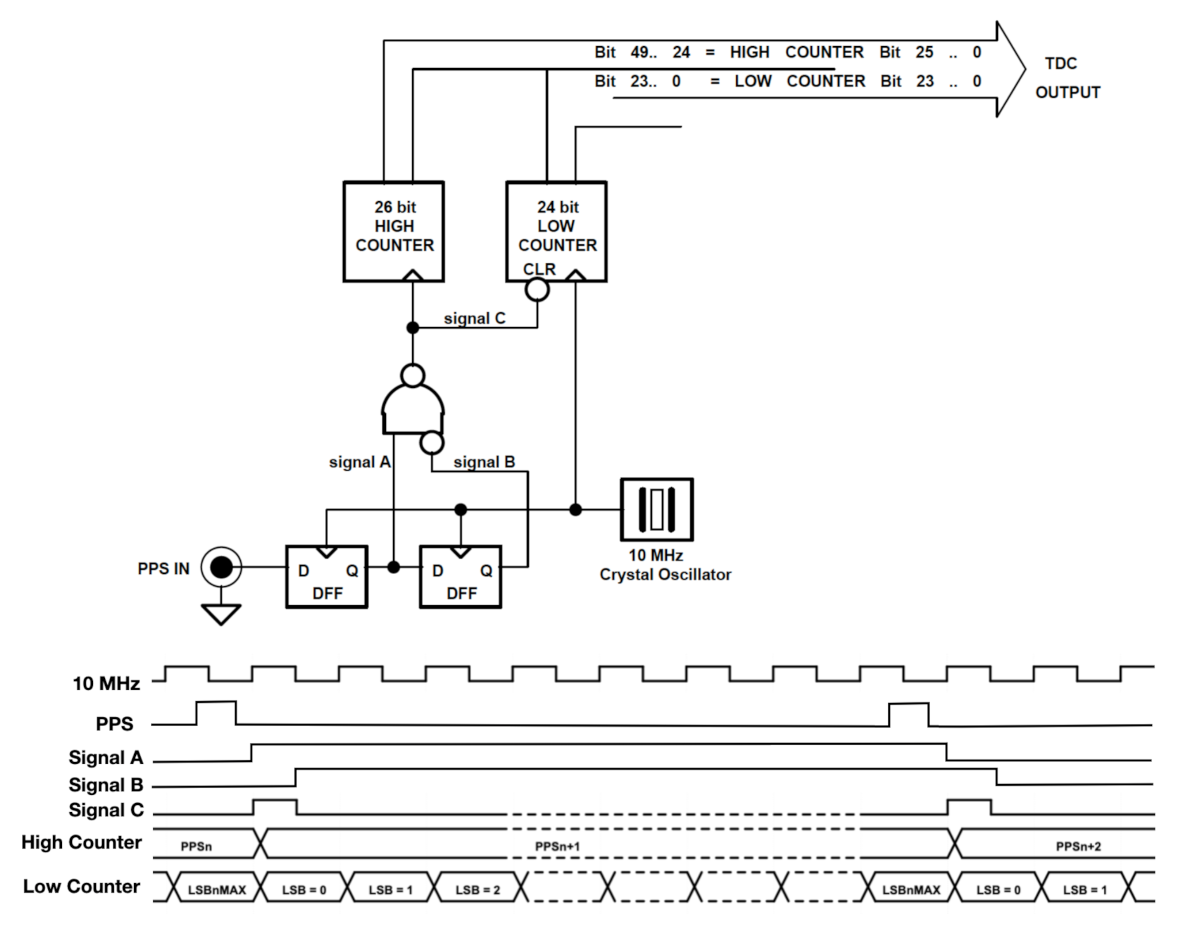
In order to be able to assign an event time stamp at microseconds resolution, an high-precision clock of the order of tens must be distributed to the payload electronics. This can be easily achieved by implementing an oven-controlled quartz oscillator, or by embodying a compact atomic clock. Both options are viable if power and cost budget allows, however for CubeSat missions it is unlikely that several watts could be invested for this task. A possible power saving solution is to implement and distribute a disciplined clock, by means of a control system, namely, a Phase-Locked Loop (PLL). The typical PLL generates an high-frequency output from a low-frequency reference. A suitable timing circuit concept is based on a PLL making the use of the low-frequency () Pulse-Per-Second (PPS) hardware signal obtained from the spacecraft GPS receiver coupled to a oscillator.
A schematic layout of the disciplined clock circuit is reported in Figure 9.
The time stamp of each event is expressed by the arithmetic sum of values of two different counters, a 26-bit counter (High Counter (HC)) measuring the numbers of the PPS cycles and a 24-bit counter (Low Counter (LC)) for the number of output oscillator clock cycles (each clock cycle lasts 100 ns) in one PPS.
The typical PLL brings in a systematic phase noise error due to the precision of the high- frequency oscillator (evaluated in parts per million, PPM), while the PPS signal has an intrinsic precision of 1 ns (i.e., ), the typical precision of off-the-shelf low power oscillator is 15 PPM. In this configuration, the maximum error per each PPS cycle is 15 s: note that the error does not accumulate. As shown in Figure 9, signal C realigns the phase of the output oscillator every PPS cycle.
According to the characteristics of the proposed circuit, the ultimate time corresponding to the last second of mission will be 67,108,864 s, about 776 days: a duration compatible with the typical lifespan of a CubeSat mission in low-Earth orbit with less than 450 km altitude.
3.4. Matched Filter for Signal Discrimination in Low Power Applications
As previously mentioned, a critical aspect in operating standalone gamma-ray detectors in CubeSat missions is represented by the capability of extracting the meaningful waveform parameters (arrival time, charge, and amplitude) in very low power regime. In this section, the signal discrimination based on a matched filter circuit and its implementation is presented. Matched filters [22], widely used in many domains of science and technology such as radio communications, radar, and image processing, are linear filters that maximize the signal-to-noise (S/N) ratio in presence of random fluctuation that cannot be modeled (i.e., white noise). Matched filter algorithms for signal discrimination can be digitally implemented on FPGAs and run continuously to extract the topical parameters of a signal.
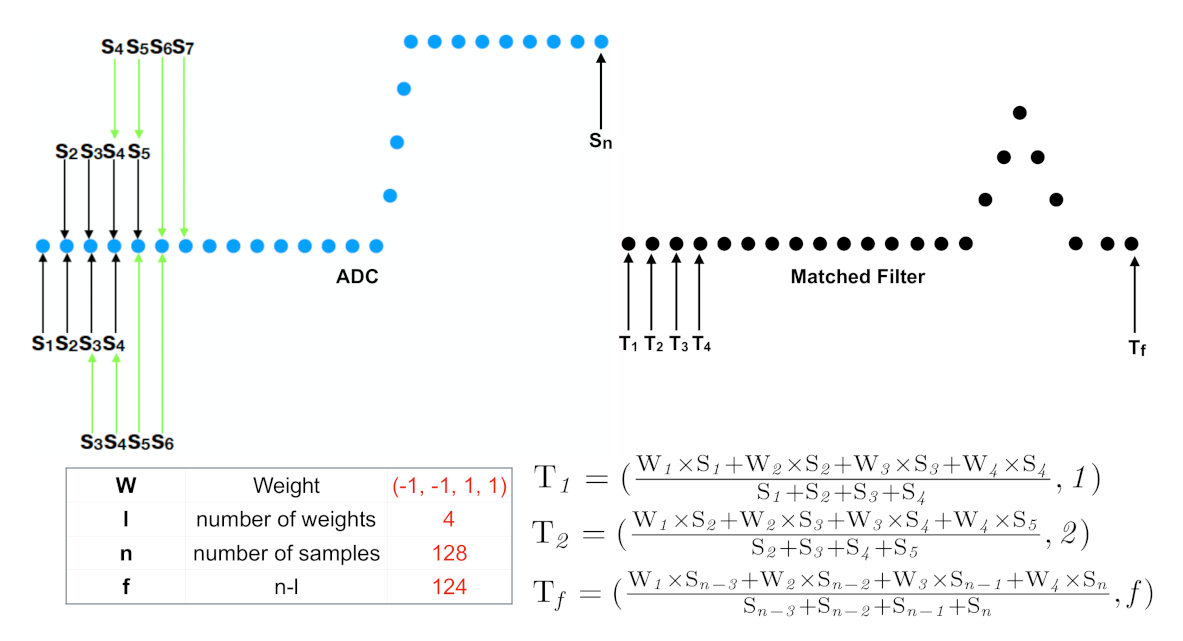
As mentioned in the previous section, the amplitude signal (Figure 10A) generated by a photosensor is integrated and the charge waveform is sampled at by the ADC (Figure 10B). The ADC output is in turn passed to the matched filter stage and a digital output is produced, as reported in Figure 11.
The digital output consists of a sequence of pairs of values generated through Equation (1) that defines the matched filter algorithm.
where is the weight array, k is the sample number of the matched filter output, and is the array of the four consecutive ADC samples ().
An online peak finder algorithm running at the FPGA level extracts the position (in units of number of samples) and the value of the peak, respectively, corresponding to the event time stamp and to the energy released in the interaction.
In order to evaluate the S/N ratio, a set of PMT waveforms generated by a release of energy of has been simulated and a white noise added (see Figure 12A). The same set of waveforms is then integrated (Figure 12B) and the matched filter applied (Figure 12C). The signal-to-noise ratio is finally inferred from the histogram reported in Figure 12D, where the distribution of the ratio between the maximum value and the standard deviation of each waveform in Figure 12C is reported. In the presented framework, the obtained S/N value is about 6.
The proposed approach has been implemented in a GEANT4 simulation used to evaluate the detector performances and discussed in Section 5.
4. Operating Scenarios
One critical task operating CubeSat missions consist in carefully defining operating scenarios (or operation modes). Given the power and budget requirements, the communication with ground stations is generally constrained to a few minutes per day, and therefore the payload might not be interactively operated.
To put things into perspective, a CubeSat deployed from the ISS (average altitude at 51.6° inclination) would complete an orbit in about 93 min (about 15 orbits per day) and in average one passage per day above the mission ground station (maximum transmission time window of about 10 min).
The typical CubeSat (with no active propulsion) orbiting at ISS altitude can have a lifetime of up to 1.5 years [23].
For most of the missions operating in similar orbits, a payload switch off might be required, for example, in proximity of high radiation regions, such as the South Atlantic Anomaly (SAA) [24] and during Polar transits [25], where the Earth’s magnetic field does not offer an effective shielding against cosmic rays.
The typical operating mode of the payload passing through the SAA, can be outlined as follows.
- The OBC continuously checks the GPS coordinates and, if in proximity of the SAA, it issues a command that will ask the payload to run the internal powering off procedure (ramping down the photosensor voltage biasing, storing the current payload operating configuration, and registering the time of the event).
- The Payload acknowledges the reception of the command and once ready for the powering off procedure, issues a command to the OBC to cut the biasing lines. From this moment onward, the payload is unresponsive and needs to be rearmed by the OBC to restart its operations.
- The OBC periodically checks the GPS Coordinates and once the spacecraft got over the SAA, it powers on the biasing lines. The payload automatically restarts. In order to protect the photosensors, the bias ramping up is subject to a series of functional conditions: the particle rate measured by the VETO is below a given threshold and the payload electronics temperature is within the operating range.
- Once the conditions are satisfied, the payload electronics will operate the procedure to ramp up the detector bias according to the last operating scenario uploaded.
The position of the CubeSat along the orbit can be also predicted by taking into account the characteristics of the environment (altitude, dragging, solar activity) and the satellite attitude determination. It is also possible to pre-load mission time windows in which the satellite is required to activate specific functionalities (i.e., powering off or on the payload). This technique can be either alternative to the GPS crosscheck, or used in combination in order to increase redundancy.
Of course, each operating mode has to be strengthened by layers of redundancy for example by coding multiple commands producing the same effect to the payload, time delay between consecutive operations, and by designing very similar operating scenarios. Once implemented the final release of the software in the flight model, it is a good practice to reproduce a series of consecutive orbits, for example, by operating the CubeSat in a Thermo-Vacuum Chamber (TVAC), simulating the orbital conditions at a given mission epoch and validating the operating scenarios.
Further steps regarding risk mitigation can be considered, especially when the payload performance strongly depends on the environmental conditions, such as for a gamma-ray detector immersed in a charged particle background and subject to a rapid variation of temperature. A viable solution concerns the ability to reconfigure the payload from ground, by uploading a suitable scenario that copes with the orbital conditions. This action requires a solid review process and debugging procedure: to mitigate the failure risk, each new scenario should be beforehand validated on the engineering model (equivalent to the flight one) and, once commissioned, uploaded from the ground station to the satellite.
5. The Geant4 Simulation for the Detection of Short Burst of Gamma-Rays
In order to evaluate the performance at regime operation of a detector orbiting for example at ISS orbit, a GEANT4 simulation (version 10.4 with “FTFP_BERT” physics list implemented) has been used to generate the particle events and the detector signals has been processed by means of a customized Mathematica algorithm based on the procedure presented in Section 3.4.
The cross section of detector used in the GEANT4 simulation is reported in Figure 13.
To determine the expected scientific and technological output of the mission, a critical task is to assess the ability of the instrument to detect high intensity and sub-millisecond bursts of gamma-rays (fluency of the order of ) with energies up to tens of MeV.
The major goal of the simulation is to demonstrate that it is possible to discriminate such featured events from the particle background. This is further evaluated by performing a simulation with SPENVIS [27], an open source tool developed by the European Space Agency (ESA) and optimized to model the particle background at a various orbits and solar activity conditions. Nowadays, a diverse software portfolio is available for modeling the expected particle background at given orbit. An example is the Satellite Tool Kit (STK) developed by AGI, which is a comprehensive software capable of modeling and simulating various mission components. The STK package dedicated to the particle background analysis is SEET (Space Environment Effects Tool) [28].
The background model proposed takes into account the effect of trapped protons and electrons (isotropically distributed) and extra-galactic photons (impinging only five out of six detector faces due to Earth shadowing), while the contributions of albedo photons and galactic cosmic rays are not considered. High radiation intensity areas (South Atlantic Anomaly and Polar regions) encountered along the orbit are not taken into account in the simulation as the instrument is in power off mode.
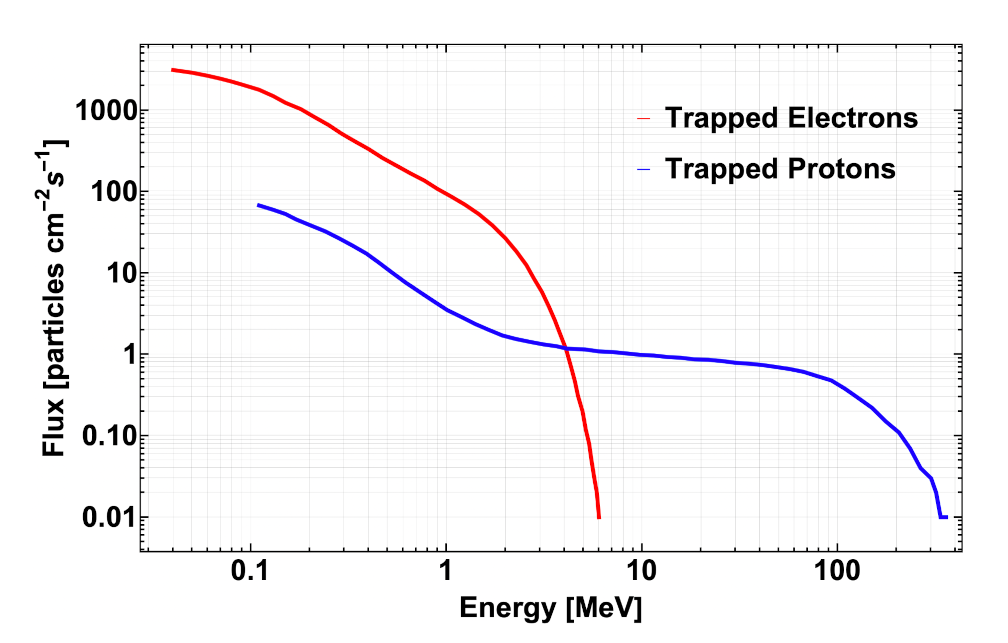
The typical trapped proton and electron spectra for ISS-like orbit () are reported in Figure 14.
The procedure to create a more refined background model as a function of the position in the orbit is reported here [32].
A thorough paper that accurately discusses the particle background of a given orbit as a function of the satellite position is currently under review [33].
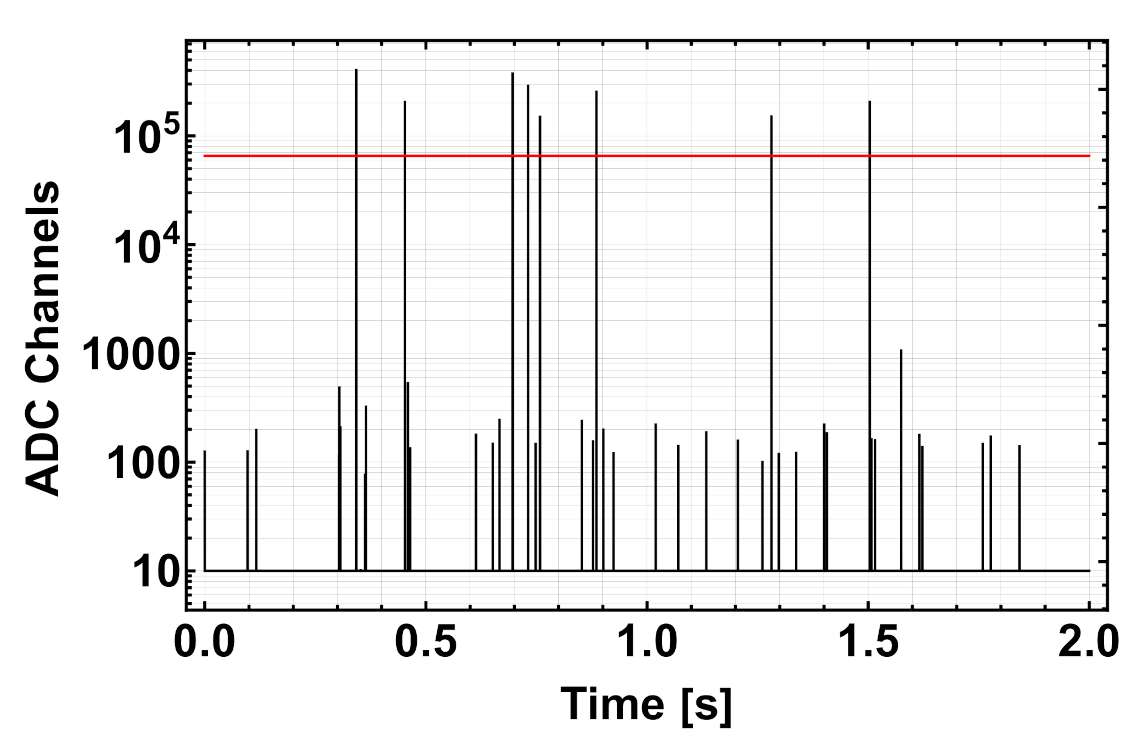
Charged particles and extra-galactic photons contributions have been used to build the average background environment corresponding to about 5000 s of detector operations (1,000,000 of events). The expected response of a detection channel during the first 2 s of mission is shown in Figure 16. The height of each spike (expressed in ADC channels) is proportional to the energy released in the interaction. The highest peaks correspond to the energy released by protons in the target, while the lower ones are mainly due to gamma-ray and electron interactions with the target. By measuring the number of spikes over the time, an average interaction rate of 30 Hz for CH1 and CH2 can be inferred (slightly less is the rate for CH3 and CH4 due to Earth shadowing against extra-galactic photons).
To prove the discrimination capability, a 175s duration event consisting of eight gamma-rays generated in the energy range between 30 keV and 30 MeV has been used to contaminate the pure background spectrum.
In order to reject background events, a selection of data reduction rules has been applied to the 1,000,000 event sample. Table 4 shows the data reduction protocol and its effect.
The expected event signature consists of multiple gamma-ray interactions characterized by no energy release in the VETO and at least one detection unit fired with deposited energy less than 30 MeV (for higher energy depositions, the electronics is expected to saturate), and detected within 1 millisecond time window span. By using the set of data constraints presented in Table 4, the event is localized in time, within the 1 ms time window. Figure 17 shows the signal output for each detector channel in correspondence of the event.
The number of gamma-rays can be inferred by counting number of peaks in each quadrant, while the energy released in the interactions is proportional to the peak amplitude.
The two highlighted peaks (red star) in CH3 and CH4 correspond to two gamma-rays simultaneously detected: in this case, either the arrival time delay between two gammas is less than 100 ns (the minimal time granularity corresponding to the 10 MHz ADC sampling rate considered in the simulation) or a gamma-ray interacted via the Compton process in one channel and eventually released energy in the other. This latter option has been confirmed by looking at time structure of the event used to contaminate the background sample.
Note that the number of gamma-rays ultimately detected (6) is less than the ones emitted at the source (8): the details of the simulation confirm that the first missing gamma-ray has been absorbed by the passive material shielding the target, while the second passed unseen through the detector.
By randomly changing the event features, the discrimination efficiency provided by the reduction data protocol presented in Table 4 has been assessed and it is larger than .
6. Mechanical and Thermal Analysis
In order to assess the payload resilience to mechanical strains and to predict its thermodynamic behavior, modal and thermal analysis are in general recommended. The goal of the modal analysis is to reveal possible resonant frequencies that could damage the payload during the launch phase.
The goal of the thermal analysis is to assess the temperature variation of the satellite components along the orbit and to highlight possible overheated regions that could bring to an emergency shut down in order to mitigate the risk of failure.
In this section, the modal and thermal analysis, both developed under Siemens NX Design software, is presented. As the simulation using finite element method is highly demanding in terms of computation, a simplified rendering of payload and the other subsystems is often required. In order to get meaningful insights from the simulation, material details along with physical properties must be preserved.
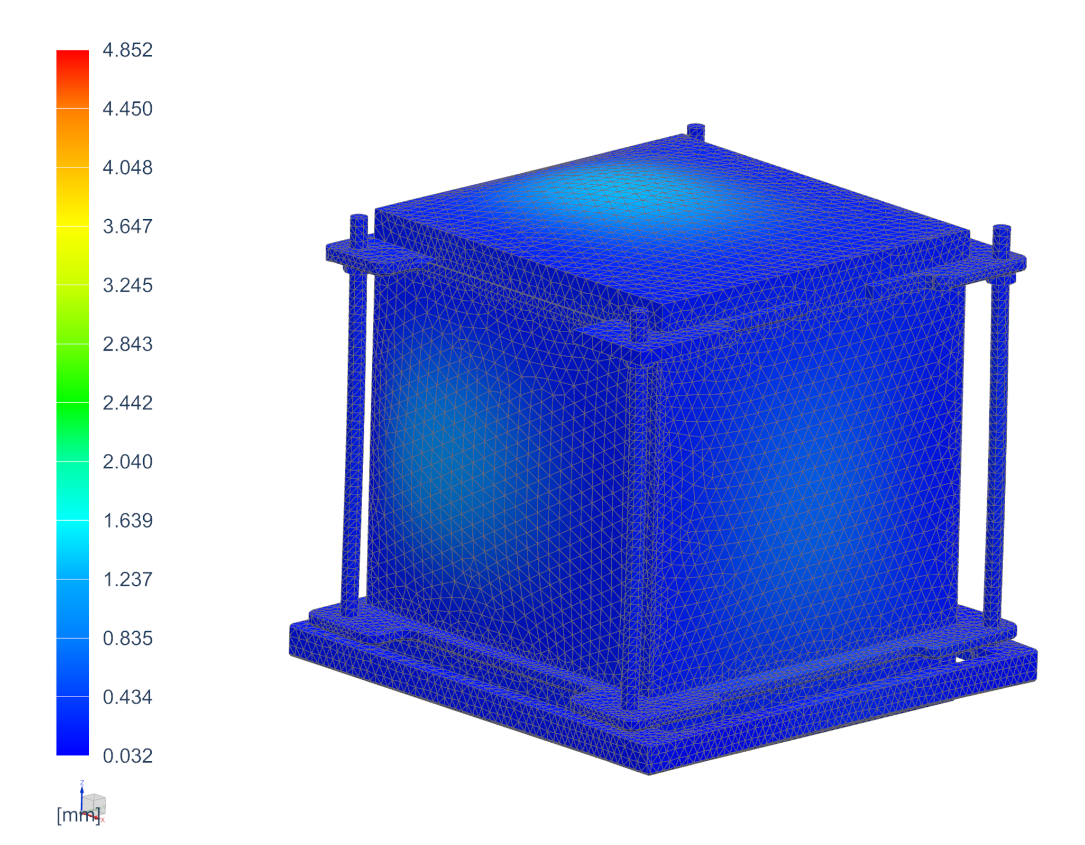
Concerning the modal analysis, the payload has been fixed to eight anchor points and connected in pairs by means of threaded bars as visible in Figure 18.
The analysis generated the first ten natural frequency modes of the system: note that only the lowest frequency (1153 Hz) falls under 2000 Hz, which is the upper limit of the typical vibrational profile of the launching vehicle [34]. Requirements and limits for the vibrational characteristics of the payload depend on the launcher; however, the first natural mode should not appear below a few hundred Hz (typically < 200 Hz) and normal mode frequency should not shift more than before and after vibrational tests [35].
To provide a comprehensive thermodynamic analysis for the payload, the whole satellite should be taken into account in order to correctly model the heat exchange among subsystems. In the thermal simulation presented here, a simplified version of the LIGHT-1 satellite (see Section 2) has been considered.
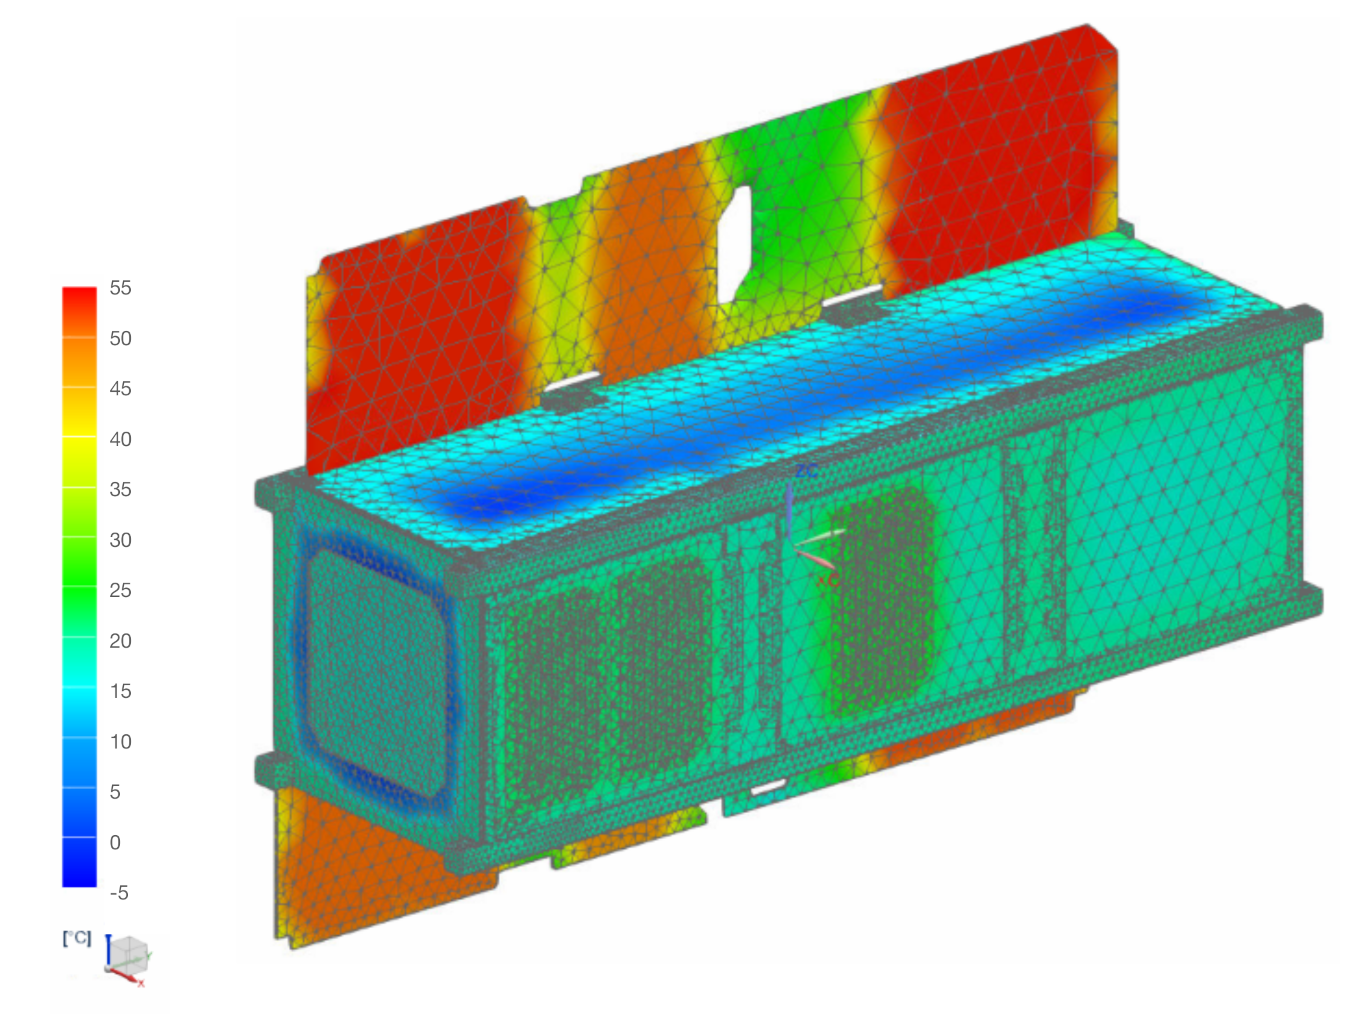
Figure 19 shows the temperature distribution on various subsystems of the satellite after completing the first orbit. The expected heat generation of each subsystem has been considered.
In this specific case, the temperature span is within the typical temperature operative range () of a CubeSat spacecraft and therefore no active cooling or heating system shall be required, leaving the overall mission power budget unaffected.
7. Conclusions
CubeSats have inaugurated a new era to access space in faster and cheaper ways compared to more structured and standard space missions, and opened the door for new science probes for understanding the dynamics of the universe by detecting particles. In the future, detectors on board CubeSats will be the new tools for targeting a quite diverse science program including the study of GRBs, Gravitational Waves, High-Energy Atmospheric Physics, assessment of the orbital particle background, and the localization of high energy astrophysical sources. This paper reviews the design constraints of a payload sensitive to gamma-rays in the 20 keV up to tens of MeV energy range and able to operate on-board a 2U (or larger) CubeSat spacecraft. The capital investment for the construction of such instrument is in the order of 30k USD, whereas the total expenditure, launch included, is about ten times more. The satellite bus elements instrumental for the operation of the payload have been discussed, along with constraints and requirements posed by CubeSat missions. The overall effort is relatively cheap compared to bigger missions, making it possible for an average size university department to place a real scientific instrument in orbit.
Author Contributions
Conceptualization, F.A. and A.D.G. methodology, A.D.G.; software, A.D.G.; validation, A.D.G. and P.M.; resources, F.A. and P.M. data curation, A.D.G.; writing—original draft preparation, A.D.G.; writing—review and editing, A.D.G. and F.A. supervision, F.A.; project administration, F.A. and P.M.; funding acquisition, F.A. and P.M. All authors have read and agreed to the published version of the manuscript.
Funding
This research received no external funding.
Institutional Review Board Statement
Not applicable.
Informed Consent Statement
Not applicable.
Acknowledgments
The authors would like to thank Sebastian Kalos, Basel AlTawil, and Giovanni Franchi for the fruitful discussions.
Conflicts of Interest
The authors declare no conflict of interest.
References
- Puig-Suari, J.; Turner, C.; Ahlgren, W. Development of the standard CubeSat deployer and a CubeSat class PicoSatellite. IEEE Aerosp. Conf. Proc. 2001, 1, 347–353. [Google Scholar]
- Kulu, E. Nanosatellite & CubeSat Database. Available online: www.nanosats.eu (accessed on 14 January 2021).
- Thakker, P.; Shiroma, W.A. Emergence of Pico- and Nanosatellites for Atmospheric Research and Technology Testing; American Institute of Aeronautics and Astronautics, Inc.: Reston, VA, USA, 2010. [Google Scholar]
- Paikowsky, D. What is new space? The changing ecosystem of global space activity. New Space 2017, 5, 84–88. [Google Scholar] [CrossRef]
- Morrison, P. On gamma-ray astronomy. Nuovo Cimento 1958, 7, 858–865. [Google Scholar] [CrossRef]
- Singer, S. The Vela Satellite Program for Detection of High Altitude Nuclear Detonations. Proc. IEEE 1965, 53, 1935–1948. [Google Scholar] [CrossRef]
- Fishman, G.J. BATSE observations of gamma-ray bursts. AIP Conf. Proc. 1993, 280, 669–680. [Google Scholar]
- Frontera, F. The key role of BeppoSAX in the GRB history. Rend. Fis. Acc. Lincei 2019, 30, 171–184. [Google Scholar] [CrossRef] [Green Version]
- Götz, D.; Gouiffès, C.; Rodriguez, J. INTEGRAL results on gamma-ray bursts and polarization of hard X-ray sources. New Astron. Rev. 2019, 87, 101537. [Google Scholar] [CrossRef]
- Gehrels, N.; Chincarini, G.; Giommi, P. The Swift Gamma-Ray Burst Mission. Astrophys. J. 2004, 611, 1005–1020. [Google Scholar] [CrossRef] [Green Version]
- Meegan, C.; Lichti, G.; Bhat, P.N. The Fermi Gamma-ray burst monitor. Astrophys. J. 2009, 702, 791–804. [Google Scholar] [CrossRef] [Green Version]
- Tavani, M.; Barbiellini, G.; Argan, A. The AGILE Mission. Astron. Astrophys. 2009, 502, 995–1013. [Google Scholar] [CrossRef]
- Bagoly, Z.; Balázs, L.G.; Galgóczi, G. Transient detection capabilities of small satellite gamma-ray detectors. Astron. Nachr. 2019, 340, 681–689. [Google Scholar] [CrossRef] [Green Version]
- Gieseler, J.; Oleynik, P. Radiation Monitor RADMON aboard Aalto-1 CubeSat: First results. Adv. Space Res. 2020, 66, 52–65. [Google Scholar] [CrossRef] [Green Version]
- Phan, H.; Halloin, H.; Laurent, P. IGOSat—A 3U Cubesat for measuring the radiative/electrons content in low Earth orbit and ionosphere. Nucl. Instruments Methods Phys. Res. Sect. Accel. Spectrometerss Detect. Assoc. Equip. 2018, 912, 389–394. [Google Scholar] [CrossRef]
- Fuschino, F.; Campana, R.; Labanti, C. HERMES: An ultra-wide band X and gamma-ray transient monitor on board a nano-satellite constellation. Nucl. Instruments Methods Phys. Res. Sect. Accel. Spectrometers Detect. Assoc. Equip. 2019, 936, 199–203. [Google Scholar] [CrossRef] [Green Version]
- Lan, W.; Munakata, R.; Nugent, R.; Pignatelli, D. Poly Picosatellite Orbital Deployer Mk III Rev. E User Guide; Cal Poly SLO: San Luis Obispo, CA, USA, 2014. [Google Scholar]
- Niederstrasser, C.G. A 2019 view of the impending small launch vehicle boom. In Proceedings of the International Astronautical Congress, IA, Washington DC, USA, 21–25 October 2019. [Google Scholar]
- Bok, C.B.; Comeau, A.; Dolgopolov, A.; Halt, T.; Juang, C.; Smith, P. SmallSats by the Numbers. Bryce Space Technol. 2020. [Google Scholar]
- Fagerudd, J. Stress Simulation of the SEAM CubeSat Structure during Launch; KTH Royal Institute of Technology: Stockholm, Sweden, 2015. [Google Scholar]
- Roberts, M.S.E.; Arneodo, F.; Giovanni, A.D. RAAD: A CubeSat-based soft gamma-ray detector for the study of terrestrial gamma-ray flashes and other short timescale phenomena. Proc. Vol. Sensors Syst. Next-Gener. Satell. 2019, 11151, 111510Y. [Google Scholar]
- Turin, G.L. An Introduction to Matched Filters. IRE Trans. Inf. Theory 1960, 6, 311–329. [Google Scholar] [CrossRef] [Green Version]
- Piñeros, J.O.M.; Santos, W.A.d.; Prado, A.F.B.A. Analysis of the orbit lifetime of CubeSats in low Earth orbits including periodic variation in drag due to attitude motion. Adv. Space Res. 2021, 67, 902–918. [Google Scholar] [CrossRef]
- Pavón-Carrasco, F.J.; Santis, A.D. The South Atlantic Anomaly: The Key for a Possible Geomagnetic Reversal. Front. Earth Sci. 2016, 4–40. [Google Scholar] [CrossRef] [Green Version]
- Suparta, W. Space Weather Effects on Microelectronics Devices around the LEO Spacecraft Environments. J. Phys. Conf. Ser. 2014, 539, 012025. [Google Scholar] [CrossRef] [Green Version]
- Di Giovanni, A.; Manenti, L.; AlKhouri, F. Characterisation of a CeBr3(LB) detector for space application. J. Instrum. 2019, 14, P09017. [Google Scholar] [CrossRef] [Green Version]
- Spenvis. Available online: https://www.spenvis.oma.be (accessed on 8 March 2021).
- AGI. Available online: https://www.agi.com/products/stk (accessed on 8 March 2021).
- Cumani, P.; Hernanz, M.; Kiener, J. Background for a gamma-ray satellite on a low-Earth orbit. Exp. Astron. 2019, 47, 273–302. [Google Scholar] [CrossRef] [Green Version]
- Lebrun, F.; Leray, J.P.; Lavocat, P. ISGRI: The INTEGRAL Soft Gamma-Ray Imager. Astron. Astrophys. 2003, 411, 141–148. [Google Scholar] [CrossRef]
- Atwood, W.B.; Abdo, A.A.; Ackermann, M. The Large Area Telescope on the Fermi Gamma-Ray space telescope mission. Astrophys. J. 2009, 697, 1071–1102. [Google Scholar] [CrossRef] [Green Version]
- Campana, R.; Feroci, M.; Monte, E.D. Background simulations for the Large Area Detector onboard LOFT. Exp. Astron. 2013, 36, 451–477. [Google Scholar] [CrossRef] [Green Version]
- Galgóczi, G.; Řípa, J.; Campana, R. Simulations of expected signal and background of gamma-ray sources by large field-of-view detectors aboard CubeSats. arXiv 2021, arXiv:2102.08104. [Google Scholar]
- SpaceX, Falcon User’S Guide. Available online: https://www.spacex.com/media/falcon_users_guide_042020.pdf (accessed on 8 March 2021).
- Nieto-Peroy, C.; Emami, M.R. CubeSat Mission: From Design to Operation. Appl. Sci. 2019, 9, 3110. [Google Scholar] [CrossRef] [Green Version]
Figure 1.
The 3U mainframe of the LIGHT-1 CubeSat mission. (Left) All the subsystems fit in 1.3 U, leaving room for a 1.7 U payload. (Right) The satellite is equipped with deployables with embedded solar panels for power harvesting.
Figure 1.
The 3U mainframe of the LIGHT-1 CubeSat mission. (Left) All the subsystems fit in 1.3 U, leaving room for a 1.7 U payload. (Right) The satellite is equipped with deployables with embedded solar panels for power harvesting.

Figure 2.
Schematic description of the detection concept of a gamma-ray detector operating in a CubeSat type satellite. The gamma-ray enters the payload and deposits energy in the target. The energy is in turn transformed into a flash of light that is collected from the photosensor. The signal output is read out by the front-end electronics and a charge signal generated. The processing electronics assigns a time stamp and a Attitude Determination and Control (ADC) channel to the event. The processed event is in turn sent to the On-Board Computer (OBC), a priority is assigned based on a look-up table for event categorization, and eventually made available for the transmission to ground.

Figure 3.
(Left) The outer box containing the reference detector studied in this paper. The enclosure might be either machined form solid aluminum or developed by additive manufacturing process (3D printing) and shaped to mechanically fit in the CubeSat mechanical structure. (Right) The schematic layout of the reference detector. Visible in the picture are the electronics, the rejection layer (VETO) for charged particle induced events, and the inner housing for the detection unit are also labeled.

Figure 4.
The core of the reference detector consists of a 4-fold scintillating crystal array read out by as many photosensors and encapsulated in an aluminum enclosure (transparent body visible in the figure).
Figure 4.
The core of the reference detector consists of a 4-fold scintillating crystal array read out by as many photosensors and encapsulated in an aluminum enclosure (transparent body visible in the figure).

Figure 5.
Detection efficiency of the reference instrument as a function of the gamma-ray energy for several crystals normalized to the same volume (each crystal has of dimensions), encapsulated in the same aluminum enclosure and presented at two different energy scales.
Figure 5.
Detection efficiency of the reference instrument as a function of the gamma-ray energy for several crystals normalized to the same volume (each crystal has of dimensions), encapsulated in the same aluminum enclosure and presented at two different energy scales.

Figure 6.
The S13361-6050NE-04 MPPC series manufacturer by Hamamatsu: the device consists of 16 independent cells, each one of sensitive area.
Figure 6.
The S13361-6050NE-04 MPPC series manufacturer by Hamamatsu: the device consists of 16 independent cells, each one of sensitive area.

Figure 7.
The R11265-200 PMT manufactured by Hamamatsu.

Figure 8.
Block diagram of the payload electronics needed to operate the reference detector.

Figure 9.
Schematic representation of the disciplined clock circuit for the generation of the event time stamping. The system is based on the use of the PPS signal coupled to a clock.
Figure 9.
Schematic representation of the disciplined clock circuit for the generation of the event time stamping. The system is based on the use of the PPS signal coupled to a clock.

Figure 10.
(A) A typical PMT signal triggered by a gamma-ray interaction in the target. (B) The corresponding charge signal (in ADC channel units) sampled by the ADC.
Figure 10.
(A) A typical PMT signal triggered by a gamma-ray interaction in the target. (B) The corresponding charge signal (in ADC channel units) sampled by the ADC.

Figure 11.
The photosensor integrated signal is sampled by a ADC (blue points). By combining the amplitude values of each sample S, the matched filter algorithm produces a new set of T values. The local maximum in T values is proportional to the energy released in the interaction.
Figure 11.
The photosensor integrated signal is sampled by a ADC (blue points). By combining the amplitude values of each sample S, the matched filter algorithm produces a new set of T values. The local maximum in T values is proportional to the energy released in the interaction.

Figure 12.
(A) A set of PMT-simulated waveforms corresponding to a release of energy in the detector. (B) The corresponding charge integrated signals obtained from the set of PMT simulated waveforms. (C) The matched filter output. (D) Histogram of S/N distribution.
Figure 12.
(A) A set of PMT-simulated waveforms corresponding to a release of energy in the detector. (B) The corresponding charge integrated signals obtained from the set of PMT simulated waveforms. (C) The matched filter output. (D) Histogram of S/N distribution.

Figure 13.
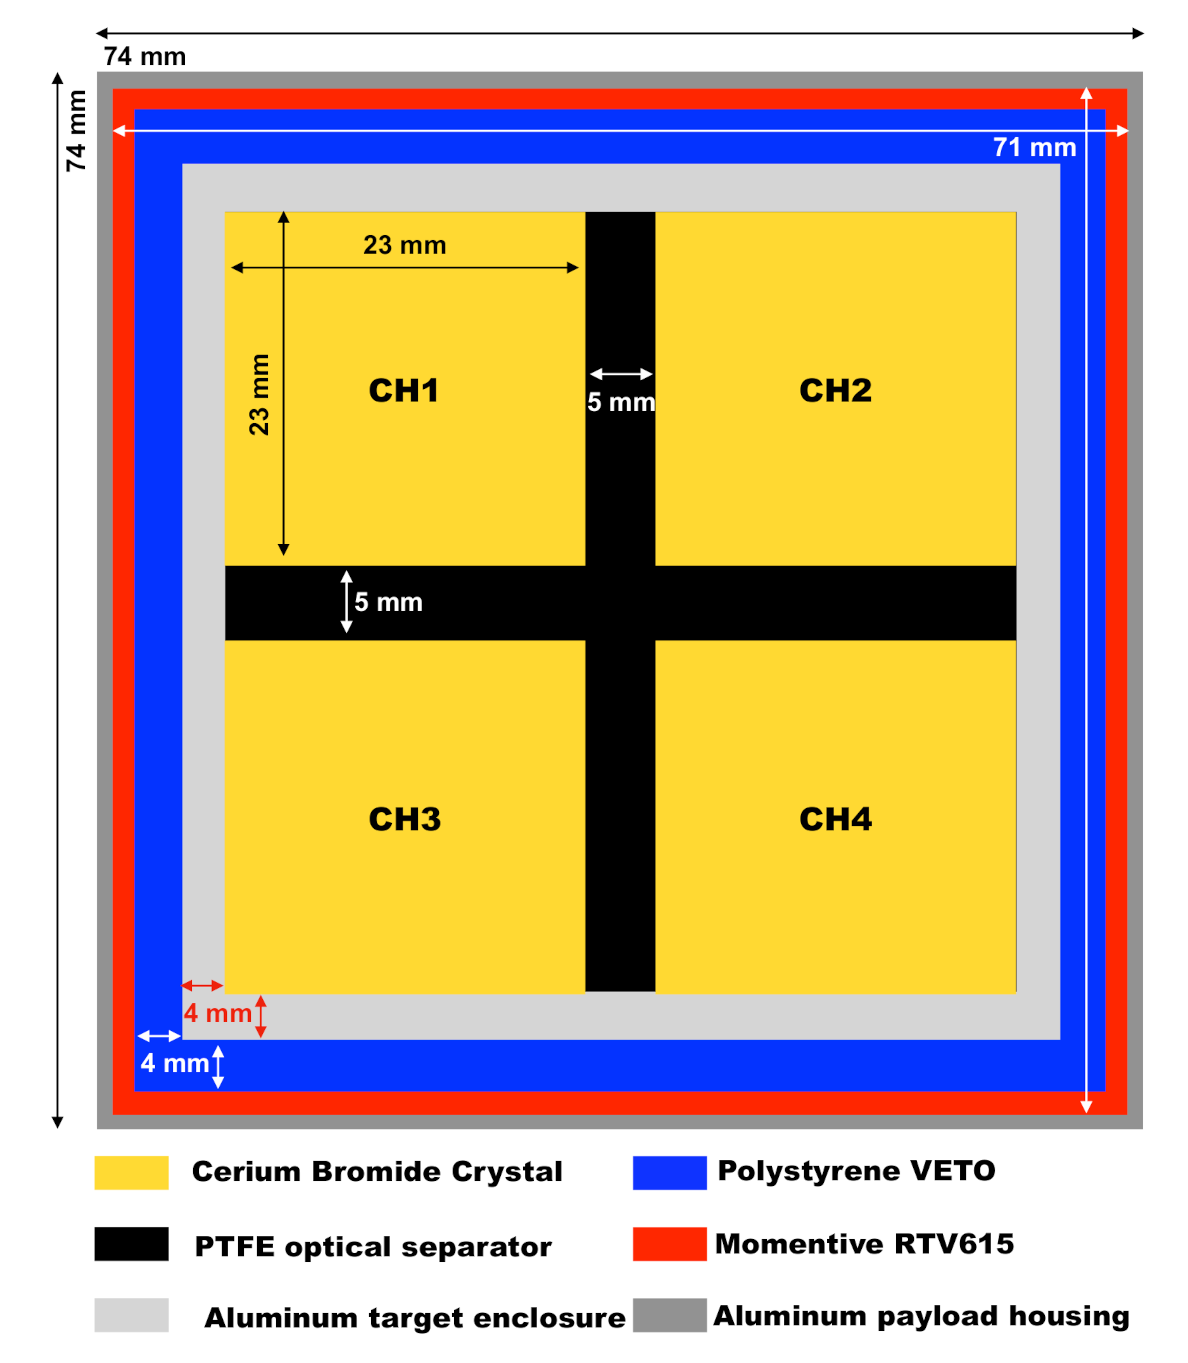
The cross section of the detector studied in the simulation. In yellow is the 4 scintillating crystals [26] optically separated by means of a PTFE barrier (in black). The target is sealed by means of an aluminum enclosure (light gray). In blue is the polystyrene-based VETO for the rejection of charged particle induced events. In red is the Momentive RTV615 silicon used as electrical and thermal insulator. The whole assembly is ultimately enclosed in an outer aluminum box (dark gray).
Figure 13.
The cross section of the detector studied in the simulation. In yellow is the 4 scintillating crystals [26] optically separated by means of a PTFE barrier (in black). The target is sealed by means of an aluminum enclosure (light gray). In blue is the polystyrene-based VETO for the rejection of charged particle induced events. In red is the Momentive RTV615 silicon used as electrical and thermal insulator. The whole assembly is ultimately enclosed in an outer aluminum box (dark gray).

Figure 14.
Energy spectra for trapped protons (in red) and electrons (in blue) at the ISS altitude and orbit.
Figure 14.
Energy spectra for trapped protons (in red) and electrons (in blue) at the ISS altitude and orbit.

Figure 15.
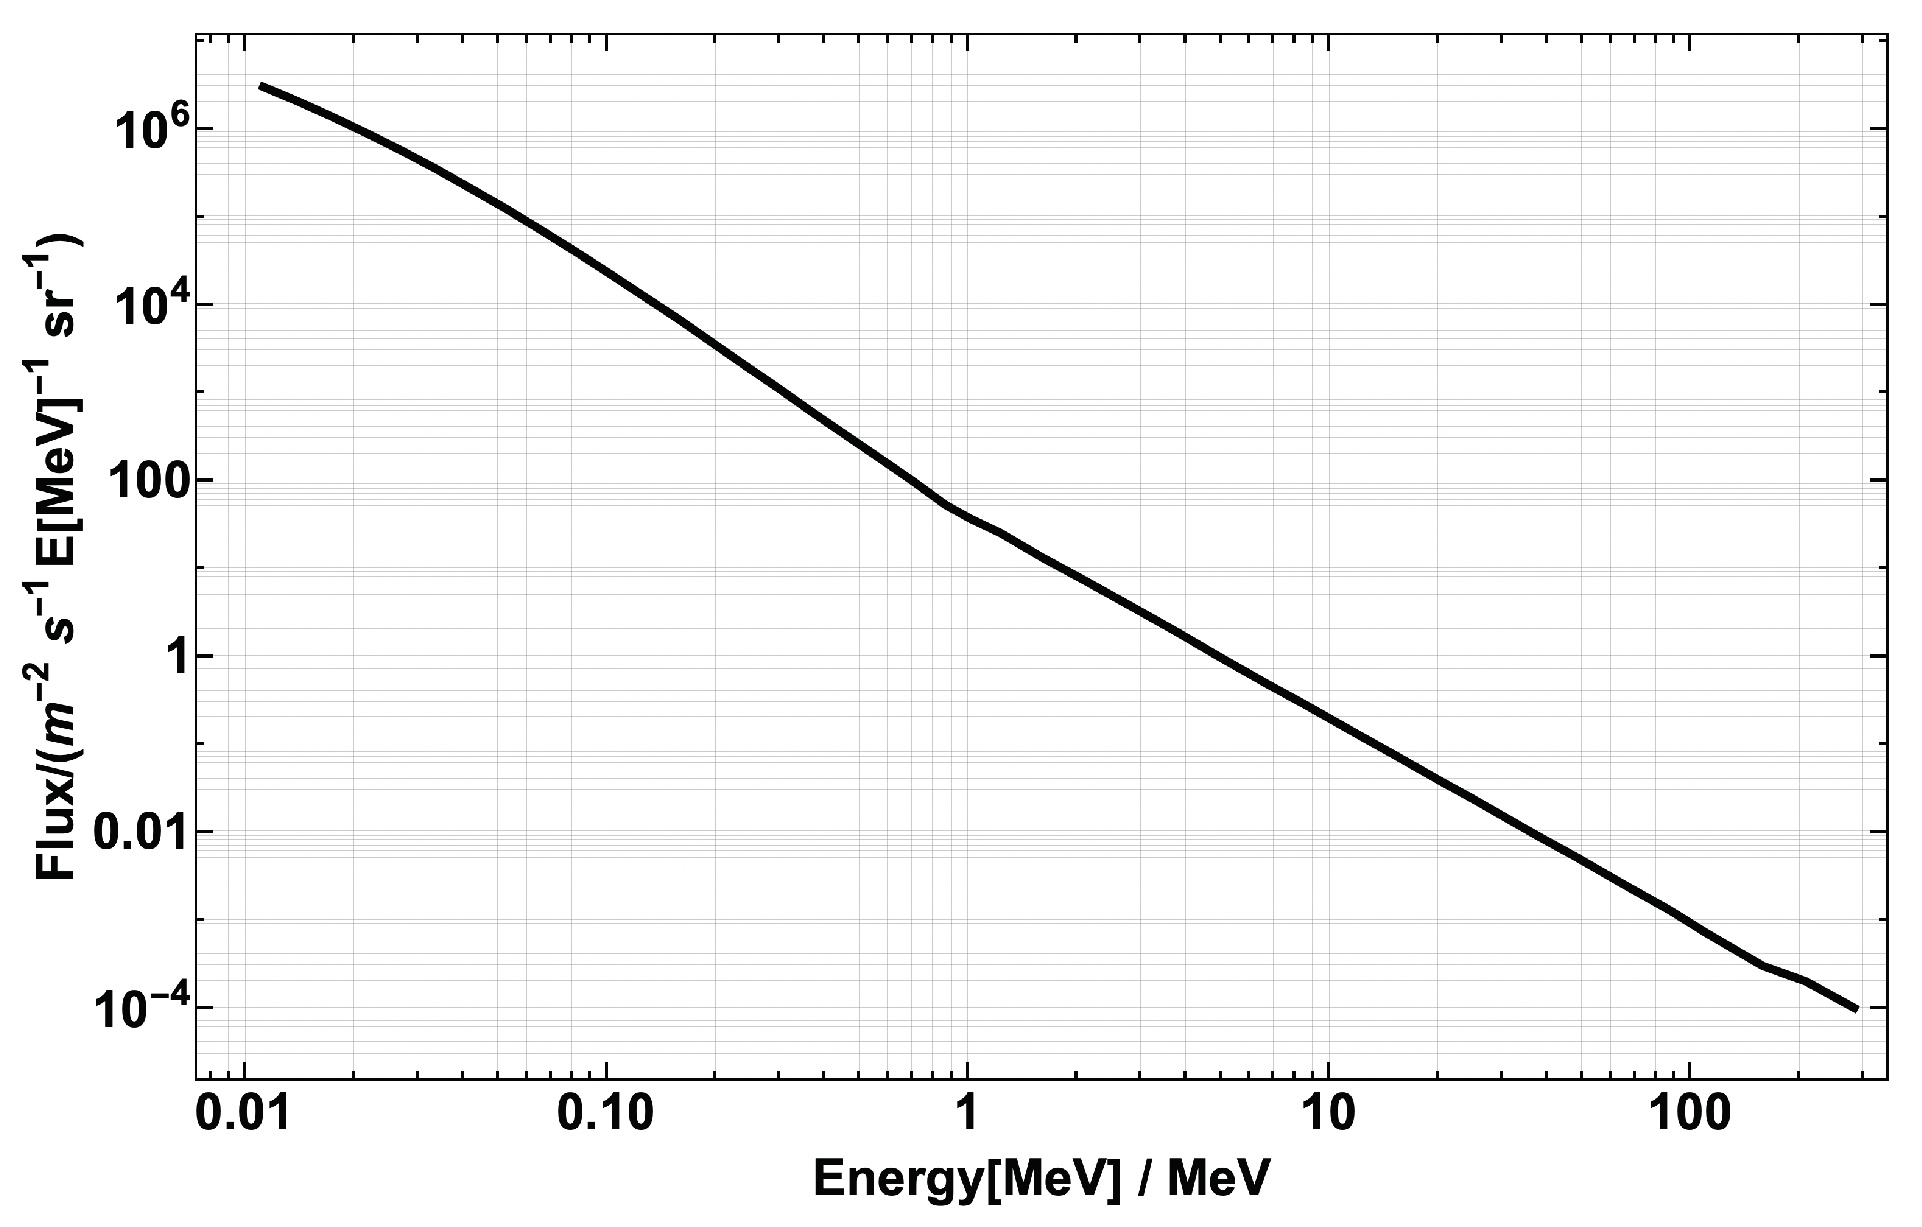
Extra-galactic photons flux as modeled by Integral [30] (up to 890 keV) and FERMI-LAT [31] at higher energies.

Figure 16.
The expected response of a detection channel for the first 2 s of mission. The horizontal red line represents the ADC limit: each peak that crosses such limit corresponds to a saturated event (mostly protons).
Figure 16.
The expected response of a detection channel for the first 2 s of mission. The horizontal red line represents the ADC limit: each peak that crosses such limit corresponds to a saturated event (mostly protons).

Figure 17.
The event seen at the level of the readout electronics in 1 ms time window. The two channels on top (namely, CH1 and CH2) did not detect events, while the peaks visible in the CH3 and CH4 correspond to gamma-rays detected in a 175s time range. The red star indicates the simultaneous detection of gamma-rays in both channels due to a Compton effect.

Figure 18.
The payload modal analysis. This simulation meshing is based on 3D CTETRA 10 mesh, with maximum mesh size of 5mm and minimum of 1 mm. Courtesy of Basel AlTawil.
Figure 18.
The payload modal analysis. This simulation meshing is based on 3D CTETRA 10 mesh, with maximum mesh size of 5mm and minimum of 1 mm. Courtesy of Basel AlTawil.

Figure 19.
The satellite thermal analysis results after one orbit. In this specific case, the deployables are facing the sun. Maximum temperature is ∼53 °C (red region) and minimum temperature is ∼0 °C (blue region). Courtesy of Basel AlTawil.
Figure 19.
The satellite thermal analysis results after one orbit. In this specific case, the deployables are facing the sun. Maximum temperature is ∼53 °C (red region) and minimum temperature is ∼0 °C (blue region). Courtesy of Basel AlTawil.


Table 1.
Typical constraints on payload requirements in 3U, 6U, and 12U class CubeSats (based on private communication with vendors).
Table 1.
Typical constraints on payload requirements in 3U, 6U, and 12U class CubeSats (based on private communication with vendors).
| Parameter Specification | 3U CubeSat | 6U CubeSat | 12U CubeSat |
|---|---|---|---|
| Satellite Mass Limit [kg] | ∼5 | ∼10 | ∼20 |
| Payload Mass Limit [kg] | ∼2 | ∼5 | ∼14 |
| Downlink S-Band [Mbps] | 2–8 | 2–8 | 2–8 |
| Downlink X-Band [Mbps] | 200–400 | 200–400 | 200–400 |
| Energy Storage [Wh] | 40 | 80 | 160 |
| Payload Available Power (Body Mounted) [W] | ∼4 | ∼10 | ∼20 |
| Payload Available Power (Deployables) [W] | ∼10 | ∼30 | ∼45 |
| Payload Volume Occupancy [U] | 1.5–2 | 3–4 | 8–9 |
| Pointing Accuracy [deg] | <1 | <1 | <1 |
Table 2.
Physical characteristics of scintillating crystals considered in the paper as building block of the payload target. In red, the crystals affected by unavoidable intrinsic radioactivity (parameter values can change at the level of few percent depending on the manufacturing conditions).
Table 2.
Physical characteristics of scintillating crystals considered in the paper as building block of the payload target. In red, the crystals affected by unavoidable intrinsic radioactivity (parameter values can change at the level of few percent depending on the manufacturing conditions).
| Scintillating Crystal | Density | Weight | Energy Resolution at 662 keV [%] | Decay Time [ns] | Emission Peak [nm] | Hygroscopic |
|---|---|---|---|---|---|---|
| Low background Cerium Bromide () | 5.2 | 495 | ∼4–5 | 18–20 | 370 | yes |
| Thallium Activated Sodium Iodide() | 3.67 | 350 | ∼7–8 | 250 | 415 | yes |
| Thallium Activated Cesium Iodide () | 4.51 | 430 | ∼5–6 | 1000 | 550 | slightly |
| Lanthanum Bromide () | 5.08 | 485 | ∼3 | 16 | 385 | yes |
| Lanthanum Bromochloride () | 4.90 | 465 | ∼3 | 35 | 380 | yes |
| Bismuth Germanate () | 7.13 | 680 | ∼11–12 | 300 | 480 | no |
| Lutetium-yttrium oxyorthosilicate () | 7.1 | 675 | ∼8–9 | 45 | 420 | no |
| Gadolinium Aluminum Gallium Garnet () | 6.6 | 630 | ∼6 | 90 | 520 | no |
Table 3.
Characteristics of the two devices (PMT and MPPC) considered in the paper.
| Characteristics | R11265-200 PMT | S13361-6050NE-04 MPPC |
|---|---|---|
| Dimensions () | ||
| Weight [g] | 24 | 2 |
| Peak Sensitivity [nm] | 400 | 450 |
| Quantum Efficiency at Peak [%] | 43 | - |
| Photo Detection Efficiency at Peak [%] | - | 40 |
| Typical Operating Voltage [V] | 900 | 55-58 |
| Typical Gain at working point | > | > |
| Dark Count at working point, room temperature [Hz] | few | > |
Table 4.
Data reduction protocol used in order to discriminate the event from the particle background composed of 1,000,000 of events.
Table 4.
Data reduction protocol used in order to discriminate the event from the particle background composed of 1,000,000 of events.
| Data Reduction Rule | Surviving Events |
|---|---|
| CUT1: Selection of all the Events with VETO OFF | 911516 |
| CUT2: CUT1 and at least one detection channel ON | 365142 |
| CUT3: CUT2 and deposited energy less than 30 MeV | 352795 |
| CUT4: CUT3 and at least 2 events within 1 ms | 6 |
Publisher’s Note: MDPI stays neutral with regard to jurisdictional claims in published maps and institutional affiliations. |
© 2021 by the authors. Licensee MDPI, Basel, Switzerland. This article is an open access article distributed under the terms and conditions of the Creative Commons Attribution (CC BY) license (http://creativecommons.org/licenses/by/4.0/).
Share and Cite
MDPI and ACS Style
Arneodo, F.; Di Giovanni, A.; Marpu, P. A Review of Requirements for Gamma Radiation Detection in Space Using CubeSats. Appl. Sci. 2021, 11, 2659. https://doi.org/10.3390/app11062659
AMA Style
Arneodo F, Di Giovanni A, Marpu P. A Review of Requirements for Gamma Radiation Detection in Space Using CubeSats. Applied Sciences. 2021; 11(6):2659. https://doi.org/10.3390/app11062659
Chicago/Turabian StyleArneodo, Francesco, Adriano Di Giovanni, and Prashanth Marpu. 2021. "A Review of Requirements for Gamma Radiation Detection in Space Using CubeSats" Applied Sciences 11, no. 6: 2659. https://doi.org/10.3390/app11062659
Note that from the first issue of 2016, this journal uses article numbers instead of page numbers. See further details here.