Full-Scale Experimental Investigation of the Interaction between Trains and Tunnels
by
 , ,
, ,
Claudio Somaschini
* ,
,
Tommaso Argentini
,
Elia Brambilla
,
Daniele Rocchi
,
Paolo Schito
and
Gisella Tomasini
* Department of Mechanical Engineering, Politecnico di Milano, 20133 Milano MI, Italy
*
Authors to whom correspondence should be addressed.
Appl. Sci. 2020, 10(20), 7189; https://doi.org/10.3390/app10207189
Submission received: 29 September 2020
/
Revised: 11 October 2020
/
Accepted: 13 October 2020
/
Published: 15 October 2020
(This article belongs to the Special Issue Interactions between Railway Subsystems)
Abstract
:Featured Application
Experimental data presented in this work can be taken into consideration both to perform numerical simulations of trains crossing tunnels and to update the reference standards.
Abstract
This works focuses on a series of experimental tests carried out to investigate overpressures in tunnels due to train crossings. Although the above-mentioned topic is well known and also defined in European standards, in the literature full-scale data are lacking, which are useful to validate the numerical codes required in the certification process and are used in train structural dimensioning. In this respect, an extensive full-scale experimental campaign was planned for observing as many test conditions as possible, such as single passages of different trains, two train crossing, different tests speed, and different tunnel characteristics. In detail, the understanding of the pressure wave generation and transmission is deeply enhanced by studying the pressure evolution both on board and at trackside, considering both single train passages or two trains crossings and having the possibility to compare aerodynamic loads on sealed and unsealed trains. Furthermore, the position of sensors, the speed of the train, and the initial conditions within the tunnel have been proven to be fundamental parameters for properly estimating the pressure loads on trains.
1. Introduction
In the last 40 years, railway transportation has changed considerably mainly thanks to the development of High-Speed (HS) lines and trains. Driven by this trend, interest in aerodynamic effects has grown exponentially, considering that train aerodynamic effects, on first approximation, increase with the square of the train speed. Drag reduction, crosswind effects, head pressure pulses, effect of the slipstream on people at trackside and on platform, pressure transients within tunnels, and the ballast lifting phenomenon [1,2,3,4,5] are just some of the problems caused by the aerodynamic field surrounding a HS train.
All the above listed topics have to be considered at the design phase and it is also necessary to take them into account in new standards to ensure run safety. Within joint research projects among several European institutions, significant work has been carried out over the last 20 years to develop both standard procedures and limits gathered in the European standard EN 14067 and in the Technical Specification for Interoperability (TSI) for both rolling stock (RST) and infrastructure (IST) [6,7,8,9,10,11,12]. Nevertheless, at the moment, there are still gaps and open points in standards, and further work needs to be done, considering that in some cases there is not yet a unified standard, and each country is progressing in its own way.
The present work focuses on the phenomenon of overpressures in tunnel, since it represents one of the most challenging aspects with regards to the train speed increase and the Italian line characteristics. Thanks to the knowledge acquired over more than three years of experimental tests carried out as part of the homologation process of the ETR1000 train (running dynamics, pantograph-catenary interaction, aerodynamics, and infrastructure dynamics were investigated at the same time during an extensive experimental campaign [13,14,15,16,17]), ad-hoc tests have been designed to study the main aerodynamic issues that are of concern in order to increase the capacity of the Italian HS line and to highlight aspects needing more details in current regulations.
Despite the fact that phenomenon of overpressures in tunnel is well defined in the European standards, as well as the test procedures required to certify a new train, some aspects need further investigation, as will be shown by experimental data presented in this work. Moreover, probably due to both organizational difficulties and high costs of full-scale tests, there is still a lack in the literature of full-scale data (some examples are reported in [18,19,20,21,22,23,24,25,26]) necessary to validate numerical codes that are required in the certification process and are used in train structural dimensioning. In this respect, after investigating the effects of various parameters on the measured pressure, a one-dimensional (1-D) code (TETUN, the 1-D code developed in the AeroTRAIN project to become a European reference) was extensively validated reproducing the numerous available experimental scenarios (single passages of different trains, two train crossing, different tests speed, different tunnel characteristics) and some important results are shown in this work. The research gave the opportunity to compare different physical phenomena producing aerodynamic loads on sealed and unsealed trains, increasing the understanding of the pressure wave generation and transmission.
1.1. The Overpressure in Tunnel Phenomenon
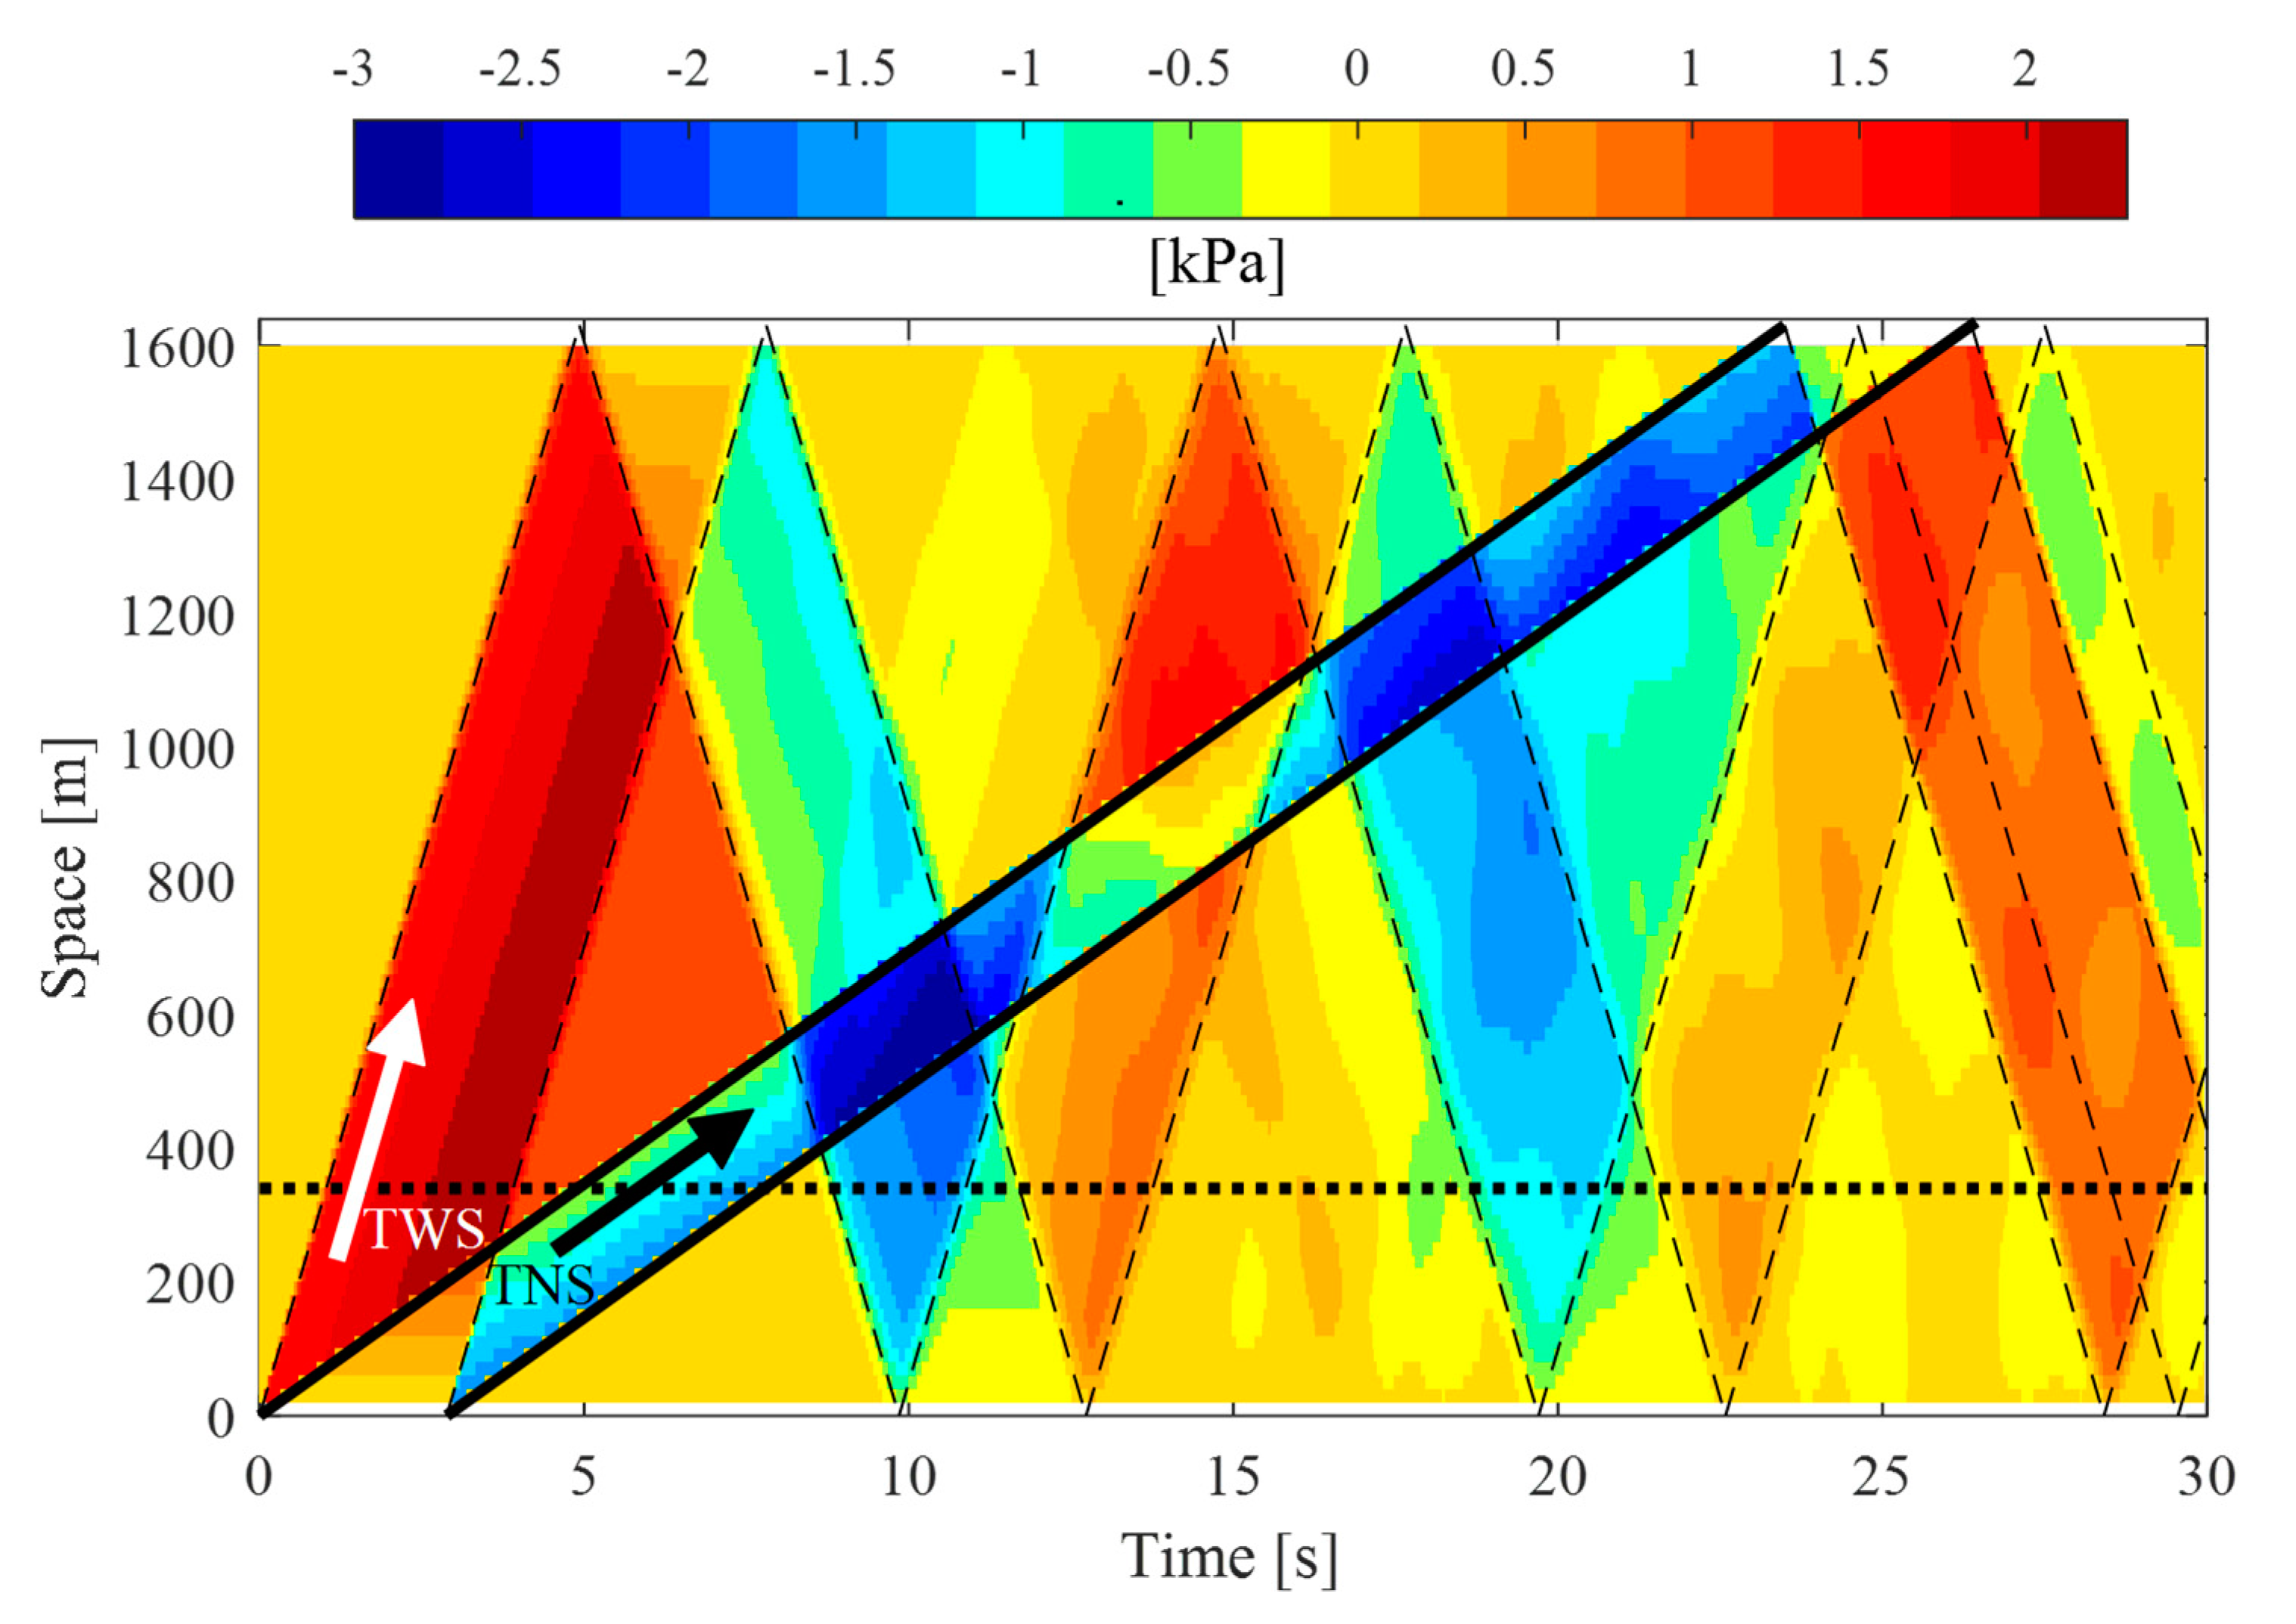
The effect of the interaction between the pressure field that surrounds a running train and the air in a tunnel is the generation of pressure waves that propagate along the tunnel at sonic speed. In particular, as can be seen in Figure 1, the entry and the exit of both train nose and train tail in the tunnel generate four pressure waves that move along the tunnel at sonic speed. Furthermore, the pressure inside the tunnel is also perturbed by the pressure field surrounding the train traveling at the same speed of the train. Anytime a traveling pressure wave reaches a discontinuity (i.e., the entrance and the exit of the tunnel, the train itself, another train in the tunnel, vent-hole, caves, etc.), it is partially reflected, changing its travel direction and its compression/expansion characteristic, and partially radiated [27,28,29,30]. As a result, a large number of pressure waves are generated that cross the tunnel headed in opposite directions, which then interact with each other, producing a complex pressure field. Depending on the tunnel wall roughness, the amplitude of a pressure wave may be reduced at faster or slower rate, while the wavefront may become steeper. If the amplitude and the gradient of the first pressure wave are above certain limits when it reaches the exit, it is partially radiated outside with an audible bang (“Sonic Boom”) with consequent environmental annoyance [31,32,33], which gives rise to the need to reduce speed or modify the geometries by lengthening the nose of trains or the hoods of tunnels [34]. This issue is not the subject of the experimental tests and of this work, since it is not of concern in Italy, at least at the moment. Two of the major factors affecting the compression effect are the high blockage ratio and the low roughness of the track, while the Italian HS lines, as all the tunnels, are of double ballasted track type.
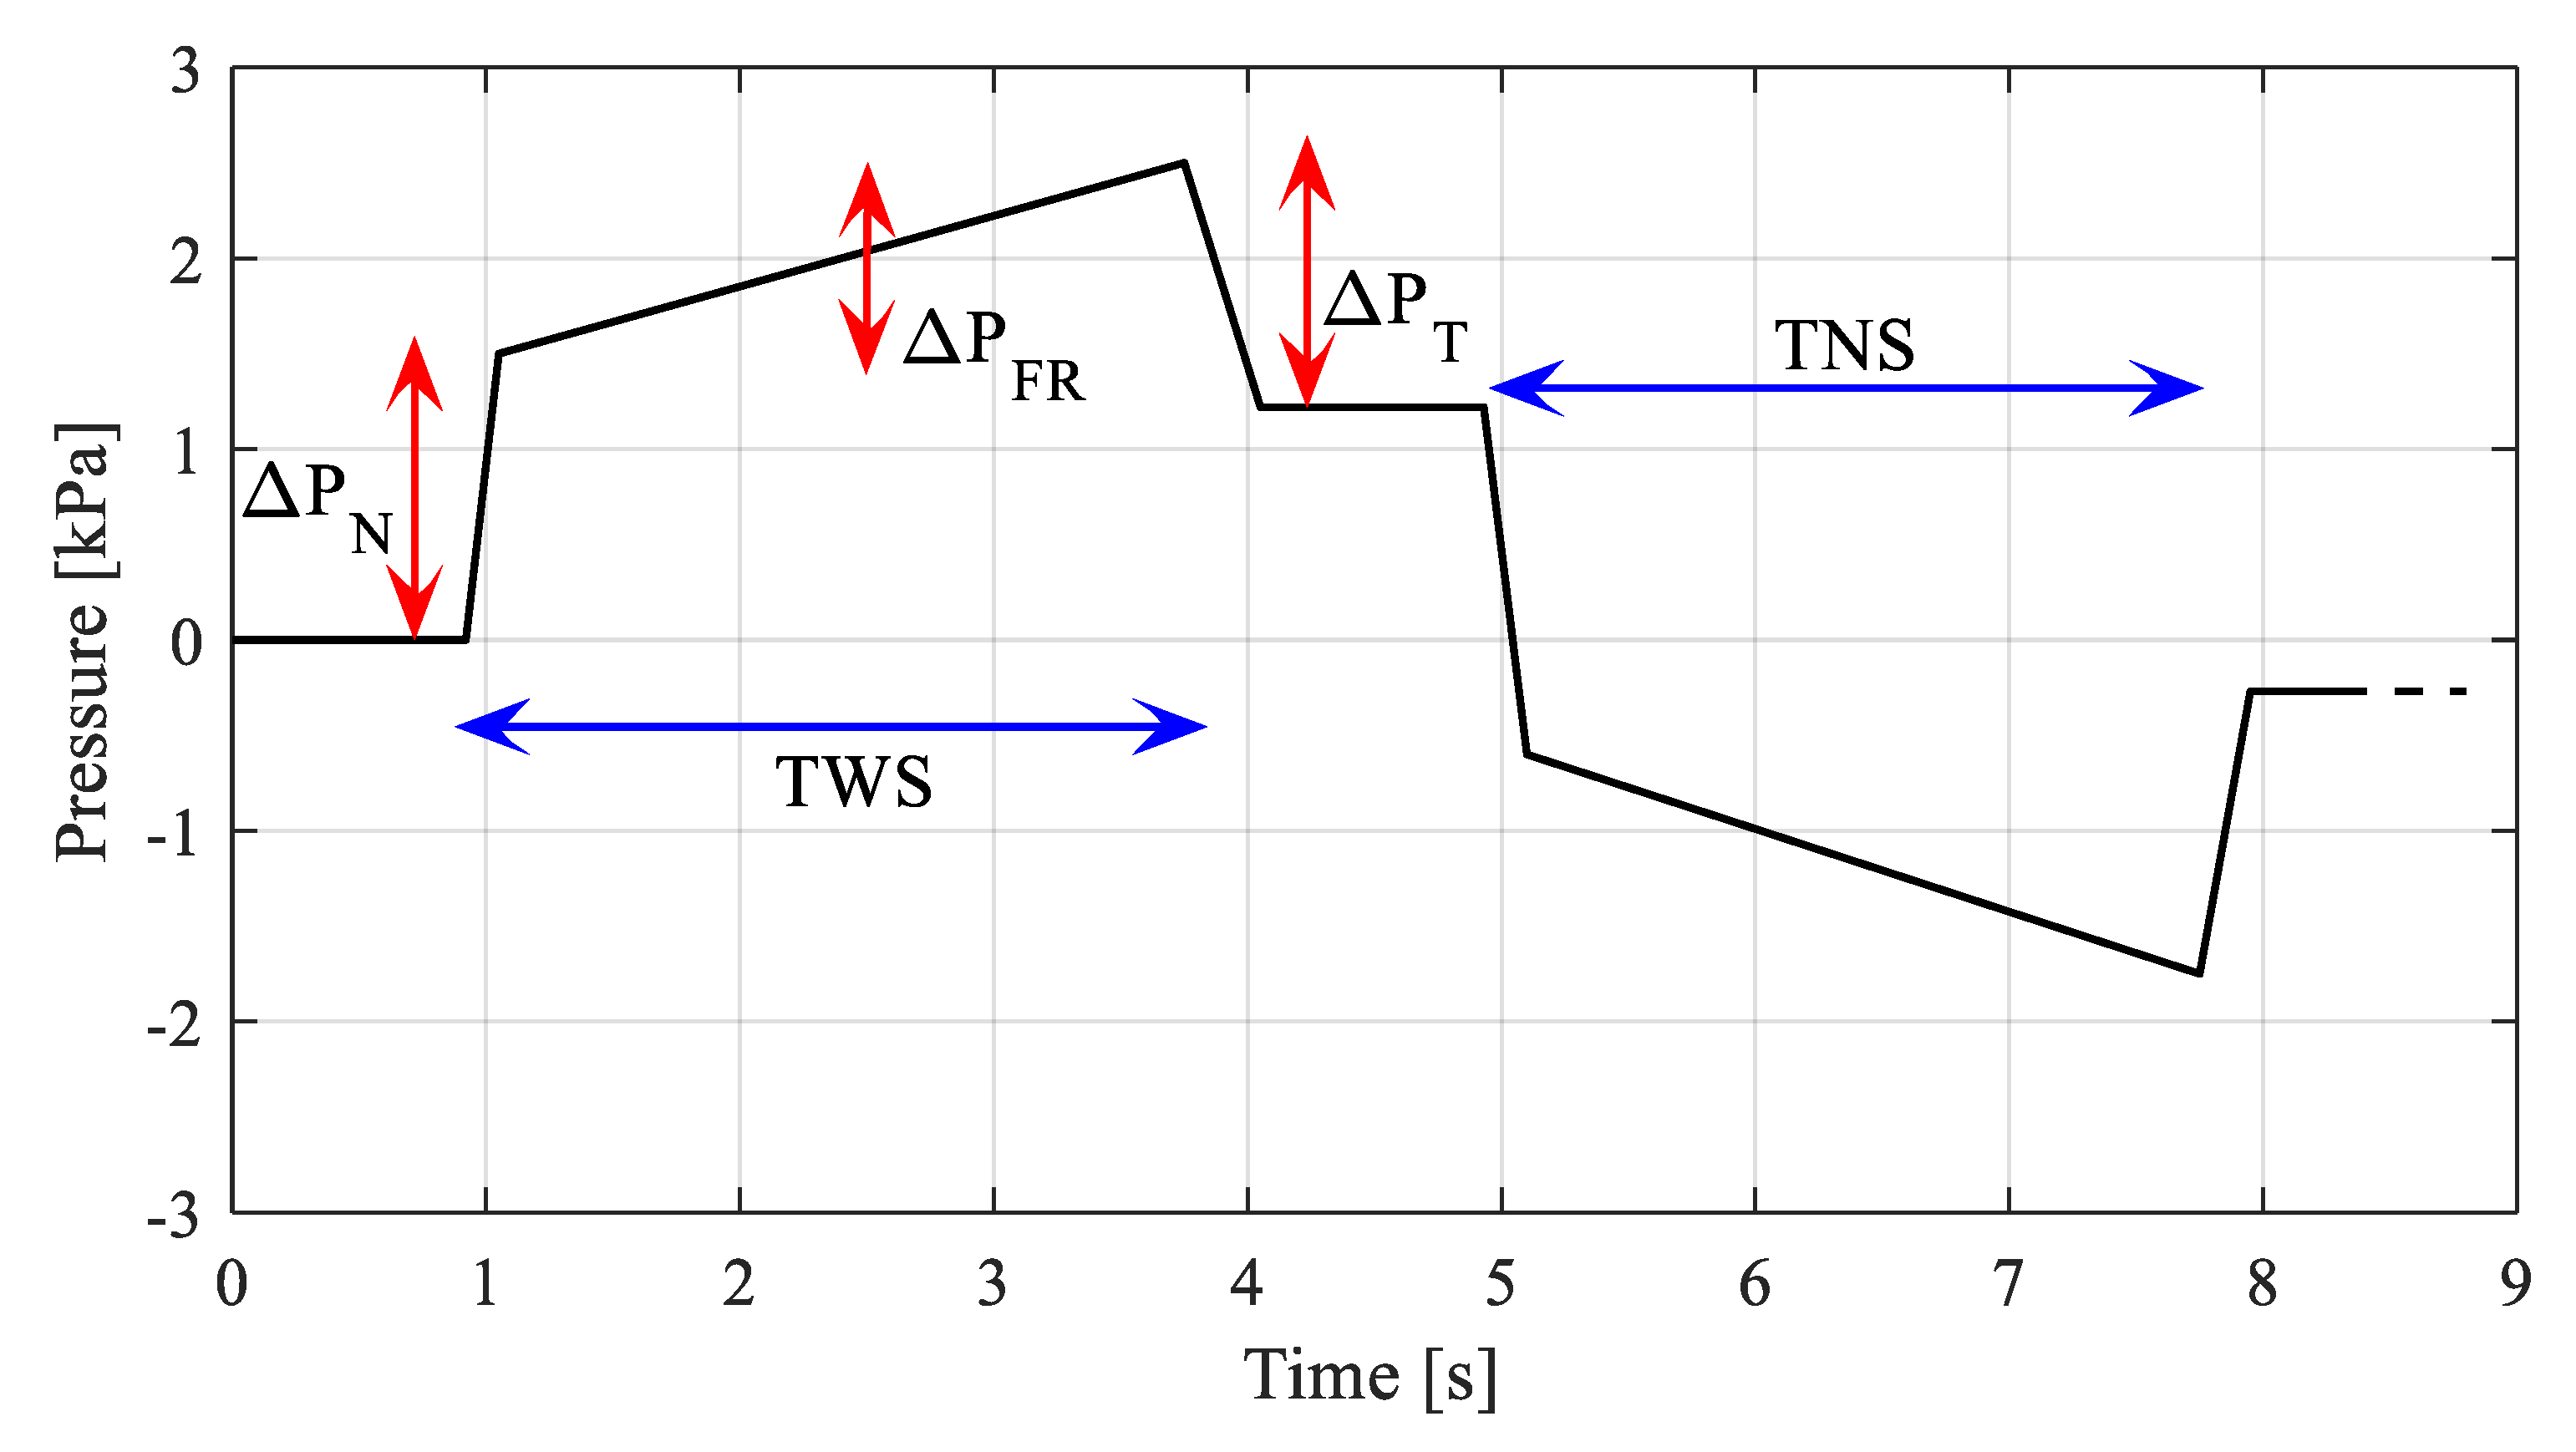
In this work, the pressure variations generated by the entrance of a train in a tunnel, the so-called Train-Tunnel Pressure Signature, will be called the Train Wave Signature (TWS). As is shown in Figure 1, three pressure changes characterize this first part:
- ΔPN, the sudden and positive leap due to the entry of the train nose in the tunnel;
- ΔPFR, another increase in pressure with much lower slope due to the friction effects caused by the entry of the train body into the tunnel;
- ΔPT, the sudden and negative drop generated by the entry of the train tail in the tunnel.
Once the train entered the tunnel, the pressure field around it generates another type of pressure variation, which moves in the tunnel with the train (Train Near-field Signature, TNS in Figure 2). The shape of this pressure variation is similar to the TWS, although it has an opposite sign, and the values of the ΔP are a bit higher due to the blockage effect of the train.
Finally, when the train leaves the tunnel, a second TWS, similar to the first one, is generated that starts to move at sonic speed into the tunnel headed in the direction opposite to the train one.
Since the pressure waves propagate along the tunnel at sonic speed and are reflected by the tunnel end, a train running in a tunnel meets the self-generated pressure waves several times during its passage and, furthermore, it could intersect the pressure waves or the pressure field produced by another train crossing the same tunnel. This superposition gives rise to strong variations in the pressure distribution within the tunnel and around the train that are transferred into the coaches, albeit attenuated. The internal pressure Pi depends on the external pressure Pe and the mechanism that connects the evolution of the inner pressure with the outer one can be simplified with a differential equation of the first order:
dPi/dt = (Pe(t) − Pi(t))/τdyn
The more the train is sealed (which means the higher the time delay τdyn is), the better the on-board comfort is. On the other hand, an increment of aerodynamic loads on the train car body due to the strong pressure differences between inside and outside occurs. Furthermore, in case of two trains crossing, the pressure variations acting on the trains and, consequently, on their passengers, depend not only on the tunnel, on the trains, and on their speeds, but also on the relative time delay between the entrances of the two trains.
1.2. The Importance of Full-Scale Experimental Tests
As previously mentioned, issues regarding the pressure variations in tunnel are well defined in European standards. In detail, the test procedure for evaluating the pressure signature is described in the EN 14067-1, -3, and -5, while some limits and targets are depicted in different standard, i.e.,
- The limits for the pressure signature ΔPs [1];
- A health criterion to prevent ear damage for weaker people (young babies, ill people, specific disease) [3];
- Basic criteria for pressure comfort on-board during tunnel crossings [7];
- Structural dimensioning for interoperability [2].
Practically, it is impossible to carry out an experimental campaign with two trains crossing in a tunnel, testing all the possible delays and measuring the pressure along the entire tunnel length and on the two trains. As a consequence, the above-mentioned criteria must be verified by numerical codes. On the other hand, the validation procedure of these numerical codes by using experimental data is a key aspect for the approval of a train and for the estimate of the maxima aerodynamic loads that a train has to withstand.
Although the phenomenon of the overpressures in tunnel has been well known for decades, in Europe it started to become of primary importance in the 1990s, along with the construction of new HS lines throughout the continent. In order to study the major aerodynamic problems caused by the increase in speed over 200 km/h, 12 institutions (eight universities and four railways companies) from six countries came together to establish the first European project that started at the end of 1995 and ended in 1999: the TRANSAERO [35,36]. The acronym TRANSAERO stand for “TRANSient AErodynamics for Railways system Optimisation,” in order to underline the interest of the project in the time-dependent phenomena being studied, namely, cross-wind, train pressure pulses, and waves in tunnels. With regards to the pressure pulses, since the remedies until then had consisted of increasing the cross-section of tunnels dramatically and of sealing trains (both of which are very expensive), the project gave a sharp acceleration in this area through experimental tests (both full-scale and small scale) and numerical codes. Since then, numerous numerical calculation methods have been proposed to try to reproduce the generation of the waves on the one hand and the evolution of the waves along the tunnel on the other.
The typologies of numerical simulations can be divided into two mainly categories: on the one hand the CFD [37,38,39] and, on the other, the 1-D codes [40,41,42,43]. CFD simulations can reproduce the entry of the train and the consequent pressure signature or the entire passage in the tunnel being studied. This allows to investigate the effect of geometry changes to both the tunnel and the trains (portals and heads shapes, vent holes, internal cavities, and many other solutions), although with very high computational costs. On the other hand, the 1-D simulations mainly deal with the evolution of the pressure waves within a tunnel. A mathematical model recreates the pressure waves at the entrance, while the evolution along the tunnel is managed by the codes through the physical laws of gas dynamics. In case of a 1-D code, the computational cost is reduced by orders of magnitude. Thus, while the CFD can be used to optimize the geometrical characteristics of the train and tunnels at the design stage, 1-D codes can be used to simulate the crossings between two trains investigating all possible delays in different tunnels. Of course, like any numerical code, both codes must be validated through experimental tests, especially the 1-D codes, since they require careful optimization of the parameters needed to recreate the pressure signature. The data shown in the present work have been used to set the parameters of the 1-D code called TRUNS, which is an open package made available after the end of the AeroTRAIN project. The code behind this software (TETUN, “Train En TUNnel”) was also used and validated during the TRANSAERO project with the name of TRANSTUN [42,44]. Many other codes exist, mainly developed by train manufacturers or infrastructure managers for practical purposes, although few literature and documentation are available, especially as regards the validation with full-scale data.
Contrariwise, academic contributions are available, but full-scale data for comparison are very rare and validations using scale models is more common [28,45,46,47,48,49,50,51,52,53]. Under laboratory conditions, it is possible to study the effects of the geometric characteristics on the pressure signature and the pressure gradient pressure. Furthermore, the waves superposition and reflection, which lasts for a longer time than the train passage, can also be investigated. In some cases, and generally with a high scale ratio (1:70–1:200), models with simplified shapes are used since they help the development of numerical codes by reducing the complexity of the phenomenon [54]. In other cases, the object is catapulted in a high-molecular-weight gas to carry out test under the real Mach number conditions, even with lower speeds [55,56]. Besides these examples, however, there are test rigs with scale models of real trains to conduct both basic research and predictive/parametric industrial studies on most train passing issues. Thanks to its versatility, in recent years, many institutions have built similar devices all over the world [46,57,58,59] by gradually increasing the speed and reducing the scale. On the other hand, these models suffer from the same problems faced for scale models used in wind tunnels: it is almost impossible to reproduce the right surface roughness of both track and train and to recreate all the details that characterize the underbody and roof regions. Moreover, the models are almost always composed of only three cars (leading, intermediate, and tailing). All these differences make it difficult to reproduce the second part of the pressure signature (ΔPFR). Finally, the degree of sealing of the train and the resulting τdyn cannot be reproduced with scale models.
For these reasons, although the numeric codes and the scale models are allowed by the EN standard, it still specifies that “Full-scale test data may be the basis for train and tunnel acceptance and homologation.” Therefore, full-scale experimental tests are the basis of the whole process [60]. However, despite their importance, not many examples of solid validations (using, for example, different tunnels, speeds, or cross-sections) of numerical models with full-scale experimental data are available in the literature, e.g., [23,61,62,63]. In addition, in the presentation of the TRUNS software of the AeroTRAIN the results are still compared with experimental data of the TRANSAERO. Many data might be available within train manufacturers and railway operators, however, for confidentiality reasons, they have not been published. On the other hand, organizational difficulties combined with high costs of full-scale tests are probably the reasons why the data collected in the TRANSAERO have been considered as the reference for full-scale tests for the past 20 years, at least in Europe, and are adopted as a benchmark [19,64].
This work deals with the above-presented subject: an experimental full-scale campaign has been carried out on the Italian HS railways lines, collecting a wide database for the validation of 1-D codes. These data, recorded both at trackside and on-board, allow to observe the pressure evolution within tunnels, focusing on the effect of different parameters.
2. Trackside Tests
In order to characterize the pressure signatures of different trains and to better define practical guidelines for carrying out experimental tests, the data collected in different tunnels of the Italian HS line will be shown. The experimental data were collected using absolute pressure transducers placed at different positions and acquired continuously for approximately one month. The speed of the trains was measured by two couples of photocells on both sides. Additionally, the atmospheric conditions (pressure, temperature, and wind) were measured during the experimental campaigns using a weather station. By comparing all the collected data, it is possible to highlight the influence of three main parameters: the initial conditions within the tunnel, the side of the track where to place the sensors, and the speed of the train.
2.1. Speed Influence
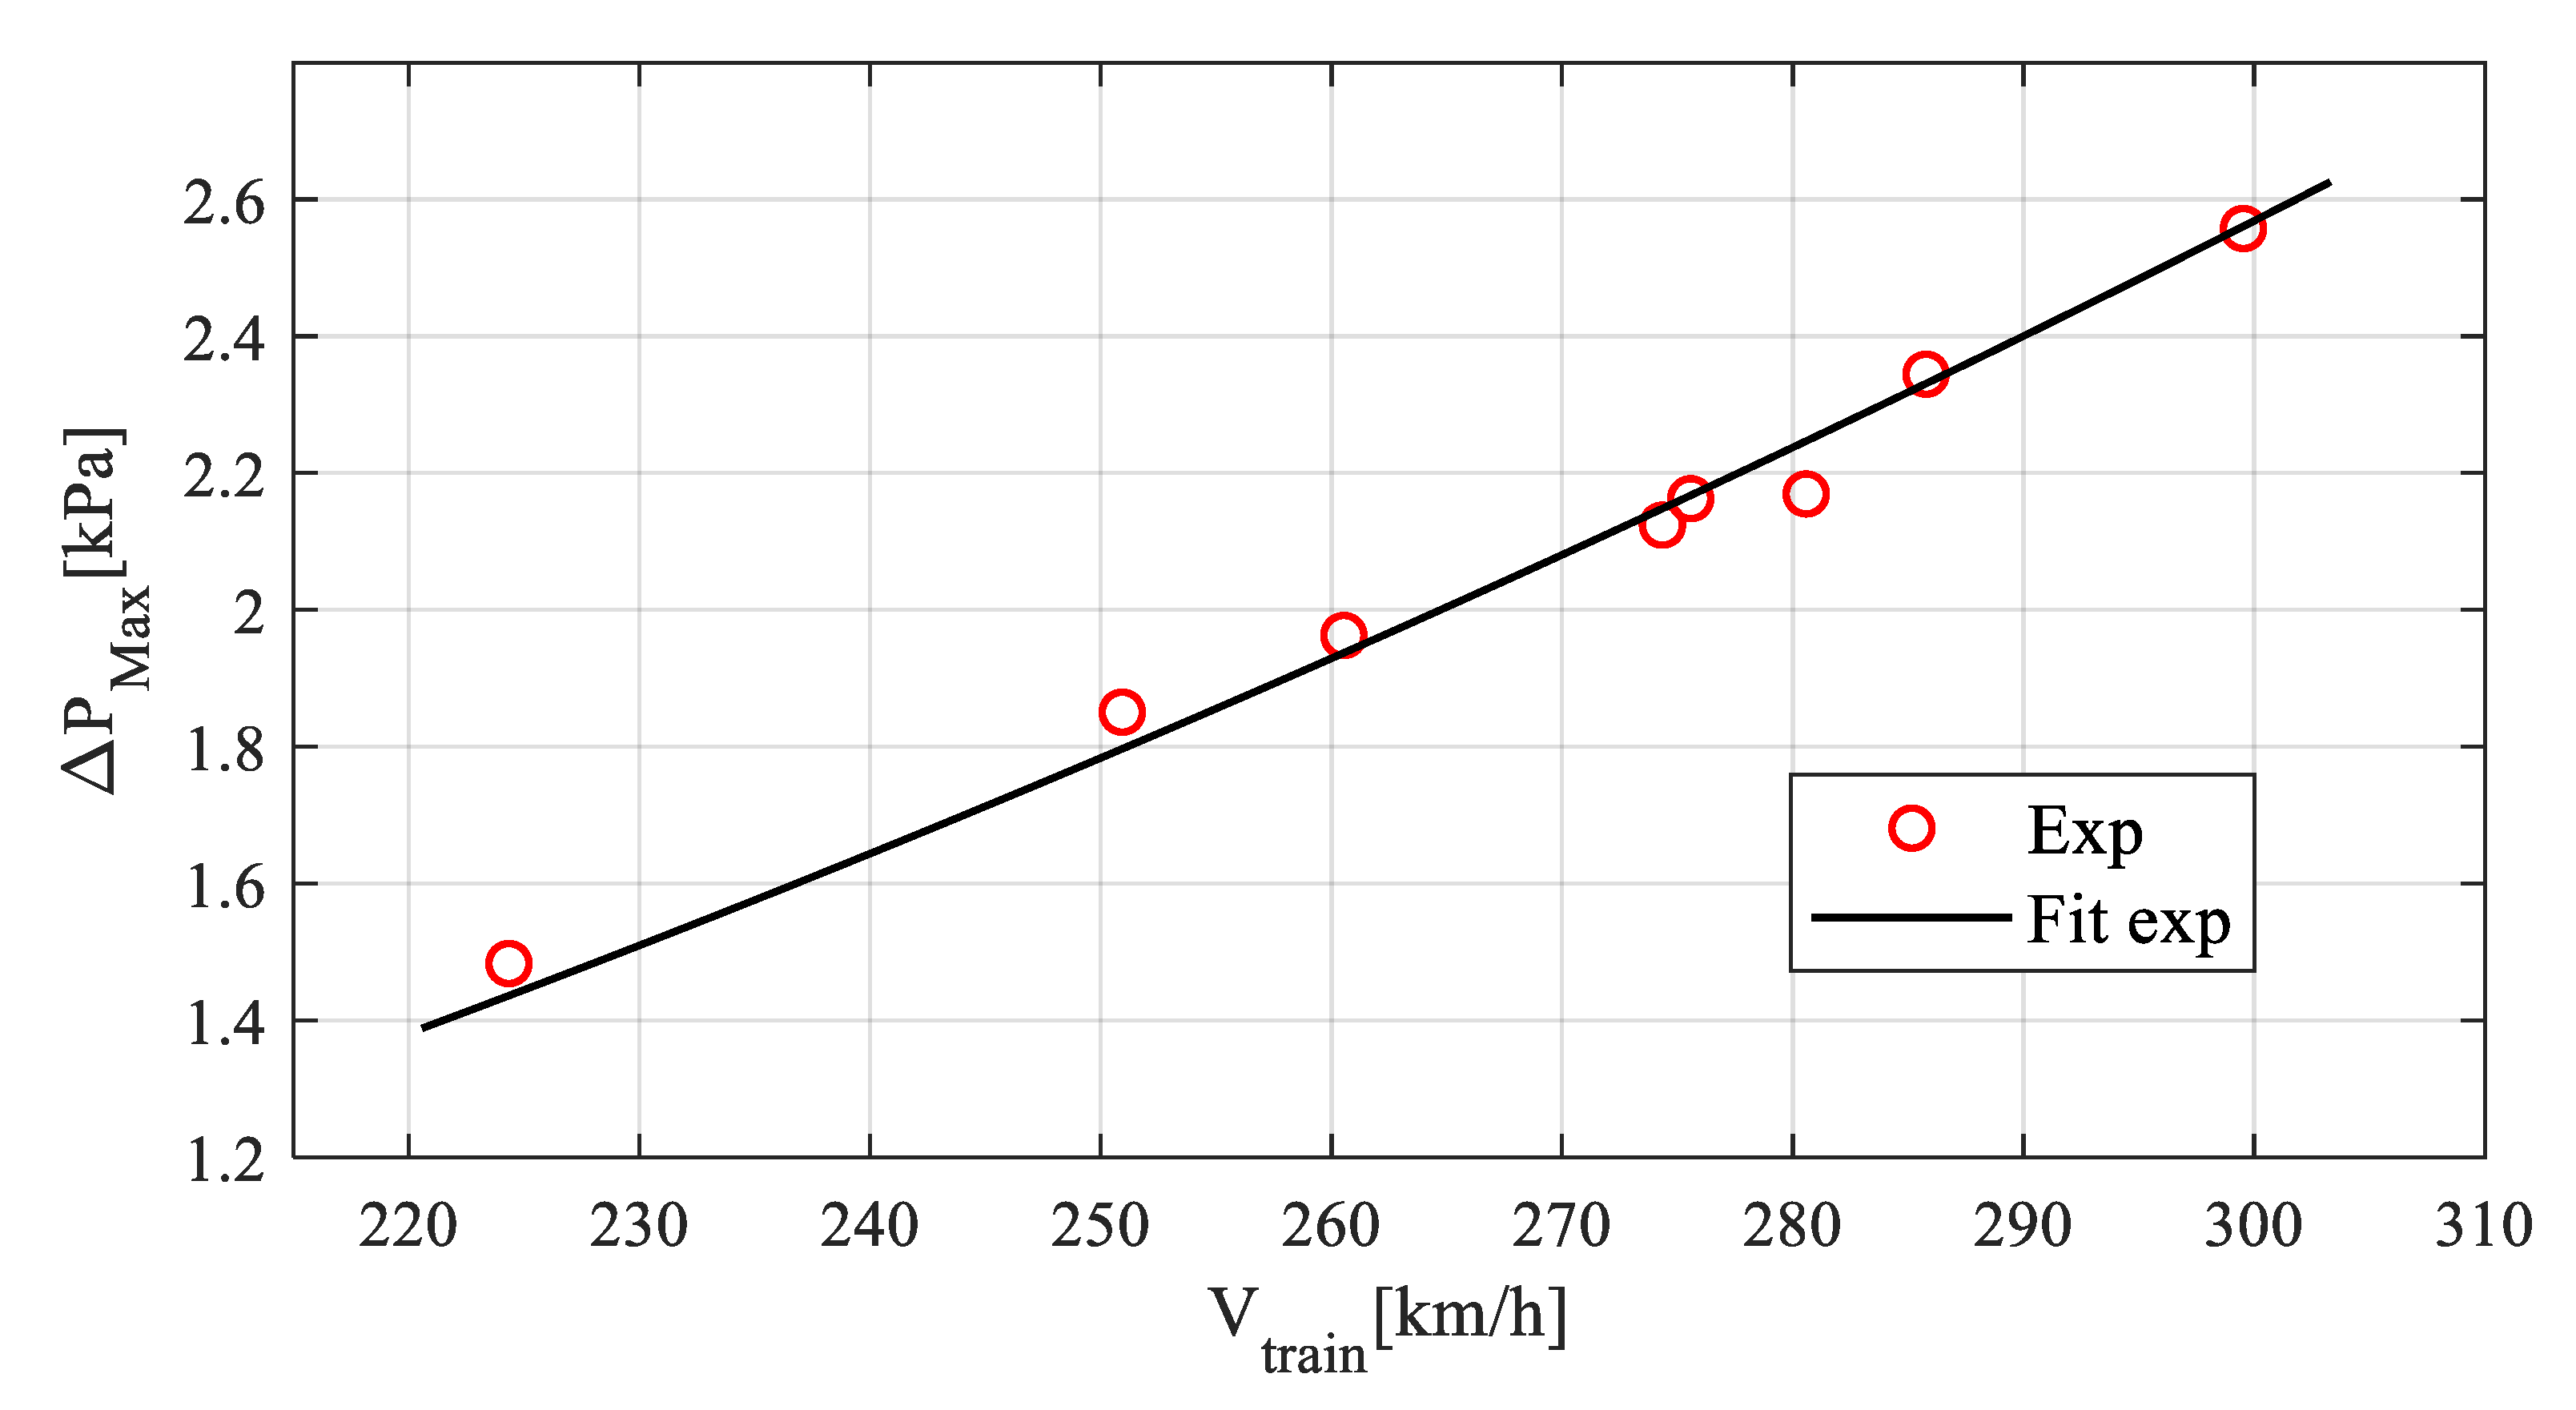
In this paragraph, the influence of the speed is highlighted, expanding as much as possible the range of the considered train speed. Although in the experimental campaign there was not an anemometer to minimize the effect of the flow, the analysis is limited to night runs, all recorded in the same direction with a delay of more than 50 min from the previous passage. In Figure 3, the values of the ΔPmax (that is ΔPN + ΔPfr), measured in eight runs, in the speed range of 220–300 km/h, are shown and superimposed with the quadratic interpolation. The comparison shows the interpolation goodness demonstrating that it is possible to correct the results with a wider range of speeds. Although it might seem a foregone result, in the literature there is little experimental evidence of this behavior on full-scale tests [26,45,65]. On the other hand, this is a very important result because it allows to measure the pressure signature at a certain speed and then extrapolate the results to higher speeds.
2.2. Initial Conditions Influence
The standard EN 14067-5: 2006 [12] describes how to measure the pressure signature at a fixed location in the tunnel. The indications provided are:
“The tunnel should have constant cross section, no airshafts and no residual pressures waves. Ideally there should be no initial air flow in the tunnel. However, if there is, its influence on the measurements should be checked.”
If we focus on the second part, it is suggested that a certain dependence on the initial air flow speed is expected, but nothing else is specified: for example, no limit criteria nor data correction procedure are specified. Although the condition of “no initial air flow in the tunnel” may be verified during homologation runs, the restrictive request on the flow speed may result in expensive tests, especially if they are performed in a normal day of commercial traffic. Trains crossing a tunnel generate an airflow that remains inside the tunnel also after their passages, adding adverse testing conditions to the ones due to natural ventilation.
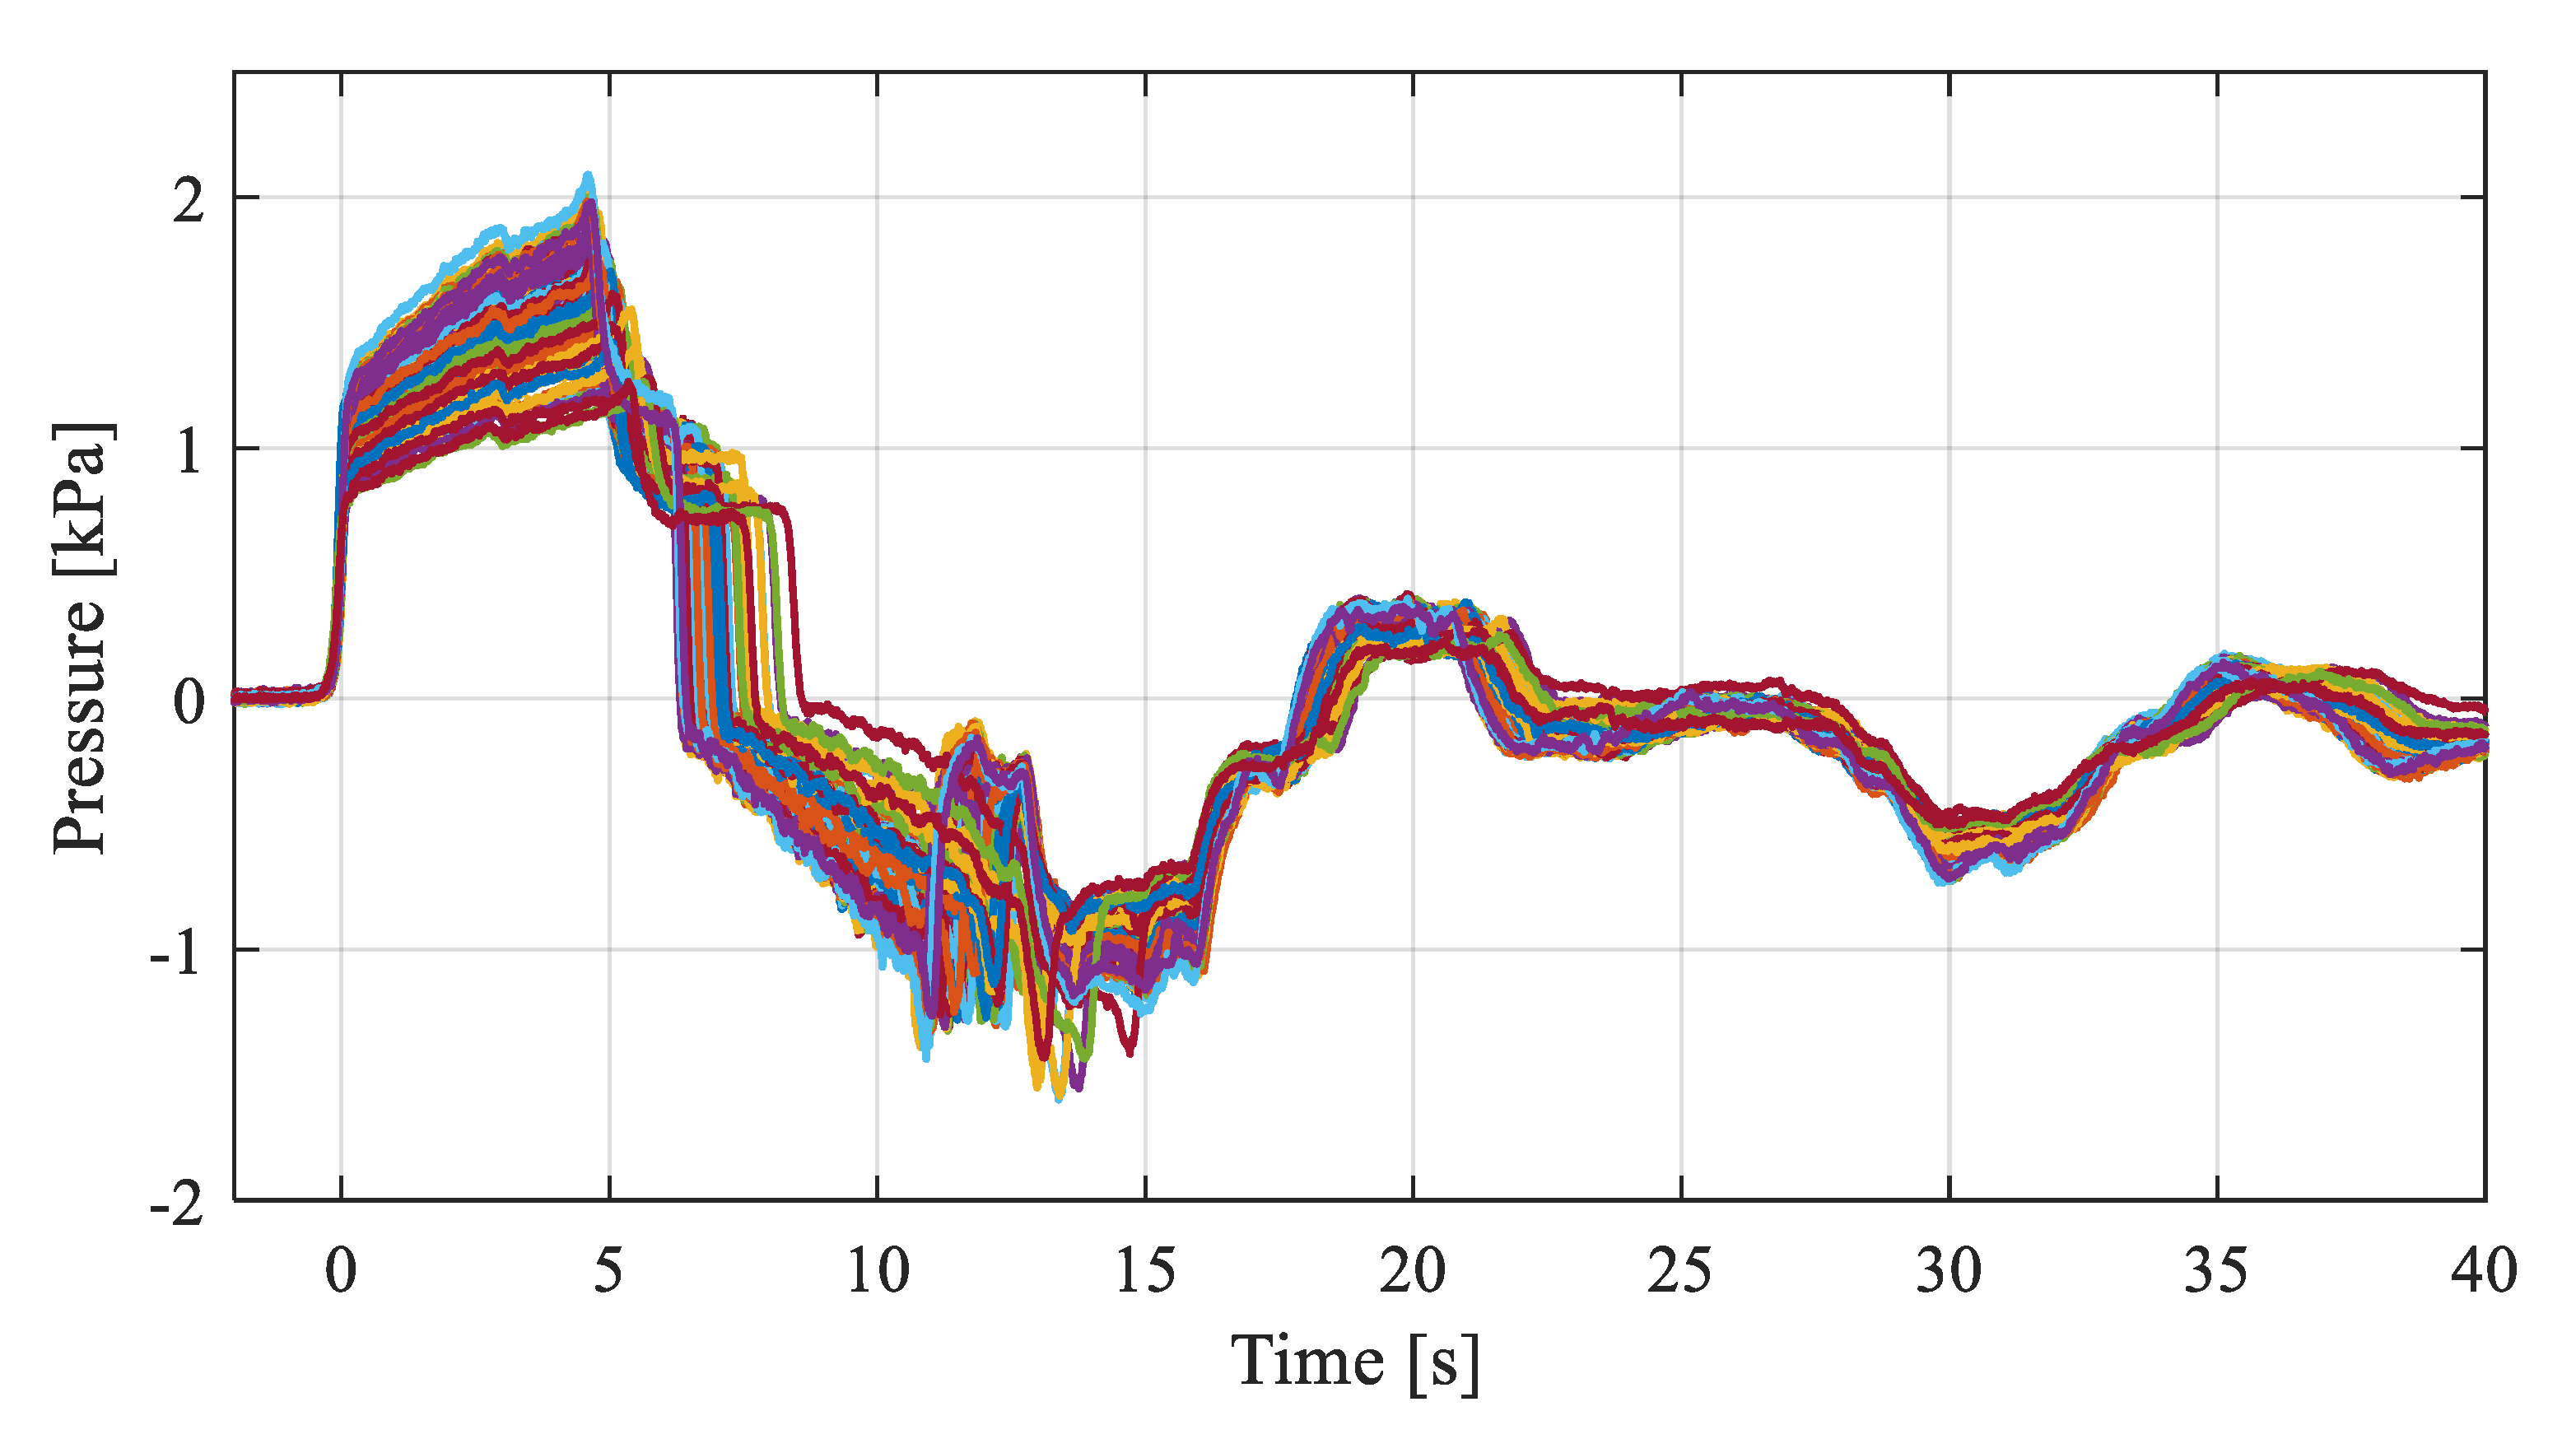
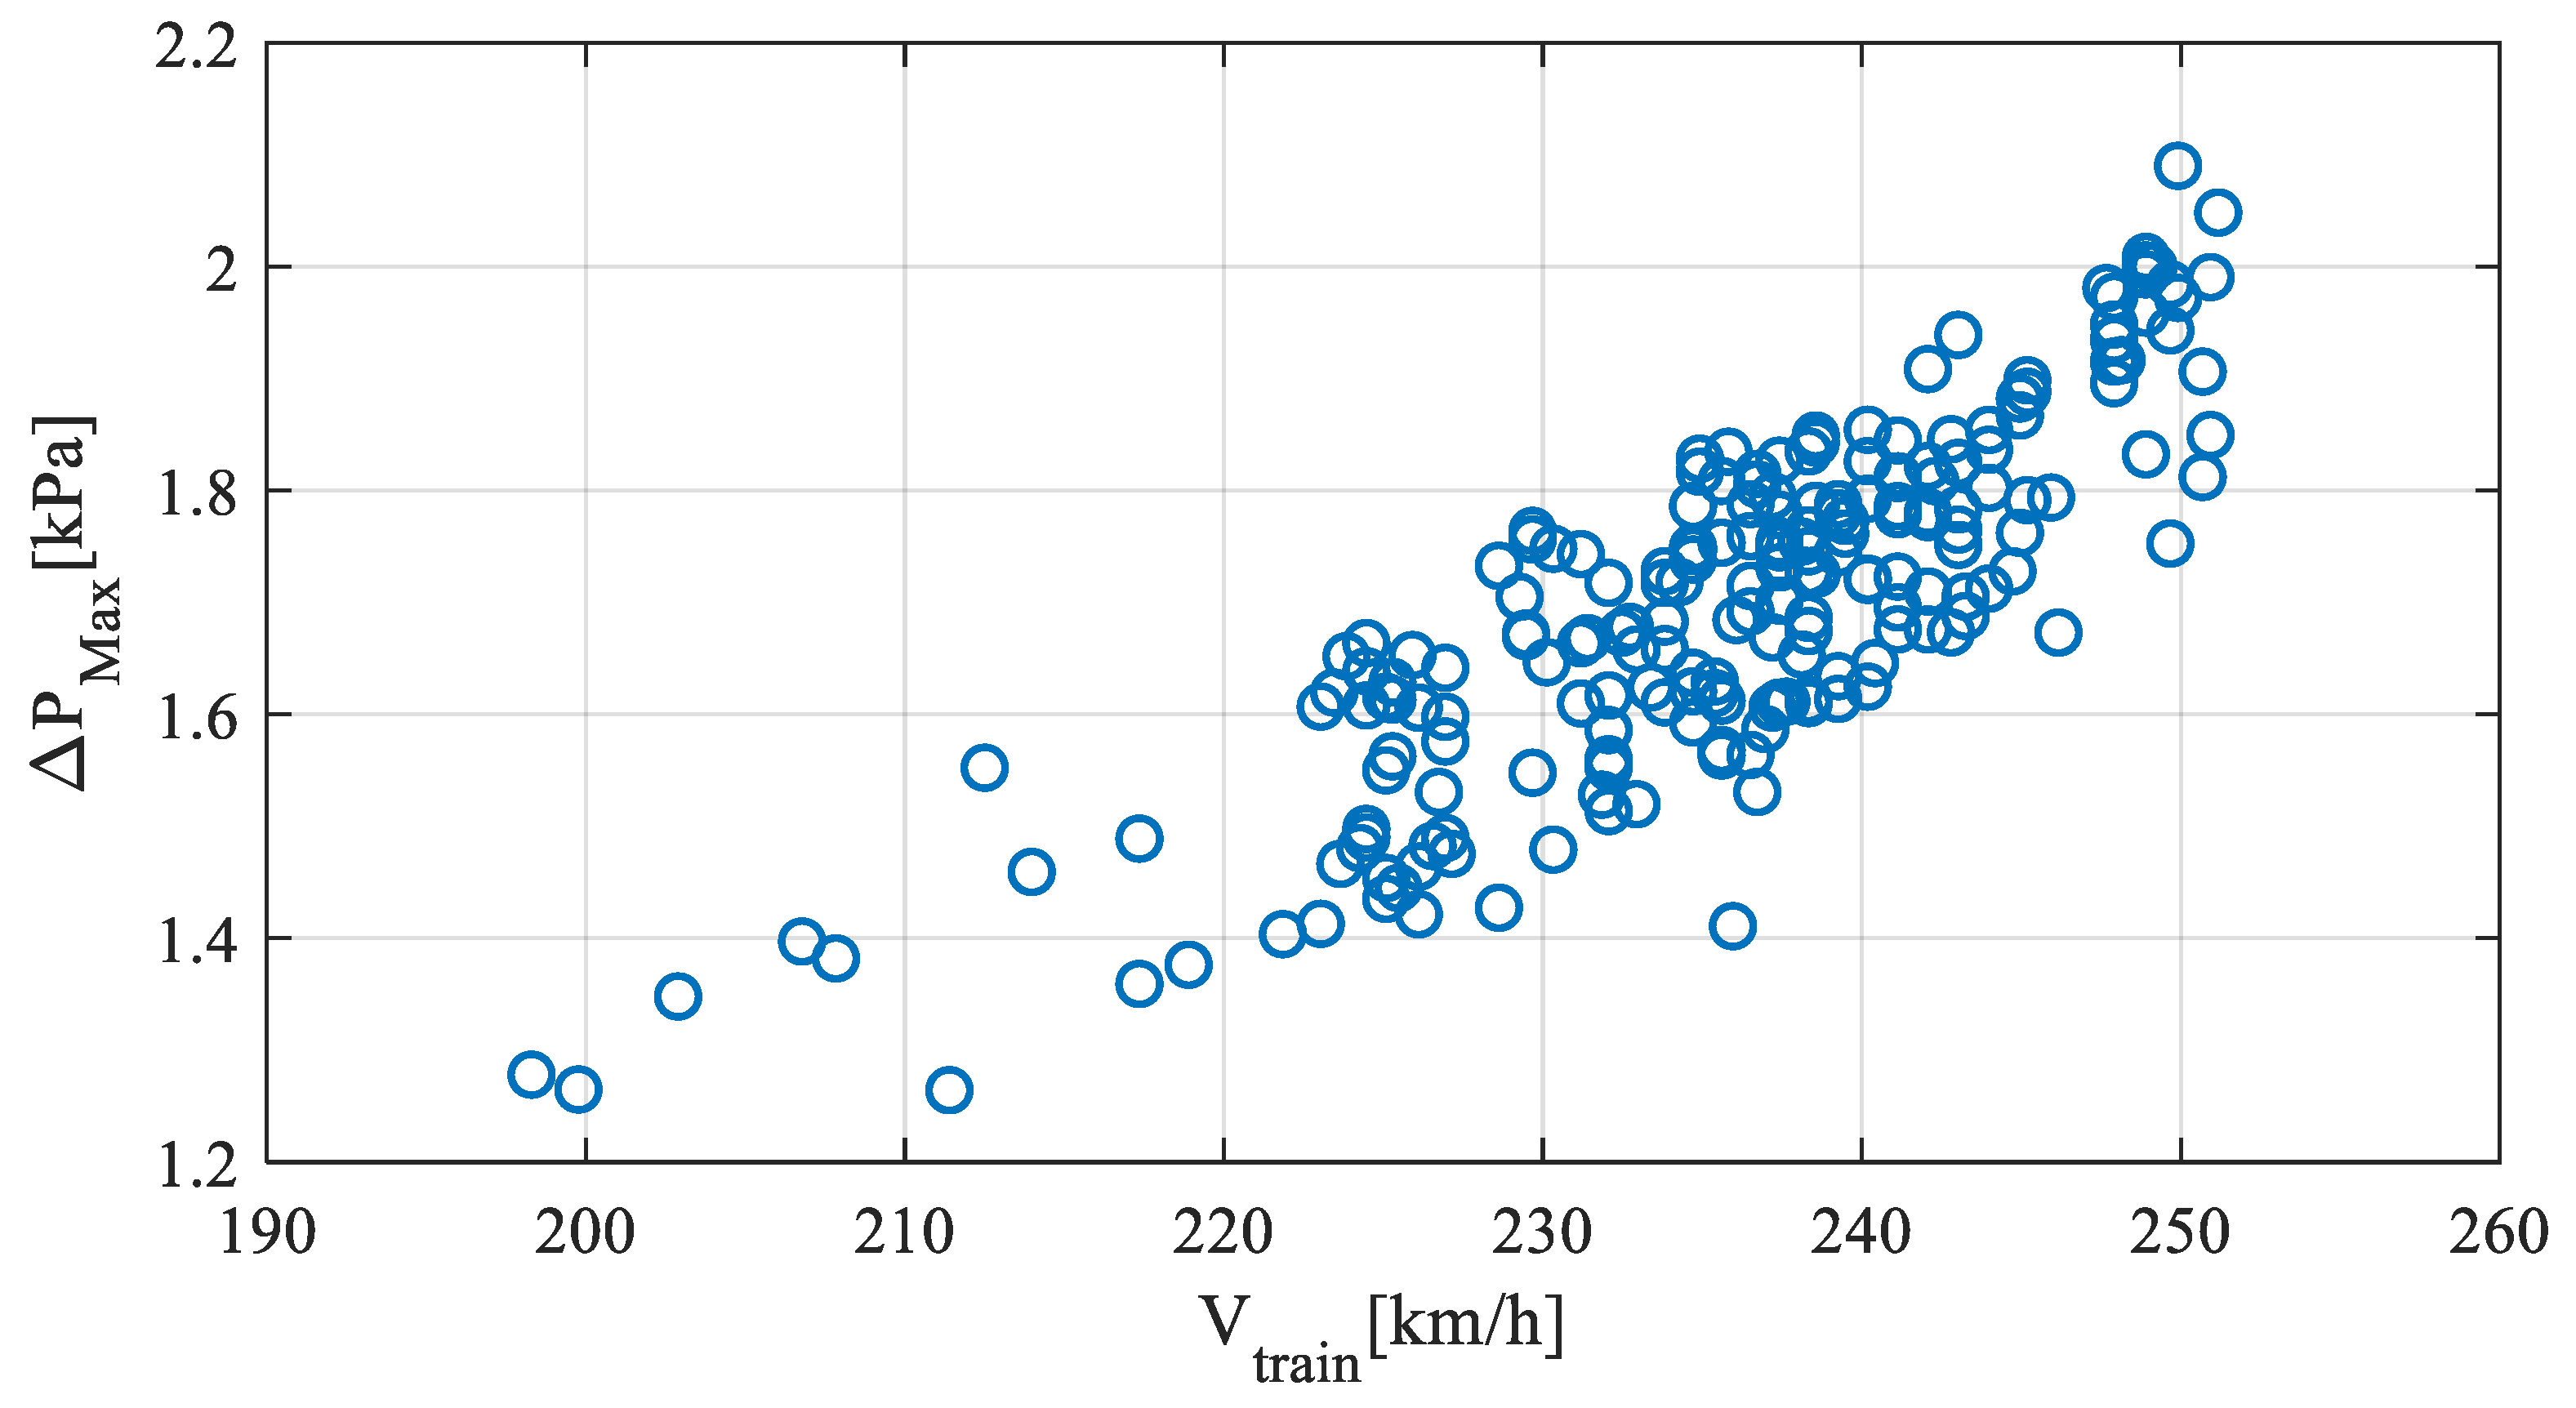
Therefore, if a dependence on airflow is admitted, an analysis has to be carried out to understand how the initial air flow effects the pressure signature. To underline the differences due to different initial conditions, Figure 4 shows 203 single passages in a 2700 m long tunnel of the same type of HS train in the selected speed range 200–250 km/h, analyzing the initial residual pressures waves and imposing a limit threshold of 20 Pa.
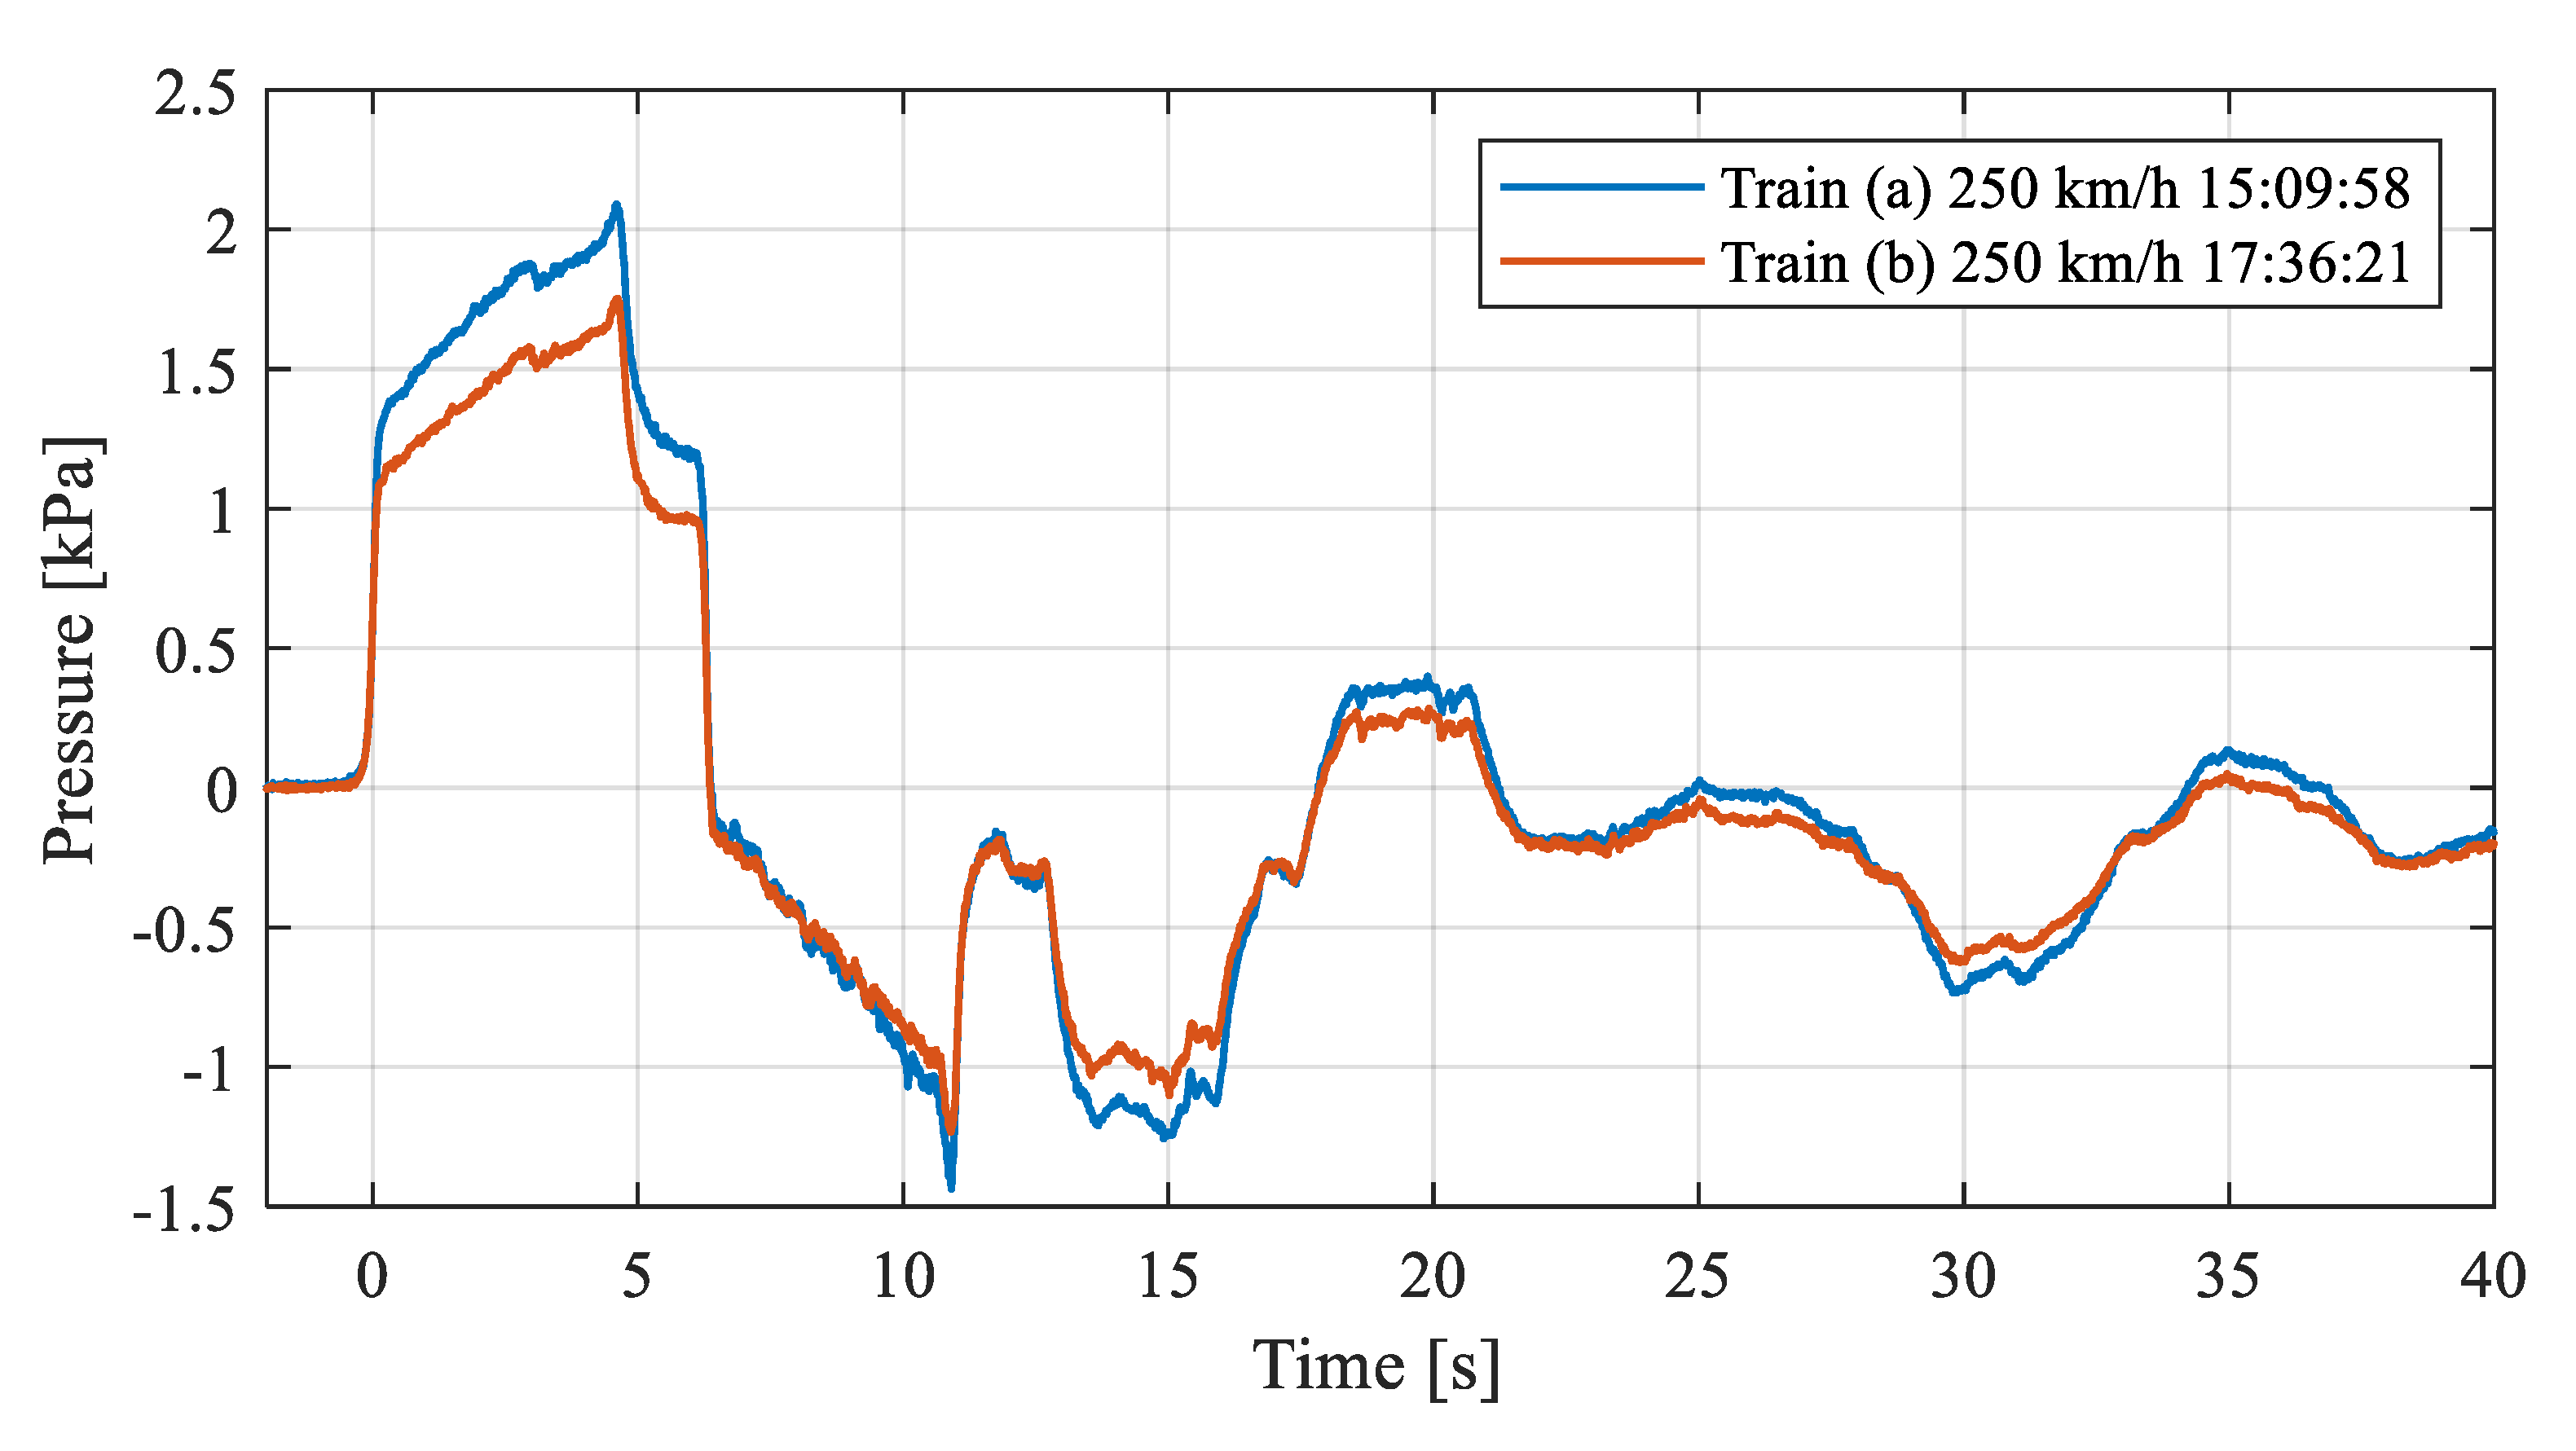
In order to highlight the differences due to different initial conditions, in Figure 5, the maximum pressure measured ΔPmax is reported as a function of the speed. Although the passages have been selected considering the residual pressures waves, the dispersion of the result is quite wide, i.e., it is about 300 Pa and it cannot be explained by the environmental condition. By way of example, in Figure 6, two passages performed at the same speed within only two hours are reported. From the comparison, the differences between the two histories are clearly visible, particularly as regards the ΔPN of both the TWS and of the TNS. In the first case, the ΔPN is much bigger and the friction region has a larger slope, while, after this first part, the two curves overlap perfectly.
In order to better understand the cause, the passages preceding those shown in Figure 6 are also analyzed. The timetable of the four considered passages, together with their direction, is shown in Table 1.
The differences of the first part of the pressure signature can be explained by the different initial conditions due to previous trains: in the first case, the previous train was run at opposite directions, while in the second one, the train had the same direction as the one analyzed.
Unfortunately, in this experimental campaign it was not possible to place an anemometer inside the tunnel and, therefore, it was not possible to directly identify the dependence of the pressure signature on the speed of the flow within the tunnel. On the other hand, the numerical simulations also do not account for this effect and, consequently, 1-D codes could underestimate the real values in case of two trains crossing.
Finally, it must be stressed that the analyses carried out were based only on the maximum pressure, without considering the different parts ΔPN, ΔPFR, and ΔPT. However, the evaluation of these values is subjected to other uncertainties that are beyond the results shown (identification of the changing point between the ΔPN and the ΔPFR or the lower value of the ΔPT). The analysis is postponed until further details will be presented in the standard for the evaluation of the different ΔP contributions.
2.3. Track Side Influence
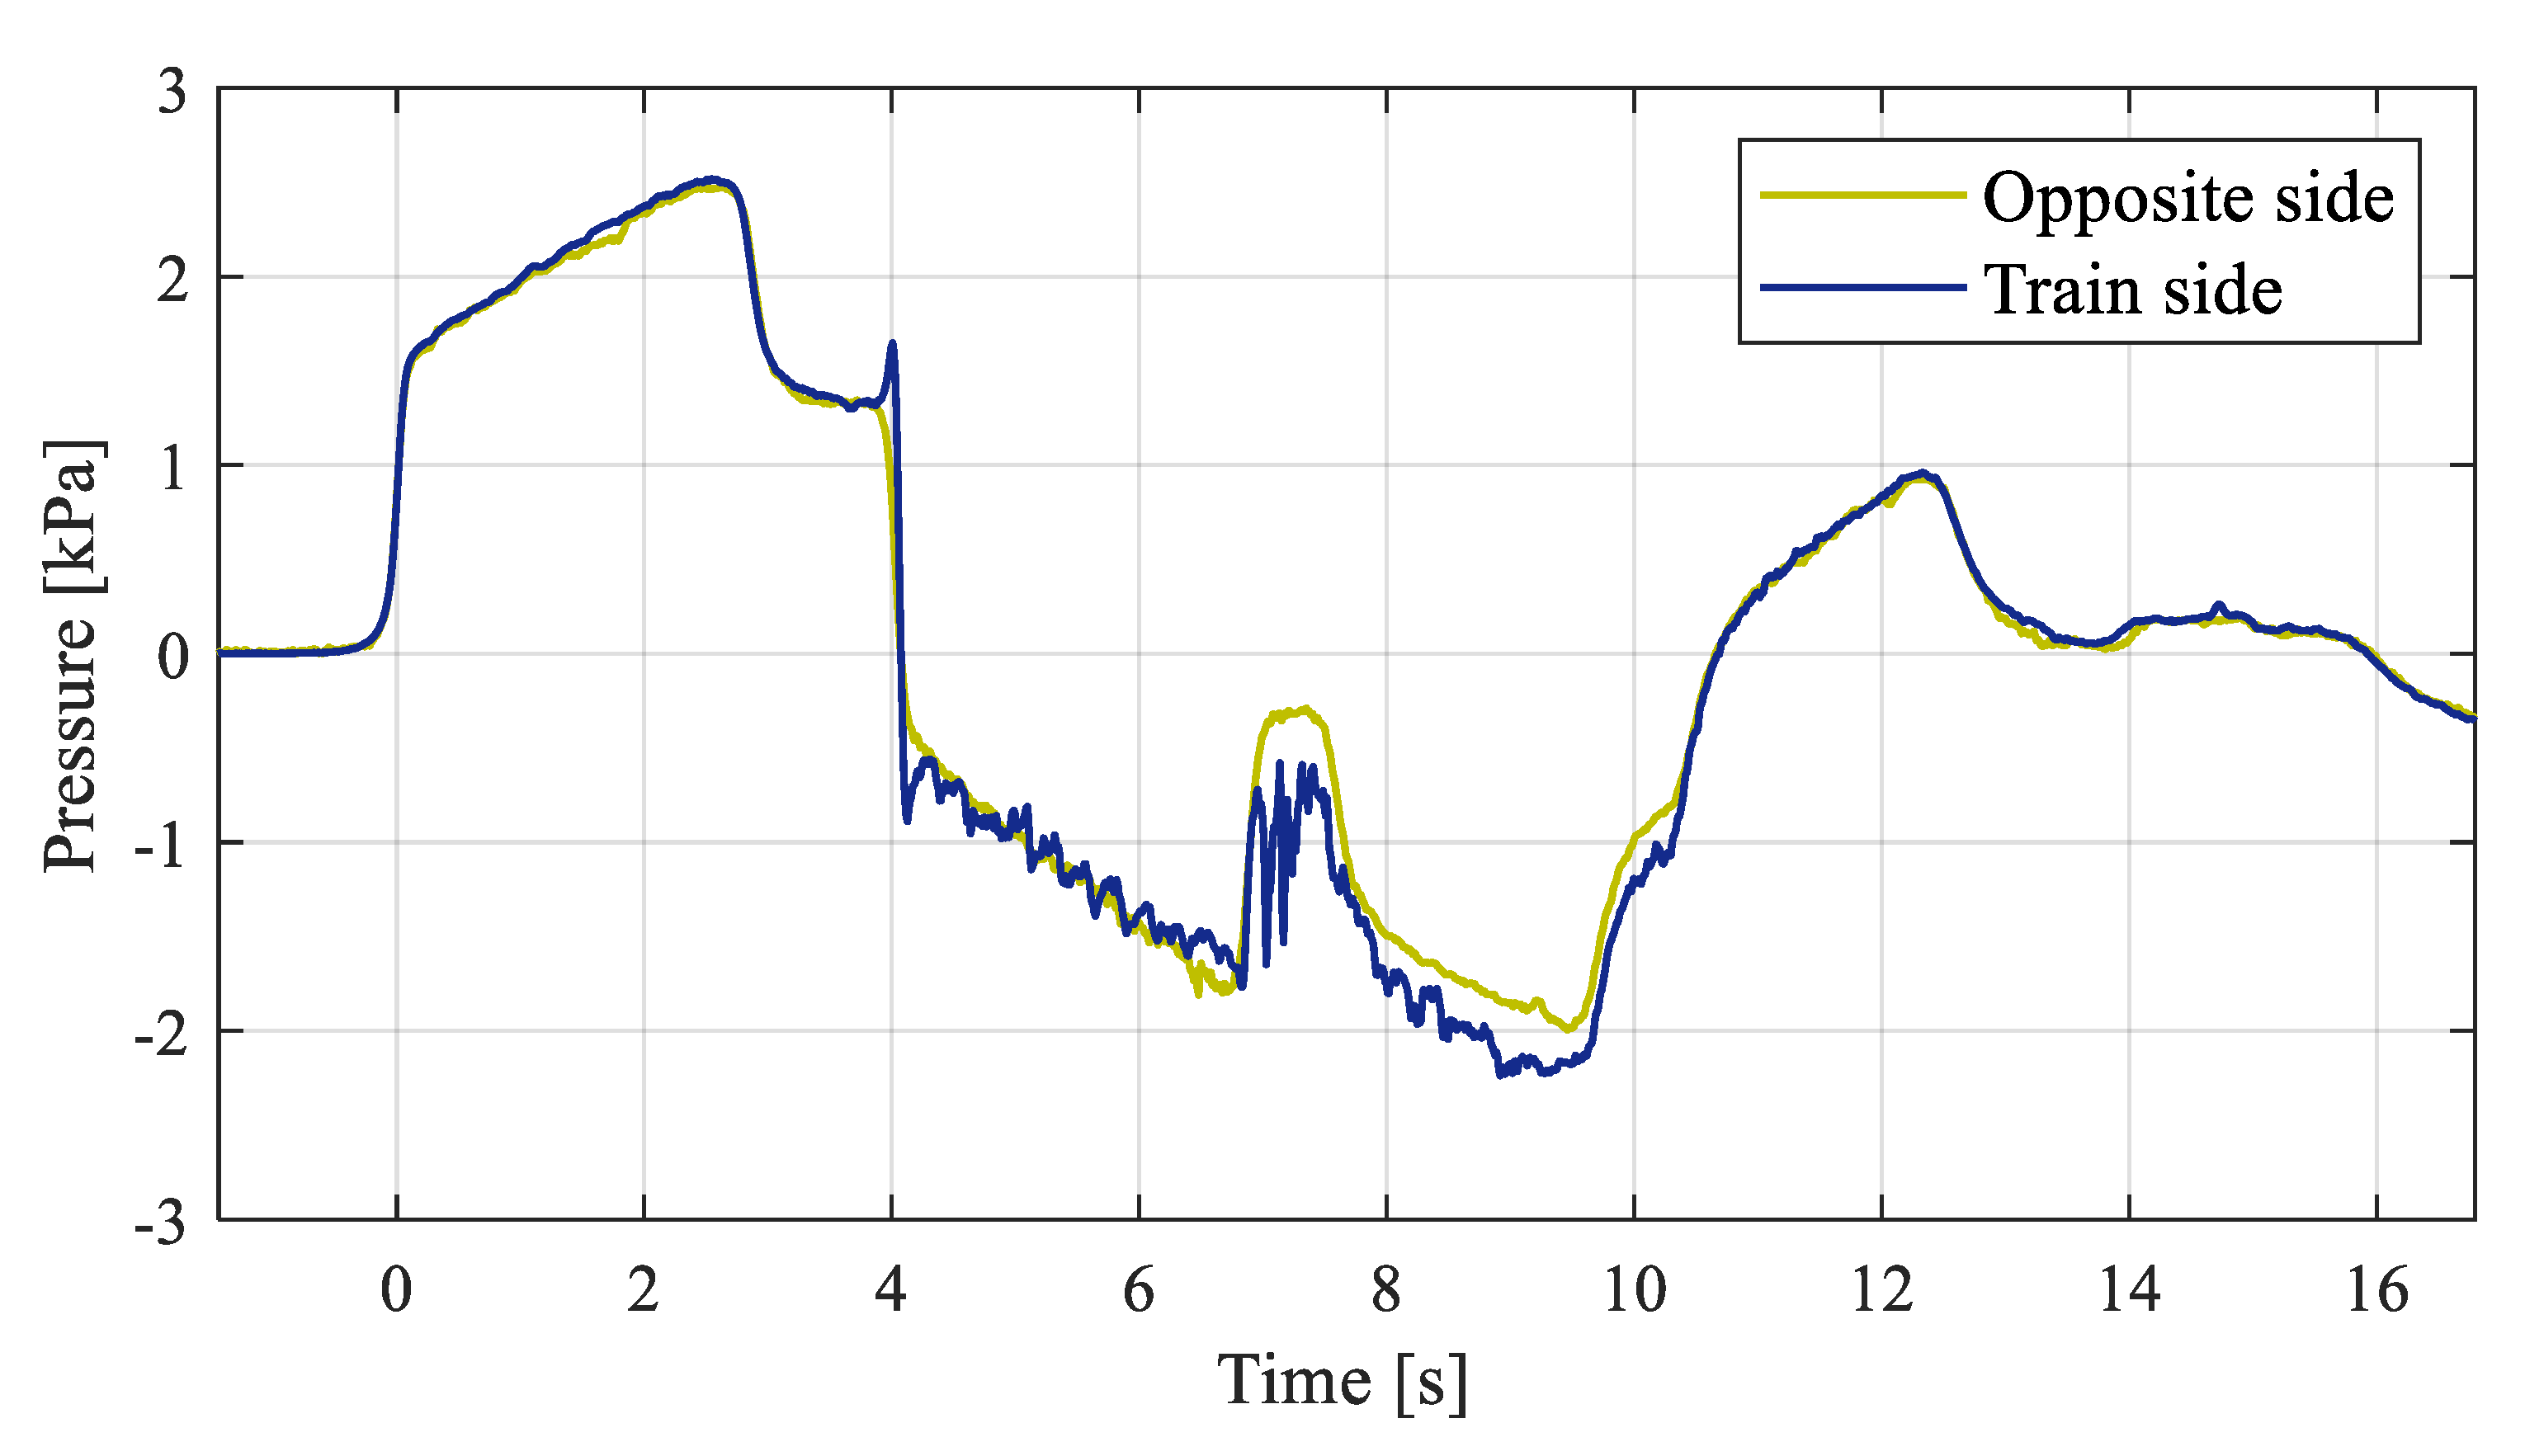
Since in the standards there is no indication (for double track tunnels case) on the side of the track where to place the sensors, the pressure was measured on both sides of the tunnel: on the side of the train (at about 1 m from the lateral surface of the train) and on the opposite side (at about 6 m from the lateral surface of the train). An example of the comparison is shown in Figure 7. As could be expected, there are no differences in the pressure changes due to the pressure waves traveling at sonic speed: the pressure signature and also the evolution after the train passage are not influenced by the position of the sensor. On the other hand, the measure taken closer to the train (the TNS at 4–7 s) is highly affected by the pressure field running with the train. In detail, during the passage of the nose, the pressure is characterized by the typical positive and negative fluctuation, while along the train the oscillations due to the carriages are more evident and, above all, the wake behind the train modify the pressure evolution for about three seconds.
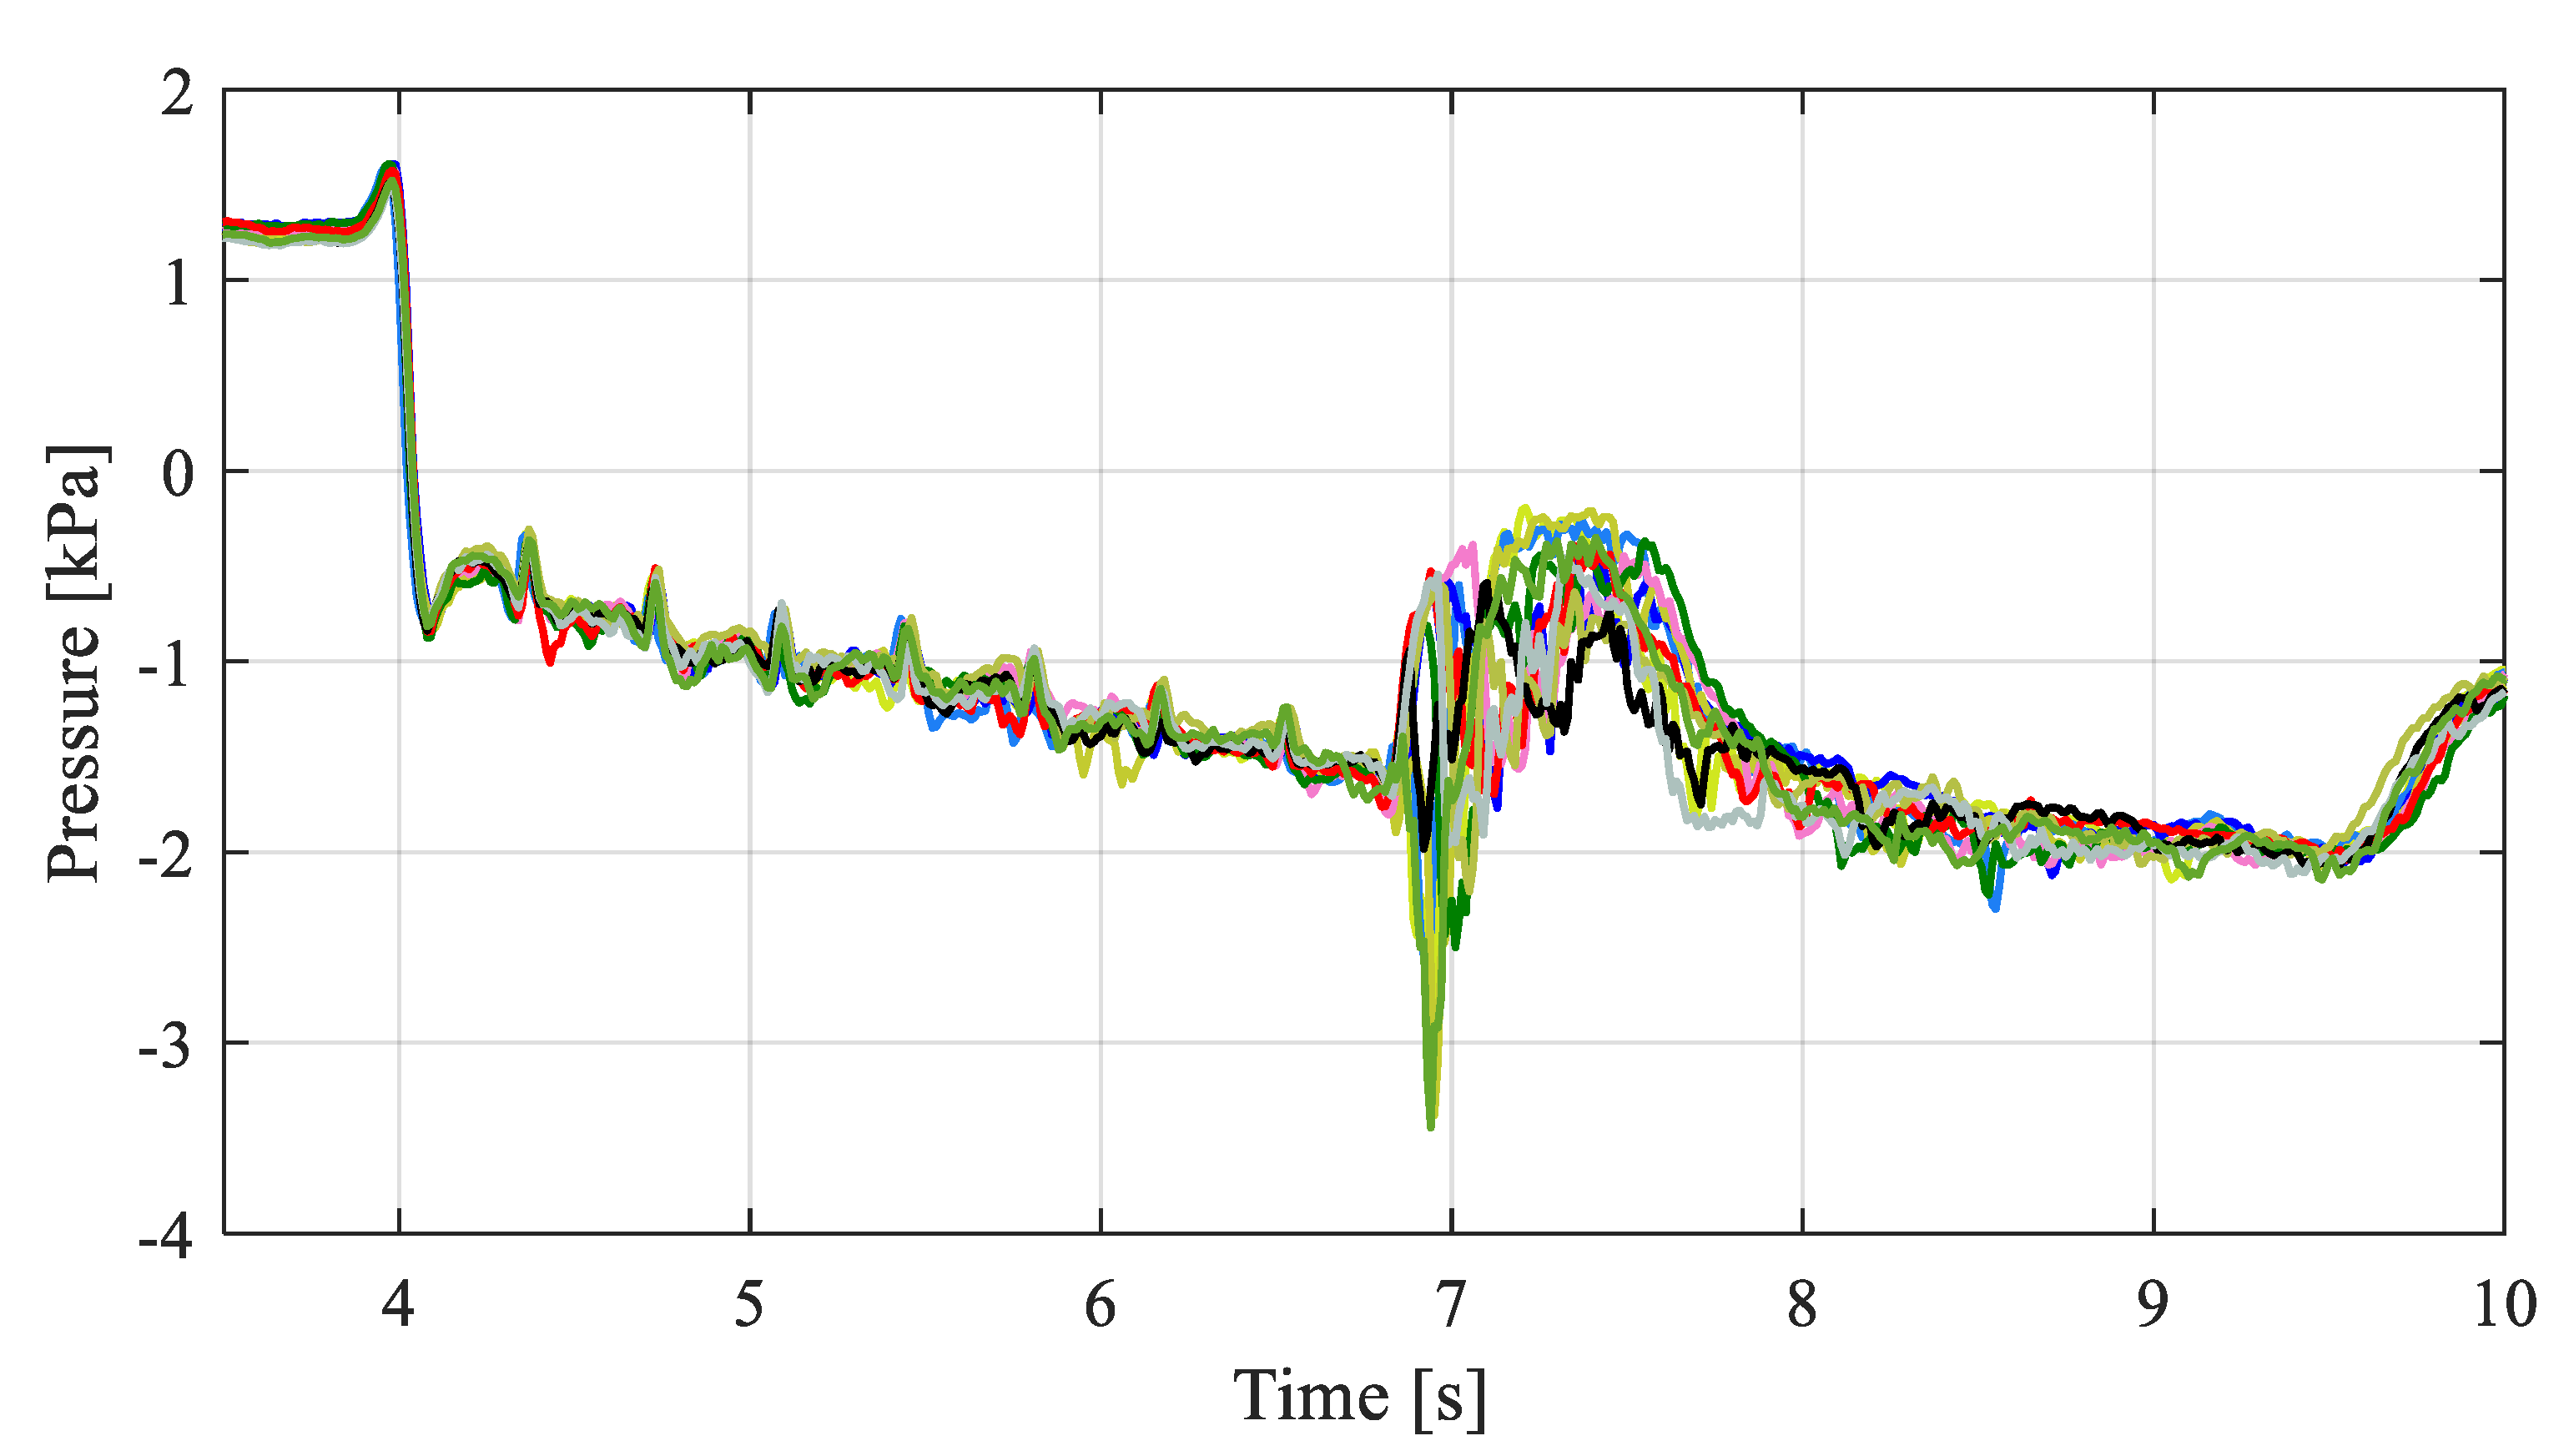
Although the differences due to the head and the cars are quite small, they are deterministic, since they depend on the geometry both of the nose and of the inter-car gap (they are clearly visible even in CFD studies [38]) and they could be implemented in 1-D computational codes. On the contrary, the wake region is characterized by high fluctuations and the pressure can vary by thousands of Pascal, as is clearly visible in Figure 8. Furthermore, the described effect cannot be easily introduced into 1-D software and it would also require statistical analysis. Although this is not an issue from the point of view of the pressure comfort on board, since the high frequency oscillations are filtered by the car body, it may generate problems with the TSI limit of 10 kPa.
3. On-Board Tests
The interaction between a train crossing a tunnel and the complex pressure field produced by the traveling waves was also deeply investigated through full-scale experimental tests measuring the external and internal pressure on a sealed HS train (τdyn > 10 s) and on an unsealed conventional train (τdyn < 1 s). The experimental results collected on-board can be used to calibrate both the parameters of the software used for the numerical reproduction of the pressure waves in tunnel and the models utilized for the computation of the internal pressures.
3.1. Experimental Setup
In order to study the pressure field that surrounds the train, probably the best solutions would be to drill holes through the train surface to obtain pressure taps, as in the case of wind-tunnel tests. Unfortunately, it was not possible to adopt this solution because of the commercial use of the trains after the tests. Therefore, an alternative solution had to be adopted. Two fairings (visible in Figure 9) have been designed in order to solve the issue: the thinner one (about 8 mm in height) is used to house the pressure tap, the thicker one (about 25 mm in height), placed in a higher position, is used to house the pressure transducer, while a tube brings the pressure from the first to the second fairing. Both the fairings are held in a position about 2.5 m above the top of the rail by using sailing boat adhesive tissue in order to avoid unwanted detachments and to guarantee a good durability with regards to sun and wind pressure. Using the proposed solution, it was possible to measure the pressure distribution along the train, as visible in Figure 10. This arrangement was validated through previous experimental campaigns measuring also the pressure exactly on the outer wet surface of the train (in that case, it was possible to drill a hole through the surface of the laboratory train used for the tests). The comparison between the data acquired with and without the fairings did not show significant effects from the point of view of both the amplitudes and the frequencies.
To measure both the external and the internal pressures, barometric sensor AMS 4711 were used. All the sensors were individually calibrated showing an uncertainty of about 40 Pa in the pressure and in the frequency range of interest.
3.1.1. Sealed Train
In order to evaluate the aerodynamic features of an HS sealed train, a test train has been equipped on almost every coach and in many different positions with 15 absolute pressure sensors that have been installed along the whole train, inside and outside. Figure 10 reports an overview of the positions of the sensors: eight sensors were glued on the external surface, in the mid of five cars, while seven sensors were placed inside the two cabs and in the mid of five cars. Pressure tight cable glands were used for all the cable passages in order to preserve the train pressure tightness.
This HS train has a length of 200 m, a maximum commercial speed of 300 km/h, a nose length of 6 m, and a smooth and continuous external surface.
3.1.2. Unsealed Train
The unsealed train chosen for the tests is a regional train mainly used by commuters. It is composed of a locomotive from one side, one control car on the other one and from 4 to 6 intermediate bilevel rail cars. Although this train has a maximum speed of 160 km/h, it also runs on some sections of the HS line characterized by an operating speed of 250 km/h. The train is 180 m long with a flat head and separated 25 m long cars without gangways.
To estimate the aerodynamic loads acting on this kind of train during its operation on the HS line, a type specimen of five carriages has been equipped on every coach with pressure sensors, both absolute and differential. According to the scheme shown in Figure 10, the sensors were placed in correspondence of the doors of the cars at about 7.5 m from the inter-car gap. Experimental tests were performed both with single train runs and with crossings of a HS train headed in the opposite direction both in open field and within tunnels.
3.2. External Pressure
As the main objective, data shown in the following have to highlight on the one hand the differences between the measurements taken at different position along the train and, on the other one, the repeatability of the measurements performed.
3.2.1. Single Train Case
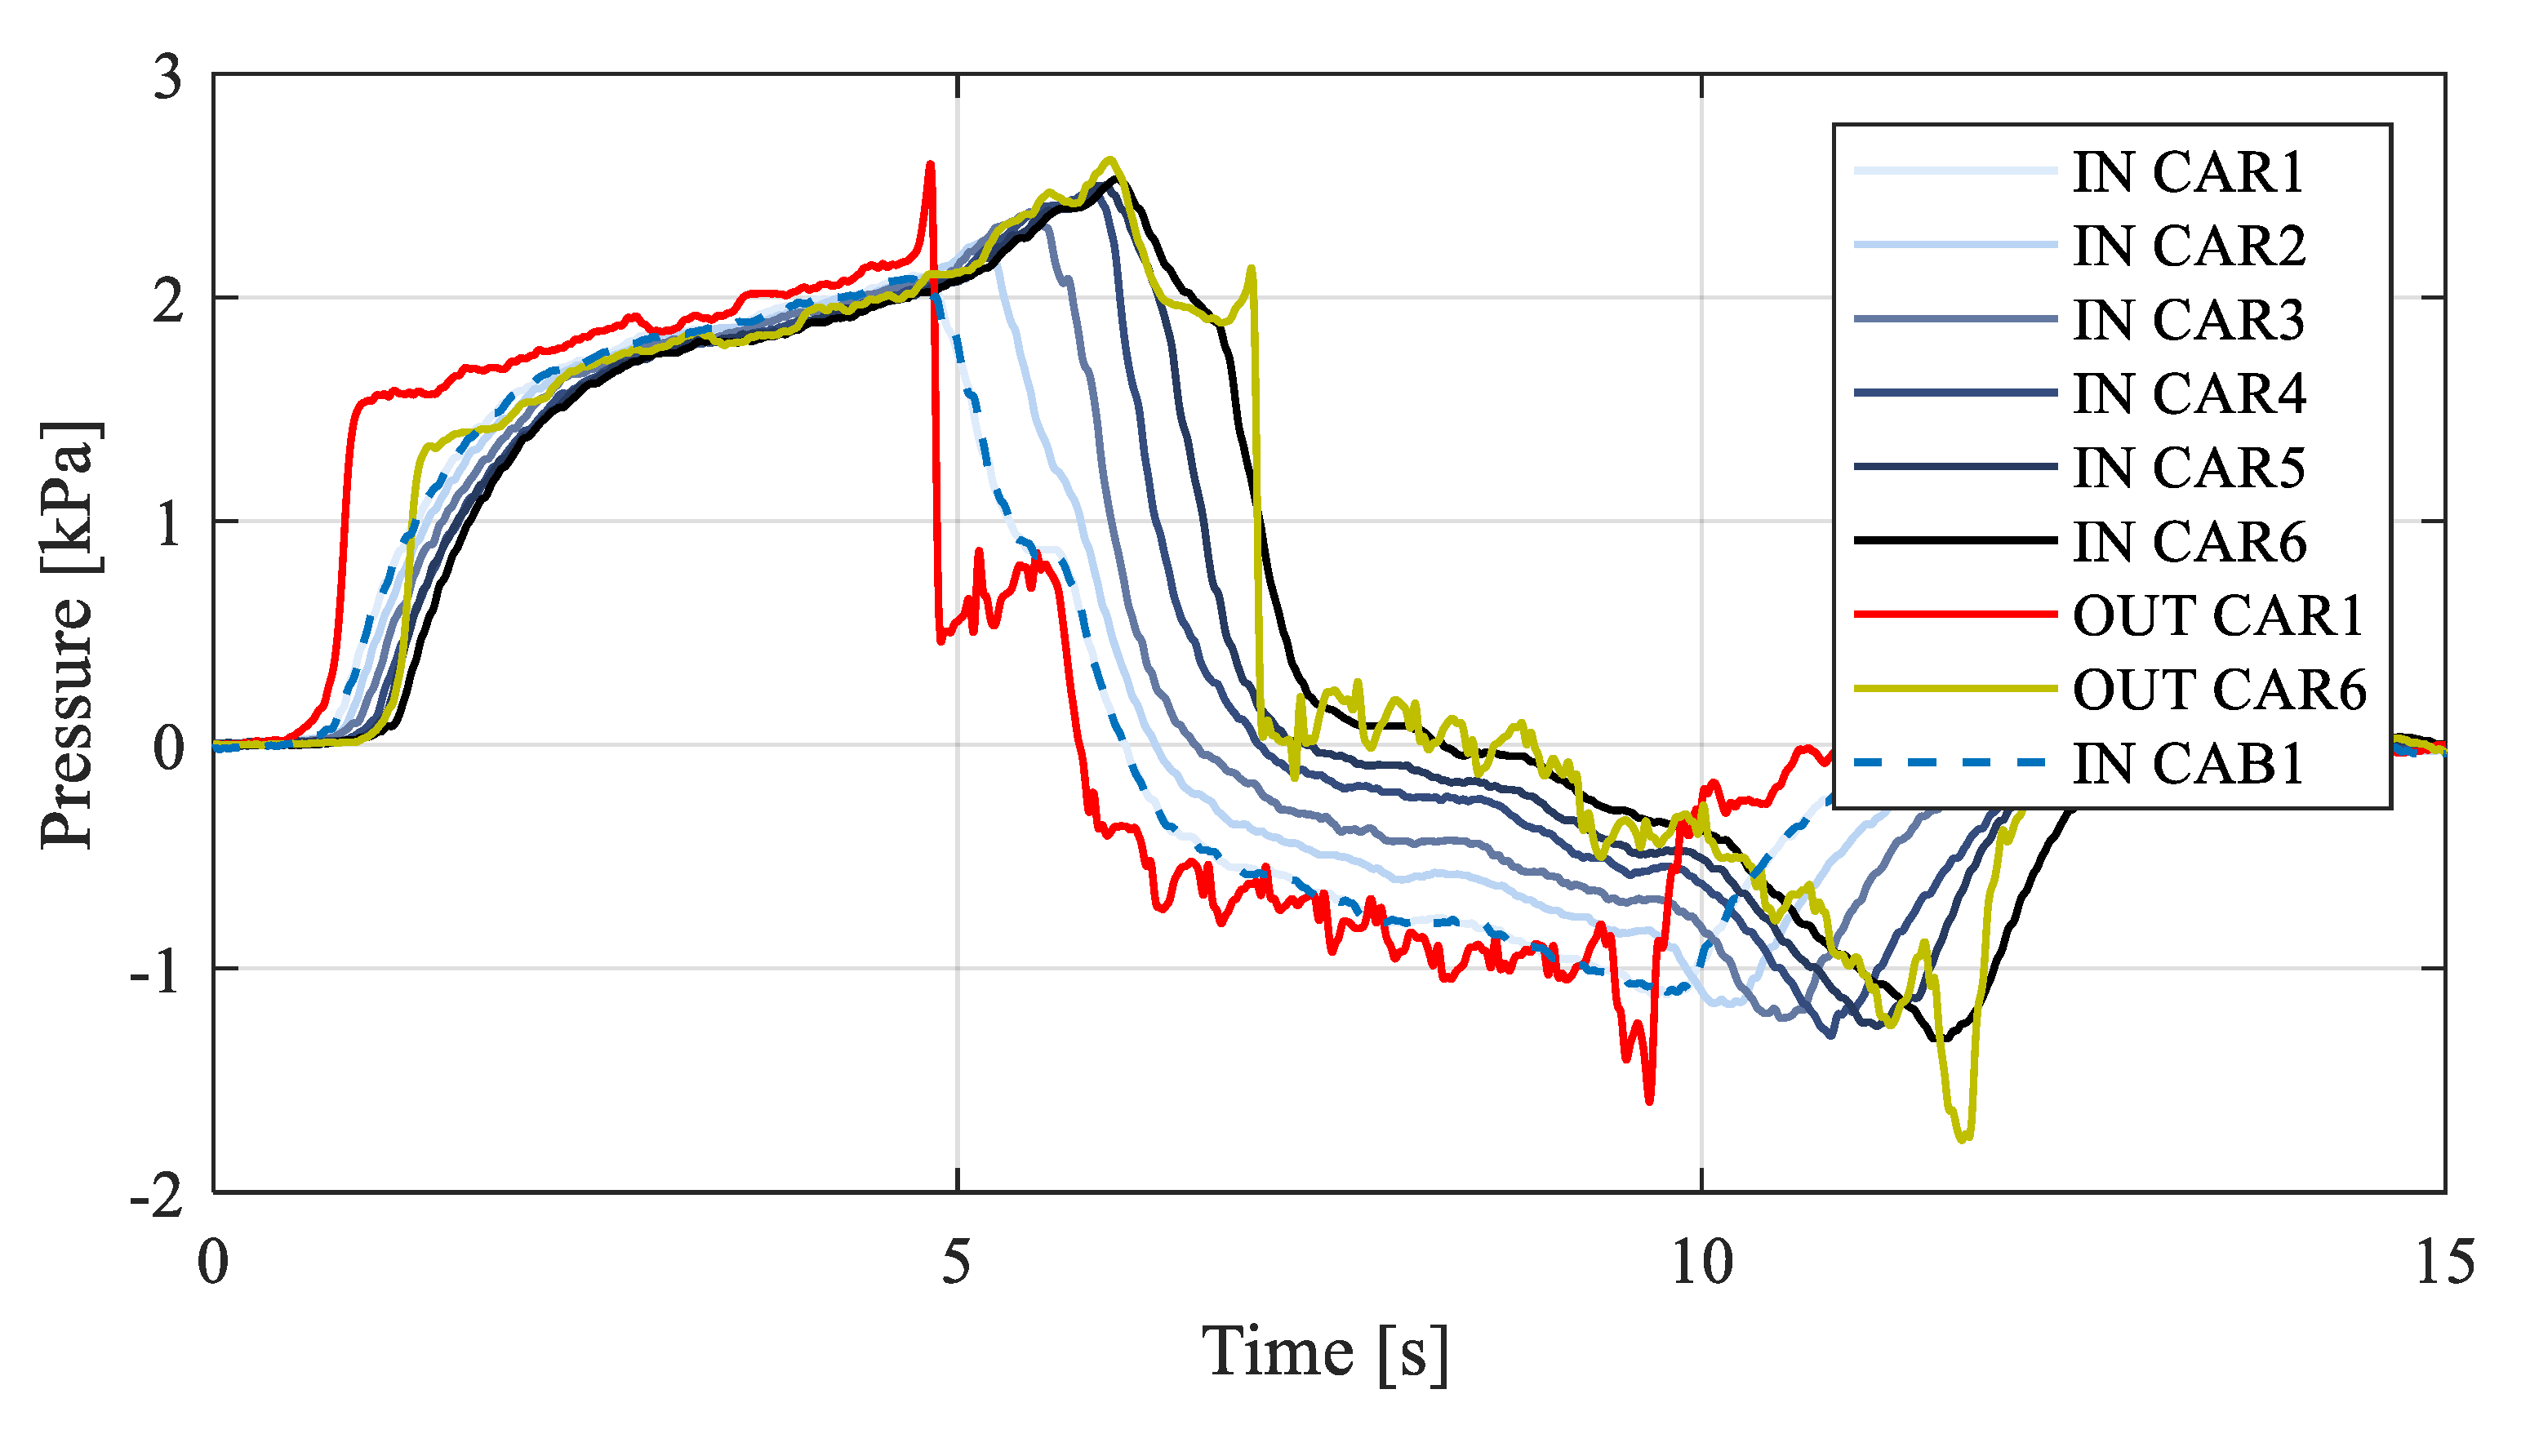
Figure 11 reports the results obtained during a crossing of a generic tunnel with a constant speed of 250 km/h. Figure 11a shows the values acquired from all the sensors on one side in correspondence of different carriages. The major differences can be noted during the entry of the train in the tunnel. The sensors along the train are affected by the rise due to the friction, while this does not happen for the sensor closest to the tail. The differences acquired in this first part remain constant throughout the crossing of the tunnel and represent the steady pressure field identified by the TNS.
Another useful and interesting comparison is the one presented by Figure 11b using sensors in the same longitudinal position but placed on opposite sides of the train. As it can be seen, the pressure along the whole train is equal on both sides and there are no wall effects on the sensor closer to the tunnel wall, as it was found in [25]. This result is useful for the simulation because it demonstrates the one-dimensionality of the phenomenon.
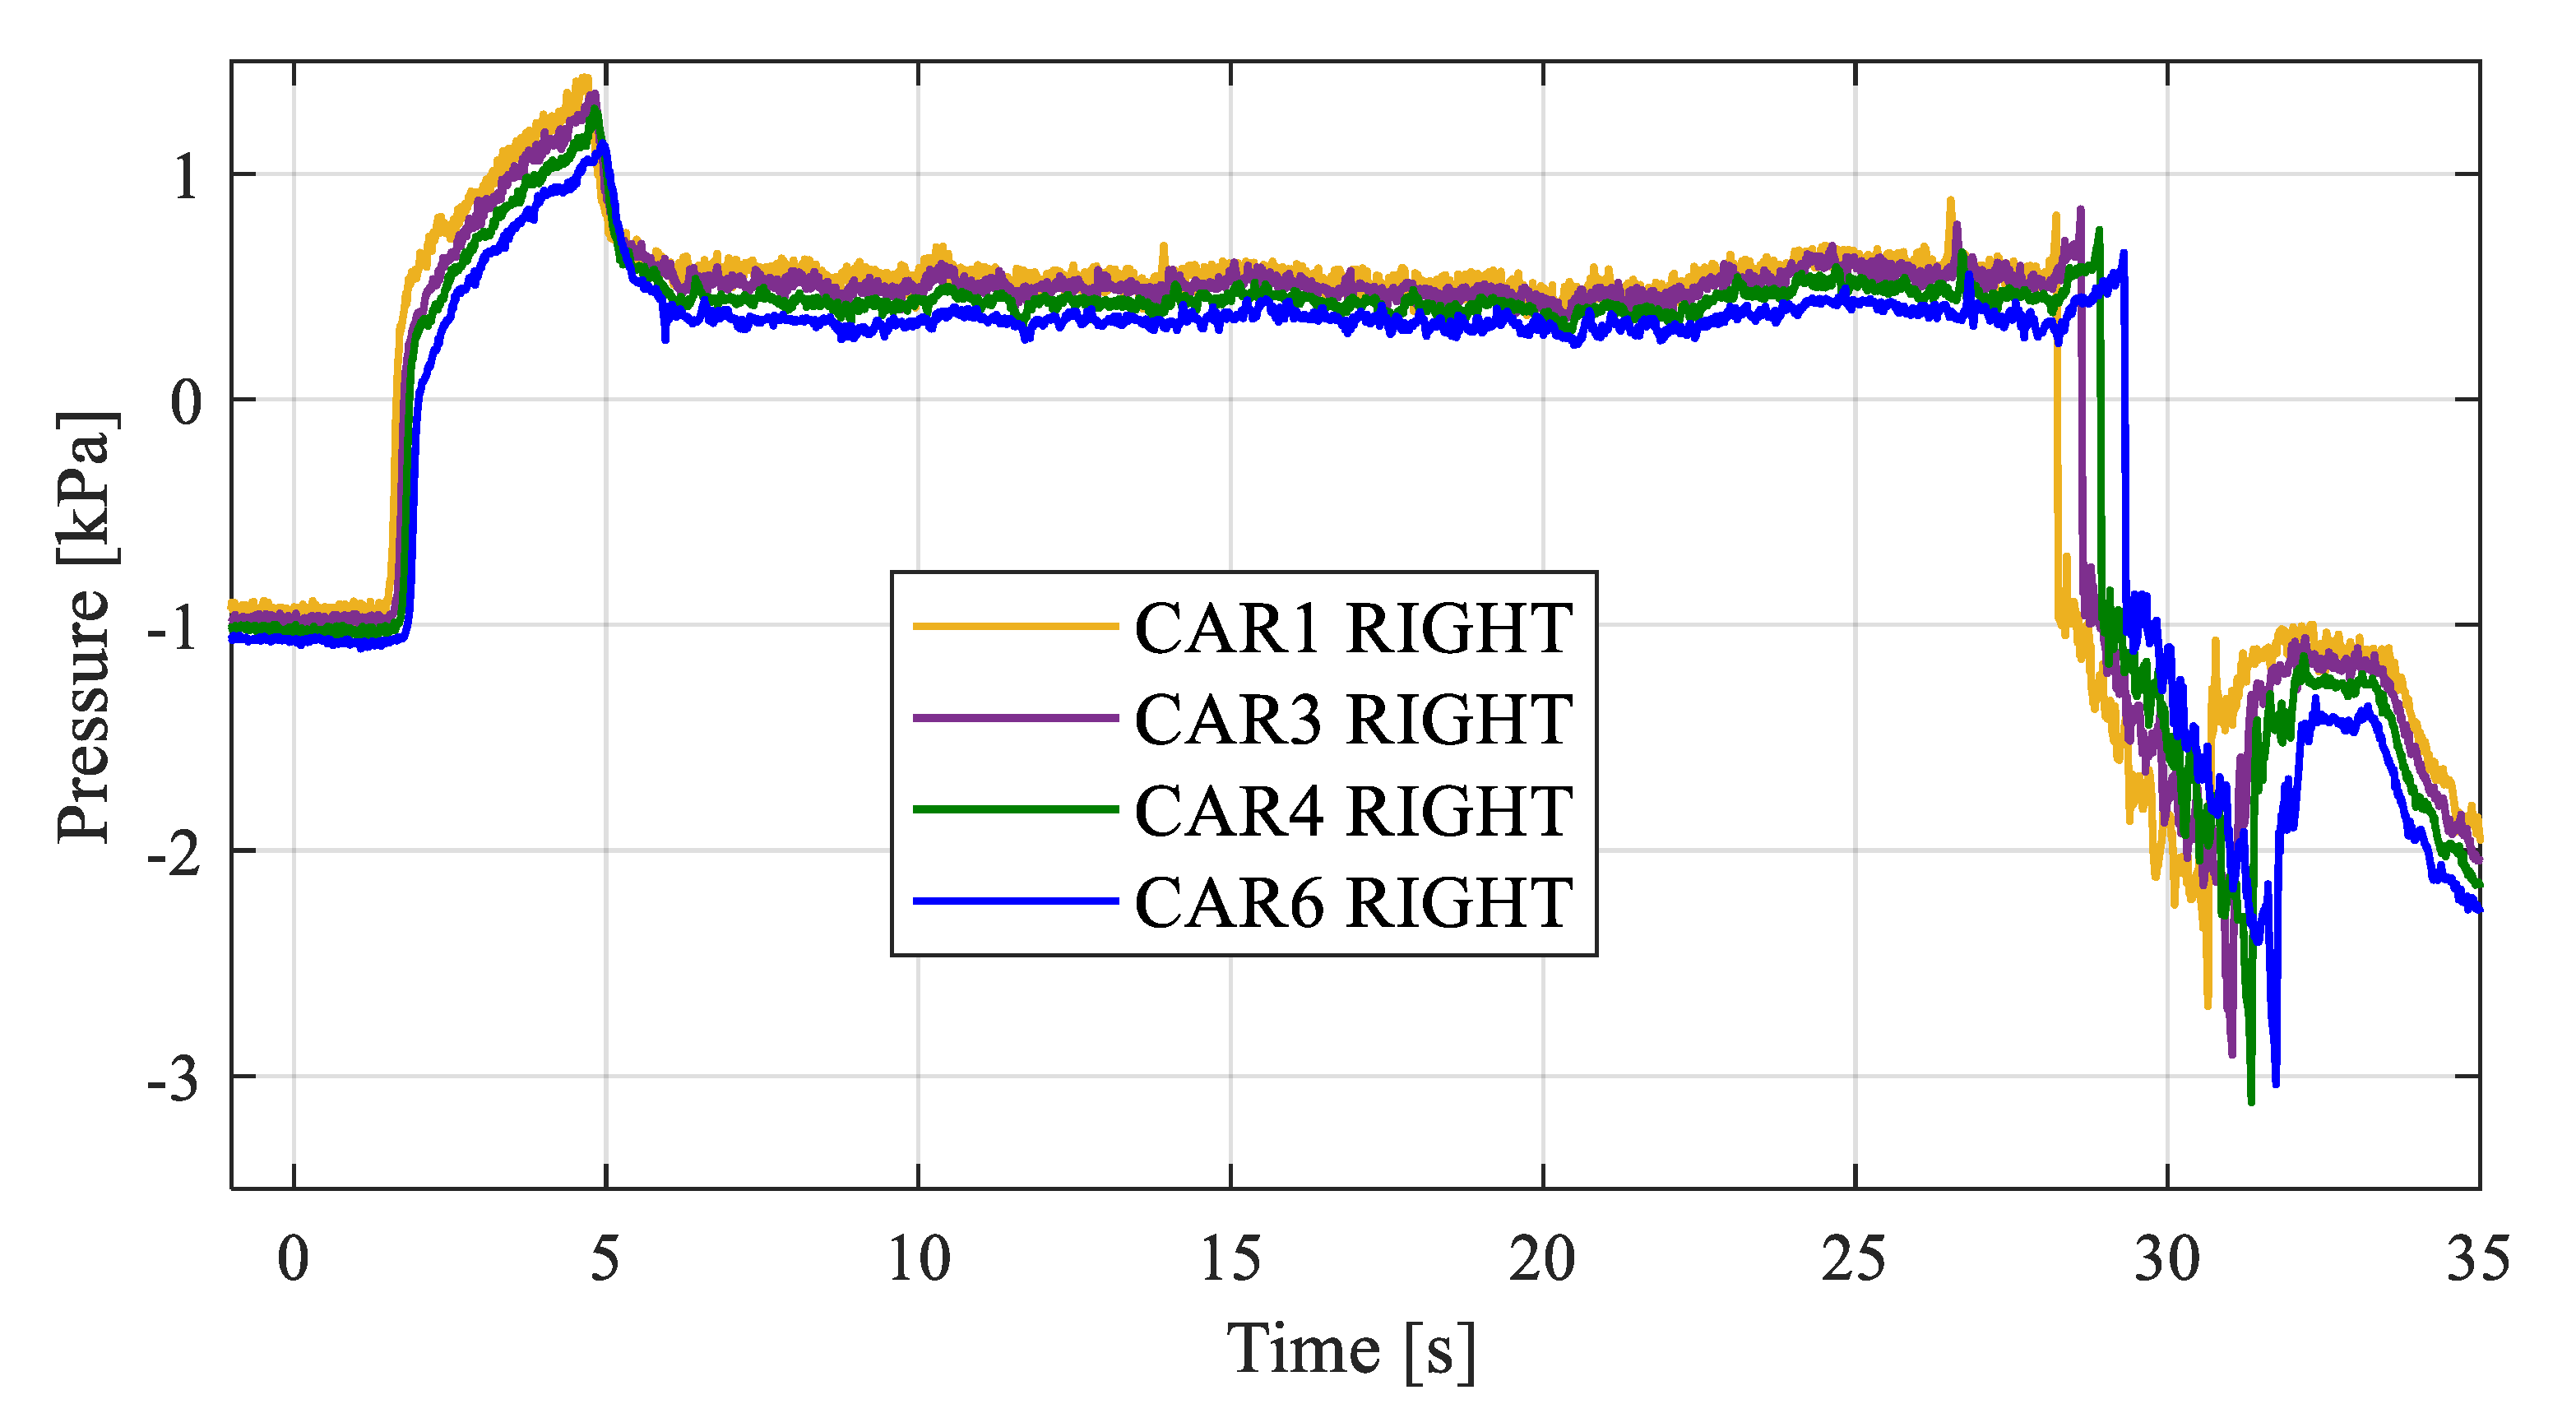
With regard to the repeatability of the results, six different runs, all at the nominal speed of 250 km/h and with the same direction, are superimposed in Figure 12. The differences between all the runs are limited to about 100 Pa. This is an excellent result if account is taken on the fact that on board is not possible to correct the pressure values with the speed of the train or of the air flow, as it can be done with the measurements at trackside for the pressure signature. The temporal evolution of the pressure is greatly affected by the speed of the train not only for the amplitude of the pressure waves generated but also for the chronology of the train-waves crossings.
3.2.2. Crossing of Two Trains
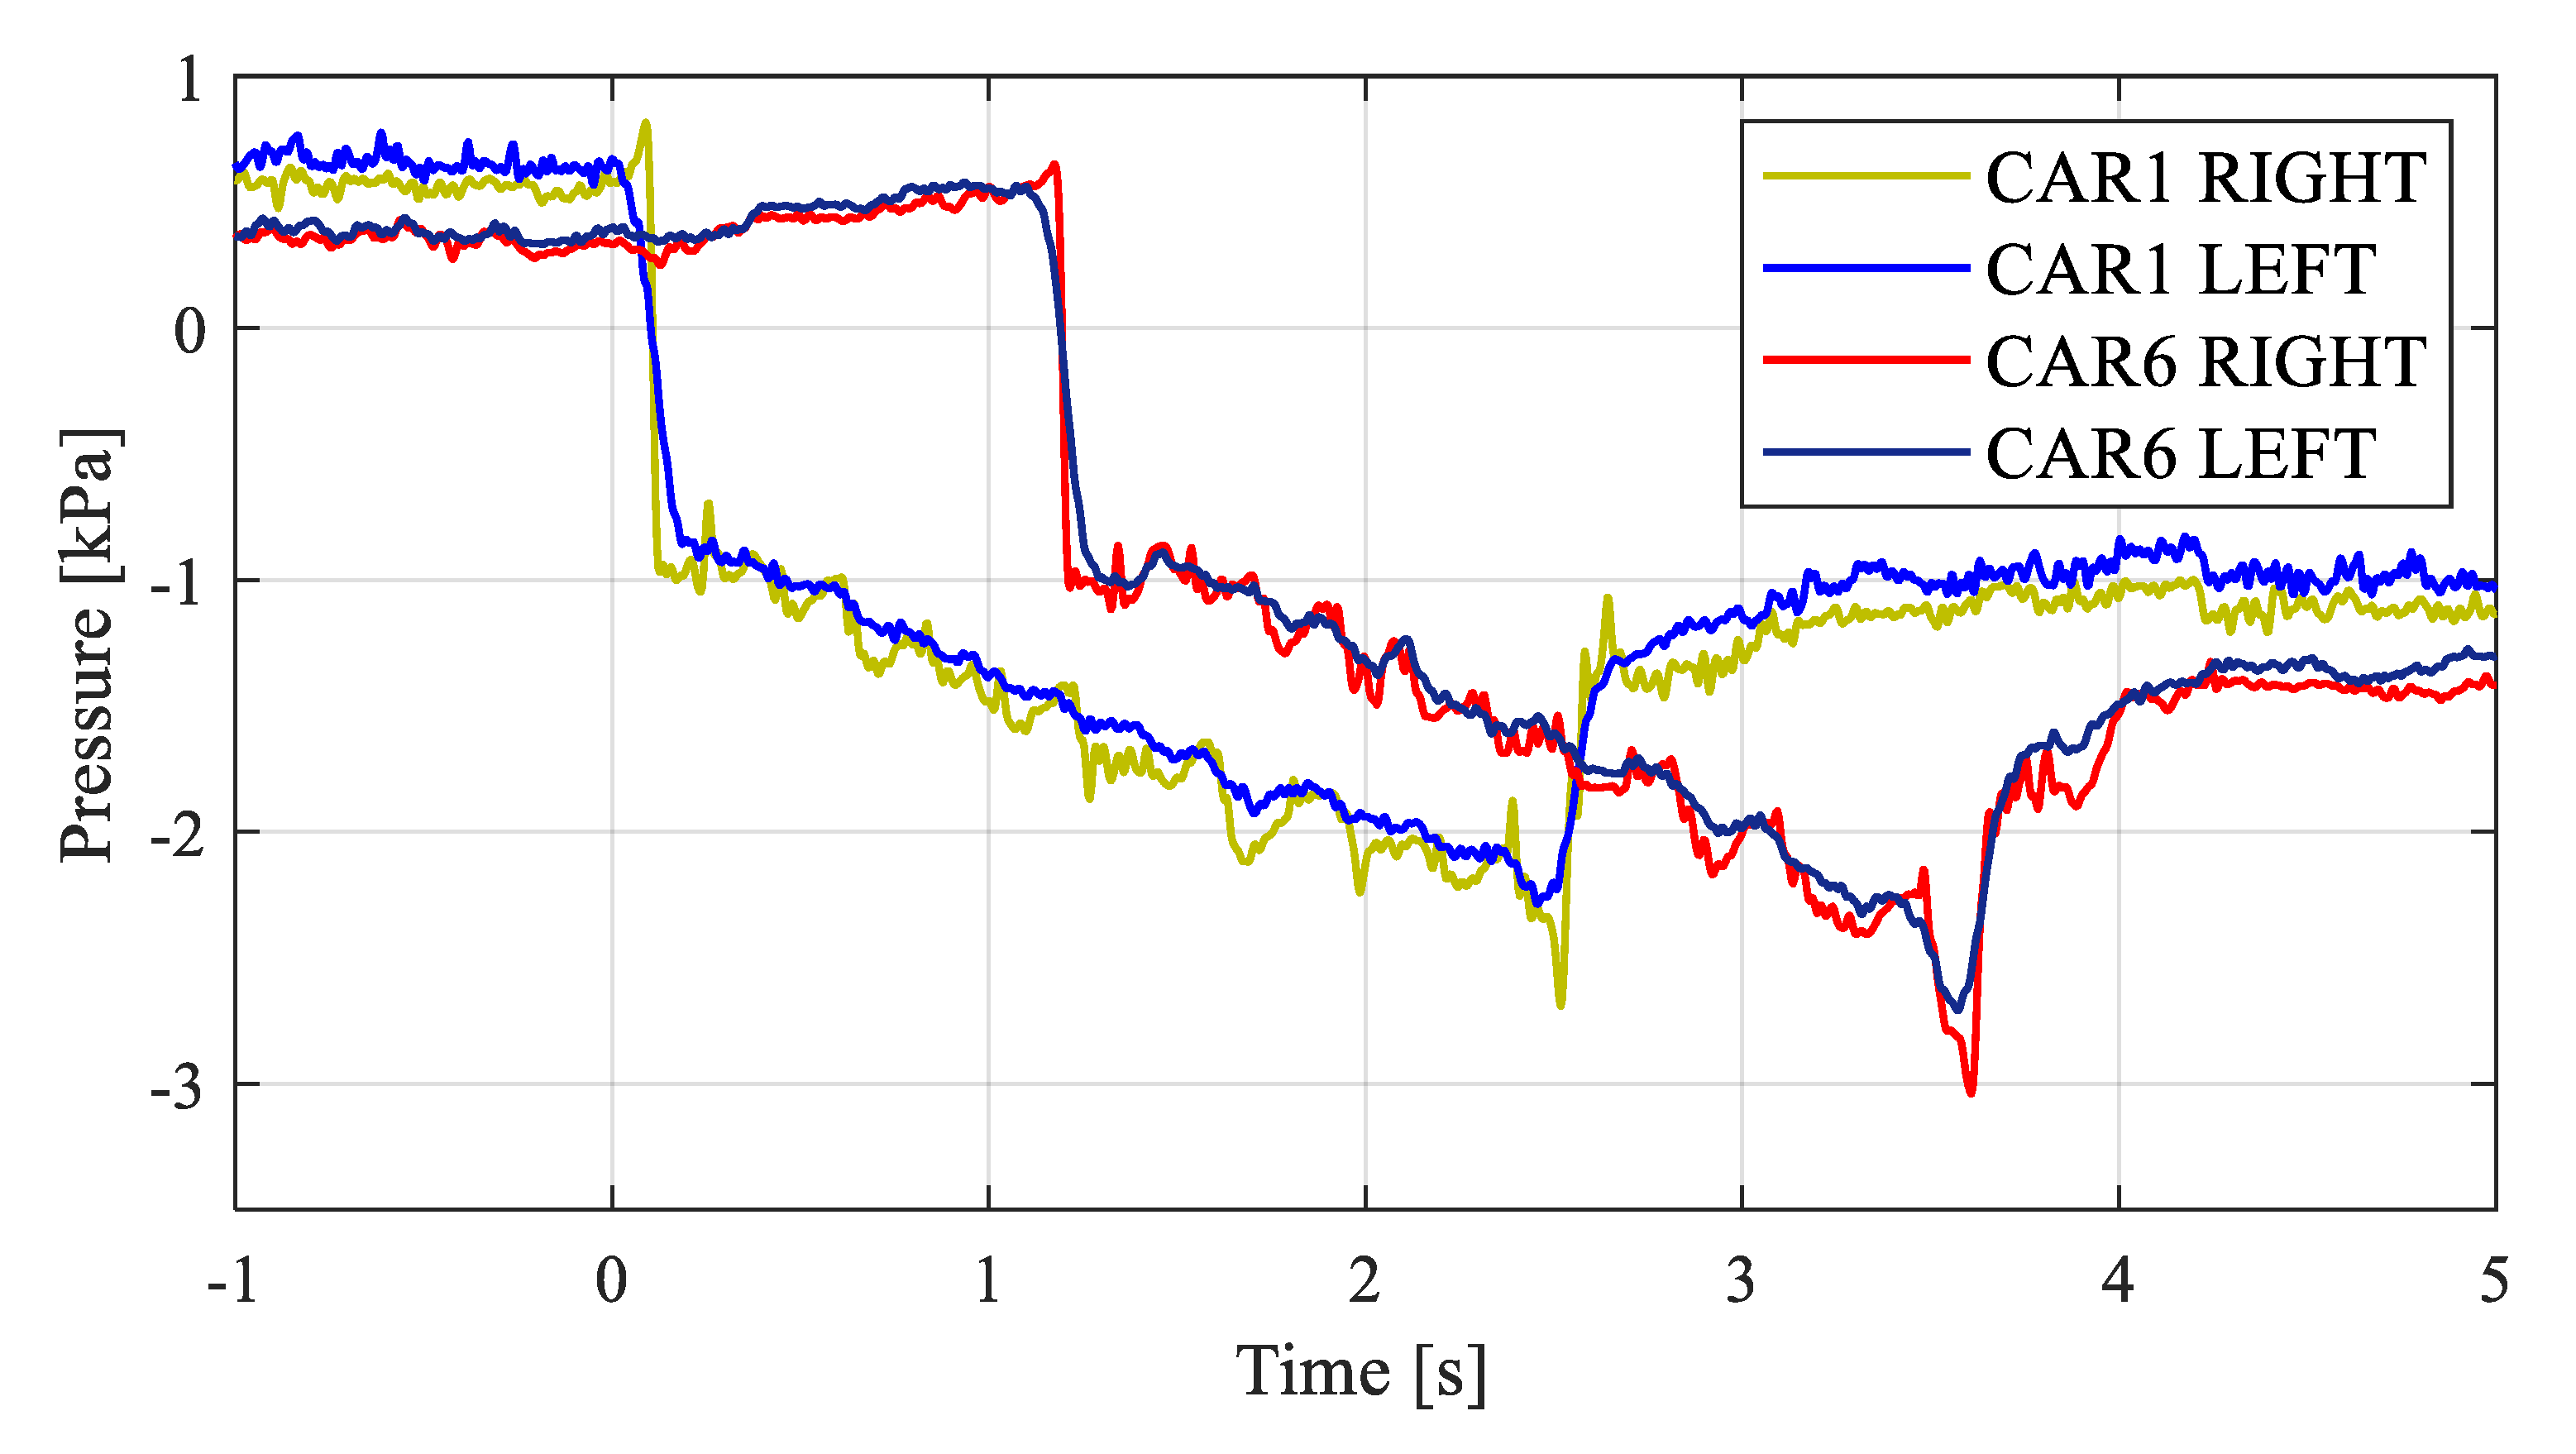
By using the unsealed train, it was possible to carry out some tests crossing HS trains within a tunnel. The crossing shown below was performed inside a very long tunnel (more than 10,000 m long) that allows to separate the various effects isolating the crossing region without overlapping with other pressure waves. Figure 13 shows the pressures measured by the sensor placed on the internal side with respect to the track. The temporal evolution is very similar to that measured from the ground sensors: in the first part it is possible to identify the TWS of the other train and, later, the TNS. Furthermore, as was highlighted in the TRANSAERO project, it is proven that there are not many differences in the pressure evolution during the crossings if the train is stationary or in motion. Additionally, in case of crossing it is possible to make a comparison between the two sides of the train, as shown in Figure 14. The differences between the TNS measured on the two sides are very similar to those shown in Figure 7. The measurement closer to the other train is highly affected by its slipstream, more fluctuations are visible, and the peaks due head and tail passages are more pronounced. On the other hand, no big differences between sensors at different longitudinal positions can be highlighted.
3.3. Inner Pressure
Up to now the pressures generated by the passage of a train in a tunnel was analyzed from the point of view of both the track and the train, but always referring to the outside of the train. In this section, however, the pressure changings within the two types of train will be shown.
While outside the train there are not many differences in the two cases, apart from those depending on the speeds, inside the train the behaviors are completely different. If on the one hand the sealing increases the comfort of the passengers, on the other the high-pressure differences between the internal and external surfaces generate relevant loads on the structure. As regards the unsealed trains, the external pressure is less filtered and, therefore, the on-board comfort is, in general, worse. The advantage is that they do not have to withstand big static loads. However, the dynamic loads at a higher frequency are not filtered and they can lead to fatigue problems over time. On the other hand, the unsealed trains usually travel at lower speeds and, consequently, the self-generated loads are also lower. The problem arises in the case of mixed traffic, i.e., when an unsealed train travels on a HS line crossing HS trains.
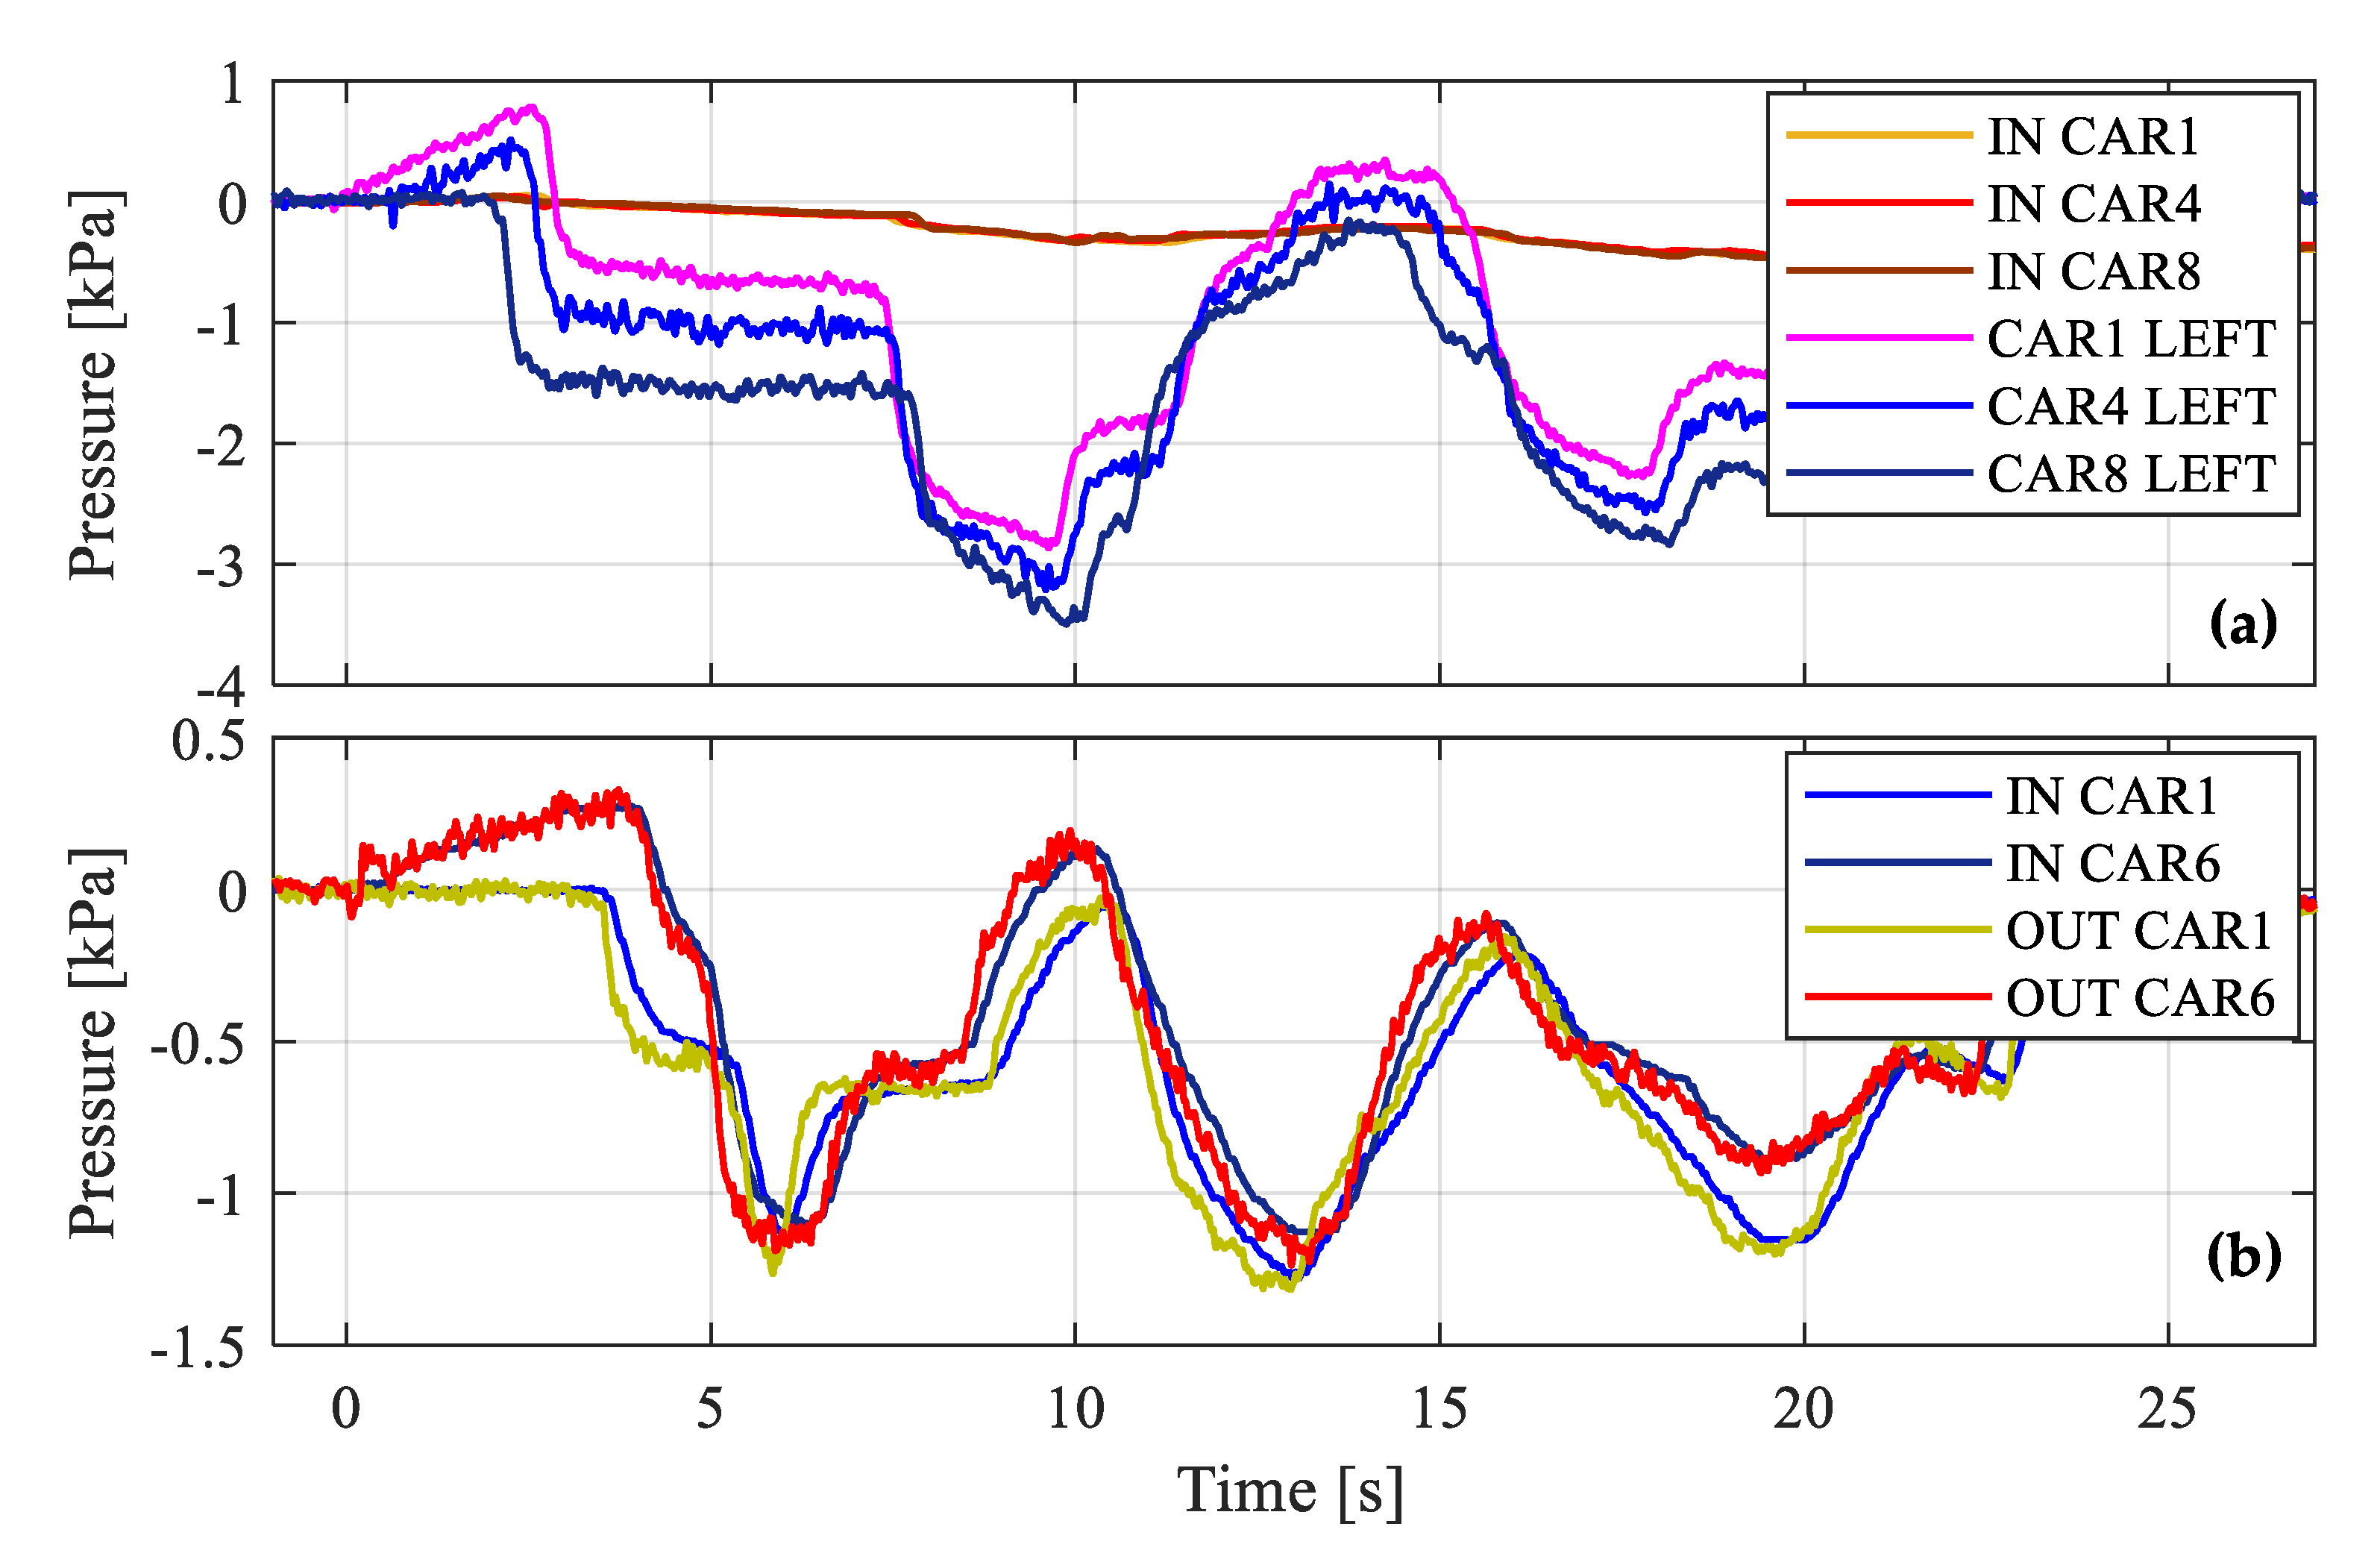
Figure 15a reports the comparison between various inner pressures in different points of the sealed train. It can be clearly seen that in the case of a sealed train the internal pressure is practically equal throughout the train and the whole train is sealed with respect to the outside but not internally between different cars. Since the small openings towards the outside are distributed throughout the train and the pressure information travel at the speed of sound, the differences are not appreciable inside.
For comparison, an example of pressures measured inside the unsealed train is presented in Figure 15b. As the train is less filtered, in this case the inner pressures follow the trend of the corresponding external pressures and, since the passage from one vehicle to another is practically open to the outside, the pressure within each vehicle is not influenced by that of other vehicles.
To highlight the differences, in Figure 16 a crossing between the unsealed train and an HS train running at 250 km/h is considered. In this case the first order system response of the inner pressure and the differences between different carriages are clearly visible. On the other hand, inside a car the pressure is uniformly distributed, as proven by the sensor in the middle of the first car and the one in the cabin.
In both cases the internal pressure evolves from the external one, roughly following the first order system described by Equation (1) (an advanced model could be used, also considering the sign of the ΔP [66]). Using this model, the time constants τdyn an be estimated by means of a least squares method by comparing the calculated internal pressure with the measured one.
Pressurized Trains
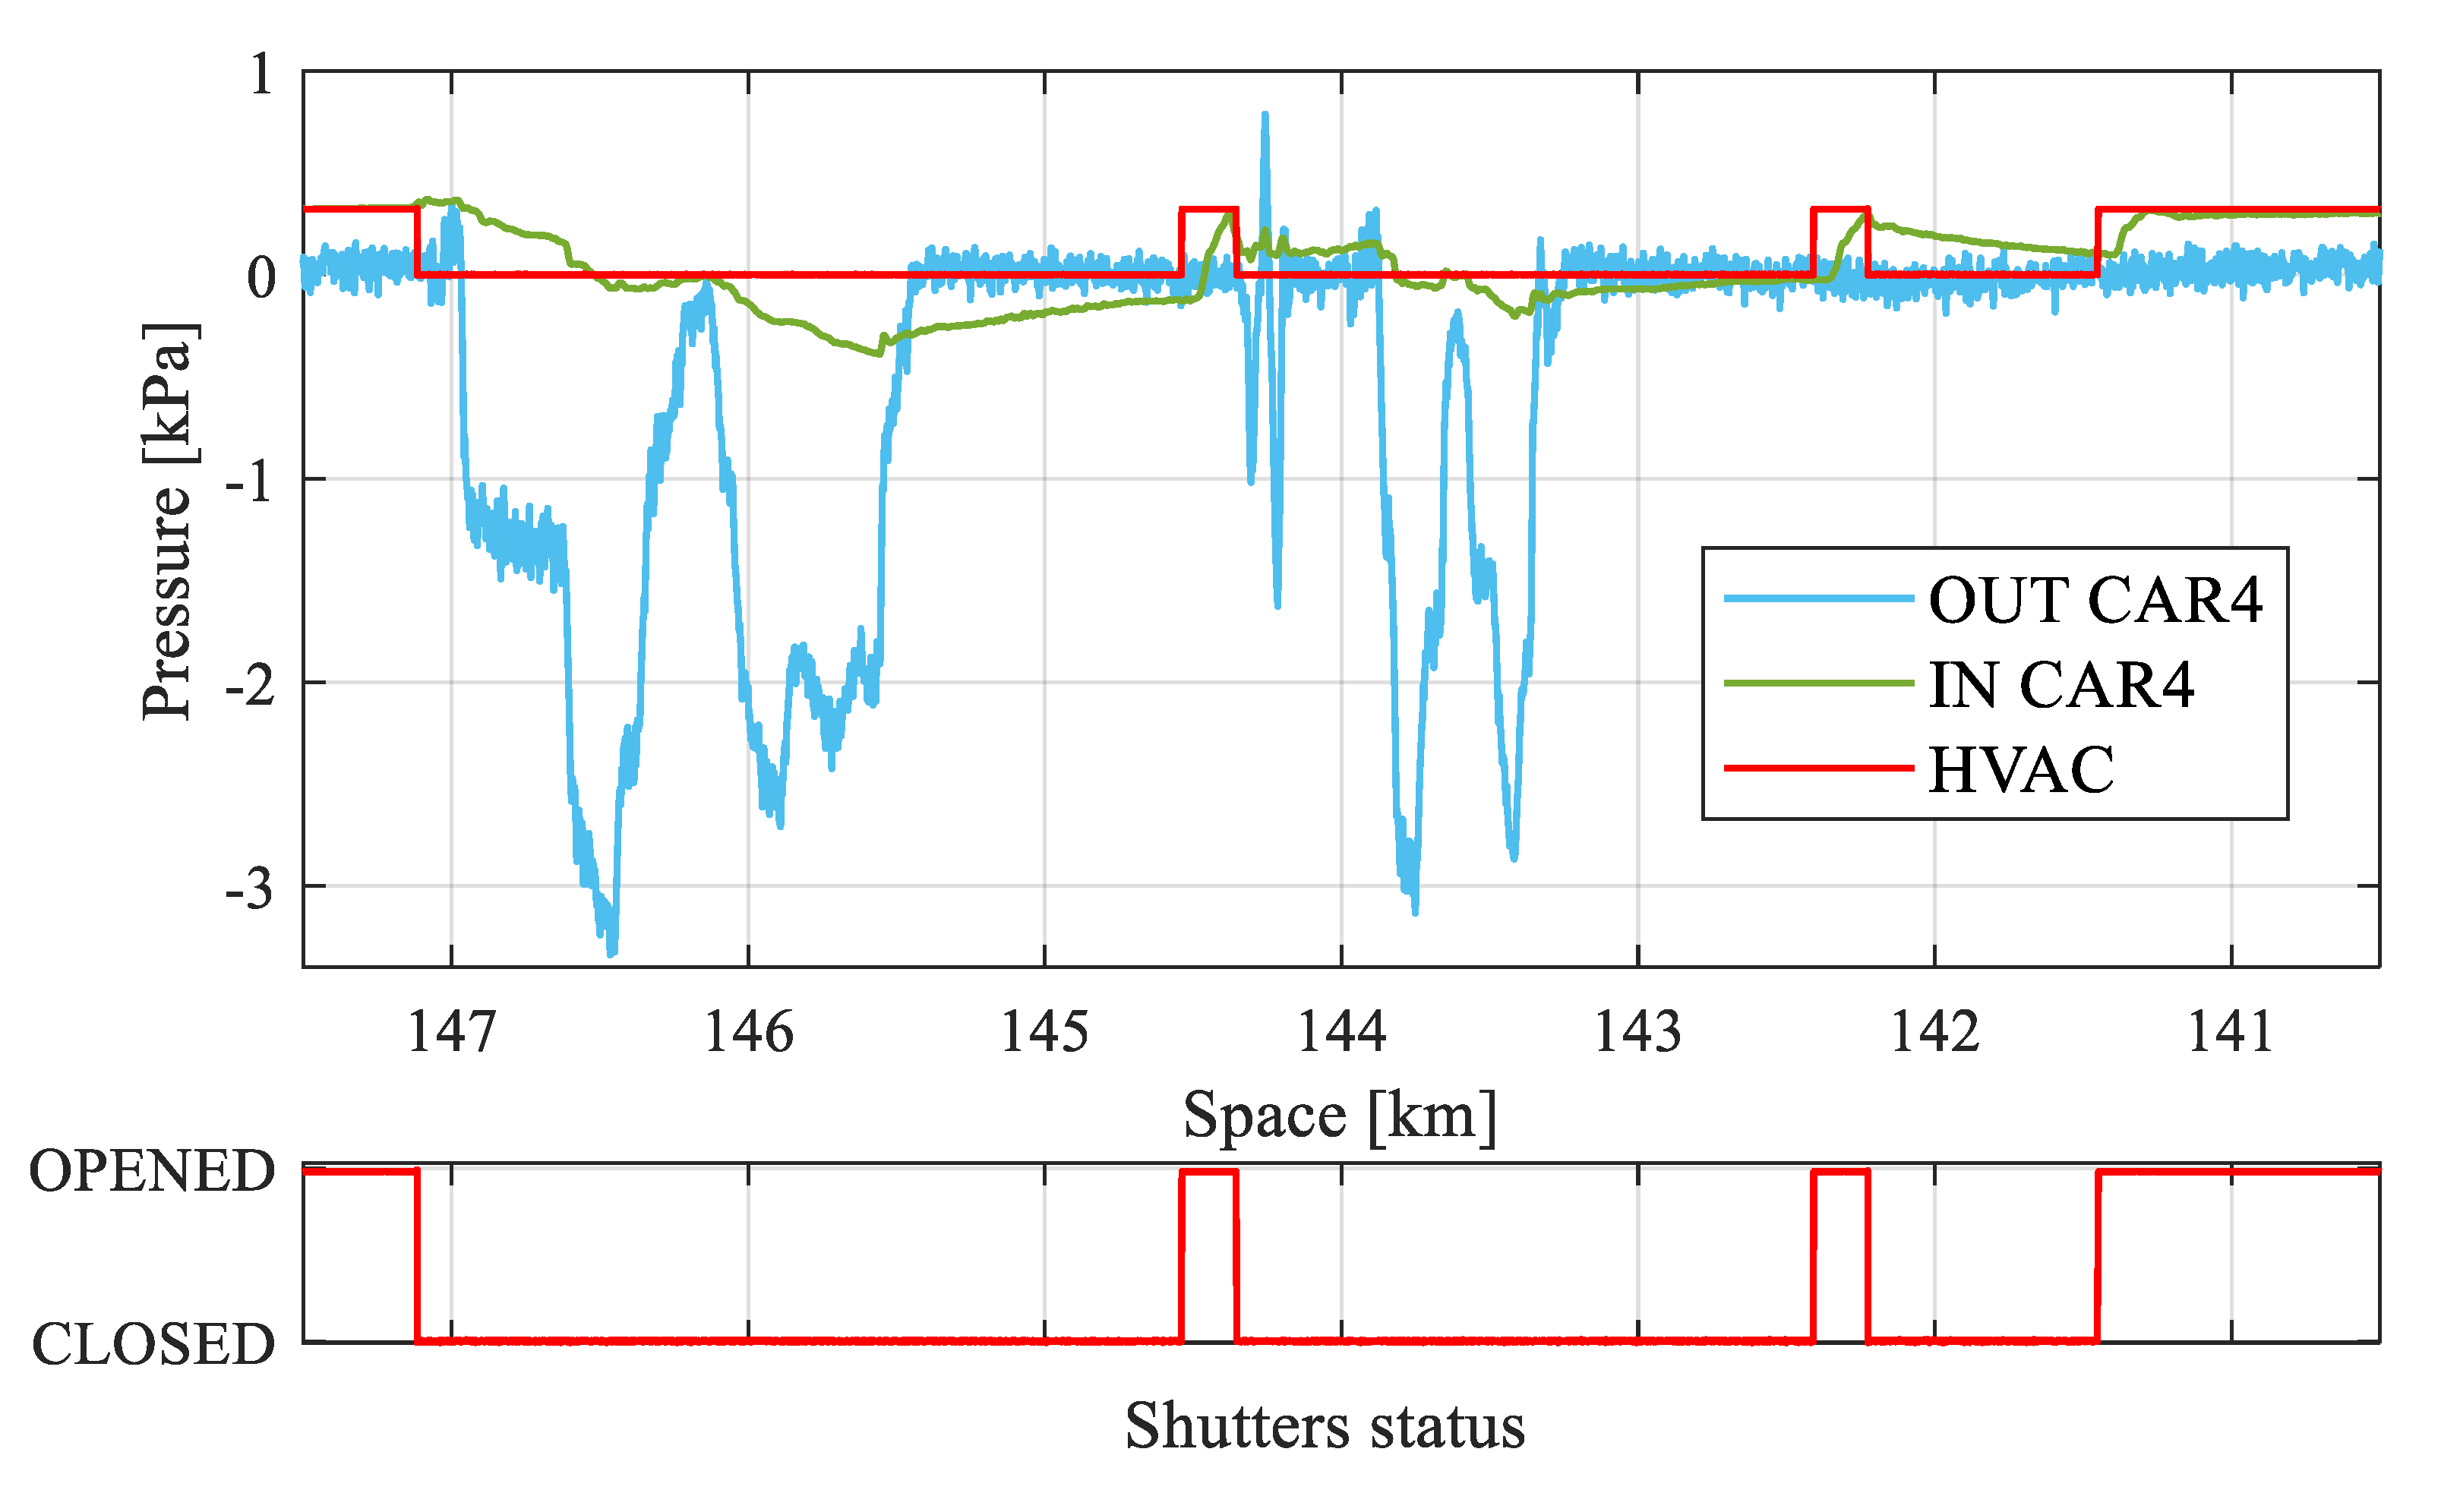
To be thorough, but only for information purposes, it has to be said that the sealed trains are also pressurized. The HVAC (Heating, Ventilation and Air Conditioning) system is equipped with shutters that can open and close automatically, relying on external pressure signals. During a run in the open field, the shutters are opened so that the system can suck in air from outside, keeping the internal pressure of the train about 200–300 Pa higher than the environmental one. Then, when the train enters a tunnel, the shutters are closed; at this point the train is sealed and the inner pressure follows the outer one according to the first order system previously seen.
An example of the behavior of the shutters during the crossing of three tunnels is shown at the bottom of Figure 17, while, in the upper plot, internal and external pressures are superimposed to the one provided by the HVAC system. The train comes from an open field section, the shutters are opened and the inner pressure is about 300 Pa higher than the external one. Once the train enters a tunnel, the pressure difference between the inner and outer pressure make the HVAC system close the shutters and, at this point, the train is characterized by its time constant, until the shutters are opened again and the pressure goes back to the initial value.
4. Conclusions
This works represents a contribution to the analysis of overpressures arising when a train crosses a tunnel. The phenomenon is one of the most challenging aspects, if an increase both in the operating speed and in the capacity of a HS line are considered. Furthermore, it is lacking in deep validation, even if it is codified within standards and it can be studied by means of specific tools. The possibility to perform wide experimental campaigns on different sections of the Italian HS line by measuring on board and at trackside and by recording data for both testing and commercial trains allowed to better investigate the issue of tunnel overpressures and to present new applications, such as the mixed traffic operation.
Full-scale experimental activity within the railway system is a very demanding and challenging task since many actors are involved (infrastructure managers, trains operators, trains manufacturers) and, as a consequence, few data are available in the literature. Moreover, few areas are usually left to research since most of the experimental work is based on the application of standard procedures to well confined topics. Therefore, the research field is usually limited to model scale reproductions in laboratory test rigs. Nevertheless, this work takes advantage from the purpose to increase the Italian HS line performance (both speed and capacity) by involving universities not only in the preliminary feasibility study but also in the experimental validation of the project.
Thanks to the wide availability of experimental data, it is possible to highlight some criticalities that can be summarized in two main points:
- The initial conditions within the tunnel highly modifies the pressure signature;
- The position of the sensors is fundamental to properly estimate the pressure loads.
According to the proposed work and as future developments, existing standards should be revised by accordingly implementing at least these aspects:
- A limit value on the flow speed or a corrective formula that also takes into account environmental data, e.g., pressure, temperature, and density, should be defined;
- Since the 10 kPa health criterion could be exceeded for a few tenths of seconds due to fluctuations in the wake region, deeper specifications on this topic are needed;
- To properly estimate the aerodynamic loads, the measurement of the external pressure on both sides and the internal pressure in at least one point per car should be specified.
Based on the presented results, a new measurement campaign has been planned with the intention of measuring the environmental parameters also in the tunnel and of finding a corrective formula for the pressure signature. On the other hand, a new 1-D code is being developed and it will consider the characteristics of different types of trains and the specific effects of the TNS in case of crossing.
Author Contributions
Conceptualization, C.S., T.A., D.R. and P.S.; Data curation, C.S., T.A., E.B. and P.S.; Formal analysis, T.A. and E.B.; Funding acquisition, D.R.; Investigation, C.S.; Project administration, D.R.; Resources, G.T.; Supervision, D.R. and G.T.; Writing—original draft, C.S.; Writing—review & editing, E.B., D.R. and G.T. All authors have read and agreed to the published version of the manuscript.
Funding
This research received no external funding.
Conflicts of Interest
The authors declare no conflict of interest.
References
- Baker, C.J.; Sterling, M. Current and Recent International Work on Railway Aerodynamics. Available online: https://www.yumpu.com/en/document/view/25887515/current-international-work-on-railway-aerodynamics-rssb (accessed on 15 October 2020).
- Baker, C. The flow around high speed trains. J. Wind. Eng. Ind. Aerodyn. 2010, 98, 277–298. [Google Scholar] [CrossRef]
- Baker, C.; Johnson, T.; Flynn, D.; Hemida, H.; Quinn, A.; Soper, D.; Sterling, M. Train Aerodynamics: Fundamentals and Applications; Butterworth-Heinemann: Oxford, UK, 2019. [Google Scholar] [CrossRef]
- Rocchi, D.; Tomasini, G.; Schito, P.; Somaschini, C. Wind effects induced by high speed train pass-by in open air. J. Wind. Eng. Ind. Aerodyn. 2018, 173, 279–288. [Google Scholar] [CrossRef]
- Somaschini, C.; Argentini, T.; Rocchi, D.; Schito, P.; Tomasini, G. A new methodology for the assessment of the running resistance of trains without knowing the characteristics of the track: Application to full-scale experimental data. J. Rail Rapid Transit 2018, 232, 1814–1827. [Google Scholar] [CrossRef]
- TSI; HS; RST. Technical specification for interoperability relating to the ‘rolling stock’ sub-system of the trans-European high-speed rail system. Off. J. Eur. Union 2008, L84, 132–392. [Google Scholar]
- TSI; RST; LOC; PAS. Technical specification for interoperability relating to the ‘rolling stock-locomotives and passenger rolling stock’ subsystem of the rail system in the entire European Union. Off. J. Eur. Union 2014, L356, 228–393. [Google Scholar]
- TSI; HS; INF. Technical specification for interoperability relating to the ‘infrastructure’ subsystem of the rail system in the European Union. Off. J. Eur. Union 2014, L356, 1–109. [Google Scholar]
- EN14067–2. Railway Applications—Aerodynamics—Part 2: Aerodynamics on Open Track; European Committee for Standardization (CEN): Brussels, Belgium, 2003. [Google Scholar]
- EN14067–3. Railway Applications—Aerodynamics—Part 3: Aerodynamics in Tunnels; European Committee for Standardization (CEN): Brussels, Belgium, 2003. [Google Scholar]
- EN14067–4. Railway Applications—Aerodynamics—Part 4: Requirements and Test Procedures for Aerodynamics on Open Track; European Committee for Standardization (CEN): Brussels, Belgium, 2013. [Google Scholar]
- EN14067–5. Railway Applications—Aerodynamics—Part 5: Requirements and Test Procedures for Aerodynamics in Tunnels; European Committee for Standardization (CEN): Brussels, Belgium, 2006. [Google Scholar]
- Bionda, S.; Cazzulani, G.; Di Gialleonardo, E.; Braghin, F. Homologation Tests of ETR1000-V300ZEFIRO train up to 350 km/h. In Proceedings of the 15th Conference on Vehicle System Dynamics, Identification and Anomailes, Budapest, Hungary, 7–9 November 2016. [Google Scholar]
- Somaschini, C.; Matsuoka, K.; Collina, A. Experimental analysis of a composite bridge under high-speed train passages. Procedia Eng. 2017, 199, 3071–3076. [Google Scholar] [CrossRef]
- Bucca, G.; Carnevale, M.; Comolli, L.; Facchinetti, A.; Cavaliere, F.; Pancari, G.; Brughera, F.; Noviello, G. Assessment of current collection quality of ETR1000-V300 Zefiro pantograph: An innovative measurement set-up and test results. In Proceedings of the 11th World Congress on Railway Research, Milan, Italy, 29 May–2 June 2016. [Google Scholar]
- Rocchi, D.; Schito, P.; Somaschini, C.; Tomasini, G.; Argentini, T.; Barbone, L.; Sima, M.; Bocciolini, L.; Galeazzo, G. Measurement of the aerodynamic features of the ETR1000-V300Zefiro high-speed train. In Proceedings of the 11th World Congress on Railway Research, Milan, Italy, 29 May–2 June 2016. [Google Scholar]
- Matsuoka, K.; Collina, A.; Somaschini, C.; Sogabe, M. Influence of local deck vibrations on the evaluation of the maximum acceleration of a steel-concrete composite bridge for a high-speed railway. Eng. Struct. 2019, 200, 109736. [Google Scholar] [CrossRef]
- Liu, T.-H.; Tian, H.-Q.; Liang, X.-F. Aerodynamic Effects Caused by Trains Entering Tunnels. J. Transp. Eng. 2010, 136, 846–853. [Google Scholar] [CrossRef]
- Mancini, G.; Malfatti, A. Full Scale Measurements on High Speed Train ETR 500 Passing in Open Air and in Tunnels of Italian High-Speed Line. In TRANSAERO—A European Initiative on Transient Aerodynamics for Railway System Optimisation; Springer: Berlin/Heidelberg, Germany, 2002; pp. 101–122. [Google Scholar]
- Quinn, A.D.; Baker, C.J.; Hemida, H.; Gallagher, M.; Morden, J.; Soper, D. The Measurement of Train Aerodynamic Parameters in Operational On-Vehicle Measurements. In Proceedings of the Aerovehicles2, Second International Conference in Numerical and Experimental Aerodynamics of Road Vehicles and Trains, Goteborg, Sweden, 21–23 June 2016. [Google Scholar]
- Sakuma, Y.; Suzuki, M. Measurement of Velocity and Pressure Fluctuations around High-Speed Train Running in Tunnel. In Proceedings of the 9th World Congress on Railway Research, Lille, France, 22–26 May 2011. [Google Scholar]
- Somaschini, C.; Rocchi, D.; Schito, P.; Tomasini, G. Numerical and Experimental Analysis of the Pressure Signature for different High-Speed Trains. Civ. Comp. Proc. 2015, 108. [Google Scholar] [CrossRef] [Green Version]
- Yun, S.-H.; Kwak, M.-H.; Lee, D.H.; Kwon, H.-B.; Ko, T.-H. Passive reduction of large pressure variation for a high-speed express train in a narrow tunnel using an extra dummy tunnel duct. J. Mech. Sci. Technol. 2010, 24, 1433–1440. [Google Scholar] [CrossRef]
- Xiong, X.; Zhu, L.; Zhang, J.; Li, A.; Li, X.; Tang, M. Field measurements of the interior and exterior aerodynamic pressure induced by a metro train passing through a tunnel. Sustain. Cities Soc. 2020, 53, 101928. [Google Scholar] [CrossRef]
- Liu, T.-H.; Chen, X.-D.; Li, W.-H.; Xie, T.-Z.; Chen, Z.-W. Field study on the interior pressure variations in high-speed trains passing through tunnels of different lengths. J. Wind. Eng. Ind. Aerodyn. 2017, 169, 54–66. [Google Scholar] [CrossRef]
- Liu, T.; Jiang, Z.; Chen, X.; Zhang, J.; Liang, X. Wave effects in a realistic tunnel induced by the passage of high-speed trains. Tunn. Undergr. Space Technol. 2019, 86, 224–235. [Google Scholar] [CrossRef]
- Howe, M.; Cox, E. Reflection and transmission of a compression wave at a tunnel portal. J. Fluids Struct. 2005, 20, 1043–1056. [Google Scholar] [CrossRef]
- Baron, A.; Molteni, P.; Vigevano, L. High-speed trains: Prediction of micro-pressure wave radiation from tunnel portals. J. Sound Vib. 2006, 296, 59–72. [Google Scholar] [CrossRef]
- Barrow, H.; Pope, C. A simple analysis of flow and heat transfer in railway tunnels. Int. J. Heat Fluid Flow 1987, 8, 119–123. [Google Scholar] [CrossRef]
- Vardy, A.; Brown, J. An Overview of Wave Propagation in Tunnels. In TRANSAERO—A European Initiative on Transient Aerodynamics for Railway System Optimisation; Springer: Berlin/Heidelberg, Germany, 2002; pp. 249–266. [Google Scholar]
- Bourquin, V.; Beguin, C.; Monkewitz, P.A. Aerodynamic Effects in Railway Tunnels as Speed is Increased. In The Aerodynamics of Heavy Vehicles: Trucks, Buses, and Trains; Springer: Berlin/Heidelberg, Germany, 2004; Volume 19, pp. 431–441. [Google Scholar] [CrossRef]
- Howe, M. Influence of train Mach number on the compression wave generated in a tunnel-entrance hood. J. Eng. Math. 2003, 46, 147–163. [Google Scholar] [CrossRef]
- Howe, M.S. Review of the theory of the compression wave generated when a high-speed train enters a tunnel. Proc. Inst. Mech. Eng. Part F J. Rail Rapid Transit 1999, 213, 89–104. [Google Scholar] [CrossRef]
- Saito, S.; Fukuda, T. Design of a tunnel entrance hood for high-speed trains. J. Wind. Eng. Ind. Aerodyn. 2020, 206, 104375. [Google Scholar] [CrossRef]
- Knorzer, D. Technology Acquisition through the Research Framework Programmes of the European Union. In TRANSAERO—A European Initiative on Transient Aerodynamics for Railway System Optimisation; Springer: Berlin/Heidelberg, Germany, 2002; pp. 3–10. [Google Scholar]
- Schulte-Werning, B. The TRANSAERO Project—Joint European Railway Research on Transient Aerodynamics. In TRANSAERO—A European Initiative on Transient Aerodynamics for Railway System Optimisation; Springer: Berlin/Heidelberg, Germany, 2002; pp. 11–24. [Google Scholar]
- Faramehr, S.; Hemida, H. Aerodynamics of Trains in Tunnels. Civ. Comp. Proc. 2016, 110. [Google Scholar] [CrossRef]
- Pahlke, K. Application of the Standard Aeronautical CFD Method FLOWer to ETR 500 Tunnel Entry. In TRANSAERO—A European Initiative on Transient Aerodynamics for Railway System Optimisation; Springer: Berlin/Heidelberg, Germany, 2002. [Google Scholar]
- Wang, Y.; Yang, G.; Huang, C.; Wang, W. Influence of tunnel length on the pressure wave generated by high-speed trains passing each other. Sci. China Technol. Sci. 2011, 55, 255–263. [Google Scholar] [CrossRef]
- Nam, S.-W. Numerical simulation on wind pressure transients in high speed train tunnels. WIT Trans. Built Environ. 2014, 135, 905–913. [Google Scholar] [CrossRef]
- Wagner, S.; Ehrenfried, K.; Schröder, A. A Simplified Model of the Wave Generation Due to Train-Tunnel Entry. Lect. Notes Appl. Comput. Mech. 2016, 79, 161–173. [Google Scholar] [CrossRef] [Green Version]
- William-Louis, M.J.-P.; Gregoire, R. I-d Calculations of Pressure Fluctuations Outside and Inside a Pressure Sealed High-Speed Trainset Travelling Through Tunnels. In TRANSAERO—A European Initiative on Transient Aerodynamics for Railway System Optimisation; Springer: Berlin/Heidelberg, Germany, 2002; pp. 342–357. [Google Scholar]
- Wormstall, H.; Reitschuster, J. I-d Calculations of Pressure Change due to Passage of an ETR 500 through the Terranuova LeVille Tunnel. In TRANSAERO—A European Initiative on Transient Aerodynamics for Railway System Optimisation; Springer: Berlin/Heidelberg, Germany, 2002; pp. 358–366. [Google Scholar]
- William-Louis, M.; Tournier, C. A wave signature based method for the prediction of pressure transients in railway tunnels. J. Wind. Eng. Ind. Aerodyn. 2005, 93, 521–531. [Google Scholar] [CrossRef]
- Aoki, T.; Vardy, A.; Brown, J. Passive alleviation of micro-pressure waves from tunnel portals. J. Sound Vib. 1999, 220, 921–940. [Google Scholar] [CrossRef]
- Heine, D.; Ehrenfried, K. Experimental Study of the Pressure Rise due to Tunnel Entry of a High-Speed Train. In Notes on Numerical Fluid Mechanics and Multidisciplinary Design; Springer: Berlin/Heidelberg, Germany, 2014; Volume 124, pp. 335–342. [Google Scholar] [CrossRef]
- Howe, M.; Iida, M.; Fukuda, T.; Maeda, T. Theoretical and experimental investigation of the compression wave generated by a train entering a tunnel with a flared portal. J. Fluid Mech. 2000, 425, 111–132. [Google Scholar] [CrossRef]
- Iida, M.; Howe, M. Compression Wave Generated by a High-Speed Train Entering a Tunnel Fitted with a Hood with a Long Slit Window. J. Low Freq. Noise, Vib. Act. Control. 2007, 26, 227–247. [Google Scholar] [CrossRef]
- Uystepruyst, D.; William-Louis, M.; Creusé, E.; Nicaise, S.; Monnoyer, F. Efficient 3D numerical prediction of the pressure wave generated by high-speed trains entering tunnels by high-speed trains entering tunnels. Comput. Fluids 2011, 47, 165–177. [Google Scholar] [CrossRef] [Green Version]
- Heine, D.; Ehrenfried, K.; Heine, G.; Huntgeburth, S. Experimental and theoretical study of the pressure wave generation in railway tunnels with vented tunnel portals. J. Wind. Eng. Ind. Aerodyn. 2018, 176, 290–300. [Google Scholar] [CrossRef]
- Zonglin, J.; Matsuoka, K.; Sasoh, A.; Takayama, K. Numerical and experimental investigation of wave dynamic processes in high-speed train/tunnels. Acta Mech. Sin. 2002, 18, 209–226. [Google Scholar] [CrossRef] [Green Version]
- Heine, D.; Ehrenfried, K.; ühnelt, H.; Lachinger, S.; Rudolph, M.; Vorwagner, A.; Saliger, F. Influence of the shape and size of cavities on pressure waves inside high-speed railway tunnels. J. Wind. Eng. Ind. Aerodyn. 2019, 189, 258–265. [Google Scholar] [CrossRef]
- Lu, Y.; Wang, T.; Yang, M.; Qian, B. The influence of reduced cross-section on pressure transients from high-speed trains intersecting in a tunnel. J. Wind. Eng. Ind. Aerodyn. 2020, 201, 104161. [Google Scholar] [CrossRef]
- Bourquin, V.; Monkewitz, M.; Monkewitz, P. Reduced-Scale Experiments for Railway Applications. In TRANSAERO—A European Initiative on Transient Aerodynamics for Railway System Optimisation; Springer: Berlin/Heidelberg, Germany, 2002. [Google Scholar]
- Bellenoue, M.; Kageyama, T. Reduced Scale Simulation of the Compression Wave Generated by the Entry of a High-Speed Train into a Tunnel. In TRANSAERO—A European Initiative on Transient Aerodynamics for Railway System Optimisation; Springer: Berlin/Heidelberg, Germany, 2002; pp. 206–216. [Google Scholar]
- Bellenoue, M.; Morinière, V.; Kageyama, T. Experimental 3-d simulation of the compression wave, due to train–tunnel entry. J. Fluids Struct. 2002, 16, 581–595. [Google Scholar] [CrossRef]
- Doi, T.; Ogawa, T.; Masubuchi, T.; Kaku, J. Development of an experimental facility for measuring pressure waves generated by high-speed trains. J. Wind. Eng. Ind. Aerodyn. 2010, 98, 55–61. [Google Scholar] [CrossRef]
- Johnson, T.; Dalley, S. 1/25 Scale Moving Model Tests for the TRANSAERO Project. In TRANSAERO—A European Initiative on Transient Aerodynamics for Railway System Optimisation; Springer: Berlin/Heidelberg, Germany, 2002; pp. 123–135. [Google Scholar]
- Yang, Q.-S.; Song, J.-H.; Yang, G.-W. A moving model rig with a scale ratio of 1/8 for high speed train aerodynamics. J. Wind. Eng. Ind. Aerodyn. 2016, 152, 50–58. [Google Scholar] [CrossRef] [Green Version]
- Deeg, P.; Eisenlauer, M.; Tielkes, T. Overview of aerodynamics studies and tests performed for new high speed line Erfurt—Leipzig/Halle. In Proceedings of the 13th International Conference & Exhibition, Edinburgh, UK, 30 June–1 July 2015. [Google Scholar]
- Hieke, M.; Gerbig, C.; Van Diepen, G.; Tielkes, T.; Miyachi, T. Field measurements of Micro-pressure wave mitigations of German new high-speed line Erfurt-Halle/Leipzig. In Proceedings of the 11th World Congress on Railway Research, Milan, Italy, 29 May–2 June 2016. [Google Scholar]
- Johnson, T. Measurements of the effect on pressures of a porous tunnel entrance using a moving model rig. In Proceedings of the World Congress on Railway Research, Kologn, Germany, 25–29 November 2001. [Google Scholar]
- Martínez, A.; Vega, E.; Gaite, J.; Meseguer, J. Pressure measurements on real high-speed trains travelling through tunnels. In Proceedings of the BBAA VI International Colloquium on Bluff Bodies Aerodynamics & Applications, Milano, Italy, 20–24 July 2008. [Google Scholar]
- Matschke, G.; Heine, C. Full Scale Tests on Pressure Wave Effects in Tunnels. In TRANSAERO—A European Initiative on Transient Aerodynamics for Railway System Optimisation; Springer: Berlin/Heidelberg, Germany, 2002; pp. 187–195. [Google Scholar]
- Li, X.-H.; Deng, J.; Chen, D.-W.; Xie, F.-F.; Zheng, Y. Unsteady simulation for a high-speed train entering a tunnel. J. Zhejiang Univ. A 2011, 12, 957–963. [Google Scholar] [CrossRef]
- Sima, M.; Barbone, L.; Galeazzo, G.; Gölz, P. Dynamic Pressure Tightness of Very High Speed Train ETR1000/V300ZEFIRO. In Proceedings of the 11th World Congress on Railway Research, Milan, Italy, 29 May–2 June 2016. [Google Scholar]
Figure 1.
Time-space representation of the pressure evolution within a 1640 m long tunnel crossed by a 200 m long train running at 250 km/h. Solid lines represent the head and tail of the train, the horizontal dotted line represents a sensor at 340 m from the entrance, the dashed lines represent the pressure waves generated by the train.

Figure 2.
Schematic representation of TWS (Train Wave Signature) and TNS (Train Near-field Signature) measured by the sensor of Figure 1.
Figure 2.
Schematic representation of TWS (Train Wave Signature) and TNS (Train Near-field Signature) measured by the sensor of Figure 1.

Figure 3.
∆Pmax measure during the train speed increases as a function of the speed and best fit quadratic line.
Figure 3.
∆Pmax measure during the train speed increases as a function of the speed and best fit quadratic line.

Figure 4.
Superposition of 203 single train passages of the same type of HS train recorded in a 2700 m long tunnel.
Figure 4.
Superposition of 203 single train passages of the same type of HS train recorded in a 2700 m long tunnel.

Figure 5.
Measured ΔPmax of the 203 single train passages as a function of train speed.

Figure 6.
Comparison between two time histories of the pressure generated by two trains; same train type, same tunnel, same speeds, same day.
Figure 6.
Comparison between two time histories of the pressure generated by two trains; same train type, same tunnel, same speeds, same day.

Figure 7.
Comparison between the pressures acquired within the tunnel on the train side and on the opposite side.
Figure 7.
Comparison between the pressures acquired within the tunnel on the train side and on the opposite side.

Figure 8.
Example of the pressure fluctuations measured in the wake region for 10 different runs.

Figure 9.
Two views of the fairings covering the pressure tap and the sensor with and without the adhesive tissue.
Figure 9.
Two views of the fairings covering the pressure tap and the sensor with and without the adhesive tissue.

Figure 10.
Schematic visualizations of the pressure tap positions along (a) the sealed train and (b) the unsealed train.
Figure 10.
Schematic visualizations of the pressure tap positions along (a) the sealed train and (b) the unsealed train.

Figure 11.
Comparison between the pressure acquired (a) in different positions and (b) on different sides of the sealed train.
Figure 11.
Comparison between the pressure acquired (a) in different positions and (b) on different sides of the sealed train.

Figure 12.
Comparison between the pressure acquired on-board of the sealed train in the same position in six different runs; (a) first car, (b) last car.
Figure 12.
Comparison between the pressure acquired on-board of the sealed train in the same position in six different runs; (a) first car, (b) last car.

Figure 13.
Comparison between the pressure acquired in different positions along the unsealed train.
Figure 13.
Comparison between the pressure acquired in different positions along the unsealed train.

Figure 14.
Comparison between the pressure acquired in different sides of the unsealed train in case of crossing within a tunnel.
Figure 14.
Comparison between the pressure acquired in different sides of the unsealed train in case of crossing within a tunnel.

Figure 15.
Comparison between the pressure acquired in different positions, outside and inside, along the sealed train (a) and the unsealed train (b).
Figure 15.
Comparison between the pressure acquired in different positions, outside and inside, along the sealed train (a) and the unsealed train (b).

Figure 16.
Comparison between the pressure acquired in different positions along the unsealed train outside and inside in case of crossing within a tunnel.
Figure 16.
Comparison between the pressure acquired in different positions along the unsealed train outside and inside in case of crossing within a tunnel.

Figure 17.
Example of the behavior of the HVAC shutters of the sealed train and corresponding pressure evolution.
Figure 17.
Example of the behavior of the HVAC shutters of the sealed train and corresponding pressure evolution.


Table 1.
Timetable of the four passages considered in the analysis.
| TIME | TRAIN | DIRECTION |
|---|---|---|
| 15:06:51 | ETR500 | Rm-Fi |
| 15:09:58 | Train (a) | Fi-Rm |
| 17:32:13 | ETR500 | Fi-Rm |
| 17:36:21 | Train (b) | Fi-Rm |
Publisher’s Note: MDPI stays neutral with regard to jurisdictional claims in published maps and institutional affiliations. |
© 2020 by the authors. Licensee MDPI, Basel, Switzerland. This article is an open access article distributed under the terms and conditions of the Creative Commons Attribution (CC BY) license (http://creativecommons.org/licenses/by/4.0/).
Share and Cite
MDPI and ACS Style
Somaschini, C.; Argentini, T.; Brambilla, E.; Rocchi, D.; Schito, P.; Tomasini, G. Full-Scale Experimental Investigation of the Interaction between Trains and Tunnels. Appl. Sci. 2020, 10, 7189. https://doi.org/10.3390/app10207189
AMA Style
Somaschini C, Argentini T, Brambilla E, Rocchi D, Schito P, Tomasini G. Full-Scale Experimental Investigation of the Interaction between Trains and Tunnels. Applied Sciences. 2020; 10(20):7189. https://doi.org/10.3390/app10207189
Chicago/Turabian StyleSomaschini, Claudio, Tommaso Argentini, Elia Brambilla, Daniele Rocchi, Paolo Schito, and Gisella Tomasini. 2020. "Full-Scale Experimental Investigation of the Interaction between Trains and Tunnels" Applied Sciences 10, no. 20: 7189. https://doi.org/10.3390/app10207189
Note that from the first issue of 2016, this journal uses article numbers instead of page numbers. See further details here.