Air-Coupled, Contact, and Immersion Ultrasonic Non-Destructive Testing: Comparison for Bonding Quality Evaluation


1
Prof. K. Baršauskas Ultrasound Research Institute, Kaunas University of Technology, K. Baršausko St. 59, LT, 51423 Kaunas, Lithuania
2
Department of Electronics Engineering, Kaunas University of Technology, Studentų St. 48, LT, 51367 Kaunas, Lithuania
*
Author to whom correspondence should be addressed.
Appl. Sci. 2020, 10(19), 6757; https://doi.org/10.3390/app10196757
Submission received: 14 September 2020
/
Revised: 24 September 2020
/
Accepted: 25 September 2020
/
Published: 27 September 2020
(This article belongs to the Special Issue Advances in Nondestructive Testing and Structural Health Monitoring for Materials and Aerospace Industry Applications)
Abstract
:The objective of this study is to compare the performance of different ultrasonic non-destructive testing (NDT) techniques for bonding quality evaluation. Aluminium-epoxy-aluminium single lap joints containing debonding in the form of release film inclusions have been investigated using three types of ultrasonic NDT methods: contact testing, immersion testing, and air-coupled testing. Apart from the traditional bulk wave ultrasound, guided wave testing was also performed using air coupled and contact transducers for the excitation of guided waves. Guided wave propagation within adhesive bond was numerically simulated. A wide range of inspection frequencies causing different ultrasonic wavelengths has been investigated. Average errors in defect sizing per ultrasonic wavelength have been used as a feature to determine the performance of each ultrasonic NDT technique. The best performance is observed with bulk wave investigations. Particularly, the higher frequencies (10–50 MHz) in the immersion testing performed significantly better than air-coupled testing (300 kHz); however, air coupled investigations have other advantages as contactless inspection. Whereas guided wave inspections show relatively lower accuracy in defect sizing, they are good enough to detect the presence of the debonding and enable to inspect long range. Even though each technique has its advantages and limitations, guided wave techniques can be practical for the preliminary in-situ inspection of adhesively bonded specimens.
1. Introduction
Adhesive bonding is an attractive alternative to other joining technologies due to its high performance to weight ratio, ability to join dissimilar materials, and homogenous load distribution. Although the advantages of the adhesive bonding are very attractive to highly developed industries, such as aerospace, their usage is limited due to the lack of the knowledge in the non-destructive testing (NDT) of bonding quality [1]. Hence, research in non-destructive evaluation of bonding quality is of great interest for decades.
The ultrasonic NDT techniques have been one of the most commonly used NDT techniques to evaluate bonding quality [2]. The ultrasonic NDT methods have been used not only to evaluate adherend integrity, but also for interface quality determination, debonding detection, and weak bond investigations [3].
Through-transmission immersion, ultrasonic NDT is considered the reference method within all ultrasonic NDT methods. The experiment itself requires two-sided access to the structure and the inspected component needs to be immersed in water [4]. Immersion pulse-echo ultrasonic inspection, on the other hand, requires only single-side access to the structure; however, it still requires water immersion of the sample [5,6]. In particular, pulse-echo immersion ultrasonic NDT techniques have been utilized for bonding interface visualization [7], debonding detection [8], adhesive quality evaluation [9], kissing bond evaluation [10], and for the defect positioning in dissimilar joints [11].
Moreover, scanning acoustic microscopy (SAM) allows structures to be inspected with high frequency-high resolution. While SAM provides higher spatial clarity, the size of the structure is limited, the experimental set-up is bulky and investigations are performed in water. SAM has been employed for the evaluation of weak bonds in composite joints [12], weak bond imaging with holography [13], and porosity identification in dissimilar joints [14].
Nowadays, air-coupled ultrasonic NDT has also gained interest for in-situ applications because, as a rapid ultrasonic testing, it can be performed without any contact medium and it applies to the industrial test line [15]. Compared to immersion ultrasonic, the air-coupled ultrasonic NDT has several advantages. However, it still lacks the high spatial resolution and fast inspections that are achieved with the immersion ultrasonic NDT. In a recent study, the interfacial stiffness coefficients of weak bonds have been investigated with air-coupled ultrasound [16]. Moreover, interface visualization of the tri-layer bonded aluminium plate has been performed with the air-coupled through-transmission ultrasonic testing [15]. While air-coupled through-transmission needs two-sided access, it is possible to inspect structures with pitch and catch by the propagation of Lamb waves [17].
The guided wave (GW) ultrasonic NDT is another promising technique to evaluate bonding quality that allows large structures to be inspected in a short time. GW ultrasound can be employed with non-contact systems, such as air-coupled transducers and laser interferometer [18,19,20]. Moreover, it is possible to excite and receive guided waves in specific modes with contact transducers, electromagnetic acoustic transducer (EMATs) [21], and macro fibre composite transducers (MCF) [22]. However, it should be noted that the evaluation with GW inspections requires an understanding of the wave propagation within the sample, which, in most cases, is achieved only by highly complex numerical investigations [23]. Several studies used guided waves to investigate bonding quality. While some works focused on the debonding and delamination detection with Lamb waves and vibrometry systems [24,25]; others discussed the scattering of the guided waves as a result of the change in interface quality [26,27]. In addition, weak bonds had been investigated by using Lamb wave inspection [28].
The comparison of ultrasonic NDT techniques is provided in Table 1 considering the overall capabilities and limitations of different techniques used in this study. In general, the bulk wave technique is more accurate because the insonified area is usually right beneath the transducer; however, that requires a time-consuming measurement process to scan a large structure. On top of that, immersion testing requires preparation of the setup, which includes a big water tank for inspection. Bulk waves in general are highly sensitive to the alignment of the transducers in case of the through-transmission technique. This is where the guided wave technique can excel because it is possible to use long-range inspection in short time.
This study aims to compare contact, immersion, and air-coupled testing techniques with the case study on single lap joints containing different bonding quality. Hence in this work, metal-adhesive bonded structures specifically, aluminium-epoxy-aluminium single lap joints having release film inclusions at the bonding interface have been investigated with different ultrasonic non-destructive testing techniques. Particularly, immersion ultrasonic NDT with through-transmission and pulse-echo techniques, scanning acoustic microscopy (SAM), air-coupled through-transmission, guided wave inspections with air-coupled excitation and a contact receiver, and guided wave inspections with a contact transmitter and receiver have been employed. Guided wave inspections have been validated via numerical simulations.
2. Materials and Methods
2.1. Sample Description
The aluminium-epoxy-aluminium single lap joint containing release films have been manufactured at COTESA GmBH, Mittweida, Germany. For adherend, 1.6 mm thick aluminium 2024-T3 alloy sheets have been cut. For adhesive, 3M Scotch-Weld AF163 k-red structural adhesive film epoxy with the theoretical cured thickness of 0.24 mm has been selected. Prior to bonding, five square inclusions have been placed on the film adhesive (Figure 1a). Double-sided, 0.063 mm thick Wrightlon 4600 release film inclusions have been prepared as 12.7 mm by 12.7 mm to represent debonding at the interface. Bondline has been kept as 25 mm. Schematics of the cross-section of the sample is shown in Figure 1b. The properties of the material used for adhesive and adherend in the study are given in Table 2.
2.2. Techniques for Investigation
The aluminium-epoxy-aluminium bonded structure has been investigated by immersion, contact, and air-coupled ultrasonic methods. For bulk waves, classical immersion techniques, through-transmission and pulse-echo ultrasonic NDT techniques have been used. In addition, high-frequency high-resolution scanning acoustic microscopy was applied to evaluate bonding quality in the aluminium-adhesive bond. Moreover, NDT with air-coupled through-transmission method was performed. Additionally, two different guided wave inspections have been performed: using air-coupled excitation and a contact transducer as the receiver and a contact transducer excitation along with a contact transducer receiver. Figure 2 shows the inspection techniques as a classification tree.
2.3. Bulk Wave Techniques
2.3.1. Immersion Ultrasonic NDT
The adhesively bonded aluminium-epoxy-aluminium single lap joints containing different bonding quality have been investigated in an immersion tank by TecScan System (TecScan, Boucherville, QC, Canada). Single element focused transducers (Olympus V375-SU having 10 MHz central frequency, 9.525 mm diameter, and 50.8 mm focal distance) have been used in two different set-ups: through-transmission and pulse-echo. The sample has been placed in perpendicular to the transducer focal centre. To maintain the focus at the bonding interface, the distance between transducers and the sample has been kept at 43.29 mm. The schematic representation of through-transmission immersion testing is shown in Figure 3a.
2.3.2. Scanning Acoustic Microscopy (SAM)
Adhesively bonded aluminium-epoxy-aluminium single lap joints containing debonding have been investigated with the scanning acoustic microscope (KSI GmBH) located in Ultrasound Research Institute Kaunas University of Technology (KTU). The experimental set up shown in Figure 3b has been used to save images and A-scan data on small areas of the samples. 33.4 mm by 66.8 mm area has been selected as the region of interest and 250 points on each Cartesian axis (x and y) have been recorded for A-scan measurements. The samples have been investigated with the 50 MHz focused ultrasonic transducer PT-50-3-10 using the immersion pulse-echo technique. The ultrasonic transducer aperture is 3 mm, and the focal distance in water is 10 mm. During measurements, the sample has been placed perpendicular to the transducer. The distance between the transducer and the structure has been selected as 2.94 mm to focus the ultrasonic field on the bonding interface.
2.3.3. Air-Coupled through-Transmission
The 300 kHz single element flat air-coupled transducers (produced at Ultrasound Research Institute, KTU, Kaunas, Lithuania) were used for the investigation of the bonding quality in the case of air coupled through-transmission investigations. The active diameter of the air-coupled transducers is 14 mm. The nearfield distance for this transducer is calculated to be 43 mm. The distance between two transducers is kept at twice the near field distance (86 mm) and the plate is placed in the middle at the bonded region. The through-transmission setup is shown in Figure 4. Moreover, 10 periods rectangular burst signal with 750 V amplitude is used as the excitation signal. The received signal is pre-amplified by 50 dB static gain and 40 dB dynamic gain. The received signal is then averaged 64 times for each scanning point for noise reduction. The scanner is moved with a step of 0.5 mm and scanned along the bonded region with the defect.
2.4. Guided Wave Ultrasonic NDT Techniques
2.4.1. Analytical and Numerical Investigation
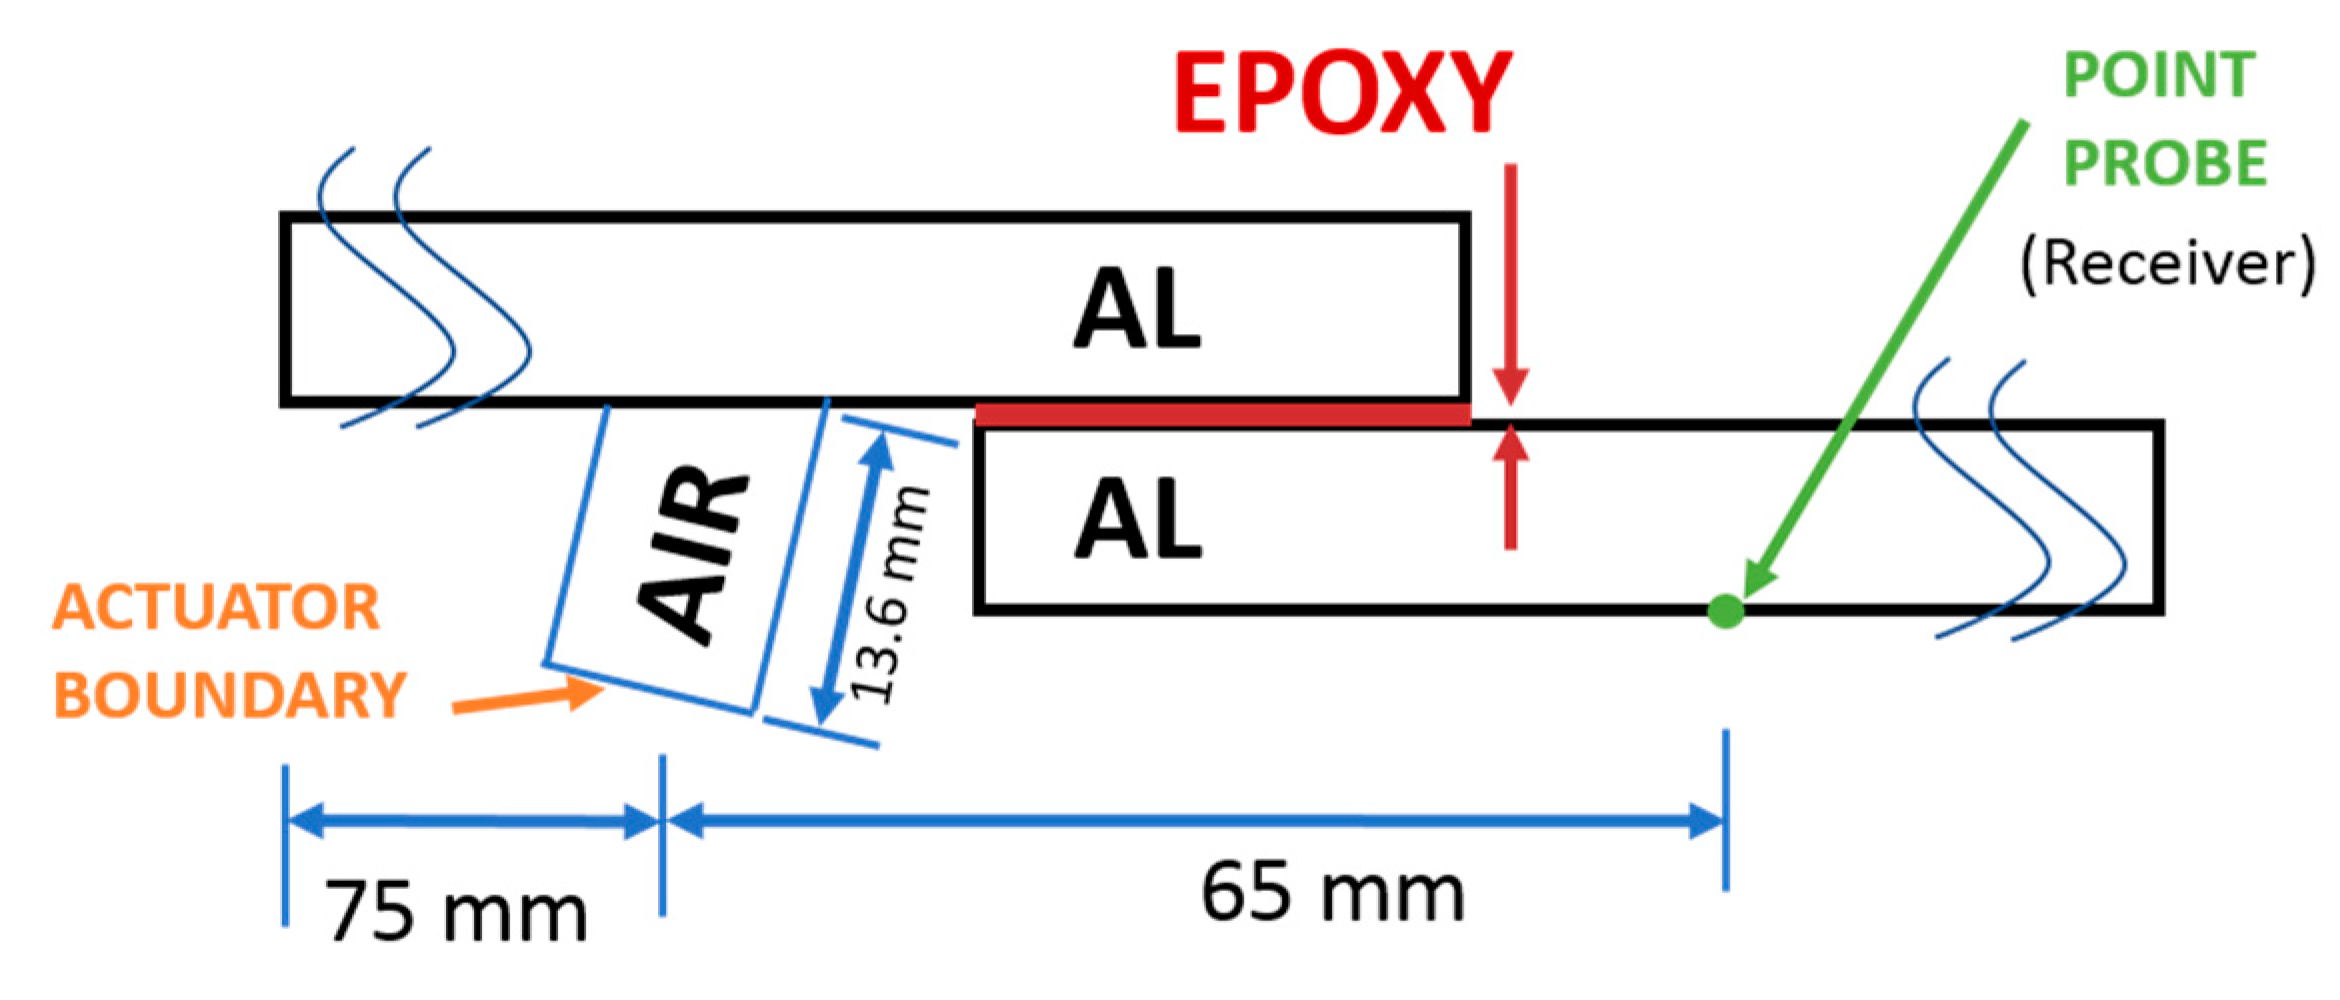
For bulk wave through-transmission method, it is straightforward that the loss of amplitude will indicate where there is a defect. However, in the case of guided waves, it can be beneficial to understand the physical phenomenon by using numerical simulation investigations to visualize the interaction of ultrasonic guided waves with the different characteristics of the guided medium. It is preferred to build a numerical model, then select experimental setup parameters according to the numerical results and validate. Thus, based on the investigation from the simulation, it would be easy to perform the experiment and to validate the numerical model with regards to the theory. Therefore, a numerical model of air-coupled excitation and contact reception of guided waves was created, as shown in Figure 5.
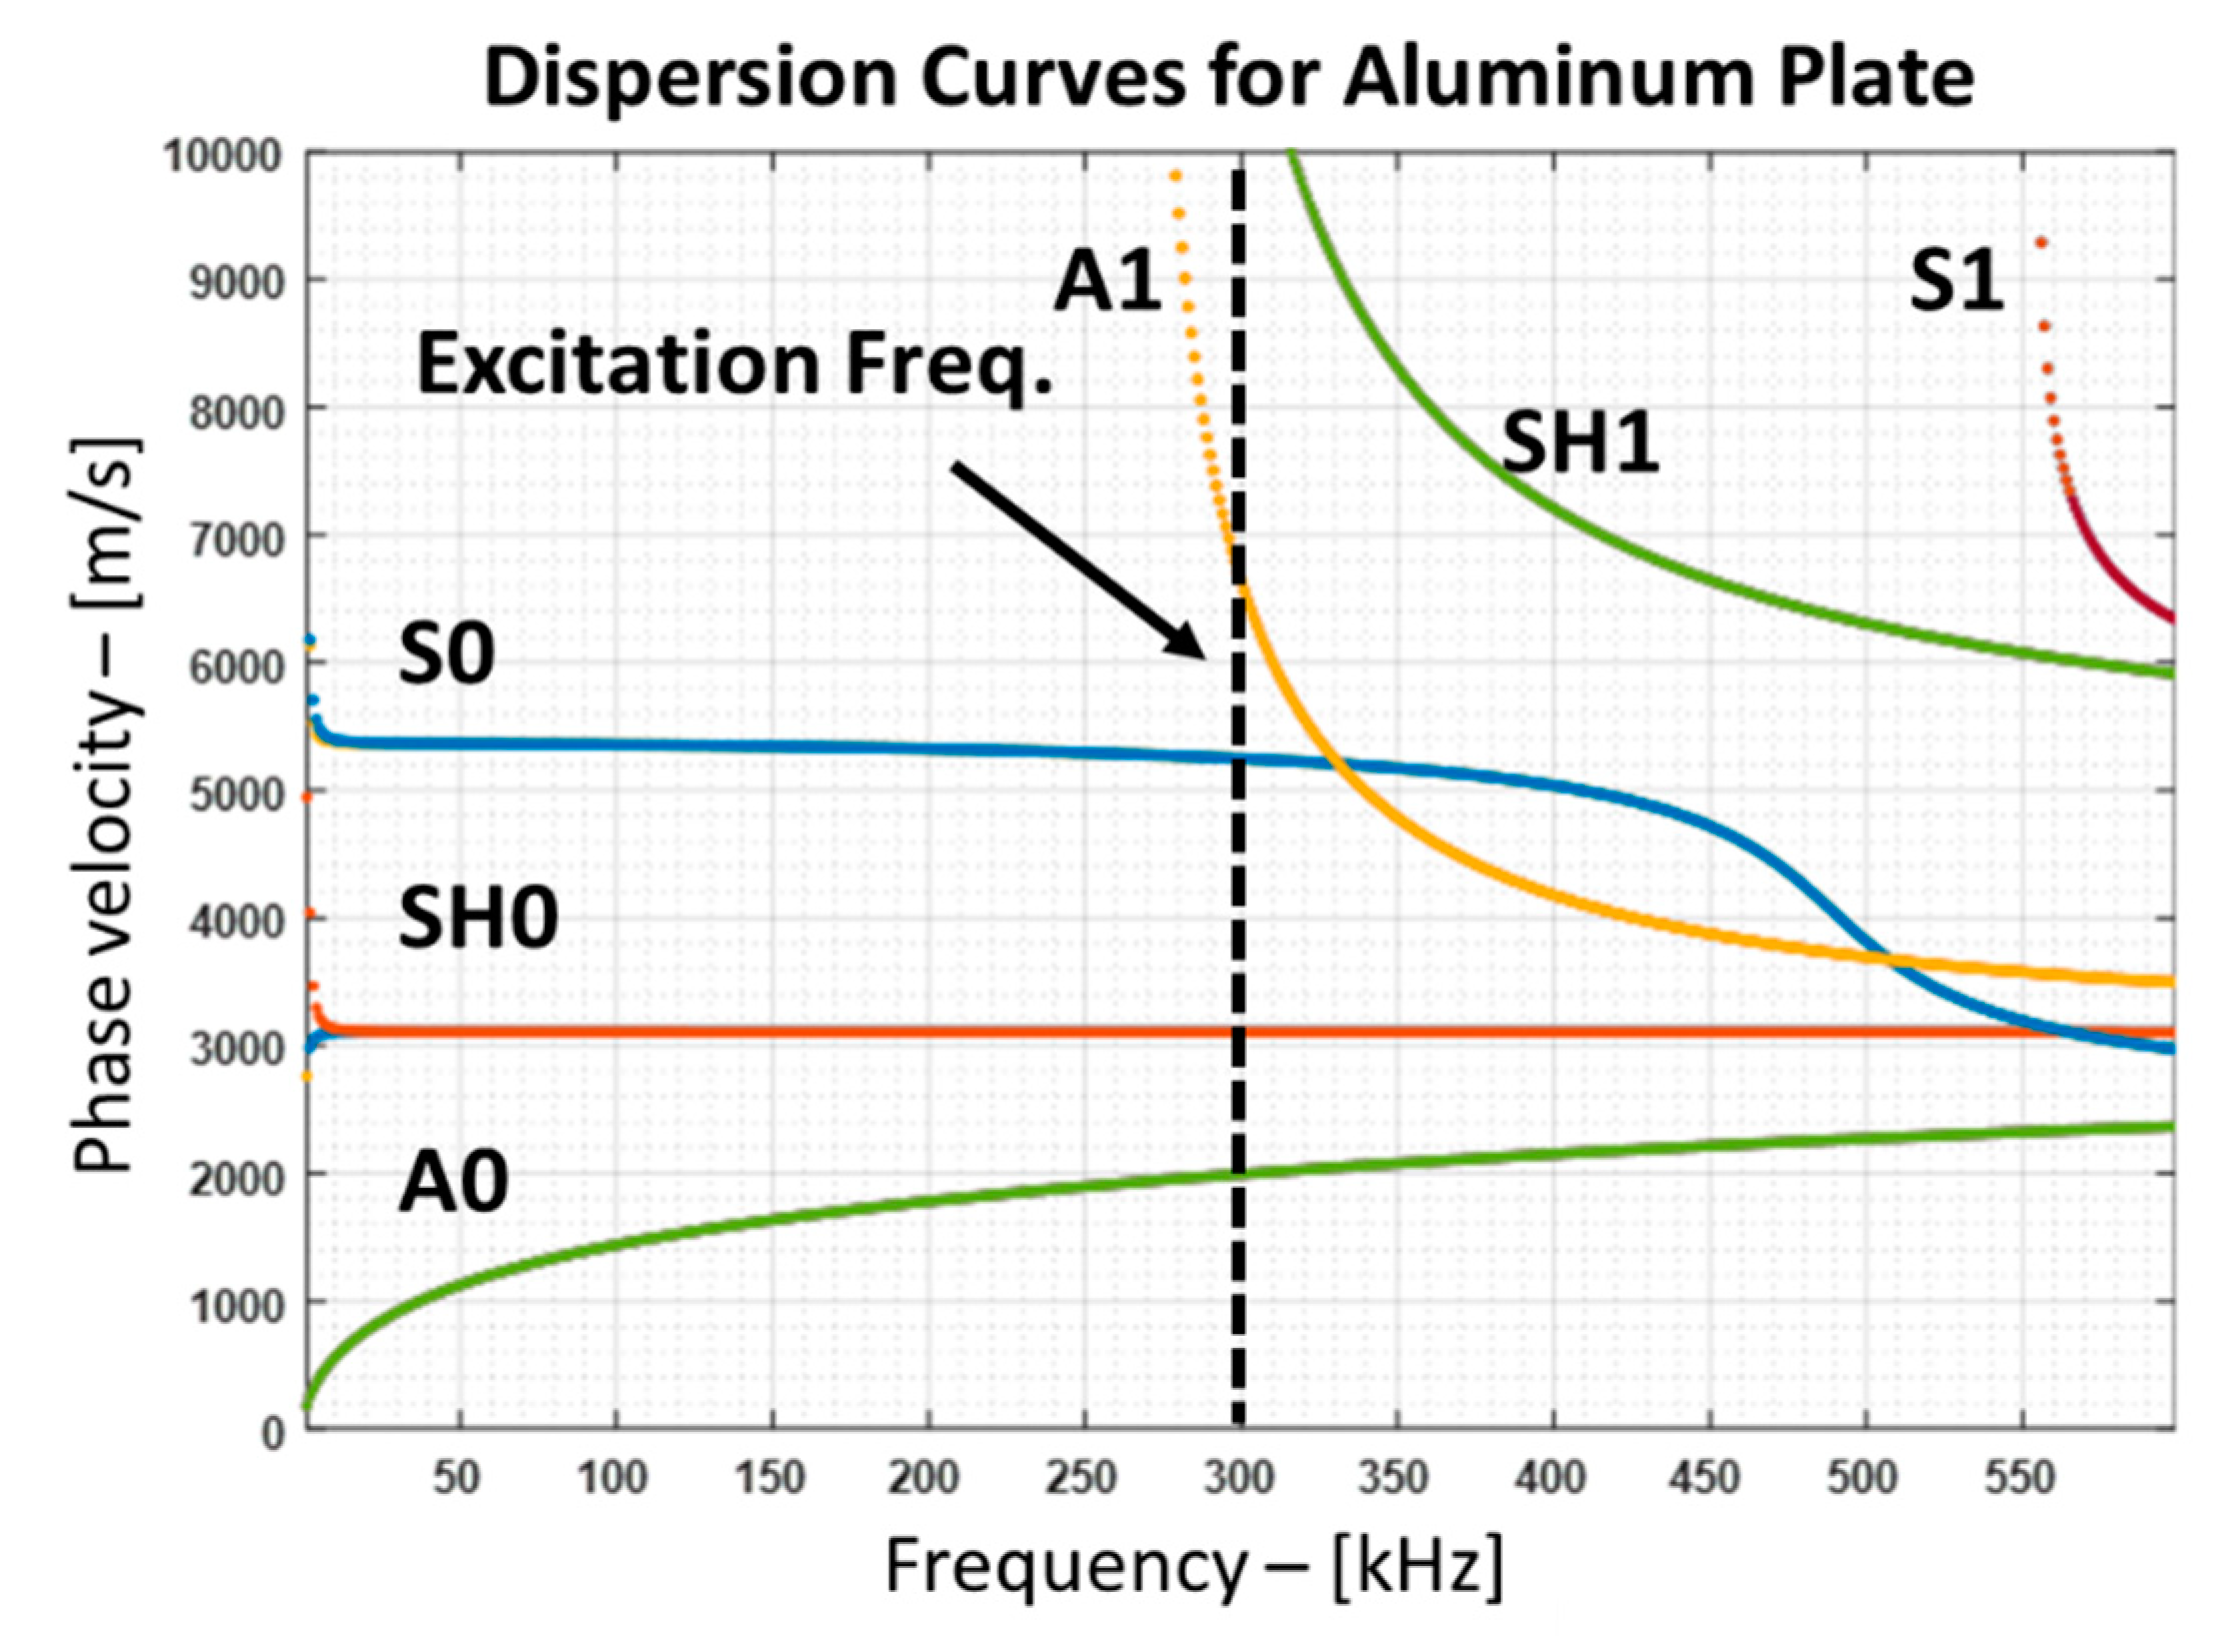
To generate the guided waves in the bonded plate, it is essential to obtain the parameters from the dispersion curves so that the specific modes can be generated. The phase velocity dispersion curves for 1.6 mm thick aluminium 2024 plate were obtained by a semi-analytical finite element (SAFE) method developed in Ultrasound Institute, Kaunas, is shown in Figure 6. To reduce the complexity of the investigation, fundamental modes are preferred. Specifically, A0 mode was selected because it has high out-of-plane displacement when compared to the symmetric S0 mode. Since air is the coupling medium, the incidence angle of 10.84° to generate A0 mode at 300 kHz was calculated using Snell’s law assuming the velocity of sound in air is 343.21 m/s and the phase velocity of A0 mode at 300 kHz is 1824 m/s.
The symmetrical three-dimensional (3D) model as shown in Figure 7 was created in COMSOL Multiphysics. The air is assigned as a pressure-acoustics domain, where aluminium and epoxy are assigned as a solid domain. To reduce the complexity of the numerical model, the actual geometry of the transducers was not considered, but instead, only the air domain for the medium of propagation was considered. The acoustic domain and the solid domain are coupled using the COMSOL Multi-physics node called acoustic-solid interaction, where the necessary equations are loaded automatically.
For the actuator, a cylindrical air domain with a diameter of 14 mm was considered, and the bottom flat surface was considered for excitation with a 10 period Hanning windowed sinusoidal burst at 300 kHz. For the reception, a point probe was considered to record the guided waves after passing through the bond. The normal displacement of the guided waves is recorded at 65 mm away from the transducer. Two simulations were performed, one case for a perfect bond condition and another case with a defect.
Here the defect is considered as a void where a rectangular portion of the epoxy is removed to simulate the artificial debonding within the structure. The size of the void is 12.7 mm × 0.063 mm. The change in amplitude of the ultrasonic signal will indicate the presence of debonding, and this effect will be compared with the results of the experiment. To avoid boundary reflection, the Rayleigh damping condition was applied to the edge surface of the plate and the radiating boundary condition was applied for the air domain to simulate an infinite acoustic medium.
The mesh size considered in each domain is according to the wavelength of each material at 300 kHz and the criteria of eight elements per wavelength was used. The second-order discretization (quadratic discretization) was used for elements. Hence, the following mesh sizes were considered: for air = 0.28601 mm, for Aluminium = 1.52 mm. The time step is calculated according to the Courant-Friedrichs-Lewy (CFL) criteria [29] for the slowest velocity in the simulation, which in this model is for air—343.21 m/s. Hence, the calculated time step is determined to be 8.33 nanoseconds. The total time of 170 µs was recorded. The computer used for the simulation has the configuration: Intel i7-3820 quad-core processor @ 3.60 GHz and 56 GB of RAM.
2.4.2. Air-Coupled to Contact Transducer Guided Wave Inspection
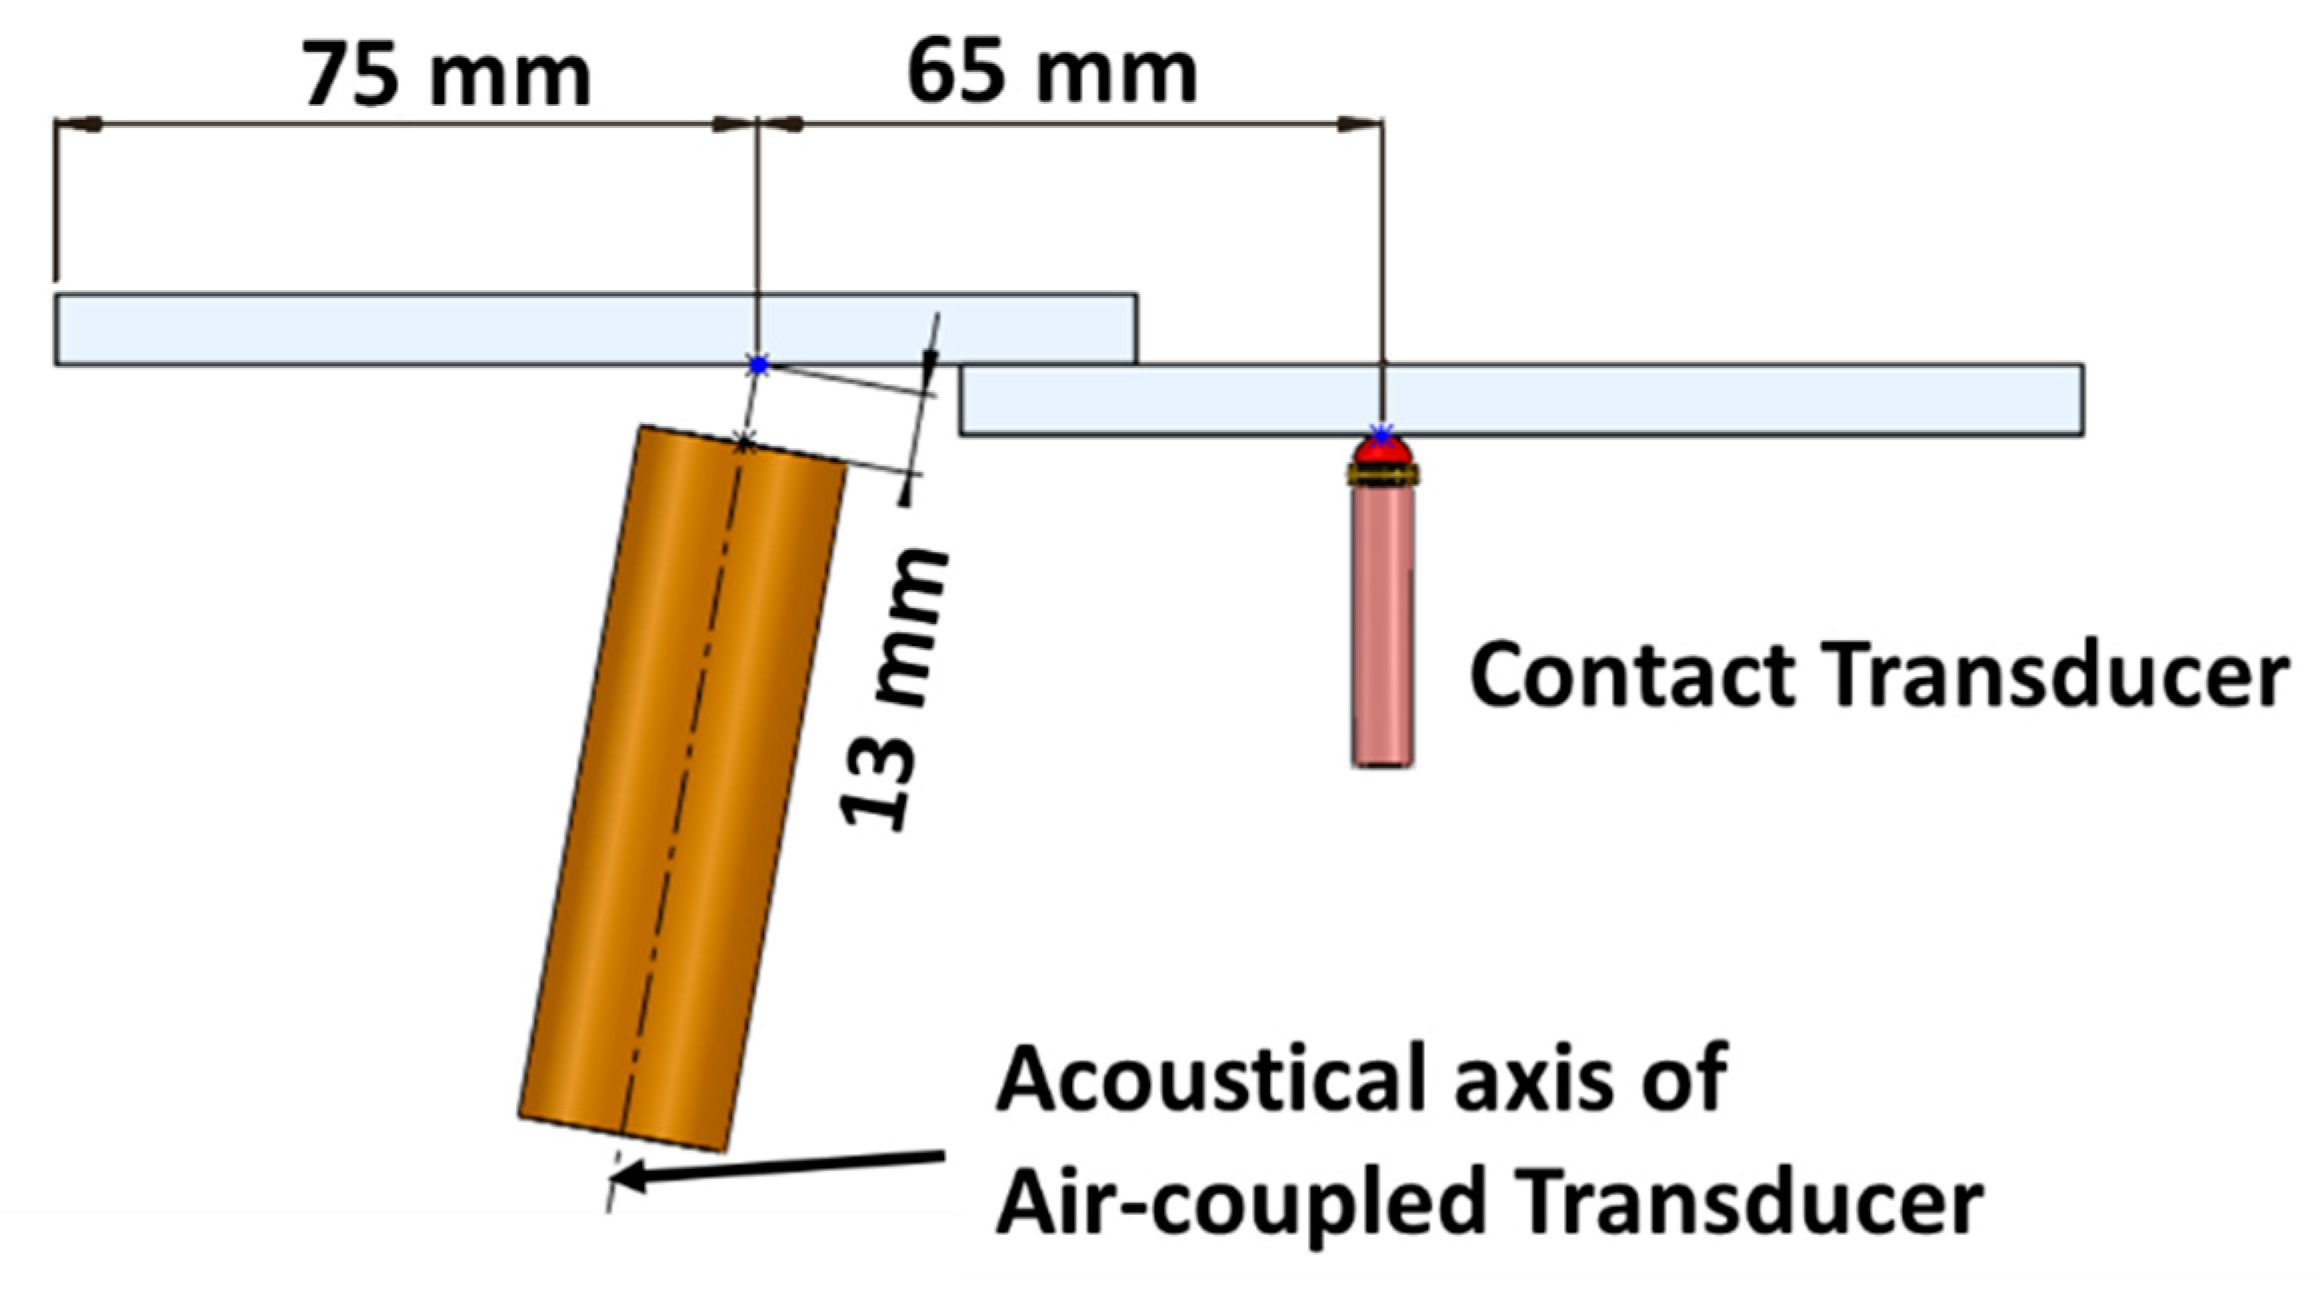
The aluminium-epoxy bonded structure was investigated using an air-coupled excitation and a point type contact reception technique. The air-coupled transducer is used as the transmitter placed at an angle of 10° to generate the A0 mode at 300 kHz. The guided waves in the plate are then received using the contact transducer placed normal to the surface of the plate to record the out of plane displacement. The schema of the setup is shown in Figure 8. For the reception, the contact transducer was spring loaded for a better contact, and glycerol was used as the coupling medium reducing the friction. The distance between the excitation air-coupled transducer centre and the contact transducer centre is kept at 65 mm (Figure 9).
2.4.3. Contact-to-Contact Transducer Guided Wave Inspection
For the contact-to-contact transducer guided wave technique, two spring-loaded point contact transducers at 300 kHz are placed normal to the surface of the plate as shown in Figure 10. The setup is similar to Figure 8, but instead of the air-coupled transducer, another contact transducer is placed normal to the plate. Those transducers are coupled to the plate with glycerol as the coupling medium. The distance between transducers is kept as 110 mm, while the bondline being at the centre.
3. Results
3.1. Bulk Wave Technique Results
3.1.1. Immersion Techniques
Through-Transmission Immersion Ultrasonic Inspection
Through-transmission immersion ultrasonic testing with bulk wave results are shown in Figure 11. The A-scans indicate where there is debonding—the ultrasonic bulk wave transmission to the receiver is significantly reduced (Figure 11a). While C-scan results mostly agree with the A-scans, it can be observed that the defect at the far left (defect number 1) is not as consistent as the other defects (Figure 11b). The slice in the middle of the bondline shows normalized amplitude change where there is debonding and no debonding.
Pulse-Echo Immersion Ultrasonic Inspection Results
The results obtained by the pulse-echo immersion technique are shown in Figure 12. According to the A-scan results, the interface reflection is not easily separable from the multiple reflections (Figure 12a). The window in the time domain has been selected to create C-scans according to the time of flight calculations; however, multiple reflections needed to be considered. The C-scan results show the defect position, however, the contrast between the defected zone and the sound area is not so clear (Figure 12b). The slice represents the normalized amplitude difference in the middle of the bondline. The higher values indicate the defect presence since the ultrasonic pulse-echo amplitude increases at the debonding due to impedance difference.
3.1.2. Scanning Acoustic Microscopy (SAM)
Experiments with the scanning acoustic microscope were performed and the results with A-scan, C-scan, and the slice in the middle of the bondline are shown in Figure 13. As seen in A-scan results, the amplitude in the debonded region is slightly increased, while the third wave packet which represents the reflection from the bottom interface has disappeared (Figure 13a). Due to the large size of the data, separate scans have been performed for each bond and then the resulting 5 C-scan images are stitched to form a single image in post-processing (Figure 13b).
3.1.3. Air-Coupled Ultrasonic NDT through-Transmission Technique
The air-coupled through-transmission scan was performed in an area of 125 × 25 mm with a 0.5 mm step size, which resulted in 12,801 scanning points. To improve the signal to noise ratio, each scan point was averaged 64 times (Figure 14a). Each signal is band-pass filtered in the frequency range from 200 kHz to 500 kHz to reduce the noise level. The resulting normalized C-scan is shown in Figure 14b and a slice of the C-scan image at Y = 14 mm presented in Figure 14c shows the damage profile of the debonding present in the specimen.
3.2. Guided Wave Techniques Results
3.2.1. Simulation for Guided Waves
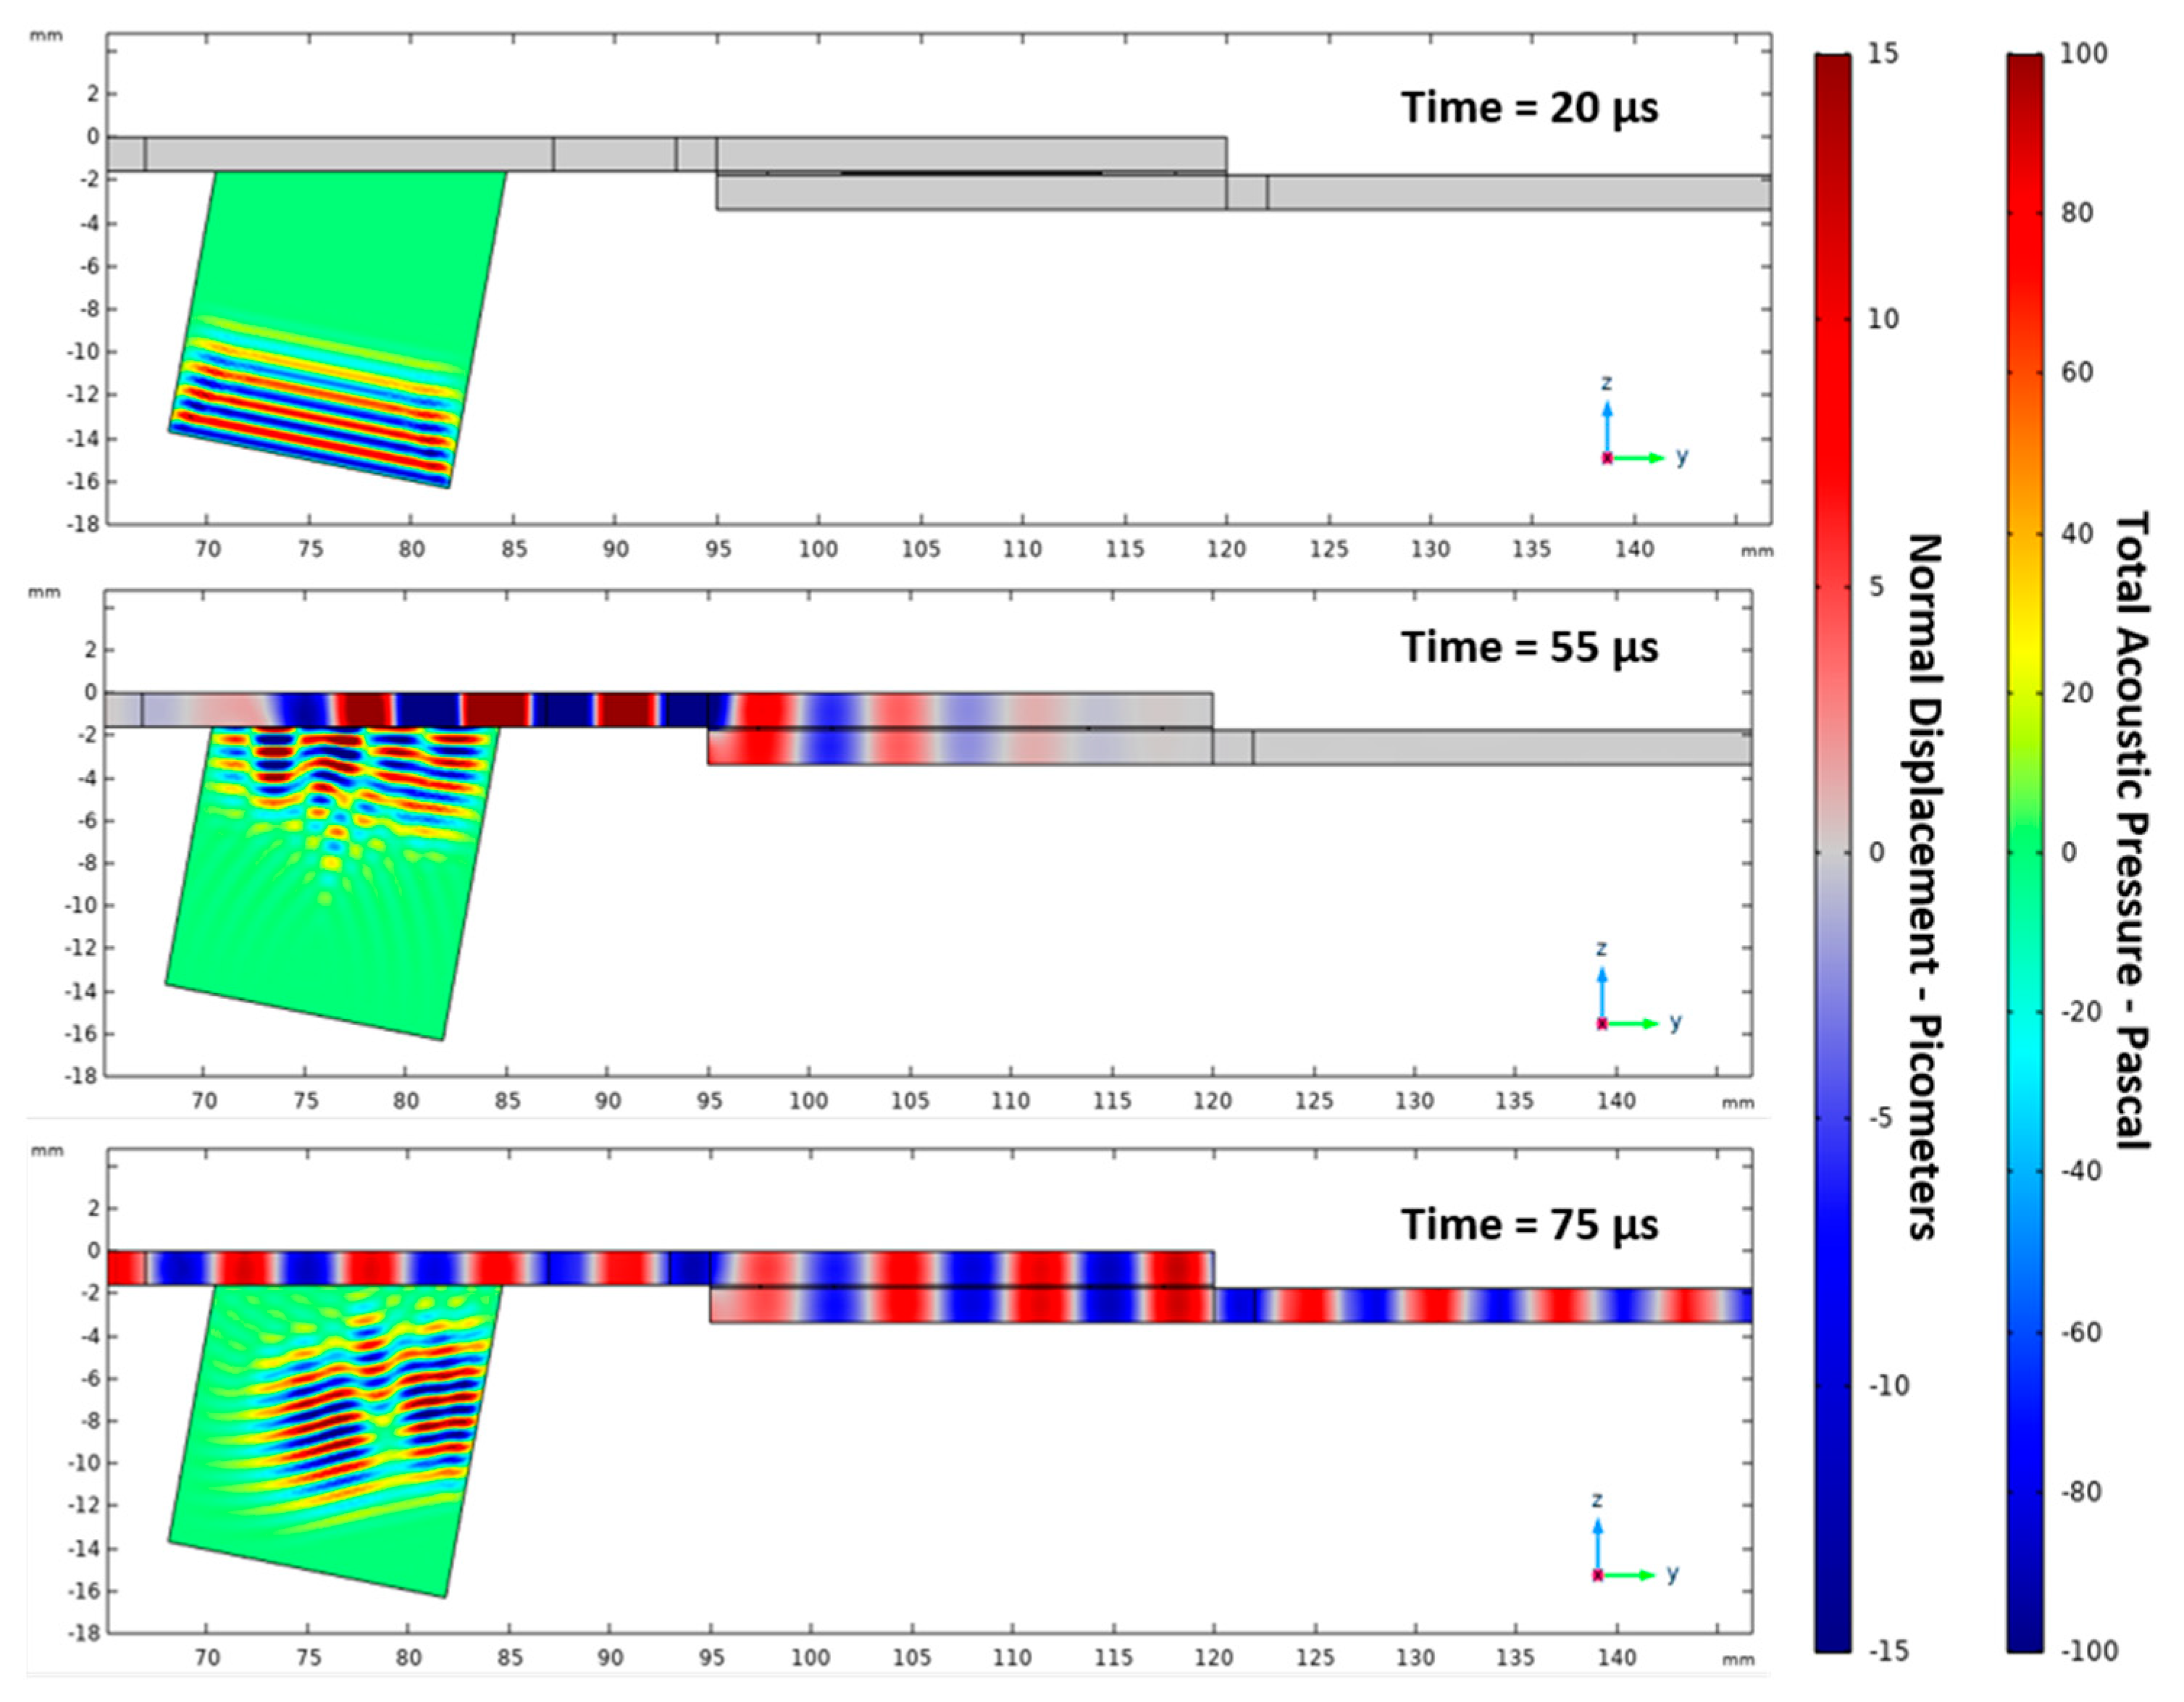
The simulation was performed to understand the constructive and destructive interference of the guided waves in the bonding region and to visualize the spatial distributions in the debonded region in order to understand what to expect in the experimental investigation. The snapshots of the normal distribution along the plane of symmetry at different time frames are shown in Figure 15 where propagation of only A0 mode is evident. In Figure 16a,b, the spatial distributions of the normal displacement for two cases are shown in the left and the middle at 75 µs where visually the two cases are almost indistinguishable. Thus, the differential image (Figure 16c) was obtained by taking a difference between the reference case without defect and the case with the defect at 75 µs. The differential image plot shows the area, which is most suitable to record the signals to obtain maximum information about the defect. The experimental parameters are selected based on these results. The A-scan results from the case with debonding and case with the perfect bond are shown in Figure 17. The results show that the guided waves in the debonded joint show a higher amplitude than the perfect bond. The results are likely to be caused by the splitting of guided waves in the debonded region, causing constructive interference after the waves have crossed the debonded region.
3.2.2. Air-Coupled to Contact Transducer Guided Wave
The air-coupled to contact guided wave B-scan is of length 170 mm with a step of 0.5 mm, which comprises of total 341 scans. The scan was made with 32 times averaging where each scan took 2 s. Since the contact transducer is used, there is not much signal pre-amplification necessary when compared to air-coupled through-transmission. In this case, the static gain and dynamic gain used were 50 dB and 10 dB, respectively.
The A-scan and B-scan of this experiment is shown in Figure 18a and Figure 18b, respectively. In the B-scan, the normalized absolute values are shown where the increase in amplitude means that there is a presence of debonding while the lower values represent the place where there is no debonding (perfect bond). This kind of increase in amplitude when GW is passing through the bond is also observed in the simulation. This can be visualized from the A-scans as shown in Figure 18a. Along the B-scan, a slice at the time instant 62.84 µs is shown in Figure 18c, where it represents the damage profile along the scanning distance.
When using the air-coupled transducer as the actuator, the incidence angle can be changed. Since the incidence angle is not normal to the plate, the amplitude of the guided waves can be directionally controlled. This effect can be also visualized in the spatial distributions in the simulation. Thus, this way of excitation can be highly beneficial to focusing the amplitude of the guided wave in one direction and, thereby, avoiding the boundary reflection from the edges of the plate.
3.2.3. Contact-to-Contact Transducer Guided Wave Result
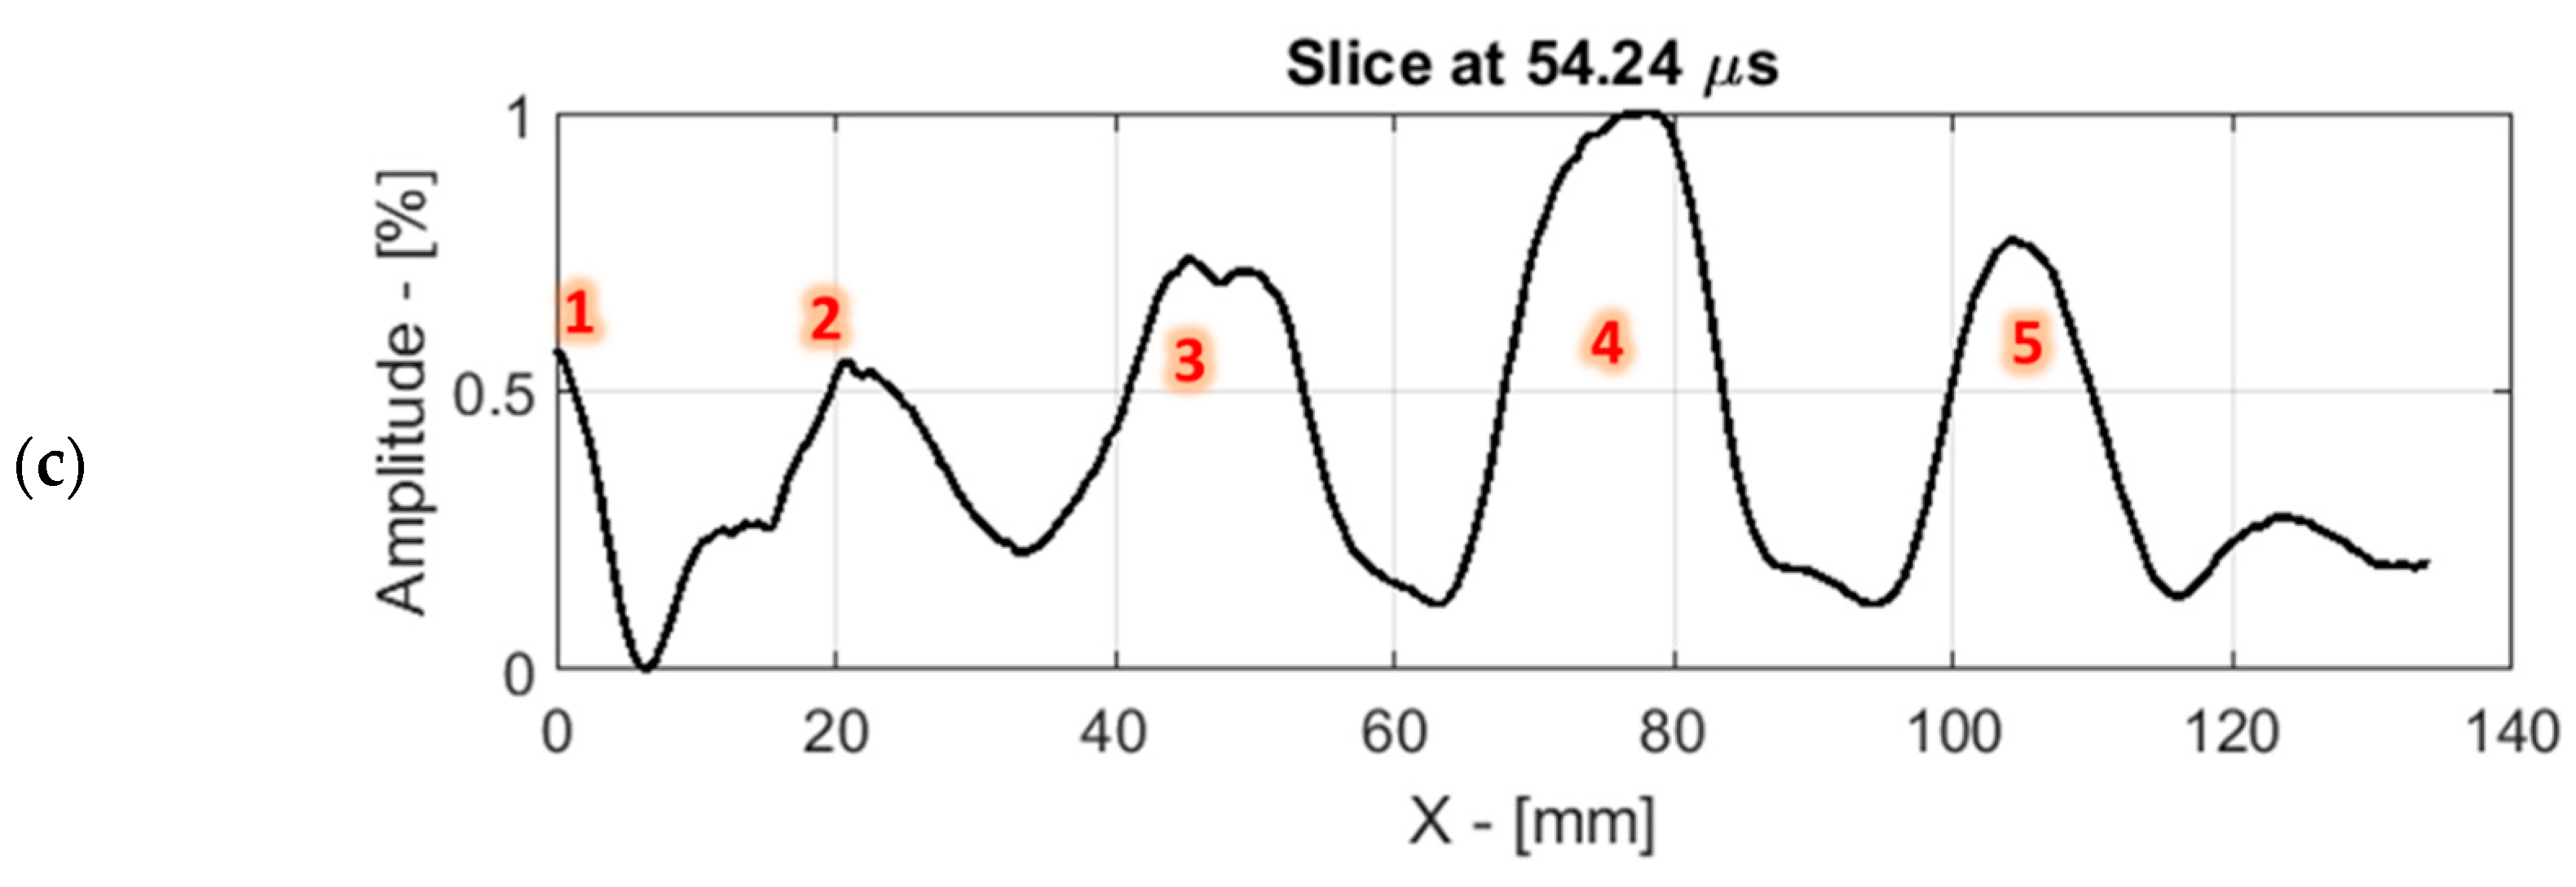
The scanning parameters were the same as that of the air-coupled to contact the GW method. However, in this case, since two contact transducers were used the transmission efficiency is higher in comparison to air-coupled transducers. Thus, the used static gain was 25 dB, and the dynamic gain was 10 dB. The A-scan and B-scan of the experiment with contact-to-contact transducers GW is shown in Figure 19a,b, respectively. The results in this method can be interpreted in a similar way to the results of the air-coupled to contact GW because the amplitude of the GW increases when it passes through the debonded region due to the constructive interference.
When compared to the air-coupled excitation method, where the incidence angle can be changed, here the angle of incidence is normal to the surface of the plate. Hence, the generated guided waves will have equal amplitudes in all directions. As a result, a strong boundary reflection was observed at the edge of the plate. This interference of the boundary reflection can hinder the possibility of detecting the defects near the edge of the plate boundary Figure 19b. The A-scans from the perfect bond path and the path with debonding is shown in Figure 19a.
The amplitude of the A-scan along the path with the debonding shows a higher amplitude than the amplitude of the A-scan along the perfect bond path. A similar effect can also be observed in the simulation and in air-coupled excitation and contact reception GW technique.
4. Discussion on Comparison of NDT Techniques
Six different ultrasonic NDT techniques for the evaluation of adhesive bonding quality have been investigated. Aluminium-epoxy-aluminium bonded structures with interface debonding have been investigated with ultrasonic bulk waves as immersion through-transmission, immersion pulse-echo, scanning acoustic microscopy, and air-coupled ultrasonic through-transmission methods. Additionally, two guided wave inspections have been performed: air-coupled to contact transducer and two contact transducers.
According to different ultrasonic NDT results, the defect detection performance in immersion techniques is better than of the air-coupled methods. Specifically, immersion techniques—with through-transmission (Figure 11), pulse-echo (Figure 12), and scanning acoustic microscopy (SAM, Figure 13), identified five different defects successfully. Immersion through-transmission C-scan results suggest that the defect number 1 has different properties than other defects. The same abnormality is observed in immersion pulse-echo and SAM results; however, the level of contrast difference is less than using the through-transmission technique. This abnormality might be caused a physical phenomenon such as the lack of air within the double-sided release film. On the other hand, air-coupled through-transmission ultrasonic NDT was successful to visualize four defects (2–5) as seen in Figure 14b. In this case, the defect number 1 was not identified because the active part of the transducer is exposed outside the plate boundary. Since there is no barrier between ultrasonic transducers, the ultrasonic wave is directly transmitted to the receiver causing significantly high amplitude values. Moreover, the second defect at left shows the higher transmission of the ultrasonic bulk wave than in the case of a perfect bond; therefore, the identification of this defect is questionable. Guided wave inspection with air-coupled to contact transducer has shown that three defects with defect numbers 2–4, which are at the centre of the investigation, have been identified as defects (Figure 18). With contact-to-contact transducer guided wave inspection, four areas are identified as defects (Figure 19). The defect number 1 is difficult to detect due to the wave packet reflected from the structure boundary.
Additionally, ultrasonic NDT techniques have been compared, according to defect sizing performances. For each NDT technique, the decibel drop method had been employed to determine the size of the defects (Figure 20) [30]. According to this technique, a slice with normalized amplitude from the observed C-scan or B-scan is crossed with a horizontal line at the desired decibel drop. For immersion ultrasonic NDT and scanning acoustic microscopy (SAM) results, the slice has been selected in the middle of the defects. The slice selections in air-coupled through-transmission C-scan and guided wave B-scans are performed according to the highest contrast observed. The defect size has been calculated with the −6 dB drop method except for air-coupled through-transmission NDT technique where the drop line is selected at −12 dB. The calculated defect sizes are reported in Table 3. Moreover, the relative errors have been estimated according to the known defect size (12.7 mm). It can be observed that the immersion techniques and SAM can size the defects with higher precision than the air-coupled and contact techniques. Compared to the guided wave inspections, the air-coupled through-transmission method shows higher accuracy of defect sizing. In-between guided wave techniques, the contact-to-contact method determines defect size better than the air-coupled to contact method. However, it is observed that the guided wave contact-to-contact method has high variation in defect sizing for different defects: while defect number 3 has been sized with less than 1% error, others show more than 20% relative error.
While the performance in defect detection and defect sizing of the immersion ultrasonic techniques including SAM is significantly higher than of the air-coupled and contact NDT techniques; the applicability aspects should be discussed. Immersion ultrasonic NDT applications are limited because structures being under water makes them susceptible to corrosion. Additionally, open-wound defects, such as impact damages, are not recommended to undergo immersion testing. In the case of SAM, while the inspection time is shorter, any irregularity in structure geometry such as curved surfaces significantly affects the inspection performance. While air-coupled through-transmission system provides a clear visualization of the inner structure, the amplitude loss in the air makes the experimental set-up very sensitive to structure boundaries and environmental error. Hence, the experiments require higher averaging which leads to a time cost, nevertheless air-coupled experiments would be preferred in an industrial set-up. Furthermore, guided wave (GW) inspection gives us the possibility to inspect large bonded structures in a short time. GW air-coupled to contact transducer set up shows that only one side contact to the bonded structure might be enough to determine debonding defects. When compared to the air-coupled to contact transducer guided waves, two-contact transducers method can give results with significantly higher amplitude and lower transmission losses because of better coupling.
Considering the advantages and limitations that each ultrasonic NDT technique offers, we propose a relative comparison method where the average absolute errors have been normalized according to the ultrasonic wavelengths that have been transferred inside the adhesive bond. The wavelength is an important ultrasonic parameter that describes the relationship between the ultrasonic wave velocity and the inspection frequency. The half-wavelengths are used in the ultrasonic defect detection procedures as a limit to detect the smallest defect. The average absolute error values that are normalized with respect to the wavelengths are shown in Figure 21. For each ultrasonic NDT technique, the inspection frequency and the dominant ultrasonic wave velocity have been considered (the longitudinal velocity for bulk waves, the A0 velocity for GW). The graph presented allows one to evaluate the performance of the investigated NDT techniques. In between immersion techniques and SAM, the immersion through-transmission technique has the lowest error value. The air-coupled through-transmission indicate lower error values than the guided wave (GW) inspections. GW contact-to-contact method performs better than the GW air-coupled to contact method.
The investigated defects within adhesive joints might occur due to the foreign material inclusions at the manufacturing stage or the debonding caused by the fatigue in usage. Quality control of adhesive bonding must be performed both in the manufacturing line and in regular interval maintenance. Within all ultrasonic NDT techniques compared, the immersion through-transmission technique performs the best; however, in real life two-side access to the structures is very limited. On the other hand, although immersion ultrasonic techniques show a high performance, the experimental set-ups are bulky: difficult to change position and not applicable to in-situ testing. The scanning acoustic microscopy shows that the defect detection and sizing can be performed with a high precision, however, the detection systems are also bulky, and the structures inspected must be small. Moreover, where two-sided inspection is possible, air-coupled through-transmission techniques might achieve high efficiency. Finally, the guided wave inspection techniques are suitable for industrial set-ups in both manufacturing and maintenance scenarios, where the structures can be inspected in-situ. In order to evaluate bonding quality with high performance and low cost to the production/maintenance line, the structures can firstly be evaluated with guided wave inspections; then, if the anomalies are observed further, more accurate investigations might be performed using ultrasonic immersion techniques.
5. Conclusions
This paper compares the performance of immersion, air-coupled, and contact ultrasonic non-destructive testing techniques in bonding quality evaluation. The aluminium-epoxy-aluminium single lap adhesive joints containing debonding have been investigated with both bulk wave and guided wave inspections. According to the investigation results, the following conclusions have been made:
- For through-transmission techniques, the amplitude of the bulk wave decreases on the debonded area whereas in the case of guided waves and pulse-echo inspections, the amplitude increases when passing through the debonded area.
- The defect detectability and sizing performance of the immersion techniques and the scanning acoustic microscopy is higher than the performance of the air-coupled through-transmission and guided wave techniques.
- The relative comparison of ultrasonic NDT techniques in defect sizing has been performed by the ratio of average absolute defect sizing error to ultrasonic wavelength inside the adhesive bond. While the best performance is observed in the immersion through-transmission technique, the high performance for the air-coupled through-transmission technique cannot be disregarded.
- In this case study, ultrasonic techniques could be sorted from best to worst in defect sizing as: immersion through-transmission, SAM, immersion pulse-echo, air-coupled through-transmission, guided wave contact-to-contact, and guided wave air-coupled to contact.
- While immersion ultrasonic techniques and acoustic microscopy achieve high precision in defect detection and sizing, the structure under the test needs to be immersed in water. These NDT systems are bulky and expensive. Air coupled ultrasonic techniques reach lower precision than immersion techniques, but they allow non-contact inspection. Since the air-coupled through-transmission technique requires two-sided inspection, the guided wave inspections could be recommended for in-situ applications.
- In industrial applications, the structures can be inspected with less precise but more applicable techniques like guided wave ultrasonic methods, and if the abnormalities are detected, further investigations with higher precision techniques, such as immersion and acoustic microscopy, could be used.
Author Contributions
Conceptualization, B.Y., A.A., E.J., and R.J.K.; methodology, B.Y., A.A., E.J., and R.J.K.; software, B.Y. and A.A.; validation, E.J., and R.J.K.; investigation, B.Y. and A.A.; formal analysis, B.Y. and A.A.; data curation, B.Y. and A.A.; writing—original draft preparation, B.Y., and A.A.; writing—review and editing, B.Y.; A.A.; E.J., and R.J.K.; visualization, B.Y. and A.A.; supervision, E.J., and R.J.K.; project administration, E.J.; funding acquisition, E.J. All authors have read and agreed to the published version of the manuscript.
Funding
This research was funded by the NDTonAIR project from the European Union’s Horizon 2020 Research and Innovation program under the Marie Skłodowska-Curie, grant number 722134.
Acknowledgments
The authors would like to acknowledge the contributions of Reimondas Sliteris, Egidijus Zukauskas, Vaidotas Cicenas, Vykintas Samaitis, and Audrius Jankauskas on the experiments performed; and the contribution of Mastan Raja Papanaboina on the numerical investigations.
Conflicts of Interest
The authors declare no conflict of interest.
References
- Tornow, C.; Schlag, M.; Lima, L.C.M.; Stübing, D.; Hoffmann, M.; Noeske, P.-L.M.; Brune, K.; Dieckhoff, S. Quality assurance concepts for adhesive bonding of composite aircraft structures–Characterisation of adherent surfaces by extended NDT. J. Adhes. Sci. Technol. 2015, 29, 2281–2294. [Google Scholar] [CrossRef]
- Asif, M.; Khan, M.A.; Khan, S.Z.; Choudhry, R.S.; Khan, K.A. Identification of an effective nondestructive technique for bond defect determination in laminate composites—A technical review. J. Compos. Mater. 2018, 52, 3589–3599. [Google Scholar] [CrossRef] [Green Version]
- Yilmaz, B.; Ba, A.; Jasiuniene, E.; Bui, H.K.; Berthiau, G. Comparison of different non-destructive testing techniques for bonding quality evaluation. In Proceedings of the 2019 IEEE 5th International Workshop on Metrology for AeroSpace (MetroAeroSpace), Torino, Italy, 19–21 June 2019; IEEE: Piscataway Township, NJ, USA, 2019; pp. 92–97. [Google Scholar] [CrossRef]
- Ehrhart, B.; Valeske, B.; Muller, C.-E.; Bockenheimer, C. Methods for the Quality Assessment of Adhesive Bonded CFRP Structures—A Resumé. Proc. Int. 2010, 1–9. [Google Scholar] [CrossRef]
- Raišutis, R.; Kažys, R.; Mažeika, L. Application of the ultrasonic pulse-echo technique for quality control of the multi-layered plastic materials. NDT E Int. 2008, 41, 300–311. [Google Scholar] [CrossRef]
- Titov, S.A.; Maev, R.G.; Bogachenkov, A.N. Pulse-echo NDT of adhesively bonded joints in automotive assemblies. Ultrasonics 2008, 48, 537–546. [Google Scholar] [CrossRef] [PubMed]
- Tamborrino, R.; Palumbo, D.; Galietti, U.; Aversa, P.; Chiozzi, S.; Luprano, V.A.M. Assessment of the effect of defects on mechanical properties of adhesive bonded joints by using non destructive methods. Compos. Part B Eng. 2016, 91, 337–345. [Google Scholar] [CrossRef]
- Scarselli, G.; Nicassio, F. Analysis of debonding in single lap joints based on employment of ultrasounds. Health Monit. Struct. Biol. Syst. 2017, 1017020, 1017020. [Google Scholar] [CrossRef]
- Galy, J.; Moysan, J.; El Mahi, A.; Ylla, N.; Massacret, N. Controlled reduced-strength epoxy-aluminium joints validated by ultrasonic and mechanical measurements. Int. J. Adhes. Adhes. 2017, 72, 139–146. [Google Scholar] [CrossRef]
- Wood, M.; Charlton, P.; Yan, D. Ultrasonic Evaluation of Artificial Kissing Bonds in CFRP Composites. E-J. Nondestruct. Test. 2014, 19, 1–10. [Google Scholar]
- Jasiūnienė, E.; Mažeika, L.; Samaitis, V.; Cicėnas, V.; Mattsson, D. Ultrasonic non-destructive testing of complex titanium/carbon fibre composite joints. Ultrasonics 2019. [Google Scholar] [CrossRef]
- Yılmaz, B.; Jasiūnienė, E. Advanced ultrasonic NDT for weak bond detection in composite-adhesive bonded structures. Int. J. Adhes. Adhes. 2020, 102, 102675. [Google Scholar] [CrossRef]
- Twerdowski, E.; von Buttlar, M.; Grill, W. Scanning acoustic defocused transmission microscopy with vector contrast combined with holography for weak bond imaging. Health Monit. Smart Nondestruct. Eval. Struct. Biol. Syst. V 2006, 6177, 617718. [Google Scholar] [CrossRef]
- Jasiūnienė, E.; Žukauskas, E.; Dragatogiannis, D.A.; Koumoulos, E.P.; Charitidis, C.A. Investigation of dissimilar metal joints with nanoparticle fillers. NDT E Int. 2017. [Google Scholar] [CrossRef]
- Sunarsa, T.Y.; Aryan, P.; Jeon, I.; Park, B.; Liu, P.; Sohn, H. A reference-free and non-contact method for detecting and imaging damage in adhesive-bonded structures using air-coupled ultrasonic transducers. Materials 2017, 10, 1402. [Google Scholar] [CrossRef] [PubMed] [Green Version]
- Wu, W.-L.; Wang, X.-G.; Huang, Z.-C.; Wu, N.-X. Measurements of the weak bonding interfacial stiffness by using air-coupled ultrasound. AIP Adv. 2017, 7, 125316. [Google Scholar] [CrossRef]
- Kazys, R.; Demcenko, A.; Zukauskas, E.; Mazeika, L. Air-coupled ultrasonic investigation of multi-layered composite materials. Ultrasonics 2006, 44. [Google Scholar] [CrossRef]
- Cerniglia, D.; Montinaro, N.; Nigrelli, V. Detection of disbonds in multi-layer structures by laser-based ultrasonic technique. J. Adhes. 2008. [Google Scholar] [CrossRef] [Green Version]
- Kazys, R.J.; Mazeika, L.; Sestoke, J. Development of ultrasonic techniques for measurement of spatially non-uniform elastic properties of thin plates by means of a guided sub-sonic A0 mode. Appl. Sci. 2020, 10, 3299. [Google Scholar] [CrossRef]
- Zhang, K.; Zhou, Z. Quantitative characterization of disbonds in multilayered bonded composites using laser ultrasonic guided waves. NDT E Int. 2018. [Google Scholar] [CrossRef]
- Castaings, M. SH ultrasonic guided waves for the evaluation of interfacial adhesion. Ultrasonics 2014, 54, 1760–1775. [Google Scholar] [CrossRef]
- Matt, H.; Bartoli, I.; Coccia, S.; Lanza di Scalea, F.; Oliver, J.; Kosmatka, J.; Gyuhae, P.; Farrar, C. Ultrasonic guided wave monitoring of composite bonded joints using macro fiber composite transducers. Smart Struct. Mater. 2006. [Google Scholar] [CrossRef]
- Siryabe, E.; Renier, M.; Meziane, A.; Castaings, M. The transmission of lamb waves across adhesively bonded lap joints to evaluate interfacial adhesive properties. Phys. Procedia 2015, 70, 541–544. [Google Scholar] [CrossRef] [Green Version]
- Marks, R.; Clarke, A.; Featherston, C.; Paget, C.; Pullin, R. Lamb Wave Interaction with Adhesively Bonded Stiffeners and Disbonds Using 3D Vibrometry. Appl. Sci. 2016, 6, 12. [Google Scholar] [CrossRef] [Green Version]
- Sherafat, M.H.; Guitel, R.; Quaegebeur, N.; Lessard, L.; Hubert, P.; Masson, P. Guided wave scattering behavior in composite bonded assemblies. Compos. Struct. 2016, 136, 696–705. [Google Scholar] [CrossRef]
- Leiderman, R.; Figueroa, J.C.; Braga, A.M.B.; Rochinha, F.A. Scattering of ultrasonic guided waves by heterogeneous interfaces in elastic multi-layered structures. Wave Motion 2016, 63, 68–82. [Google Scholar] [CrossRef]
- Leiderman, R.; Braga, A.M.B. Scattering of guided waves by defective adhesive bonds in multilayer anisotropic plates. Wave Motion 2017, 74, 93–104. [Google Scholar] [CrossRef]
- Cho, H.; Hara, Y.; Matsuo, T. Evaluation of the thickness and bond quality of three-layered media using zero-group-velocity lamb waves. J. Phys. Conf. Ser. 2014, 520. [Google Scholar] [CrossRef]
- Duczek, S.; Joulaian, M.; Düster, A.; Gabbert, U. Numerical analysis of Lamb waves using the finite and spectral cell methods. Int. J. Numer. Methods Eng. 2014. [Google Scholar] [CrossRef]
- Felice, M.V.; Fan, Z. Sizing of flaws using ultrasonic bulk wave testing: A review. Ultrasonics 2018. [Google Scholar] [CrossRef]
Figure 1.
Single lap joint containing double-sided release film debonding: (a) prior to bonding top view photo where the right side is perfectly bonded and the left side is with debonding; (b) side view schematics.
Figure 1.
Single lap joint containing double-sided release film debonding: (a) prior to bonding top view photo where the right side is perfectly bonded and the left side is with debonding; (b) side view schematics.

Figure 2.
Ultrasonic non-destructive testing methods that were used for adhesive bond inspection.

Figure 3.
Experimental set-up: immersion ultrasonic non-destructive testing (NDT) with through-transmission (a) and scanning acoustic microscopy (b).
Figure 3.
Experimental set-up: immersion ultrasonic non-destructive testing (NDT) with through-transmission (a) and scanning acoustic microscopy (b).

Figure 4.
Air coupled through-transmission experimental setup.

Figure 5.
Schema of the simulation model for the air-coupled transducer to contact transducer guided wave.
Figure 5.
Schema of the simulation model for the air-coupled transducer to contact transducer guided wave.

Figure 6.
Phase velocity dispersion curves for aluminium 2024 plate with 1.6 mm thickness.

Figure 7.
One-half of the symmetric model with two cases: one with the defect, and one without defect.
Figure 7.
One-half of the symmetric model with two cases: one with the defect, and one without defect.

Figure 8.
Guided wave inspection set-up with air-coupled to contact ultrasonic transducer.

Figure 9.
Side view of the air-coupled to contact guided wave (GW) inspection set-up.

Figure 10.
Guided wave arrangement with two contact ultrasonic transducers.

Figure 11.
Immersion ultrasonic through-transmission results: (a) A-scan; (b) C-scan; (c) slice from the middle of the defects.
Figure 11.
Immersion ultrasonic through-transmission results: (a) A-scan; (b) C-scan; (c) slice from the middle of the defects.

Figure 12.
Immersion pulse-echo results: (a) A-scan; (b) C-scan with the gate at the bonding interface time of flight; (c) slice from the middle of the defects.
Figure 12.
Immersion pulse-echo results: (a) A-scan; (b) C-scan with the gate at the bonding interface time of flight; (c) slice from the middle of the defects.

Figure 13.
Scanning acoustic microscopy (SAM) results for debonded sample: (a) A-scan; (b) C-scan; (c) slice from the middle of the defects.
Figure 13.
Scanning acoustic microscopy (SAM) results for debonded sample: (a) A-scan; (b) C-scan; (c) slice from the middle of the defects.

Figure 14.
Results of the air-coupled through-transmission: (a) A-scan; (b) C-scan; (c) slice at Y = 14 mm.
Figure 14.
Results of the air-coupled through-transmission: (a) A-scan; (b) C-scan; (c) slice at Y = 14 mm.


Figure 15.
Snapshots of the normal displacements from COMSOL simulation (side view) of the no defect model at time instants 20 µs, 55 µs, and 75 µs showing propagation of A0 mode.
Figure 15.
Snapshots of the normal displacements from COMSOL simulation (side view) of the no defect model at time instants 20 µs, 55 µs, and 75 µs showing propagation of A0 mode.

Figure 16.
Snapshots from simulation (bottom view) of the mirrored model, which shows the normal distributions at the time instant 75 µs: (a) the case with no defect; (b) the case with the defect; (c) the differential image.
Figure 16.
Snapshots from simulation (bottom view) of the mirrored model, which shows the normal distributions at the time instant 75 µs: (a) the case with no defect; (b) the case with the defect; (c) the differential image.

Figure 17.
Guided wave A-scan—numerically simulated with probe point across the bond.

Figure 18.
Air-coupled to contact guided waves results: (a) A-scan; (b) B-scan; (c) slice at time = 62.84 μs.
Figure 18.
Air-coupled to contact guided waves results: (a) A-scan; (b) B-scan; (c) slice at time = 62.84 μs.


Figure 19.
Contact-to-contact guided wave results: (a) A-scan; (b) B-scan; (c) slice at time = 54.24 μs.
Figure 19.
Contact-to-contact guided wave results: (a) A-scan; (b) B-scan; (c) slice at time = 54.24 μs.


Figure 20.
Decibel drop method (−6 dB and −12 dB) to measure the defect size for different ultrasonic NDT techniques: (a) immersion ultrasonic through-transmission; (b) immersion ultrasonic pulse-echo; (c) scanning acoustic microscopy; (d) air coupled ultrasonic testing through-transmission; (e) guided wave ultrasonic testing with air-coupled to contact; (f) guided wave ultrasonic testing with the contact-to-contact method.


Figure 21.
Defect sizing normalized absolute errors per wavelength for each defect and ultrasonic NDT techniques.
Figure 21.
Defect sizing normalized absolute errors per wavelength for each defect and ultrasonic NDT techniques.


Table 1.
Comparison of different techniques.
| Techniques | Capabilities | Limitations |
|---|---|---|
| Immersion testing | MHz range operating frequency, coupling uniformity, less wear for probes, focused beams. | Limited materials due to corrosion. |
| Air-coupled testing | 50 kHz to 2 MHz operating frequency, contactless coupling, focused beams. | High attenuation loss at higher frequencies, lower signal to noise ratio due to acoustical mismatch. |
| Contact Guided Wave (GW) testing | Up to 5 MHz operating frequency, the ability for faster inspection than air-coupled, superior coupling over immersion, and air-coupled methods hence higher transmissibility. | Wear of transducers and the material due to contact. Requires a special setup for angle excitation. |
| Air coupled excitation and contact reception Guided Wave (GW) testing | Possibility of mode selection, directional wavefront, long-range inspection. | Lower the signal to noise ratio. |
Table 2.
Material properties for aluminium adherend and epoxy adhesive.
| Material | Material Properties | ||
|---|---|---|---|
| Young’s Module GPa | Density kg.m−3 | Poisson Ratio - | |
| Aluminium 2024 T3 | 73.1 | 2780 | 0.33 |
| Epoxy | 4.27 | 1214 | 0.37 |
Table 3.
The measured defect dimensions and relative errors for different ultrasonic NDT techniques over five debonding defects.
Table 3.
The measured defect dimensions and relative errors for different ultrasonic NDT techniques over five debonding defects.
| NDT Technique | Value | Defect #1 | Defect #2 | Defect #3 | Defect #4 | Defect #5 |
|---|---|---|---|---|---|---|
| Immersion Through-Transmission | Size, mm | 12.48 | 12.61 | 13.28 | 13.35 | 13.00 |
| Error, mm | 0.22 | 0.09 | 0.58 | 0.65 | 0.30 | |
| Error, % | 1.70 | 0.66 | 4.60 | 5.17 | 2.38 | |
| Immersion Pulse-Echo | Size, mm | 13.83 | 12.78 | 13.04 | 14.25 | 12.89 |
| Error, mm | 1.13 | 0.08 | 0.34 | 1.55 | 0.19 | |
| Error, % | 8.92 | 0.62 | 2.65 | 12.21 | 1.46 | |
| Scanning Acoustic Microscopy (SAM) | Size, mm | 13.19 | 12.91 | 13.23 | 13.85 | 12.32 |
| Error, mm | 0.49 | 0.21 | 0.53 | 1.15 | 0.38 | |
| Error, % | 3.93 | 1.69 | 4.24 | 9.05 | 2.95 | |
| Air-Coupled Through-Transmission | Size, mm | - | - | 13.18 | 16.03 | 15.29 |
| Error, mm | - | - | 0.48 | 3.33 | 2.59 | |
| Error, % | - | - | 3.78 | 26.19 | 20.36 | |
| Guided Waves Air-Coupled to Contact | Size, mm | - | 16.98 | 21.46 | 14.86 | - |
| Error, mm | - | 4.28 | 8.26 | 2.16 | - | |
| Error, % | - | 33.70 | 69.01 | 17.00 | - | |
| Guided Waves Contact-to-Contact | Size, mm | - | 4.82 | 12.65 | 15.48 | 9.61 |
| Error, mm | - | 7.88 | 0.05 | 2.78 | 3.09 | |
| Error, % | - | 62.03 | 0.39 | 21.95 | 24.32 |
© 2020 by the authors. Licensee MDPI, Basel, Switzerland. This article is an open access article distributed under the terms and conditions of the Creative Commons Attribution (CC BY) license (http://creativecommons.org/licenses/by/4.0/).
Share and Cite
MDPI and ACS Style
Yilmaz, B.; Asokkumar, A.; Jasiūnienė, E.; Kažys, R.J. Air-Coupled, Contact, and Immersion Ultrasonic Non-Destructive Testing: Comparison for Bonding Quality Evaluation. Appl. Sci. 2020, 10, 6757. https://doi.org/10.3390/app10196757
AMA Style
Yilmaz B, Asokkumar A, Jasiūnienė E, Kažys RJ. Air-Coupled, Contact, and Immersion Ultrasonic Non-Destructive Testing: Comparison for Bonding Quality Evaluation. Applied Sciences. 2020; 10(19):6757. https://doi.org/10.3390/app10196757
Chicago/Turabian StyleYilmaz, Bengisu, Aadhik Asokkumar, Elena Jasiūnienė, and Rymantas Jonas Kažys. 2020. "Air-Coupled, Contact, and Immersion Ultrasonic Non-Destructive Testing: Comparison for Bonding Quality Evaluation" Applied Sciences 10, no. 19: 6757. https://doi.org/10.3390/app10196757
Note that from the first issue of 2016, this journal uses article numbers instead of page numbers. See further details here.