Surface Electromyography-Based Action Recognition and Manipulator Control


1
School of Instrumentation Science and Engineering, Harbin Institute of Technology, Harbin 150001, China
2
Department of Electrical and Computer Engineering, Florida International University, Miami, FL 33199, USA
*
Author to whom correspondence should be addressed.
Appl. Sci. 2020, 10(17), 5823; https://doi.org/10.3390/app10175823
Submission received: 15 July 2020
/
Revised: 7 August 2020
/
Accepted: 19 August 2020
/
Published: 22 August 2020
(This article belongs to the Section Applied Biosciences and Bioengineering)
Abstract
:Featured Application
This paper studies the surface Electromyography-based action recognition and manipulator control. Our work comprehensively considers the recognition accuracy and real-time performance of gesture classification, which can make the lives of disabled people better and provide new ideas for the improvement of existing market products.
Abstract
To improve the quality of lives of disabled people, the application of intelligent prosthesis was presented and investigated. In particular, surface Electromyography (sEMG) signals succeeded in controlling the manipulator in human–machine interface, due to the fact that EMG activity belongs to one of the most widely utilized biosignals and can reflect the straightforward motion intention of humans. However, the accuracy of real-time action recognition is usually low and there is usually obvious delay in a controlling manipulator, as a result of which the task of tracking human movement precisely, cannot be guaranteed. Therefore, this study proposes a method of action recognition and manipulator control. We built a multifunctional sEMG detection and action recognition system that integrated all discrete components. A biopotential measurement analog-to-digital converter with a high signal–noise rate (SNR) was chosen to ensure the high quality of the acquired sEMG signals. The acquired data were divided into sliding windows for processing in a shorter time. Mean Absolute Value (MAV), Waveform Length (WL), and Root Mean Square (RMS) were finally extracted and we found that compared to the Genetic-Algorithm-based Support Vector Machine (GA–SVM), the back propagation (BP) neural network performed better in joint action classification. The results showed that the average accuracy of judging the 5 actions (fist clenching, hand opening, wrist flexion, wrist extension, and calling me) was up to 93.2% and the response time was within 200 ms, which achieved a simultaneous control of the manipulator. Our work took into account the action recognition accuracy and real-time performance, and realized the sEMG-based manipulator control eventually, which made it easier for people with arm disabilities to communicate better with the outside world.

1. Introduction
Disabled people account for a large population nowadays and there are different types of disability among them. Physical disability is common and brings serious inconvenience, both physically and mentally. Those with hand or arm amputation are mostly affected. In order to ameliorate their daily lives, some traditional prosthesis like the manipulator, not only makes up for the lack of appearance, but also helps them do some basic daily actions [1]. However, it cannot be controlled and cannot act like a real limb. In recent years, the emergence of intelligent prosthetic limb solved this difficulty and makes it possible for disabled people to control it more easily and enables it to act like a real limb. How to make the manipulator work as flexibly as a real hand is now a key point [2].
The motor axons and their branches in the human cerebral cortex generate raw control signals and transmit them to the motor endplate. Electromyography (EMG) signals are formed here and stimulate muscle fibers to produce actions. EMG signals contain a number of information related to actions, and features need be extracted and input into the classifier for action recognition. The manipulators controlled by EMG signals are usually designed according to the fingers and palms of the human hand and have several degrees of freedom (DOFs). The actions of manipulators are based on control commands corresponding to the labels of the classifiers [3,4]. Fang [5] put forward a feature, termed as a magnitude-angle (MA) feature, to indicate the most active muscle groups, while subjects preformed hand motions. Then, the team proposed the concept of classifier feedback to allow patients to learn to generate repeatable sEMG pattern. Especially when a visual trajectory feedback (VTF) training strategy was applied, the averaged hand motion classification accuracy using linear discriminant analysis (LDA) across 10 sessions and 6 subjects was 80.4 ± 6.0%. Nazarpour and Sharafat [6] extracted high-order statistics of the arm’s EMG signals and realized the classification of 4 motions with an accuracy of 91%, through a cluster analysis classifier. Wang et al. [7] acquired 8-channel EMG signals through an MYO bracelet, extracted 5 kinds of features, and judged 4 finger motions through a back propagation (BP) neural network, with an accuracy of 90.35%. Lao et al. [8] acquired four-channel sEMG signals on the human forearm, reduced the dimensions, and classified 8 actions through LDA. The accuracy reached 98.12%. Zhao et al. [9] acquired four-channel EMG signals, adopted sliding full-cycle filtering, and utilized dynamic fuzzy neural networks to classify actions, obtaining an accuracy of up to 96.7%. Ma et al. [10] extracted the root-mean-square (RMS) and fourth-order autoregressive (AR) model coefficients, and used LDA to classify 6 gestures. The accuracy rates of 4 channels and 8 channels were 90% and 96%, respectively. Yu et al. [11] made a wearable EMG acquisition device with an accuracy of 98.55%, for recognizing 4 motions. Yang [12] presented a novel subclass discriminant analysis (SDA) algorithm and a principal component analysis (PCA) strategy for the prediction of simultaneous wrist rotation and finger gestures. The group demonstrated that a wrist tracking precision (coefficient of determination) of 0.954 ± 0.012 and a finger gesture classification accuracy of 96.5 ± 1.7% could be simultaneously achieved. Zhou [13] proposed a closed loop Functional Electrical Stimulation (FES) system, using sEMG bias feedback from the bilateral arms for enhancing upper limb stroke rehabilitation. The RMS value was taken as a measure of the power of sEMG signals, which is related to constant force and non-fatiguing contraction. Zhang [14] proposed a spatial-temporal features-based gesture recognition method (STF-GR) and conducted experiments on 3 datasets. Experimental evaluations with within-subject tests showed that STF-GR exceeded the performance of other state-of-the-art methods, including deep learning algorithms that were not focused on spatial-temporal features and traditional machine learning algorithms that used handcrafted features. Shen [15] built a new motion recognition model based on deep learning to improve the accuracy of motion recognition of sEMG signals. The model used an architecture that included 6 convolutional layers and 6 pooling layers. The results showed that an accuracy of about 90% could be achieved when using sEMG signal data from every single subject or all subjects. Banerjee [16] analyzed HD-sEMG signals recorded from 32 channels during Sit to Stand (STS) test for the functional assessment of body muscles. Five primary characteristic features, iEMG, ARV, RMS, Skewness, and Kurtosis, were employed for the study. A channel clustering approach was proposed based on the parameters using Non Negative Matrix Factorization (NMF). The NMF-based clustering of the HD-sEMG channels seemed to be sensitive toward modifications of the muscle activation strategy with ageing during the STS test. Kim [17] designed a multi-channel EMG module and developed an algorithm for classifying different types of hand postures, using the artificial neural network (ANN). The classification accuracy was evaluated for 10 normal volunteers. The results revealed an optimized accuracy of 97.49 ± 3.87%, after using a high independence feature group (HIFG). Meattini [18] presented an HRI system based on 8 fully differential EMG sensors connected to a wearable sensor node for acquisition and processing. The results of the test performed on 4 able-bodied subjects showed success rates greater than 90%, in grasping objects that required different hand shapes and impedance regulations for the task completion.
In addition to the exact feature and classifier, the analysis of different forms of data also determined the speed of signal processing. The transient and steady-state data of raw signals could both be detected in pattern recognition. Usually, the whole EMG signals are collected and the transient data inside are detected for feature extraction and classification. However, this brings obvious disadvantages as all data are needed to be processed in each classification, resulting in a slow speed. The severe delay does not meet the expectation for real-time control. Hence, dividing the whole EMG signals into windows is presented [19]. The action classification is performed by judging the steady-state data in each window rather than processing the whole data. Action recognition is achieved with only a small length of data and the response time experiences a dramatical reduction, meanwhile. Parker et al. [20] processed transient and steady-state sEMG data and analyzed the classification effect, respectively. Subsequently, the team concluded that compared to transient data, steady-state data could lead to a higher accuracy of action classification and less delay in real-time control. Van et al. [21] applied steady-state data in sliding windows to classify actions and also obtained high classification accuracy, thus, demonstrating the effectiveness of sliding window analysis. Therefore, analyzing the steady-state data of small windows in EMG signals provides a possibility that the biosignals and manipulator could be well combined for free-style control in real time.
Although some research significantly increased the accuracy of offline action classification, there are still few studies that could achieve a high accuracy in real-time classification and control. Additionally, reducing the delay as much as possible also contributes to an increase in the synchronization of control. To address the problem, we present a multifunctional sEMG detection and action recognition system that integrates signal acquisition, signal processing, and real-time control. The purpose of our research was to comprehensively enhance the action recognition accuracy and real-time performance, helping patients with arm disabilities to make correct expressions according to their own intentions, in a shorter time, so as to realize effective communication with the outside world. To realize a high accuracy of action recognition, we extracted time-domain, frequency-domain, and wavelet features to see which could best reflect specific action information. After determining the optimal features, we then compared different classifiers to see which was able to achieve a higher classification accuracy. To reduce the delay, we adopted overlapping sliding windows and signal processing was carried out in each window. The content of this paper is as follows. Section 2 introduces the overall schematic diagram and relative theories. Section 3 describes the experimental platform and detailed operation. Section 4 lists the results of each step. Section 5 discusses the results and Section 6 concludes the full text.
2. Method and Mathematical Background
2.1. System Architecture
The acquisition electrodes were attached to the forearm of the subject. After being collected, 4-channel sEMG signals were simply amplified by the integrated programmable gain amplifier (PGA) in the acquisition instrument, and transmitted to the host computer through wireless local area network (LAN). After preprocessing, noise was got rid of to further raise the signal–noise rate (SNR) and the signals were divided into overlapping sliding windows. Then, features were extracted and later the classifier learned the eigenvalues of different actions and carried out the classification. Finally, the classifier output the label and the corresponding control command was transmitted to the manipulator to realize the control. The manipulator was kept under observation to see whether it followed the movement of subjects consistently and synchronously, which provided a feedback. Figure 1 illustrates the schematic diagram of the sEMG detection and the action recognition system.
2.2. Data Preprocessing
The baseline wander was removed through a median filter with length . The 50 Hz power frequency interference was got rid of by a Butterworth notch, whose frequency bandwidth was 49–51 Hz, with a pass-band rippledB and a stop-band attenuation dB. The acquisition circuit contained wireless communication, so it would inevitably bring a high frequency interference from surroundings. We made use of a 256th order Chebyshev filter, to filter out the high frequency interference. The bandwidth was 10–300 Hz. All filters were implemented through software (Qt Creator).
There is a demand to increase processing speed and decrease delays. Additionally, due to the fact that the forearm of the subject is not always straight, the system must be able to distinguish the start and end of the action. In this study, the overlapping sliding window was adopted and the data were divided into multiple windows. In this way, only the sEMG signals in a small window needed to be analyzed each time to judge whether an action happened. Compared with other characteristics like the frequency-domain feature, the amplitude of the EMG signals was more related to the corresponding action. When the subject made an action, the change of amplitude of the EMG signals was more obvious and easier to be captured intuitively. As a result, Mean Absolute Value (MAV) of a window was calculated and represented as energy Q. If Q was greater than a set threshold A more than N times, it was considered that an action had started. When Q was less than A, it was believed that this action ended. In accordance with references and multiple experiments, we set the window size to 128 ms, the sliding step to 50 ms, and the threshold A to 1.5 times the Q of the resting state. After dividing the window, A was calculated and saved for judging the start and the end of the action.
2.3. Feature Extraction
Features that are widely used usually include the time-domain feature, frequency-domain feature, and the parameter model [22,23,24]. We selected some typical features and ascertained which had the greatest distinction among different actions.
2.3.1. Time-Domain Feature
Although the sEMG signals belong to non-stationary, random, one-dimensional bioelectrical signals, they can be processed as stationary random signals in a short time. We chose MAV, Zero Crossing (ZC), Waveform Length (WL), and RMS for processing sEMG signals [25,26,27,28]. Assume is a single-channel sEMG sequence. N is the number of data and denotes the ith element. The equations were as follows.
(i) MAV:
The MAV was proportional to the intensity of muscle movements.
(ii) ZC:
where sgn(·) is sign function.
The number of times the signal changed from positive to negative amplitude and from negative to positive amplitude was called ZC. The human cerebral cortex generates the control signal first. Then the control signal is transmitted to the motor endplate, through the motor neuron via the axon, and its branches and the EMG signal is formed. Later the muscle fiber is stimulated to produce action, and the intensity of the action is closely related to the frequency of the conduction signal. Therefore, ZC reflects the frequency domain information, which is closely related to the intensity of the action.
(iii) WL:
The WL also contains some key characteristics, such as the duration, amplitude, and frequency of the signal.
(iv) RMS:
The RMS is on behalf of the average power of the signal.
2.3.2. Frequency-Domain Feature
It was found that time-domain signals tend to be affected by time. As long as there is movement of muscle during the acquisition, the features change with it, and bring apparent non-stationary characteristics to some extent. In this case, the Fast Fourier transform (FFT) was put into use to convert the time-domain sequence to the power spectrum. Thence, the influence brought by time and quick motion could be reduced and the stability is enhanced [29].
In practicality, the power spectrum of infinite length is estimated as follows. Assuming that the EMG signals are short-term stationary and can reflect time-varying characteristics, median frequency (MF) and the mean power frequency (MPF) are as below: [30].
(i) MF:
(ii) MPF:
in which PSD(f) is the power spectral density of the EMG signals.
2.3.3. Wavelet Feature
Wavelet theory also plays an important role in signal processing and performs well, both in one-dimensional data processing and two-dimensional image processing [31,32,33,34]. Since EMG signals are physiologically non-stationary in nature, it is found that when the Coiflet 4 wavelet is used to analyze EMG signals, the wavelet coefficients can well reflect the characteristics of EMG signals [35]. In this case, we used the Coiflet 4 wavelet to decompose the signal after noise removal, according to Equation (7), and then took the vector composed of the coefficient with the largest absolute value in each layer of decomposition as the feature. For single-channel sEMG sequence , the wavelet coefficients of each scale could be obtained by the Mattlat algorithm.
where is the layer of decomposition, and are low-pass and high-pass decomposition filters for signal decomposition, are the low-frequency and high-frequency component coefficients of the th layer.
2.4. Feature Selection
Feature extraction was performed in each window, and each feature of each channel was saved as a row vector of eigenvalue matrix. For the purpose of improving the classification effect and verifying the feasibility, only features of five representative actions were extracted for comparison. In the eigenvalue matrix, the number of rows was equal to the kind of features, times that of channels. Finally, the eigenvalue matrix was input to the classifier for training and evaluation.
The time-domain and frequency-domain features had a more intuitive spatial distribution characteristic. For the sake of selecting the features with a higher classification accuracy, we took advantage of all 6 features in the time domain and frequency domain, at first, and saw their spatial distribution and action recognition accuracy, respectively. We extracted 6-scale wavelet coefficients, and used the maximum value of the coefficients at each scale, as the feature vector of the EMG signals. A three-layer back propagation (BP) neural network was chosen for classification on each feature separately, and the following equation evaluated the performance of action recognition.
where and are the number of correctly predicted and total number of actions. is considered to be the accuracy of action classification. For each feature, we did action classification times. is the number of actions predicted correctly, i.e., the number of predicted labels that are consistent with their original classes. Each single feature was extracted from the same sample, so the accuracy of action recognition could be directly compared. In fact, the classification accuracy of a single feature was usually low to some extent, so we later combined some features with higher accuracy to further better the classification effect.
2.5. Selection of Classifier
After combining the features for joint classification, we made the comparison between BP neural network and Genetic-Algorithm-based Support Vector Machines (GA–SVM).
2.5.1. BP Neural Network
The neural network possesses powerful physical computing skills to simulate the neural network structure and function of the creatures. The biosignals are always very complicated and bring great non-stationarity and diversity. The BP neural network has an excellent classification effect on non-stationary signals, and can be used to classify the action by surface EMG signals. BP neural network is the most popular in artificial neural network and is widely applied for the classification of diverse data.
The BP neural network is a multilayer network composed of the input layer, at least 1 hidden layer, and an output layer. This multilayer network, and the weights and thresholds of each layer form a complete feedforward neural network. The error is transferred forward from the output layer to the input layer, through the hidden layer. Contrary to error, the input transfers from the input layer to the output layer through the hidden layer. During the transfer, the value of the neurons in each layer only directly affects that in the next layer, while the other layers are not affected. After being transmitted to the output layer, the result is compared with the expectation. If the error exceeds the preset, the error is transmitted forward. In the meantime, the weights and thresholds of each layer are constantly modified. The network training does not stop until the error is reduced below the preset [36,37].
We selected a 3-layer BP neural network. is the weight between the input layer and the hidden layer, and is the weight between the hidden layer and the output layer. The number of input nodes is , the number of hidden layer nodes is , and that of the output nodes is . The process can be simply regarded as a function mapping. and are the exact thresholds of theth node of the hidden layer and the th node of the output layer separately.
When doing the classification, we first need to train the eigenvalues extracted from the sEMG signals. When the training is completed, we can test the samples and predict whether these samples can meet the expectation. The whole process can be divided into 7 steps:
(i) Neural network initialization. The number is equal to the number of rows of eigenvalue matrix. The number is the number of actions to be classified, and then the number of nodes in the hidden layer is needed to be calculated. It is also necessary to initialize the , , , and . Then the learning rate, training times, transfer function, training error, etc. are gained.
(ii) Calculate the output of the hidden layer. Here, X is the eigenvalue sequence extracted from the EMG signals, so the output His:
where f(·) is the excitation function of the hidden layer.
(iii) Calculate the result of the output layer. The final output O is:
(iv) Calculate the prediction error between the output and the expectation:
in which is the expectation.
(v) Modify and change the weights, and according to error .
(vi) Update the thresholds and by the error .
(vii) Check whether the error meets the preset. If it meets, the training ends and the result is the output. If not, return to step (ii).
There are 12 nodes in the input layer of the BP neural network in terms of the rows of the eigenvalue matrix and 5 nodes in the output layer related to the 5 actions. When adopting the BP neural network for recognition, the number of hidden layer nodes is very crucial [38]. If the number is too large, it can improve accuracy and indeed reduce network errors, but also brings overfitting, greatly increasing the training time, and reducing the generalization. If the number is too small, the network is not able to establish a complex boundary judgment, and the fault tolerance is low. After many trainings, we noticed that when the number of hidden nodes was 9, the training speed and the recognition accuracy were highest. The 12-9-5 structure was formed ultimately.
2.5.2. Genetic-Algorithm-Based Support Vector Machine (GA–SVM)
Support Vector Machine (SVM) is specially applied to process data with limited samples, based on structural risk minimization. The penalty coefficient and kernel parameter are the key factors that affect the learning and generalization ability. The penalty coefficient acts on the ratio of empirical risk and confidence range in a given feature subspace. The kernel parameter affects the complexity of the same type of data in high-dimensional space. In parameter optimization, it is usually difficult to choose the best parameter through empirical or manual calculation, so grid division and Genetic Algorithm (GA) are commonly applied to realize the simultaneous optimization of the training parameters [39,40].
The grid division searches and compares all samples in the grid. However, if the number of grids is large, the search takes a long time. Fortunately, the GA runs much faster, as the GA searches in parallel and in a random order, which is different from the grid division. GA aims to create a population through random parameters, in light of Darwin’s theory of evolution, and the individuals in the population are encoded in the form of chromosome. First, the individuals are selected through the fitness function. The fittest survives and the unsuitable are eliminated. Second, crossover is executed, i.e., one or a part of the chromosome in two selected individuals is randomly picked to replace each other in corresponding positions. Third, mutation is carried out, namely a bit of the chromosome is changed randomly with a small probability. During the loop of the three operations, the fitness of the individual is constantly improved, until the optimal solution is found. As a result, the individuals of new population have a relatively higher fitness.
We made the choice of Radial Basis Function (RBF) with penalty coefficient as the kernel function, so that it could map the sample to a higher dimensional space and handle the samples when the class labels had a nonlinear relationship with the eigenvalues as well. The parameters (where is the penalty coefficient and is the kernel parameter) required optimizing. The parameter optimization of SVM through GA are divided into 7 steps, and the complete flow is shown in Figure 2 [41,42,43,44]:
(i) Input the training samples and preprocess the data via the normalization function and the eigenvalues of the training and test sets [0,1].
(ii) Set the range of and . Others parameters such as maximum genetic generation, total number of populations, generation gap, encoding length, crossover rate, and mutation rate are also initialized.
(iii) Encode the and in binary form. Generate the initial population and the chromosomes that randomly represent the SVM parameters.
(iv) Train the SVM model by the obtained parameters and through the use of leave-one-out cross-validation to evaluate the fitness. Then select the fitness function to calculate the fitness of the individual.
(v) Iterate to find the optimal solution. If the fitness calibration is satisfied, the loop ends, or it repeats the selection, crossover, and mutation.
(vi) Get the optimized SVM model by the best and .
(vii) Send the training set to the optimized SVM model and obtain the optimal classification surface, and then input the test set for calculating the classification accuracy.
2.6. Evaluation of Classification
The confusion matrix is an error matrix that is commonly applied in pattern recognition. It depicts the relationship between the true attributes of the sample data and the recognition result, and is a common method to evaluate the performance of the classifier. The confusion matrix is a square matrix with the size (n_classes × n_classes), where n_classes represents the number of classes. Each row of the matrix represents the instance in the true class, and each column represents the instance in the prediction class. Through the confusion matrix, it is easy to see whether the classifier confuse the multiple classes or not [45,46].
Suppose that for the classification task of -classes, the recognition data set D includes samples, each type of mode contains data (. A certain recognition algorithm is used to construct the classifier R. represents the number of the data of the sth class, judged as the tth class by the classifier R to the total number of the sth class samples, and then the × dimensional confusion matrix is gained [47]:
The row subscripts of the elements in the confusion matrix correspond to the true attributes of the class, and the column subscripts correspond to the recognition attributes generated by the classifier. Diagonal elements represent the number of each class that can be correctly identified by the classifier R, while the non-diagonal elements represent the number of incorrect judgments. In the ideal situation, the predicted category of each sample is correct, then the confusion matrix becomes a diagonal matrix. In this study, due to the fact that we chose 5 representative actions—fist clenching, hand opening, wrist flexion, wrist extension, and calling me, we finally got a confusion matrix with 5 rows and 5 columns.
3. Experiment
3.1. Design of sEMG Detection and Action Recognition System
The whole system was composed of an acquisition subsystem, a processing subsystem, and a control subsystem. Functions of signal acquisition, wireless transmission, filtering, overlapping sliding window analysis, feature extraction, action classification, and real-time control were integrated. Data and eigenvalues could be saved and analyzed offline. The acquisition subsystem consisted of signal source, our self-developed wearable and portable acquisition device, and a wireless local area network. The acquisition device involved an acquisition board and a lithium battery. The board took the USR-C322 (Texas Instruments, Dallas, TX, USA) as the core and also had the ADS1299 (Texas Instruments, Dallas, TX, USA), which was designed for simultaneous multi-channel biopotential measurements. The ADS1299 was featured with Common Mode Rejection Ratio (CMRR)−110 dB and was integrated with a 24-bit high-resolution simultaneous-sampling Analog-to-Digital Converter (ADC) and PGA. The board was connected to the PC through the User Datagram Protocol (UDP) protocol, and the real-time waveform was displayed and stored by adjusting the preset parameters. The processing subsystem included a series of signal processing steps. After receiving the collected data, the PC processed data such as median filtering, Butterworth notch, Chebyshev filter, overlapping sliding window analysis, feature extraction, and network training. The eigenvalues and training network could also be saved and used repeatedly. When the training network was ready, the new samples as well as the test set, was directly input into the network and compared with the trained data to generate a classification label of actions. The control subsystem took STM32F103C8 (STMicroelectronics, Geneva, Switzerland) as the core. Six independent steering gears were adopted to control 5 fingers and palms of the 6-DOF manipulator. The fingers of the manipulator were connected with the wrist and the steering gear. When the steering gear changed the angle, the manipulator moved. The steering gear was a position servo drive, which is suitable for those control systems that require constant angle changes and can be maintained. First, the control signal enters the signal modulation chip from the channel of the receiver to obtain the DC bias voltage. Next, there is a reference circuit inside, which generates a reference signal with a period of 20 ms and a width of 1.5 ms. Later, the obtained DC bias voltage is compared with the voltage of the potentiometer and a voltage difference is output. Finally, the positive and negative output of the voltage difference to the motor drive chip determines the positive and negative rotation of the motor. We apply the serial port and save the command corresponding to the exact action, in advance. When a label is given by a classifier, the control code sequence is sent to the manipulator, so that the manipulator can follow the command and carry out the actions. At the same time, the movement of the manipulator is observed, which provides feedback to see whether the manipulator shows synchronized and the same actions, with the subjects. The overall composition is shown in Figure 3.
3.2. Subjects and Training Session
A group of subjects (mean ± SD: 25 ± 3.9) were recruited. We comprehensively considered their ages, weights, genders, and physical health to ensure the validity of the experiment. The subjects were 19 healthy volunteers, including 11 males and 8 females. The left arm was selected for acquiring sEMG signals. Before enlisting, volunteers should have met the requirement of no muscle disease. We told them to follow the operator’s reminder to force or relax the muscles when doing the experiment in advance. Before acquisition, the subjects were first instructed to relieve stress to ensure that the muscles were not fatigued. Then, the surface of the skin was cleaned to remove excess cuticle and lower the impedance. Later, conductive adhesive was smeared on the electrode to strengthen the conductivity. Eventually, the electrodes were fixed. The electrode positions are shown in Figure 4. Nine electrodes were requested so that our device applied four-channel differential input and the elbow was opted as the reference, in the meantime. The sEMG signals were acquired from extensor pollicis longus, finger extensor muscle, and palm long extensor muscle. The elbow had less muscle and would not be affected by other muscles.
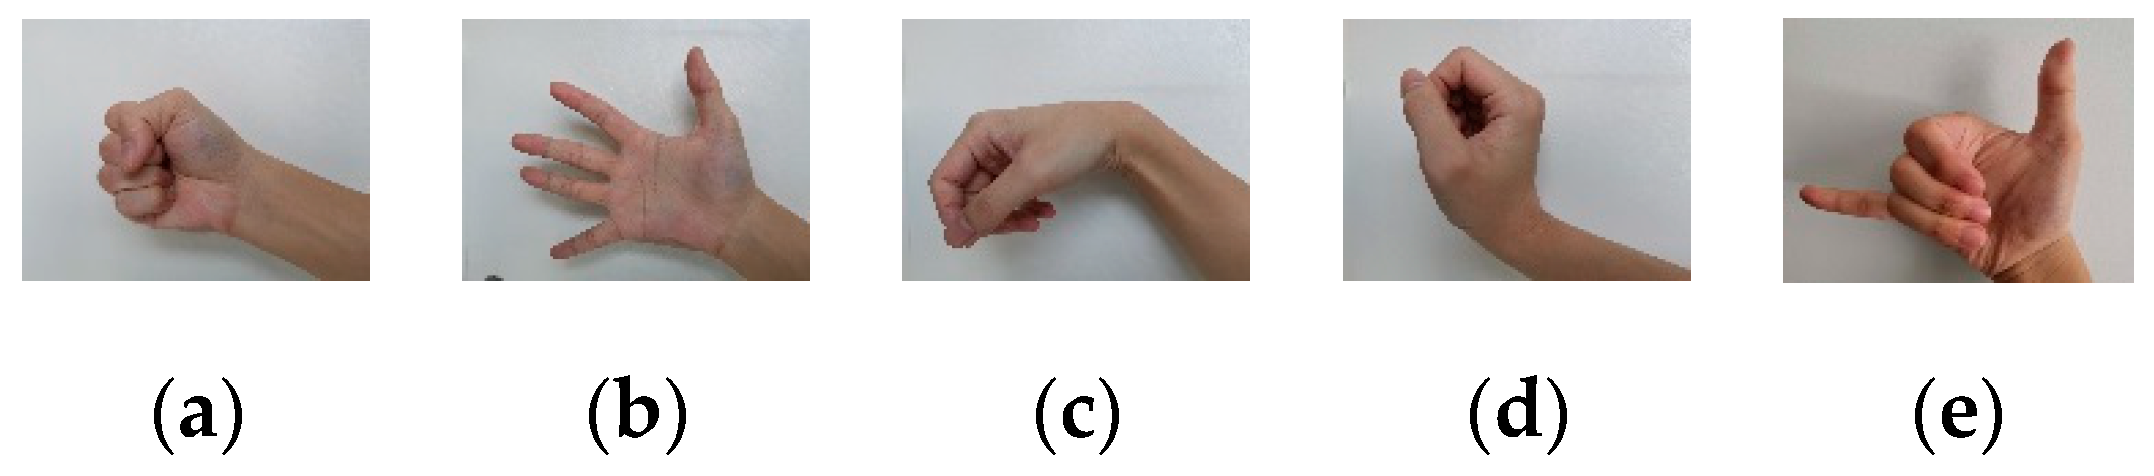
Subjects were asked to do 5 representative actions—fist clenching, hand opening, wrist flexion, wrist extension, and calling me, as demonstrated in Figure 5.
3.3. Experimental Protocol and Procedure
The experiment was conducted in a quiet office, where the temperature remained constant at 23 °C approximately, and the subjects sat in a comfortable chair. During the whole experiment, other sources of radiation were powered off in the room. We closed the doors and windows to block outside interference. The experiments were done in the morning so that people tended to be relaxed and was not tired. The experiments were done at the same time for fear of circadian factors. The subjects kept their body still and were not allowed to speak during the entire experiment. Before starting the experiment, we asked the subjects to put their arms upright on the table. When carrying out actions, only the hands did the movements and exerted force naturally, and the subjects kept the rest of the body still.
As the actions were determined via the threshold of the resting state, there was no doubt that the sEMG in the resting state needed be acquired initially. After collecting the resting-state signals for 12 s, the threshold would be obtained. Then, the subjects did the 5 actions in turn. Considering muscle fatigue might occur, subjects could have a break after each collection, and the pause and restart of acquisition could be decided by the subjects. After numerous experiments and repeated comparisons, the rest interval was determined to be 10 s. As a result, for each action, each time the subjects held the action for 12 s and then rested for 10 s. In order to eliminate the influence of muscle fatigue, there was a break for 1 min after each action. The same step was repeated 6 times in each action and the acquisition stopped after completing all 5 actions, so we collected 6 sets for each action and each set cost 12 s. The sampling rate was set to 1000 Hz, which met the Nyquist sampling theory for collecting sEMG signals, the frequency spectrum was mostly distributed within 10–150 Hz, and the rest was distributed within 0–500 Hz. The whole acquired data were divided into 1039 sliding windows. We chose samples in 50 windows as test set and the rest were a training set.
4. Results
4.1. Comparison of Features
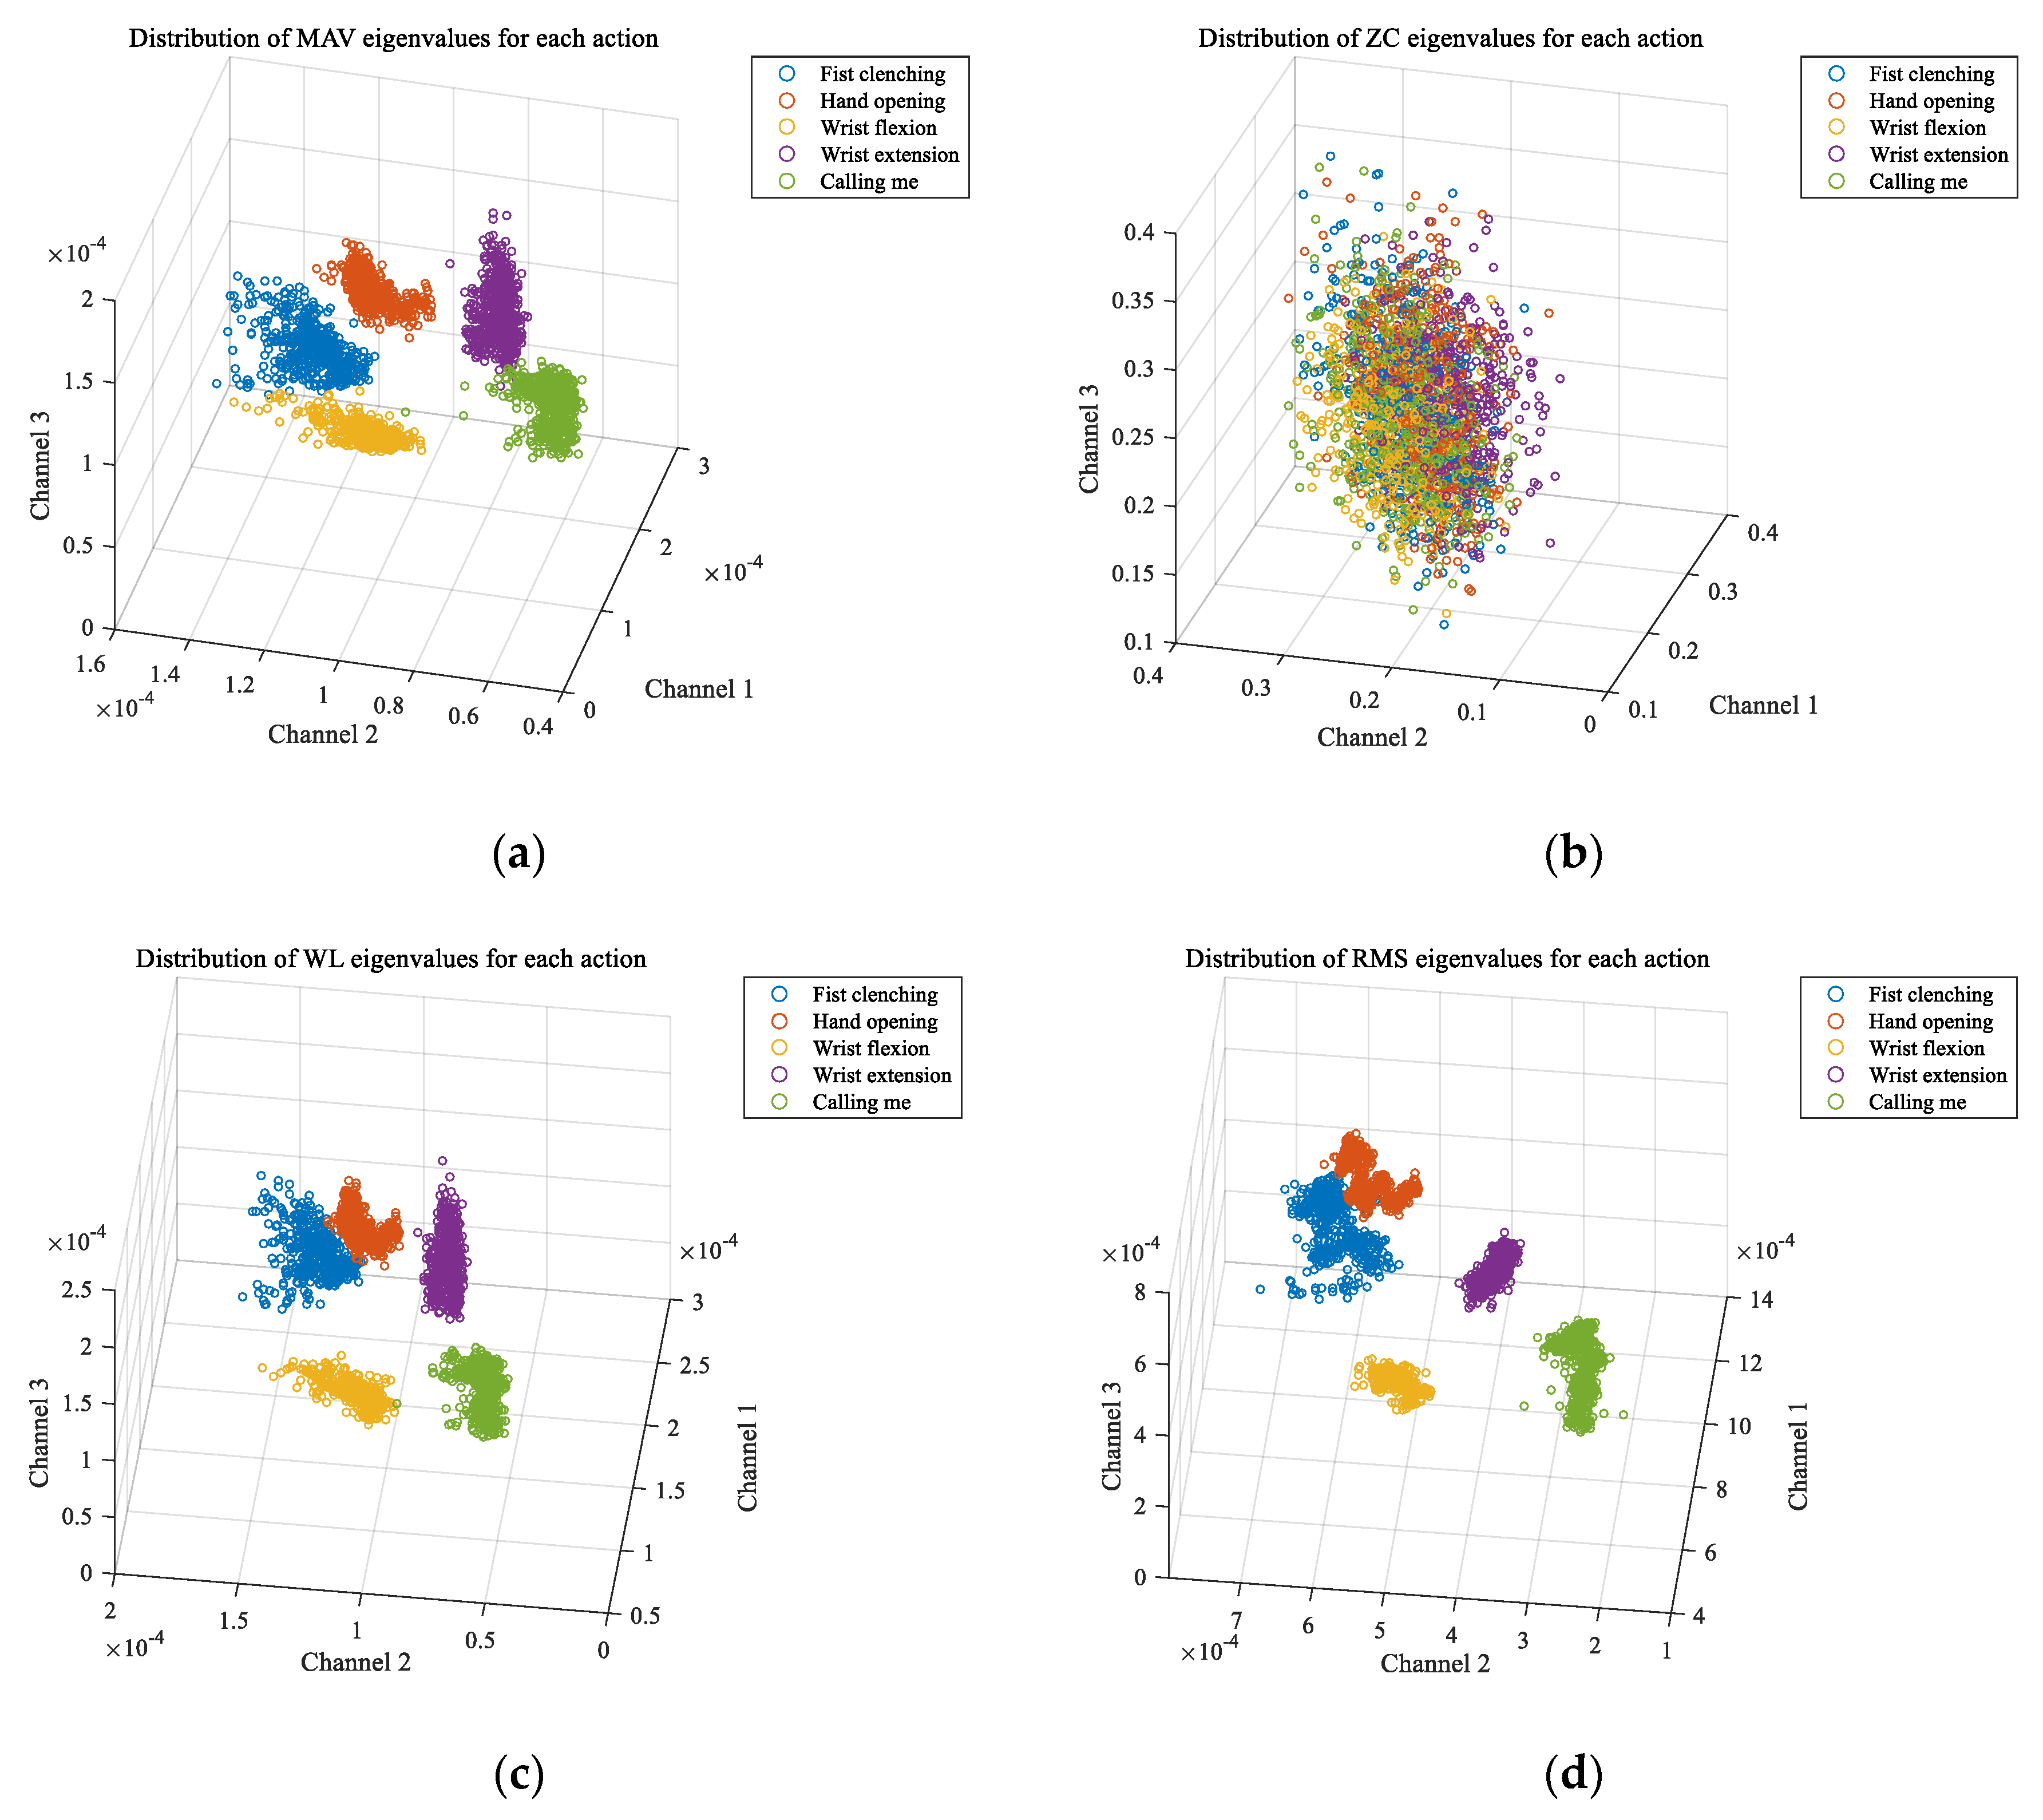
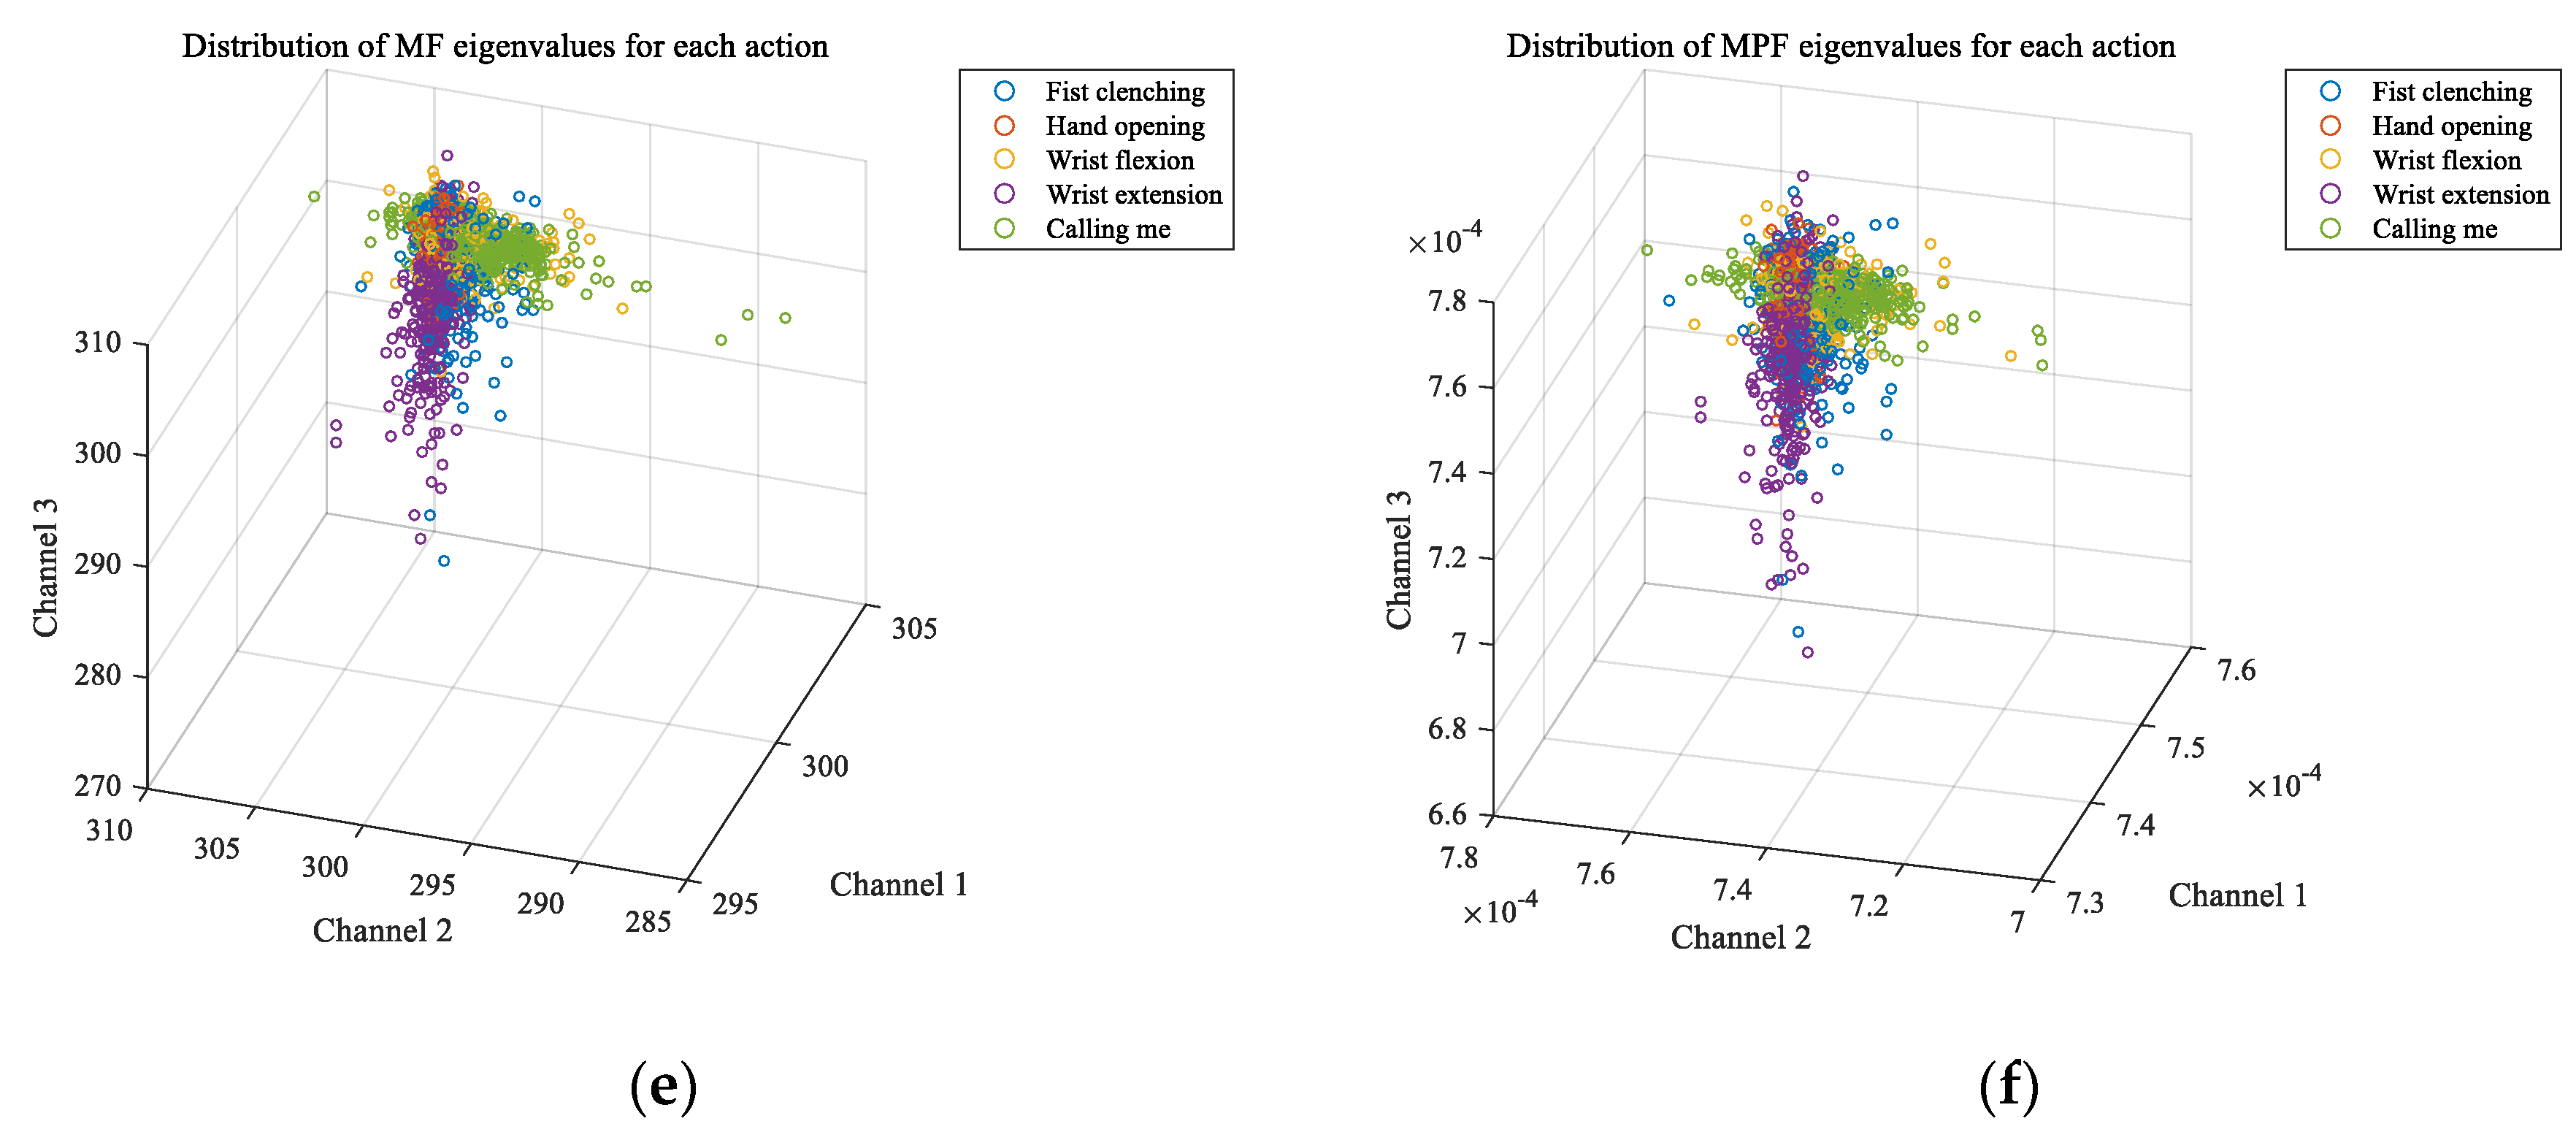
The time and frequency-domain features were extracted first and the scatter plots in three channels were drawn, respectively. Figure 6 exhibits the spatial distribution of each feature. It could be noticed that the spatial distribution of MAV, WL, and RMS was more apparent and easier to distinguish. After all features including wavelet coefficient was extracted, eigenvectors were input into the BP neural network for action recognition. Table 1 lists the classification accuracy of each action. it was clear that MAV, WL, and RMS still performed better than other features. Meanwhile, it was clear that the classification accuracy of a single feature on some actions was not so high, so MAV, WL, and RMS were combined and sent to the classifier for a subsequent three-feature-combination joint action classification.
4.2. Comparison of Online Classification
The same eigenvalue was input to the BP neural network and GA–SVM. The comparison between the BP neural network and the GA–SVM is manifested in Table 2. The confusion matrix evaluation of the BP neural network and the GA–SVM is displayed in Table 3 and Table 4, which makes it more intuitive to see the number of samples correctly classified and misjudged.
4.3. Performance of Real-Time Control
The overlapping sliding window and the synchronous command transmission were conducive to shorten the running time. We set the baud rate of the serial port to 115,200. The specific correspondence between the labels and the control commands ensured consistency. When the classifier outputs the label of resting state, a corresponding resting-state command was also sent to the manipulator to keep it still. After network training, the action of the manipulator could be controlled synchronously. For instance, when the subject did not make any movement and remained at a resting state, the manipulator also kept still. When the subject did fist clenching, so did the manipulator. When the subject’s movement was hand opening, the manipulator also opened its fingers to follow the action. The synchronization speed was fast, without excessive delay. After calculation, it was noticeable that the entire process took less than 200 ms from the sEMG signal acquisition to the manipulator’s response. The manipulator was able to track the actions of the subject consistently.
5. Discussion
From Figure 6 and Table 1, the effectiveness of the single feature to the action classification could be judged preliminary. The time-domain features and frequency-domains feature had more intuitive spatial distribution characteristics so that the contribution to action recognition could be evaluated with the naked eye. In the position distribution of MAV, WL, and RMS, we could see that the points of 5 actions was scattered comparatively. The points representing any 2 actions were independent. The space was large and there was very little overlap. Nevertheless, in the distribution of ZC, MF, and MPF, almost all points representing all 5 actions were mixed together, and it was almost impossible to distinguish each other. Table 1 further confirmed the effectiveness of all features. The classification rate of MAV was the best among all features—the average accuracy rate was 90.0%. Comparing the 5 actions to be recognized, the accuracy of fist clenching could reach to 100%, which really realized the ideal classification. The WL and RMS could also achieve high accuracy in general. By contrast, the ZC, MF, and MPF contributed less to action classification. Although the wavelet coefficient contributed an accuracy of 71.6%, its classification accuracy was still not as high as that of MAV, WL, and RMS. Considering the effectiveness of the features and the calculation amount, we finally chose MAV, WL, and RMS to do the joint action classification afterwards.
From Table 2, the accuracy of different classifiers based on the same features was obvious. By using the BP neural network, it was clear that the recognition accuracy of fist clenching could reach 100%, and that of hand opening, wrist flexion, and wrist extension exceeded 90%. The average accuracy achieved up to 93.2%. With regards to the GA–SVM, the accuracy of fist clenching could still reach 100%, and that of wrist flexion and wrist extension achieved 90% or more, as well. However, the accuracy of hand opening and calling me as well as the overall average accuracy was lower.
The confusion matrices further quantified the classification performance. From Table 3 and Table 4, not only can we know the classification rate of each action, but we can also we observe the misjudgments in the confusion matrices. Some actions have a higher accuracy while others have a relatively lower accuracy. For instance, the accuracy of calling me was always lower than the other 4 typical actions. When doing the action of calling me, the amplitude and intensity of the muscle movement was lower than other common movements, so it was possible that the acquired signals was difficult to analyze and the features were not so apparent. Additionally, calling me tended to be judged to wrist flexion. It was possible that when doing the action of calling me, the activated muscle area overlapped with the wrist flexion, and the sEMG signals also had similarities, leading to misjudgment.
Compared to GA–SVM, the overall classification rate of the BP neural network exceeded 10.2% and the number of misjudgments was relatively smaller. When it came to the exact action, the classification accuracy of the BP neural network exceeded that of the GA–SVM generally. In contrast, we concluded that the BP neural network performed better in action recognition.
Our research comprehensively considered a series of factors, first of which was to ensure action recognition accuracy, while improving the response time. First of all, compared to some research [48,49,50,51,52] that aim at improving accuracy only by using a large number of features or algorithms with high complexity, we utilized as few features as possible to ensure the action recognition rate. This reduced the amount of calculation and did not exert a high computational complexity. In addition to accuracy, the response time of the entire system needed be considered in real-time control. Based on foundation in biological research, humans feel noticeable delay when it exceeds 300 ms [53]. On one hand, owing to the fewer calculations, signal processing could be finished in a shorter time. On the other hand, we adopted overlapping sliding windows to do the real-time signal processing, which greatly decreased the waiting time of the system. We can do signal processing while collecting EMG data. Our whole process cost less than 200 ms, which fully meets the requirement. As a result, the manipulator quickly generates actions, and almost synchronously tracks the hands of the subjects, confirming the validity and rationality.
Additionally, compared to some experiments that need to train the subjects for a long time [54], we did not need to spend much time training the subjects to make them familiar with our experiment and build a stable training network. After being told the essential information of the experiment, a new subject could directly join the experiment and try to control the manipulator, based on previous trained networks. Additionally, we acquired only 4 channels of EMG signals instead of complex acquisition like high density EMG [55], so our acquisition equipment was portable and wearable, which ensured that the subject could freely carry out actions and was conducive to the development of related products.
6. Conclusions
In order to improve functioning of disabled groups, especially that with hand amputations, we tried to control a manipulator through sEMG signals from the forearm, in real time, letting patients communicate and express like normal people as much as possible. In this study, we designed a complete multifunctional sEMG detection and action recognition system. We independently developed a portable and wearable acquisition device. The device could acquire high SNR EMG signals and was beneficial to extract effective features. We eventually chose MAV, WL, and RMS to realize signal detection. In comparison with the GA–SVM, the BP neural network performed better in a three-feature-combination joint action classification. The average accuracy was 92.8%, and the accuracy among some typical actions like fist clenching could rise to 100%. In addition, we realized the real-time control through overlapping sliding window analysis and synchronous command transmission. Moreover, the system integrated subsystems and enriched functions. Additionally, the basic real-time signal processing, data, eigenvalues, and trained network could also be saved for offline analysis.
With regards to a comprehensive running speed and accuracy, we finally opted some most representative time-domain features, and utilized patch electrodes in order to better match our acquisition instrument.
Since we used disposable patch electrodes, the position of each collection could not be guaranteed to be completely consistent, which might cause signal differences to some extent. In addition, the disposable electrode needs to be replaced every time an experiment is performed, which is troublesome. Our future work is to detect more features like entropy and complexity that belong to a non-linear characteristic, to better achieve action recognition accuracy. The parameter model was also made use of. Maybe the evoked potentials EMG needs to be separated from spontaneous EMG signal for independent analysis so as to further improve action recognition accuracy. There is also a common problem, which is individual differences. For example, some people with strong muscles might not have obvious signal characteristics, which exerts drawbacks in judging the intension of motion. To solve this, it is possible that features of other physiological information can be extracted as an auxiliary analysis. Bracelet electrodes can also be designed and applied in signal acquisition, which guarantees the same acquisition position each time and simplifies the operation, improving the consistency of the experimental conditions.
Author Contributions
T.C. wrote this paper; D.L. carried out the experiments and did the formal analysis; Q.W. debugged the software and analyzed the data; O.B. suggested the methodology; J.S. supervised the entire project. All authors reviewed the manuscript. All authors have read and agreed to the published version of the manuscript.
Funding
This work was sponsored by National Natural Science Foundation of China (Grant No. 61301012, No. 61471140), and Sci-tech Innovation Foundation of Harbin (No. 2016RALGJ001).
Conflicts of Interest
The authors declare no conflict of interest.
Abbreviations
The following abbreviations are used in this manuscript:
| sEMG | surface Electromyography |
| SNR | signal-noise rate |
| DOF | degrees of freedom |
| LAN | Local Area Network |
| MAV | Mean Absolute Value |
| WL | Waveform Length |
| RMS | Root Mean Square |
| PSD | Power Spectrum Density |
| ZC | Zero Crossing |
| MF | Median Frequency |
| MPF | Mean Power Frequency |
| BP | back propagation |
| RBF | Radial Basis Function |
| GA | Genetic Algorithm |
| SVM | Support Vector Machine |
| PGA | programmable gain amplifier |
| UDP | User Datagram Protocol |
References
- Salih, S.I.; Oleiwi, J.K.; Ali, H.M. Study the Mechanical Properties of Polymeric Blends (SR/PMMA) Using for Maxillofacial Prosthesis Application. IOP Conf. Ser. Mater. Sci. Eng. 2018, 454. [Google Scholar] [CrossRef]
- Han, Y.; Liu, F.; Dowd, G.; Zhe, J. A thermal management device for a lower-limb prosthesis. Appl. Therm. Eng. 2015, 82, 246–252. [Google Scholar] [CrossRef]
- Wu, J.; Yu, G.; Gao, Y.; Wang, L. Mechatronics modeling and vibration analysis of a 2-DOF parallel manipulator in a 5-DOF hybrid machine tool. Mech. Mach. Theory 2018, 121, 430–445. [Google Scholar] [CrossRef]
- Truong, H.V.A.; Tran, D.T.; Ahn, K.K. A Neural Network Based Sliding Mode Control for Tracking Performance with Parameters Variation of a 3-DOF Manipulator. Appl. Sci. 2019, 9, 2023. [Google Scholar] [CrossRef] [Green Version]
- Fang, Y. Interacting with Prosthetic Hands via Electromyography Signals. Ph.D. Dissertation, University of Portsmouth, Portsmouth, UK, July 2015. [Google Scholar]
- Nazarpour, K.; Sharafat, A.R.; Firoozabadi, S.M.P. Surface EMG Signal Classification Using a Selective Mix of Higher Order Statistics. In Proceedings of the 2005 IEEE Engineering in Medicine and Biology 27th Annual Conference, Shanghai, China, 17–18 January 2006; pp. 4208–4211. [Google Scholar] [CrossRef]
- Wang, J. Four Finger Movements Elbow sEMG Pattern Recognition Algorithm. Master’s Thesis, Kunming University of Science and Technology, Kunming, China, March 2017. [Google Scholar]
- Lao, K. Design and Myoelectrical Control of Anthropomorphic Prosthetic Hand. Master’s Thesis, South China University of Technology, Guangzhou, China, April 2016. [Google Scholar]
- Zhao, H. Research on Hand Grasping Movement of sEMG Signals for Artifical Limb. Ph.D. Dissertation, Harbin University of Science and Technology, Harbin, China, June 2016. [Google Scholar]
- Ma, Z.; Qiao, Y.; Li, L.; Rong, H. Classification of surface EMG signals based on LDA. Comput. Eng. Sci. 2009, 38, 2321–2327. [Google Scholar]
- Yu, B. Wearable Human Activity Recognition System Based on sEMG Signal. Master’s Thesis, Zhejiang University, Hangzhou, China, March 2018. [Google Scholar]
- Yang, X.; Yan, J.; Fang, Y.; Zhou, D.; Liu, H. Simultaneous Prediction of Wrist/Hand Motion via Wearable Ultrasound Sensing. IEEE Trans. Neural Syst. Rehabil. Eng. 2020, 28, 970–977. [Google Scholar] [CrossRef] [PubMed] [Green Version]
- Zhou, Y.; Fang, Y.; Gui, K.; Li, K.; Zhang, D.; Liu, H. sEMG Bias-Driven Functional Electrical Stimulation System for Upper-Limb Stroke Rehabilitation. IEEE Sens. J. 2018, 18, 6812–6821. [Google Scholar] [CrossRef] [Green Version]
- Zhang, Y.; Chen, Y.; Yu, H.; Yang, X.; Lu, W. Learning Effective Spatial-Temporal Features for sEMG Armband based Gesture Recognition. IEEE Internet Things J. 2020, 1–14. [Google Scholar] [CrossRef]
- Shen, S.; Gu, K.; Chen, X.; Wang, R. Motion Classification Based on sEMG Signals Using Deep Learning. In Machine Learning and Intelligent Communications, Proceedings of the International Conference on Machine Learning and Intelligent Communications (MLICOM 2019), Nanjing, China, 24–25 August 2019; Springer: Cham, Switzerland, 2019; pp. 563–572. [Google Scholar] [CrossRef]
- Banerjee, S.; Boudaoud, S.; Kinugawa, B.K. How young is your Muscle? A Machine Learning framework for motor functional assessment with ageing by NMF based analysis of HD-sEMG signal. J. Comput. Med. Biol. 2020, in press. [Google Scholar] [CrossRef] [Green Version]
- Kim, S.; Kim, J.; Koo, B.; Kim, T.; Jung, H.; Park, S.; Kim, S.; Kim, Y. Development of an Armband EMG Module and a Pattern Recognition Algorithm for the 5-Finger Myoelectric Hand Prosthesis. Int. J. Precis. Eng. Manuf. 2019, 20, 1997–2006. [Google Scholar] [CrossRef]
- Meattini, R.; Benatti, S.; Scarcia, U.; De Gregorio, D.; Benini, L.; Melchiorri, C. An sEMG-Based Human–Robot Interface for Robotic Hands Using Machine Learning and Synergies. IEEE Trans. Compon. Packag. Manuf. Technol. 2018, 8, 1149–1158. [Google Scholar] [CrossRef]
- Nazmi, N.; Abdul Rahman, M.A.; Yamamoto, S.-I.; Ahmad, S.A.; Malarvili, M.; Mazlan, S.A.; Zamzuri, H. Assessment on Stationarity of EMG Signals with Different Windows Size During Isotonic Contractions. Appl. Sci. 2017, 7, 1050. [Google Scholar] [CrossRef] [Green Version]
- Oskoei, M.A.; Hu, H. Support Vector Machine-Based Classification Scheme for Myoelectric Control Applied to Upper Limb. IEEE Trans. Biomed. Eng. 2008, 55, 1956–1965. [Google Scholar] [CrossRef] [PubMed]
- Zhang, D. Research of EMG-based Control Methods for Bionic Mechanical Hand. Master’s Thesis, Shenyang Ligong University, Shenyang, China, December 2013. [Google Scholar]
- Udhan, T.; Bernadin, S. Optimal time-and frequency-domain feature characterization for emotion recognition using electromyographic speech. J. Acoust. Soc. Am. 2016, 139, 2015. [Google Scholar] [CrossRef]
- Jali, M.H.; Ibrahim, I.M.; Sulaima, M.F.; Bukhari, W.M.; Izzuddin, T.A.; Nasir, M.N. Features Extraction of EMG Signal using Time Domain Analysis for Arm Rehabilitation Device. AIP Conf. Proc. 2015, 1660. [Google Scholar] [CrossRef]
- Duan, W.; Huang, L.; Han, Y.; Huang, D. A hybrid EMD-AR model for nonlinear and non-stationary wave forecasting. J. Zhejiang Univ. Sci. A 2016, 17, 115–129. [Google Scholar] [CrossRef] [Green Version]
- Reddy, N.P.; Gupta, V. Toward direct biocontrol using surface EMG signals: Control of finger and wrist joint models. Med. Eng. Phys. 2007, 29, 398–403. [Google Scholar] [CrossRef]
- Zhang, Y. Hand Gestures Recognition Based on Optimization of sEMG Training Set Weight. Master’s Thesis, Chongqing University, Chongqing, China, April 2017. [Google Scholar]
- Rahayuningsih, I.; Wibawa, A.D.; Pramunanto, E. Klasifikasi Bahasa Isyarat Indonesia Berbasis Sinyal EMG Menggunakan Fitur Time Domain (MAV, RMS, VAR, SSI). J. Tek. ITS 2018, 7, 2337–3520. [Google Scholar] [CrossRef]
- Arabadzhiev, T.I.; Dimitrov, V.G.; Dimitrova, N.A.; Dimitrov, G.V. Interpretation of EMG integral or RMS and estimates of ‘neuromuscular efficiency’ can be misleading in fatiguing contraction. J. Electromyogr. Kinesiol. 2010, 20, 223–232. [Google Scholar] [CrossRef]
- Suresh, N.; Sasilatha, T.; Senthil, B. System on Chip (SOC) Based Cardiac Monitoring System Using Kalman Filtering with Fast Fourier Transform (FFT) Signal Analysis Algorithm. J. Med. Imaging Health Inf. 2016, 6, 897–905. [Google Scholar] [CrossRef]
- Abboud, J.; Nougarou, F.; Descarreaux, M. Muscle Activity Adaptations to Spinal Tissue Creep in the Presence of Muscle Fatigue. PLoS ONE 2016, 11, e0149076. [Google Scholar] [CrossRef] [PubMed] [Green Version]
- Pucciarelli, G. Wavelet Analysis in Volcanology: The Case of Phlegrean Fields. J. Environ. Sci. Eng. A 2017, 6, 300–307. [Google Scholar] [CrossRef] [Green Version]
- Duval-Poo, M.A.; Piana, M.; Massone, A.M. Solar hard X-ray imaging by means of Compressed Sensing and Finite Isotropic Wavelet Transform. Astron. Astrophys. 2018, 615. [Google Scholar] [CrossRef]
- Wang, T.; Li, L.; Huang, Y.-A.; Zhang, H.; Ma, Y.; Zhou, X. Prediction of Protein-Protein Interactions from Amino Acid Sequences Based on Continuous and Discrete Wavelet Transform Features. Molecules 2018, 23, 823. [Google Scholar] [CrossRef] [PubMed] [Green Version]
- Taran, S.; Bajaj, V. Motor imagery tasks-based EEG signals classification using tunable-Q wavelet transform. Neural Comput. Applic. 2019, 31, 6925–6932. [Google Scholar] [CrossRef]
- Luo, Z.; Wang, F. Electromyography Movement Pattern Recognition Based on the Wavelet Eigenvalues and Pi-sigma Network. J. Test. Meas. Technol. 2006, 20, 344–348. [Google Scholar]
- Wu, B.; Han, S.; Xiao, J.; Hu, X.; Fan, J. Error compensation based on BP neural network for airborne laser ranging. Optik 2016, 127, 4083–4088. [Google Scholar] [CrossRef]
- Pan, H.; Yang, J.; Shi, Y.; Li, T. BP Neural Network Application Model of Predicting the Apple Hardness. J. Comput. Theor. Nanosci. 2015, 12, 2802–2807. [Google Scholar] [CrossRef]
- Li, D.; Jia, S. Application of BP artificial neural network in blood glucose prediction based on multi-spectrum. Laser Optoelectron. Prog. 2017, 54, 031703. [Google Scholar] [CrossRef]
- Jun, Y.; Li, G. Fast algorithm for building Delaunay triangulation based on grid division. Sci. Surv. Mapp. 2016, 41, 109–114. [Google Scholar]
- Zang, S.; Zhang, C.; Zhang, L.; Zhang, Y. Wetland Remote Sensing Classification Using Support Vector Machine Optimized with Genetic Algorithm: A Case Study in Honghe Nature National Reserve. Sci. Geogr. Sin. 2012, 32, 434–441. [Google Scholar] [CrossRef]
- Ar, Y.; Bostanci, E. A genetic algorithm solution to the collaborative filtering problem. Expert Syst. Appl. 2016, 61, 122–128. [Google Scholar] [CrossRef]
- Chen, P.; Yuan, L.; He, Y.; Luo, S. An improved SVM classifier based on double chains quantum genetic algorithm and its application in analogue circuit diagnosis. Neurocomputing 2016, 211, 202–211. [Google Scholar] [CrossRef]
- Liu, Q.; Chen, G.; Liu, X.; Yang, Q. Genetic algorithm based SVM parameter composition optimization. Comput. Appl. Softw. 2012, 29, 94–100. [Google Scholar]
- Jiang, C.; Zhang, G.; Li, Z. Abnormal intrusion detection for embedded network system based on genetic algorithm optimised SVM. Comput. Appl. Softw. 2011, 28, 287–289. [Google Scholar] [CrossRef]
- Xu, J.; Zhang, Y.; Miao, D. Three-way Confusion Matrix for Classification: A Measure Driven View. Inf. Sci. 2019, 507, 772–794. [Google Scholar] [CrossRef]
- Hasnain, M.; Pasha, M.F.; Ghani, I.; Imran, M.; Alzahrani, M.Y.; Budiarto, R. Evaluating Trust Prediction and Confusion Matrix Measures for Web Services Ranking. IEEE Access 2020, 8, 90847–90861. [Google Scholar] [CrossRef]
- Kong, Y.; Jing, M. Research of the classification method based on confusion matrixes and ensemble learning. Comput. Eng. Sci. 2012, 34, 111–117. [Google Scholar]
- Ma, X.; Guo, M. Research on gesture EMG signal recognition based on EEMD and multi domain feature fusion. J. Yunnan Univ. 2018, 40, 252–258. [Google Scholar] [CrossRef]
- Pancholi, S.; Joshi, A.M. Portable EMG Data Acquisition Module for Upper Limb Prosthesis Application. IEEE Sens. J. 2018, 18, 3436–3443. [Google Scholar] [CrossRef]
- Rehman, M.Z.U.; Waris, A.; Gilani, S.O.; Jochumsen, M.; Niazi, I.K.; Jamil, M.; Farina, D.; Kamavuako, E.N. Multiday EMG-Based Classification of Hand Motions with Deep Learning Techniques. Sensors 2018, 18, 2497. [Google Scholar] [CrossRef] [PubMed] [Green Version]
- Zhang, J.; Ling, C.; Li, S. EMG Signals based Human Action Recognition via Deep Belief Networks. IFAC Pap. OnLine 2019, 52, 271–276. [Google Scholar] [CrossRef]
- Namazi, H. Fractal-Based Classification of Electromyography (EMG) Signal in Response to Basic Movements of the Fingers. Fractals 2019, 27, 1950037. [Google Scholar] [CrossRef]
- Tehovnik, E.J.; Slocum, W.M. Microstimulation of V1 delays visually guided saccades: A parametric evaluation of delay fields. Exp. Brain Res. 2007, 176, 413–424. [Google Scholar] [CrossRef] [PubMed]
- Lyons, K.R.; Joshi, S.S. Upper Limb Prosthesis Control for High-Level Amputees via Myoelectric Recognition of Leg Gestures. IEEE Trans. Neural Syst. Rehabil. Eng. 2018, 26, 1056–1066. [Google Scholar] [CrossRef]
- Stachaczyk, M.; Atashzar, S.F.; Farina, D. Adaptive Spatial Filtering of High-Density EMG for Reducing the Influence of Noise and Artefacts in Myoelectric Control. IEEE Trans. Neural Syst. Rehabil. Eng. 2020, 28, 1511–1517. [Google Scholar] [CrossRef]
Figure 1.
Schematic diagram of the proposed sEMG detection and action recognition system. Raw multi-channel sEMG signals were first acquired and transmitted wirelessly to the host computer. Then the signals were filtered and divided into sliding windows. In each window, feature extraction and action classification were conducted. The output label of the classifier drove the manipulator via the corresponding control command. The action consistency of the subject and the manipulator was observed in real time.

Figure 2.
The complete flow of the GA–SVM. The core of the GA–SVM is using genetic algorithm to simulate the rule of the fittest survives, and the unsuitable are eliminated in nature, so as to search the best penalty coefficient and the kernel parameter. Ultimately, the optimal SVM model is formed.
Figure 2.
The complete flow of the GA–SVM. The core of the GA–SVM is using genetic algorithm to simulate the rule of the fittest survives, and the unsuitable are eliminated in nature, so as to search the best penalty coefficient and the kernel parameter. Ultimately, the optimal SVM model is formed.

Figure 3.
The composition of sEMG detection and action recognition system. The signal acquisition, processing, and manipulator control are based on a variety of hardware and software. Our self-developed acquisition device acquires 4-channel sEMG signals and transmits the data to a PC by LAN. Later noise removing, overlapping sliding windows dividing, feature extraction, and action classification are carried out on the PC. The classifier outputs the label and the control command is sent by a serial port to the manipulator. Subsequently, the manipulator does the action and follows the subject.

Figure 4.
The positions of the electrodes. We adopted 4-channel differential input in signal acquisition and took the elbow as the reference. The acquisition positions located on extensor pollicis longus, finger extensor muscle, and the palm long extensor muscle.
Figure 4.
The positions of the electrodes. We adopted 4-channel differential input in signal acquisition and took the elbow as the reference. The acquisition positions located on extensor pollicis longus, finger extensor muscle, and the palm long extensor muscle.

Figure 5.
Five actions to be recognized. (a) Fist clenching. (b) Hand opening. (c) Wrist flexion. (d) Wrist extension. (e) Calling me. These actions are more common in daily lives and relatively easier to be recognized. Patients usually start with these basic movements in restoring hand function.
Figure 5.
Five actions to be recognized. (a) Fist clenching. (b) Hand opening. (c) Wrist flexion. (d) Wrist extension. (e) Calling me. These actions are more common in daily lives and relatively easier to be recognized. Patients usually start with these basic movements in restoring hand function.

Figure 6.
Spatial distribution of each feature. (a) MAV, (b) ZC, (c) WL, (d) RMS, (e) MF, and (f) MPF. The x, y, and z labels are channel 1, 2, and 3. The actions represented by different colors are marked—the blue points represent fist clenching, the red points represent hand opening, the yellow points represent wrist flexion, the purple points represents wrist extension, and the green points represents calling me. The classification effect is better if the difference can be seen with the naked eye. Or if it is difficult to distinguish the scattered points, the classification effect is poor.


Table 1.
Classification accuracy of 5 actions (fist clenching, hand opening, wrist flexion, wrist extension, and calling me) based on single feature (MAV, ZC, WL, RMS, MF, MPF, and wavelet coefficient). The purpose of this table is to explore the optimal feature among all features selected. Each row represents the accuracy of different actions based on a single feature. Each column represents the accuracy of a single action based on different features. We also calculated the average accuracy to make a better comprehensive comparison.
| Feature | Average | Fist Clenching | Hand Opening | Wrist Flexion | Wrist Extension | Calling Me |
|---|---|---|---|---|---|---|
| MAV | 90.0% | 100% | 97% | 79% | 93% | 81% |
| ZC | 27.4% | 21% | 19% | 17% | 47% | 33% |
| WL | 87.0% | 98% | 81% | 77% | 93% | 86% |
| RMS | 87.2% | 95% | 93% | 76% | 91% | 83% |
| MF | 38.8% | 22% | 21% | 34% | 71% | 46% |
| MPF | 37.2% | 18% | 47% | 19% | 59% | 43% |
| Wavelet coefficient | 71.6% | 87% | 71% | 62% | 75% | 63% |
Table 2.
Three-feature-combination joint action classification of BP neural network and GA–SVM. This table explores the performance of the BP neural network and the GA–SVM, based on the same features (MAV, WL, and RMS). Each row represents the accuracy of different actions based on a certain classifier. Each column represents the accuracy of a single action, based on different classifiers. We also calculated the average accuracy for better comprehensive comparison.
| Classifier | Average | Fist Clenching | Hand Opening | Wrist Flexion | Wrist Extension | Calling Me |
|---|---|---|---|---|---|---|
| BP | 93.2% | 100% | 92% | 91% | 96% | 87% |
| GA-SVM | 83.0% | 100% | 64% | 92% | 93% | 66% |
Table 3.
Confusion matrix evaluation of the BP neural network. The classification results are further refined in this table. The diagonal elements represent the number of samples classified correctly, which meets the accuracy in Table 2. Other elements mean the number of samples that are misclassified. More importantly, through the confusion matrix, it is clear to see which pattern has been misclassified for a certain sample.
| Action | Fist Clenching | Hand Opening | Wrist Flexion | Wrist Extension | Calling Me |
|---|---|---|---|---|---|
| Fist clenching | 950 | 0 | 0 | 0 | 0 |
| Hand opening | 9 | 876 | 17 | 27 | 21 |
| Wrist flexion | 16 | 22 | 865 | 29 | 18 |
| Wrist extension | 5 | 12 | 15 | 911 | 7 |
| Calling me | 20 | 25 | 43 | 36 | 826 |
Table 4.
Confusion matrix evaluation of GA–SVM. The classification results are further refined in this table. Similarly, the diagonal elements represent the number of correctly classified samples, which meets the accuracy in Table 2 as well. Other elements mean the number of samples that are misclassified. It is obvious that the classification accuracy of the GA–SVM is lower than that of the BP neural network, and the misjudged samples are greater in number.
| Action | Fist Clenching | Hand Opening | Wrist Flexion | Wrist Extension | Calling Me |
|---|---|---|---|---|---|
| Fist clenching | 950 | 0 | 0 | 0 | 0 |
| Hand opening | 34 | 606 | 49 | 171 | 90 |
| Wrist flexion | 8 | 22 | 877 | 27 | 16 |
| Wrist extension | 10 | 16 | 34 | 883 | 7 |
| Calling me | 38 | 76 | 120 | 89 | 627 |
© 2020 by the authors. Licensee MDPI, Basel, Switzerland. This article is an open access article distributed under the terms and conditions of the Creative Commons Attribution (CC BY) license (http://creativecommons.org/licenses/by/4.0/).
Share and Cite
MDPI and ACS Style
Cao, T.; Liu, D.; Wang, Q.; Bai, O.; Sun, J. Surface Electromyography-Based Action Recognition and Manipulator Control. Appl. Sci. 2020, 10, 5823. https://doi.org/10.3390/app10175823
AMA Style
Cao T, Liu D, Wang Q, Bai O, Sun J. Surface Electromyography-Based Action Recognition and Manipulator Control. Applied Sciences. 2020; 10(17):5823. https://doi.org/10.3390/app10175823
Chicago/Turabian StyleCao, Tianao, Dan Liu, Qisong Wang, Ou Bai, and Jinwei Sun. 2020. "Surface Electromyography-Based Action Recognition and Manipulator Control" Applied Sciences 10, no. 17: 5823. https://doi.org/10.3390/app10175823
Note that from the first issue of 2016, this journal uses article numbers instead of page numbers. See further details here.