Biodegradable Polylactide Scaffolds with Pharmacological Activity by Means of Ultrasound Micromolding Technology


1
Departament d’Enginyeria Química, Universitat Politècnica de Catalunya, Escola d’Enginyeria de Barcelona Est-EEBE, 08019 Barcelona, Spain
2
Barcelona Research Center for Multiscale Science and Engineering, Universitat Politècnica de Catalunya, Escola d’Enginyeria de Barcelona Est-EEBE, 08019 Barcelona, Spain
*
Authors to whom correspondence should be addressed.
Appl. Sci. 2020, 10(9), 3106; https://doi.org/10.3390/app10093106
Submission received: 30 March 2020
/
Revised: 24 April 2020
/
Accepted: 28 April 2020
/
Published: 29 April 2020
(This article belongs to the Section Applied Biosciences and Bioengineering)
Abstract
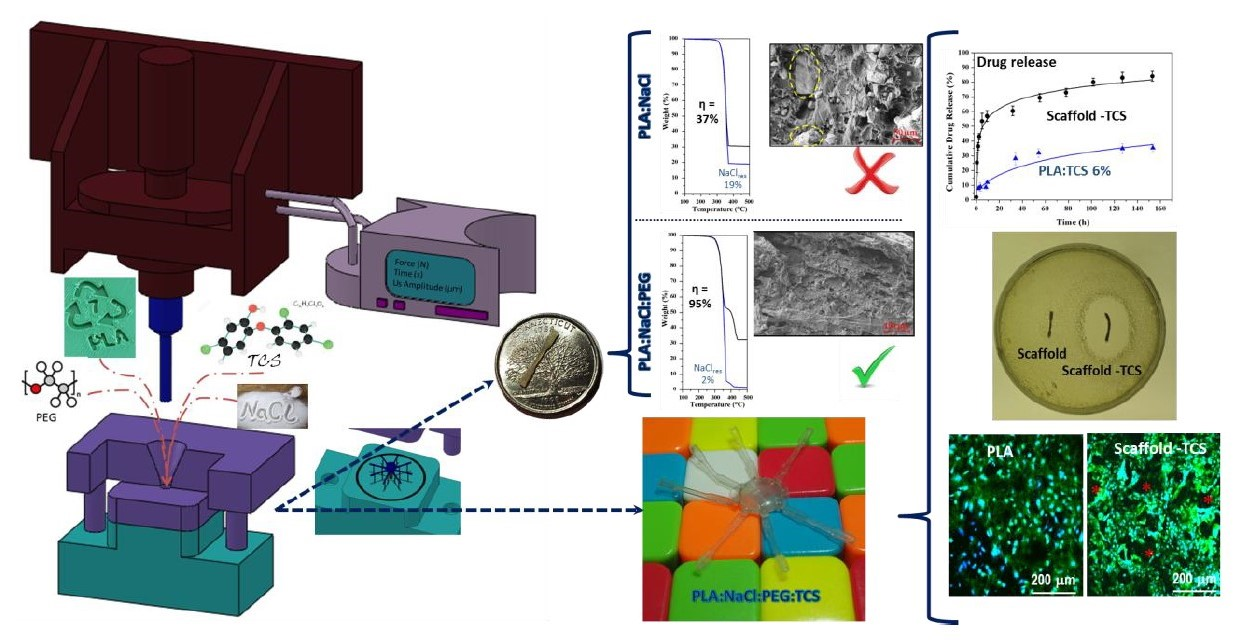
:Ultrasound micromolding technology has been applied to get microporous polylactide scaffolds from the subsequent leaching of incorporated NaCl salts. A small amount of water-soluble polyethylene glycol (PEG) was required in order to improve the leaching process and get compact pieces with interconnected pores. Distribution of polymers in the processed specimens was quite homogeneous due to the small PEG content, although it was more concentrated in the regions close to the feeding channels due to its higher viscosity. Hydrophobic drugs like triclosan could be incorporated causing a minimum degradation during ultrasound processing and suffering an insignificant solubilization during the leaching step. Final scaffolds showed clear bactericide or bacteriostatic effects before and after 10 h of exposure. Cell proliferation of MDCK epithelial cells was higher for TCS loaded porous scaffolds (200%) than for unloaded samples (170%) and non-porous polylactide (PLA) specimens (100%, control). Micrographs showed the absence of non-inhibition areas in both the specimens and the container, confirming the biocompatibility of PLA specimens.
1. Introduction
The regeneration and repair of biological tissues usually require a temporal or permanent support to provide at least structural and mechanical properties. Tissue engineering appears as a new research discipline [1,2,3] that is addressed to develop new materials with appropriate properties and features that can also improve their final performance with additional functions. Efforts are mainly focused on accelerating the regeneration and reparation of tissues, to guide cell growth [4], to increase the biodegradability of temporal supports, to decrease cytoxicity [5,6], to produce nanocomposites reinforced with particles or fibers in order to improve adhesion and cell proliferation [7,8,9], to incorporate growth factors and other bioactive agents in order to stimulate cell growth [10,11], to give an antimicrobial response or other effects such as radical scavenging [12], and finally, to develop materials with electroconductive properties that make feasible an electrical stimulation or a controlled drug release [13].
Tissue engineering has developed the so-called scaffolds, which are biomaterials that mimic the extracellular matrix of tissues. Scaffolds are usually porous supports with a three-dimensional structure that allows increasing the number of adhered cells and the cell growth [14]. Furthermore, porous scaffolds may also enhance cell transit and diffusion of nutrients and growth factors [15,16]. Biodegradable polymers are usually employed when scaffolds should have a temporary function and act as templates for tissue repair and regeneration. Extensive reviews have been focused on the selection of appropriate polymeric materials since degradation rate and maintenance of properties should be in agreement with the time required for tissue regeneration [17,18,19].
Scaffolds can also be considered as drug releasing systems since the polymer matrix can be loaded with the appropriate active agents. Scaffolds increase their surface due to their porous structure and therefore the amount of drug released could be tuned depending on this surface. In most cases, scaffolds have been developed as temporary supports based on biodegradable materials, having some of the above indicated specific properties (e.g., antibacterial activity). Triclosan (TCS), for example, is usually employed as biocide in both home and hospital settings for disinfection. TCS has a clear hydrophobic character and basically acts as an inhibitor of the bacterial lipid biosynthesis [20].
There are several methods to obtain a porous polymeric scaffold; some of them can directly generate the pores while in other cases a secondary treatment is needed. Deposition and assembly of micro/nanofibers is a common one step process. These meshes can be produced by the bonding of different fibers, where some of them (with lower melting point) act as a reticulation point, or by electrospinning. The binding process is simpler but the porosity grade is not under such accurate control as could be achieved through electrospinning [21,22]. Most of direct processes developed for scaffold production are limited to a laboratory scale and are not widely applied in the industrial field.
By contrast, indirect procedures are more common in big mass production and also they allow a fabrication with the desired final shape [23]. Conventional industrial procedures, such as extrusion or injection can be applied when are combined with the salt leaching technique. In this case, the polymer is mixed with a water-soluble salt and then molded. Porosity is created after removing the salt by water immersion. Porous size and density can be accurately controlled through the selection of both particle size and the incorporated amount of salt [24,25].
Nowadays, there is a market demand for high resolution scaffolds that are able to produce shape profiles with nanosized ending to mimic fissures and textures of naturally occurring tissues. Despite the fact that 3D printing can reach this scale with high accurate ending, it is still costly for mass production [26,27].
The use of pieces with reduced dimensions has increased in the last years through several markets. Microinjection is being used in a commercial way and good results have been achieved, this technique is inefficient, and the production costs are high. Microinjection is based in a simplistic adaptation of a conventional injection machine to produce micro samples and is not optimized to mold samples with nano or microscale features. The material dosage and heating is poor and not well optimized, leading to a high amount of non-useful material, long cycle times, and an inefficient heating profile [28,29].
Recently, some studies have been focused on the development of a new promising technique based on ultrasound micromolding [30]. Advantages include its good reproducibility, low cost, efficient material dosage, low cycling time, and high resolution [31]. The sample is locally heated by the kinetic energy produced by the chain vibration that is induced by an ultrasonic source [32,33,34]. Ultrasound heating also increases the flow index of the polymers leading to an effective filling of designed micromold cavities if an appropriate pressure/force is applied [35]. Different studies have been carried out with some commodities, such as polyethylene, polymethylene oxide, and polypropylene, [32], commercial biodegradable polymers such as polylactide (PLA) and polybutylene succinate [36], and polymers loaded with exfoliated clays (e.g., PLA) [37] and multiwall carbon nanotubes (e.g., polycaprolactone) [38]. All of them concluded that an accurate selection of amplitude, force and time parameters could lead to minimum polymer degradation, absences of defects in the micromolded pieces, and an accurate filling of the mold.
In this work, PLA was selected as the polymer matrix due to its biocompatibility, low immunogenicity, and good mechanical properties. PLA is FDA-approved for clinical use and has the ability to biodegrade in lactic acid into the human body. PLA has already been used to fabricate medical implants like screws and pins [39], scaffolds [40], and drug-delivery systems [41]. Moreover, our previous works have demonstrated that ultrasonic-assisted molding is an adequate process to produce miniature pieces loaded with bactericide agents without activity loss [42]. This is a key point since it is well known that production methods can influence on the pharmacological activity. The main goal of the present work is the preparation of new biodegradable porous scaffolds through an ultrasonic-assisted micromolding technology as a new indirect method suitable to be employed at an industrial scale with an extremely high resolution. In addition, we have explored the capacity to load the porous scaffolds with a pharmacological agent. In this case, an antibacterial drug able to protect against potential infections has been selected. The crucial point concerns the retention of the drug during the necessary salt leaching step. The work involves three main parts: evaluation of the effects caused by the incorporation of porogenic agents, optimization of the leaching process, and evaluation of the capacity to load a representative drug. Thus, the achievement of antimicrobial properties for the triclosan (TCS) loaded scaffold could be considered as a good probe of the suitability of the new application of ultrasound technology to prepare porous scaffolds.
2. Experimental
2.1. Materials
A commercial PLA powder grade (Ecorene® NW30 from NatureWorks, Naarden, The Netherlands) with number average molecular weight of 43,000 g/mol and a degree of crystallinity of 35% was employed. Polyethylene glycol (PEG) samples with weight average molecular weights of 35,000 and 100,000 g/mol were purchased from Sigma-Aldrich. Porogenic agents (i.e., Na2CO3), NaHCO3, NaCl), and the antimicrobial Triclosan® were provided by Sigma-Aldrich® (St Louis, MO, USA).
2.2. Micromolding Equipment and Scaffold Preparation
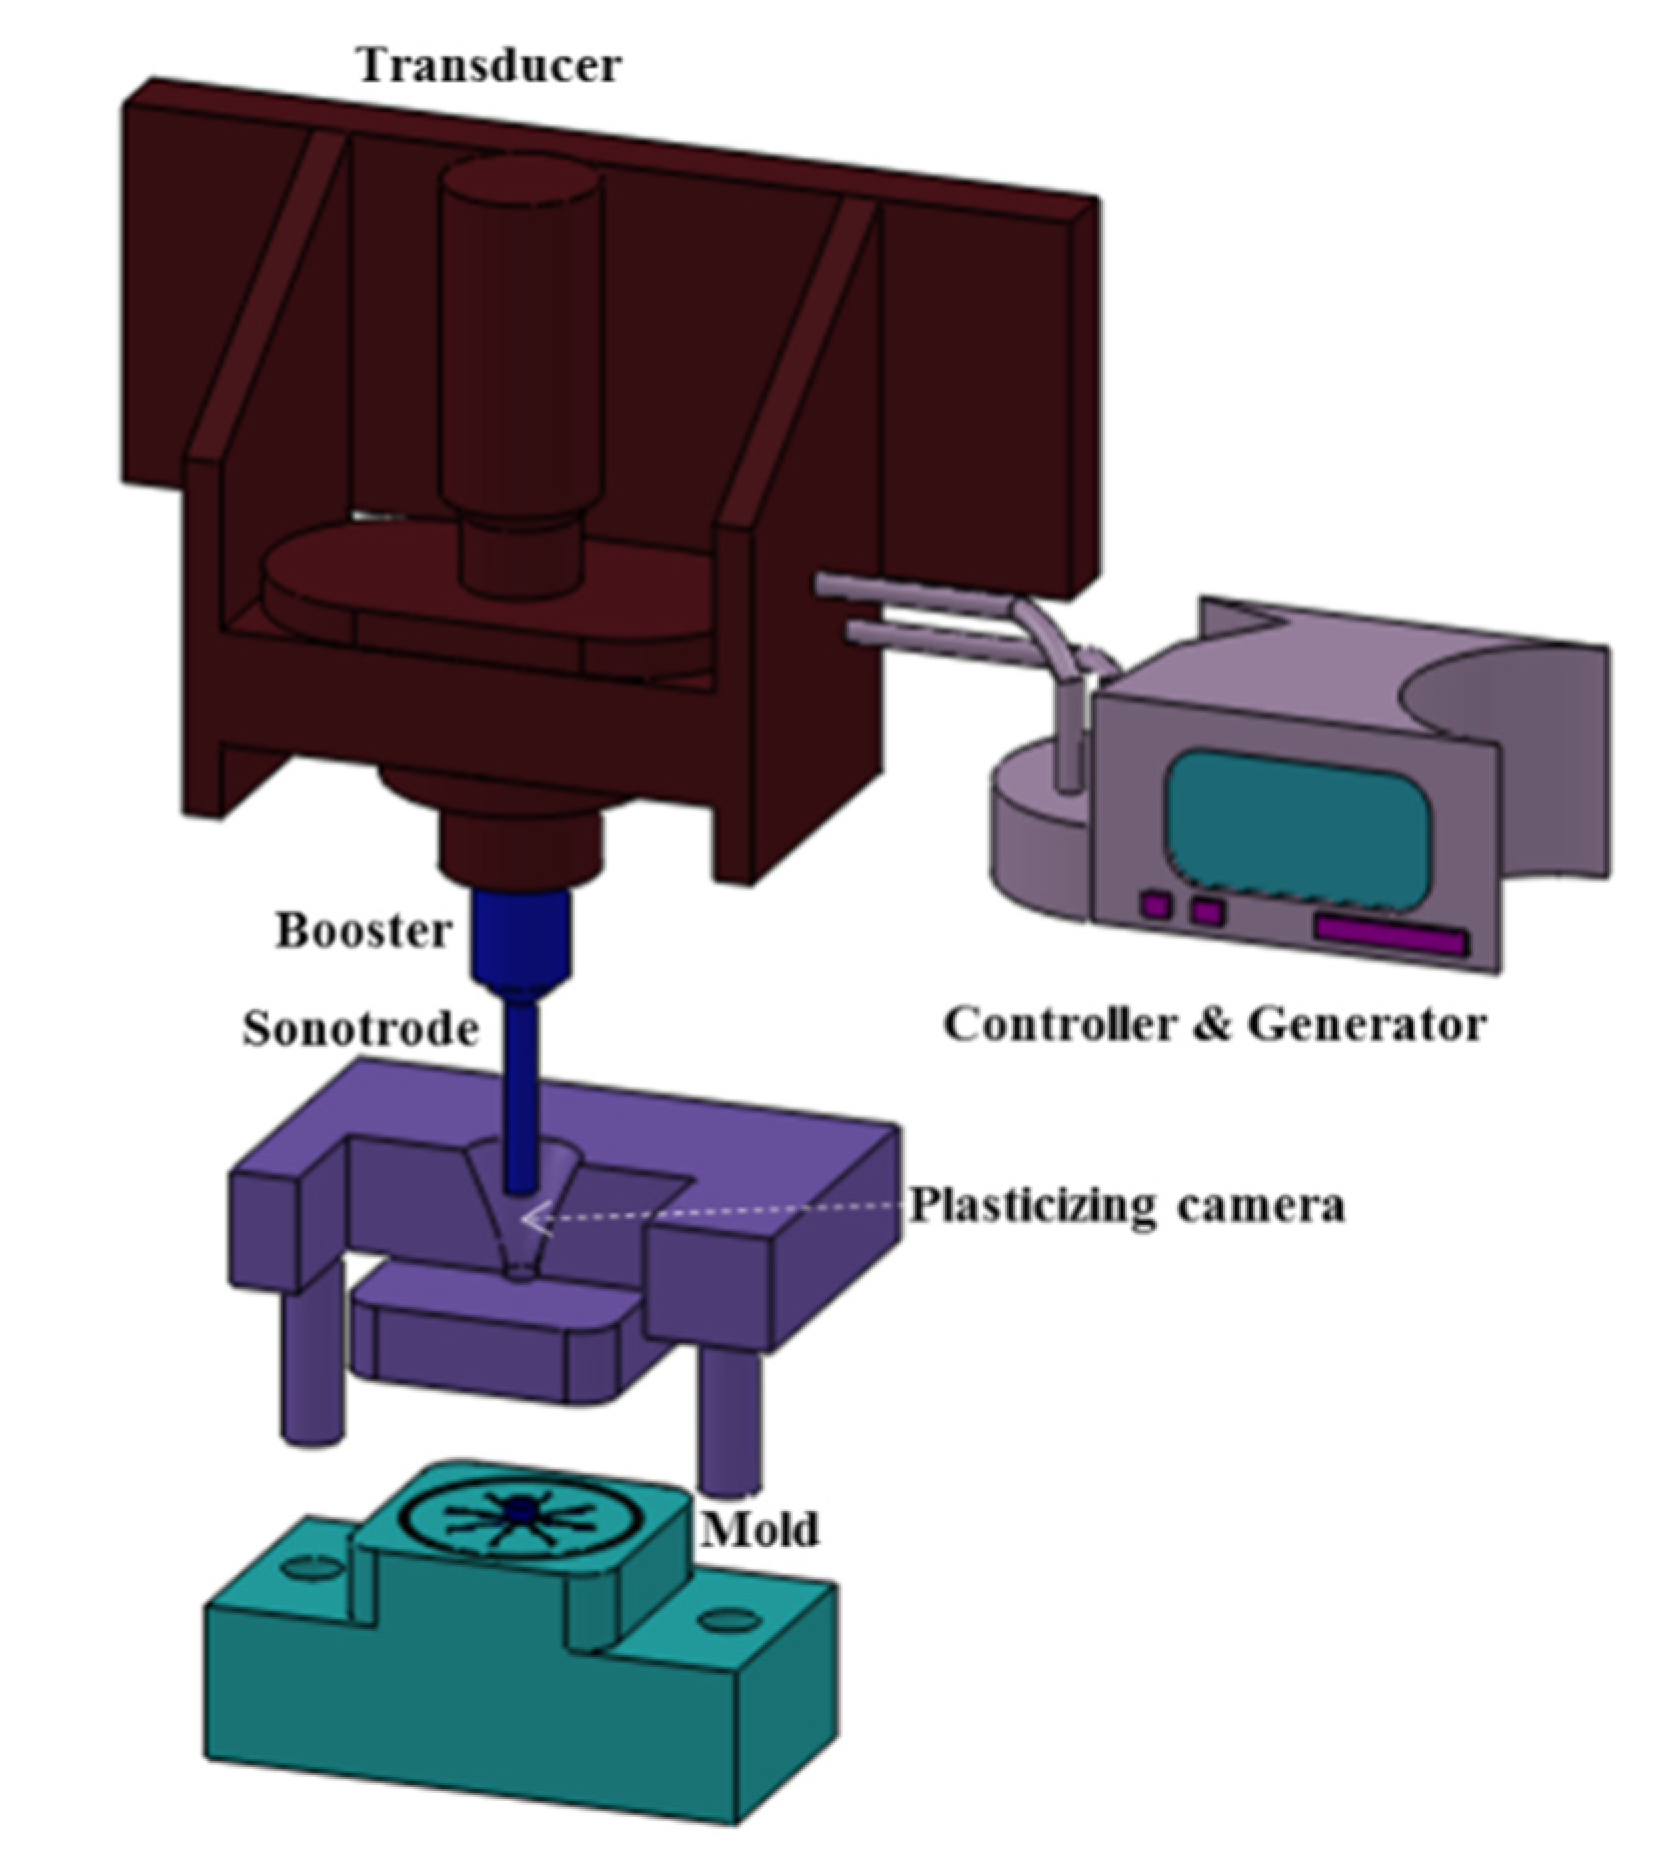
A scheme of the micromolding equipment is shown in Figure 1. This first-generation prototype Ultrasound Molding Machine (Sonorus®, Ultrasion S.L., Barcelona, Spain) is composed by a digital ultrasound generator (1000 W–30 kHz) and a controller (3010 DG digital system, Mecasonic, Barcelona, Spain). A focused piezoelectric transducer (designed by Mecasonic) converts the ultrasonic signal to a kinetic moment and an acoustic unit (constituted by a booster and a sonotrode) operates in longitudinal vibration. The equipment is also equipped with an electric servomotor control (Berneker and Rainer, Barcelona, Spain) fitted with software from Ultrasion S.L. (Barcelona, Spain), a little plasticizing camera and mold capable of preparing 8 test specimens of dimensions 1.5 cm × 0.1 cm × 0.1 cm and upgraded with an automatic ejection system.
First, 380 mg of the appropriate homogeneous mixture of the powdered compounds (PLA, PEG, porogenic agent, TCS) were introduced in the plasticizing camera. Polymers, TCS, and the porogenic agent were incorporated by physical mixture to maintain unalterable the selected particle size. Once the molding parameters (amplitude, force, and time) were configured the process started with the sample compaction in the camera by the sonotrode. Subsequently, the transducer converted the electric energy to a cycling movement, according to the given amplitude regulated by the booster. The given mechanical energy allowed the flow of the polymer mixture through the feed channels of the mold. The mold was cold down at constant pressure after the filling step and then the specimen was released with the ejection system. For PLA, PLA:PEG blends, and PLA loaded with NaCl having high particle size (100–250 µm) 24 µm, 300 N, and 1.2 s were used as molding parameters. For all the samples containing NaCl with a particle size lower than 45 µm the molding force was set up to 400 N keeping the same time and amplitude. The leaching process was performed by the immersion of samples in water under gentle stirring for 24 h.
The different molded samples and the corresponding optimized molding parameters that will be explained are summarized in Table 1.
2.3. Molecular Weight
Molecular weight was determined by size exclusion chromatography (GPC) using a liquid chromatograph (Shimadzu, model LC-8A) equipped with an Empower computer program (Waters). The polymer was dissolved and eluted in 1,1,1,3,3,3-hexafluoroisopropanol (HFIP) containing CF3COONa (0.05 M). The flow rate was 1 mL/min, the injected volume 20 µL, and the sample concentration 2 mg/mL. A PL HFIP gel column (Polymer Lab Agilent Technologies Deutschland GmbH, Böblingen, Germany) and a refractive index detector (Shimadzu RID-10A, model LC-8A, Tokyo, Japan) were employed. The number and weight average molecular weights were determined using polymethylmethacrylate standards.
2.4. FTIR Equipment
Infrared spectra (ATR-FTIR) were recorded at a resolution of 4 cm−1, with a Fourier transform infrared spectrometer FTIR 4100 Jasco dotted with a Specac MKII Golden Gate Single Reflection Diamond ATR system (Jasco International Co. Ltd., Tokyo, Japan).
2.5. Scanning Electron Microscope
SEM micrographs of micromolded specimens were taken with a Focused Ion Beam Zeiss Neon40 microscope (Zeiss, Oberkochen, Germany) operating at 5 kV. Samples were mounted on an aluminum pin-stub using a double-side adhesive carbon disc (Ted Pella Inc., Redding, CA, USA) and sputter-coated with a thin layer of carbon by using a Mitec K950 Sputter Coater (Quorum Technologies Ltd., Ashford, UK).
2.6. NMR Measurements
1H NMR spectra were recorded with a Bruker AMX-300 spectrometer (Wissenbourg, France) operating at 300.1 MHz and 25 °C. Samples were dissolved in deuterated chloroform and spectra were internally referenced to tetramethylsilane (TMS).
2.7. Surface Contact Angle Measurements
Contact angles (CA) were measured at room temperature with sessile drops using an OCA-15 plus Contact Angle Microscope (Data-Physics Instruments GmbH, Filderstadt, Germany) and SCA20 software (Version 2.0, Data-Physics Instruments GmbH, Filderstadt, Germany). Contact angle values of the right and left sides of distilled water drops were measured and averaged. Measurements were performed 10 s after the drop (5 µL) was deposited on the sample surface. All CA data were an average of six measurements on different surface locations.
2.8. Calorimetric Assays: DSC and TGA
Calorimetric data were recorded by differential scanning calorimetry using a TA instrument Q100 series (TA instruments, New Castle, DE, USA) equipped with a refrigerated cooling system operating from −50 °C to 300 °C. Experiments were performed at a heating rate of 10 °C/min with a sample weight of 5 mg and under a flow of dry nitrogen. The instrument was calibrated for temperature and heat of fusion using an indium standard. Tzero technology required two calibrations, with empty pans and sapphires discs.
Thermogravimetric (TGA) and differential thermogravimetric (DTGA) data were acquired with a Q50 thermogravimetric analyzer of TA Instruments (New Casttle, DE, USA) under a flow of dry nitrogen with approximately 5 mg samples and at a heating rate of 20 °C/min.
2.9. Synchrotron Measurements
Real-time synchrotron studies were carried out on beamline BL11-NCD at ALBA Synchrotron (Cerdanyola del Vallès, Barcelona, Spain) by using a wavelength of 0.100 nm and a WAXD LX255-HS detector from Rayonix LLC (Evanston, IL, USA). Polymer scaffolds were held on a Linkam hot stage (Linkam Scientific, Tadworth, UK) with temperature control within ± 0.1 °C. WAXD profiles were acquired during heating runs in time frames of 20 s and rates of 10 °C/min. WAXD diffraction patterns were calibrated by means of a geometrical calibration process of a well-known sample (standard Cr2O3). Diffraction profiles were normalized to the beam intensity and corrected considering the empty sample background.
2.10. Mass Extraction Yield and Porosity Calculations
NaCl extraction was calculated by measuring the conductivity of the washing water with a SX-650 San-xin electrical conductivity meter (San-Xin Instrumentation, Shanghai, China) (0–50 mS/cm). Calibration was performed with standard NaCl solutions at 21 °C. Values were averaged from three measurements. The weight of the removed salt, Wr, was calculated according to Equations (1) and (2):
where, is the theoretical weight loaded; is the weight of the removed NaCl; a and b, are calibration curve constants; V, volume of washing water (mL); σ, medium conductivity (S/m).
In the case of porosity and mass extraction of the PLA-NaCl-PEG systems, the samples were weighted before being washed (Wo), after staying in water for 24 h (Ww) and once the washed specimens were dried (Wd). Porosity and mass extraction were calculated according to the following Equations (3) and (4):
where, i refers to the components of the mixture (e.g., PLA, NaCl and PEG), δ, to the density, and wtheo, to the theoretical weight.
2.11. Drug Release Experiments
Specimens (380 mg for each sample) for release experiments were exposed to 10 mL of phosphate buffered saline (PBS) supplemented with 70% of ethanol. Specimens were kept under a moderate stirring (80 rpm) and a constant temperature of 37 °C for one week. Aliquots of 1 mL were periodically taken out of the media and analyzed by UV-Vis spectroscopy using a Shimadzu UV-3600 spectrophotometer (Shimadzu Corp., Tokyo, Japan) to quantify the amount of released drug by absorbance measurements at a wavelength of 292 nm. After each extraction, the media were renewed with fresh solutions. Calibration curves were done with pure TCS dissolved in the release medium. Release experiments were carried out in triplicate.
2.12. Antibacterial Assay
For the antibacterial assay Escherichia coli (E. coli) and Staphylococcus epidermidis (S. epidermidis) bacteria were chosen. Bacteria were previously grown aerobically to exponential phase in lysogenic broth (LB, Lennox) (tryptone 10 g, yeast extract 5 g, NaCl 5 g, pH 7.2). Two assays were carried out to evaluate the antibacterial effectiveness of the scaffold: a) The growth assay, where the different samples (i.e., neat PLA used as a control to refer the 100% bacterial growth, PLA scaffold and PLA antibacterial scaffold) were immersed in tubes of 15 mL filled with 2 mL of LB containing 1 × 10³ colony forming units (CFU). The cultures were incubated at 37 °C and agitated at 80 rpm. Aliquots of 100 µL were taken at predefined time intervals for absorbance measurement at 650 nm in a microplate reader (Biochrom EZ Read 400, Harvard Bioscience, Harvard, NE, USA). Turbidity was directly related to the bacterial growth. Three replicas of each sample were considered, and the determined values averaged. b) The plate growth inhibition test which was performed in Petri dishes of 90 mm and seeded separately with 1.5 × 10⁸ CFU/mL of each bacterium. Two samples (PLA scaffold and PLA antibacterial scaffold) were placed in each dish. Inhibition halo images were evaluated after incubation of samples with bacteria for 24 h at 37 °C. One test specimen (380 mg) was analyzed for each replica.
2.13. Cell Proliferation Assay
MDCK cells (Madin-Darby Canine Kidney epithelial-like cell line) (ATCC, Manassas, VA, USA) were thawed at step subcultivation #45 and used for the proliferation assay at step #47). The cells were cultured in Dulbecco’s modified Eagle’s medium (DMEM with 4500 mg/L of glucose, 110 mg/L of sodium pyruvate and 2 mM of L-glutamine) supplemented with 10% fetal bovine serum (FBS), 50 U/cm3 penicillin, 50 mg/mL streptomycin and L-glutamine 2 mM at 37 °C in a 10% humidified atmosphere of 5% CO2 and 95% air. Culture media were changed every two days. For sub-culture, cell monolayers were rinsed with PBS and detached by incubating them with 0.25% trypsin/EDTA for 2–5 min at 37 °C. The incubation was stopped by resuspending in 5 mL of fresh medium and the cell concentration was determined by counting with Neubauer camera (Optisum, New York, NY, USA) and using 4% trypan blue as dye vital.
PLA scaffold, antibacterial PLA scaffold, and PLA specimens (380 mg) were previously washed in water to remove the salt used as a porogenic agent and to avoid hypo-osmotic damage of cultured cells. Then, the specimens were placed in tissue culture plates of 24-well, sterilized by exposed to UV light for 15 min. 100 µL containing 5 × 10⁴ cells were deposited in each well and incubated for 60 min. 1 mL of culture media was then added to each well. Controls were conducted by cell culture on the wells without any material. Quantification of proliferated cells was performed after one week.
The percentage of cells adhered and proliferated was determined through the MTT (3-(4,5-dimethylthiazol-2-yl)-2,5-diphenyltetrazolium bromide) assay [43]. After a week, 50 µL of MTT (3 mg/mL) were added to each well in the plates and incubated for 4 h. After that, samples were washed twice with PBS and the specimens deposited in a new plate. Subsequently, 1 mL of dimethyl sulfoxide (DMSO) was added and the absorbance was measured at 540 nm in a microplate reader (Biochrom EZ-Read 400, Harvard Bioscience, Harvard, NE, USA) after 15 min of gentle stirring. Three replicas were evaluated, and the corresponding values were averaged. The statistical analysis was performed by one-way ANOVA followed by Tukey test. The analyses were performed with a confidence level of 95% (p < 0.05).
To obtain representative fluorescence images of samples coming from proliferation assay, samples were fixed in glutaraldehyde 2.5% in PBS overnight at 4 °C, and then dehydrated by extensive washing in an alcohol battery. Finally, samples were dried in air and sequentially stained with green-fluorescent Alexa Fluor Atto-488 phalloidin dye and DAPI for labeling actin and nucleus, respectively. The images were obtained with a confocal laser scanning microscope (LSM 900 Zeiss) controlled by ZEN 2.6 software (blue edition) (Carl-Zeiss Microscopy GmbH, Jena, Germany).
3. Results and Discussion
3.1. Micromolding of Mixtures of PLA and the Porogenic Agent
A preliminary study was done to determine the capability of the ultrasound equipment to mold mixtures of PLA and a water-soluble salt. Sodium carbonate (Na2CO3), sodium bicarbonate (NaHCO3), and sodium chloride (NaCl) were selected due to their low cost, biocompatibility, and wide use in salt leaching applications [44,45,46]. In a first attempt, PLA was mixed with a low percentage (e.g., 10 wt-%) of the selected salt. Both carbonates were decomposed during processing giving rise to carbon dioxide (Figure 2a,b) which means that samples could not be successfully molded. Even by varying amplitude, force, and time processing parameters, the PLA was not able to fill completely the mold and the specimens presented a lot of bubbles, especially for the bicarbonate sample (Figure 2c). Gas bubbles inside the molten polymer hindered the diffusion of molecular chains and led to a bad distribution and an imperfect molded specimen. Moreover, bubbles were responsible of cavitation effects that caused some polymer degradation as evidenced by the observed punctual coloration in some parts of the specimens.
By contrast, sodium chloride (NaCl) with a particle size of 250–100 μm allowed obtaining well molded specimens (Figure 2d) without modifying the processing parameters previously determined for the selected commercial PLA [38]. Thus, amplitude, force, and time of 24 µm, 300 N, and 1.2 s, respectively, were considered optimal and used in most of the performed tests.
Tests were also carried out considering different NaCl loads and varying also the particle size. The above indicated processing parameters were appropriate to get specimens up to a maximum NaCl load of 40 wt-% when diameters were in the 250–100 μm size range. Higher salt contents lead to an overload signal. When smaller particles (e.g., <45 μm) were employed, the salt percentage could be increased to 50 wt-% but the applied force should be increased to 400 N. Lower (e.g., 300 N) and higher (e.g., 500 N) forces caused an incomplete filling of the mold (85%) and an overload signal, respectively.
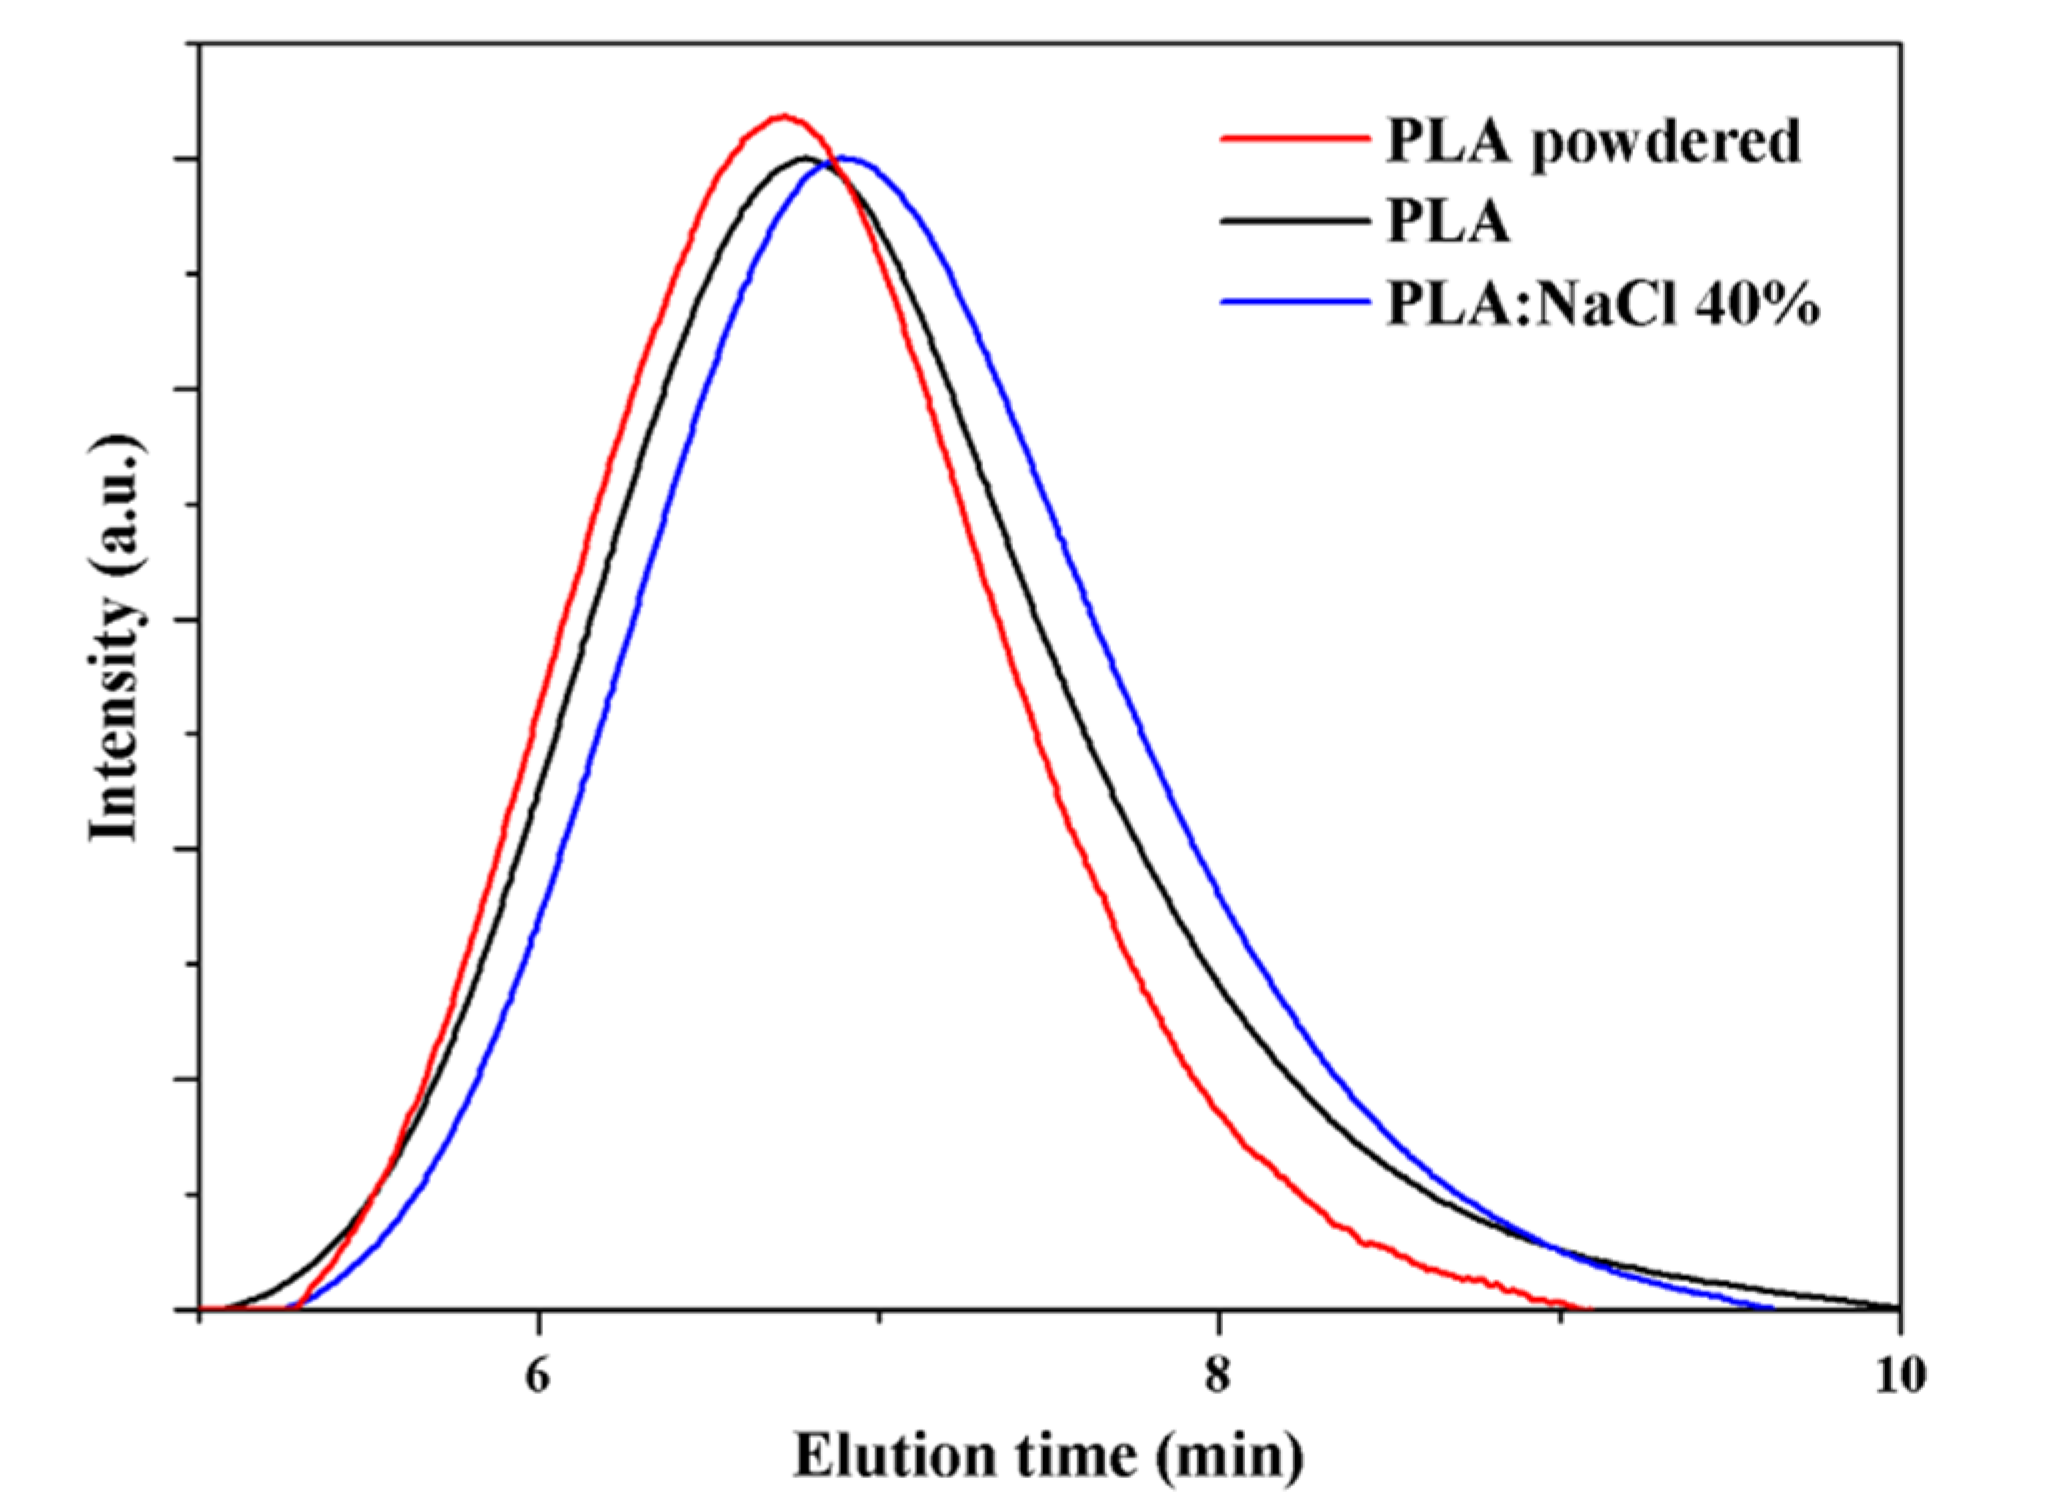
GPC chromatograms showed that the molecular weight of the neat PLA sample and that processed with 40 wt-% of salt were practically identical (Figure 3), although a small decrease on the weight average molecular weight (i.e., from 72,200 g/mol to 68,800 g/mol) was detected, suggesting the occurrence of a small degradation caused by ultrasound processing. This was slightly more significant than that detected in previous works [43], being consequently associated to the increased force that was necessary to process the salt rich specimen. In any case, the observed degradation (decrease on Mn less than 5%) was not significant to compromise final mechanical properties. Note also that the influence of the molecular weight decrease should be insignificant considering the porosity of the sample once the incorporated salt is removed.
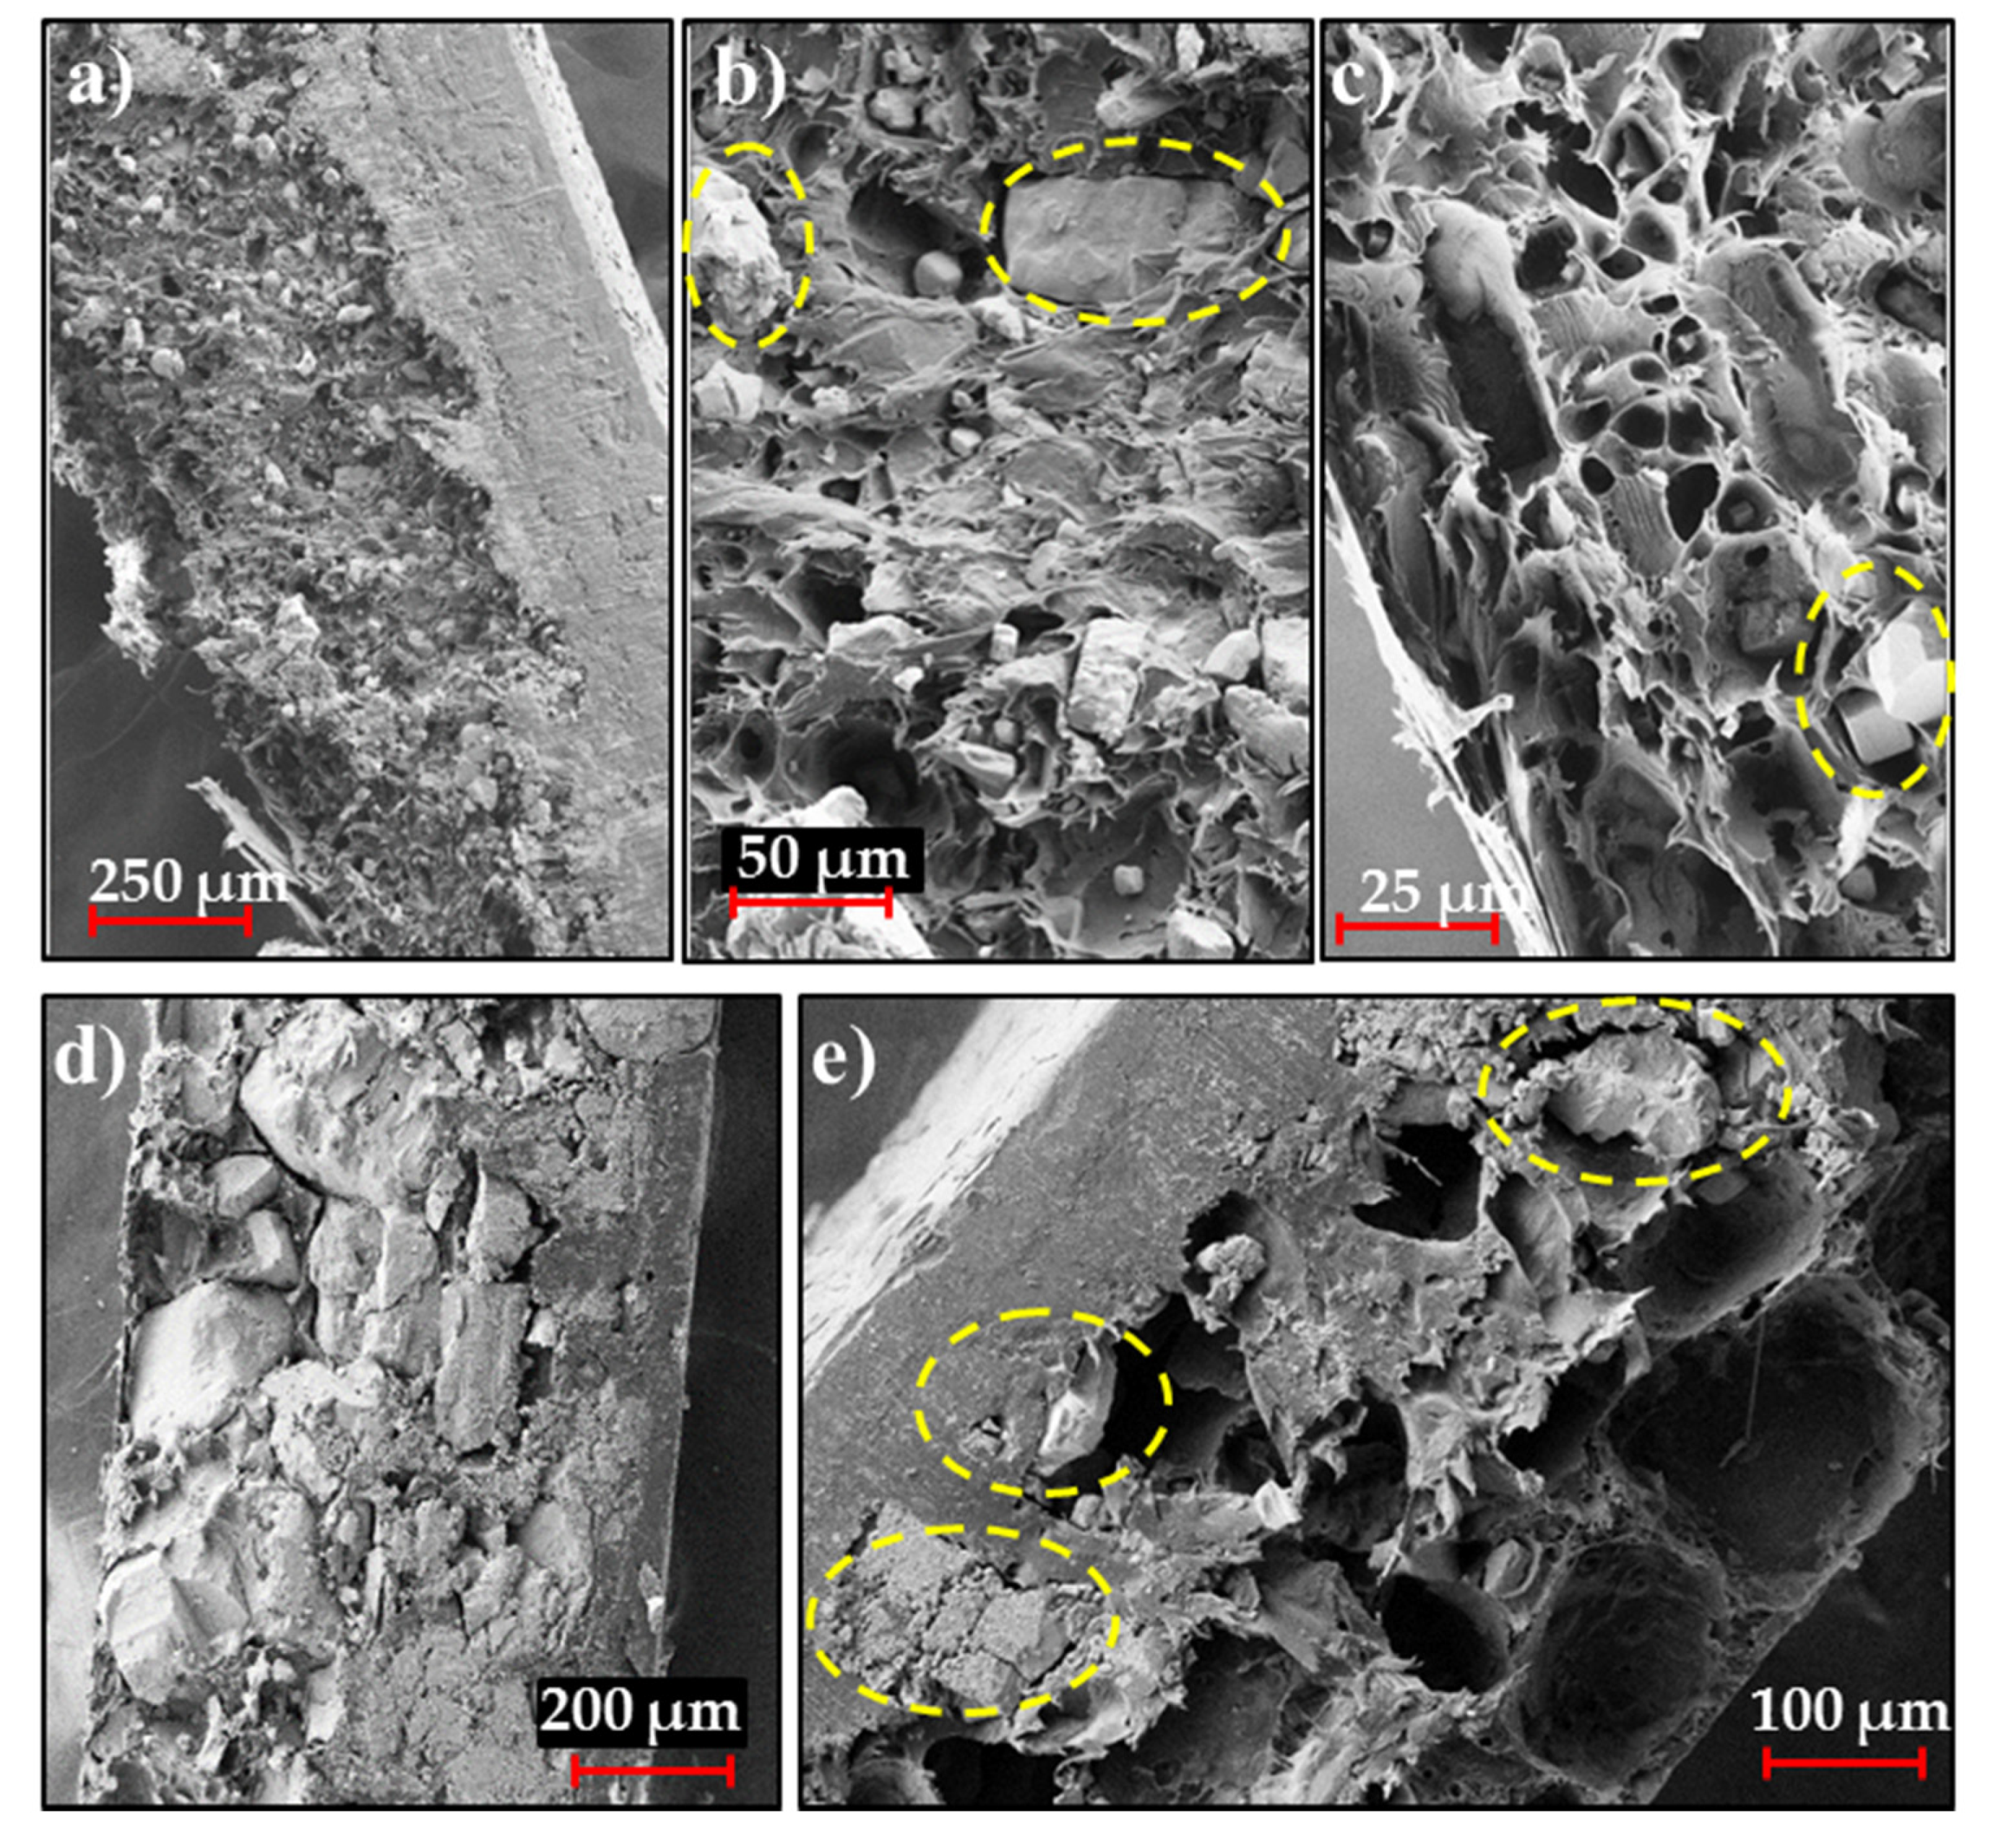
Figure 4 shows cross sections of a PLA specimen prepared under the chosen optimal conditions (i.e., amplitude, force, and time of 24 µm, 400 N, and 1.2 s, respectively), the maximum allowed amount of NaCl (i.e., 40 wt-%) for both the highest and the lowest particle size, <45 μm (Figure 4a) and 100–250 μm (Figure 4d). Salts were well encapsulated within the specimen with a minimum deposition on the specimen surface. A significant amount of salt was retained inside the specimen after the salt leaching process (Figure 4b,c,e), even when particles with the smallest dimensions were employed (i < 45 μm). Note that lower particles could be faster solubilized and that they gave rise to the smallest pore size and the maximum internal surface, which should favor the solubilization process. Nevertheless, the highly hydrophobic PLA matrix hindered water penetration and lead to an incomplete solubilization, especially when pores were isolated or not well interconnected.
In order to solve this problem and produce a proper scaffold, the PLA was blended with PEG as a hydrophilic and water-soluble polymer. This is a solution currently tested for some injection processes to improve porous interconnection when sodium chloride is used [47].
3.2. Ultrasound Micromolding of PLA/PEG Blends
In spite of PEG being employed as a sacrifice polymer and thus preservation of molecular weight and mechanical properties not being essential, an analysis of the micromolding suitability of PEG and PLA/PEG blends was undertaken, following the protocol previously done for PLA [38].
It should be noticed that the ultrasound processing of PEG and even its blends with PLA had not been previously evaluated. As such, a further study focused in processing, composition, structure and calorimetric properties of the derived micromolded specimens was carried out.
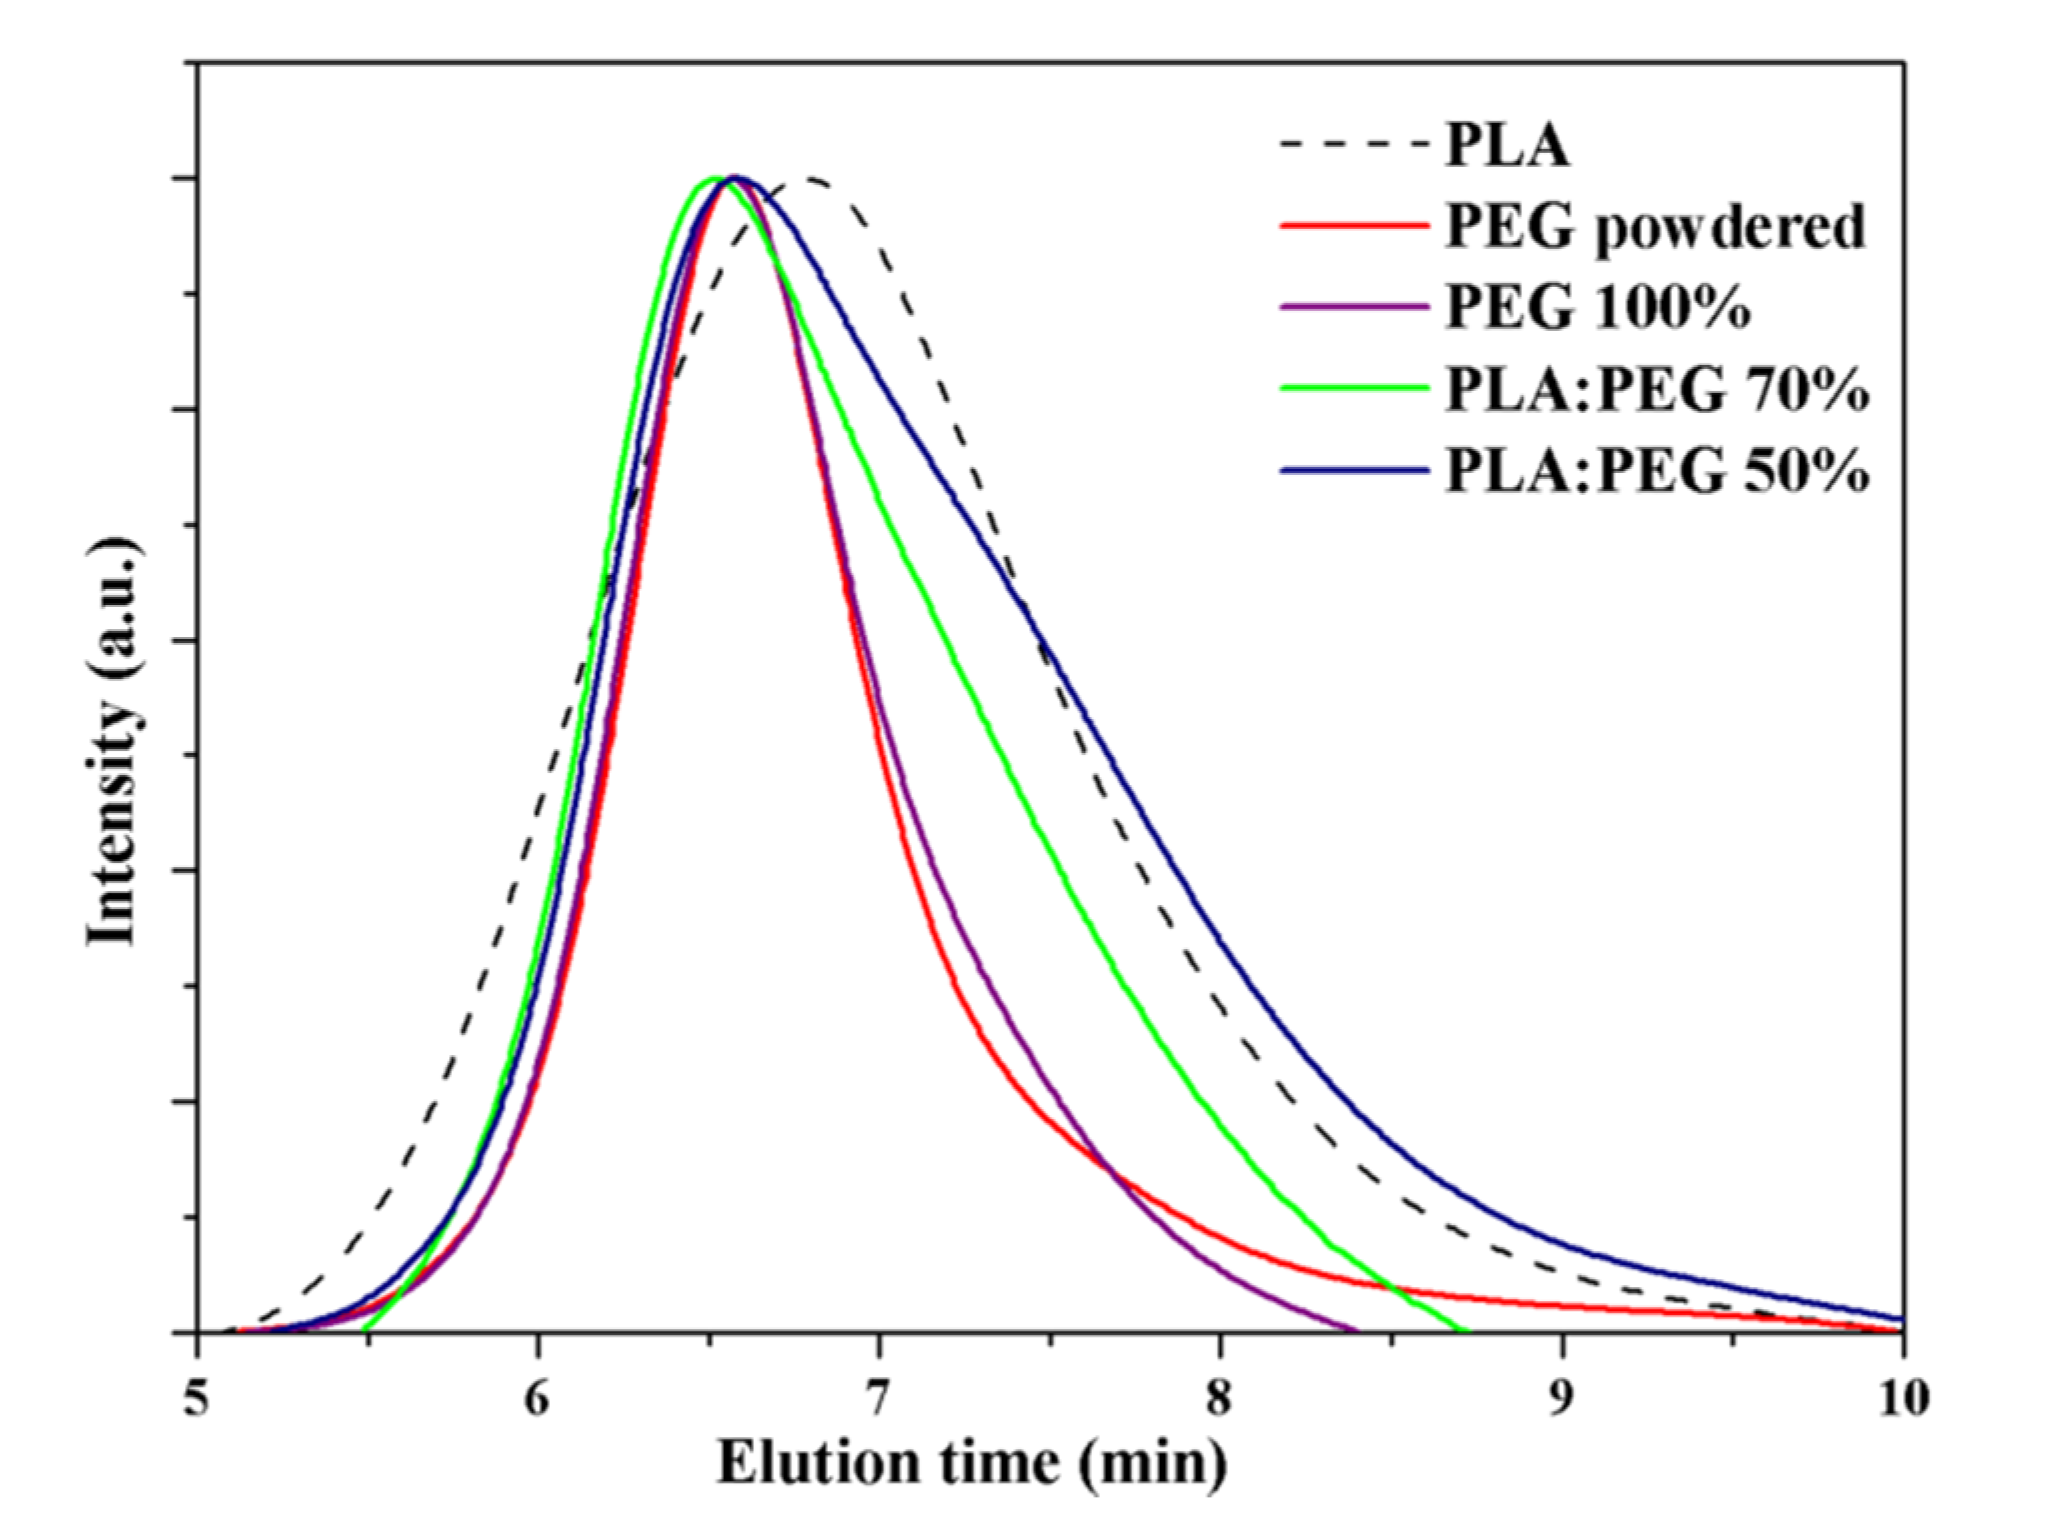
PEG samples with two distinctive molecular weights (i.e., Mw of 100,000 and 35,000 g/mol) were selected. Results pointed out that both polymers could be properly molded with the same set-up that was selected for PLA specimens (i.e., 24 µm-300 N-1.2 s). Nevertheless, specimens produced from PEG with lower molecular weight had not enough mechanical consistency and were shattered in the mold ejection step. This problem persisted even with the blend containing only 15 wt-% of PEG. In order to get perfect specimens for all compositions, the higher molecular weight sample was selected for all assays despite its higher viscosity could cause potential problems for the mixing process. Blends with 15, 30 and 50% of PEG were assayed. These blends will be referred to as: PLA:PEG 85%, PLA:PEG 70%, and PLA:PEG 50% respectively where the percentage refers to PLA content. Molecular weight of molded PEG was compared with that of the original commercial sample (i.e., before to exposition to the US heating source.) As shown in Figure 5, both GPC chromatograms were similar and the molecular weight of the molded sample was kept practically unaltered. Specifically, Mn and Mw values were 54,200 and 88,600 g/mol for the powdered PEG and 57,400 and 87,700 g/mol for the micromolded sample. GPC chromatograms were also characterized by a narrow distribution that contrasted with the relatively high polydispersity index (PI) determined for micromolded PLA (i.e., 1.5 versus 1.9). GPC chromatograms of micromolded blends were logically wider than those observed for individual polymers and for example PI reached values around 3.1 for a 50 wt-% of PEG.
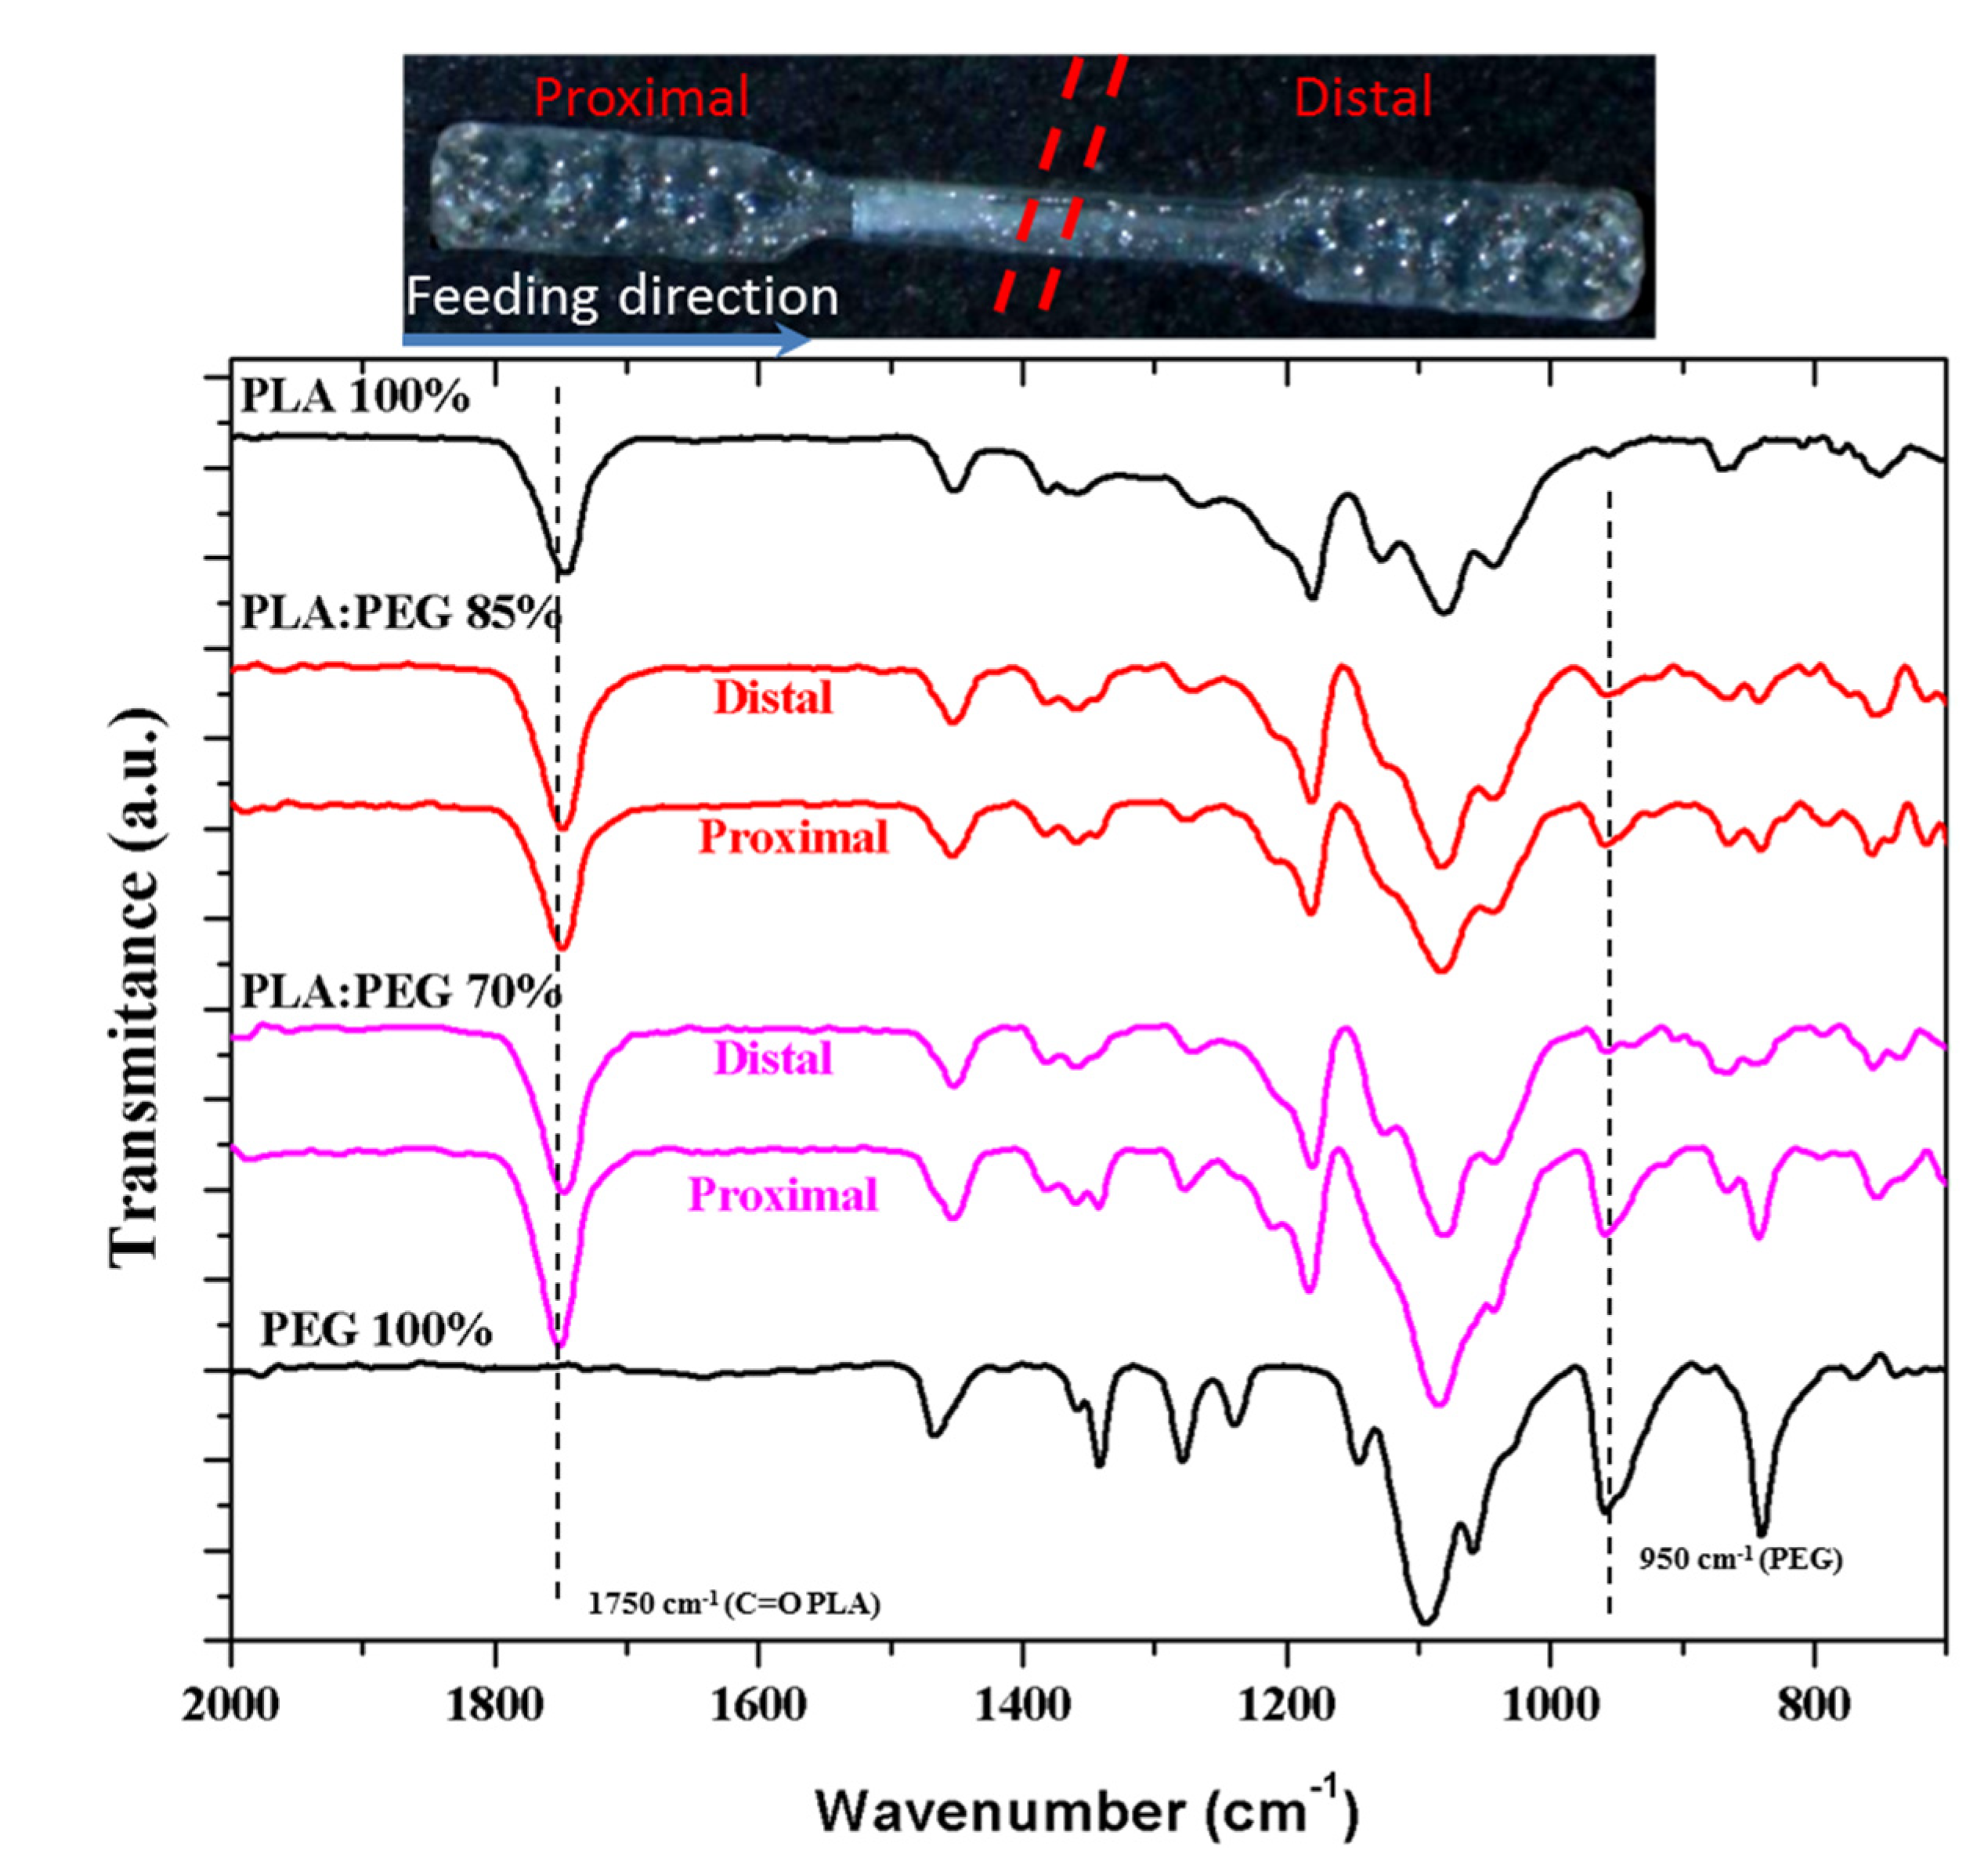
Distribution of PEG and PLA in the processed specimens could not be homogeneous due to the different flow properties of the two involved polymers caused by their different chemical structure and viscosity. This problem was evaluated by analyzing two half parts of each specimen: proximal (P) and distal (D) parts along the flow direction (Figure 6).
Figure 6 compares the FTIR spectra of micromolded specimens of PLA, PEG, and representative PLA/PEG blend with 30 wt-% and 15 wt-% of PEG. The PLA spectrum was characterized by the C=O stretching band of the ester group at 1750 cm−1, whereas PEG was characterized by the ether band at 1090 cm−1 which is also close to the C(O)-O signal of the ester PLA group. PEG had also a strong signal at 950 cm−1, which was useful to evaluate its presence since the PLA spectrum was rather clear in the 1000–900 cm−1 region.
FTIR spectra clearly demonstrated that PEG tended to be concentrated in the proximal part (i.e., the closest section from the feeding camera) as consequence of its lower fluidity (higher viscosity and higher molecular weight). Differences between proximal and distal parts become enhanced as the total PEG content in the initial blend increased. Note that a relatively homogeneous specimen was obtained for a theoretical PEG content of 15 wt-%, which contrasts with the high heterogeneity detected for the sample containing 30 wt-%.
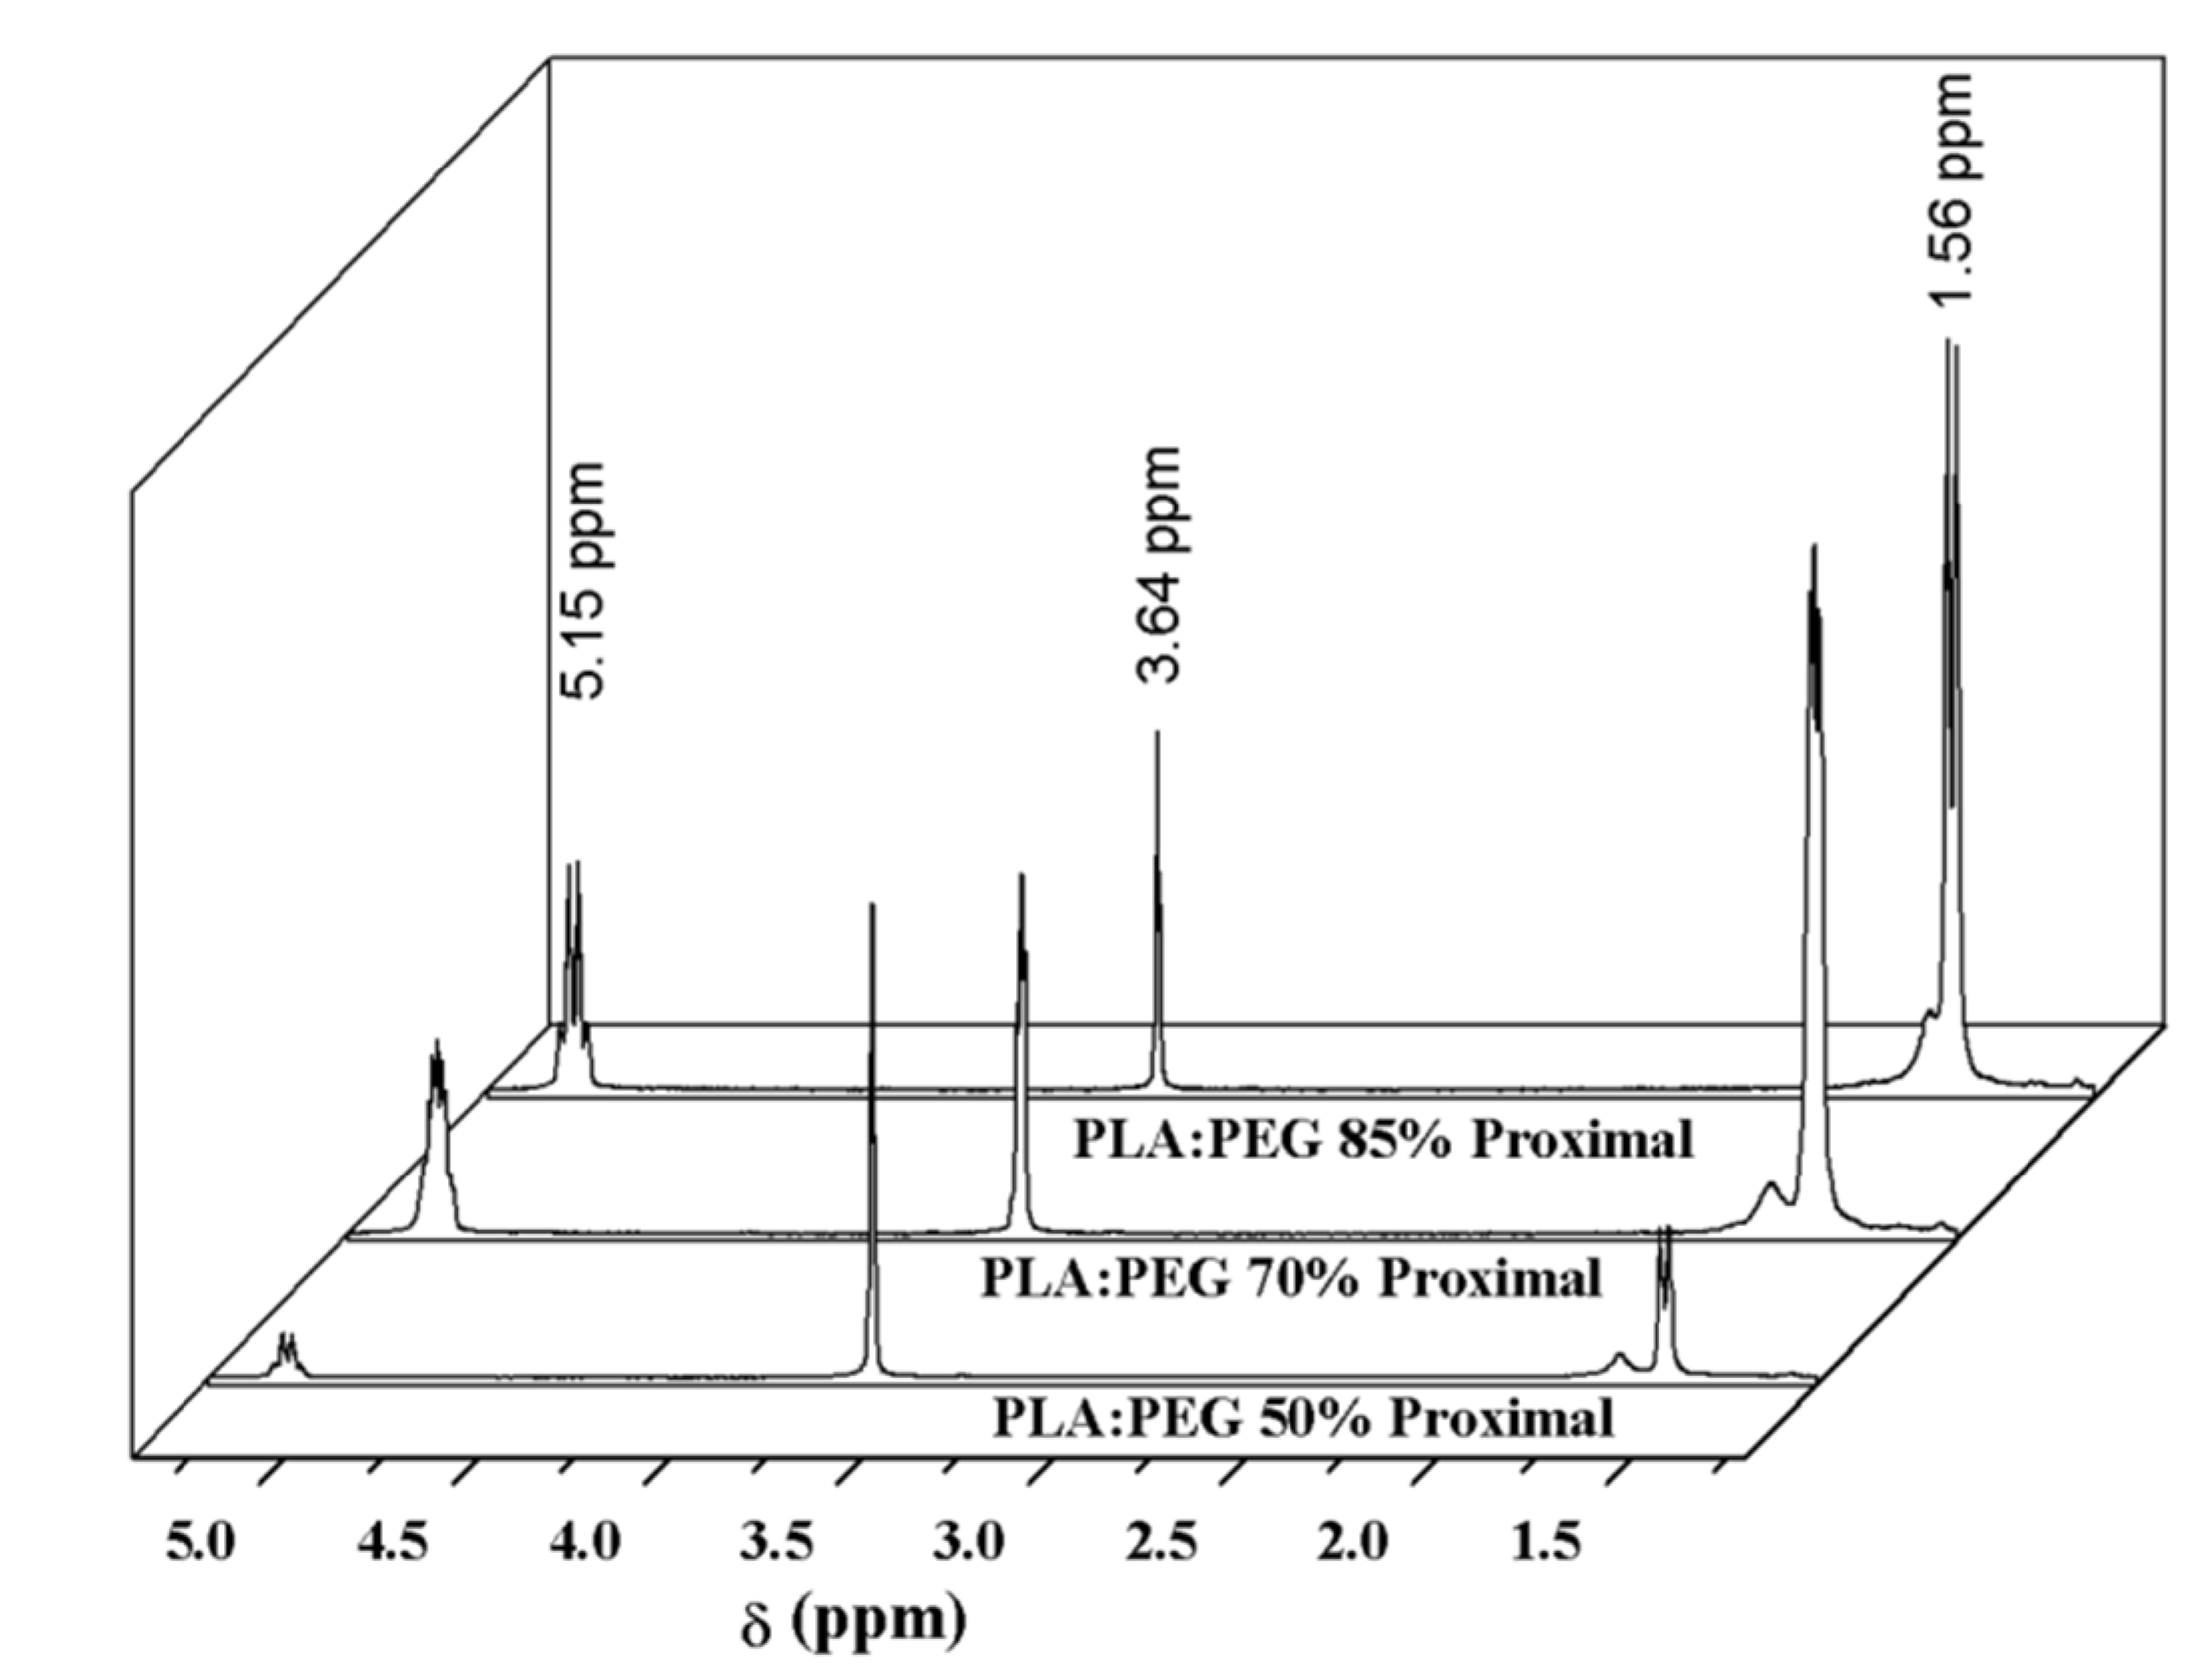
1H RMN spectra gave more quantitative results about the specimen uniformity as shown in Figure 7 and Table 2 for representative specimens obtained from mixtures containing 15 wt-%, 30 wt-% and 50 wt-% of PEG. Again, spectra were taken from the P and D parts of each processed sample.
Spectra were characterized by PLA peaks at 1.56 ppm (-CH3, d) and 5.15 ppm (-CH-, q) and the PEG peak at 3.64 ppm (-CH2-, s). Table 2 shows the value of integrated area for a representative peak of each polymer and the deduced PEG content according to Equation (5):
where A refers to the area of the indicated (subscript) NMR peak, 60 and 72 are the molecular weight (g/mol) of ethylene glycol and lactoyl repeat units, respectively.
PEG (wt-%) = 100 × (A3.64/4) × 60/[(A3.64/4) × 60 + (A1.56 /3) × 72
Differences between D and P parts were again minimized when the PEG load was low (e.g., 8.0 wt-% and 7.2 wt-% were determined for a load of 15 wt-%), while a difference close to 10 wt-% was observed for a 50 wt-% load. Maximum percentages were always lower than the expected value since the sprue was enriched on the less flowing polymer (i.e., PEG).
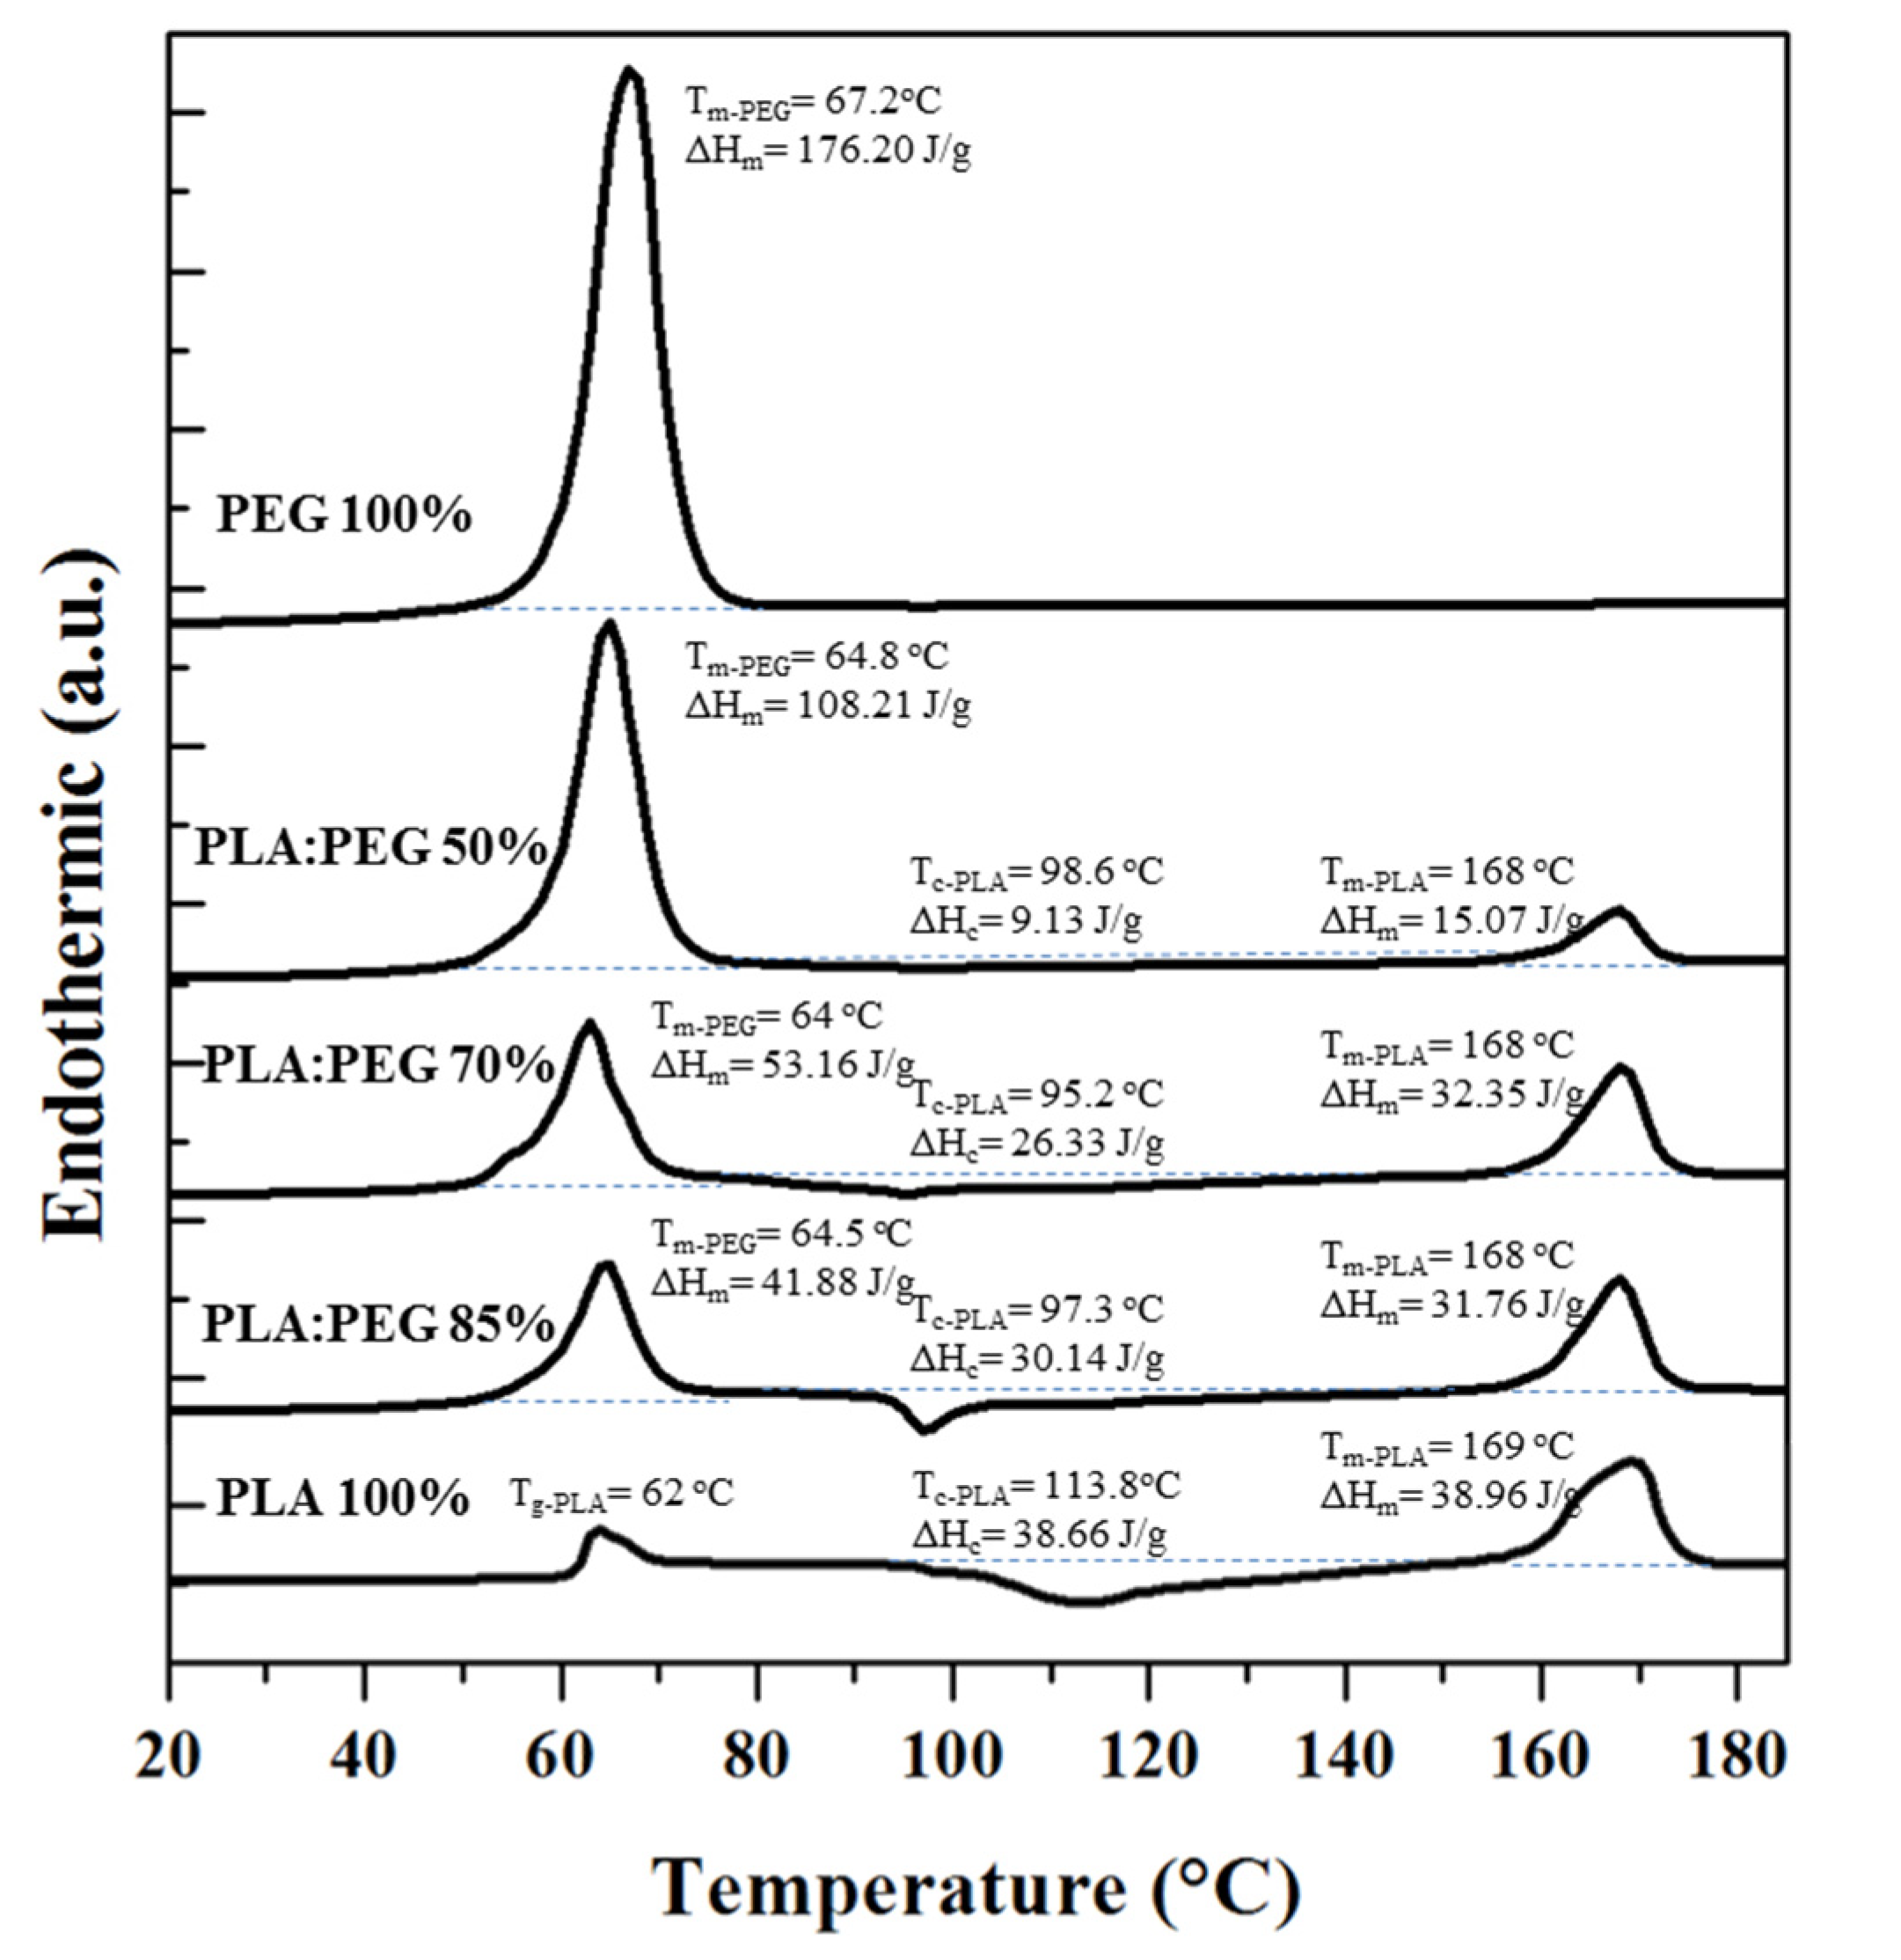
Figure 8 shows the calorimetric profiles of the first heating run of the neat PLA and PEG processed specimens, and micromolded blends with different PEG contents. The PEG profile was characterized by a sharp melting peak at 67 °C with a high melting enthalpy that pointed out the high crystallinity that could be attained (i.e., 89.6% considering the reported value for a 100% crystalline sample, 196.8 J/g [48]). PLA profile shows a glass transition temperature with a relaxation peak at 62 °C and a wide cold crystallization peak over a temperature range between 95 °C and 140 °C. The enthalpy difference between the melting and cold crystallization peaks was only 0.3 J/g, indicating that PLA was practically amorphous after the micromolding processing.
Features of PEG and PLA were distinguishable in the heating traces of the different blends, being possible to indicate the following points: (a) The PEG phase was crystalline being detected minimum changes in the corresponding temperature and enthalpy when the real PEG content was considered. Note that the melting peak appeared overlapped with the relaxation peak of PLA, being measurements more problematic for high PLA contents. (b) The temperature of the cold crystallization peak of PLA decreased with respect to that detected for neat PLA (i.e., from 114 °C to 96–98 °C), suggesting a nucleating effect of the PEG crystals. (c) The final melting enthalpy of PLA was lower than observed for the neat polymer even when the real PLA content in the processed samples was taken into account. This feature suggests that the presence of PEG crystals hindered the growth of PLA crystals and that a limited crystallinity could be achieved. More interestingly, the enthalpy difference between melting and cold crystallization peaks of PLA increased when the real PLA content was taken into account (e.g., 30.3 and 18.3 J/g for samples with 49.8%).This means that an increased percentage of PLA was able to crystallize after processing and specifically crystallinities of 12.7% and 1.9% could be estimated for specimens having PLA contents of 49.8 wt-% and 92 wt-% (i.e., those coming from theoretical blends with 50 wt-% and 85 wt-% of PLA).
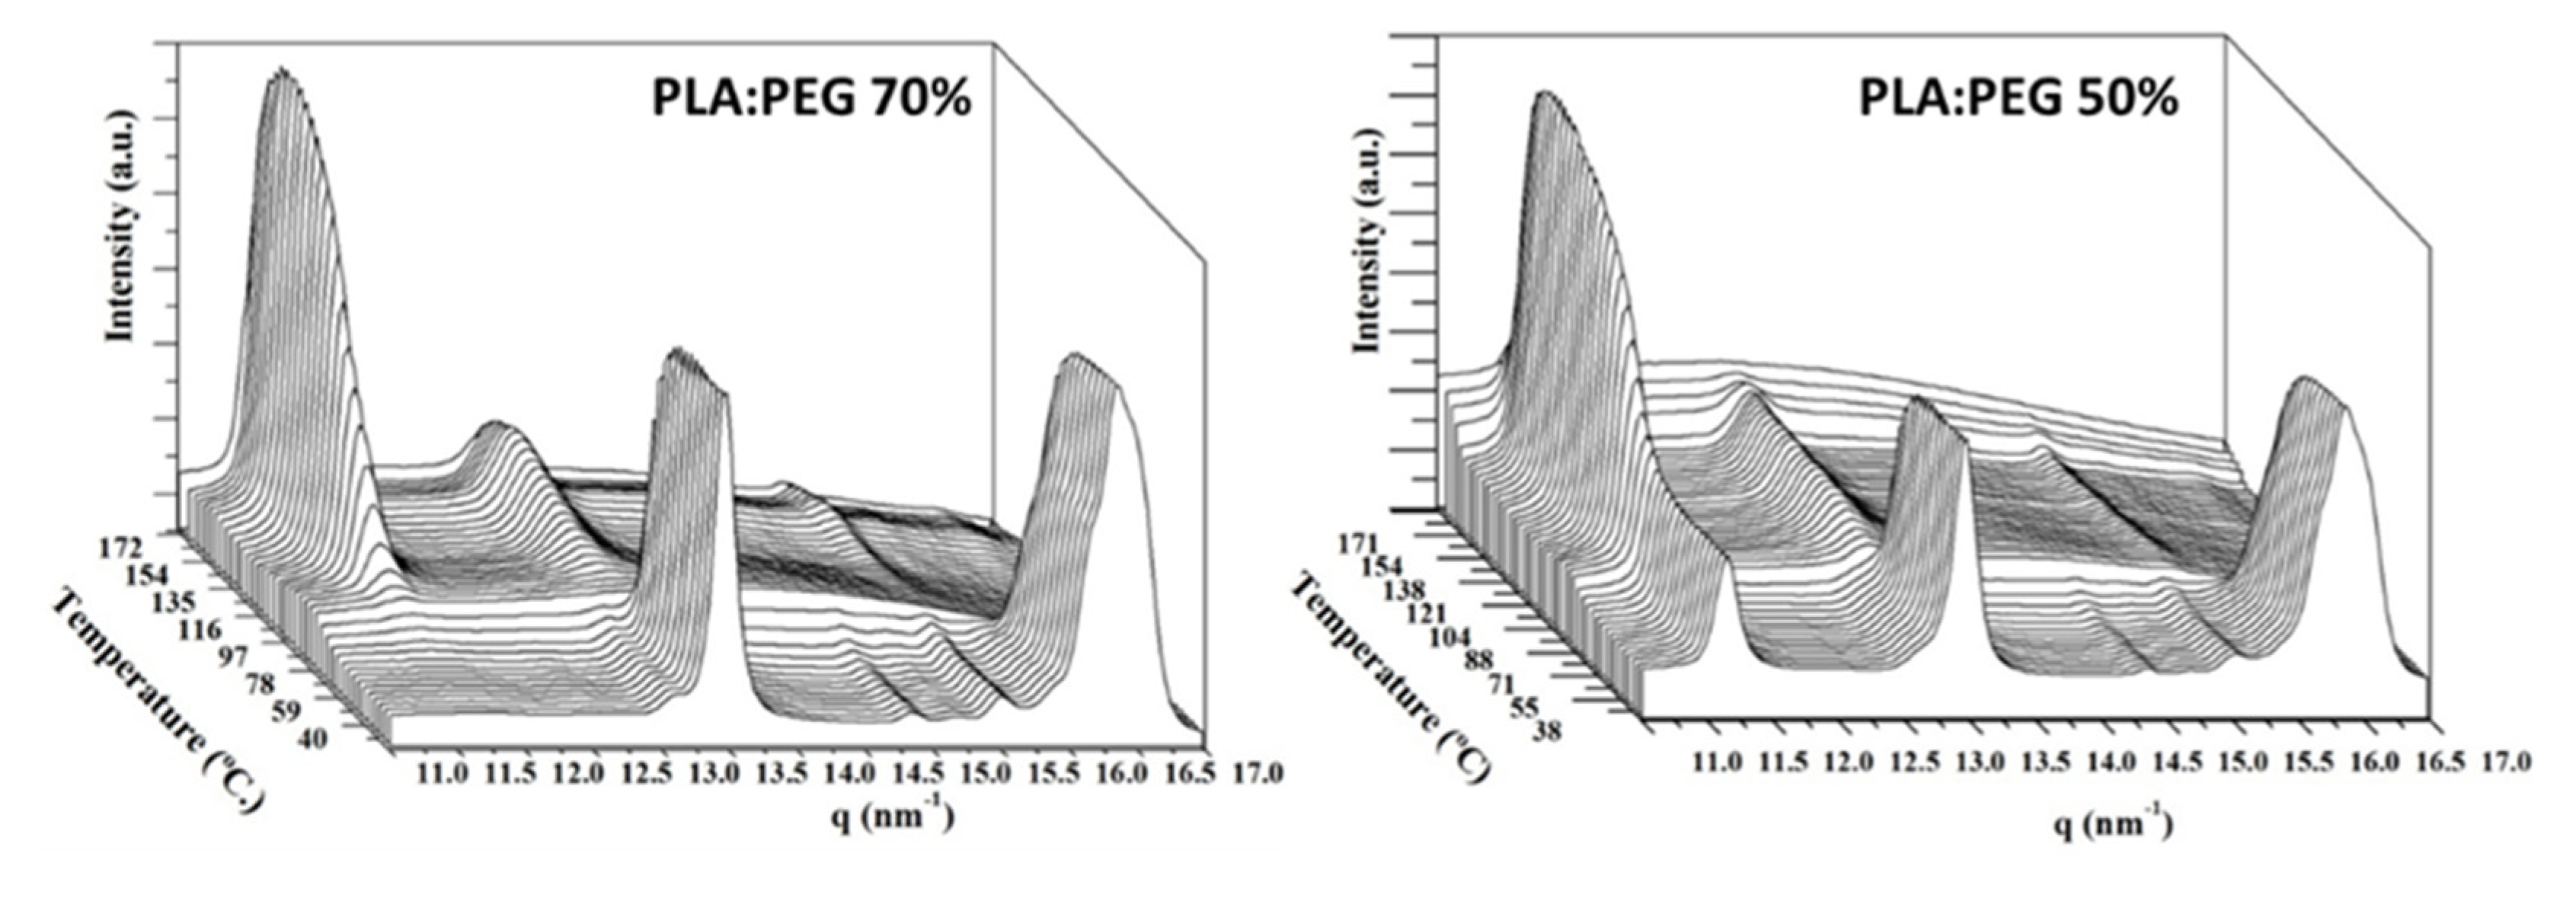
In order to get a further evaluation of the effect of PEG in the PLA crystallization during processing, micromolded specimens were analyzed by wide angle X ray diffraction (WAXD) in a heating scan performed at a rate of 10 °C/min (Figure 9).
X-ray diffraction profiles of selected samples: PLA:PEG 70% and PLA:PEG 50% were recorded during the heating process and the corresponding graphs of 3D evolution are shown in the Figure 9. Peaks around 13.5, 14.8 (low intensity), 15.6 (low intensity), and 16.5 nm−1 were related to PEG, and clearly appeared in both cases indicating a high crystallization degree at room temperature. Peaks at 11.5, 13.3, and 15.5 (low intensity) were assigned to PLA. At room temperature PLA is mainly amorphous before cold crystallization in the PLA:PEG 70% sample whereas some degree of crystallization could be observed in the PLA:PEG 50% sample. Note that the main peak of PLA at 11.5 nm−1 is observed at room temperature, in agreement with DSC results. The presence of PEG during molding process increased the PLA crystallinity of the as-molded specimen. In both cases the increase in intensity of PLA peaks during the cold crystallization, from 100 °C, and the decrease of PEG peaks during melting process, around 70 °C, could be appreciated.
3.3. Ultrasound Micromolding of PLA:PEG:NaCl Mixtures. Salt Leaching and Scaffold Characterization
PLA:NaCl mixtures with salt contents lower that 50 wt-% could be micromolded under the previously determined conditions (i.e., amplitude, force and time of 24 µm, 400 N and 1.2 s, respectively) without a significant degradation. Namely, GPC curves showed only a minor molecular weight loss for the PLA component as above discussed for the PLA:NaCl specimens (Figure 3). Scaffolds were therefore prepared with PLA, PEG and NaCl contents of 50 wt-%, 10 wt-% and 40 wt-% (abbreviated as PLA:PEG-10:NaCl-40), respectively, and a NaCl particle size lower than 45 µm in order to favor the leaching process. PEG content was found enough to dissolve the salt as demonstrated by thermogravimetric analyses. Note also that the low PEG percentage (i.e., 10 wt-%) should lead to a relatively homogeneous distribution of both polymers in the specimen.
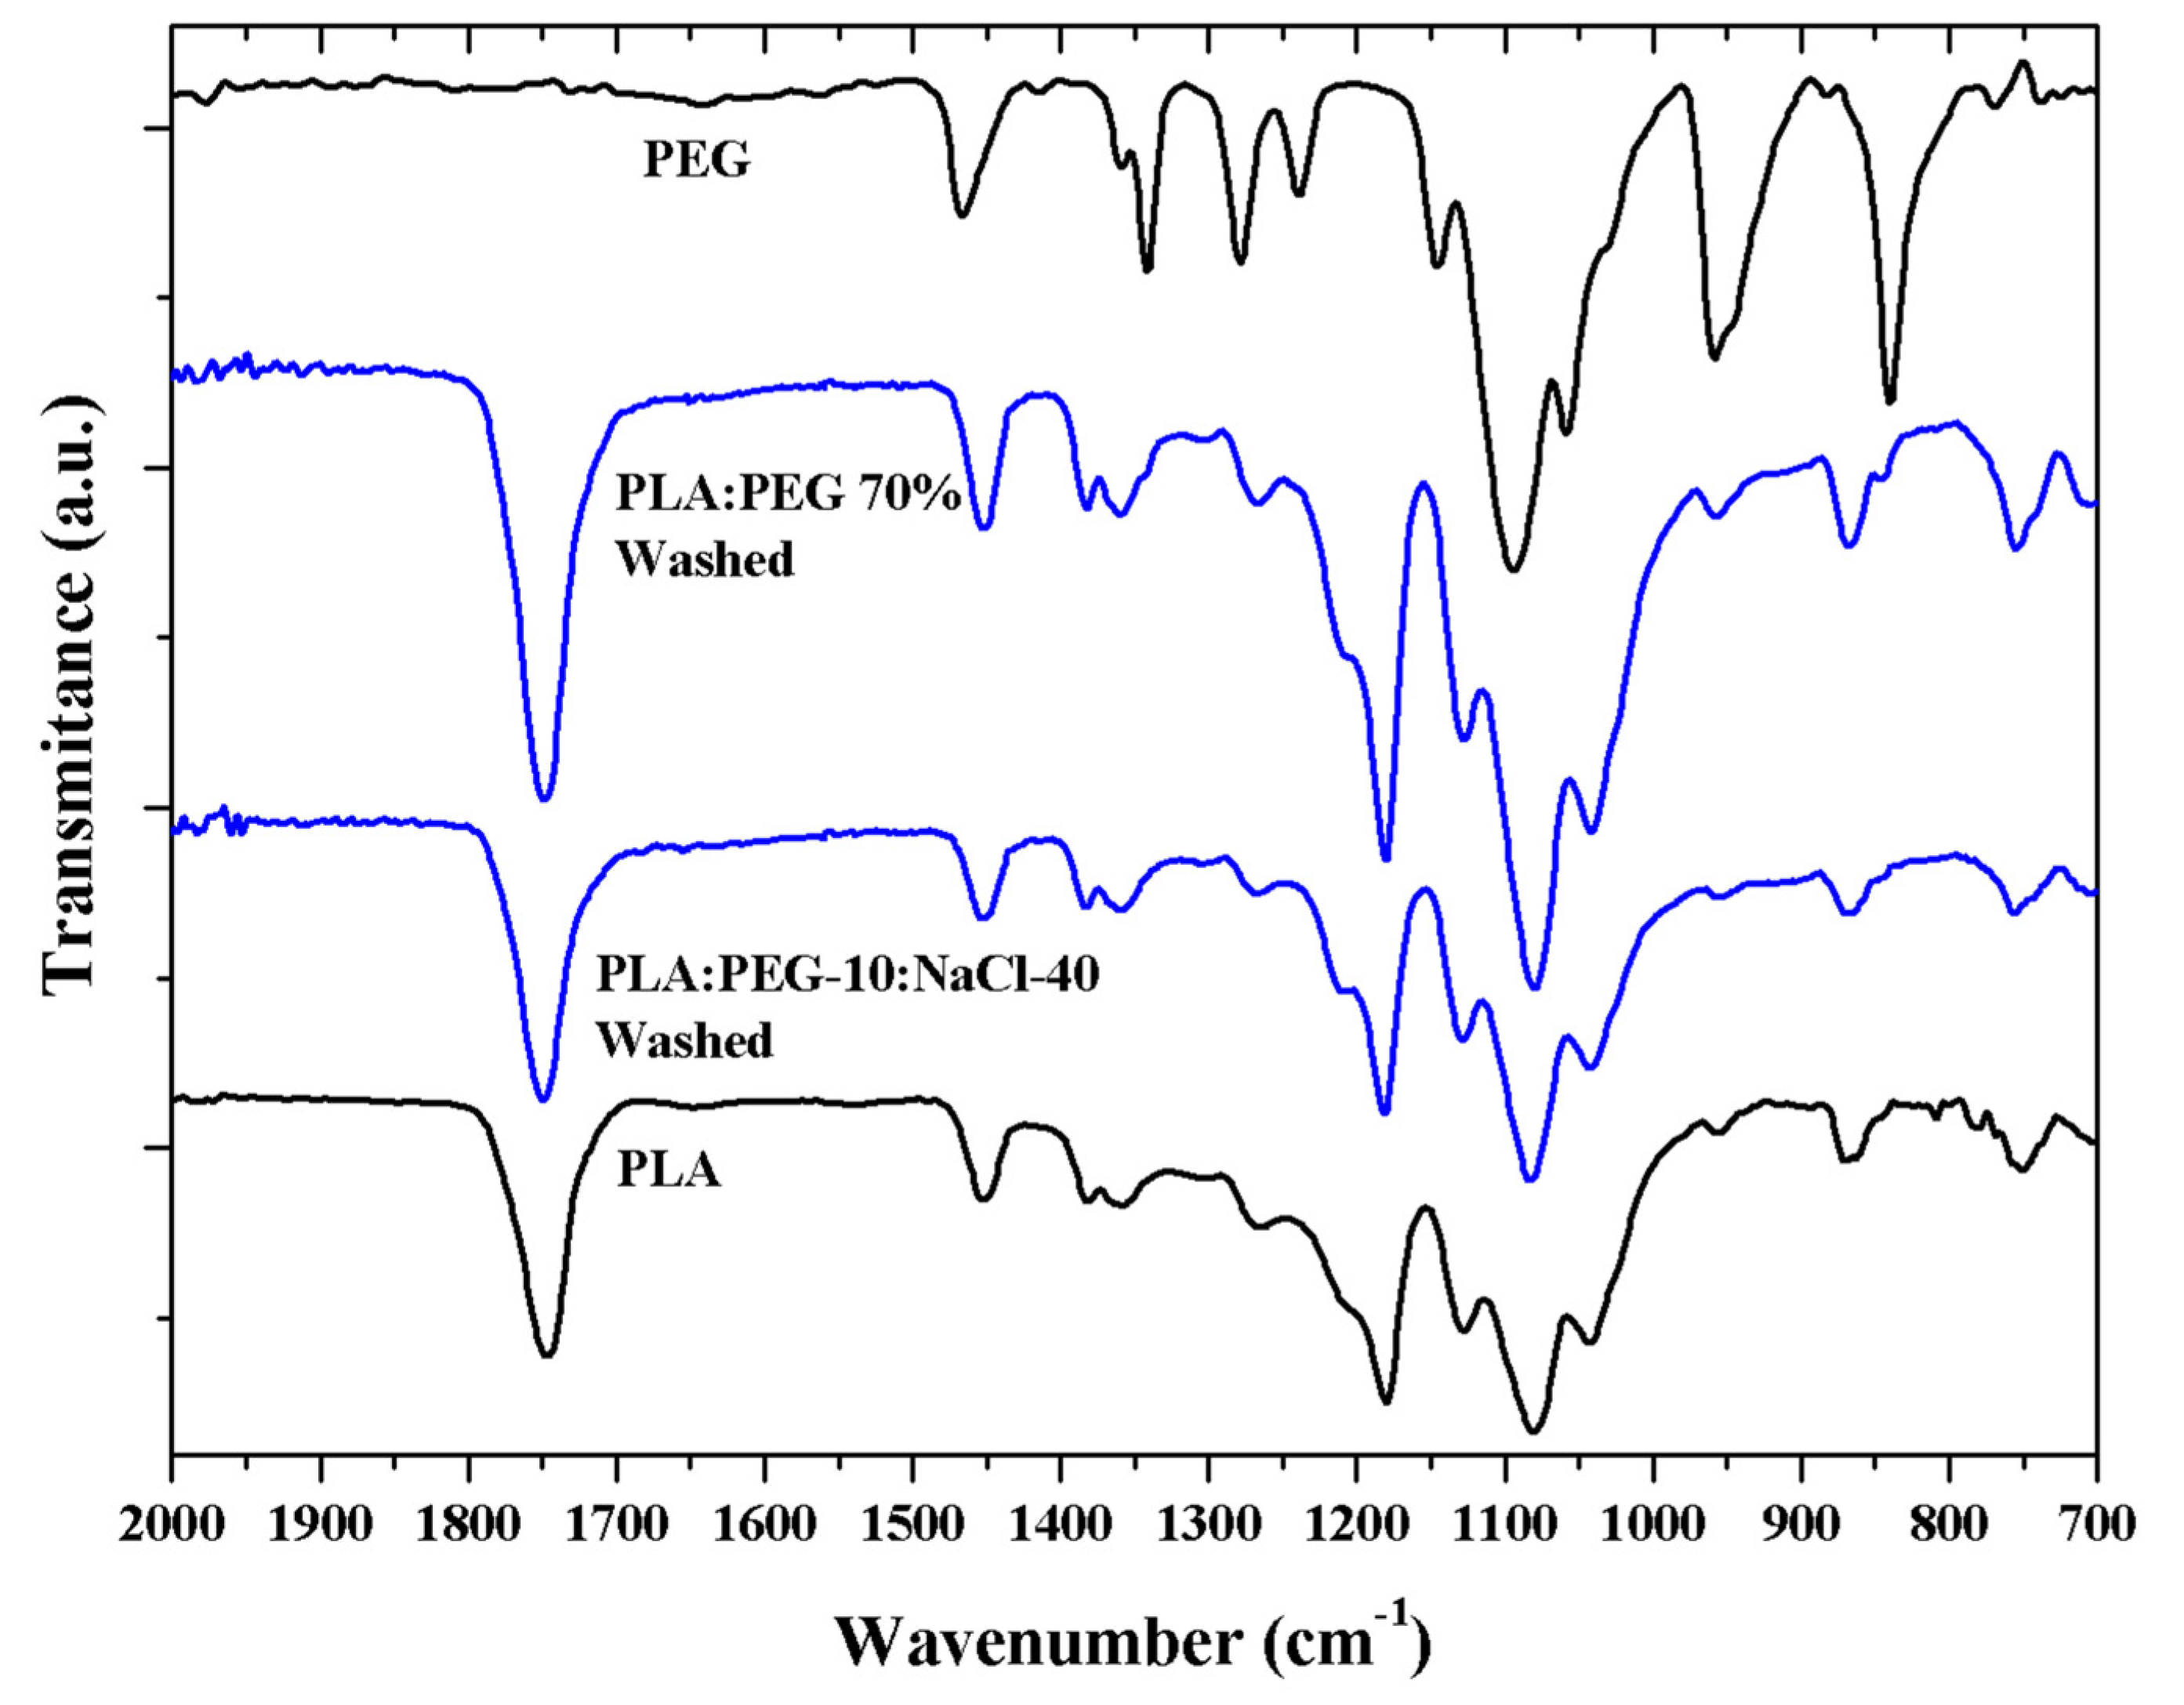
FTIR spectra (Figure 10) clearly indicated that PEG could be effectively removed after immersion of micromolded specimens for 1 day into water. Results were positive for both selected PLA:PEG 70% and PLA:PEG-10:NaCl-40 specimens.
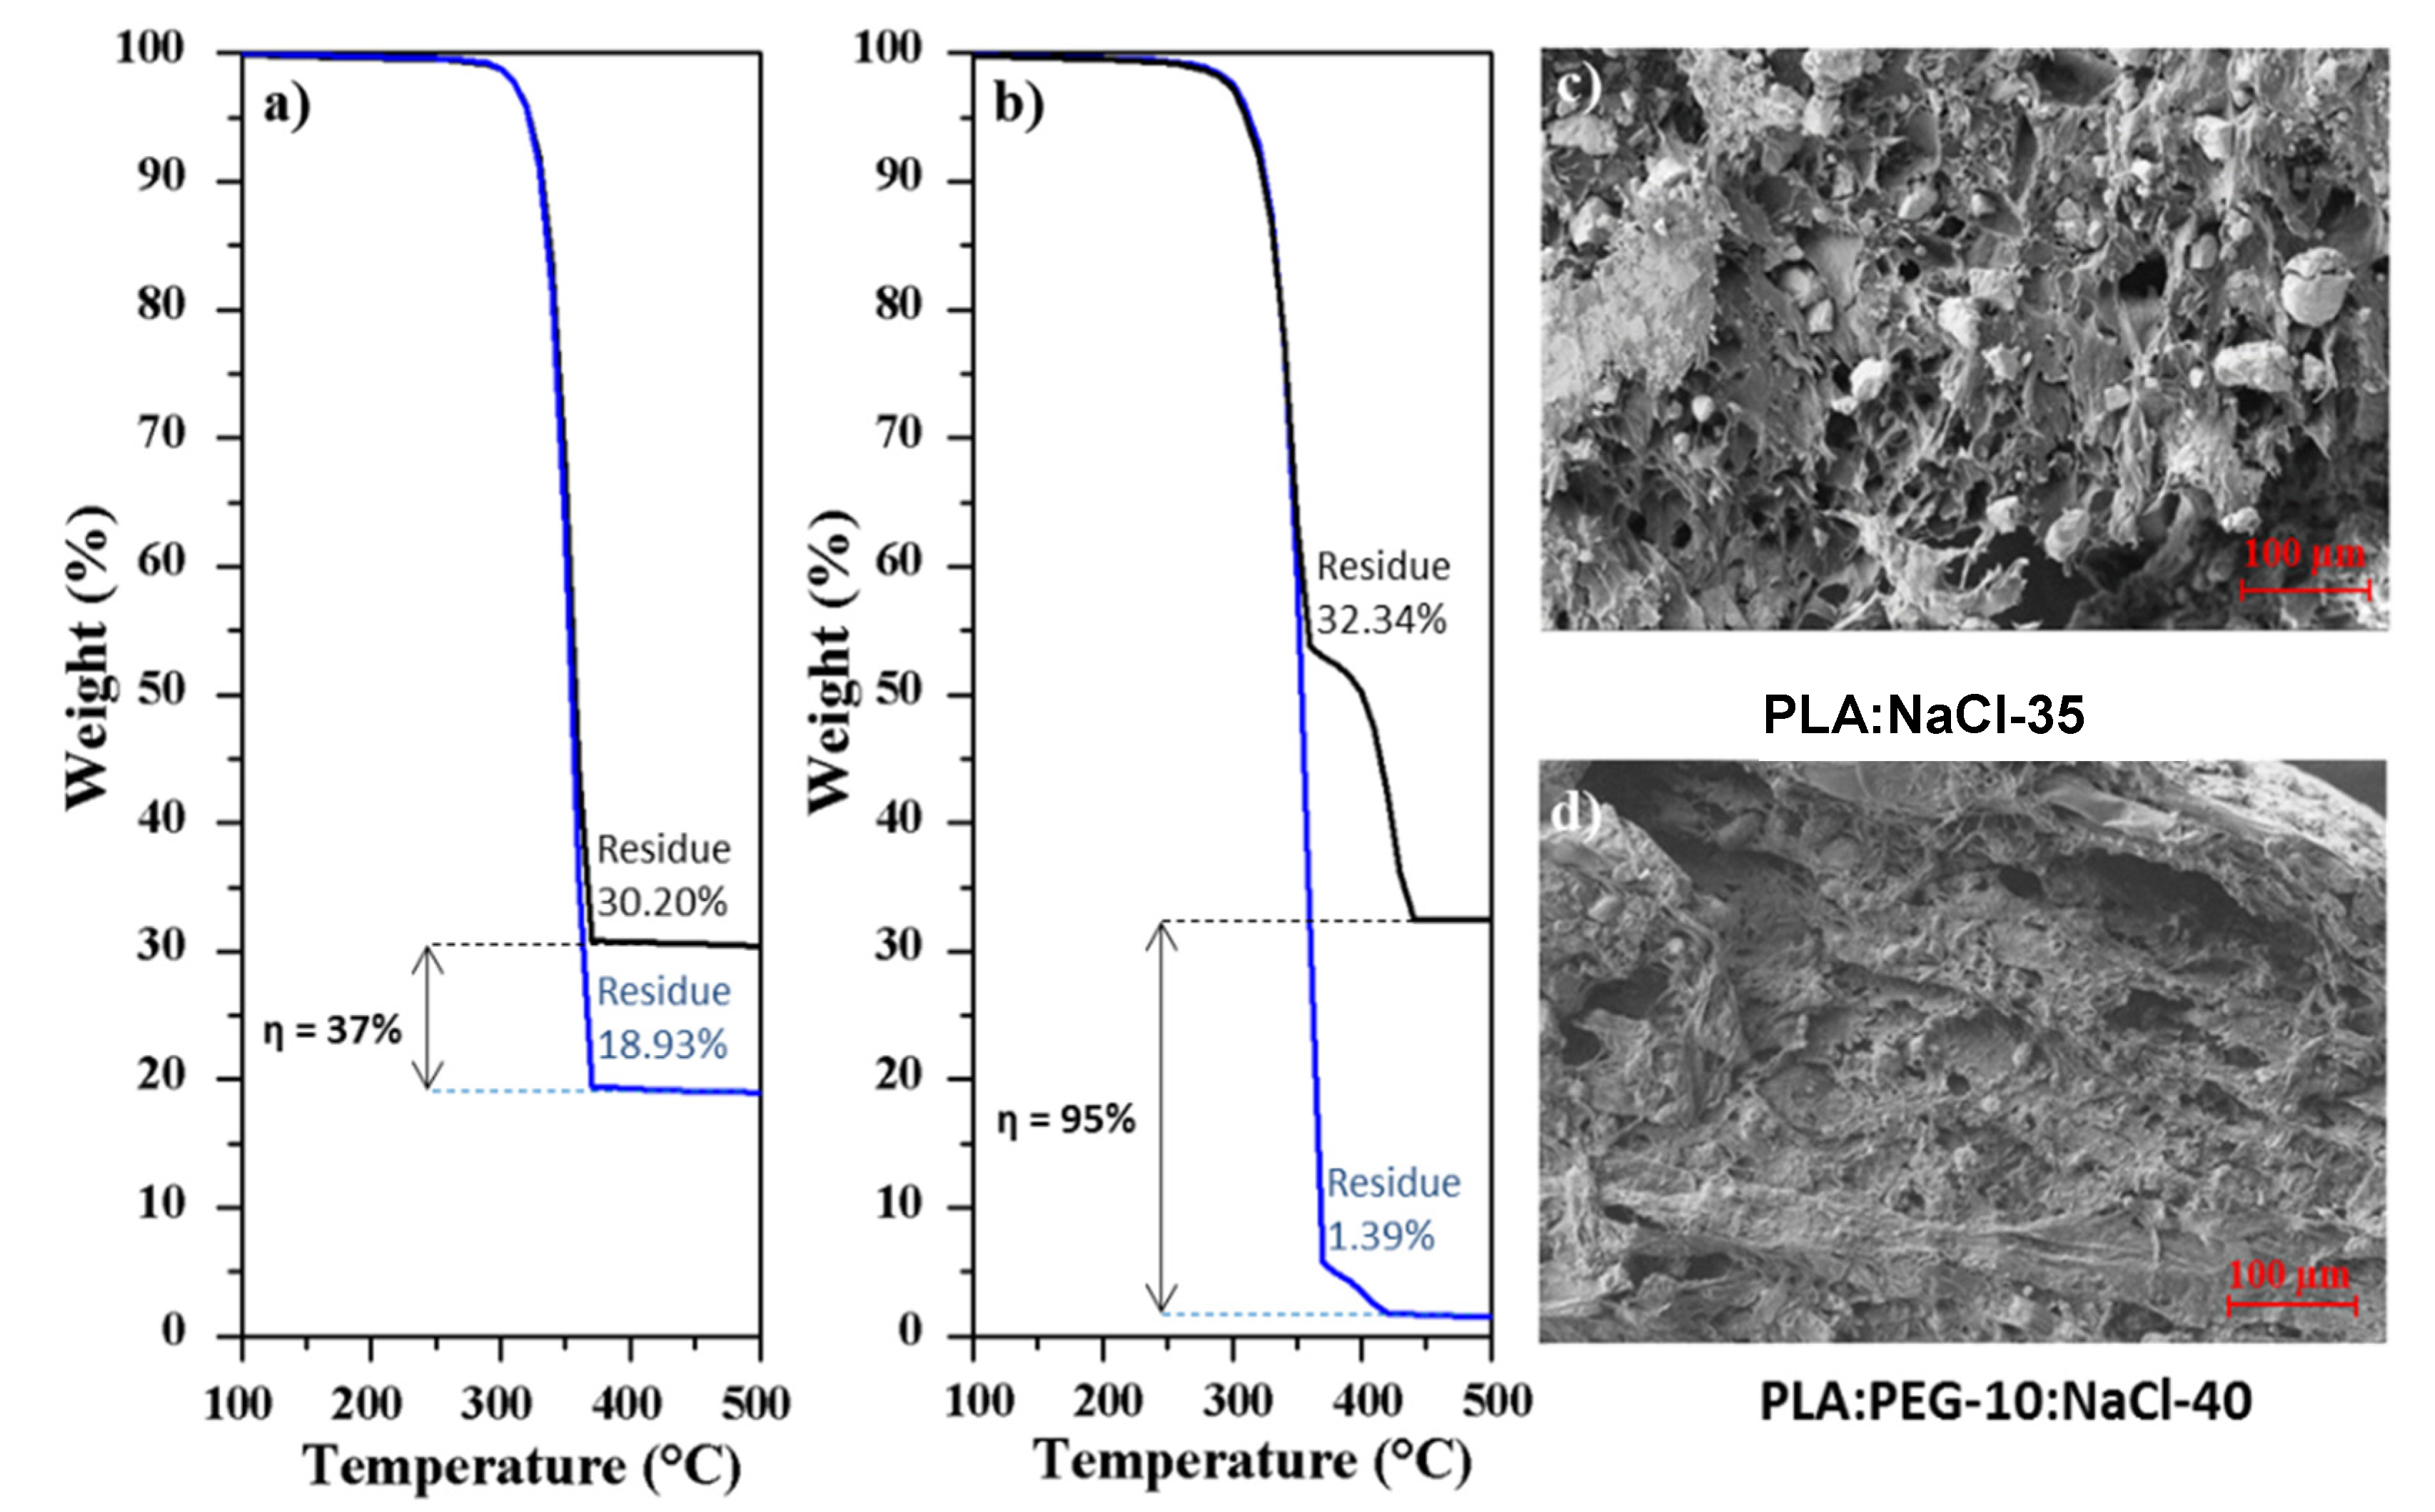
Thermogravimetric (TGA) assays were useful to quantify the amount of NaCl incorporated in the processed specimens, since the residue determined after heating the samples up to 600 °C should be associated to the salt content due to the expected polymer decomposition. Figure 11a shows TGA curves of two representative specimens before and after the washing process. In the case of the PLA:NaCl-35 sample the TGA curve was characterized by a single decomposition step with a maximum at 370 °C, which is associated to the PLA decomposition [49] and a high residual weight. This is nevertheless lower that the theoretical salt content (i.e., 30.2% with respect to 35%), suggesting that the flow of NaCl was hindered and consequently the salt was preferably located in the sprue. This feature was corroborated also from the 40% char yield determined from TGA experiments performed with the sprue (not shown). Char yield decreased to 18.9% after the washing process, a value that was significant and indicative of a considerable amount of NaCl retained in the specimen. In this case the effectiveness of the leaching process was only 37%.
Figure 11b demonstrates the effectiveness of the leaching process (e.g., 95%) when PEG was incorporated. The TGA curve of the non-washed samples showed two decomposition steps associated to PLA and PEG at 370 °C and 430 °C (423 °C is the value reported in the literature for PEG [50]) and a high residue that was lower, as expected, than the theoretical value. After washing, salt was practically eliminated, and a small trace of PEG could still be detected.
In addition to the residue quantification by the TGA assay, a visual inspection of SEM micrographs showed that the internal surface of PLA:PEG-10:NaCl-40 specimens after washing (Figure 11d) was rough and porous and practically free of NaCl particles. A clear contrast exists in related specimens where PEG was not incorporated (Figure 4c and Figure 11c).
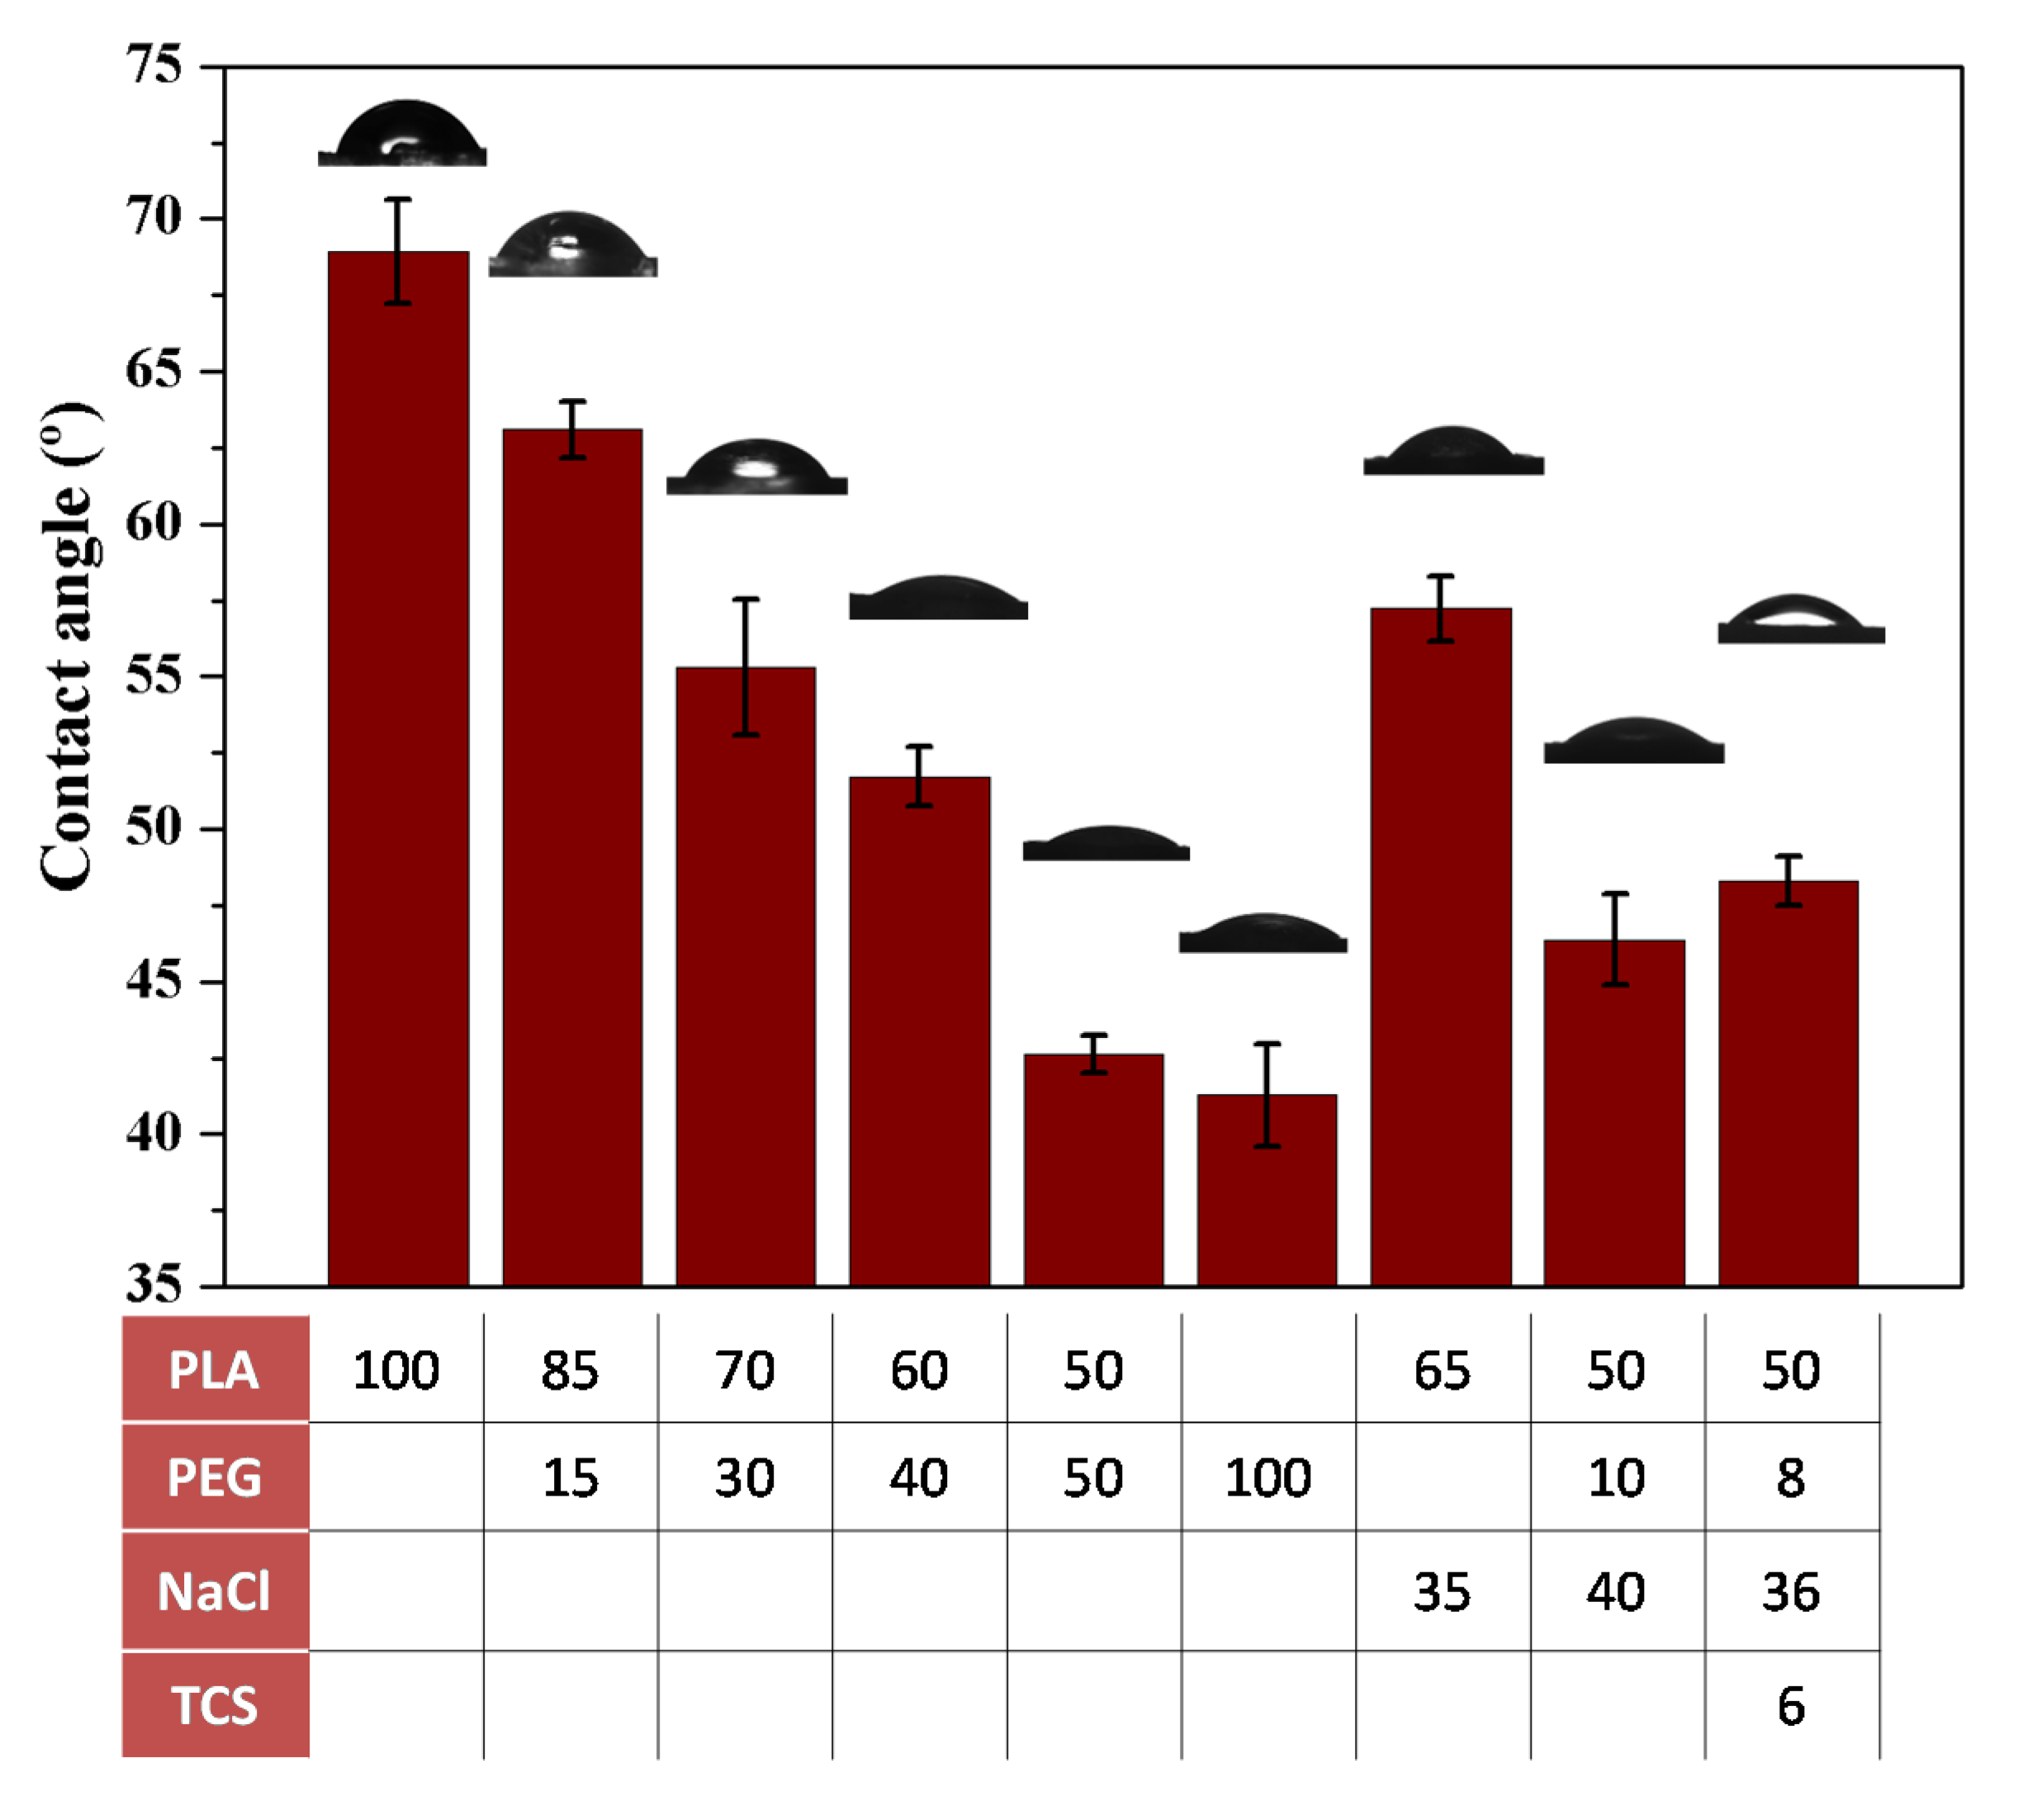
Hydrophilicity of the specimen surface is an important factor that favors the salt leaching process to get a porous scaffold. Contact angle measurements of representative ultrasound processed samples are shown in Figure 12.
The initial PLA specimen was characterized by an angle of 69°, which is low probably as a consequence of the relatively low molecular weight of selected PLA (effect of terminal groups) and the smooth surface of processed samples. In fact, angles close to 90–100° are usually determined for PLA due its hydrophobic character, instead higher contact angles of 131.9° were reported for PLA electrospun scaffolds [51]. Recently, it has been discussed that the geometry of the surface can influence the measurements of the contact angles [52]. Incorporation of PEG clearly diminishes the contact angle being observed a regular evolution with the composition. The value of 43° measured for a 50 wt-% content of PEG is close to the asymptotic angle of 41° evaluated for PEG. Results clearly indicated that the specimen was hydrophilic at the selected PEG content, allowing the water penetration. It is also important to note that the incorporation of NaCl caused an important decrease of the contact angle and specifically a decrease from 69° to 57° was determined when the specimen was loaded with a 35 wt-% of NaCl. In summary, selected PLA:PEG-10:NaCl-40 specimens were clearly hydrophilic with a contact angle of 46° that approaches also to the minimum value expected for a PEG sample.
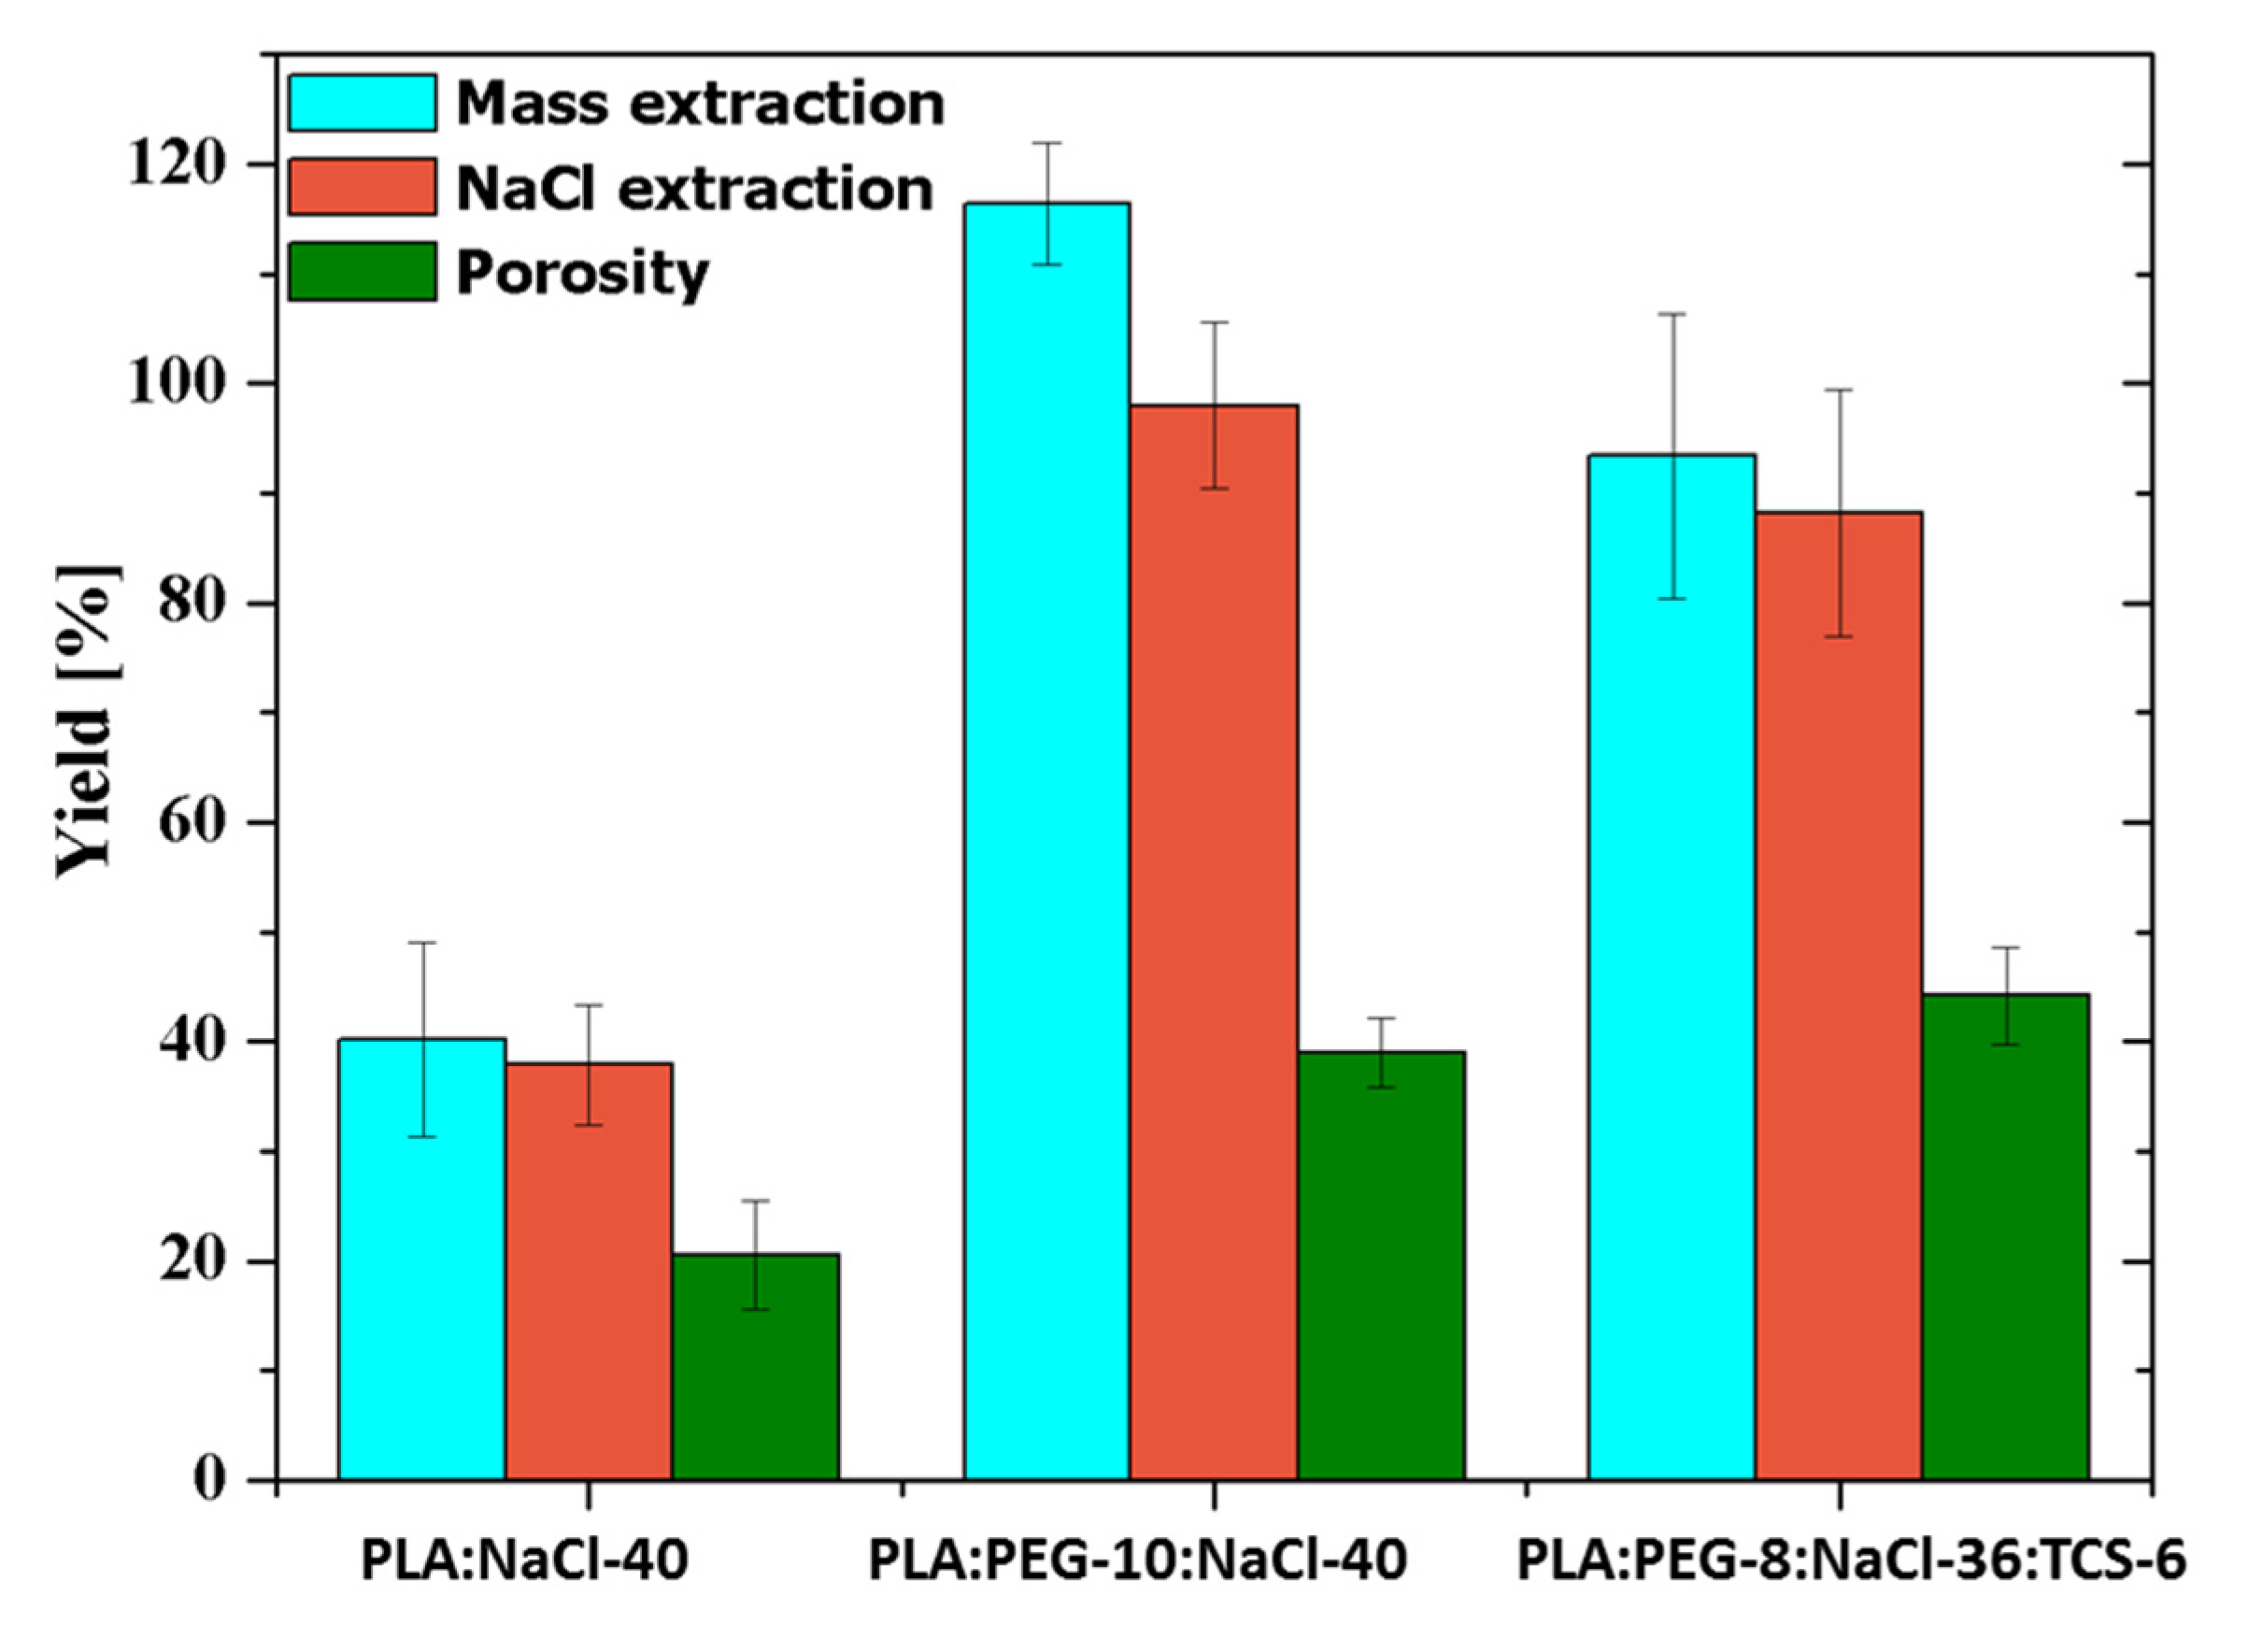
Figure 13 compares the porosity, total mass extraction and NaCl extraction yields of representative samples with and without PEG. Samples loaded with the antibacterial drug, PLA:PEG-8:NaCl-36:TCS-6 is also considered. The incorporation of PEG allowed to increase the porosity from 20% to 40–42%, a feature that demonstrates the significant role displayed by the soluble PEG to increase pore connection and enhance NaCl extraction. The extraction yield for PLA:NaCl-40 samples was lower than 40% while values around 90–98% were found for PLA:PEG-10:NaCl-40 and PLA:PEG-8:NaCl-36:TCS-6. In the case of the PLA:PEG-10:NaCl-40 sample, the difference between total mass extraction and NaCl extraction was higher than expected considering the amount of PEG. This point suggests that some PLA was lost during the leaching process probably as a consequence of dragging. It should also to be pointed that 2–3.5% of NaCl could still be present in the PLA:PEG-8:NaCl-36:TCS-6 sample according to the extraction yield.
3.4. Antibacterial Micromolded Scaffolds
An antibacterial scaffold was produced by introducing 6 wt-% of triclosan (TCS) to the previous formulation found out, namely combining the use of PEG and NaCl to obtain a proper pore interconnection and high porosity density. As concluded in the previous work [38]. TCS can be incorporated in the ultrasound micromolding of PLA without causing an appreciable degradation. Antibacterial scaffolds were therefore prepared with a PLA:PEG:NaCl:TCS mixture having 50 wt-%, 8 wt-%, 36 wt-% and 6 wt-% of each component, respectively (abbreviated as PLA:PEG-8:NaCl-36:TCS-6). GPC measurements indicated as previously explained a slight decrease on the PLA molecular weight (i.e., Mn = 39,400 g/mol). The porosity achieved after immersion on water was similar to that observed for the evaluated PLA:PEG-10:NaCl-40 scaffold. The incorporation of the hydrophobic TCS was performed through the slight decrease on the content of hydrophilic PEG and NaCl components, which may alter the surface characteristics of the molded specimens. However, contact angle measurements indicated a minimum increase from 46° to 48° (Figure 12) and consequently samples showed a good wettability as desired for a delivery application. Drug release, bacterial growth and cell proliferation assays were carried out to evaluate the bactericide and potential tissue engineering applications of the new processed scaffolds.
Release experiments were firstly carried out in a PBS medium. Less than 0.2% of the TCS loaded in the specimen was released (profile not shown) due to the poor solubility of TCS. Therefore, a PBS-ethanol mixture containing 70% ethanol was used as a release medium, the presence of ethanol increased the medium hydrophobicity and enhanced the TCS solubility. It has also been reported in previous works that this medium with an ethanol supplement could simulate the release of TCS in a physiological medium with serum supplementation [53,54].
As show in Figure 14 the drug release profile of the antibacterial scaffold (black line) was characterized by a first burst release. Thus, 56% of the loaded TCS was delivered in less than 10 h. A sustained release for a period longer than 150 h was subsequently observed. This release was defined for a first order kinetic profile with a k1 value of 0.019 h−1. As a comparison the release profile of a non-porous PLA specimen with the same TCS load is also shown in Figure 14 (blue line). A burst release was not observed, indicating that less accessible surfaces for an immediate release were available. Furthermore, only 40% of TCS was released after 150 h of exposure, a value that clearly contrasts with the 84% reached with the porous sample. It is clear that the presence of a high density of pores has a dramatic effect and a considerably improvement of the TCS release, which should led to specimens with bactericide activity [38].
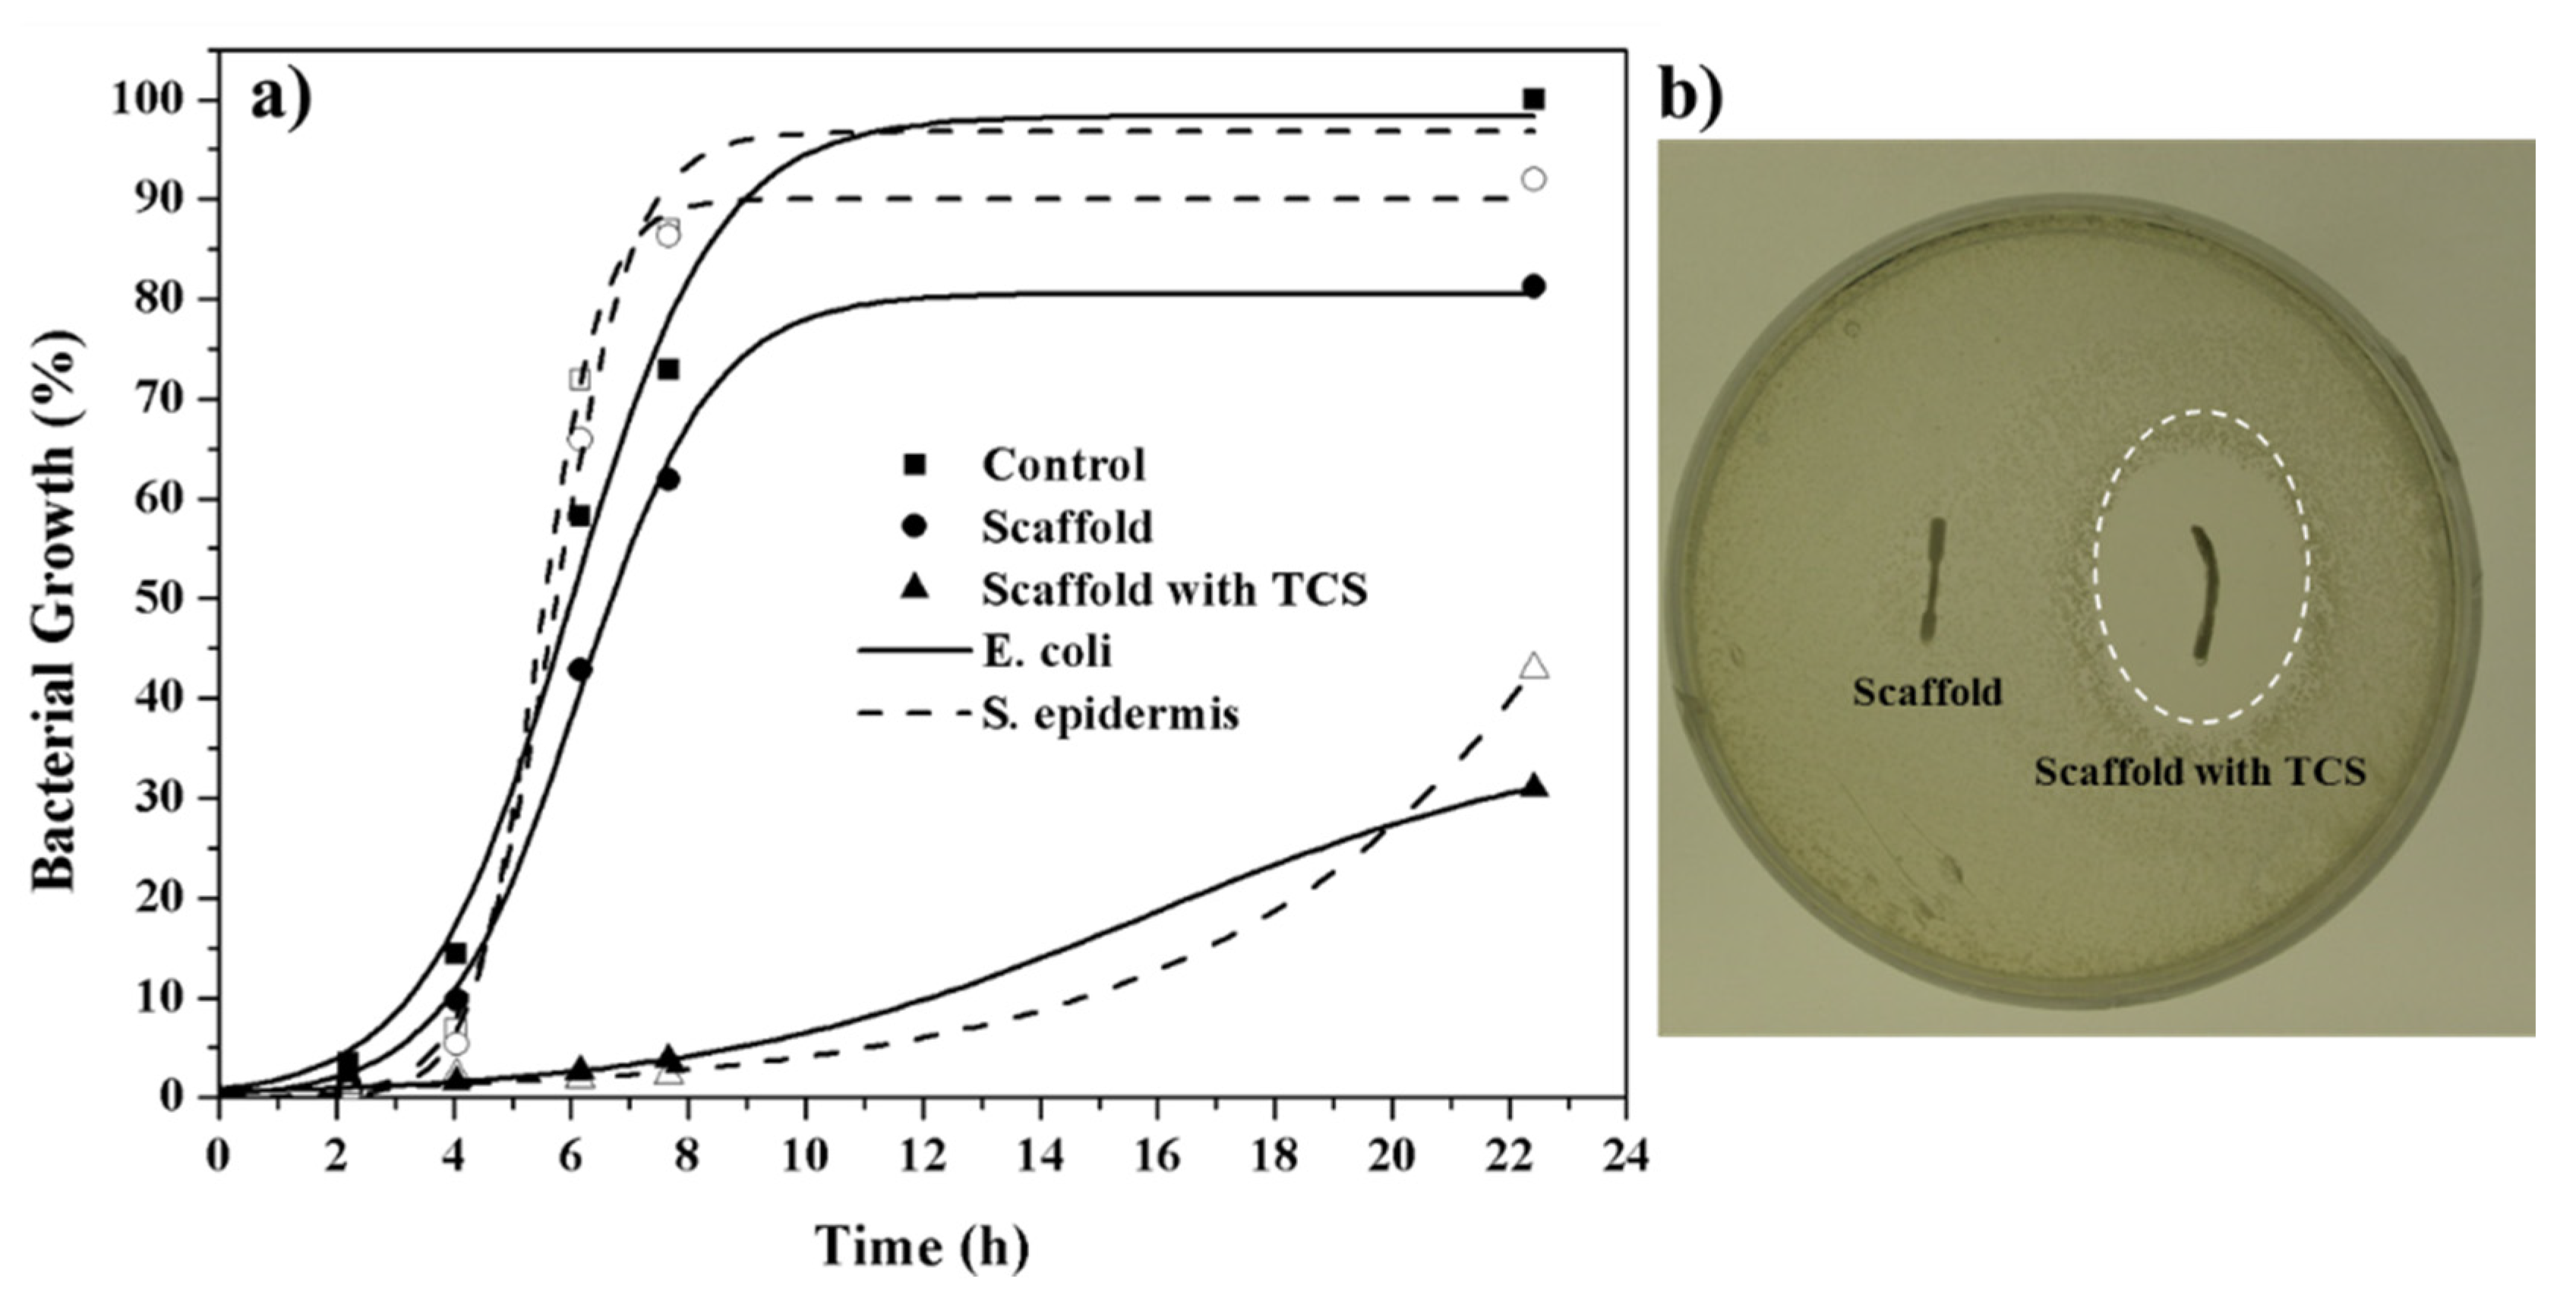
Figure 15a shows E. coli (Gram-negative) and S. epidermidis (Gram-positive) bacterial growth curves in presence of micromolded specimens of non-porous PLA (control), PLA porous scaffold (PLA:PEG-10:NaCl-40) and TCS loaded PLA scaffold. The unload scaffold displayed a similar bacterial growth curve than the non-porous PLA sample. Note that in both cases, the bacterial growth required a lag phase close to 4 h. However, bacterial growth in the porous scaffold was subsequently limited to a value around 80–90%. This low inhibition growth effect (in the stationary phase) could be explained taking into account that some NaCl remained in the piece. By contrast, the scaffolds loaded with TCS had a clear bactericide effect during the first 10 h that was followed by a bacteriostatic effect that kept the bacterial growth around 30–35%. Performance of TCS loaded specimens was similar for both Gram-positive and Gram-negative bacterial cultures. Agar tests showed the presence of inhibition halos, which confirmed the antibacterial activity, only when TCS loaded specimens were assayed (see Figure 15b) for an E. coli culture).
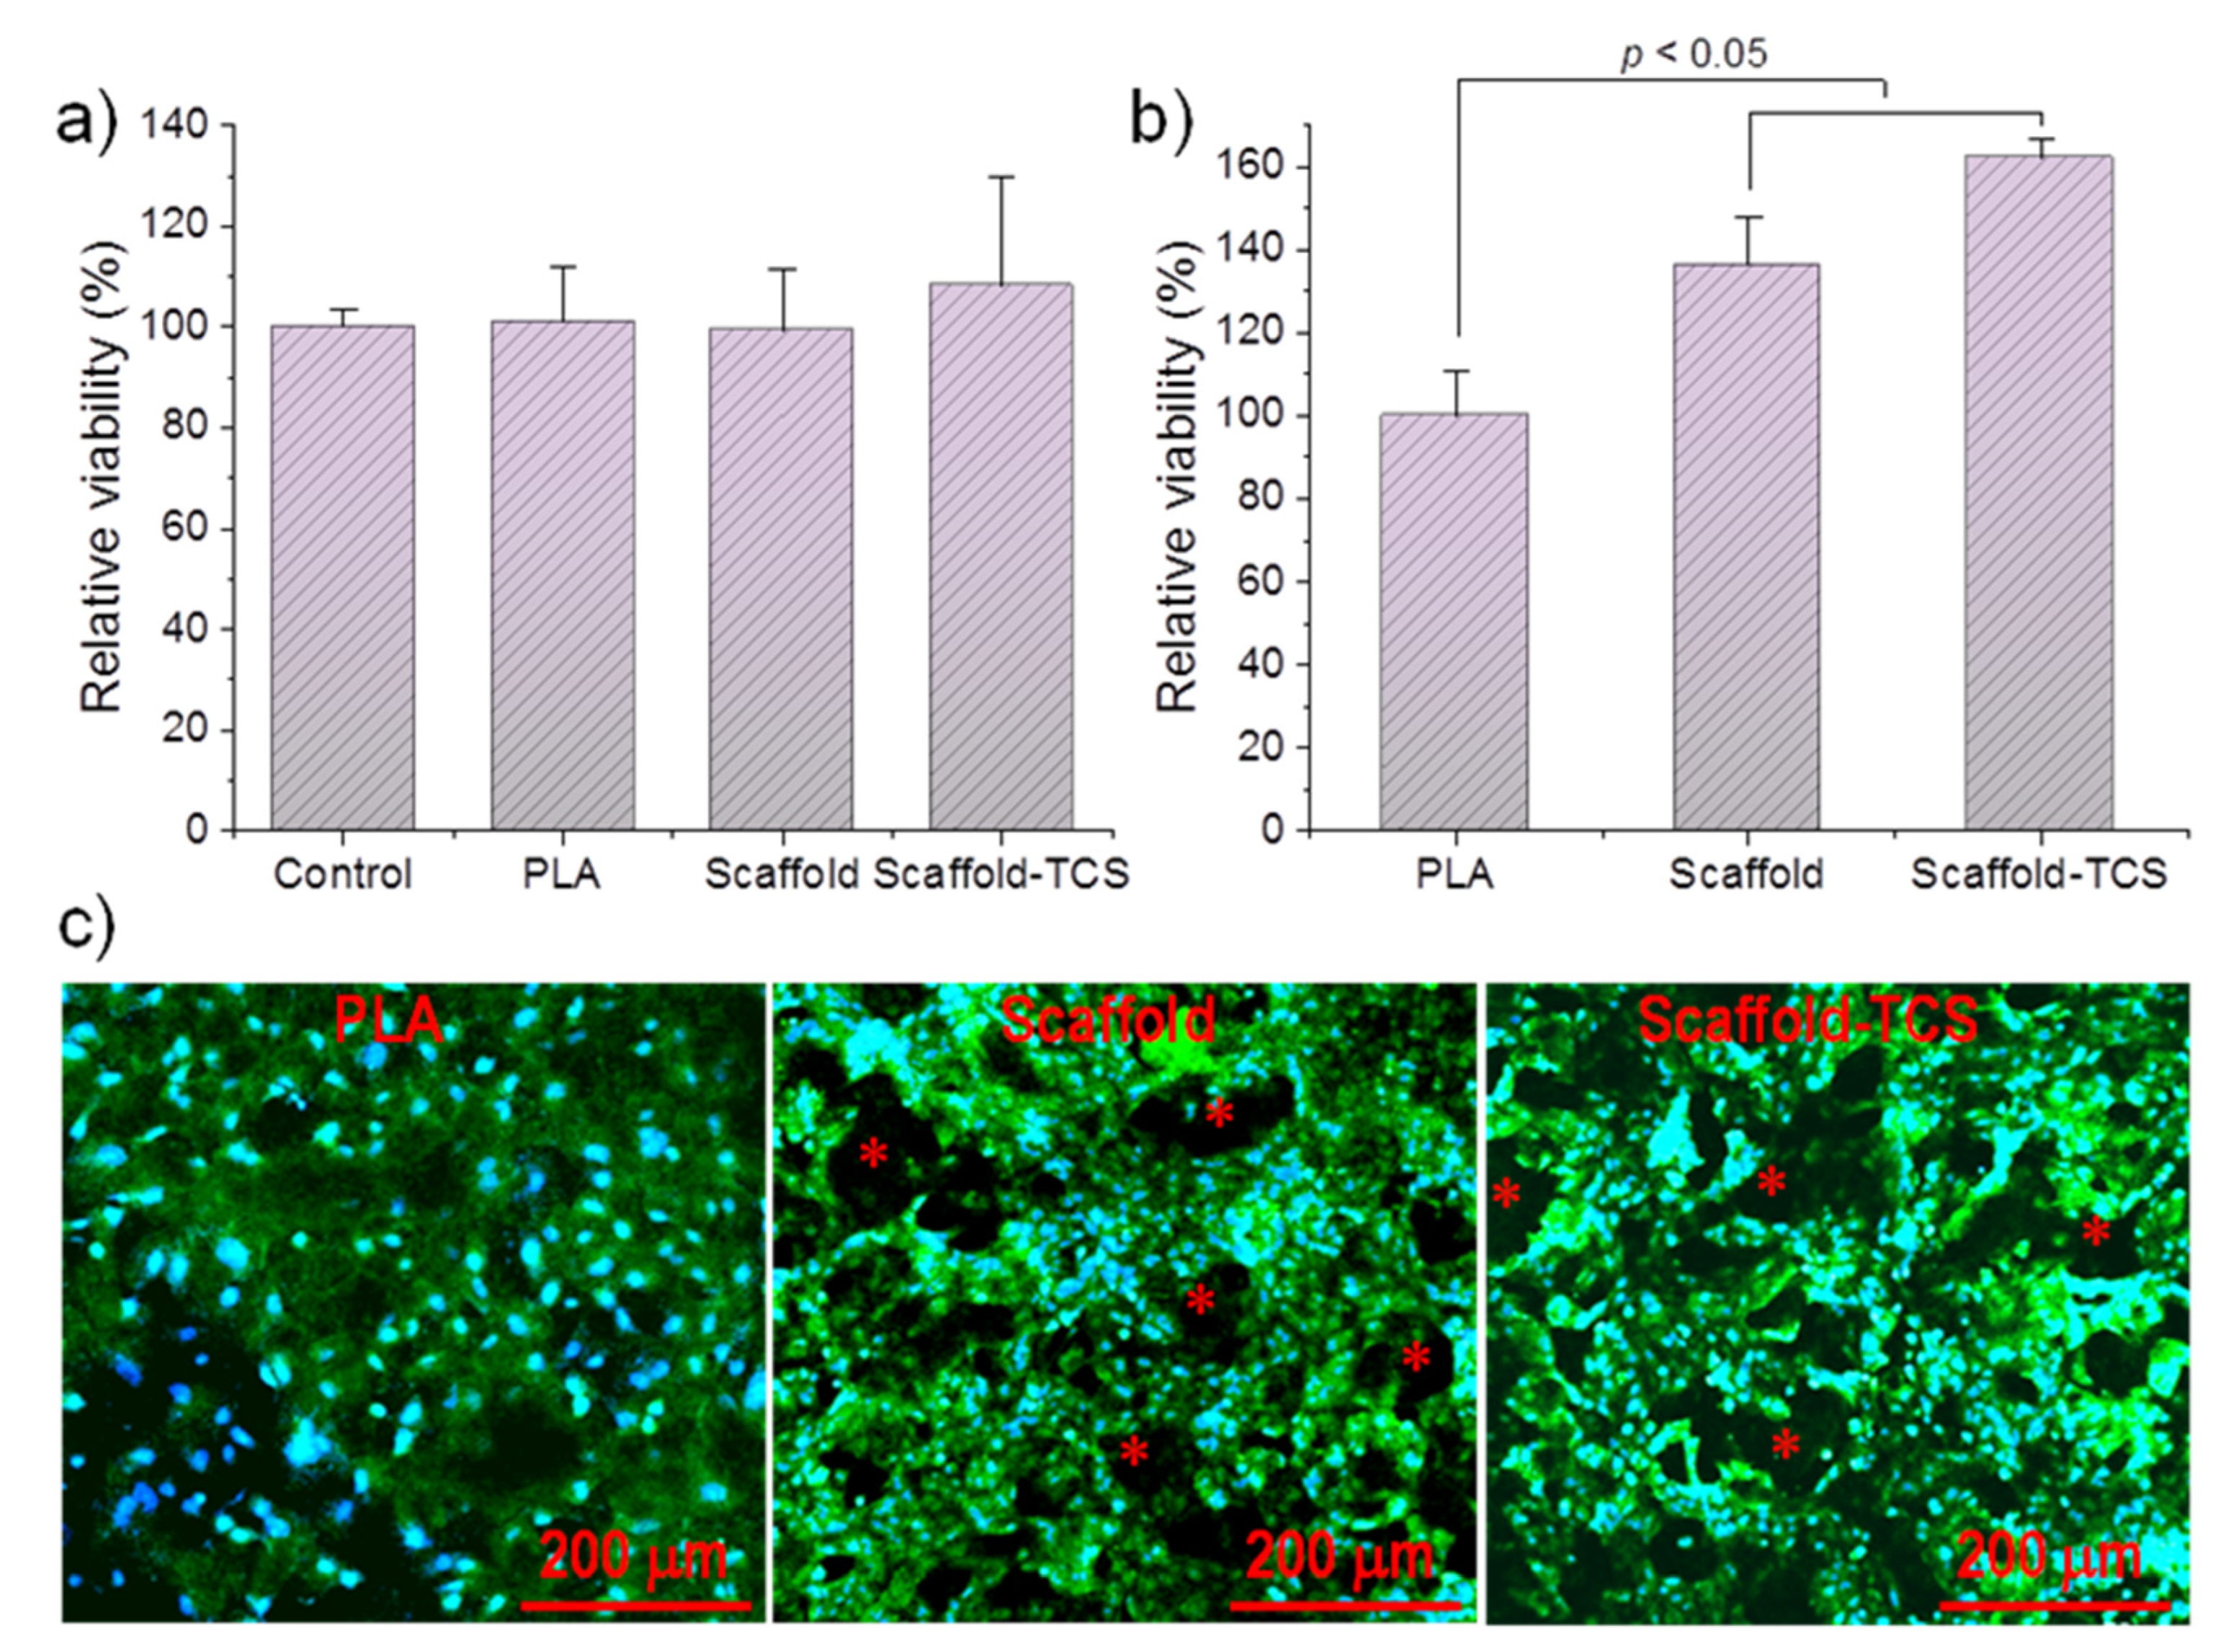
Figure 16 compares the cell growth of MDCK cells on a non-porous PLA specimen, a PLA scaffold, and the TCS loaded PLA scaffold. Specifically, Figure 16a shows that cell viability was similar for the different samples (e.g., control well without specimens and wells containing the specimens). These results allow discarding the potential toxicity of TCS and are coherent with the potential use of TCS for sanitizing the specimens, in a similar way as used in different hygiene products (e.g., soaps, deodorants, toothpastes, and others). Figure 16b shows that the number of cells grown on the porous micro-pieces, with and without TCS, were similar but significantly higher (increase by about 40–60%) than observed for specimens without pores (p < 0.05). The reduction in the size of cells in the porous specimens can be a morphological evidence of the increase in the number of cells (Figure 16c). The ability of MDCK cells to colonize tubular channels is demonstrated by different evidences related to their mobility and adherent growth [55,56,57]. Note that pores in the scaffolds remained open but covered by cells (see asterisks in Figure 16c).
Finally, the cells proliferated similarly in all the cases, confirming the biocompatibility of processed PLA scaffolds. Cell growth percentages demonstrate the increase of cell proliferation in the porous specimens. Moreover, the presence of the TCS has not a cytotoxic effect and as antibacterial drug could prevent bacterial contamination of the micromolded specimen.
4. Conclusions
Porous micromolded PLA scaffolds could be successfully prepared by a combination of ultrasound micromolding and salt leaching techniques. The combined process showed clear advantages with respect to conventional injection methods. Specifically, small polymer degradation due to the short exposure time to the energy source (1.2 s), minimum material loss and the possibility to attain a high precision of details in the processed specimens can be mentioned. NaCl was a suitable salt for ultrasound processing since cavitation problems could be avoided and a minimum change of the optimized parameters determined for the neat polylactide was required. A small addition of water-soluble PEG (10 wt-%) was nevertheless necessary to attain a complete solubilization of NaCl particles. Final specimens could be prepared with a relatively homogeneous porous distribution despite the higher fluidity of polylactide. PEG could also be micromolded without a significant degradation. It was found that large amounts of PEG could influence the PLA crystallinity. Micromolded scaffolds with antibacterial properties and a minimum polymer degradation could finally be obtained when triclosan was added to the PLA:PEG:NaCl processing mixture. Porosity of samples was appropriate to favor cell proliferation.
Author Contributions
C.O. performed experiments; L.F. was involved in thermal characterization studies; L.J.d.V. performed biological assays; and J.P. supervised project direction. All authors have read and approved the final manuscript.
Funding
The authors are in debt to support from MINECO and FEDER (RTI2018-101827-B-I00) and the Generalitat de Catalunya (2017SGR373).
Conflicts of Interest
The authors declare no conflict of interest.
References
- Bonassar, L.J.; Vacanti, C.A. Tissue engineering: The first decade and beyond. J. Cell. Biochem. 1998, 72, 297–303. [Google Scholar] [CrossRef]
- Atala, A. Tissue Engineering and Regenerative Medicine: Concepts for Clinical Application. Rejuvenation Res. 2004, 7, 15–31. [Google Scholar] [CrossRef]
- Peter, S.J.; Miller, M.J.; Yasko, A.W.; Yaszemski, M.J.; Mikos, A.G. Polymer concepts in tissue engineering. J. Biomed. Mater. Res. 1998, 43, 422–427. [Google Scholar] [CrossRef]
- Marler, J.J.; Upton, J.; Langer, R.; Vacanti, J.P. Transplantation of cells in matrices for tissue regeneration. Adv. Drug Deliv. Rev. 1998, 33, 165–182. [Google Scholar] [CrossRef]
- Salgado, A.J.; Coutinho, O.P.; Reis, R.L. Novel Starch-Based Scaffolds for Bone Tissue Engineering: Cytotoxicity, Cell Culture, and Protein Expression. Tissue Eng. 2004, 10, 465–474. [Google Scholar] [CrossRef] [Green Version]
- Heller, C.; Schwentenwein, M.; Russmueller, G.; Varga, F.; Stampfl, J.; Liska, R. Vinyl esters: Low cytotoxicity monomers for the fabrication of biocompatible 3D scaffolds by lithography based additive manufacturing. J. Polym. Sci. Part A Polym. Chem. 2009, 47, 6941–6954. [Google Scholar] [CrossRef]
- Watari, F.; Yokoyama, A.; Saso, F.; Uo, M.; Kawasaki, T. Fabrication and properties of functionally graded dental implant. Compos. Part B Eng. 1997, 28, 5–11. [Google Scholar] [CrossRef]
- Walsh, D.; Furuzono, T.; Tanaka, J. Preparation of porous composite implant materials by in situ polymerization of porous apatite containing ε-caprolactone or methyl methacrylate. Biomaterials 2001, 22, 1205–1212. [Google Scholar] [CrossRef]
- Mizuno, S.; Glowacki, J. Three-dimensional composite of demineralized bone powder and collagen for in vitro analysis of chondroinduction of human dermal fibroblasts. Biomaterials 1996, 17, 1819–1825. [Google Scholar] [CrossRef]
- Su, Z.; Ma, H.; Wu, Z.; Zeng, H.; Li, Z.; Wang, Y.; Liu, G.; Xu, B.; Lin, Y.; Zhang, P.; et al. Enhancement of skin wound healing with decellularized scaffolds loaded with hyaluronic acid and epidermal growth factor. Mater. Sci. Eng. C 2014, 44, 440–448. [Google Scholar] [CrossRef]
- Guo, T.; Zhao, J.; Chang, J.; Ding, Z.; Hong, H.; Chen, J.; Zhang, J. Porous chitosan-gelatin scaffold containing plasmid DNA encoding transforming growth factor-β1 for chondrocytes proliferation. Biomaterials 2006, 27, 1095–1103. [Google Scholar] [CrossRef] [PubMed]
- Li, X.; Wang, Y.; Guo, M.; Wang, Z.; Shao, N.; Zhang, P.-b.; Chen, X.; Huang, Y. Degradable 3D printed PLA scaffold with long-term antibacterial activity. ACS Sustain. Chem. Eng. 2018, 6, 2047–2054. [Google Scholar] [CrossRef]
- Wu, J.C.-C.; Ray, S.; Gizdavic-Nikolaidis, M.; Uy, B.; Swift, S.; Jin, J.; Cooney, R.P. Nanostructured bioactive material based on polycaprolactone and polyaniline fiber-scaffolds. Synth. Met. 2014, 198, 41–50. [Google Scholar] [CrossRef]
- Hollister, S.J. Porous scaffold design for tissue engineering. Nat. Mater. 2005, 4, 518–524. [Google Scholar] [CrossRef]
- Velasco, M.; Narváez-Tovar, C.A.; Garzón-Alvarado, D.A. Design, Materials, and Mechanobiology of Biodegradable Scaffolds for Bone Tissue Engineering. Biomed Res. Int. 2015, 2015, 21. [Google Scholar] [CrossRef]
- Jeong, D.; Yun, A.; Kim, J. Mathematical model and numerical simulation of the cell growth in scaffolds. Biomech. Model. Mechanobiol. 2012, 11, 677–688. [Google Scholar] [CrossRef]
- Freed, L.E.; Vunjak-Novakovic, G.; Biron, R.J.; Eagle, D.B.; Lesnoy, D.C.; Barlow, S.K.; Langer, R. Biodegradable polymer scaffolds for tissue engineering. Nat. Bio-Technol. 1994, 12, 689–693. [Google Scholar] [CrossRef]
- Liu, X.; Holzwarth, J.M.; Ma, P.X. Functionalized synthetic biodegradable polymer scaffolds for tissue engineering. Macromol. Biosci. 2012, 12, 911–919. [Google Scholar] [CrossRef] [Green Version]
- Rezwan, K.; Chen, Q.Z.; Blaker, J.J.; Boccaccini, A.R. Biodegradable and bioactive porous polymer/inorganic composite scaffolds for bone tissue engineering. Biomaterials 2006, 27, 3413–3431. [Google Scholar] [CrossRef]
- McMurry, L.M.; Oethinger, M.; Levy, S.B. Triclosan targets lipid synthesis. Nature 1998, 394, 531–532. [Google Scholar] [CrossRef]
- Mikos, A.G.; Bao, Y.; Cima, L.G.; Ingber, D.E.; Vacanti, J.P.; Langer, R. Preparation of poly(glycolic acid) bonded fiber structures for cell attachment and transplantation. J. Biomed. Mater. Res. 1993, 27, 183–189. [Google Scholar] [CrossRef] [PubMed]
- Díaz, A.; del Valle, L.J.; Tugushi, D.; Katsarava, R.; Puiggalí, J. New poly(ester urea) derived from l-leucine: Electrospun scaffolds loaded with antibacterial drugs and enzymes. Mater. Sci. Eng. C 2015, 46, 450–462. [Google Scholar] [CrossRef] [Green Version]
- Sin, D.; Miao, X.; Liu, G.; Wei, F.; Chadwick, G.; Yan, C.; Friis, T. Polyurethane (PU) scaffolds prepared by solvent casting/particulate leaching (SCPL) combined with centrifugation. Mater. Sci. Eng. C 2010, 30, 78–85. [Google Scholar] [CrossRef] [Green Version]
- Oh, S.H.; Kang, S.G.; Lee, J.H. Degradation behavior of hydrophilized PLGA scaffolds prepared by melt-molding particulate-leaching method: Comparison with control hydrophobic one. J. Mater. Sci. Mater. Med. 2006, 17, 131–137. [Google Scholar] [CrossRef] [PubMed]
- Widmer, M.S.; Gupta, P.K.; Lu, L.; Meszlenyi, R.K.; Evans, G.R.D.; Brandt, K.; Savel, T.; Gurlek, A.; Patrick, C.W.; Mikos, A.G. Manufacture of porous biodegradable polymer conduits by an extrusion process for guided tissue regeneration. Biomaterials 1998, 19, 1945–1955. [Google Scholar] [CrossRef]
- Utela, B.; Storti, D.; Anderson, R.; Ganter, M. A review of process development steps for new material systems in three dimensional printing (3DP). J. Manuf. Process. 2008, 10, 96–104. [Google Scholar] [CrossRef]
- Bergmann, C.; Lindner, M.; Zhang, W.; Koczur, K.; Kirsten, A.; Telle, R.; Fischer, H. 3D printing of bone substitute implants using calcium phosphate and bioactive glasses. J. Eur. Ceram. Soc. 2010, 30, 2563–2567. [Google Scholar] [CrossRef]
- Yao, D.; Chen, S.-C.; Kim, B.H. Rapid thermal cycling of injection molds: An overview on technical approaches and applications. Adv. Polym. Technol. 2008, 27, 233–255. [Google Scholar] [CrossRef]
- Michaeli, W.; Opferman, D. Ultrasonic plasticising for micro injection moulding. In Proceedings of the 4M 2006—Second International Conference on Multi-Material Micro Manufacture, Grenoble, France, 20–22 September 2006; pp. 345–348. [Google Scholar]
- Yao, D.; Chen, S.-C.; Kim, B.H. High-frequency proximity heating for injection molding applications. Polym. Eng. Sci. 2006, 46, 938–945. [Google Scholar] [CrossRef]
- Sacristán, M.; Puiggalli, J.; Planta, X.; Morell, M. Effects of ultrasonic vibration on the micro-molding processing of polylactide. Ultrason. Sonochem. 2014, 21, 376–386. [Google Scholar]
- Michaeli, W.; Kamps, T.; Hopmann, C. Manufacturing of polymer micro parts by ultrasonic plasticization and direct injection. Microsyst. Technol. 2011, 17, 243–249. [Google Scholar] [CrossRef]
- Michaeli, W.; Spennermann, A.; Gärtner, R. New plastification concepts for micro injection moulding. Microsyst. Technol. 2002, 8, 55–57. [Google Scholar] [CrossRef]
- Michaeli, W.; Starke, C. Ultrasonic investigations of the thermoplastics injection moulding process. Polym. Test. 2005, 24, 205–209. [Google Scholar] [CrossRef]
- Chen, G.; Guo, S.; Li, H. Ultrasonic improvement of rheological behavior of polystyrene. J. Appl. Polym. Sci. 2002, 84, 2451–2460. [Google Scholar] [CrossRef]
- Planellas, M.; Sacristán, M.; Rey, L.; Olmo, C.; Aymamí, J.; Casas, M.T.; Valle, L.J.d.; Franco, L.; Puiggalí, J. Micro-molding with ultrasonic vibration energy: New method to disperse nanoclays in polymer matrices. Ultrason. Sonochem. 2014, 21, 1557–1569. [Google Scholar] [CrossRef]
- Díaz, A.; Franco, L.; Casas, M.T.; del Valle, L.J.; Aymamí, J.; Olmo, C.; Puiggalí, J. Preparation of micro-molded exfoliated clay nanocomposites by means of ultrasonic technology. J. Polym. Res. 2014, 21, 584. [Google Scholar] [CrossRef]
- Olmo, C.; Amestoy, H.; Casas, M.T.; Martínez, J.C.; Franco, L.; Sarasua, J.-R.; Puiggalí, J. Preparation of Nanocomposites of Poly(ε-caprolactone) and Multi-Walled Carbon Nanotubes by Ultrasound Micro-Molding. Influence of Nanotubes on Melting and Crystallization. Polymers 2017, 9, 322. [Google Scholar] [CrossRef] [Green Version]
- Suzuki, S.; Ikada, Y. Medical Applications. In Poly(Lactic Acid); Auras, R., Lim, L.-T., Selke, S.E.M., Tsuji, H., Eds.; John Wiley & Sons, Inc.: Hoboken, NJ, USA, 2010. [Google Scholar]
- Dhandayuthapani, B.; Yoshida, Y.; Maekawa, T.; Kumar, D.S. Polymeric Scaffolds in Tissue Engineering Application: A Review. Int. J. Polym. Sci. 2011, 2011, 290602. [Google Scholar] [CrossRef]
- Heller, J. Biodegradable polymers in controlled drug delivery. Crit. Rev. Drug Carr. Syst. 1984, 1, 39–90. [Google Scholar]
- Olmo, C.; Franco, L.; del Valle, L.J.; Puiggalí, J. Preparation of Medicated Polylactide Micropieces by Means of Ultrasonic Technology. Appl. Sci. 2019, 9, 2360. [Google Scholar] [CrossRef] [Green Version]
- Mosmann, T. Rapid colorimetric assay for cellular growth and survival: Application to proliferation and cytotoxicity assays. J. Immunol. Methods 1983, 65, 55–63. [Google Scholar] [CrossRef]
- Li, S.H.; De Wijn, J.R.; Layrolle, P.; De Groot, K. Synthesis of macroporous hydroxyapatite scaffolds for bone tissue engineering. J. Biomed. Mater. Res. 2002, 61, 109–120. [Google Scholar] [CrossRef] [PubMed]
- Kim, S.-S.; Sun Park, M.; Jeon, O.; Yong Choi, C.; Kim, B.-S. Poly(lactide-co-glycolide)/hydroxyapatite composite scaffolds for bone tissue engineering. Biomaterials 2006, 27, 1399–1409. [Google Scholar] [CrossRef] [PubMed]
- Kramschuster, A.; Turng, L.-S. An injection molding process for manufacturing highly porous and interconnected biodegradable polymer matrices for use as tissue engineering scaffolds. J. Biomed. Mater. Res. Part B Appl. Biomater. 2010, 92B, 366–376. [Google Scholar] [CrossRef]
- Huang, R.; Zhu, X.; Zhao, T.; Wan, A. Preparation of tissue engineering porous scaffold with poly(lactic acid) and polyethylene glycol solution blend by solvent-casting/particulate-leaching. Mater. Res. Express 2014, 1, 45403. [Google Scholar] [CrossRef]
- Wu, D.; Lin, D.; Zhang, J.; Zhou, W.; Zhang, M.; Zhang, Y.; Wang, D.; Lin, B. Selective Localization of Nanofillers: Effect on Morphology and Crystallization of PLA/PCL Blends. Macromol. Chem. Phys. 2011, 212, 613–626. [Google Scholar] [CrossRef]
- Yang, M.; Lin, Y. Measurement and Simulation of Thermal Stability of Poly(Lactic Acid) by Thermogravimetric Analysis. J. Test. Eval. 2009, 37, 364–370. [Google Scholar]
- Han, S.; Kim, C.; Kwon, D. Thermal/oxidative degradation and stabilization of polyethylene glycol. Polymer 1997, 38, 317–323. [Google Scholar] [CrossRef]
- Hassan, M.; Chong, L.; Sultana, N. Wettability and water uptake properties of PLA and PCL/Gelatin-based electrospun. ARPN J. Eng. Appl. Sci. 2016, 11, 23. [Google Scholar]
- Szewczyk, P.K.; Ura, D.P.; Metwally, S.; Knapczyk-Korczak, J.; Gajek, M.; Marzec, M.M.; Bernasik, A.; Stachewicz, U. Roughness and Fiber Fraction Dominated Wetting of Electrospun Fiber-Based Porous Meshes. Polymers 2019, 11, 34. [Google Scholar] [CrossRef] [Green Version]
- Zurita, R.; Puiggalí, J.; Rodríguez-Galán, A. Triclosan Release from Coated Polyglycolide Threads. Macromol. Biosci. 2006, 6, 58–69. [Google Scholar] [CrossRef] [PubMed]
- Márquez, Y.; Cabral, T.; Lorenzetti, A.; Franco, L.; Turon, P.; del Valle, L.J.; Puiggalí, J. Incorporation of biguanide compounds into poly(GL)-b-poly(GL-co-TMC-co-CL)-b-poly(GL) monofilament surgical sutures. Mater. Sci. Eng. C 2017, 71, 629–640. [Google Scholar] [CrossRef] [PubMed] [Green Version]
- Puliafito, A.; Hufnagel, L.; Neveu, P.; Streichan, S.; Sigal, A.; Fygenson, D.K.; Shraiman, B.I. Collective and single cell behavior in epithelial contact inhibition. Proc. Natl. Acad. Sci. USA 2012, 109, 739–744. [Google Scholar] [CrossRef] [PubMed] [Green Version]
- Xi, W.; Sonam, S.; Beng Saw, T.; Ladoux, B.; Teck Lim, C. Emergent patterns of collective cell migration under tubular confinement. Nat. Commun. 2017, 8, 1517. [Google Scholar] [CrossRef] [PubMed] [Green Version]
- Tlili, S.; Gauquelin, E.; Li, B.; Cardoso, O.; Ladoux, B.; Delanoë-Ayari, H.; Graner, F. Collective cell migration without proliferation: Density determines cell velocity and wave velocity. R. Soc. Open Sci. 2018, 5, 172421. [Google Scholar] [CrossRef] [PubMed] [Green Version]
Figure 1.
Scheme of the main parts of the micromolding equipment.

Figure 2.
Polylactide (PLA) micromolded samples loaded with 10 wt-% of sodium carbonate (a,b), sodium bicarbonate (c) and sodium chloride (d). Processing amplitude, force and time parameters were in this case 24 µm, 300 N and 1.2 s, respectively.
Figure 2.
Polylactide (PLA) micromolded samples loaded with 10 wt-% of sodium carbonate (a,b), sodium bicarbonate (c) and sodium chloride (d). Processing amplitude, force and time parameters were in this case 24 µm, 300 N and 1.2 s, respectively.

Figure 3.
GPC chromatograms of commercial PLA powder, micromolded PLA, and mixtures of PLA:NaCl at 40 wt-% of salt. Processing parameters were 24 µm-300 N-1.2 s for neat PLA and 24 µm-400 N-1.2 s for PLA:NaCl 40%.
Figure 3.
GPC chromatograms of commercial PLA powder, micromolded PLA, and mixtures of PLA:NaCl at 40 wt-% of salt. Processing parameters were 24 µm-300 N-1.2 s for neat PLA and 24 µm-400 N-1.2 s for PLA:NaCl 40%.

Figure 4.
SEM micrographs of the cross section of PLA specimens loaded with 40 wt-% of NaCl before ((a) for <45 μm and (d) for 100–250 μm) and after immersion in water ((b,c) for <45 μm and (e) for 100–250 μm). NaCl particles are marked with yellow ellipsoids.
Figure 4.
SEM micrographs of the cross section of PLA specimens loaded with 40 wt-% of NaCl before ((a) for <45 μm and (d) for 100–250 μm) and after immersion in water ((b,c) for <45 μm and (e) for 100–250 μm). NaCl particles are marked with yellow ellipsoids.

Figure 5.
Gel permeation chromatography (GPC) profiles of powdered polyethylene glycol (PEG), micromolded PEG and PLA/PEG blends having 30 wt-% and 50 wt-% of PEG. The curve of a micromolded PLA specimen (dashed line) is also given for comparison purposes.
Figure 5.
Gel permeation chromatography (GPC) profiles of powdered polyethylene glycol (PEG), micromolded PEG and PLA/PEG blends having 30 wt-% and 50 wt-% of PEG. The curve of a micromolded PLA specimen (dashed line) is also given for comparison purposes.

Figure 6.
FTIR spectra of PLA, PEG, and selected PLA/PEG (30 and 15 wt-% of PEG) specimens. Spectra corresponding to distal and proximal parts are displayed for the blend specimens.
Figure 6.
FTIR spectra of PLA, PEG, and selected PLA/PEG (30 and 15 wt-% of PEG) specimens. Spectra corresponding to distal and proximal parts are displayed for the blend specimens.

Figure 7.
RMN spectra of proximal sections of PLA:PEG specimens with theoretical PEG content of 15%, 30% and 50 wt-%.
Figure 7.
RMN spectra of proximal sections of PLA:PEG specimens with theoretical PEG content of 15%, 30% and 50 wt-%.

Figure 8.
DSC curves corresponding to the first heating scan (10 °C/min) of PEG (top), PLA (bottom) and PLA:PEG blends having the indicated theoretical concentrations.
Figure 8.
DSC curves corresponding to the first heating scan (10 °C/min) of PEG (top), PLA (bottom) and PLA:PEG blends having the indicated theoretical concentrations.

Figure 9.
Three dimensional representation of WAXD profiles of representative micromolded PLA:PEG specimens having theoretical PLA contents of 70 wt-% (left) and 50 wt-% (right). Diffractograms were taken during heating scans at a rate of 10 °C/min from room temperature.
Figure 9.
Three dimensional representation of WAXD profiles of representative micromolded PLA:PEG specimens having theoretical PLA contents of 70 wt-% (left) and 50 wt-% (right). Diffractograms were taken during heating scans at a rate of 10 °C/min from room temperature.

Figure 10.
FTIR spectra of PLA:PEG 70% and PLA:PEG-10:NaCl-40 specimens after immersion in a water medium. For comparison purposes spectra of PLA and PEG micromolded specimens are also given.
Figure 10.
FTIR spectra of PLA:PEG 70% and PLA:PEG-10:NaCl-40 specimens after immersion in a water medium. For comparison purposes spectra of PLA and PEG micromolded specimens are also given.

Figure 11.
TGA profiles of PLA:NaCl-35 (a) and PLA:PEG-10:NaCl-40 (b) specimens as molded (black lines), and after being washed (blue lines). (c,d) SEM micrographs of cross sections of both samples after being washed.
Figure 11.
TGA profiles of PLA:NaCl-35 (a) and PLA:PEG-10:NaCl-40 (b) specimens as molded (black lines), and after being washed (blue lines). (c,d) SEM micrographs of cross sections of both samples after being washed.

Figure 12.
Contact angle for representative micromolded specimens. On the bars are shown the images of the water droplets on the respective material whose composition is shown in the table below.
Figure 12.
Contact angle for representative micromolded specimens. On the bars are shown the images of the water droplets on the respective material whose composition is shown in the table below.

Figure 13.
Extraction yields and porosity for PLA:NaCl-40, PLA:PEG-10:NaCl-40, and PLA:PEG-8:NaCl-36:TCS-6.
Figure 13.
Extraction yields and porosity for PLA:NaCl-40, PLA:PEG-10:NaCl-40, and PLA:PEG-8:NaCl-36:TCS-6.

Figure 14.
Release profiles in a PBS-EtOH 70% medium of the antibacterial scaffold (black) and non-porous (blue) micromolded PLA specimen. Both samples contained 6 wt-% of TCS.
Figure 14.
Release profiles in a PBS-EtOH 70% medium of the antibacterial scaffold (black) and non-porous (blue) micromolded PLA specimen. Both samples contained 6 wt-% of TCS.

Figure 15.
(a) S. epidermidis (dashed lines) and E. coli (solid lines) bacterial growth profiles in presence of non-porous PLA control), PLA scaffold and PLA scaffold loaded with 6 wt-% of TCS. (b) Agar test for E. coli bacterium using PLA scaffolds with and without the TCS antibacterial drug.
Figure 15.
(a) S. epidermidis (dashed lines) and E. coli (solid lines) bacterial growth profiles in presence of non-porous PLA control), PLA scaffold and PLA scaffold loaded with 6 wt-% of TCS. (b) Agar test for E. coli bacterium using PLA scaffolds with and without the TCS antibacterial drug.

Figure 16.
(a) Cell viability in the presence of the micro-molded specimens. Control corresponds to cell growth in the absence of any specimen. (b) Relative cell proliferation at 7 days after seeding on non-porous PLA, PLA scaffold and PLA scaffold loaded with 6 wt-% of TCS. (c) Fluorescence micrographs of the three indicated samples after the cell proliferation assay. The cells were stained for nuclei (DAPI, blue) and actin (phalloidin, green). Asterisks indicate scaffold porous.


Table 1.
Abbreviation, composition and processing parameters of the studied samples.
| Sample | PLA [%-wt] | PEG [%-wt] | NaCl 45 nm [%-wt] | TCS [%-wt] | Molding Parameters a |
|---|---|---|---|---|---|
| PLA | 100 | 0 | 0 | 0 | 24/300/1.2 |
| PLA:NaCl-35 | 65 | 0 | 35 | 0 | 24/400/1.2 |
| PLA:NaCl-40 | 60 | 0 | 40 | 0 | 24/400/1.2 |
| PLA:PEG 85% | 85 | 15 | 0 | 0 | 24/300/1.2 |
| PLA:PEG 70% | 70 | 30 | 0 | 0 | 24/300/1.2 |
| PLA:PEG 60% | 60 | 40 | 0 | 0 | 24/300/1.2 |
| PLA:PEG 50% | 50 | 50 | 0 | 0 | 24/300/1.2 |
| PLA:PEG-10:NaCl-40 b | 50 | 10 | 40 | 0 | 24/400/1.2 |
| PLA:PEG-8:NaCl-36:TCS-6 c | 50 | 8 | 36 | 6 | 24/400/1.2 |
a Amplitude (µm)/Force (N)/time (s), b Scaffold, c Antibacterial scaffold.
Table 2.
Area of characteristic NMR peaks and calculated PEG content of micromolded PLA/PEG specimens with a theoretical PEG content of 15 wt-%, 30 wt-% and 50 wt-%. P and D in the specimen name are indicated the proximal and distal part, respectively.
Table 2.
Area of characteristic NMR peaks and calculated PEG content of micromolded PLA/PEG specimens with a theoretical PEG content of 15 wt-%, 30 wt-% and 50 wt-%. P and D in the specimen name are indicated the proximal and distal part, respectively.
| Sample | 1.56 ppm (-CH3) | 3.64 ppm (-CH2-) | PEG (wt-%) |
|---|---|---|---|
| PLA: PEG 85% P | 4.49 | 0.52 | 8.0 |
| PLA: PEG 85% D | 5.03 | 0.45 | 7.2 |
| PLA: PEG 70% P | 3.65 | 0.82 | 14.4 |
| PLA: PEG 70% D | 4.92 | 0.77 | 10.5 |
| PLA: PEG 50% P | 1.06 | 1.42 | 50.2 |
| PLA: PEG 50% D | 1.20 | 1.22 | 43.3 |
© 2020 by the authors. Licensee MDPI, Basel, Switzerland. This article is an open access article distributed under the terms and conditions of the Creative Commons Attribution (CC BY) license (http://creativecommons.org/licenses/by/4.0/).
Share and Cite
MDPI and ACS Style
Olmo, C.; Franco, L.; del Valle, L.J.; Puiggalí, J. Biodegradable Polylactide Scaffolds with Pharmacological Activity by Means of Ultrasound Micromolding Technology. Appl. Sci. 2020, 10, 3106. https://doi.org/10.3390/app10093106
AMA Style
Olmo C, Franco L, del Valle LJ, Puiggalí J. Biodegradable Polylactide Scaffolds with Pharmacological Activity by Means of Ultrasound Micromolding Technology. Applied Sciences. 2020; 10(9):3106. https://doi.org/10.3390/app10093106
Chicago/Turabian StyleOlmo, Cristian, Lourdes Franco, Luis J. del Valle, and Jordi Puiggalí. 2020. "Biodegradable Polylactide Scaffolds with Pharmacological Activity by Means of Ultrasound Micromolding Technology" Applied Sciences 10, no. 9: 3106. https://doi.org/10.3390/app10093106
Note that from the first issue of 2016, this journal uses article numbers instead of page numbers. See further details here.