Health State Classification of a Spherical Tank Using a Hybrid Bag of Features and K-Nearest Neighbor


1
Department of Electrical, Electronics & Computer Engineering, University of Ulsan, Ulsan 44610, Korea
2
Department of Computer Engineering, Chonnam National University, Gwangju 61186, Korea
*
Author to whom correspondence should be addressed.
Appl. Sci. 2020, 10(7), 2525; https://doi.org/10.3390/app10072525
Submission received: 2 March 2020
/
Revised: 18 March 2020
/
Accepted: 2 April 2020
/
Published: 6 April 2020
(This article belongs to the Special Issue Machine Fault Diagnostics and Prognostics)
Abstract
:Feature analysis puts a great impact in determining the various health conditions of mechanical vessels. To achieve balance between traditional feature extraction and the automated feature selection process, a hybrid bag of features (HBoF) is designed for multiclass health state classification of spherical tanks in this paper. The proposed HBoF is composed of (a) the acoustic emission (AE) features and (b) the time and frequency based statistical features. A wrapper-based feature chooser algorithm, Boruta, is utilized to extract the most intrinsic feature set from HBoF. The selective feature matrix is passed to the multi-class k-nearest neighbor (k-NN) algorithm to differentiate among normal condition (NC) and two faulty conditions (FC1 and FC2). Experimental results demonstrate that the proposed methodology generates an average 99.7% accuracy for all working conditions. Moreover, it outperforms the existing state-of-art works by achieving at least 19.4%.
1. Introduction
Mechanical vessels play a very important role in day-to-day life with widespread applications [1]. Specifically, in the oil and gas industry, the use of spherical tanks is required due to the cost effectiveness of building a sphere. With the increasing use of these types of spherical tanks for different industries, the number of accidents related to leakage from the bottoms of these tanks is also increasing [2]. As a result, improved safety precautions and maintenance are required [3,4]. Moreover, the finding of the crack in its initial stages facilitates required actions to be commenced in a timely manner and reduces the incidence of industrial accidents. Therefore, identifying the health condition (normal or faulty state) through signals at an early stage will make it easier to establish the necessary precautions for condition monitoring purposes. The present crack detection procedures for spherical tanks comprise of observing inbound signals. However, there is still a lack of automated multiclass identification methods for achieving this objective.
In this study, the central focus is to categorize the health states of a spherical tank, assessed through acoustic emission (AE) signals. Compared with traditional methods, AE is a cost-effective and useful for fault detection applications [5]. Additionally, AE signals can provide underlying evidence for signals with low energy and is suitable to establish a more substantial data-driven fault identification approach.
Conventional data-driven health state classification procedures count on two vital techniques: (1) feature extraction by applying domain proficiency and (2) identifying those health states by utilizing those extracted sets of features. Among different approaches, the popular AE-based diagnosis methods mostly rely on analyzing the peak of characteristic frequencies in the frequency spectrums of signals [6]. Nevertheless, to obtain intrinsic information from the signals, the selection of this signal analysis procedure has a significant effect on the final performance [6]. In recent studies, several effective feature extraction methods with conventional feature selection algorithms have been proposed. Sohaib et al. [7] analyzed the statistical characteristics from time, and frequency domain to classify between normal and faulty health conditions of the tank by using support vector machine (SVM). Similarly, Islam et al. [8] developed a heterogeneous time-frequency feature fusion with a genetic algorithm (GA) based feature selector to identify the most distinctive feature information from the data. However, these methods are made for binary class-classification. Moreover, due to sensitive nature of the crack sizes under various faulty conditions, these feature selector algorithms failed to distinguish between multiple crack sizes. Therefore, in this research paper, the main emphasis is on multiclass health state categorization by analyzing the AE signals obtained from a spherical tank. Consequently, pattern generation from acquired signal domains using several signal-imaging techniques can also differentiate between health conditions for further classification [7]. Besides, several automated feature learning processes driven by deep learning-based algorithms have been studied to ease the inevitability of domain knowledge proficiency [9,10]. However, due to limited amount of data, these deep learning-based approaches are not capable of extracting meaningful features.
In this study, a hybrid feature pool-denoted as hybrid bag of features (HBoF) is designed by fusing the statistical properties from AE domain. Additionally, time and frequency domain-based analysis are added to increase the robustness of the proposed feature extractor mechanism. However, to select the most distinctive feature set from the proposed HBoF, it is logical to determine the underlying cause for multiple health conditions. Unlike the popular feature selector algorithms (i.e., GA), Boruta can select all the appropriate features from the feature set instead of selecting only the non-redundant ones [11]. Therefore, in this study, a wrapper-based feature selector algorithm-Boruta is utilized as the feature selector. Lastly, the chosen features are forwarded to the k-nearest neighborhood (k-NN) for multiclass classification. With the limited observations of the data, k-NN check historical database each time a prediction is required. The main impacts of this research can be encapsulated as follows:
- An HBoF extraction method is designed by combining two types of analysis: (a) analysis of the properties of the AE domain from signals and (b) analysis of the statistical properties from time-domain and frequency-domain of the signal,
- A non-redundant feature selection method based on wrapper principle, Boruta, is utilized to analyze the HBoF to capture the final features,
- Finally, by using those features by Boruta selection as and input, the k-NN is applied for final multi-class classification.
The rest of the article is arranged as follows. The details of the acquisition testbed with the details of the proposed methodology are discussed into Section 2. The experimental result analysis with comparative discussions are presented into Section 3. Therefore, with all the findings, Section 4 represents the conclusion of the paper.
2. Methodology
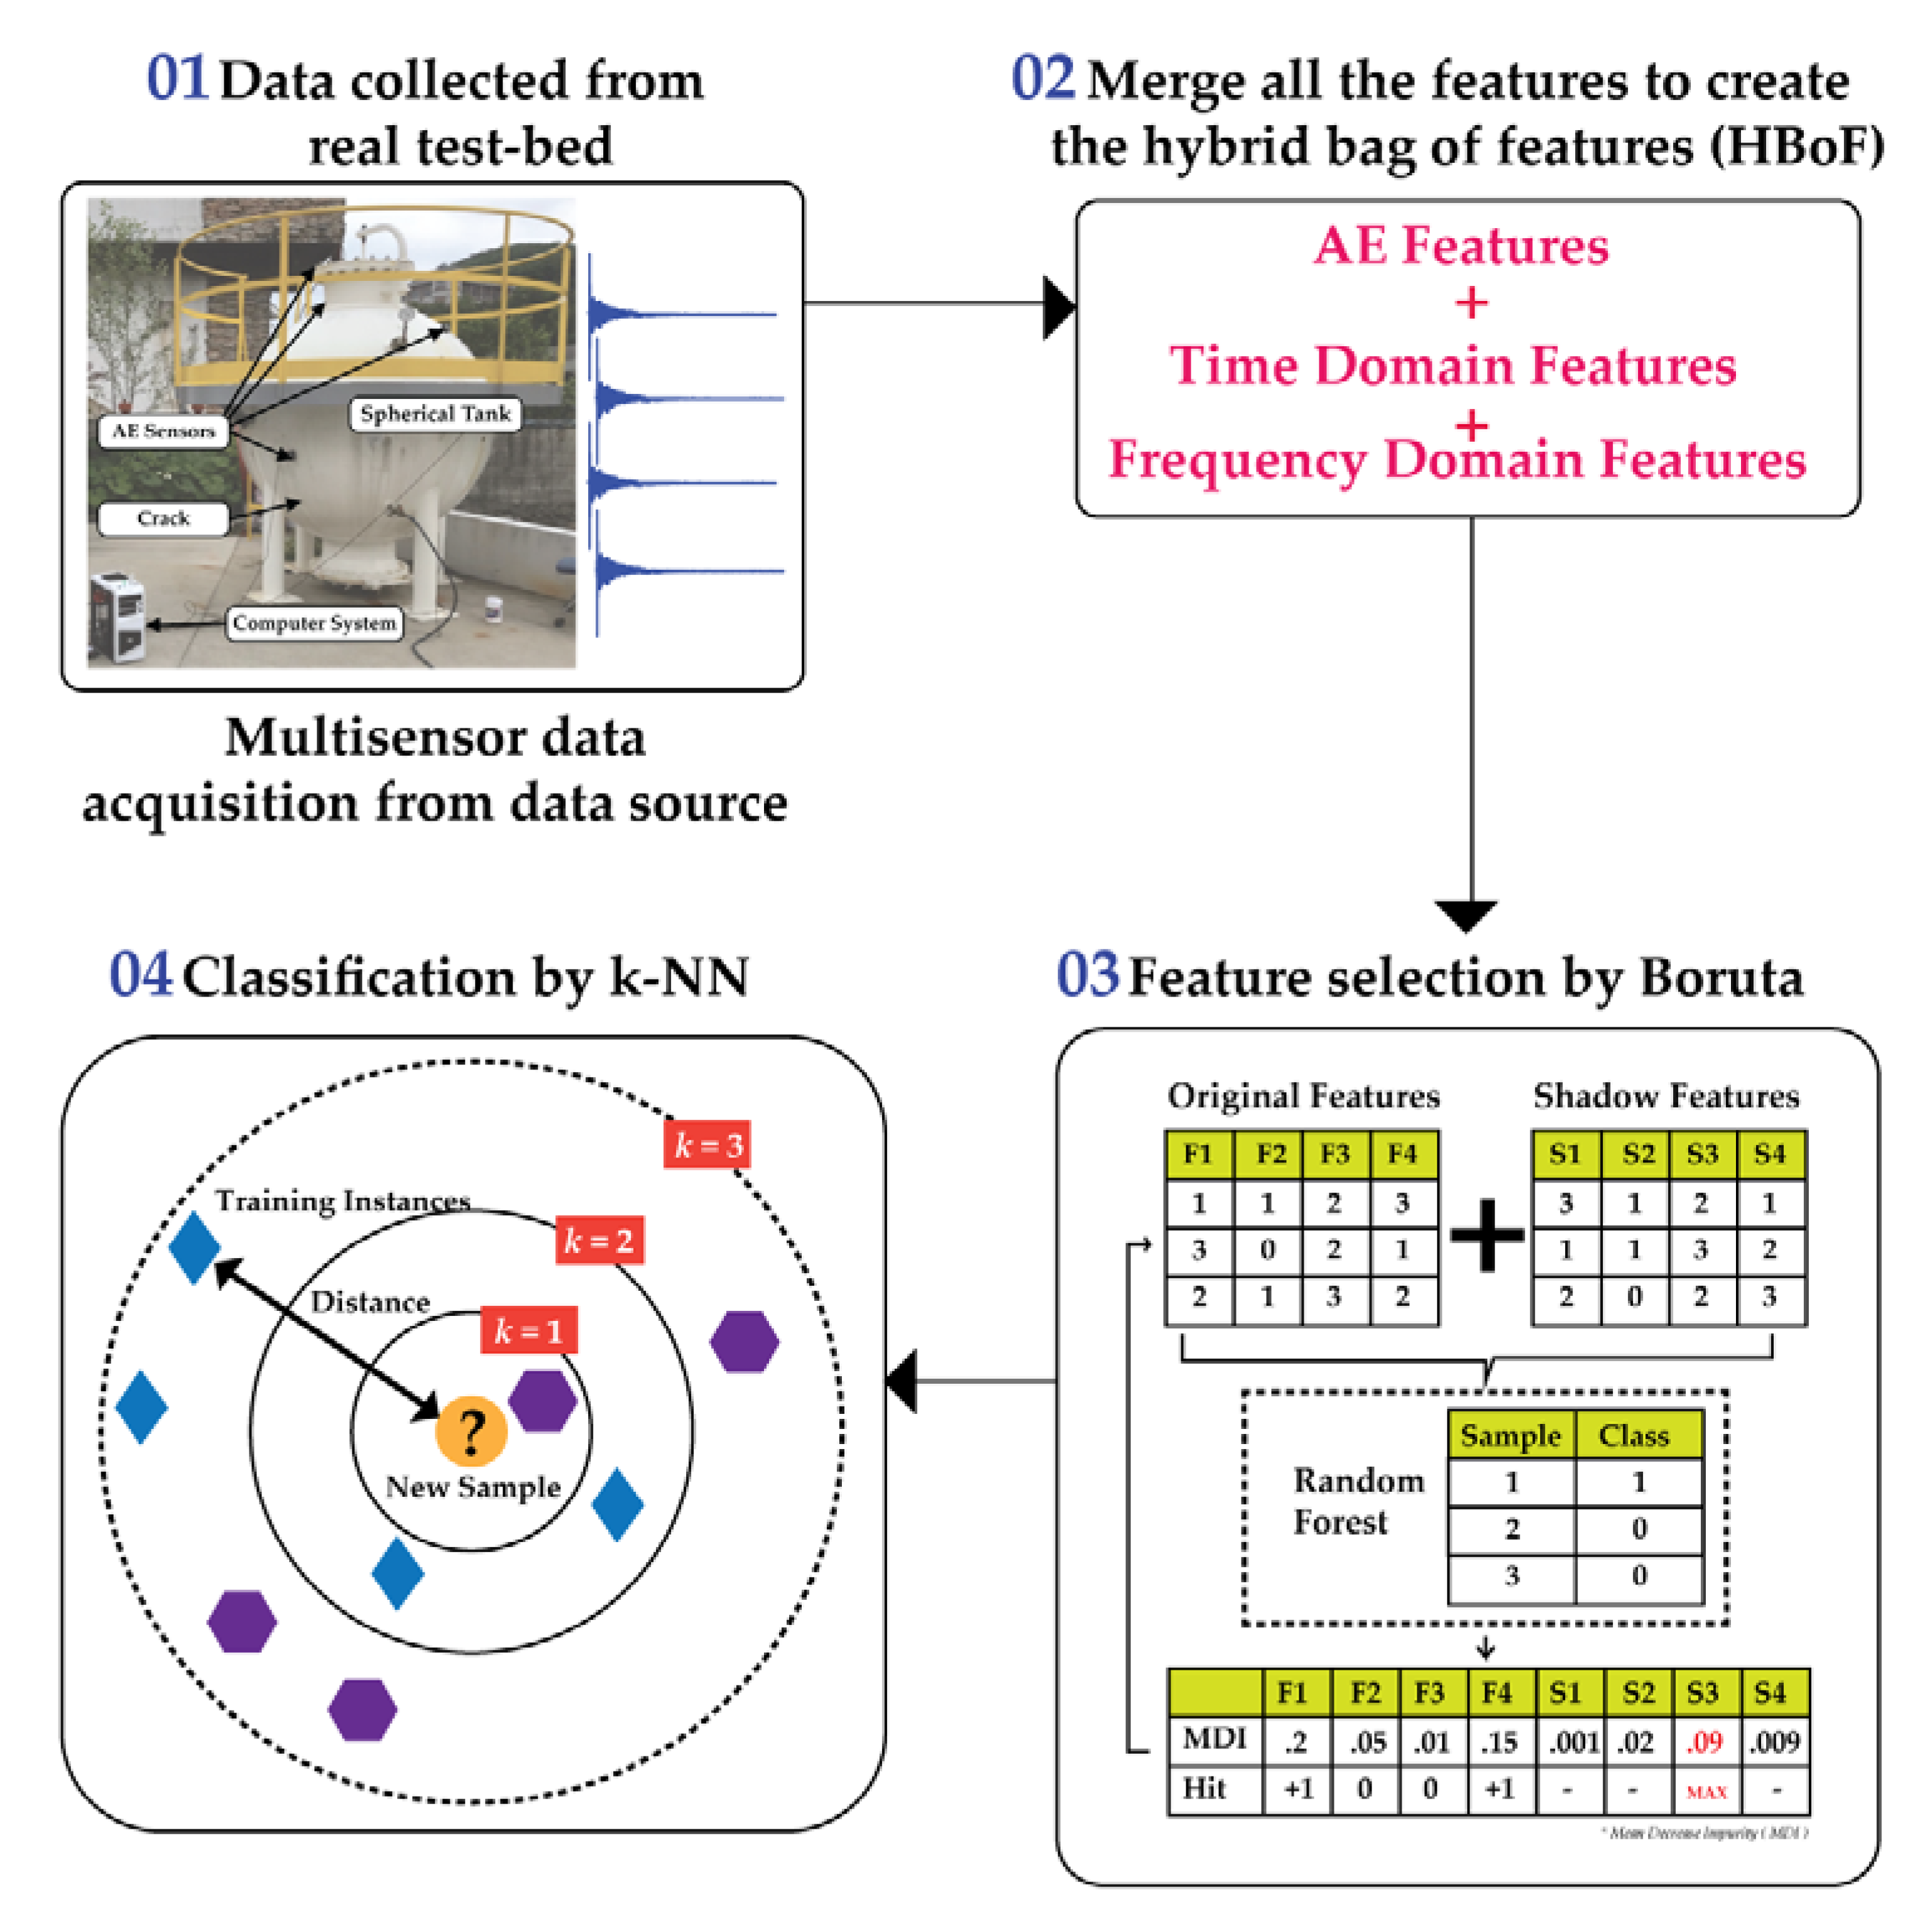
The proposed methodology is designed into four steps: (1) the AE data acquisition from a multisensory testbed, (2) feature extraction from AE, time, and frequency domain to create the HBoF, (3) feature selection by Boruta, and (4) k-NN-based multiclass-classification. Figure 1 demonstrates the total proposed approach.
2.1. Data Acquisition Set-Up
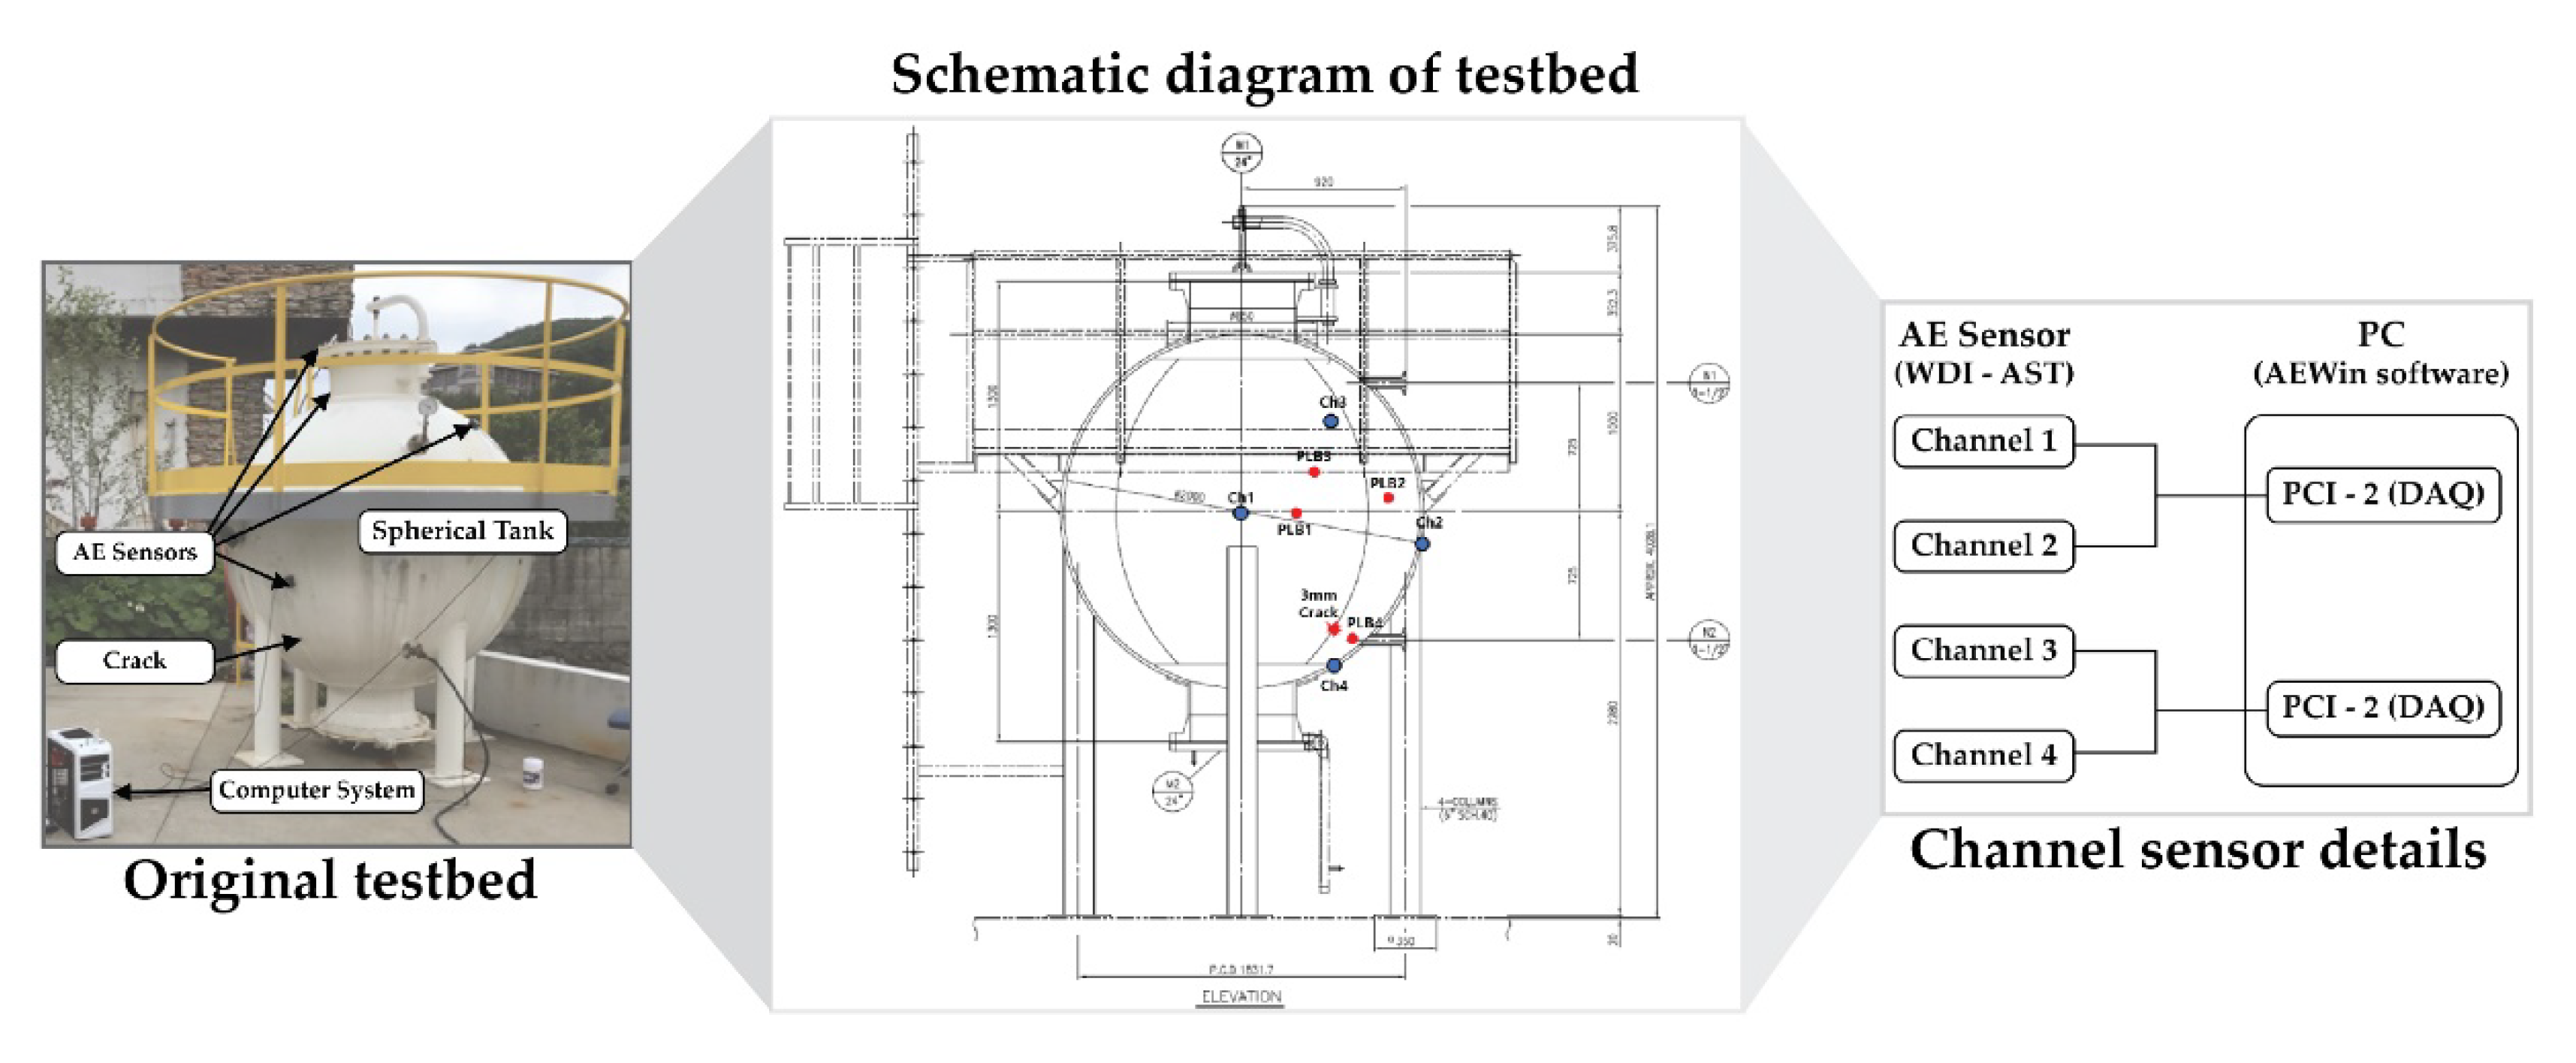
To authenticate the competence of the proposed health state classification of the tank, tests were achieved by using a data acquisition mechanism on the basis of code of ASME BPVC.Version-2015 [12,13]. For collecting the AE signal from the testbed, a carbon steel made (specification: A283 grade C) spherical tank is used. To record the signals, a PCI 2 based data acquisition device [7] was utilized. The original testbed with the full schematic diagram of the tank architecture, and the channel (sensor) plan of the acquisition system are demonstrated in Figure 2.
2.2. Hybrid Bag of Features (HBoF)
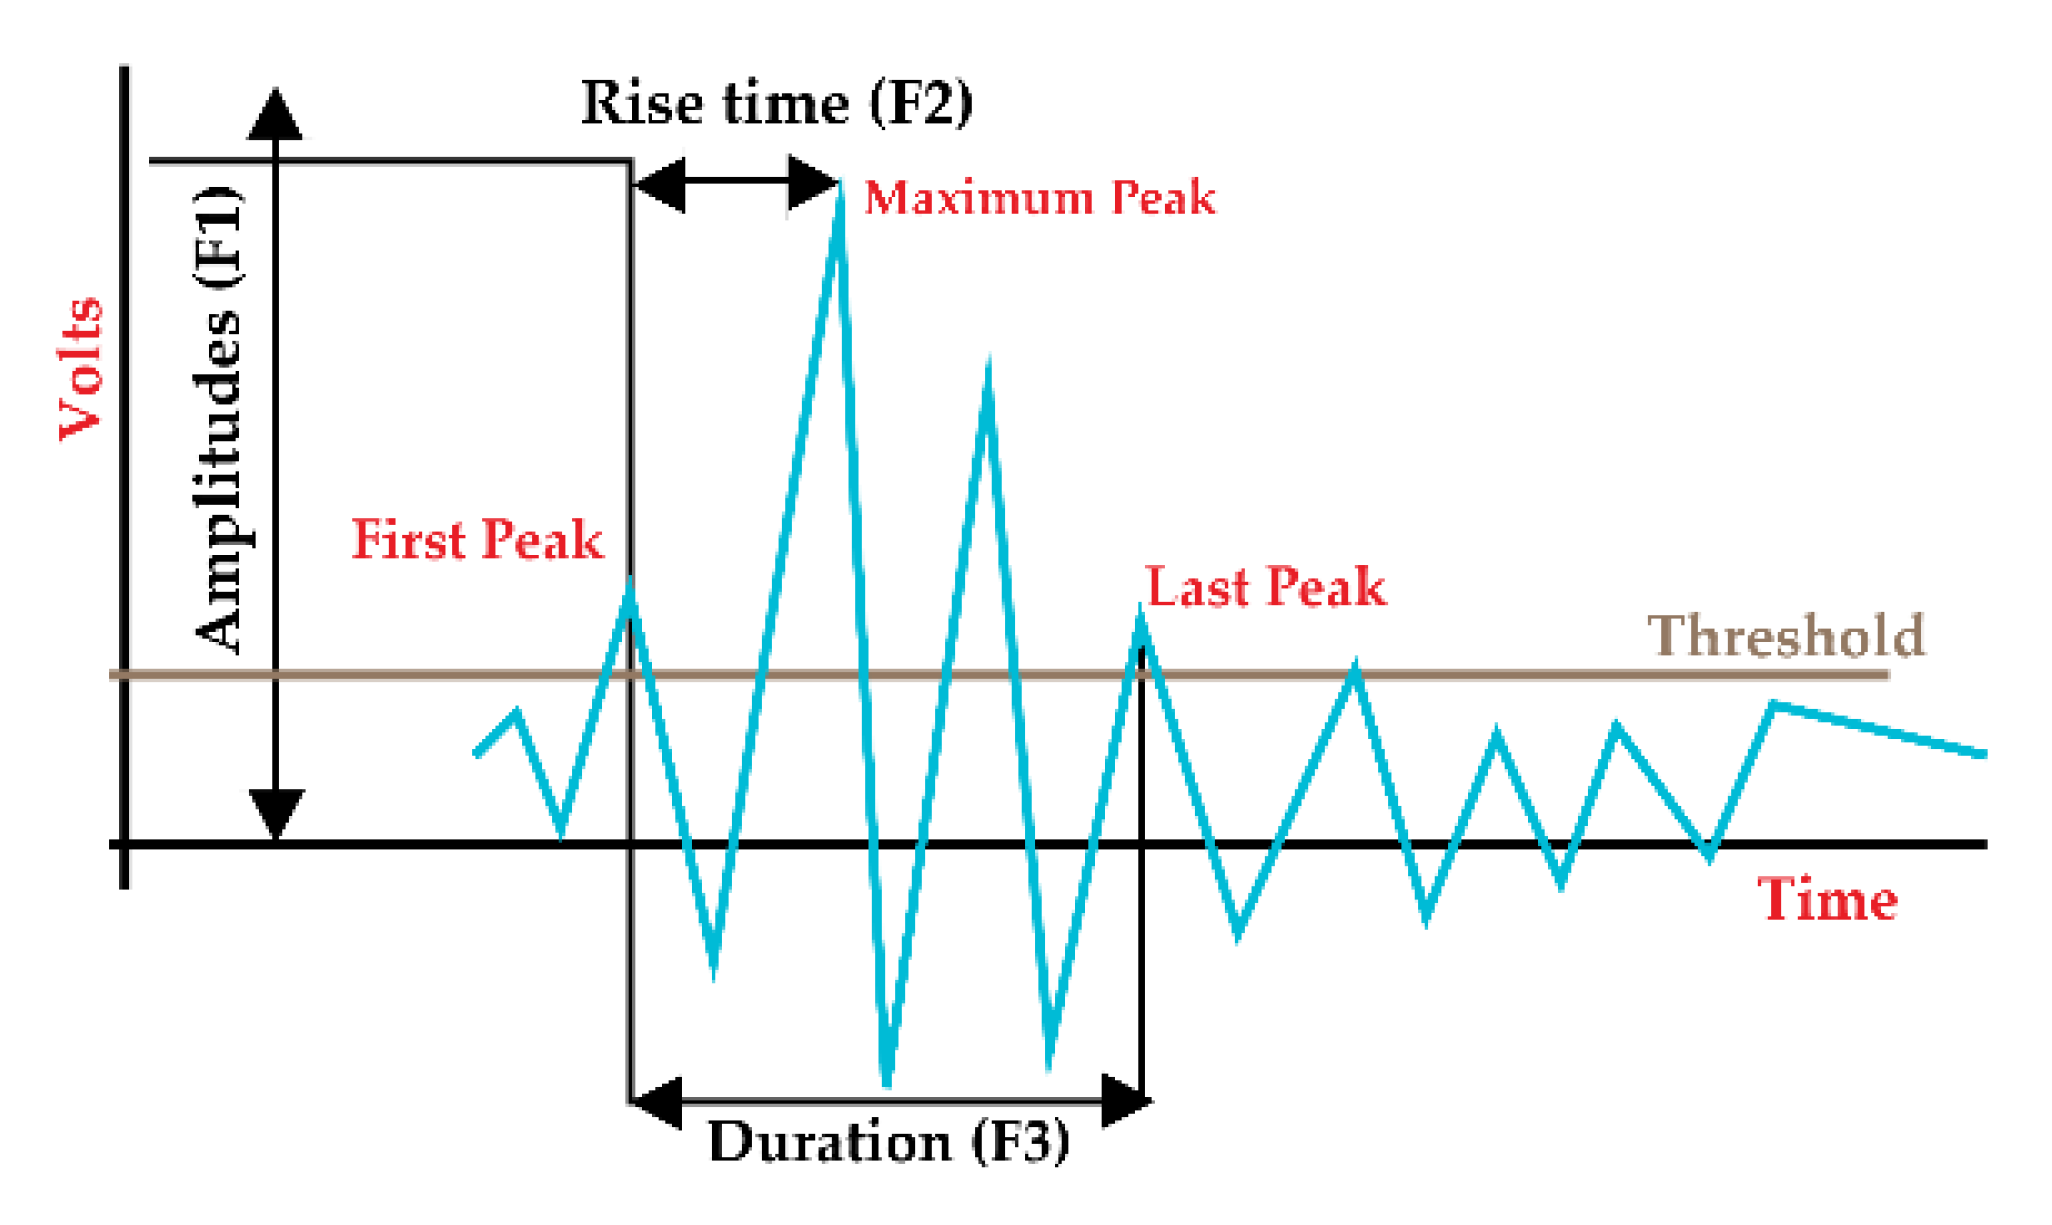
To generate the health state-based feature matrix, two different sets of features are considered. For the characteristics of the AE domain, the amplitude (F1), rise time (F2), and duration (F3) of the signals are computed. For the threshold value, the rms of the signal is considered. The specifics of the AE features are demonstrated in Figure 3.
For statistical analysis, from the frequency domain, the numerical features obtained are root mean square (F4), kurtosis (F5), skewness (F6), shape factor (F7), impulse factor (F8), root mean square (F9), kurtosis (F10), and skewness (F11). Thus, in total, 11 features are extracted to create the designed HBoF. In Table 1, the numerical details of these statistical features (F4 to F11) are described.
2.3. Feature Selection by Boruta
Feature selection keeps a great effect on the performance of machine learning algorithms. In the supervised algorithms, the identity of the labels is identified, and different feature extraction algorithms are applied to obtain the intrinsic set of features from the given data. In a practical scenario, while dealing with data, it is very common to have redundant and less information into the data. The main purpose of selecting set of features is to get rid of that redundant information and reducing the data-dimension. Generally, feature selection algorithms do this part. However, there are dimensionality reduction approaches also, by which the dimension of the data can be reduced. While both types of algorithms are applied for lessening the number of features, there is a critical difference. Feature selection algorithms just pick and ignore given features without transforming them. Therefore, dimensionality reduction algorithms changes feature into a lower dimension by both linear and non-linear data analysis. For the studies related to feature analysis, the feature selection algorithms mainly serve two purposes, i.e., (a) dimensionality reduction of the data and (b) finding out the important non-redundant attributes from the data. For these reasons, in this study, the feature selection algorithm is considered over dimensionality reduction techniques.
Feature selection algorithms have the nature to select only the non-redundant attributes from the data. If from a dataset, the analysis demands to find out all the relevant attributes rather than the non-relevant ones, feature selector algorithms cannot do that. These algorithms can pick only the non-redundant ones but miss those redundant attributes which are relevant and important. To solve this problem, the necessity of wrapper method arises [14,15]. To solve this purpose, a wrapper-based approach is considered in this research [16].
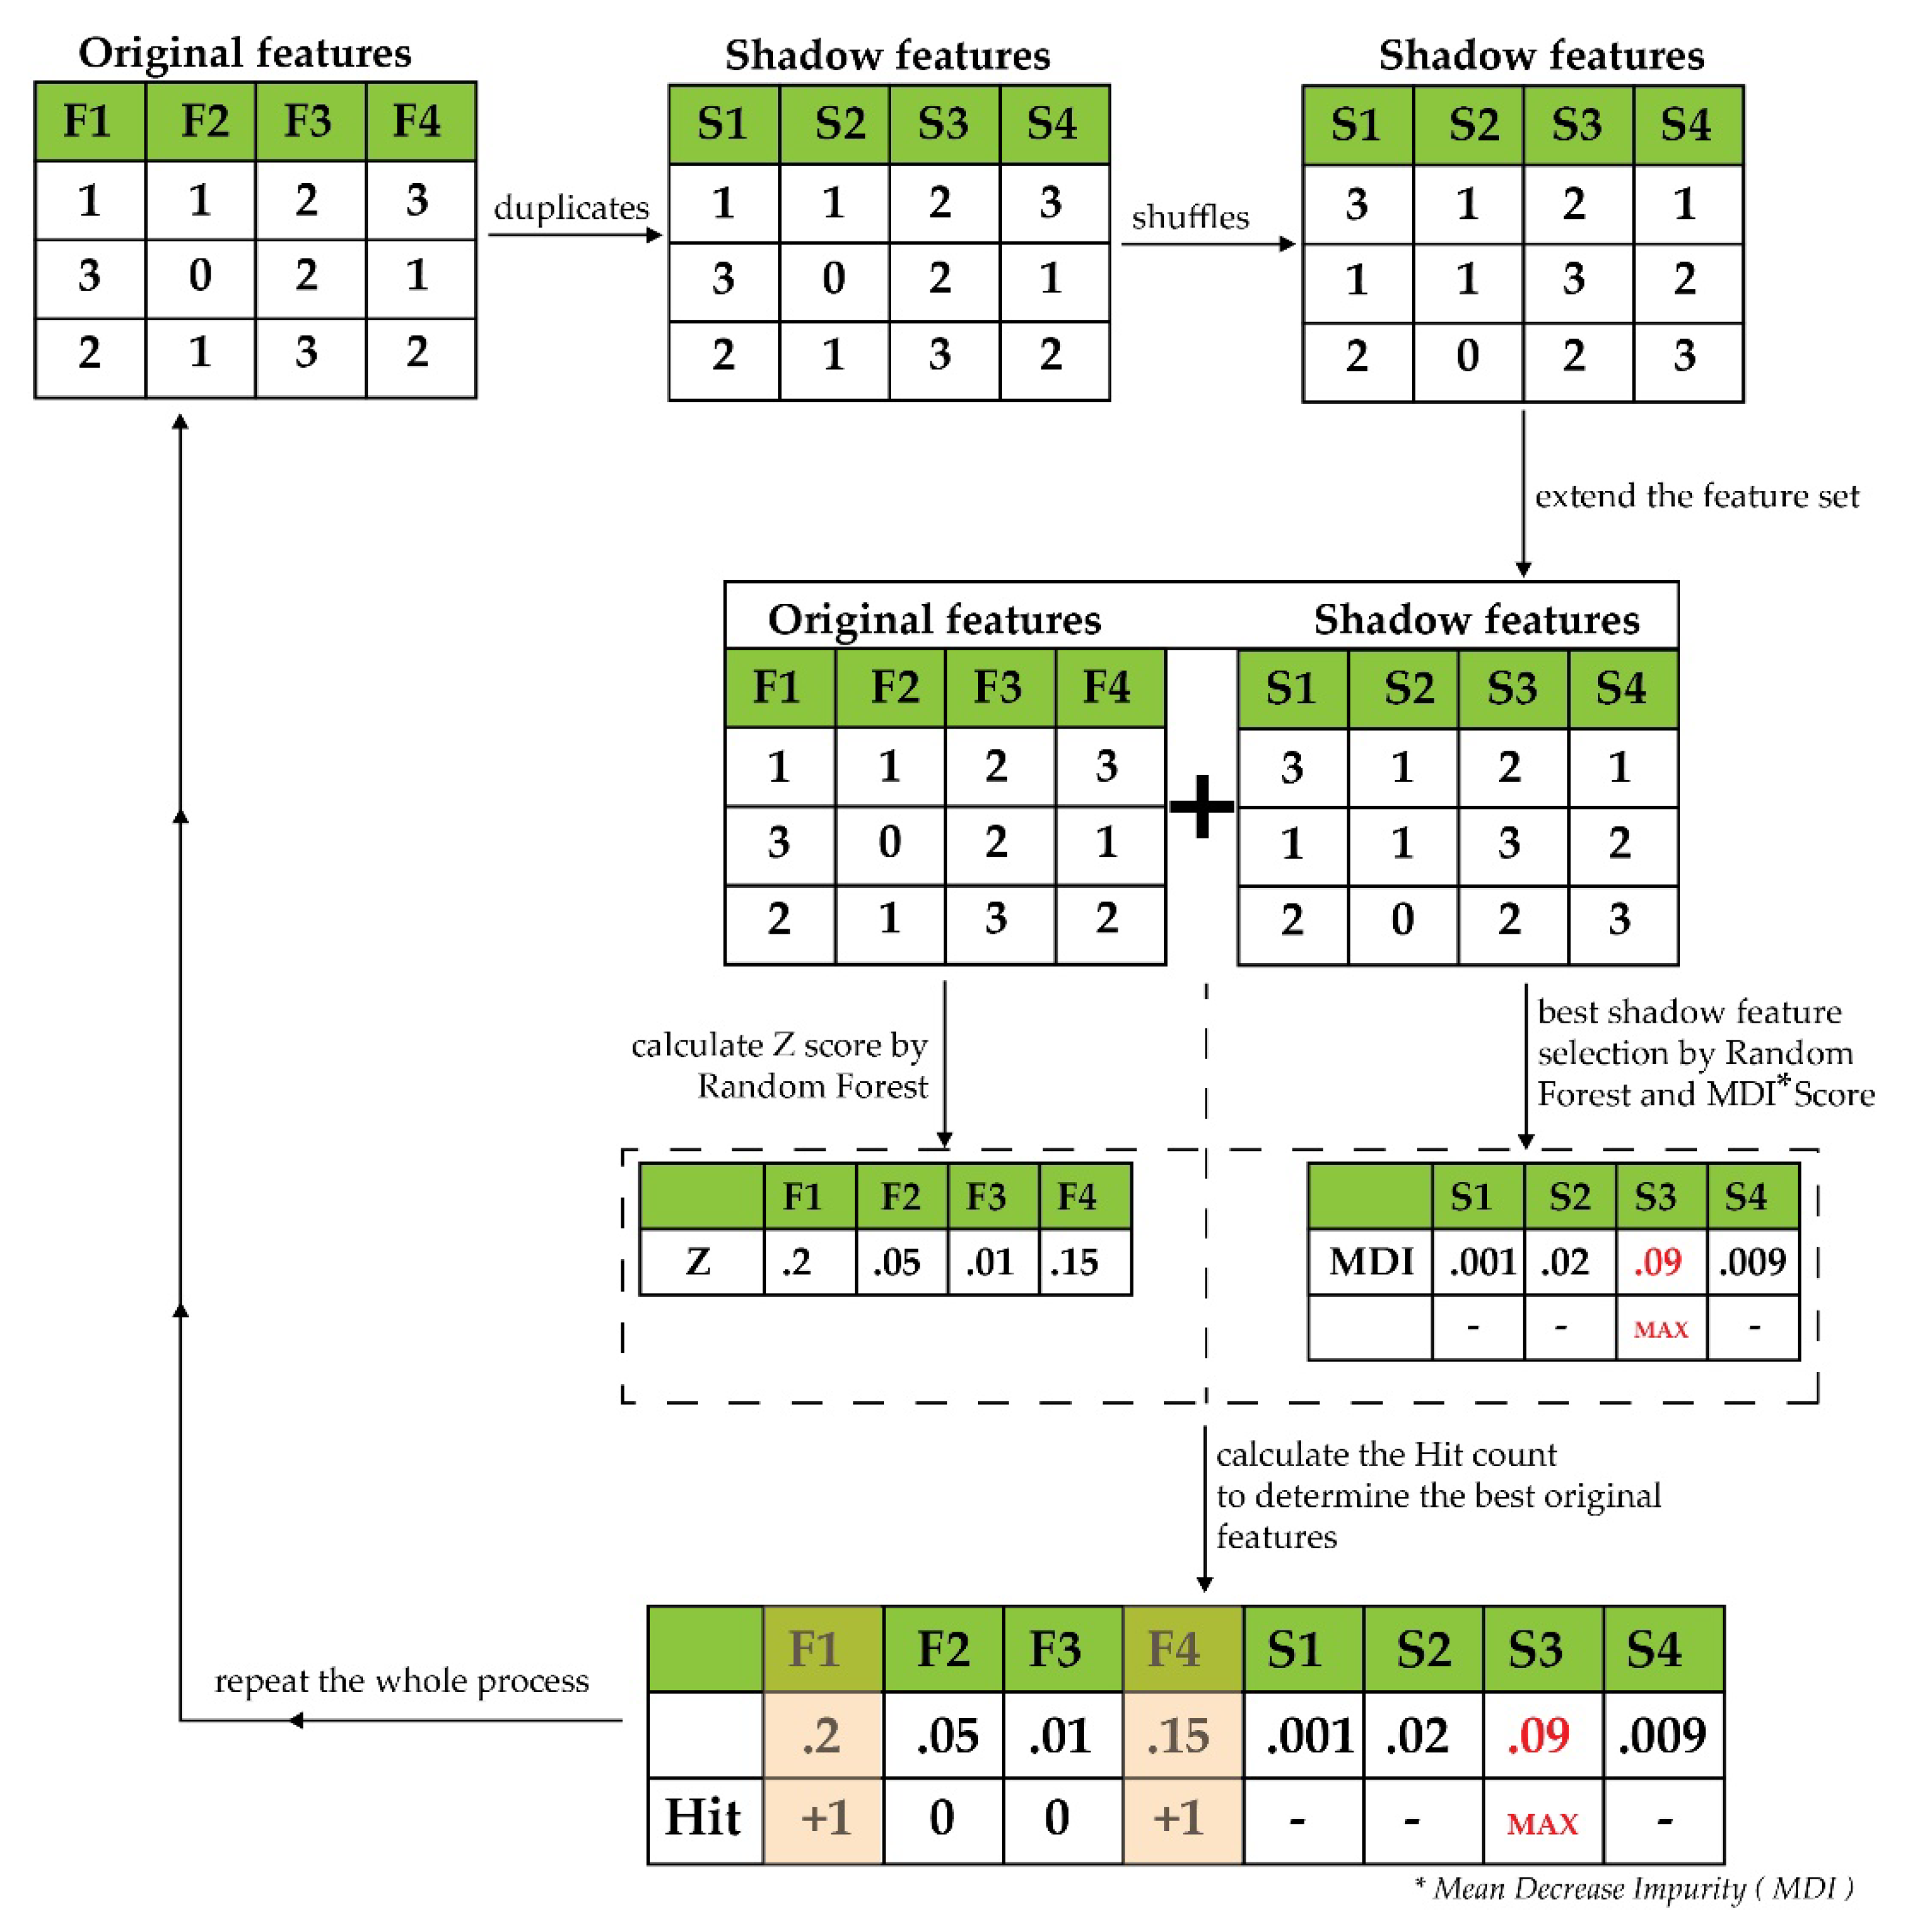
Boruta first clones the given set of features to extend the provided information. These clones of features are identified as shadow features. After that, it rearranges the elements of the cloned shadow features to eliminate the correlations. Then, to validate the significance of features by the mean decrease impurity (MDI), it trains the shadow features with random forest (RF) classifier. MDI determines the significance of each cloned feature. The shadow feature containing the highest score of MDI is counted as the best. Now, to determine the importance of the provided feature attributes, the algorithm make a test with only the provided real features (excluding the cloned shadow features). For this objective, the Z score is considered. The algorithm evaluates whether the provided feature has a higher Z score than the maximum of its shadow feature. If the score is high, it is recorded in a vector known as hits. Thus, the iteration is continued until reaching the predefined set of iteration numbers and, at the end, a hit table is generated. With every iteration, the algorithm determines the feature with the best Z score and marks it as important. From the hit vector, the final setoff features are acquired. The whole of the techniques from the start till this part are echoed until the importance is designated for all the provided set of feature attributes [11,14]. The steps of this algorithm are demonstrated in Figure 4.
2.4. K-Nearest Neighbor Algorithm Based Classification
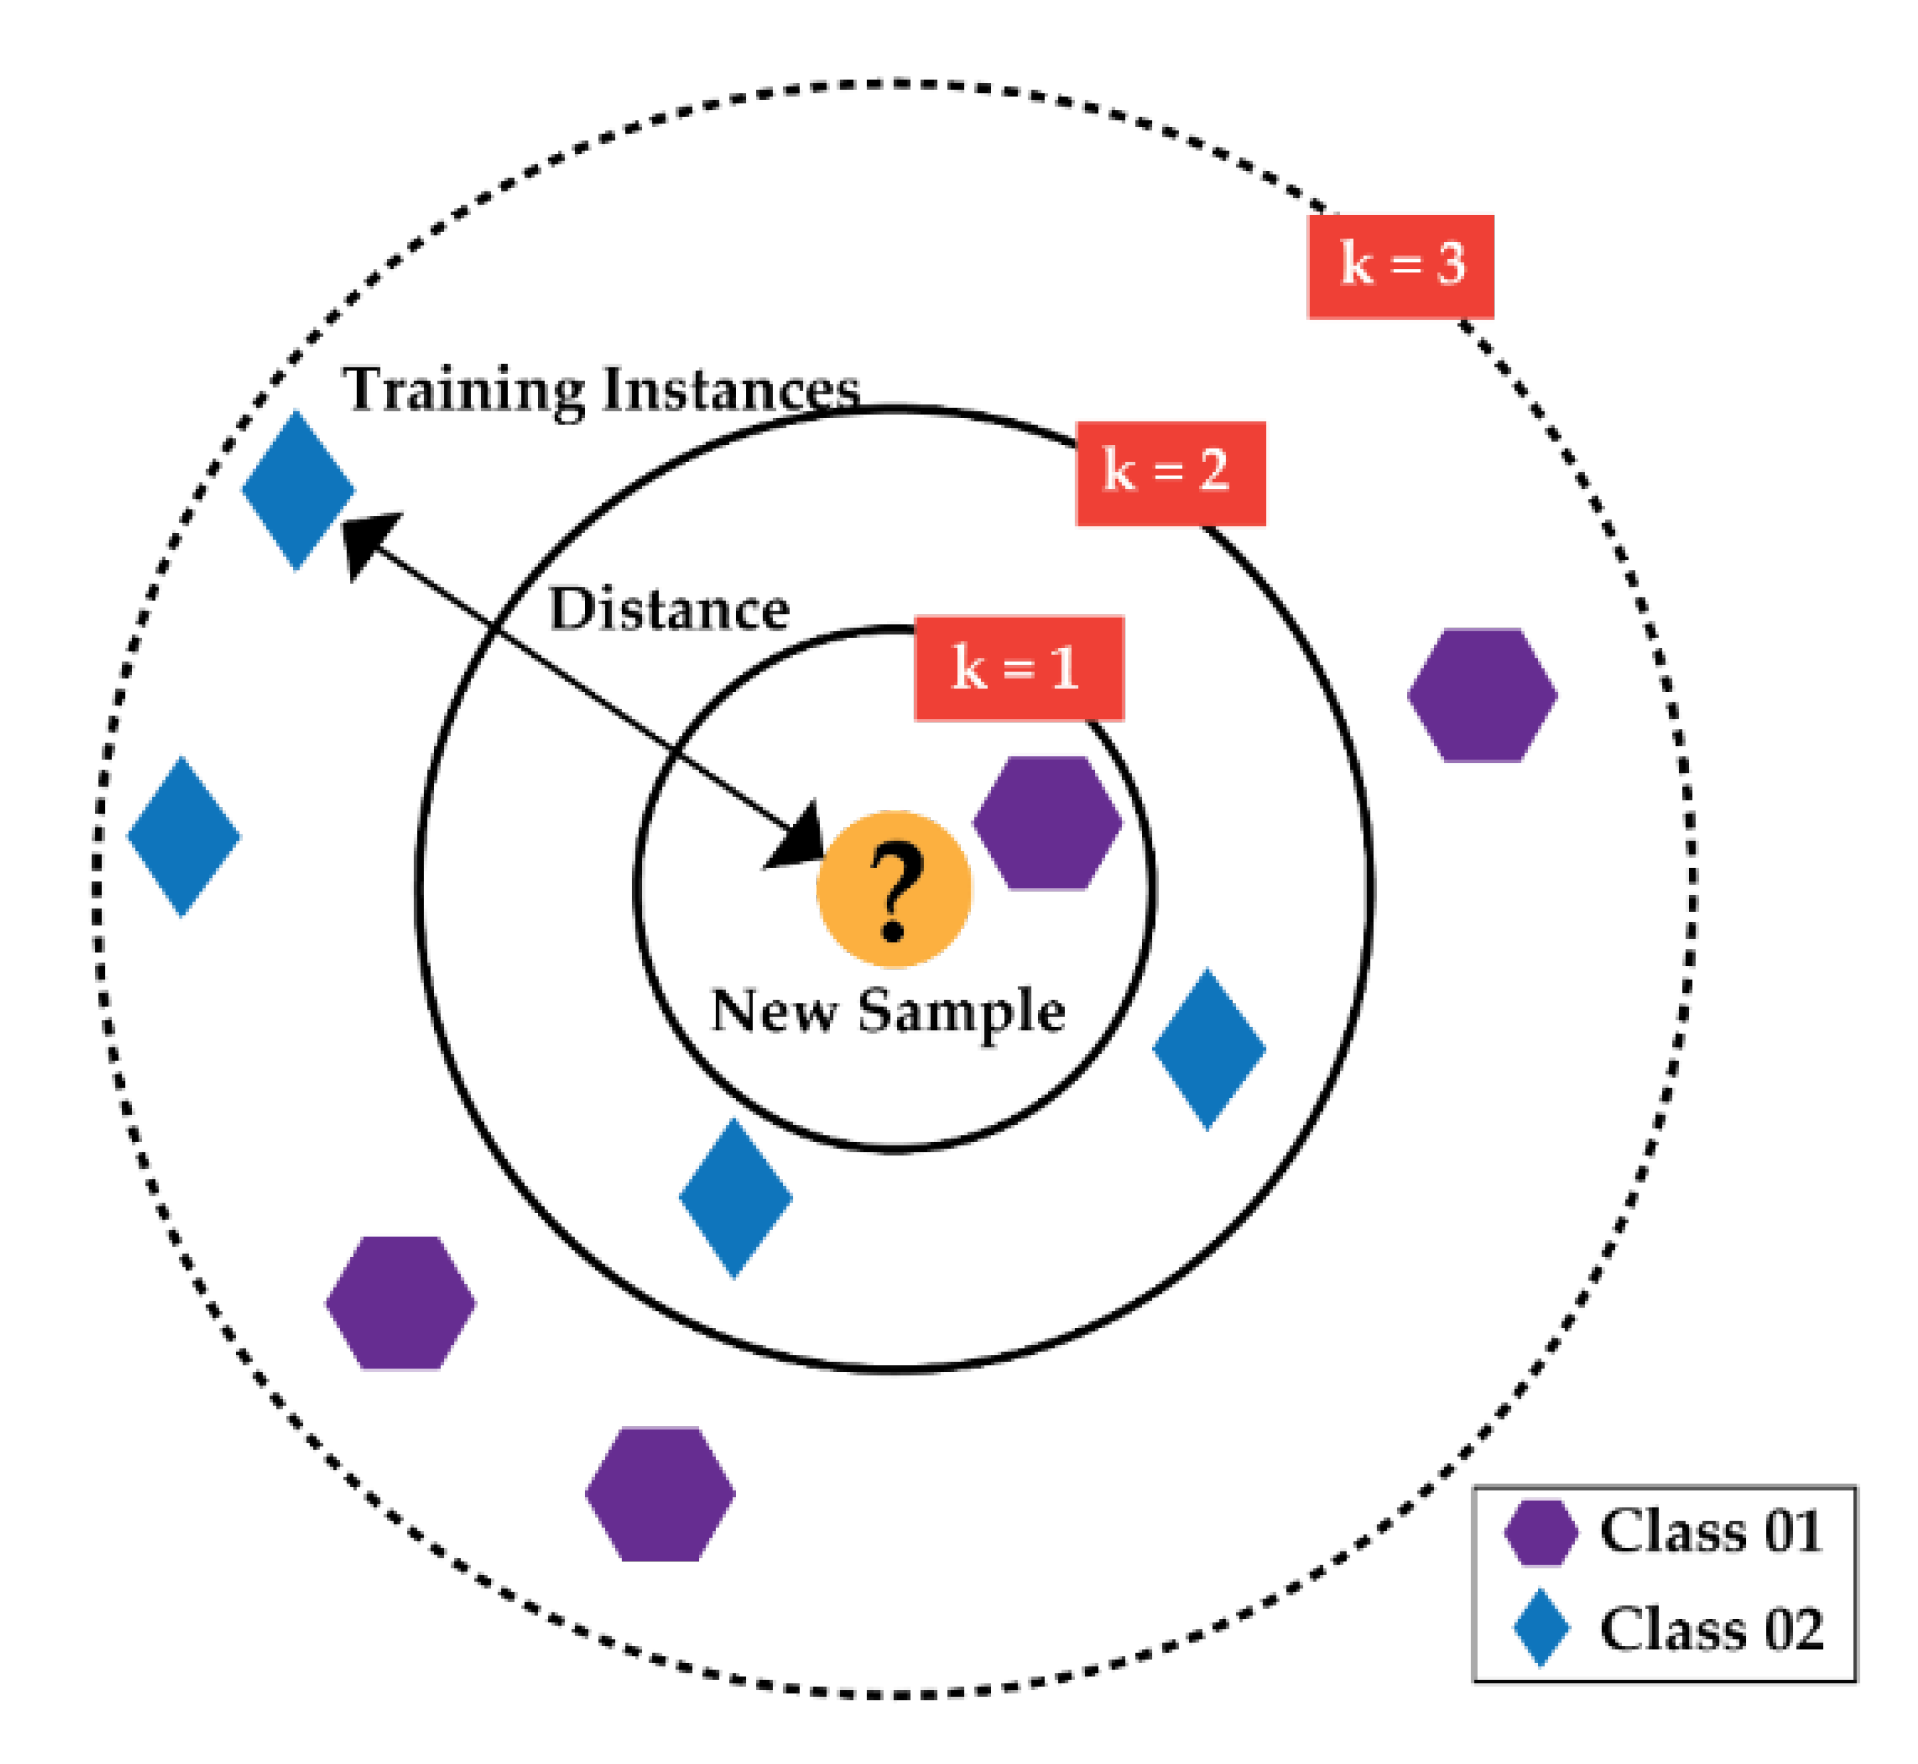
With the help of k-NN algorithm, the final classification is performed with the provided final set of features by Boruta. The benefits of this algorithm is the easiness in developing construction and less computational complexity [17,18]. This algorithm works on three main principles: (1) determine the space among the neighbors, (2) find the k closest neighbors, and (3) vote for labels. Figure 5 illustrates the details of the k-NN algorithm [11,13].
In this study, the considered dataset is allocated with a 70:30-train: test ratio. After that, a cross-validation of eight-fold is achieved by using a spawned list of odd k’s varying from 1 to 15.
3. Result Analysis and Comparative Discussions
3.1. Dataset Description
The standard AE dataset of spherical tanks is used to conduct a test. A 0.1 s velocity signal with 1 MHz sampling frequency is used for consideration of each health state. The particulars of the dataset are provided in Table 2.
3.2. Performance Analysis of the Feature Selector Boruta
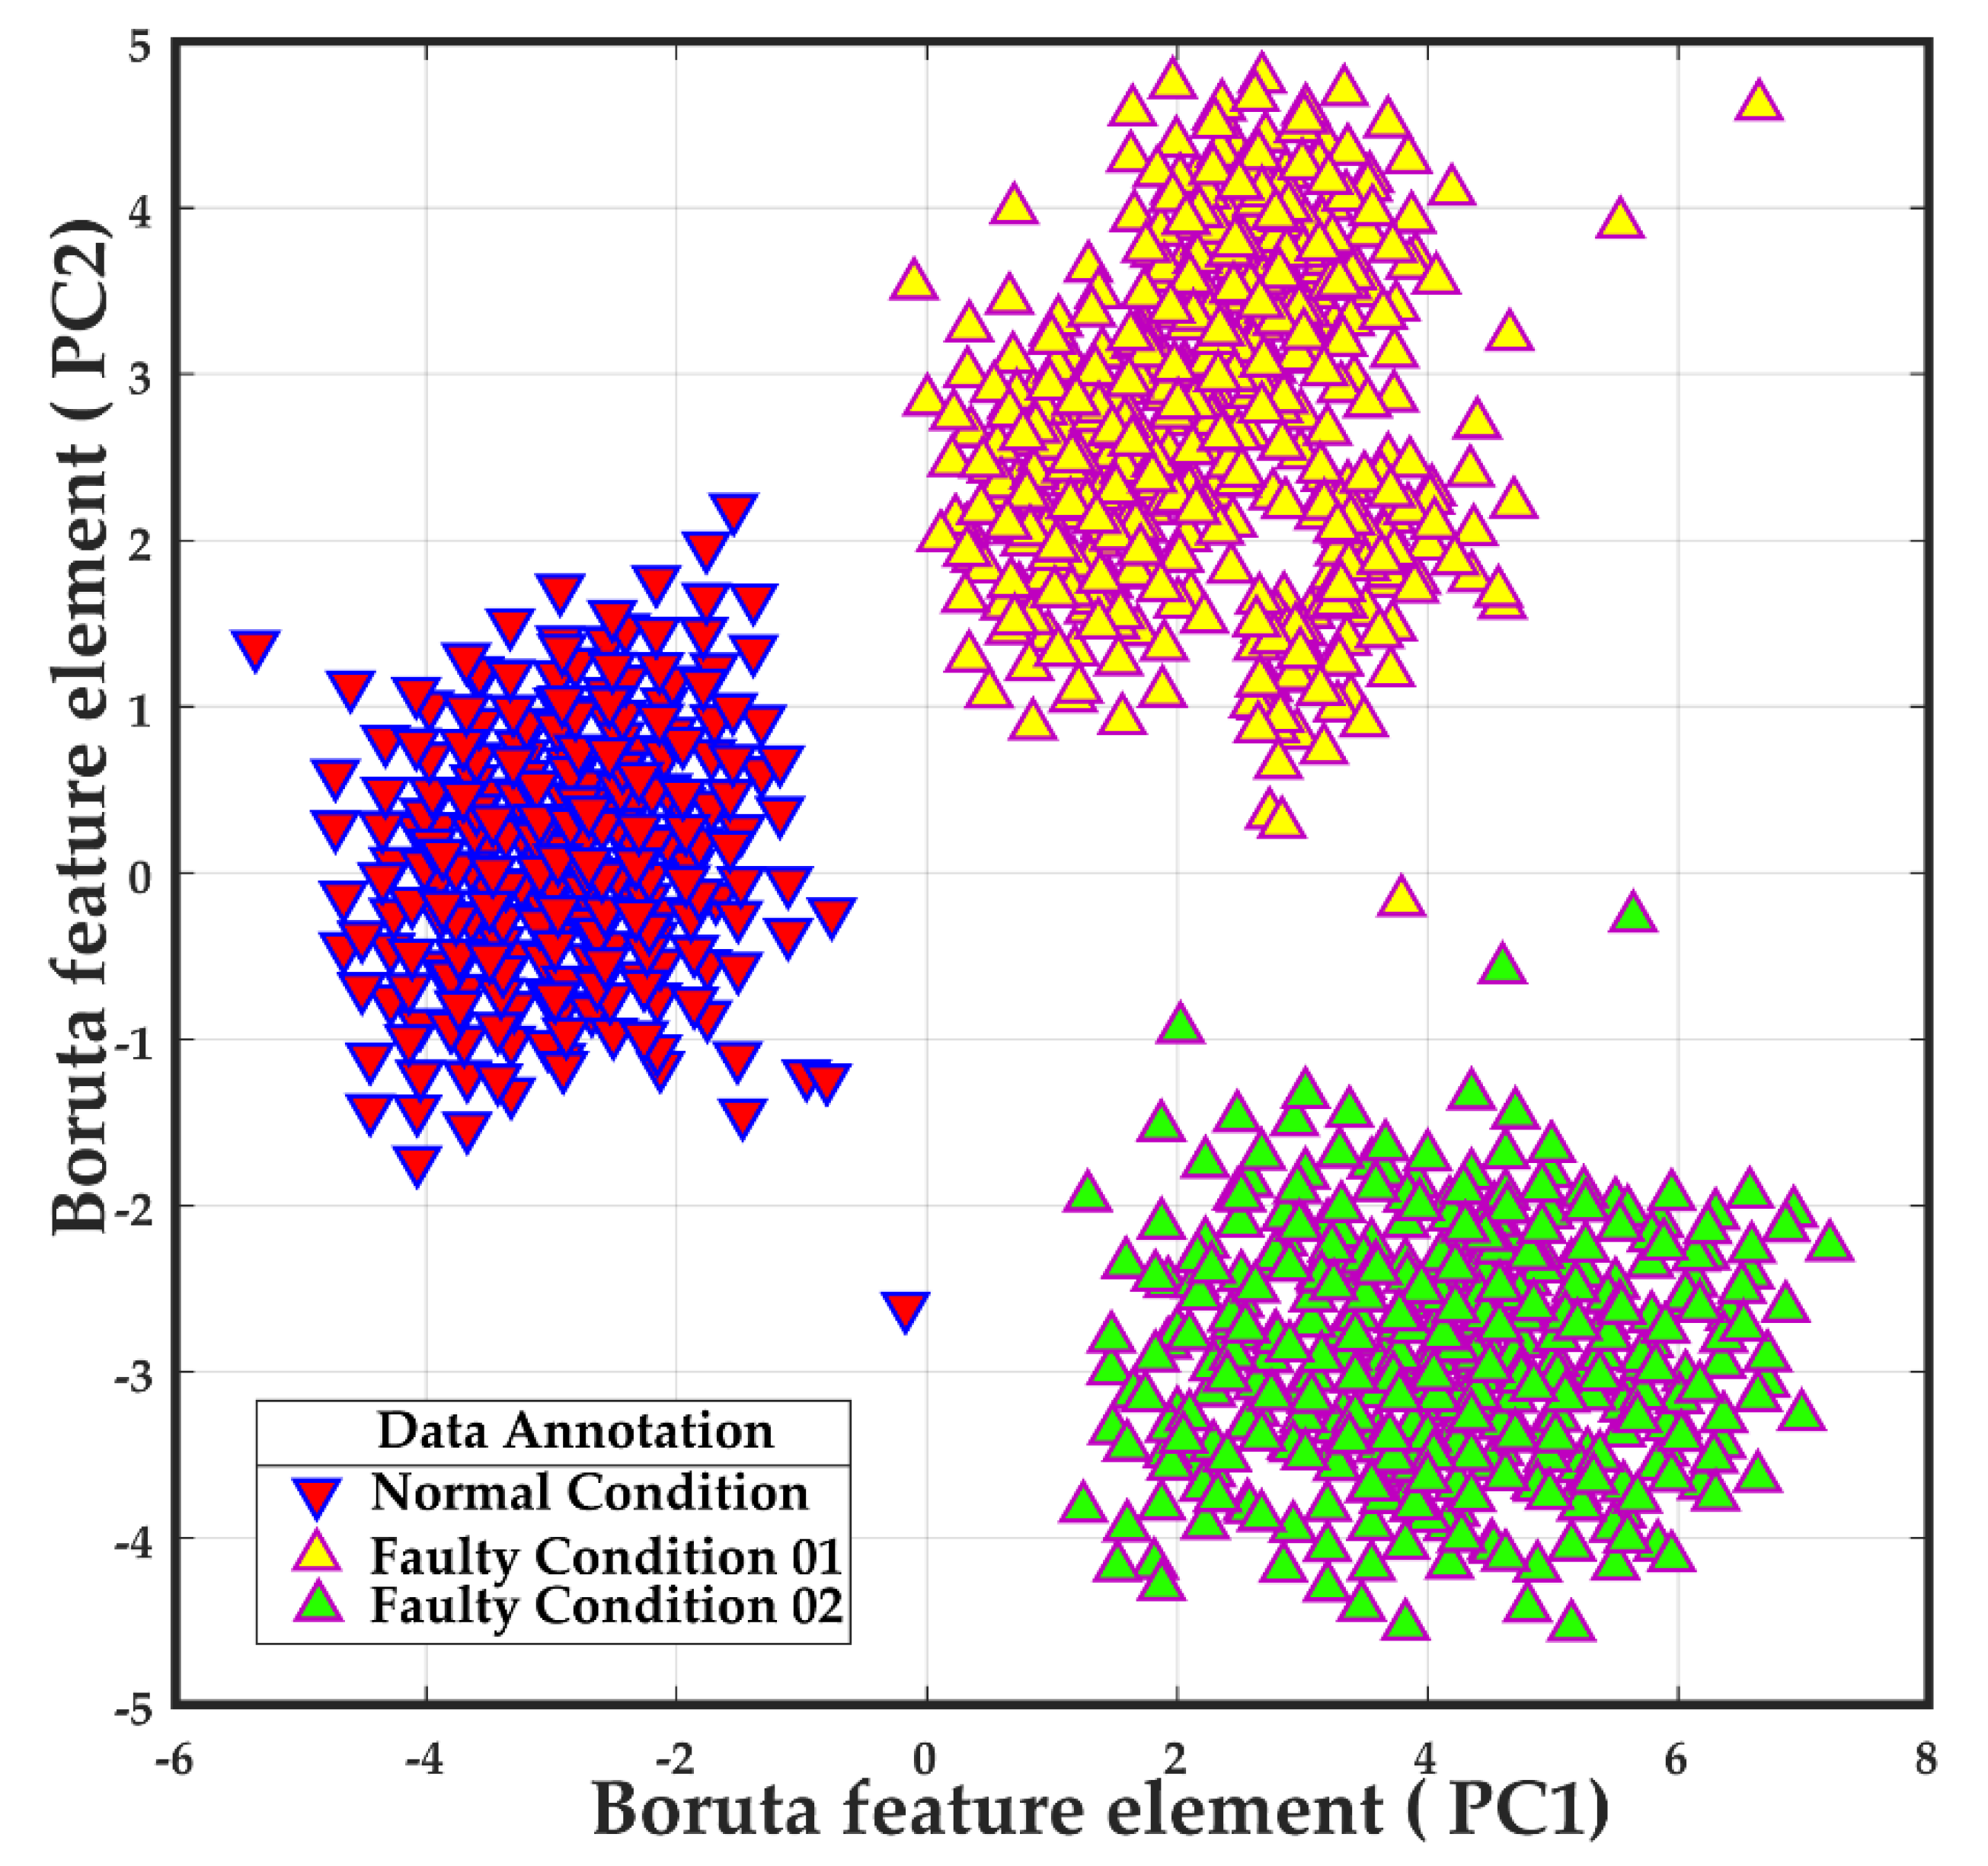
Raw AE signals have no intrinsic information to reveal different health conditions. Therefore, the HBoF is designed and Boruta is applied to get the most intrinsic feature information. From Boruta, the six most important features are calculated (i.e., F1, F3, F4, F5, F10, and F11). These six features are collected from AE analysis, time domain, and frequency domain. Figure 6demonstrates the Boruta-features in a 2D feature space. For the explanatory purpose, the selected six features are first constricted into two-dimensional space by principle component analysis (PCA) and then mapped into Figure 6.
3.3. Diagnostic Performance Analysis
The best possible feature subset captured by Boruta is given to the k-NN for multiclass-classification in a supervised manner. With the help of Equation (1), the class-based accuracy is calculated. The Equation (1) is counted as the precision (positive predictive value) for machine learning based algorithms for classwise accuracy. Therefore, in this study, the precision score is considered as the main performance parameter to determine the best performance. In this equation, the term “true positive” refers to the correctly classified samples from the provided test data to the algorithm. Similarly, the term “false positive” refers to the negatively classified samples.
Therefore, with the help of Equation (2), the average of classification accuracy is computed.
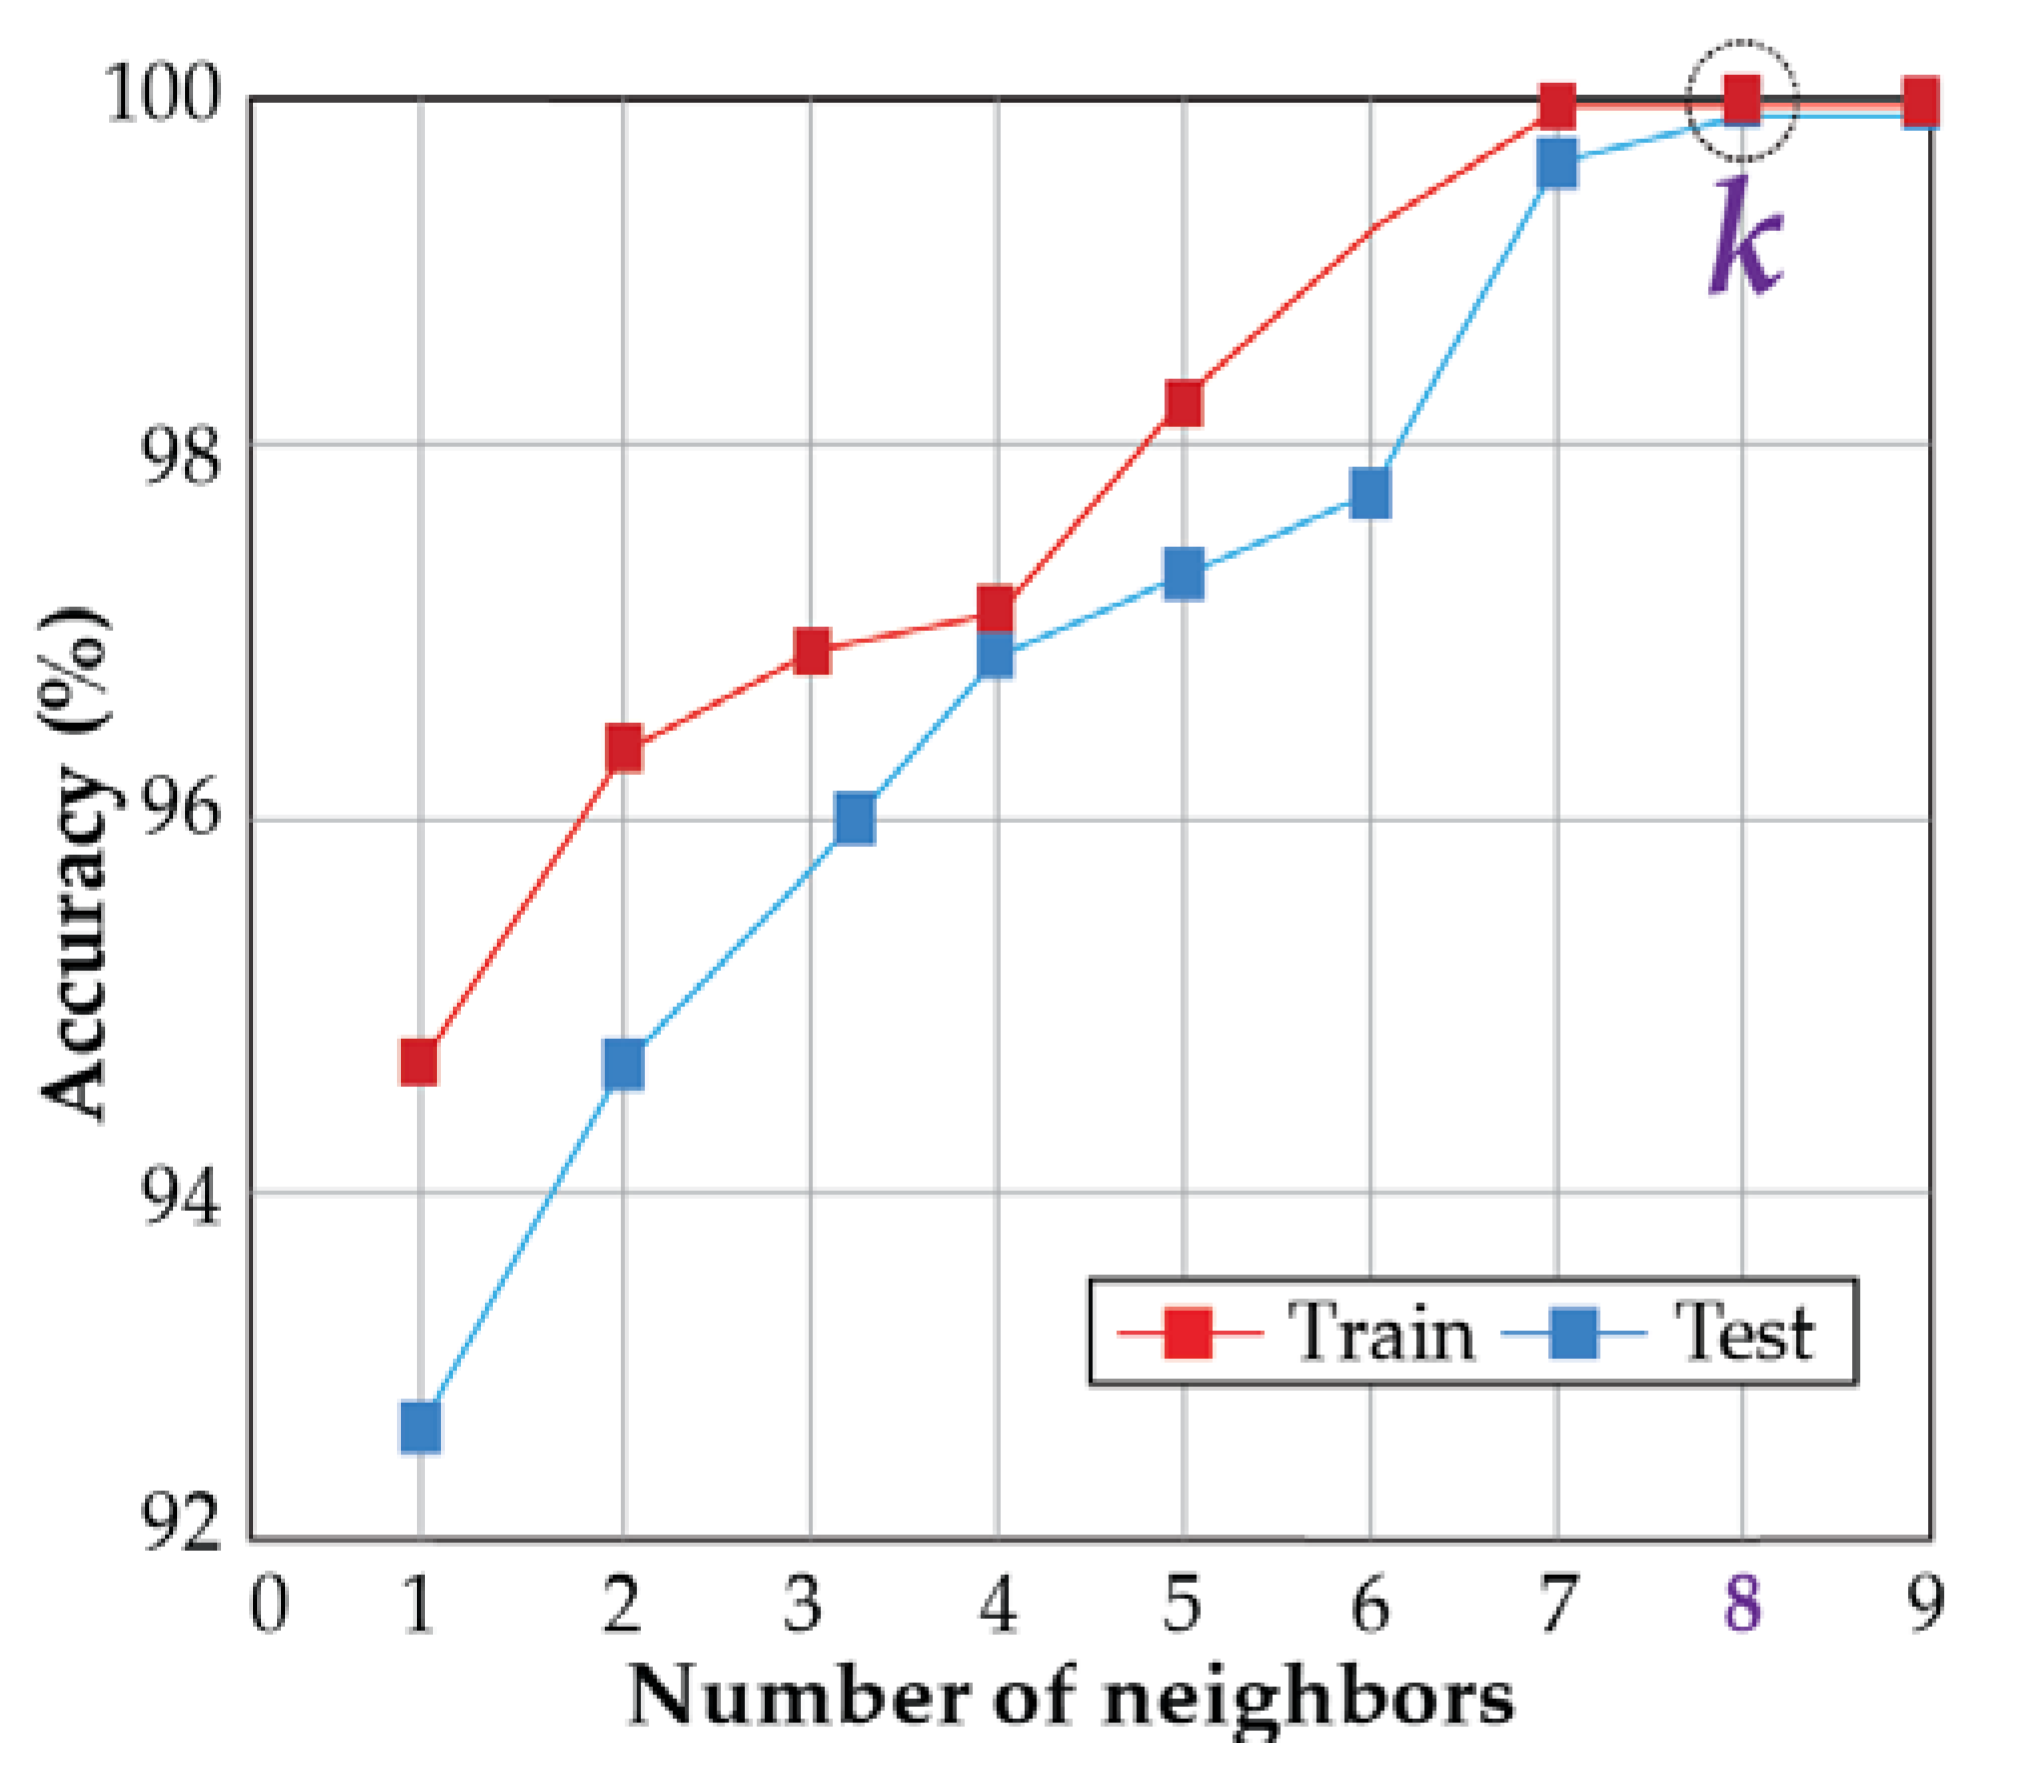
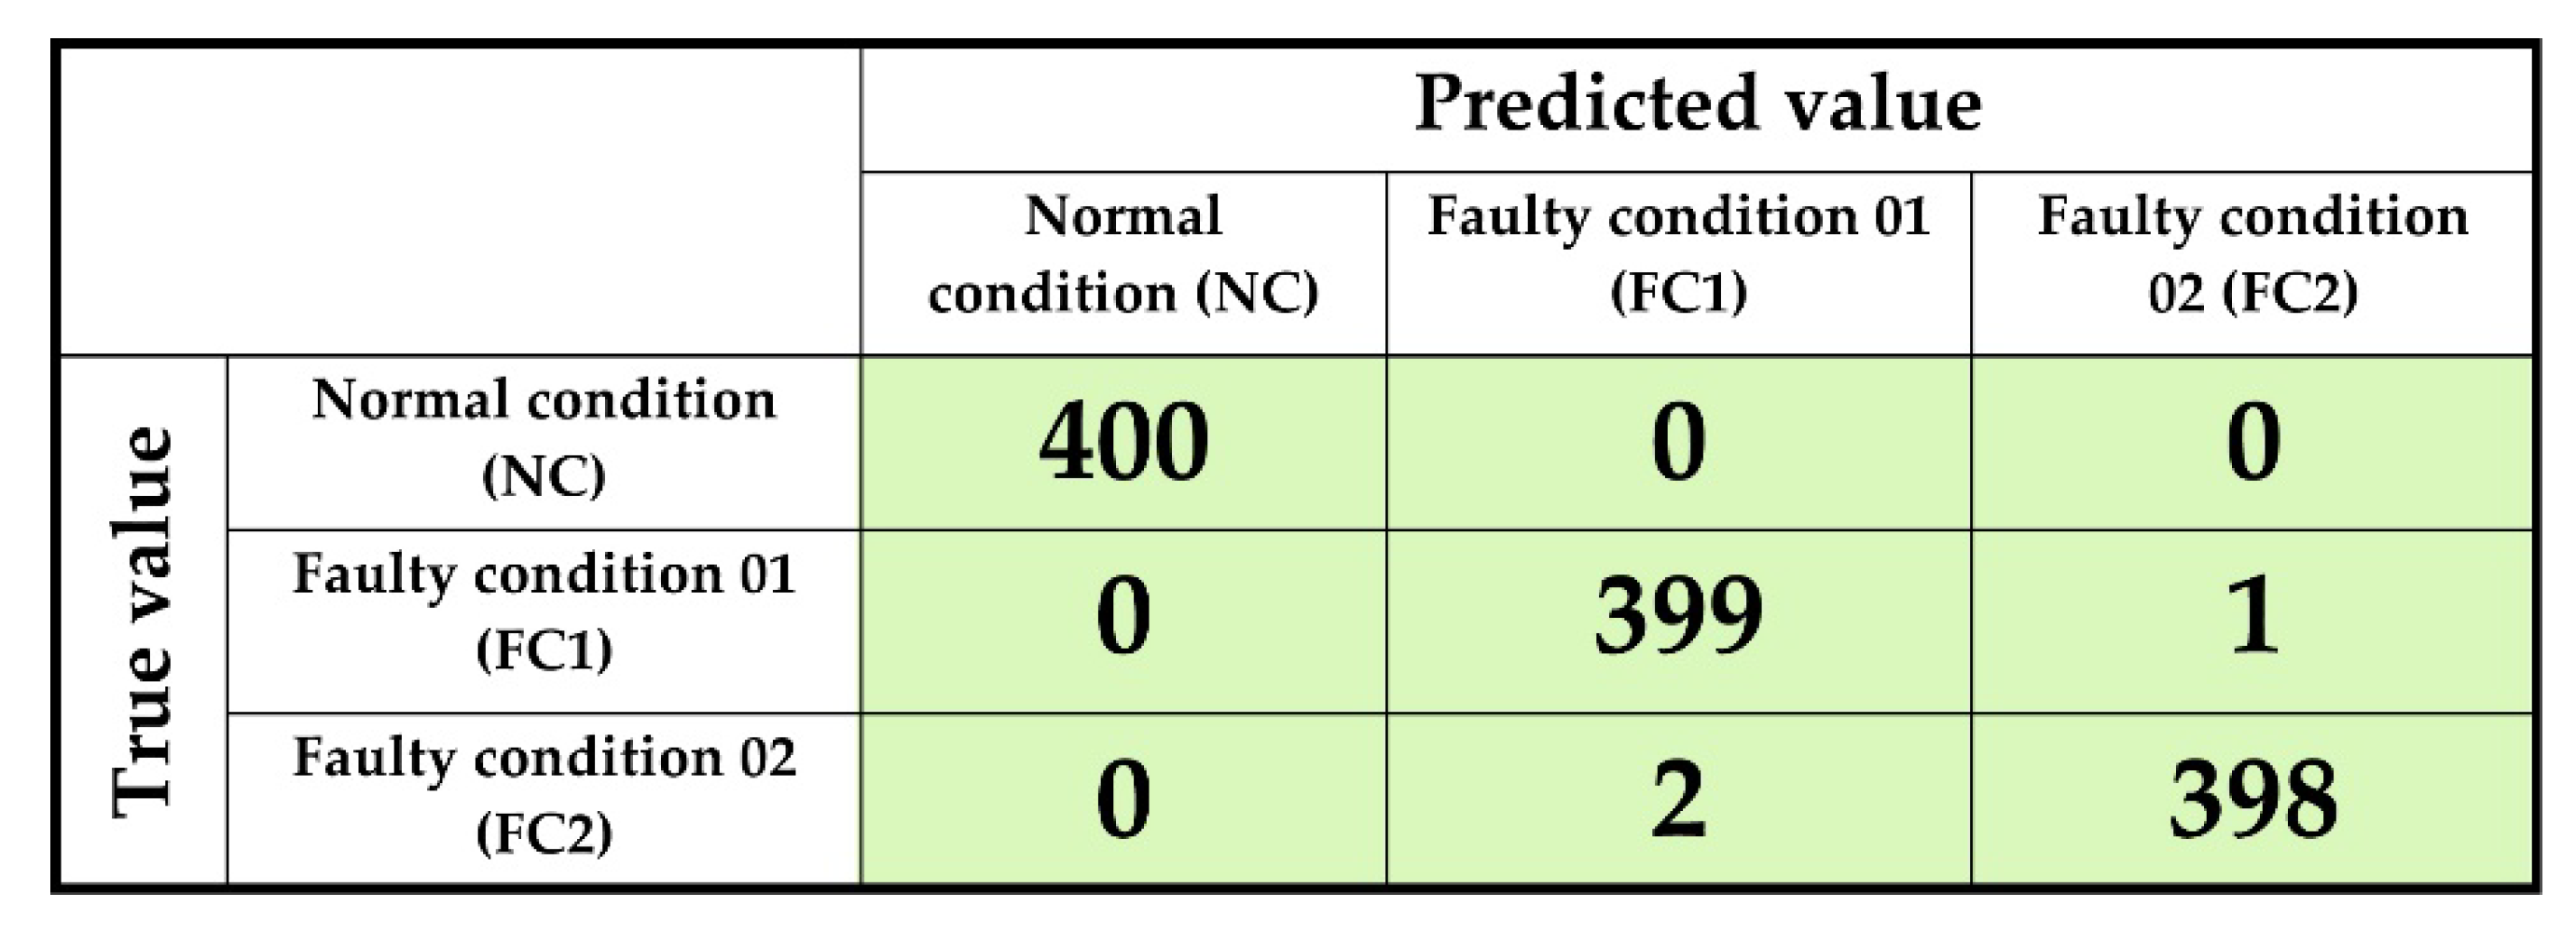
To obtain the final classification accuracy, eight-fold cross-validation is used. The final accuracy is obtained after eight-fold cross-validation. The proposed approach achieves 99.7% classification accuracy when the optimal value of k is eight in k-NN algorithm (illustrated into Figure 7). Moreover, in Table 3, the performance analysis of the proposed approach is depicted in a very detailed manner. To verify the robustness of the suggested method, besides Equation (1) and (2), the recall (sensitivity) score, and F1 value is also calculated. For recall score, Equation (3) is used, and for F1 value, Equation (4) is utilized. In addition, Figure 8 illustrates the confusion matrix for the proposed approach.
Along with the proposed approach, several assessments are made to establish the robustness. Besides the proposed method, three approaches are measured for comparative study: (1) reduction of the feature space by using PCA to use the k-NN for final classification, (2) dimensionality reduction of the HBoF by t-SNE and then usage of k-NN for final classification, and (3) taking all the features into account to use the k-NN for final health classification. In Table 4, the classification accuracies from different approaches are portrayed in a comprehensive way. From the information shown there, the necessity of finding out the ranked features is demonstrated, as opposed to keeping all the information.
From Table 4, it is observable that when there is no feature selection algorithm after extracting all the features (HBof + k-NN), the classifier (k-NN) failed to distinguish among different health types. Then again, when the manifold learning technique—t-SNE and dimensionality reduction technique—PCAs are used as feature selectors, they failed to differentiate among different health types into the low-dimensional feature space. Moreover, both algorithms mainly compress the high dimensional data into low dimension. Unlike the proposed feature selector Boruta, these algorithms do not signify the importance of any individual feature. Thus, the proposed approach signifies the importance of the feature selector—Boruta for multiclass classification in this experiment.
4. Conclusions
The main objective of this research is to distinguish among three different health conditions (normal condition (NC), faulty condition (FC)1, and FC2) of a spherical tank by analyzing the AE signal. Therefore, this paper presents a hybrid feature selection method called HBoF, which is composed of AE feature analysis and statistical information from time and frequency analysis. However, the identification of the most distinctive feature information among all the important features is challenging. Thus, to select the most intrinsic features from the proposed HBoF, a wrapper-based algorithm—Boruta is utilized. Boruta is utilized for selecting all the appropriate features from the HBof instead of picking only the non-redundant ones. Thereafter, k-NN is applied for multiclass classification, which leads to a 99.7% average accuracy for NC, FC1, and FC2. Comparative analysis with different non-linear feature dimensionality reduction techniques (i.e., PCA and t-SNE) was performed to justify the performance. However, unlike the feature selector Boruta, these dimensionality reduction algorithms never signify the importance of individual features for further analysis. Therefore, the proposed approach outperformed the PCA and t-SNE based methods by respective 19.4% and 51.5% classification accuracies. This indicates that the Boruta based proposed approach can better establish distinctive feature sub-sets from the designed HBof for classifying the heath states of a spherical tank.
Author Contributions
All of the authors contributed equally to the conception of the idea, the design of experiments, the analysis and interpretation of results, as well as the writing of the manuscript. writing—original draft preparation, M.J.H. and J.K.; writing—review and editing, C.H.K. and J.-M.K. All authors have read and agreed to the published version of the manuscript.
Funding
This work was supported by the Korea Institute of Energy Technology Evaluation and Planning (KETEP) and the Ministry of Trade, Industry & Energy (MOTIE) of the Republic of Korea (No. 20192510102510). This work was also supported by the Technology Infrastructure Program funded by the Ministry of SMEs and Startups (MSS, Korea).
Conflicts of Interest
The authors declare no conflict of interest.
References
- Saidur, R. A review on electrical motors energy use and energy savings. Renew. Sustain. Energy Rev. 2010, 14, 877–898. [Google Scholar] [CrossRef]
- Morofuji, K.; Tsui, N.; Yamada, M.; Maie, A.; Yuyama, S.; Li, Z.W. Quantitative Study of Acoustic Emission Due To Leaks from Water Tanks. Group 2003, 21, 213–222. [Google Scholar]
- Luo, T.; Wu, C.; Duan, L. Fishbone diagram and risk matrix analysis method and its application in safety assessment of natural gas spherical tank. J. Clean. Prod. 2018, 174, 296–304. [Google Scholar] [CrossRef]
- Korkmaz, K.A.; Sari, A.; Carhoglu, A.I. Seismic risk assessment of storage tanks in Turkish industrial facilities. J. Loss Prev. Process Ind. 2011, 24, 314–320. [Google Scholar] [CrossRef]
- Li, W.; Dai, G.; Wang, Y.; Long, F. Study of Tank Acoustic Emission Testing Signals Analysis Method Based on Wavelet Neural Network. In Proceedings of the ASME 2011 Pressure Vessels and Piping Conference, Baltimore, MD, USA, 17–21 July 2011; ASME: New York, NY, USA, 2011; Volume 1, pp. 699–703. [Google Scholar]
- Amar, M.; Gondal, I.; Wilson, C. Vibration spectrum imaging: A novel bearing fault classification approach. IEEE Trans. Ind. Electron. 2015, 62, 494–502. [Google Scholar] [CrossRef]
- Sohaib, M.; Islam, M.; Kim, J.; Jeon, D.-C.; Kim, J.-M. Leakage Detection of a Spherical Water Storage Tank in a Chemical Industry Using Acoustic Emissions. Appl. Sci. 2019, 9, 196. [Google Scholar] [CrossRef] [Green Version]
- Islam, M.; Sohaib, M.; Kim, J.; Kim, J.-M. Crack Classification of a Pressure Vessel Using Feature Selection and Deep Learning Methods. Sensors 2018, 18, 4379. [Google Scholar] [CrossRef] [PubMed] [Green Version]
- Sohaib, M.; Kim, C.-H.; Kim, J.-M. A Hybrid Feature Model and Deep-Learning-Based Bearing Fault Diagnosis. Sensors 2017, 17, 2876. [Google Scholar] [CrossRef] [PubMed] [Green Version]
- Hasan, M.J.; Sohaib, M.; Kim, J.M. 1D CNN-based transfer learning model for bearing fault diagnosis under variable working conditions. In Proceedings of the Advances in Intelligent Systems and Computing, Changsha, China, 18–20 October 2019; Volume 888, pp. 13–23. [Google Scholar]
- Hasan, M.; Kim, J.-M. A Hybrid Feature Pool-Based Emotional Stress State Detection Algorithm Using EEG Signals. Brain Sci. 2019, 9, 376. [Google Scholar] [CrossRef] [Green Version]
- Liu, G.; Yu, Z.; Liang, X.; Ye, C. Vibration-Based Structural Damage Identification and Evaluation for Cylindrical Shells Using Modified Transfer Entropy Theory. J. Press. Vessel Technol. 2018, 140, 61204–61214. [Google Scholar] [CrossRef]
- Hasan, M.; Kim, J.-M. Fault Detection of a Spherical Tank Using a Genetic Algorithm-Based Hybrid Feature Pool and k-Nearest Neighbor Algorithm. Energies 2019, 12, 991. [Google Scholar] [CrossRef] [Green Version]
- Kursa, M.B.; Rudnicki, W.R. Feature selection with the Boruta package. J. Stat. Softw. 2010, 36, 1–13. [Google Scholar] [CrossRef] [Green Version]
- Nilsson, R.; Peña, J.M.; Björkegren, J.; Tegnér, J. Consistent feature selection for pattern recognition in polynomial time. J. Mach. Learn. Res. 2007, 8, 589–612. [Google Scholar]
- Liaw, A.; Wiener, M. Classification and regression by randomForest. R news 2002, 2, 18–22. [Google Scholar]
- Pandya, D.H.; Upadhyay, S.H.; Harsha, S.P. Fault diagnosis of rolling element bearing with intrinsic mode function of acoustic emission data using APF-KNN. Expert Syst. Appl. 2013, 40, 4137–4145. [Google Scholar] [CrossRef]
- Yigit, H. A weighting approach for KNN classifier. In Proceedings of the 2013 International Conference on Electronics, Computer and Computation (ICECCO), Ankara, Turkey, 7–9 November 2013; Volume 1, pp. 228–231. [Google Scholar]
Figure 1.
The overview of the proposed approach with the designed steps.

Figure 2.
The original setup for collecting acoustic emission (AE) signals from the carbon made tank with the with the detailed schematic diagram and the channel sensor set up.
Figure 2.
The original setup for collecting acoustic emission (AE) signals from the carbon made tank with the with the detailed schematic diagram and the channel sensor set up.

Figure 3.
Illustration of AE signal feature.

Figure 4.
The steps of Boruta algorithm.

Figure 5.
Block overview of k-NN algorithm.

Figure 6.
Boruta feature space for different health conditions.

Figure 7.
Various categorization accuracies. The optimal value is k = 8.

Figure 8.
Confusion matrix for the proposed method.


Table 1.
Numerical explanation of statistical features.
| Property | Equation | Property | Equation | Property | Equation |
|---|---|---|---|---|---|
| F4 | F5 | F6 | |||
| F7 | F8 | ||||
| F9 | F10 | F11 |
In Table 1, for the mentioned equations (from F4 to F11), denotes the time-domain signal, denotes the frequency domain, and denotes the total number of signals presented in the dataset.
Table 2.
Details of the considered dataset.
| Health Condition | Crack Size (mm) | Channels | Number of Samples | ||
|---|---|---|---|---|---|
| Length (mm) | Width (mm) | Depth (mm) | |||
| Normal Condition (NC) | N/A | N/A | N/A | 4 | 400 |
| Faulty Condition 01 (FC1) | 3 | 0.5 | 0.4 | 4 | 400 |
| Faulty Condition 02 (FC2) | 6 | 0.7 | 0.5 | 4 | 400 |
Table 3.
Performance analysis of the proposed method.
| Health Types | Class Based Accuracy (%) | Recall Score (%) | F1 Score (%) |
|---|---|---|---|
| Normal Condition (NC) | 100 | 100 | 100 |
| Faulty Condition 01 (FC1) | 99.50 | 99.75 | 99.62 |
| Faulty Condition 02 (FC2) | 99.74 | 99.50 | 99.62 |
| Average | 99.75 | 99.75 | 99.75 |
Table 4.
Classification accuracy of various approaches.
| Approach | Classification Accuracy (%) | Average Classification Accuracy (%) | Decrement from the Proposed Method (%) | ||
|---|---|---|---|---|---|
| NC | FC1 | FC2 | |||
| Proposed | 100 | 99.5 | 99.7 | 99.7 | - |
| HBof + k-NN | 80 | 68.2 | 59.7 | 69.3 | 30.4 |
| HBof + t-SNE + k-NN | 75.5 | 35 | 34.2 | 48.23 | 51.5 |
| HBoF+ PCA + k-NN | 79.5 | 82.5 | 78.9 | 80.3 | 19.4 |
© 2020 by the authors. Licensee MDPI, Basel, Switzerland. This article is an open access article distributed under the terms and conditions of the Creative Commons Attribution (CC BY) license (http://creativecommons.org/licenses/by/4.0/).
Share and Cite
MDPI and ACS Style
Hasan, M.J.; Kim, J.; Kim, C.H.; Kim, J.-M. Health State Classification of a Spherical Tank Using a Hybrid Bag of Features and K-Nearest Neighbor. Appl. Sci. 2020, 10, 2525. https://doi.org/10.3390/app10072525
AMA Style
Hasan MJ, Kim J, Kim CH, Kim J-M. Health State Classification of a Spherical Tank Using a Hybrid Bag of Features and K-Nearest Neighbor. Applied Sciences. 2020; 10(7):2525. https://doi.org/10.3390/app10072525
Chicago/Turabian StyleHasan, Md Junayed, Jaeyoung Kim, Cheol Hong Kim, and Jong-Myon Kim. 2020. "Health State Classification of a Spherical Tank Using a Hybrid Bag of Features and K-Nearest Neighbor" Applied Sciences 10, no. 7: 2525. https://doi.org/10.3390/app10072525
Note that from the first issue of 2016, this journal uses article numbers instead of page numbers. See further details here.