Net-Net AutoML Selection of Artificial Neural Network Topology for Brain Connectome Prediction


 ,
,  ,
,  , ,
, ,  and
and
Abstract
:1. Introduction
2. Materials and Methods
2.1. Brain Connectome Dataset
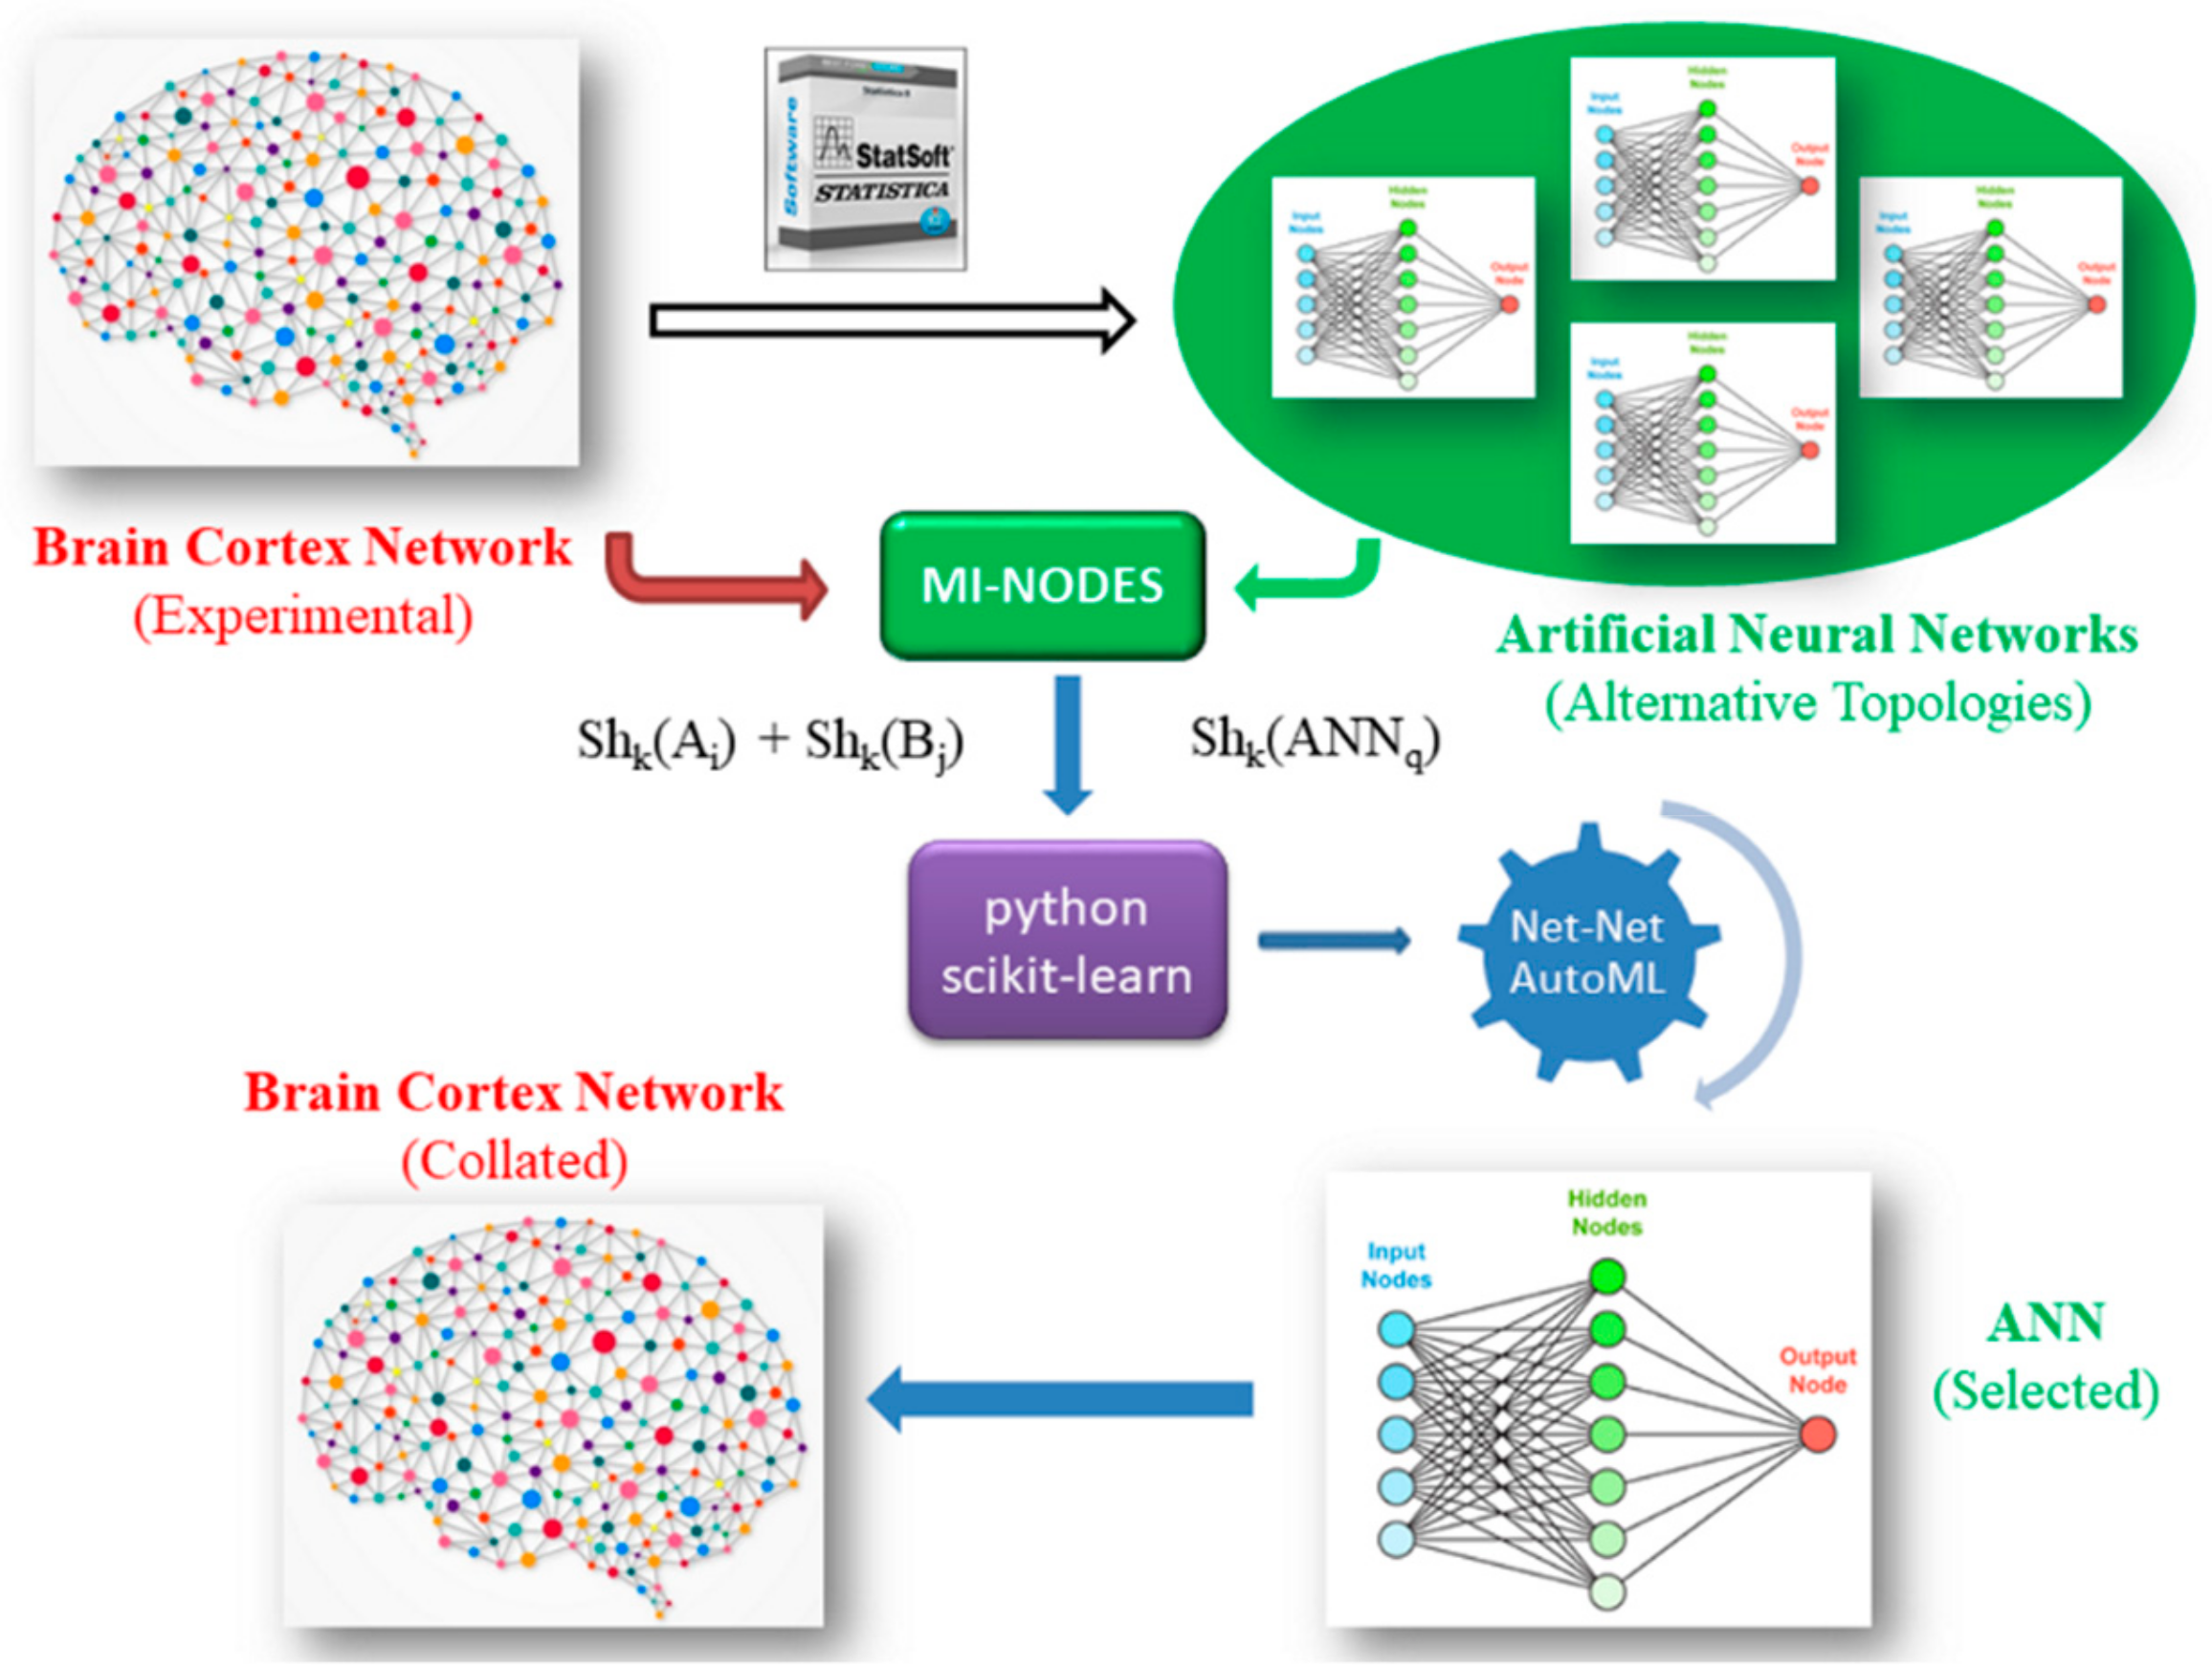
2.2. ANN Datasets and General Workflow
- (1) For each BCN:
- (1.1) Extract the connectivity matrix.
- (1.2) Add weights for the BCN connections (if present).
- (1.3) For each node Ai:
- (1.3.1) Calculate Shannon entropies for nodes using MI-NODES: Shk(Ai).
- (1.3.2) Create pairs of entropies for all the other nodes B: Shk(Ai)–Shk(Bj).
- (2) Build ANNs to predict BCN connectivity for nodes Aj–Bj:
- (2.1) For each ANNq classifier:
- (2.1.1) Calculate network Shannon entropy: Shk(ANN).
- (3) Mix the BCN node descriptors with the ANN descriptors in the Net-Net AutoML dataset: Shk(Ai), Shk(Bj), Shk(ANN).
- (4) Split the dataset into training and testing subsets (n-folds).
- (5) Search for the best Net-Net AutoML classifier to evaluate whether a specific ANN can predict the BCN connectivity:
- (5.1) For each ML method:
- (5.1.1) Use a subset to train a classifier.
- (5.1.2) Evaluate the model with a testing subset, calculating AUROC accuracy.
- (6) Choose the best Net-Net AutoML classifier using AUROC metric.
2.3. Computational Methods
2.3.1. Markov–Shannon Entropy Centralities for Nodes
2.3.2. Net-Net AutoML Models
- KNeighborsClassifier = KNN—k-nearest neighbors: A nonparametric classifier that assigns an unclassified sample to the same class as the nearest of k samples in the training set [50].
- LinearDiscriminantAnalysis = LDA—linear discriminant analysis [51]: A statistical supervised method that projects the input data to a lower dimension in order to maximize the scatter between classes versus the scatter within each class.
- GaussianNB = GBN—Gaussian Naive Bayes, a simple “probabilistic classifier” [52].
- SVC(kernel = ‘rbf’) = SVM_RBF—support-vector machines with nonlinear radial basis functions [53].
- LogisticRegression = LogR—Logistic regression [54] is a linear model that estimates the probability of a binary response using different factors.
- MLPClassifier = MLP—multilayer perceptron (artificial neural network) using 20 neurons in a hidden layer [55].
- DecisionTreeClassifier = DT—Decision Tree (DT) represents a set of decision rules inferred from the features as a tree of rules (the paths from root to leaf represent classification rules) [56].
- RandomForestClassifier = RF—Random Forest [57] aggregates several decision trees (parallel trees). Each tree is generated using a bootstrap sample randomly drawn from the original dataset.
- XGBClassifier = XGB—an optimized distributed gradient boosting library based on serial trees [58].
- GradientBoostingClassifier = GB—gradient boosting library [59].
- AdaBoostClassifier = Ada—is a meta-estimator that starts the fitting with a classifier based on the original dataset and then adds additional copies of the original classifier to the adjusted weights for the incorrectly classified instances [60].
- BaggingClassifier = Bagging—similar with Ada but the additional classifiers are based on subsets of the original dataset [61].
3. Results and Discussion
4. Conclusions
Author Contributions
Funding
Acknowledgments
Conflicts of Interest
References
- Sandhu, K.S.; Li, G.; Poh, H.M.; Quek, Y.L.; Sia, Y.Y.; Peh, S.Q.; Mulawadi, F.H.; Lim, J.; Sikic, M.; Menghi, F.; et al. Large-scale functional organization of long-range chromatin interaction networks. Cell Rep. 2012, 2, 1207–1219. [Google Scholar] [CrossRef] [PubMed] [Green Version]
- Gaspar, M.E.; Csermely, P. Rigidity and flexibility of biological networks. Brief. Funct. Genom. 2012, 11, 443–456. [Google Scholar] [CrossRef] [PubMed]
- Csermely, P.; Korcsmaros, T.; Kiss, H.J.; London, G.; Nussinov, R. Structure and dynamics of molecular networks: A novel paradigm of drug discovery: A comprehensive review. Pharm. Ther. 2013, 138, 333–408. [Google Scholar] [CrossRef] [PubMed] [Green Version]
- Vidal, M.; Cusick, M.E.; Barabasi, A.L. Interactome networks and human disease. Cell 2011, 144, 986–998. [Google Scholar] [CrossRef] [Green Version]
- Barabasi, A.L.; Gulbahce, N.; Loscalzo, J. Network medicine: A network-based approach to human disease. Nat. Rev. Genet. 2011, 12, 56–68. [Google Scholar] [CrossRef] [Green Version]
- Barabasi, A.L.; Oltvai, Z.N. Network biology: Understanding the cell’s functional organization. Nat. Rev. Genet. 2004, 5, 101–113. [Google Scholar] [CrossRef]
- Strogatz, S.H. Exploring complex networks. Nature 2001, 410, 268–276. [Google Scholar] [CrossRef] [Green Version]
- Reijneveld, J.C.; Ponten, S.C.; Berendse, H.W.; Stam, C.J. The application of graph theoretical analysis to complex networks in the brain. Clin. Neurophysiol. 2007, 118, 2317–2331. [Google Scholar] [CrossRef]
- Guo, L.; Rivero, D.; Dorado, J.; Munteanu, C.R.; Pazos, A. Automatic feature extraction using genetic programming: An application to epileptic EEG classification. Expert Syst. Appl. 2011, 38, 10425–10436. [Google Scholar] [CrossRef]
- Liu, Y.; Tang, S.; Fernandez-Lozano, C.; Munteanu, C.R.; Pazos, A.; Yu, Y.Z.; Tan, Z.; González-Díaz, H. Experimental study and Random Forest prediction model of microbiome cell surface hydrophobicity. Expert Syst. Appl. 2017, 72, 306–316. [Google Scholar] [CrossRef]
- Aguiar-Pulido, V.; Seoane, J.A.; Gestal, M.; Dorado, J. Exploring patterns of epigenetic information with data mining techniques. Curr. Pharm. Des. 2013, 19, 779–789. [Google Scholar] [CrossRef] [PubMed] [Green Version]
- Fernandez-Blanco, E.; Rivero, D.; Gestal, M.; Dorado, J. Classification of signals by means of genetic programming. Soft Comput. 2013, 17, 1929–1937. [Google Scholar] [CrossRef]
- Shannon, C.E. A mathematical theory of communication. Bell Syst. Tech. J. 1948, 27, 379–423. [Google Scholar] [CrossRef] [Green Version]
- Dehmer, M.; Emmert-Streib, F. Analysis of Complex Networks. From Biology to Linguistics; WILEY-VCH Verlag GmbH & Co. KGaA: Weinheim, Germany, 2009. [Google Scholar]
- Dehmer, M.; Grabner, M.; Varmuza, K. Information indices with high discriminative power for graphs. PLoS ONE 2012, 7, e31214. [Google Scholar] [CrossRef] [PubMed]
- Dehmer, M.; Varmuza, K.; Borgert, S.; Emmert-Streib, F. On entropy-based molecular descriptors: Statistical analysis of real and synthetic chemical structures. J. Chem. Inf. Model. 2009, 49, 1655–1663. [Google Scholar] [CrossRef] [PubMed]
- Estrada, E.; Avnir, D. Continuous symmetry numbers and entropy. J. Am. Chem. Soc. 2003, 125, 4368–4375. [Google Scholar] [CrossRef]
- Graham, D.J.; Grzetic, S.; May, D.; Zumpf, J. Information properties of naturally-occurring proteins: Fourier analysis and complexity phase plots. Protein J. 2012, 31, 550–563. [Google Scholar] [CrossRef]
- Graham, D.J.; Greminger, J.L. On the information expressed in enzyme structure: More lessons from ribonuclease A. Mol. Divers. 2011, 15, 769–779. [Google Scholar] [CrossRef]
- Graham, D.J.; Greminger, J.L. On the information expressed in enzyme primary structure: Lessons from Ribonuclease A. Mol. Divers. 2010, 14, 673–686. [Google Scholar] [CrossRef]
- Graham, D.J.; Kim, M. Information and classical thermodynamic transformations. J. Phys. Chem. B 2008, 112, 10585–10593. [Google Scholar] [CrossRef]
- Graham, D.J.; Malarkey, C.; Sevchuk, W. Experimental investigation of information processing under irreversible Brownian conditions: Work/time analysis of paper chromatograms. J. Phys. Chem. B 2008, 112, 10594–10602. [Google Scholar] [CrossRef] [PubMed]
- Graham, D.J. Information content in organic molecules: Brownian processing at low levels. J. Chem. Inf. Model. 2007, 47, 376–389. [Google Scholar] [CrossRef] [PubMed]
- Graham, D.J. Information content in organic molecules: Aggregation states and solvent effects. J. Chem. Inf. Model. 2005, 45, 1223–1236. [Google Scholar] [CrossRef] [PubMed]
- Graham, D.J.; Schulmerich, M.V. Information content in organic molecules: Reaction pathway analysis via Brownian processing. J. Chem. Inf. Comput. Sci. 2004, 44, 1612–1622. [Google Scholar] [CrossRef]
- Graham, D.J.; Malarkey, C.; Schulmerich, M.V. Information content in organic molecules: Quantification and statistical structure via Brownian processing. J. Chem. Inf. Comput. Sci. 2004, 44, 1601–1611. [Google Scholar] [CrossRef]
- Graham, D.J. Information and organic molecules: Structure considerations via integer statistics. J. Chem. Inf. Comput. Sci. 2002, 42, 215–221. [Google Scholar] [CrossRef]
- Graham, D.J.; Schacht, D.V. Base information content in organic formulas. J. Chem. Inf. Comput. Sci. 2000, 40, 942–946. [Google Scholar] [CrossRef]
- Barigye, S.J.; Marrero-Ponce, Y.; Santiago, O.M.; Lopez, Y.M.; Perez-Gimenez, F.; Torrens, F. Shannon’s, Mutual, conditional and joint entropy information indices. Generalization of global indices defined from local vertex invariants. Curr. Comput. Aided Drug Des. 2013, 9, 164–183. [Google Scholar] [CrossRef]
- Aguiar-Pulido, V.; Munteanu, C.R.; Seoane, J.A.; Fernández-Blanco, E.; Pérez-Montoto, L.G.; González-Díaz, H.; Dorado, J. Naïve Bayes QSDR classification based on spiral-graph Shannon entropies for protein biomarkers in human colon cancer. Mol. Biosyst. 2012, 8, 1716–1722. [Google Scholar] [CrossRef]
- Riera-Fernandez, P.; Munteanu, C.R.; Escobar, M.; Prado-Prado, F.; Martin-Romalde, R.; Pereira, D.; Villalba, K.; Duardo-Sanchez, A.; Gonzalez-Diaz, H. New Markov-Shannon Entropy models to assess connectivity quality in complex networks: From molecular to cellular pathway, Parasite-Host, Neural, Industry, and Legal-Social networks. J. Theor. Biol. 2012, 293, 174–188. [Google Scholar] [CrossRef] [PubMed]
- Prado-Prado, F.J.; Garcia, I.; Garcia-Mera, X.; Gonzalez-Diaz, H. Entropy multi-target QSAR model for prediction of antiviral drug complex networks. Chemom. Intellig. Lab. Syst. 2011, 107, 227–233. [Google Scholar] [CrossRef]
- Munteanu, C.R.; Magalhaes, A.L.; Uriarte, E.; Gonzalez-Diaz, H. Multi-target QPDR classification model for human breast and colon cancer-related proteins using star graph topological indices. J. Theor. Biol. 2009, 257, 303–311. [Google Scholar] [CrossRef] [PubMed]
- Munteanu, C.R.; Gonzalez-Diaz, H.; Borges, F.; de Magalhaes, A.L. Natural/random protein classification models based on star network topological indices. J. Theor. Biol. 2008, 254, 775–783. [Google Scholar] [CrossRef] [PubMed]
- Munteanu, C.R.; Gonzalez-Diaz, H.; Magalhaes, A.L. Enzymes/non-enzymes classification model complexity based on composition, sequence, 3D and topological indices. J. Theor. Biol. 2008, 254, 476–482. [Google Scholar] [CrossRef]
- González-Díaz, H.; Pérez-Bello, A.; Cruz-Monteagudo, M.; González-Díaz, Y.; Santana, L.; Uriarte, E. Chemometrics for QSAR with low sequence homology: Mycobacterial promoter sequences recognition with 2D-RNA entropies. Chemom. Intell. Lab. Syst. 2007, 85, 20–26. [Google Scholar] [CrossRef]
- González-Díaz, H.; Saíz-Urra, L.; Molina, R.; Uriarte, E. Stochastic molecular descriptors for polymers. 2. Spherical truncation of electrostatic interactions on entropy based polymers 3D-QSAR. Polymer 2005, 46, 2791–2798. [Google Scholar] [CrossRef]
- Rodriguez-Soca, Y.; Munteanu, C.R.; Dorado, J.; Rabunal, J.; Pazos, A.; Gonzalez-Diaz, H. Plasmod-PPI: A web-server predicting complex biopolymer targets in plasmodium with entropy measures of protein-protein interactions. Polymer 2010, 51, 264–273. [Google Scholar] [CrossRef]
- Jalali-Heravi, M.; Fatemi, M.H. Prediction of thermal conductivity detection response factors using an artificial neural network. J. Chromatogr. A 2000, 897, 227–235. [Google Scholar] [CrossRef]
- Prado-Prado, F.J.; Garcia-Mera, X.; Gonzalez-Diaz, H. Multi-target spectral moment QSAR versus ANN for antiparasitic drugs against different parasite species. Bioorg. Med. Chem. 2010, 18, 2225–2231. [Google Scholar] [CrossRef]
- Tenorio-Borroto, E.; Penuelas Rivas, C.G.; Vasquez Chagoyan, J.C.; Castanedo, N.; Prado-Prado, F.J.; Garcia-Mera, X.; Gonzalez-Diaz, H. ANN multiplexing model of drugs effect on macrophages; theoretical and flow cytometry study on the cytotoxicity of the anti-microbial drug G1 in spleen. Bioorg. Med. Chem. 2012, 20, 6181–6194. [Google Scholar] [CrossRef]
- Gonzalez-Diaz, H.; Bonet, I.; Teran, C.; De Clercq, E.; Bello, R.; Garcia, M.M.; Santana, L.; Uriarte, E. ANN-QSAR model for selection of anticancer leads from structurally heterogeneous series of compounds. Eur. J. Med. Chem. 2007, 42, 580–585. [Google Scholar] [CrossRef] [PubMed]
- Gonzalez-Diaz, H.; Arrasate, S.; Sotomayor, N.; Lete, E.; Munteanu, C.R.; Pazos, A.; Besada-Porto, L.; Ruso, J.M. MIANN models in medicinal, physical and organic chemistry. Curr. Top. Med. Chem. 2013, 13, 619–641. [Google Scholar] [CrossRef] [PubMed]
- Kotthoff, L.; Thornton, C.; Hoos, H.H.; Hutter, F.; Leyton-Brown, K. Auto-WEKA 2.0: Automatic model selection and hyperparameter optimization in WEKA. In Automated Machine Learning; The Springer Series on Challenges in Machine Learning; Frank, H., Ed.; Springer: Berlin, Germany, 2017; pp. 81–95. [Google Scholar] [CrossRef] [Green Version]
- Feurer, M.; Klein, A.; Eggensperger, K.; Springenberg, J.; Blum, M. Efficient and robust automated machine learning. In Advances in Neural Information Processing Systems; Curran Associates, Inc.: Red Hook, NY, USA, 2015; pp. 2962–2970. [Google Scholar]
- Barreiro, E.; Munteanu, C.R.; Cruz-Monteagudo, M.; Pazos, A.; Gonzalez-Diaz, H. Net-Net auto machine learning (AutoML) prediction of complex ecosystems. Sci. Rep. 2017, 8, 12340. [Google Scholar] [CrossRef] [PubMed]
- Modha, D.S.; Singh, R. Network architecture of the long-distance pathways in the macaque brain. Proc. Natl. Acad. Sci. USA 2010, 107, 13485–13490. [Google Scholar] [CrossRef] [Green Version]
- StatSoft. Inc. STATISTICA (Data Analysis Software System), Version 6.0; StatSoft. Inc.: Tulsa, OK, USA, 2002. [Google Scholar]
- Duardo-Sanchez, A.; Gonzalez-Diaz, H.; Pazos, A. MI-NODES multiscale models of metabolic reactions, brain connectome, ecological, epidemic, world trade, and legal-social networks. Curr. Bioinform. 2015, 10, 692–713. [Google Scholar] [CrossRef] [Green Version]
- Cover, T.; Hart, P. Nearest neighbor pattern classification. IEEE Trans. Inf. Theory 1967, 13, 21–27. [Google Scholar] [CrossRef]
- Winkel, P.; Juhl, E. Assumptions in linear discriminant analysis. Lancet 1971, 2, 435–436. [Google Scholar] [CrossRef]
- Lowd, D.; Domingos, P. Naive Bayes models for probability estimation. In Proceedings of the 22nd International Conference on Machine Learning, Bonn, Germany, 7–11 August 2005; pp. 529–536. [Google Scholar]
- Han, S.; Qubo, C.; Meng, H. Parameter selection in SVM with RBF kernel function. In Proceedings of the World Automation Congress 2012, Puerto Vallarta, Mexico, 24–28 June 2012; pp. 1–4. [Google Scholar]
- Hilbe, J.M. Logistic Regression Models; Chapman & Hall/CRC Press: Boca Raton, FL, USA, 2009. [Google Scholar]
- Haykin, S. Neural Networks: A Comprehensive Foundation; Prentice Hall PTR: Upper Saddle River, NJ, USA, 1994. [Google Scholar]
- Quinlan, J.R. Induction of decision trees. Mach. Learn. 1986, 1, 81–106. [Google Scholar] [CrossRef] [Green Version]
- Breiman, L. Random forests. Mach. Learn. 2001, 45, 5–32. [Google Scholar] [CrossRef] [Green Version]
- Chen, T.; Guestrin, C. Xgboost: A scalable tree boosting system. In Proceedings of the 22nd ACM Sigkdd International Conference on Knowledge Discovery and Data Mining, San Francisco, CA, USA, 13–17 August 2016; pp. 785–794. [Google Scholar]
- Friedman, J.H. Greedy function approximation: A gradient boosting machine. Ann. Stat. 2001, 29, 1189–1232. [Google Scholar] [CrossRef]
- Freund, Y.; Schapire, R.E. A Decision-theoretic generalization of on-line learning and an application to boosting. J. Comput. Syst. Sci. 1997, 55, 20. [Google Scholar] [CrossRef] [Green Version]
- Breiman, L. Bagging predictors. Mach. Learn. 1996, 24, 123–140. [Google Scholar] [CrossRef] [Green Version]
- Fawcett, T. An introduction to ROC analysis. Pattern Recognit. Lett. 2006, 27, 861–874. [Google Scholar] [CrossRef]
- Van Essen, D.C.; Ugurbil, K.; Auerbach, E.; Barch, D.; Behrens, T.E.; Bucholz, R.; Chang, A.; Chen, L.; Corbetta, M.; Curtiss, S.W.; et al. The Human Connectome Project: A data acquisition perspective. NeuroImage 2012, 62, 2222–2231. [Google Scholar] [CrossRef] [PubMed] [Green Version]
- Lang, E.W.; Tome, A.M.; Keck, I.R.; Gorriz-Saez, J.M.; Puntonet, C.G. Brain connectivity analysis: A short survey. Comput. Intell. Neurosci. 2012, 2012, 412512. [Google Scholar] [CrossRef]
- Stephan, K.E.; Kamper, L.; Bozkurt, A.; Burns, G.A.; Young, M.P.; Kotter, R. Advanced database methodology for the Collation of Connectivity data on the Macaque brain (CoCoMac). Philos. Trans. R. Soc. Lond. Ser. B Biol. Sci. 2001, 356, 1159–1186. [Google Scholar] [CrossRef] [Green Version]
- Kotter, R. Online retrieval, processing, and visualization of primate connectivity data from the CoCoMac database. Neuroinformatics 2004, 2, 127–144. [Google Scholar] [CrossRef]
- Sanbonmatsu, K.Y.; Tung, C.S. High performance computing in biology: Multimillion atom simulations of nanoscale systems. J. Struct. Biol. 2007, 157, 470–480. [Google Scholar] [CrossRef] [Green Version]
- Pitera, J.W. Current developments in and importance of high-performance computing in drug discovery. Curr. Opin. Drug Discov. Dev. 2009, 12, 388–396. [Google Scholar]
- Maniatis, T.A.; Nikita, K.S.; Uzunoglu, N.K. Ultrasonic diffraction tomography: An application connecting high performance computing centers with clinical environment. Stud. Health Technol. Inform. 2000, 79, 214–243. [Google Scholar] [CrossRef]
- Johnston, W.E.; Jacobson, V.L.; Loken, S.C.; Robertson, D.W.; Tierney, B.L. High-performance computing, high-speed networks, and configurable computing environments: Progress toward fully distributed computing. Crit. Rev. Biomed. Eng. 1992, 20, 315–354. [Google Scholar] [PubMed]
- Fernandez, J.J. High performance computing in structural determination by electron cryomicroscopy. J. Struct. Biol. 2008, 164, 1–6. [Google Scholar] [CrossRef] [PubMed]
- Dunning, T.H., Jr.; Harrison, R.J.; Feller, D.; Xantheas, S.S. Promise and challenge of high-performance computing, with examples from molecular modelling. Philos. Trans. Ser. Math. Phys. Eng. Sci. 2002, 360, 1079–1105. [Google Scholar] [CrossRef] [PubMed]
- Cant, S. High-performance computing in computational fluid dynamics: Progress and challenges. Philos. Trans. Ser. Math. Phys. Eng. Sci. 2002, 360, 1211–1225. [Google Scholar] [CrossRef] [PubMed]


| ANN No. | ANN Profile (inputs:hidden layers EPs:outputs) | Shk(ANN) | |||||
|---|---|---|---|---|---|---|---|
| k = 0 | k = 1 | k = 2 | k = 3 | k = 4 | k = 5 | ||
| 1 | MLP15:15-14-1:1 | 0.05 | 0.054 | 0.054 | 0.054 | 0.054 | 0.054 |
| 2 | MLP4:4-6-11-1:1 | 0.06 | 0.067 | 0.069 | 0.072 | 0.072 | 0.072 |
| 3 | MLP5:5-8-1:1 | 0.078 | 0.088 | 0.097 | 0.097 | 0.097 | 0.097 |
| 4 | MLP7:7-11-1:1 | 0.067 | 0.074 | 0.081 | 0.081 | 0.081 | 0.081 |
| 5 | MLP9:9-12-1:1 | 0.061 | 0.067 | 0.071 | 0.071 | 0.071 | 0.071 |
| 6 | MLP10:10-12-1:1 | 0.061 | 0.067 | 0.071 | 0.071 | 0.071 | 0.071 |
| 7 | MLP4:4-8-11-1:1 | 0.057 | 0.059 | 0.06 | 0.061 | 0.061 | 0.061 |
| 8 | MLP10:10-11-12-1:1 | 0.046 | 0.048 | 0.044 | 0.046 | 0.046 | 0.046 |
| 9 | LNN14:14-1:1 | 0.056 | 0.146 | 0.146 | 0.146 | 0.146 | 0.146 |
| 10 | LNN15:15-1:1 | 0.053 | 0.146 | 0.146 | 0.146 | 0.146 | 0.146 |
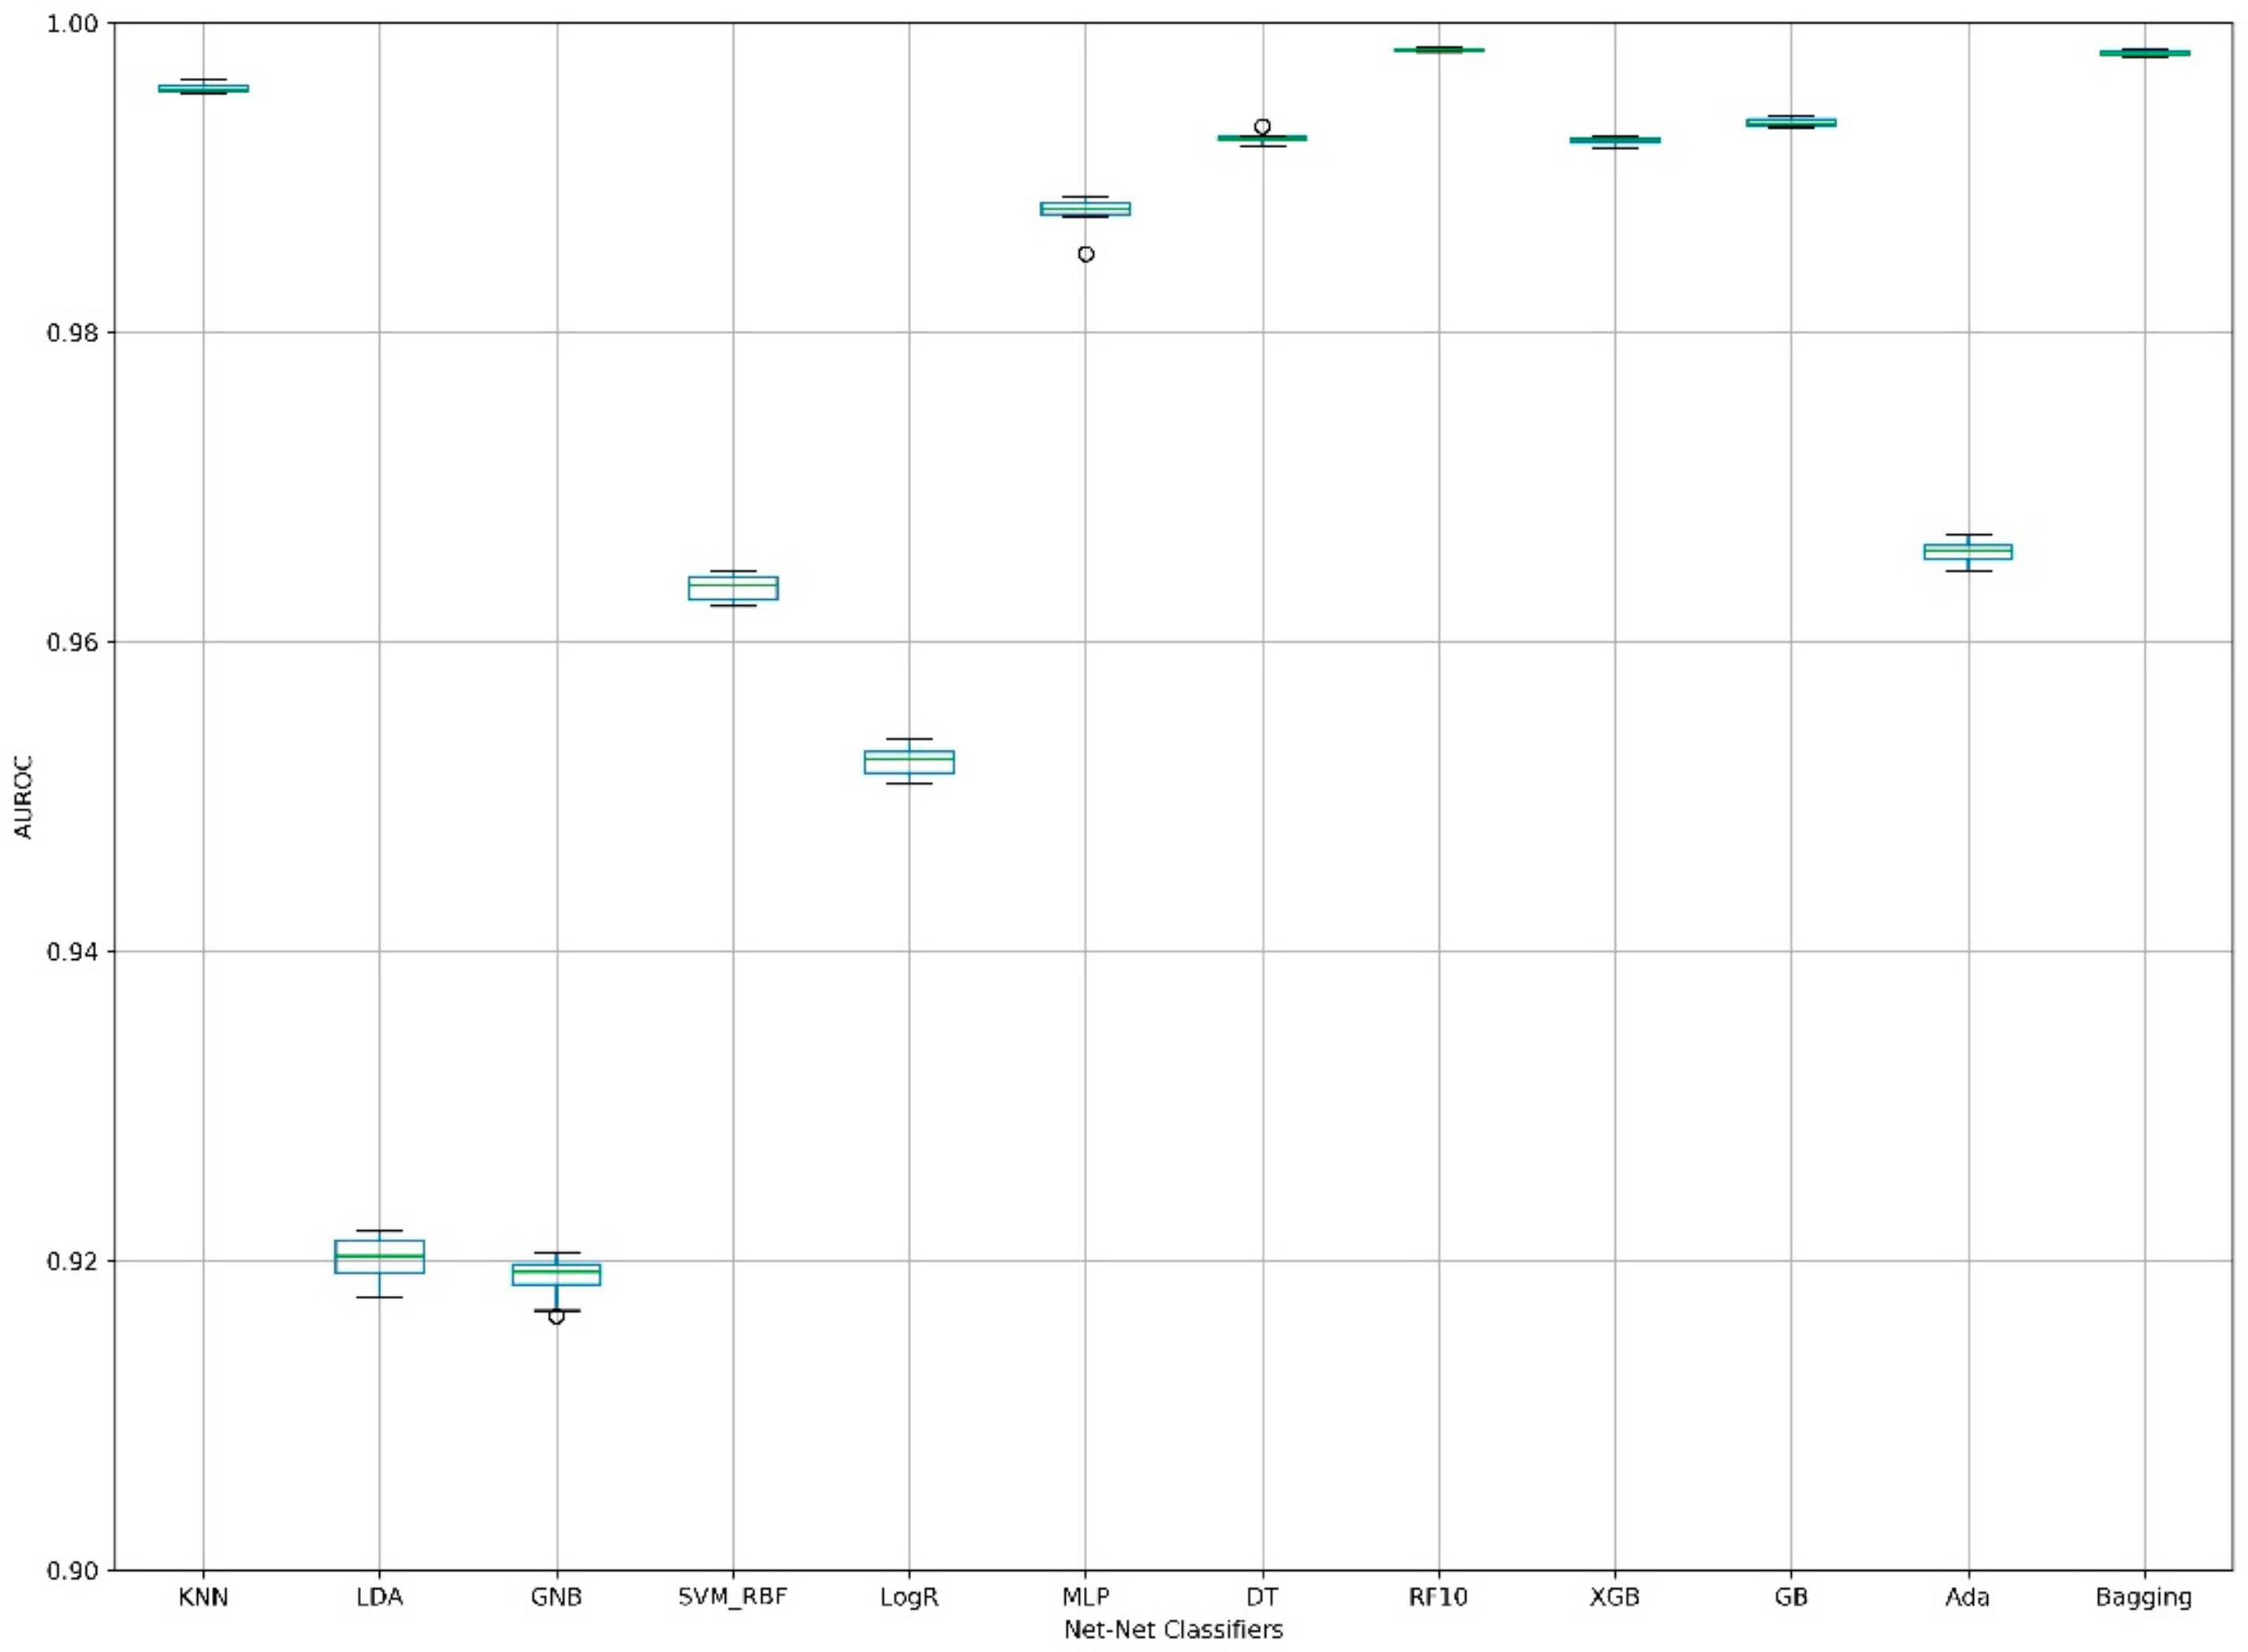
| Fold | KNN | LDA | GNB | SVM_RBF | LogR | MLP | DT | RF10 1 | XGB | GB | Ada | Bagging |
|---|---|---|---|---|---|---|---|---|---|---|---|---|
| 1 | 0.9956 | 0.9195 | 0.9164 | 0.9625 | 0.9510 | 0.9876 | 0.9926 | 0.9983 | 0.9923 | 0.9937 | 0.9652 | 0.9983 |
| 2 | 0.9955 | 0.9217 | 0.9198 | 0.9642 | 0.9529 | 0.9879 | 0.9924 | 0.9982 | 0.9923 | 0.9933 | 0.9662 | 0.9980 |
| 3 | 0.9957 | 0.9203 | 0.9193 | 0.9637 | 0.9524 | 0.9880 | 0.9920 | 0.9983 | 0.9919 | 0.9934 | 0.9659 | 0.9980 |
| 4 | 0.9962 | 0.9207 | 0.9192 | 0.9637 | 0.9525 | 0.9851 | 0.9927 | 0.9981 | 0.9926 | 0.9938 | 0.9660 | 0.9982 |
| 5 | 0.9957 | 0.9204 | 0.9204 | 0.9645 | 0.9538 | 0.9882 | 0.9924 | 0.9983 | 0.9926 | 0.9934 | 0.9662 | 0.9980 |
| 6 | 0.9960 | 0.9192 | 0.9190 | 0.9633 | 0.9518 | 0.9885 | 0.9925 | 0.9982 | 0.9925 | 0.9936 | 0.9656 | 0.9979 |
| 7 | 0.9958 | 0.9219 | 0.9205 | 0.9645 | 0.9535 | 0.9888 | 0.9925 | 0.9983 | 0.9926 | 0.9940 | 0.9669 | 0.9982 |
| 8 | 0.9955 | 0.9215 | 0.9196 | 0.9642 | 0.9529 | 0.9884 | 0.9927 | 0.9981 | 0.9925 | 0.9940 | 0.9664 | 0.9978 |
| 9 | 0.9959 | 0.9176 | 0.9183 | 0.9625 | 0.9514 | 0.9875 | 0.9922 | 0.9982 | 0.9923 | 0.9933 | 0.9646 | 0.9979 |
| 10 | 0.9964 | 0.9182 | 0.9168 | 0.9623 | 0.9508 | 0.9879 | 0.9933 | 0.9984 | 0.9922 | 0.9933 | 0.9651 | 0.9982 |
| Mean | 0.9958 | 0.9201 | 0.9189 | 0.9635 | 0.9523 | 0.9878 | 0.9925 | 0.9983 | 0.9924 | 0.9936 | 0.9658 | 0.9980 |
| SD | 0.0003 | 0.0015 | 0.0014 | 0.0009 | 0.0010 | 0.0010 | 0.0003 | 0.0001 | 0.0002 | 0.0003 | 0.0007 | 0.0002 |
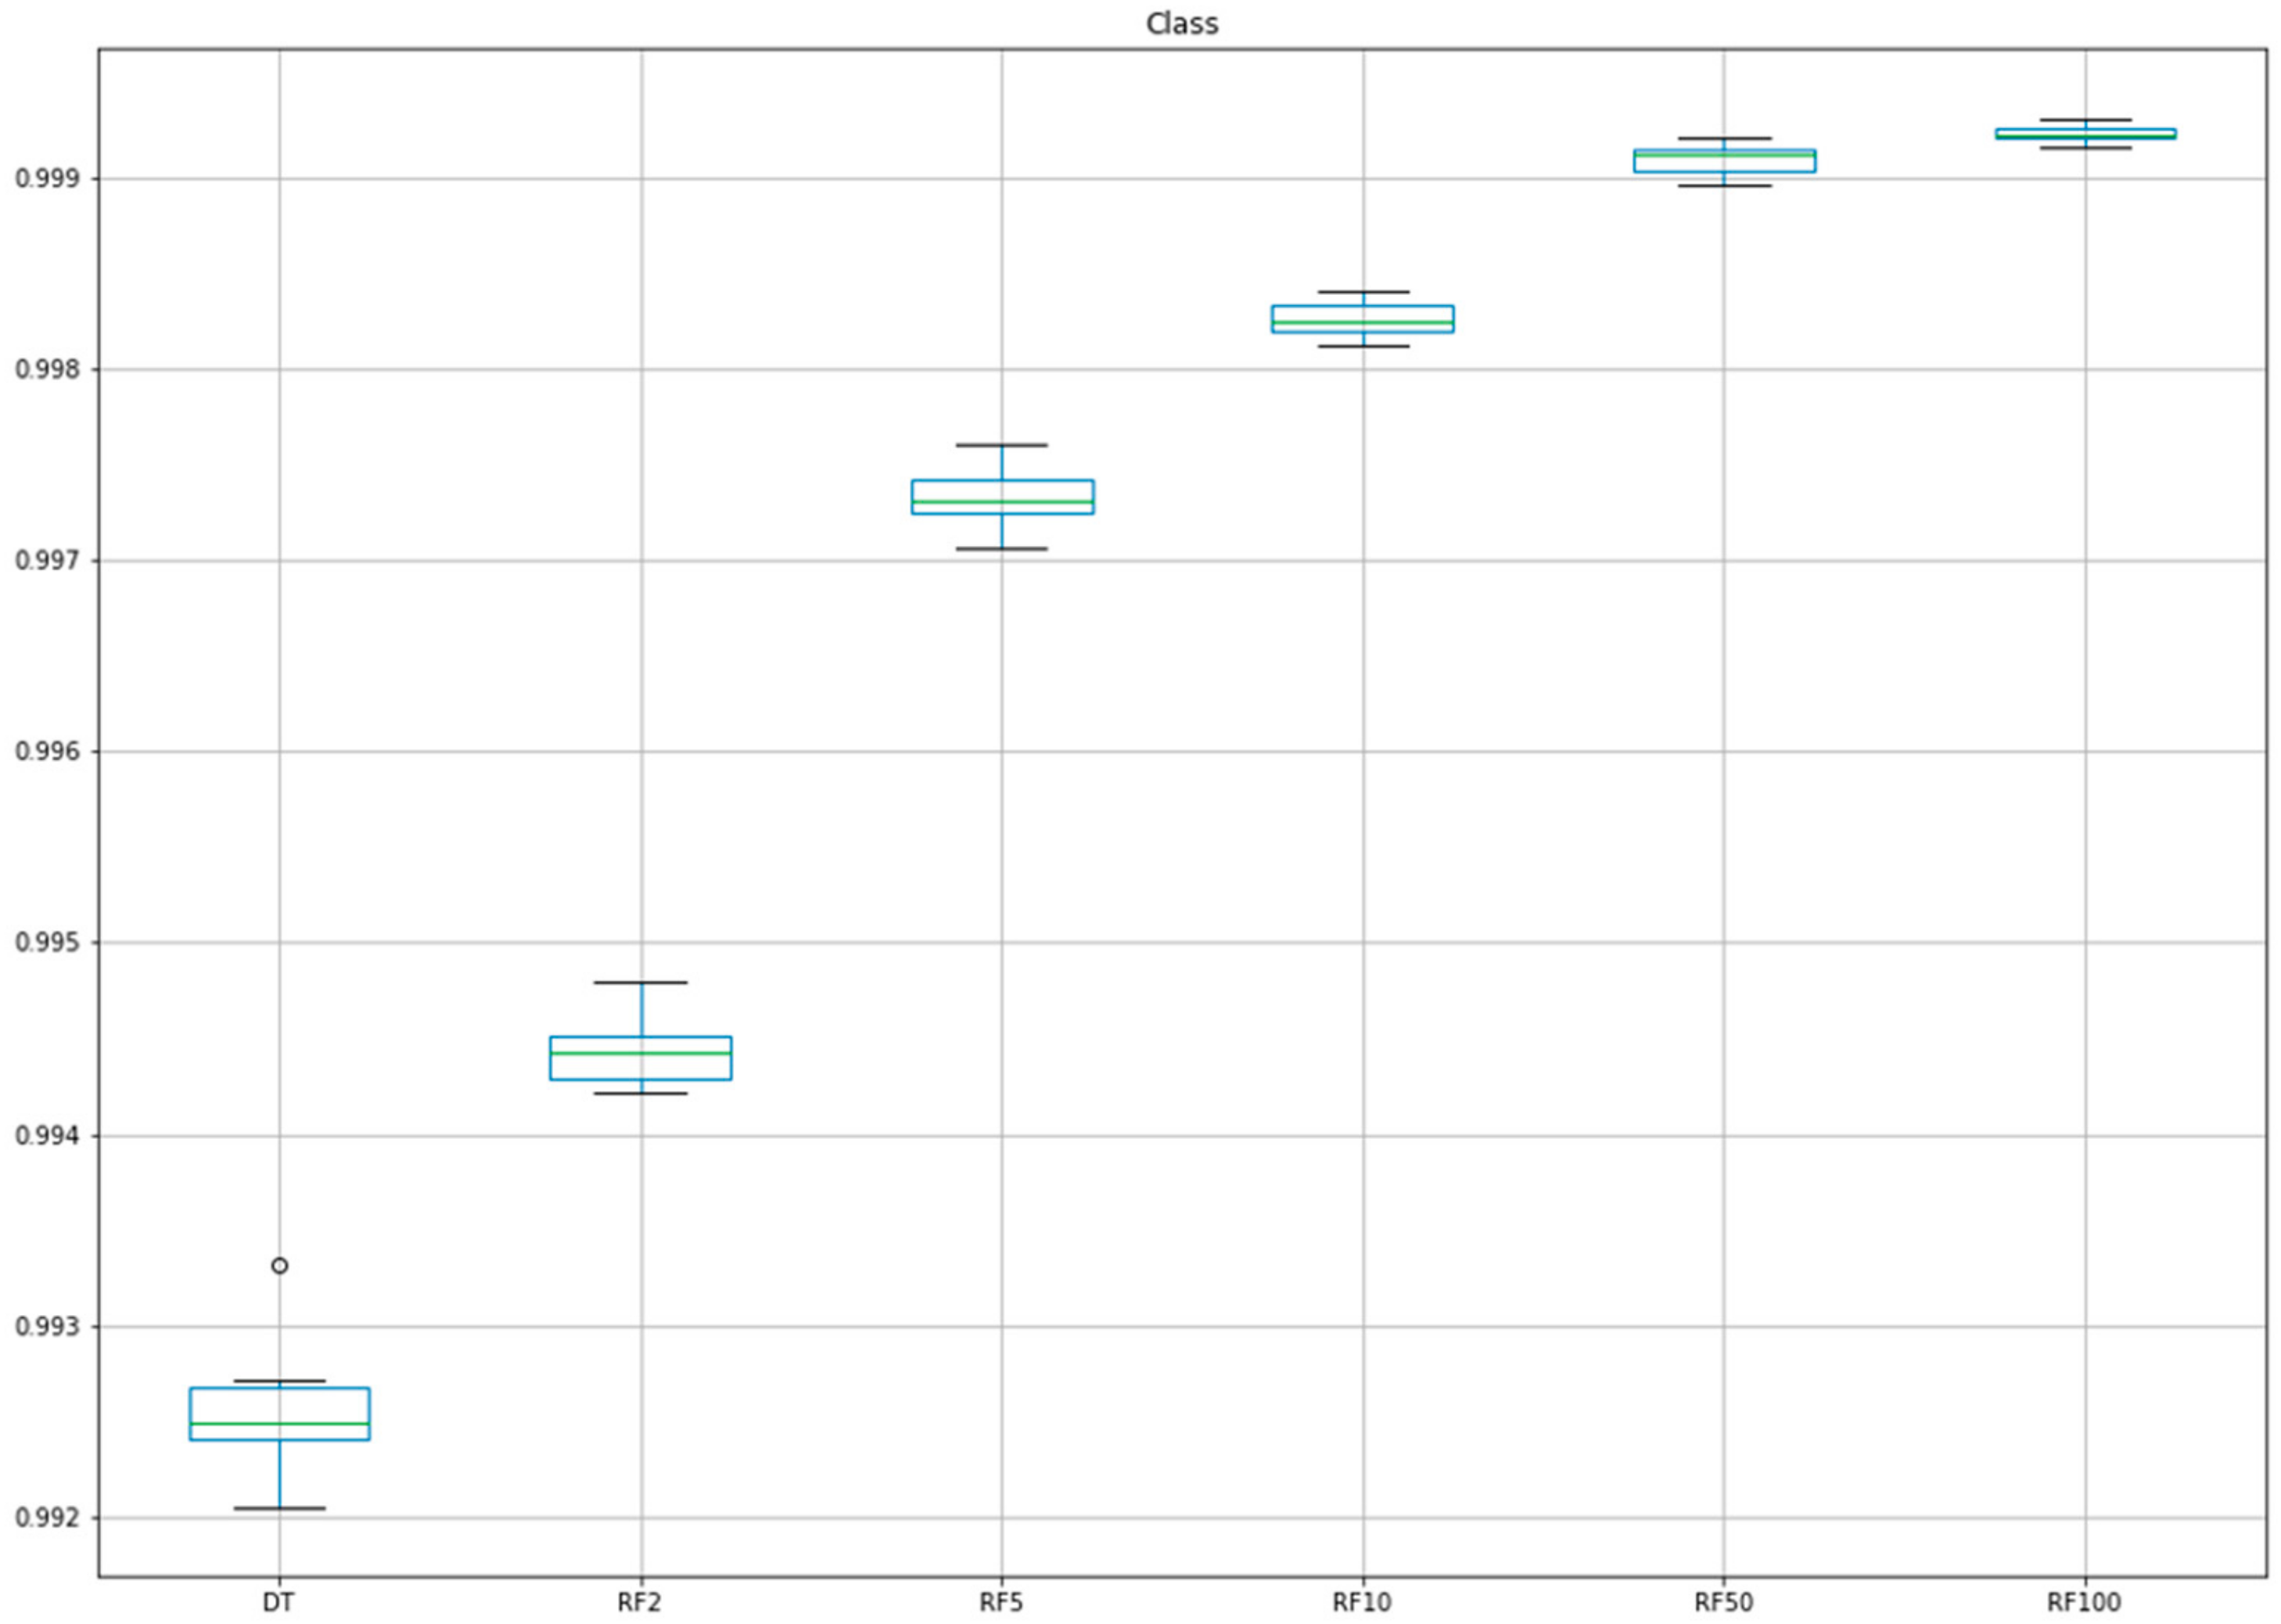
| Fold | DT | RF2 1 | RF5 2 | RF10 3 | RF50 4 | RF100 5 |
|---|---|---|---|---|---|---|
| 1 | 0.9926 | 0.9948 | 0.9976 | 0.9983 | 0.9990 | 0.9992 |
| 2 | 0.9924 | 0.9944 | 0.9971 | 0.9982 | 0.9990 | 0.9992 |
| 3 | 0.9920 | 0.9943 | 0.9971 | 0.9983 | 0.9992 | 0.9993 |
| 4 | 0.9927 | 0.9945 | 0.9974 | 0.9981 | 0.9992 | 0.9993 |
| 5 | 0.9924 | 0.9942 | 0.9972 | 0.9983 | 0.9991 | 0.9993 |
| 6 | 0.9925 | 0.9945 | 0.9974 | 0.9982 | 0.9991 | 0.9992 |
| 7 | 0.9925 | 0.9944 | 0.9974 | 0.9983 | 0.9992 | 0.9992 |
| 8 | 0.9927 | 0.9943 | 0.9973 | 0.9981 | 0.9990 | 0.9992 |
| 9 | 0.9922 | 0.9942 | 0.9972 | 0.9982 | 0.9991 | 0.9992 |
| 10 | 0.9933 | 0.9948 | 0.9975 | 0.9984 | 0.9991 | 0.9992 |
| Mean | 0.9925 | 0.9944 | 0.9973 | 0.9983 | 0.9991 | 0.9992 |
| SD | 0.0003 | 0.0002 | 0.0002 | 0.0001 | 0.0001 | 0.0000 |
© 2020 by the authors. Licensee MDPI, Basel, Switzerland. This article is an open access article distributed under the terms and conditions of the Creative Commons Attribution (CC BY) license (http://creativecommons.org/licenses/by/4.0/).
Share and Cite
Barreiro, E.; Munteanu, C.R.; Gestal, M.; Rabuñal, J.R.; Pazos, A.; González-Díaz, H.; Dorado, J. Net-Net AutoML Selection of Artificial Neural Network Topology for Brain Connectome Prediction. Appl. Sci. 2020, 10, 1308. https://doi.org/10.3390/app10041308
Barreiro E, Munteanu CR, Gestal M, Rabuñal JR, Pazos A, González-Díaz H, Dorado J. Net-Net AutoML Selection of Artificial Neural Network Topology for Brain Connectome Prediction. Applied Sciences. 2020; 10(4):1308. https://doi.org/10.3390/app10041308
Chicago/Turabian StyleBarreiro, Enrique, Cristian R. Munteanu, Marcos Gestal, Juan Ramón Rabuñal, Alejandro Pazos, Humberto González-Díaz, and Julián Dorado. 2020. "Net-Net AutoML Selection of Artificial Neural Network Topology for Brain Connectome Prediction" Applied Sciences 10, no. 4: 1308. https://doi.org/10.3390/app10041308