Scenario-Based Analysis of IT Enterprises Servitization as a Part of Digital Transformation of Modern Economy


1
Department of Information Systems, Faculty of Management, Comenius University in Bratislava, 82005 Bratislava 25, Slovakia
2
Vienna University of Economics and Business, 1020 Vienna, Austria
*
Author to whom correspondence should be addressed.
Appl. Sci. 2020, 10(3), 1076; https://doi.org/10.3390/app10031076
Submission received: 7 January 2020
/
Revised: 25 January 2020
/
Accepted: 30 January 2020
/
Published: 5 February 2020
(This article belongs to the Special Issue Digital Transformation in Manufacturing Industry)
Abstract
:The transition towards Servitization in the IT Business is extremely challenging because IT Enterprises must transform partly or entirely from hardware manufacturers into service providers. Moreover, Servitization does not occur all at once; it is a long and continuous process. Thus, in order to succeed, a company must determine which phase of this process it is in within a short time period, due to the dynamic competition in the modern IT Business. An examination of such a transition is crucial for accurate enterprise resource planning and for business success in general. Accordingly, to gain a better understanding of this process/transition in the IT industry, five major players were analyzed. We provide a foundation of the definitions and concepts regarding Servitization. Based on this foundation, every major player is analyzed by business segment. Then, those business segments are broken down into the offerings delivered to the customers. Depending on the offering, an analysis of the revenue is performed. In addition, we discuss the challenges and their effects on every company, and then we examine the similarities and differences in the process. We conclude with a brief statement of our primary achievements, and possible future investigation directions/topics are suggested.
1. Introduction
The transition towards Servitization in enterprises has been increasing continuously in the last decade. This process has been occurring in various industries, revolutionarily changing the landscape of an entire business, e.g., transforming goods manufacturers into service providers. Due to this, companies must undergo major changes. However, Servitization is a time-consuming and necessarily persistent process. It does not occur instantly; it is a long and continuous process. Thus, a company must know which phase of this process it is operating in to perform further accurate steps and succeed within a short time, because modern business competition is highly dynamic. Accordingly, an IT Servitization process analysis was the motivation for the research presented in this paper.
Consequently, the transition towards Servitization in the IT Business is extremely challenging because IT Enterprises must transform partly or entirely from hardware manufacturers into service providers. This move happens as a part of “Digital Transformation”/“Digitalization” [1] of modern economy, or, in other words, a transition towards the “Digital economy” [2].
As evidence of this, “Every day 207 billion emails are sent, 8.8 billion YouTube videos are watched, 4.2 billion Google searches are conducted, and 152 million Skype calls are made. Internet based, digital businesses are expanding at a tremendous pace, with new mobile and intangible digital goods and services becoming available to consumers on a daily basis.” (October 2018) [1].
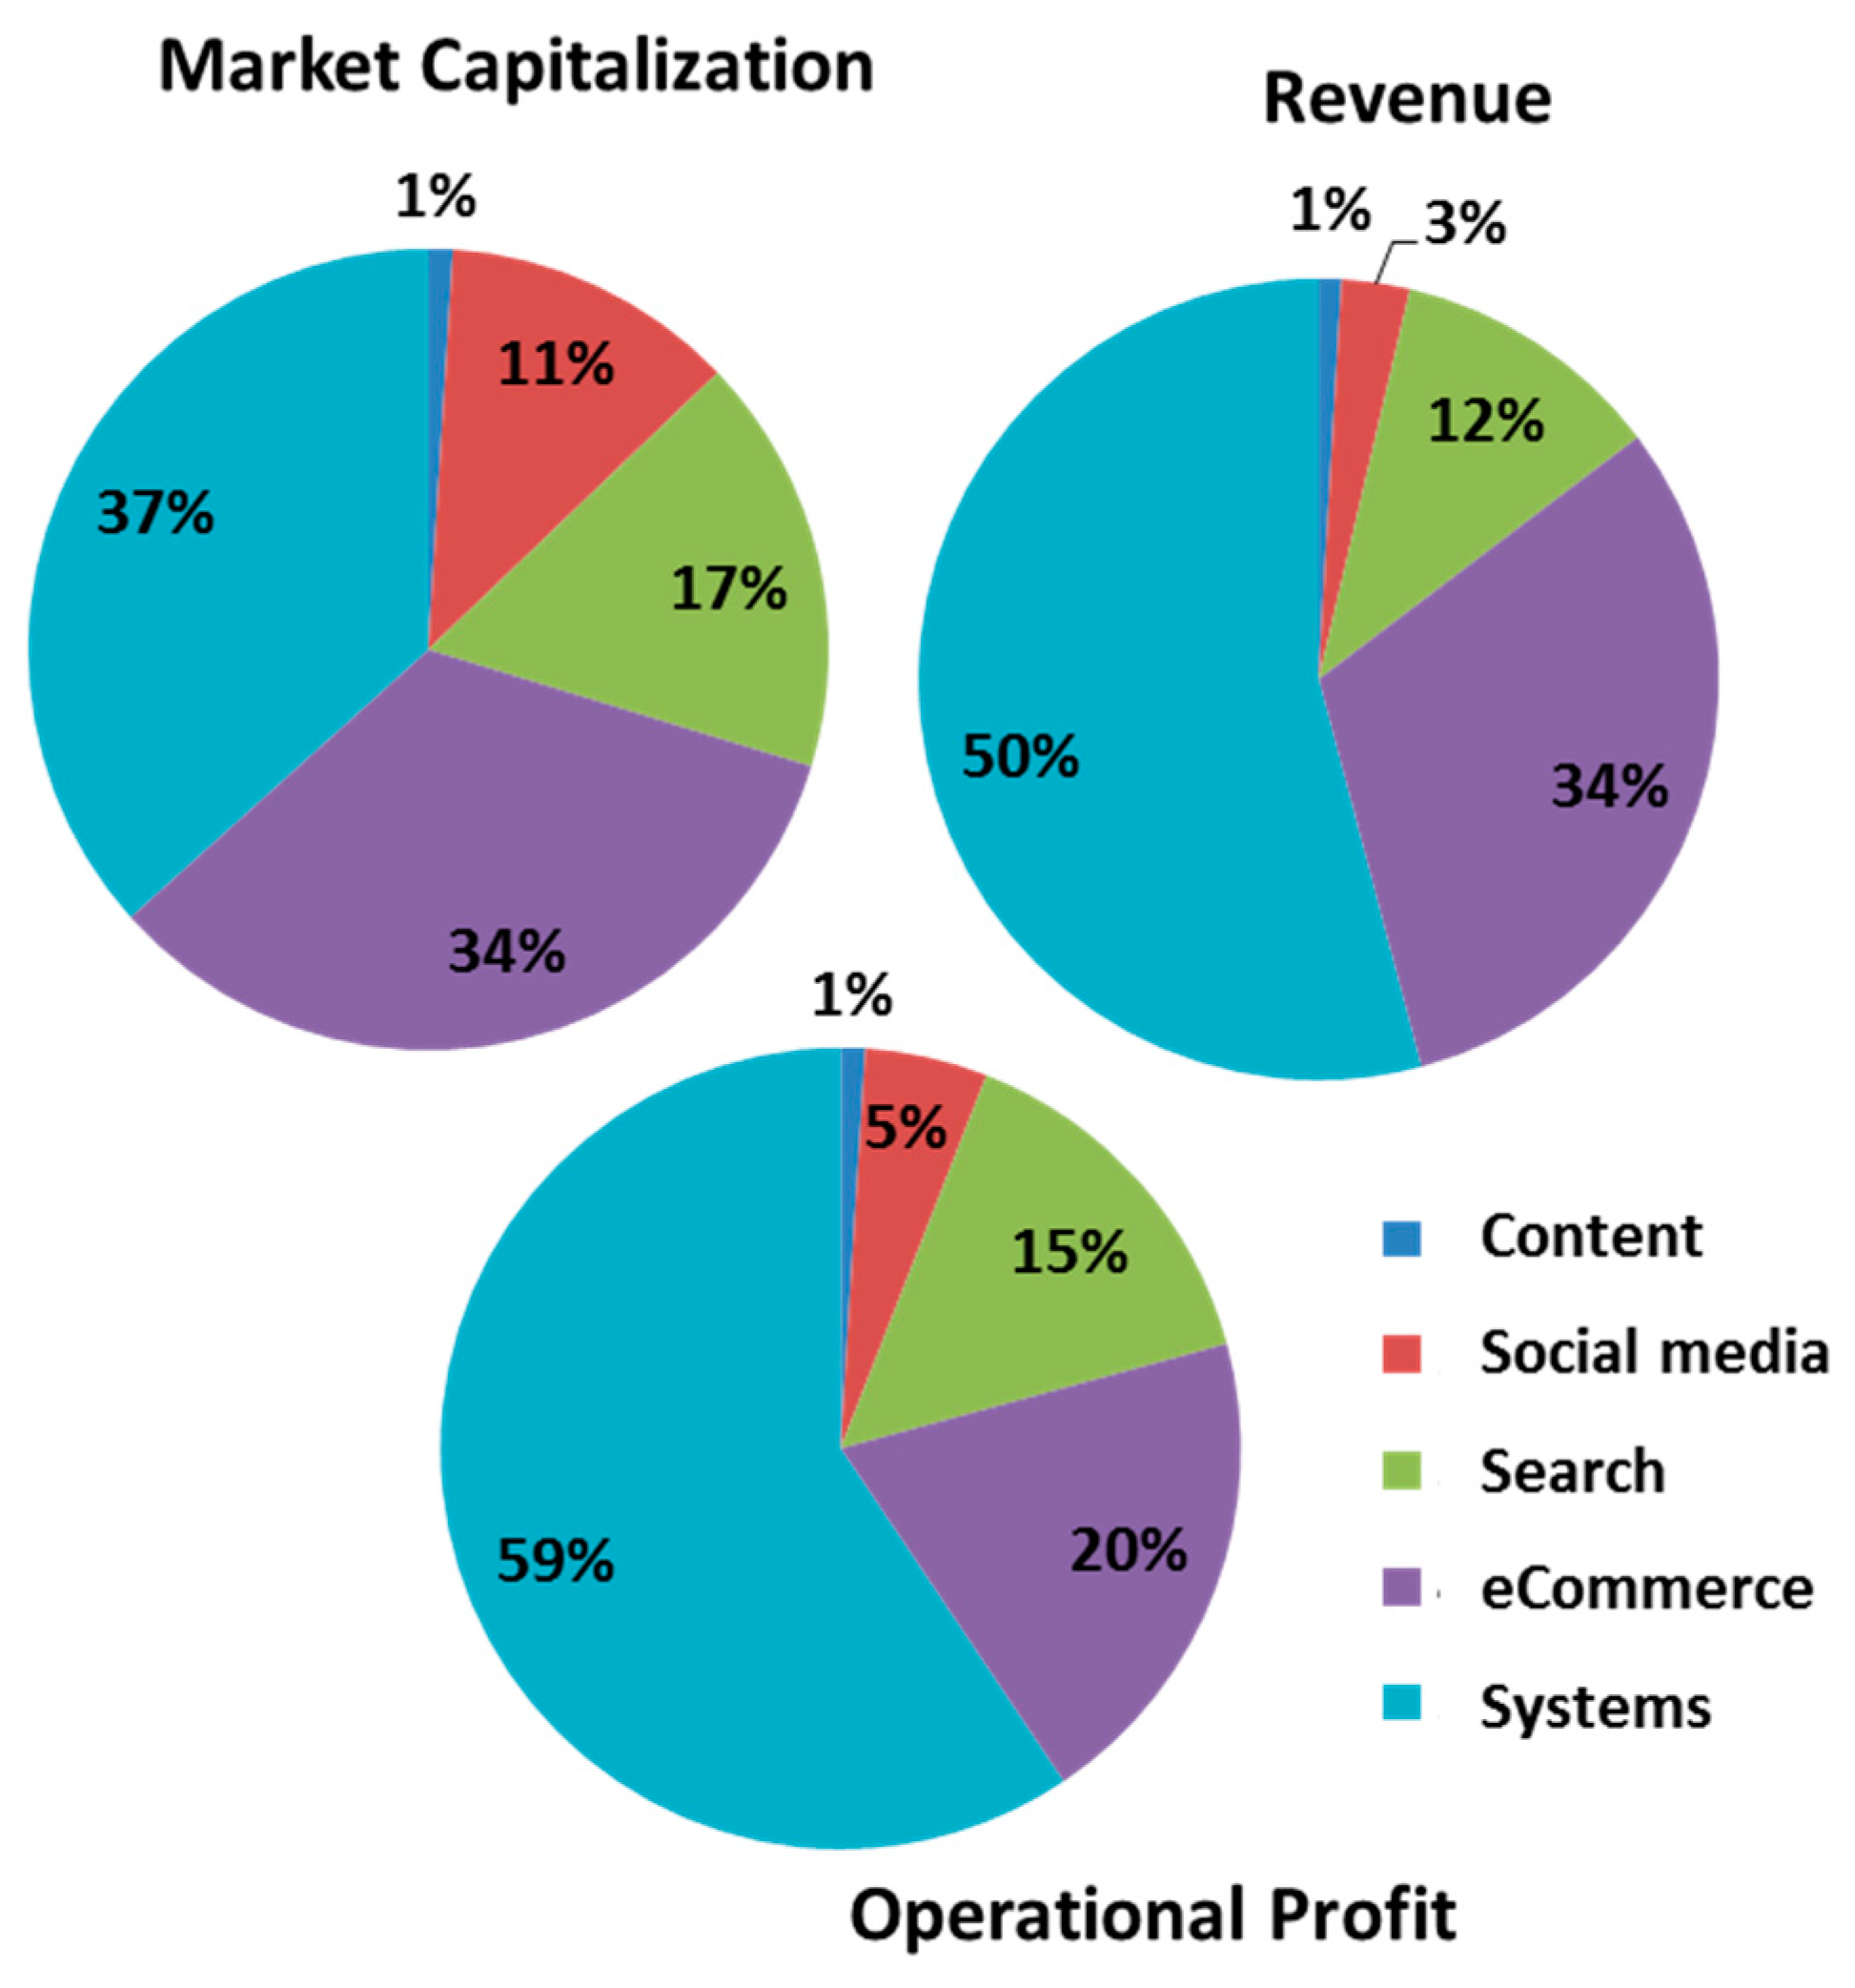
Furthermore, “Today, half the world’s population is online, a third are on a social network, 53% are mobile, and they span all ages, races, geographies and attitudes across the planet. The culmination of this explosion in consumer connectivity is the Digital Economy. A young, dynamic, $3 trillion ecosystem based on technological infrastructure, increasingly intuitive devices and interfaces, vast audience networks, a whole new medium for advertising and an unlimited supply of content.”… “It has disrupted age old industries while giving rise to completely new ones.”… “The Digital Economy is worth almost three trillion dollars today. To put it in context, this is about 30% of the S&P 500, six times the U.S.’ annual trade deficit or more than the GDP of the United Kingdom.” (Jun 16, 2016) [2]. Still, the current situation, as presented in Figure 1 [2], reflects the dominance of “digital” manufacturing of software and services. As is found in [2], “Device Systems and e-Commerce are 71% of the digital economy’s value” and “they generate 80% of the profit”, while “social media is 12% of the digital economy” and “generates 3% revenue and 5% profit”. On the other hand, the “content over billion webpages … makes up 1% of the digital economy’s value, revenue, and profit”.
Besides, as is mentioned in [3], “Digital technologies are driving unprecedented change, disruption, and opportunity in business, the economy, and society. As the pace of change accelerates, it’s imperative that humans examine the most pressing question of our time: How do we thrive in a period of profound digital transformation?”
Consequently, Servitization transition reasonably envisions this question and also visualizes Digitalization, or the transition towards a digital economy, through real projects.
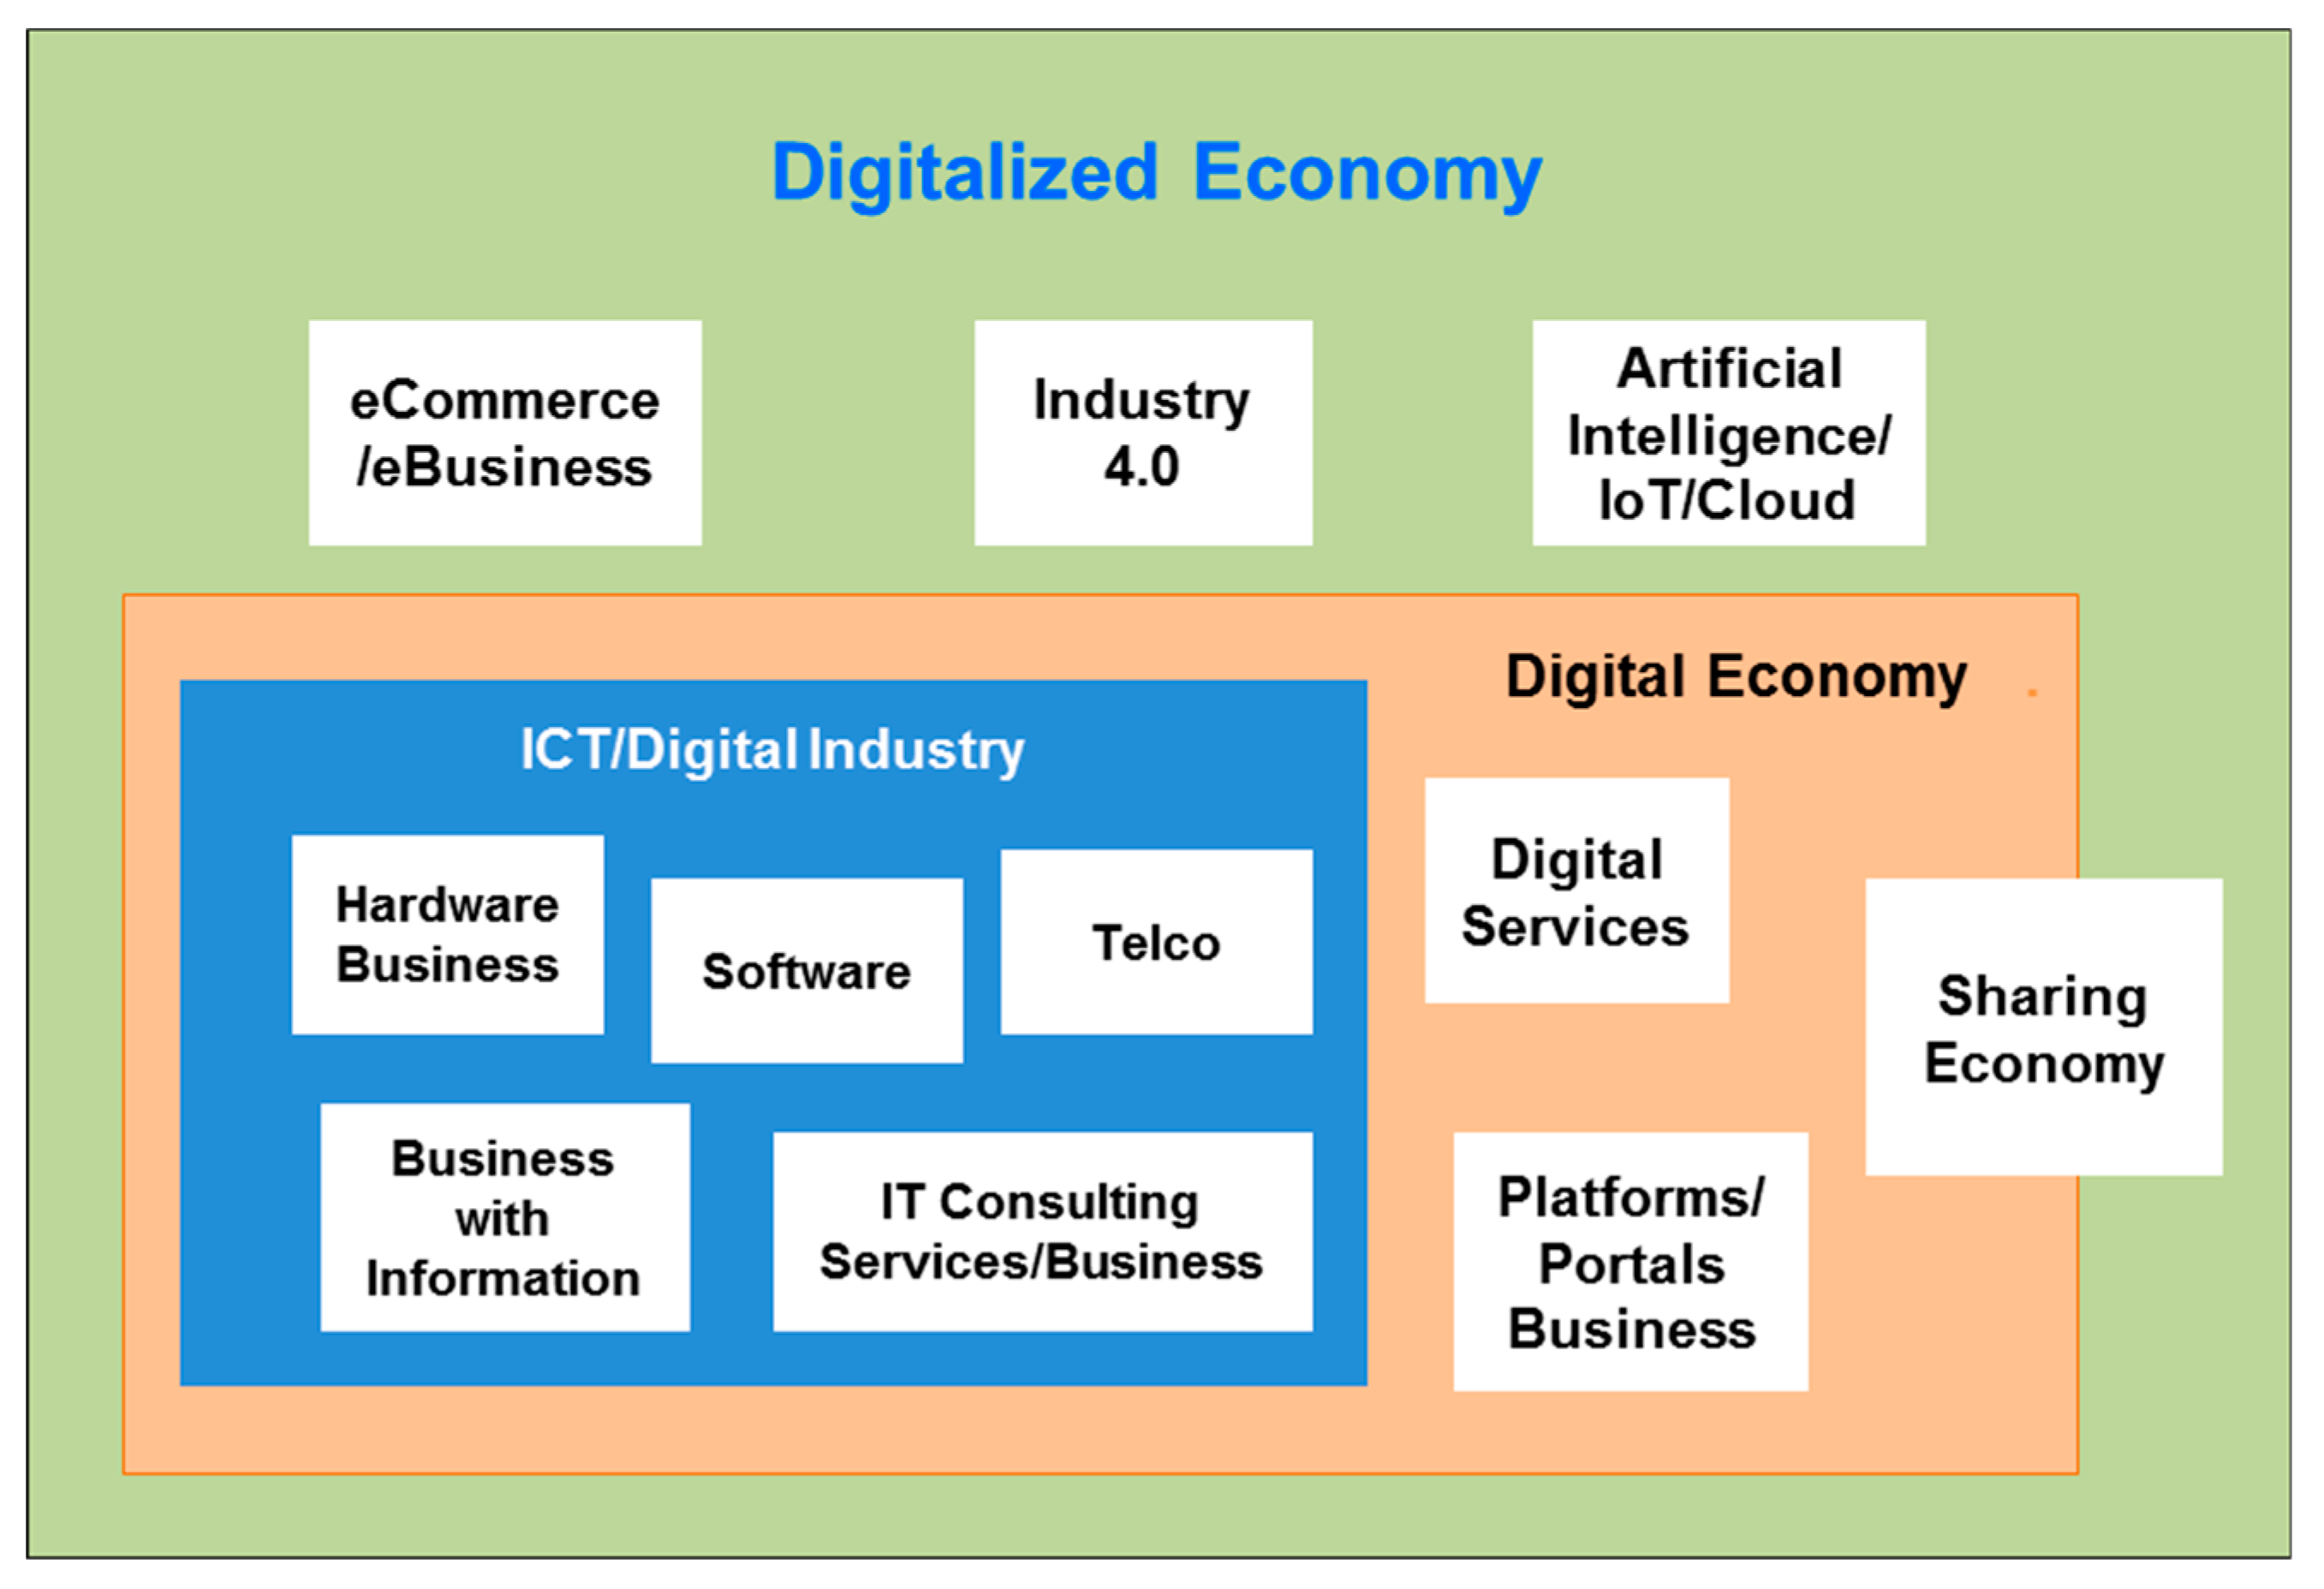
As defined in [4] (Figure 2), “The core of the digital economy is the “digital sector”: more often called the “IT sector” or “ICT sector””; “The “digital economy” is “that part of economic output derived solely or primarily from digital technologies with a business model based on digital goods or services”; “A much wider scope encompasses all economic activity based on digital technologies; thus also including application of ICTs to intensify existing economic activity in manufacturing, services and primary production is “digitalised economy””.
Based on the above definitions, we explore in this paper how ICT/digital sector converts, e.g., concrete cases—how IT companies servitize or transform into service providers. Such an investigation is done through scenario-based analysis of Servitization projects implemented in these companies. In addition, our aim was to perform such research using major players in the IT branch that had previously gone, either partly or entirely, through this transition, with successful results, e.g., business profits from services [5,6,7,8,9,10,11,12].
As explored in [13], “Servitization promises to strengthen the competitiveness of manufacturers and is expected to deliver growth, profitability and stable revenues”. Further, the authors define levers for succeeding in servitization [13]: “Setting strategic direction - clear service strategy and the necessary investments to align the strategic direction with operational capabilities; develop capabilities for designing and delivering services, including technical expertise, customer orientation and IT; create the organizational arrangements to support the development, sale and delivery of services and align performance measures and incentives; and, establishing a service culture”. Besides this, the industrial operations strategy is based on five performance objectives and KPIs for service: Quality (Customer satisfaction), Speed (Response time), Dependability (% faults addressed within time), Cost (Labor productivity), Flexibility (Range of service mix) [13].
Other scholars [14] claim that “Servitization is a transformation process wherein product companies embrace a service orientation and/or develop more and better services, with the aim to: satisfy customer’s needs, enhance the firm’s performance, achieve competitive advantages”.
Next, the success of Servitization, similarly to any other innovation process/transition, can be measured through CSFs (Critical Success Factors). As was defined in [15], “Critical Success Factors are the critical factors or activities required for ensuring the success of business”. CSFs refer to “the limited number of areas in which satisfactory results will ensure successful competitive performance for the individual, department, or organization” [15], and [16,17,18]. The author [15] delineates four basic types of CSFs: (1) Industry CSF’s, (2) Strategy CSF’s, (3) Environmental CSF’s, and (4) Temporal ones.
In the research performed in [19], it is claimed that the success of Servitization depends on many components/aspects. Of particular importance are five elements for the efficient alignment of company factors with Servitization. “Organisational (1) capabilities are achieved by aligning (2) structure, (3) processes, (4) rewards and (5) people with each other [19]”.
The seven CSFs are explored in [20]: “(1) Assess your market and internal readiness; (2) create the right strategic and cultural context; (3) build the structures and governance for services; (4) get the resources ready for service innovation and delivery; (5) proactively manage engagement and trust; (6) develop and embed service processes; and (7) optimise services and communicate best practices”. Further, the authors state that “Success of servitization depends on success of every single service implementation and usage by customers”.
In [21,22], the conceptual framework for the servitization process is developed. The authors propose a detailed taxonomy of critical success factors and test them on a few cases.
This is our primary work on Servitization. The research goal was to start preparing a framework/methodology to answer a crucial question—“how to measure Servitization?”—starting from the IT industry. For this reason, we predominantly analyzed five IT companies, which of course is not enough to perform a comparative analysis, and in turn construct an efficient/comprehensive illustration of an evolution and a current situation However, the value of our research lies in defining the variables/factors/elements of a future Servitization measurement framework.
The remainder of the paper is organized as follows. The subsequent “Introduction” subsections provide a brief description of the Servitization paradigm: its basic definitions and concepts, a retrospective view of services and service science entrance as a scientific element. Then, Section 2 provides a more precise focus on the Servitization process through an analysis of its phases and approaches. Section 3 is the core of our paper, e.g., the case analyses. Additionally, we provide an evaluation of the Servitization transition similarities and differences of the five IT players. We complete our work by summarizing our analysis results and by providing several ideas for further investigations needed by the IT industry while “Servitizing” enterprises.
1.1. Goods and Products
In 1766, Adam Smith [23] defined “goods”, and the definition has remained mostly unchanged over the last 200 years. The features of goods can be summarized as follows (adapted from [24]):
- Physical objects for which a demand exists;
- Their physical attributes are preserved over time;
- Ownership rights can be established;
- They exist independently of their owner;
- They are exchangeable;
- Unit ownership rights can be exchanged between institutions;
- They can be traded on markets;
- They embody specialized knowledge in a method that is highly advantageous for promoting the division of labor.
Furthermore, the definition of products is interchangeable with the definition of goods, as is stated in [24]. Products have the same attributes as goods.
1.2. Services
The definition of services is not as easy to find as that for goods or product because research on services stems from different scientific backgrounds, such as marketing or operations research. Thus, there is no explicit definition agreed upon by every discipline, but, instead, various agreed-upon definitions [24]. The most cited definition is in [25], as follows:
“Service is a process consisting of series of more or less intangible activities that normally, but not necessarily always, occur in interactions between the customer and service employees and/or physical resources or goods and/or systems of the service provider, which are provided as solutions to customer problems” [25].
Another characterization of services that is widely accepted conceptualizes it as containing four major features: Intangible, Heterogeneous, Inseparable, and Perishable (IHIP). These four features are known as the IHIP characteristics [26]. Intangible things, by definition, are not physical objects and thus are services based on the performance of a service provider [26]. Heterogeneity focuses on the difficulty of standardizing the services. In addition, depending on the customer’s involvement and requirements, the outcome will change [26]. Inseparability is a service that must be produced and consumed simultaneously. Thus, the production of a service provider is directly linked to the consumption of a customer [26]. Perishable services cannot be stored or stockpiled. These criteria are broadly used and often criticized by scholars [27,28,29]. Nevertheless, they are quite useful as a commonly accepted definition.
1.3. Digital Goods and Digital Products
Digital goods/products differ from classical ones because they only exist in a digital form. However, like classical ones, they have economic value. Examples of these are digital books, music and images. In general, the transaction cost of digital products is quite low compared to normal goods. In addition, they share certain common attributes, as described in Table 1.
Hill (1999) [31] argued that intangible goods/products must be separated from services under the IHIP service definition. Music, e-books or movies are intangible but utilized in the same method as goods/products, e.g., used or sold. This makes it necessary to clarify that such goods and products are more than what is stated in the definition of goods and products. Additionally, intangible goods/products are different because they can be copied an infinite amount of times by third parties. This creates a complicated legal situation that results in tight patent and copyright laws to secure those products [30]. Another difference between tangible and intangible goods/products is that there is an obvious differentiation between a product and a digital product. In the case of intangibles, it is not clear whether product ownership is exchanged because digital products are either on a third-party network or exchanged at the point of operation by the digital product owner. This complicates, for example, an evaluation of taxation and jurisdiction [30].
In the following section, we continue with definitions of the Servitization process, and its phases and approaches.
2. Servitization
The term Servitization was introduced by Vanderemerwe and Rada in 1988 [32,33]. They described it as a method of offering packages, which combined goods, services, knowledge, support and self-service, of which services were the primary offering [32,33]. In the 1990s, Wise and Baumgartner introduced to the industry the idea that, instead of producing goods only, businesses should go further and offer goods by exploring new profit units. Therefore, the Servitization notion originated in the manufacturing industry, which was related to a slowdown in world consumption and decreasing profit margins [34].
After two decades of research, the transition has been developing exponentially, as more data are available and the importance of Servitization is constantly increasing. However, currently, the primary research area is still the Servitization of the manufacturing industry [35].
Additionally, other terms have been coined that use a different approach or have a different final goal. Explicitly, the term product–service–system is closely related to the term Servitization [36]. There are various approaches because Servitization’s outcome differs, e.g., manufacturing companies should enhance their products by selling integrated solutions, meaning it was researched from different perspectives. After reviewing more than 58 scientific works, Baines et al. define Servitization as follows.
“Servitization is the innovation of an organization capabilities and processes to better create mutual value through a shift from selling product to selling PSS” (product service system—PSS) [36].
This definition is widely used in the field and a simplification will be used for the remainder of the paper.
2.1. Phases Analysis
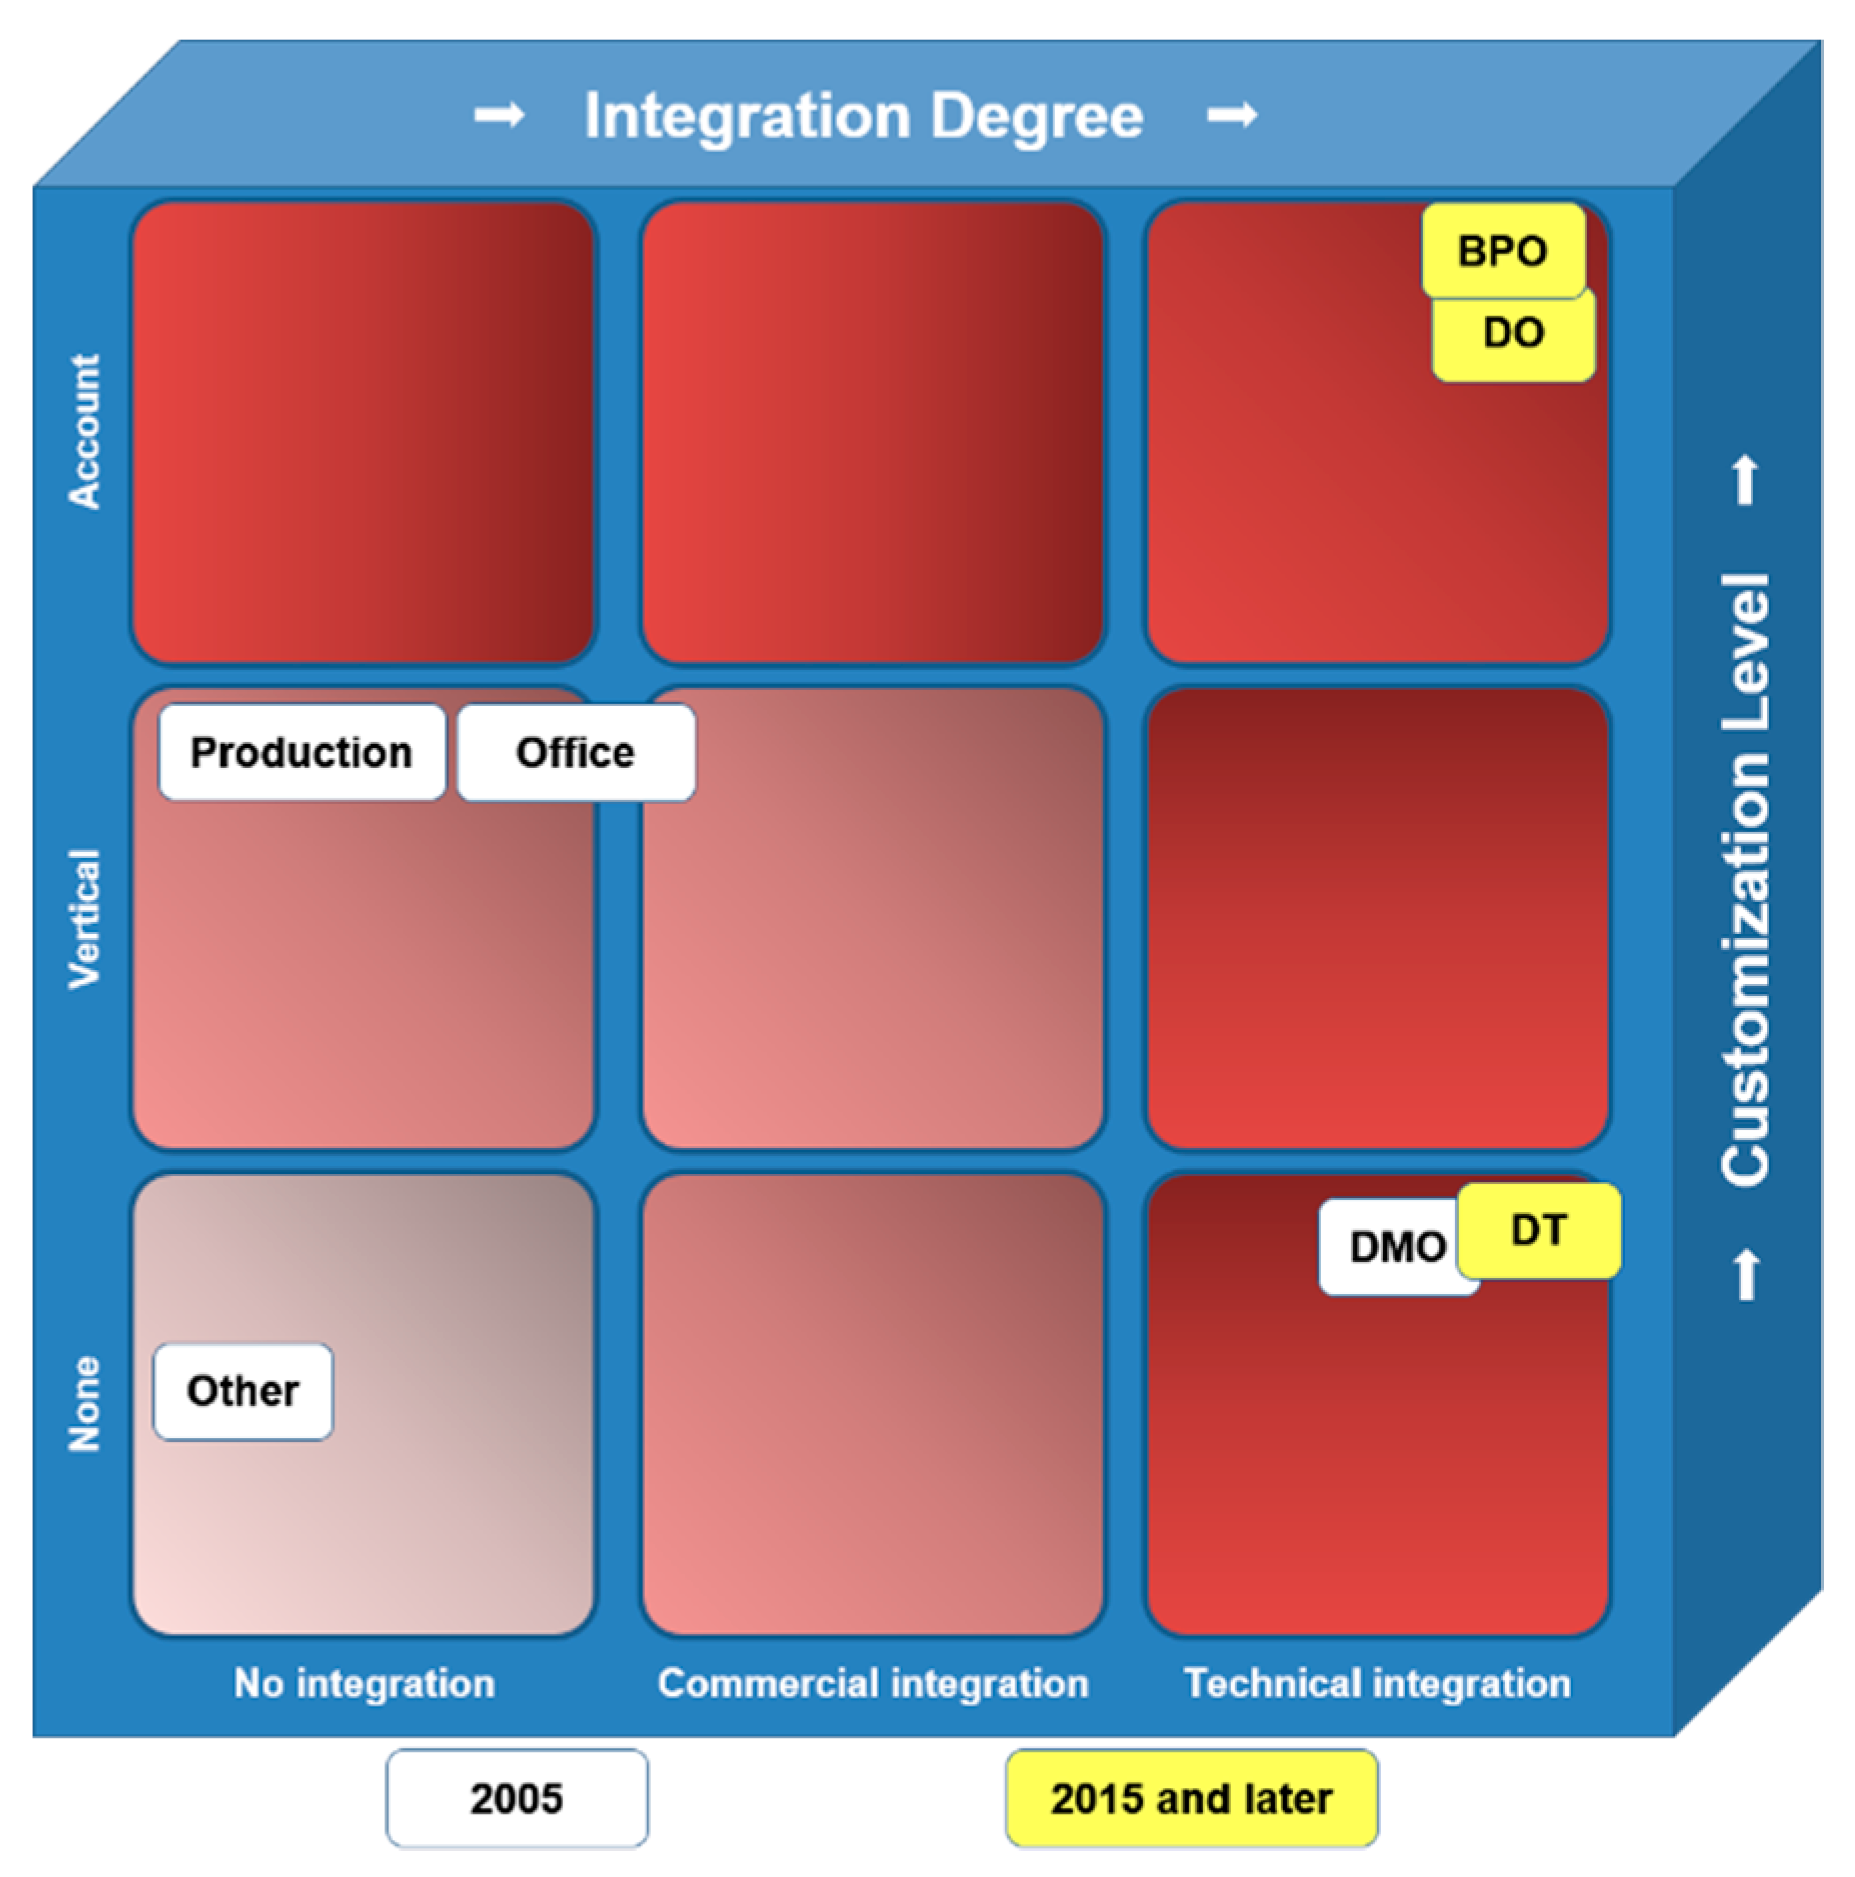
Since Servitization does not occur instantly—it is a long and continuous process—companies can be classified by the phase of the process they are operating in [5,25,33,35,37]. The steps/phases are rated based on their grade of implementation. In this aspect, crucial analysis must occur regarding the grade of customization in relation to the degree of integration of the product/service provided by a company. In larger companies, this analysis is based on the cells/segments a company operates in [38,39].
McKinsey [39] divided the grade of customization into three levels:
- On the first level there is no customization added to the basic product/service. These products/services are usually standardized and have the same marketing strategies;
- On the second level, several adoptions and modifications, geared towards industries or customer segments, are implemented. This primarily varies in the technical specifications or the marketing of the product/service;
The degree of integration is based on the interrelation between product and services in a single offer. This is based on the value products or services deliver over the sum of their parts. McKinsey [39] also divides the integration into three levels:
- On the first level no interrelation is occurring and only a single product or service is sold;
- On the second level commercial integration is happening, where multiple products/services are put into a single offer. In this phase, there are various types of product or price bundles;
- At the highest degree of integration, commercial integration and technical integration occur simultaneously. This degree of integration requires the interoperability of the components and occurs in offers where an option is offered from beginning to end. In this case, the offerings are interlinked for customer satisfaction and support [39,41].
2.2. Transaction Analysis
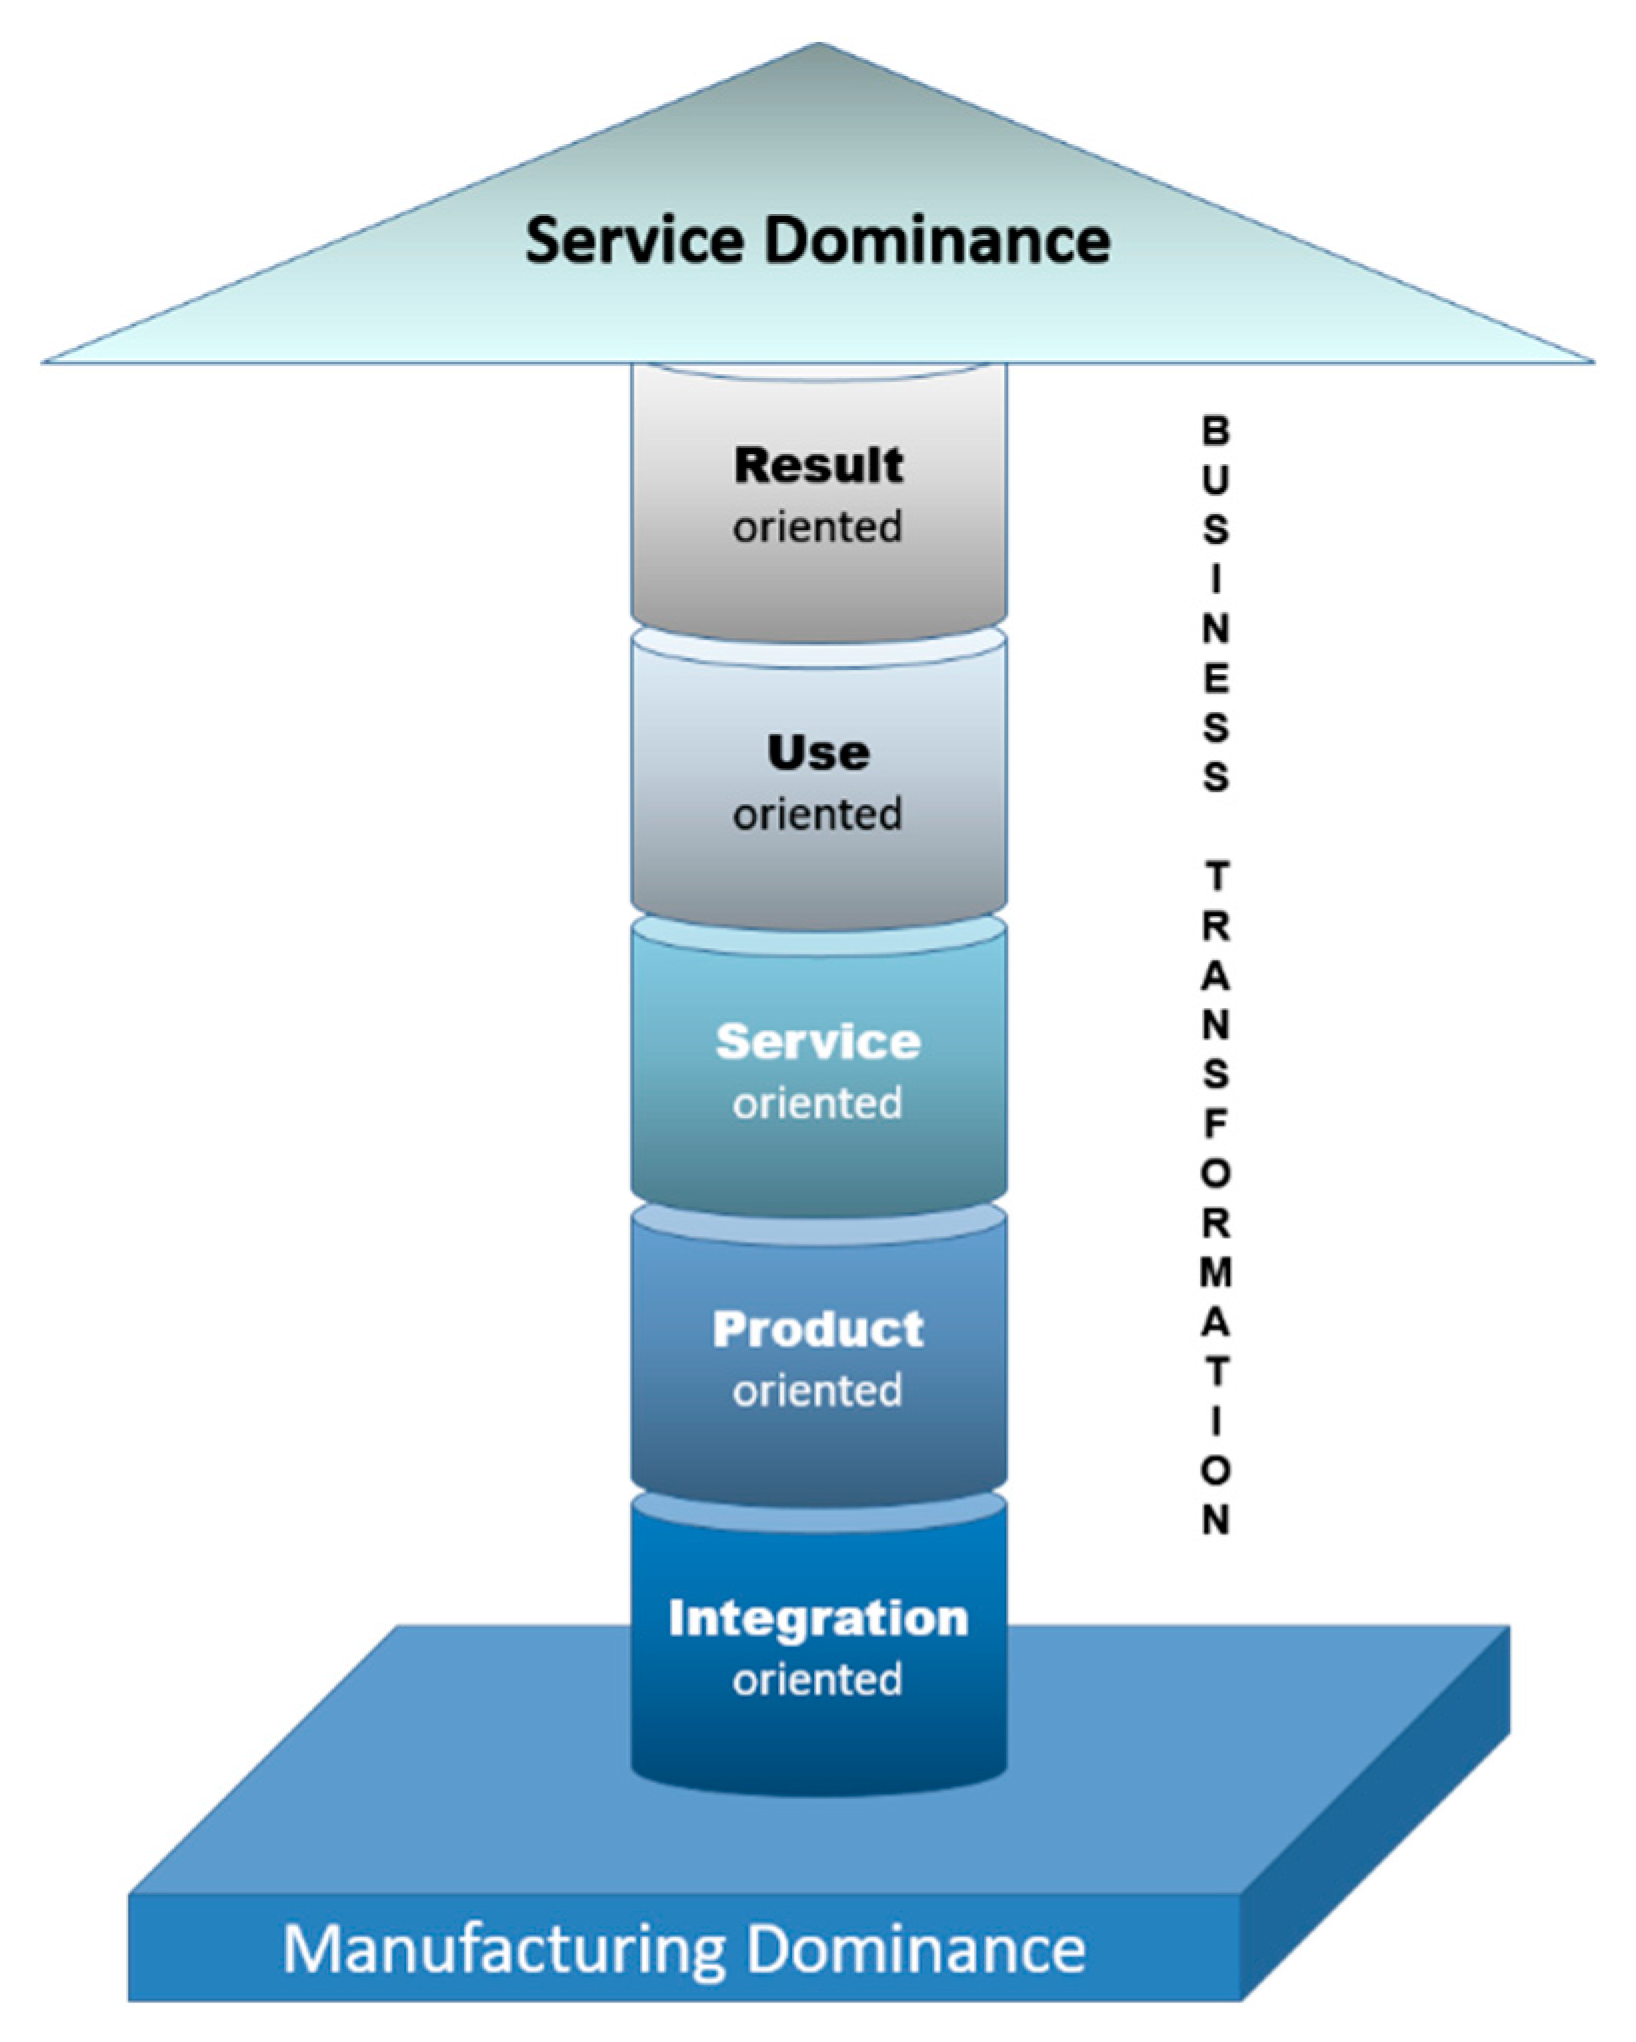
Analysis of the Servitization process development in a company can be performed by examining the transition progress from a product organization to a product–service organization. Tukker proposed a model in which he provided a product–service–system (PSS) by establishing three basic classifications. These PSSs could be product-oriented, use-oriented, or result-oriented [42]. Afterwards, Neely added integration-oriented and solution-oriented approaches in his research on the financial consequences of Servitization [43]. In addition [5], he later composed an illustration with an explicit analysis of the various elements (Figure 3) [5].
In the first phase, a company focuses only on the selling of tangible goods, which are corroborated by services as add-ons and ownership changes at the point of sale. This is in line with the vertical integration of manufacturing companies [5,42,43].
In the second phase, companies are still geared towards selling products, but several extra services are added, which are closely related to the product but not a necessity to use the product [5,42,43].
In the third phase, services are added with no choice given to the customer in terms of deciding whether to use the service or not. This results in a bundling of a product and a service as an offering [5,42,43].
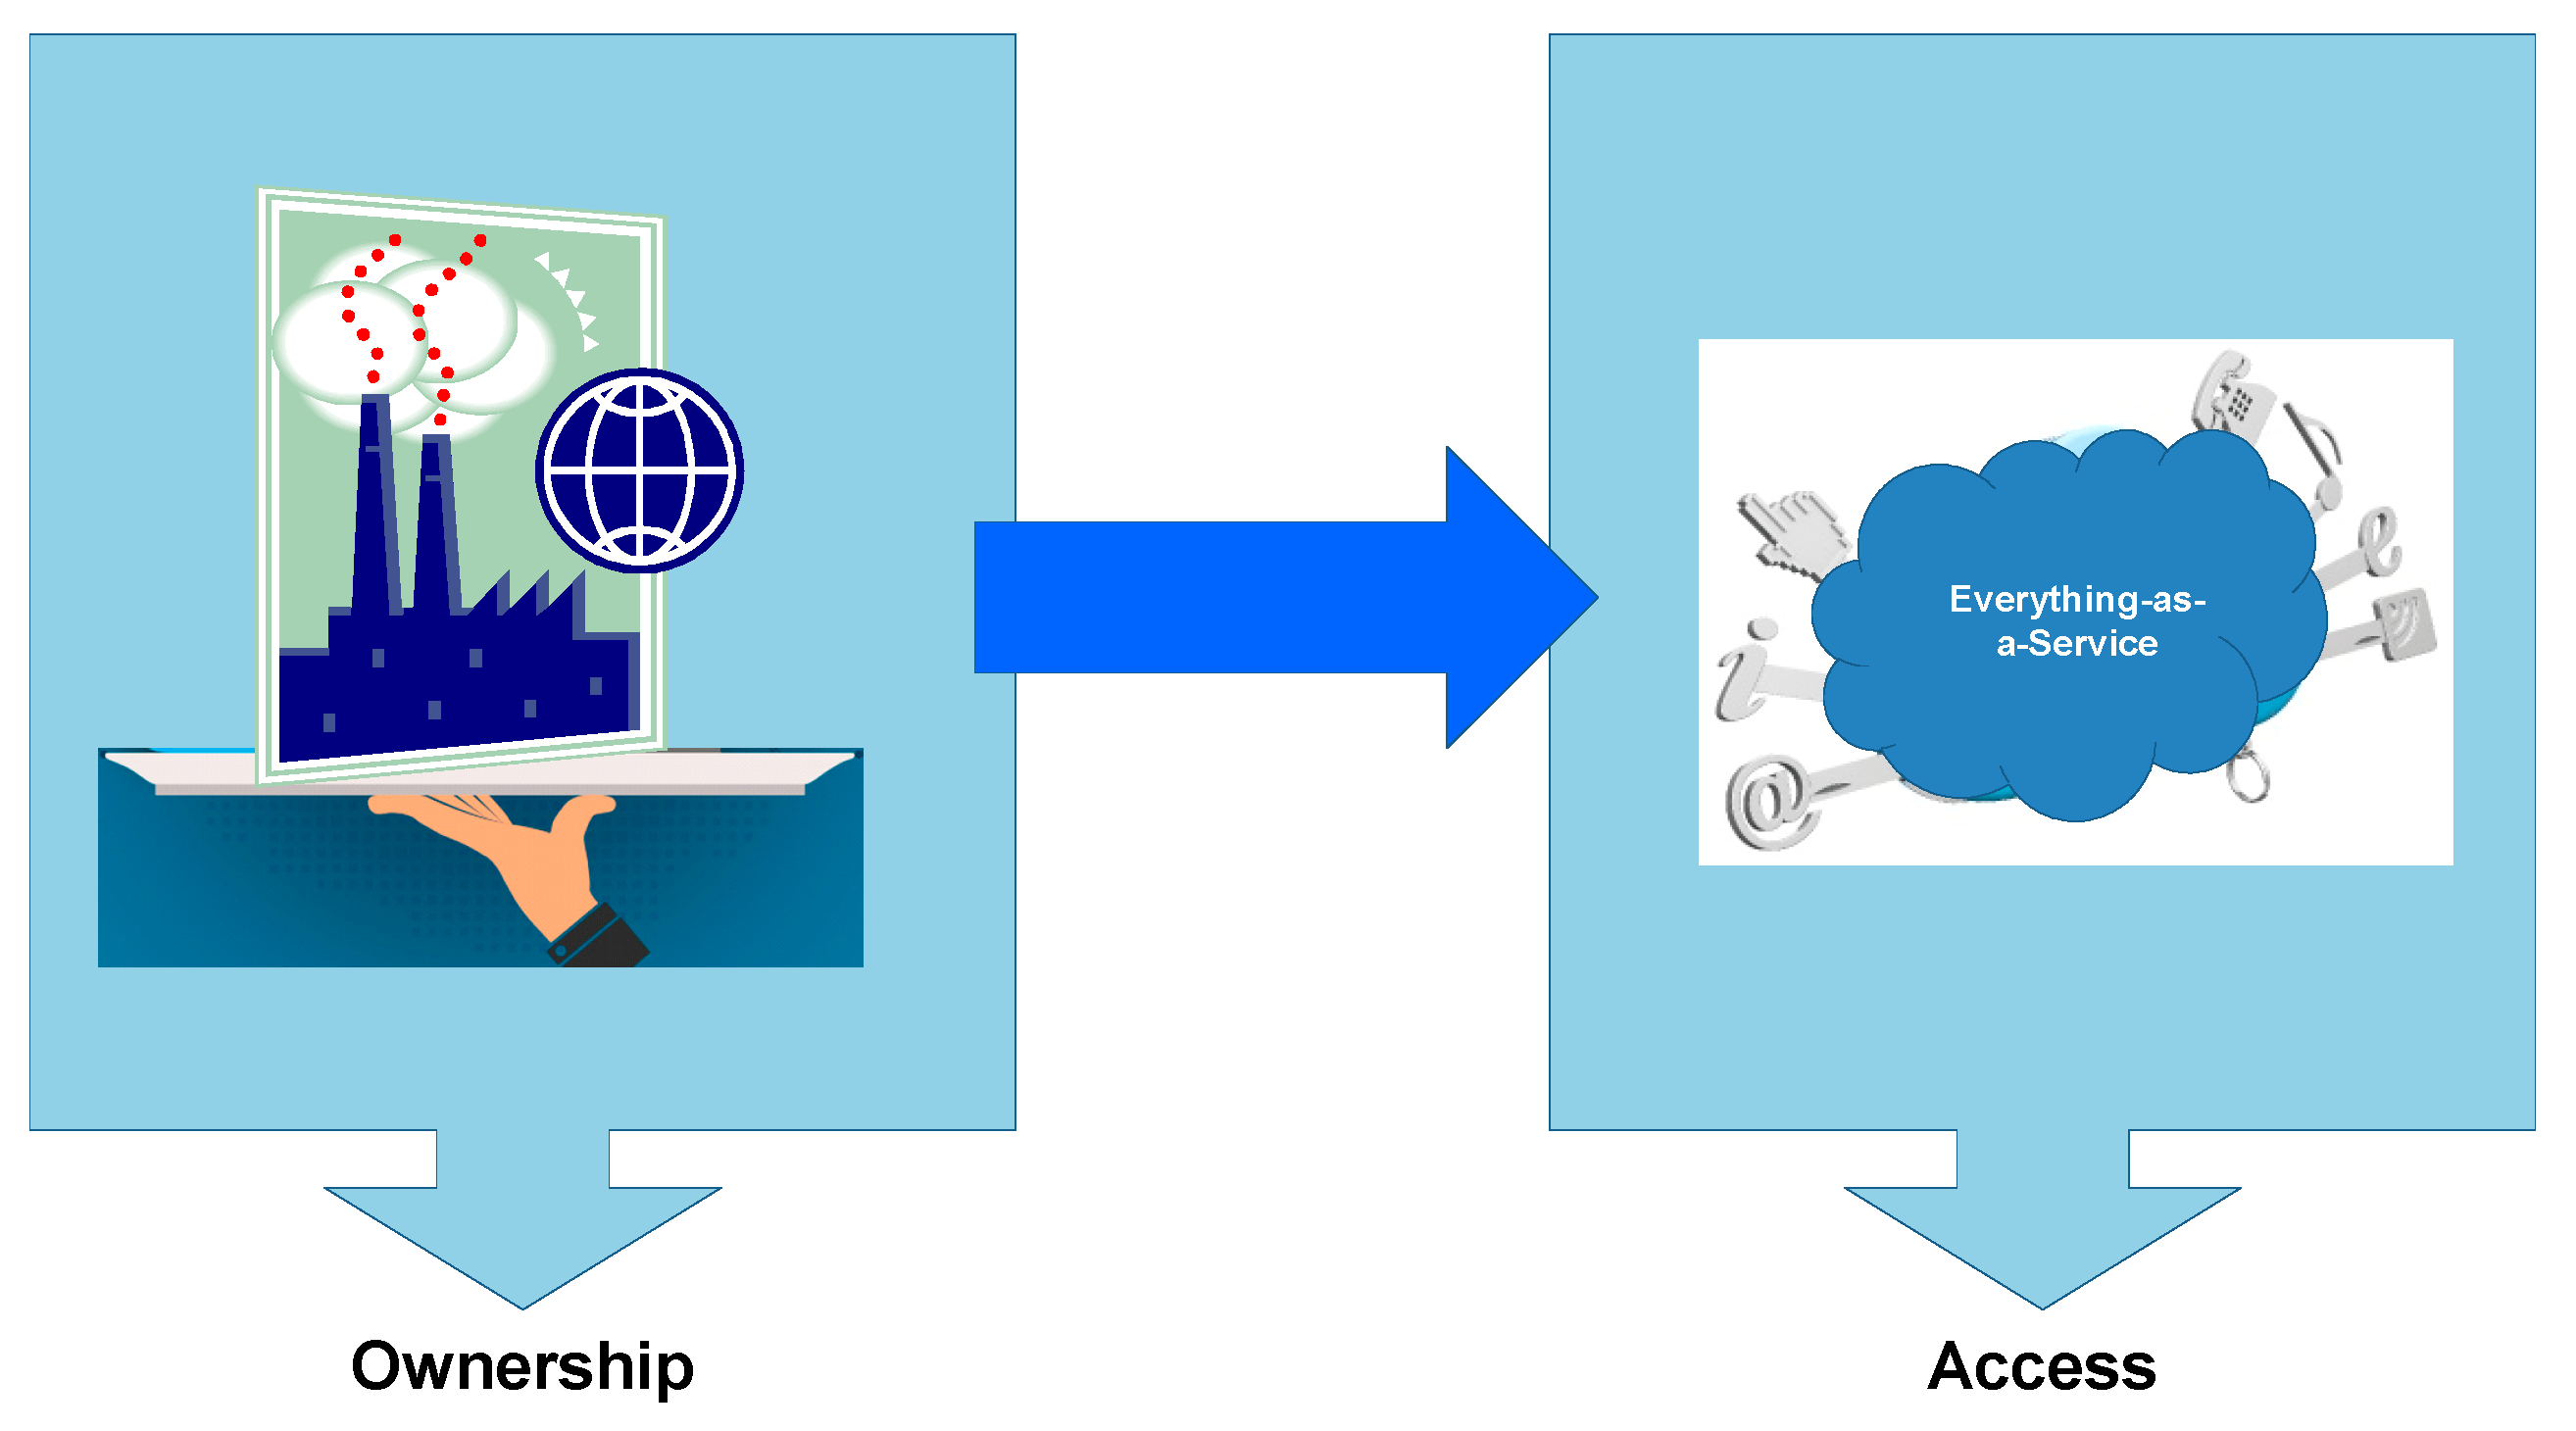
In the use-oriented phase, the business model switches away from selling products, as the product stays under the ownership of the provider. This switch, implied by Baines et al. [36], is illustrated in Figure 4 [44,45].
Tukker divides this phase into three additional types of use-oriented services. The first type is the product lease, in which the customer leases the right to use the product. In the second type, the product-renting customer rents the right to use to product for a specific time period and must partially share the product with other users. In the last type, the product is pooled to a large user base and is used by them simultaneously [42].
In the last phase, the customer and the provider agree on a result, which must be provided. This solution-based approach is the final stage of Servitization. Tukker subdivides this phase into three types. First, the outsourcing type, which includes the outsourcing of entire departments or activities. In the second type, a customer agrees to pay according to a certain output of the product and a certain level of usage. The third type is based on the resulting product, and the provider is allowed to deliver the result using any given method [5,42,43].
3. Servitization Scenarios of Top 5 IT Enterprises
In this section, we perform an assessment of the Servitization processes in different business segments of a company, based on real scenarios/examples of the Servitization principles’ implementation by major players in the IT Business. The five scenarios/companies analyzed in this paper were selected because of their pioneering of Servitization. According to a chronological analysis, they were approximately the first ones.
A scenario-based analysis method is widely described in the scientific literature. The most precise descriptions related to our investigation were performed in [46,47,48,49,50,51,52]. A definition coined by [49] can be used as description of the method: “as a “scenario”, we consider a set of conditions, variables and boundaries that drive a future (prospective) context of analysis”. Then, “In this sense, a scenario involves a context boundary to restrict the analysis to a well-delimited frame of time and variables or agents, to describe a possible near or long-term future”.
Accordingly, we performed an analysis of the customization grade in relation to the degree of integration into the product/service provided by a company. The analysis is based on the segment of evaluation a company operates under. Additionally, we explore Servitization revenue distribution, and the challenges and positive/negative effects of the Servitization transition.
3.1. IBM Servitization Scenario
In this subsection, we perform an IBM Servitization scenario analysis. First, we examine the changes faced by business segments and the revenue distribution. Then, we discuss the challenges and positive/negative effects of the Servitization transition [6,7,8].
(1) Changes Assessment by Business Segment
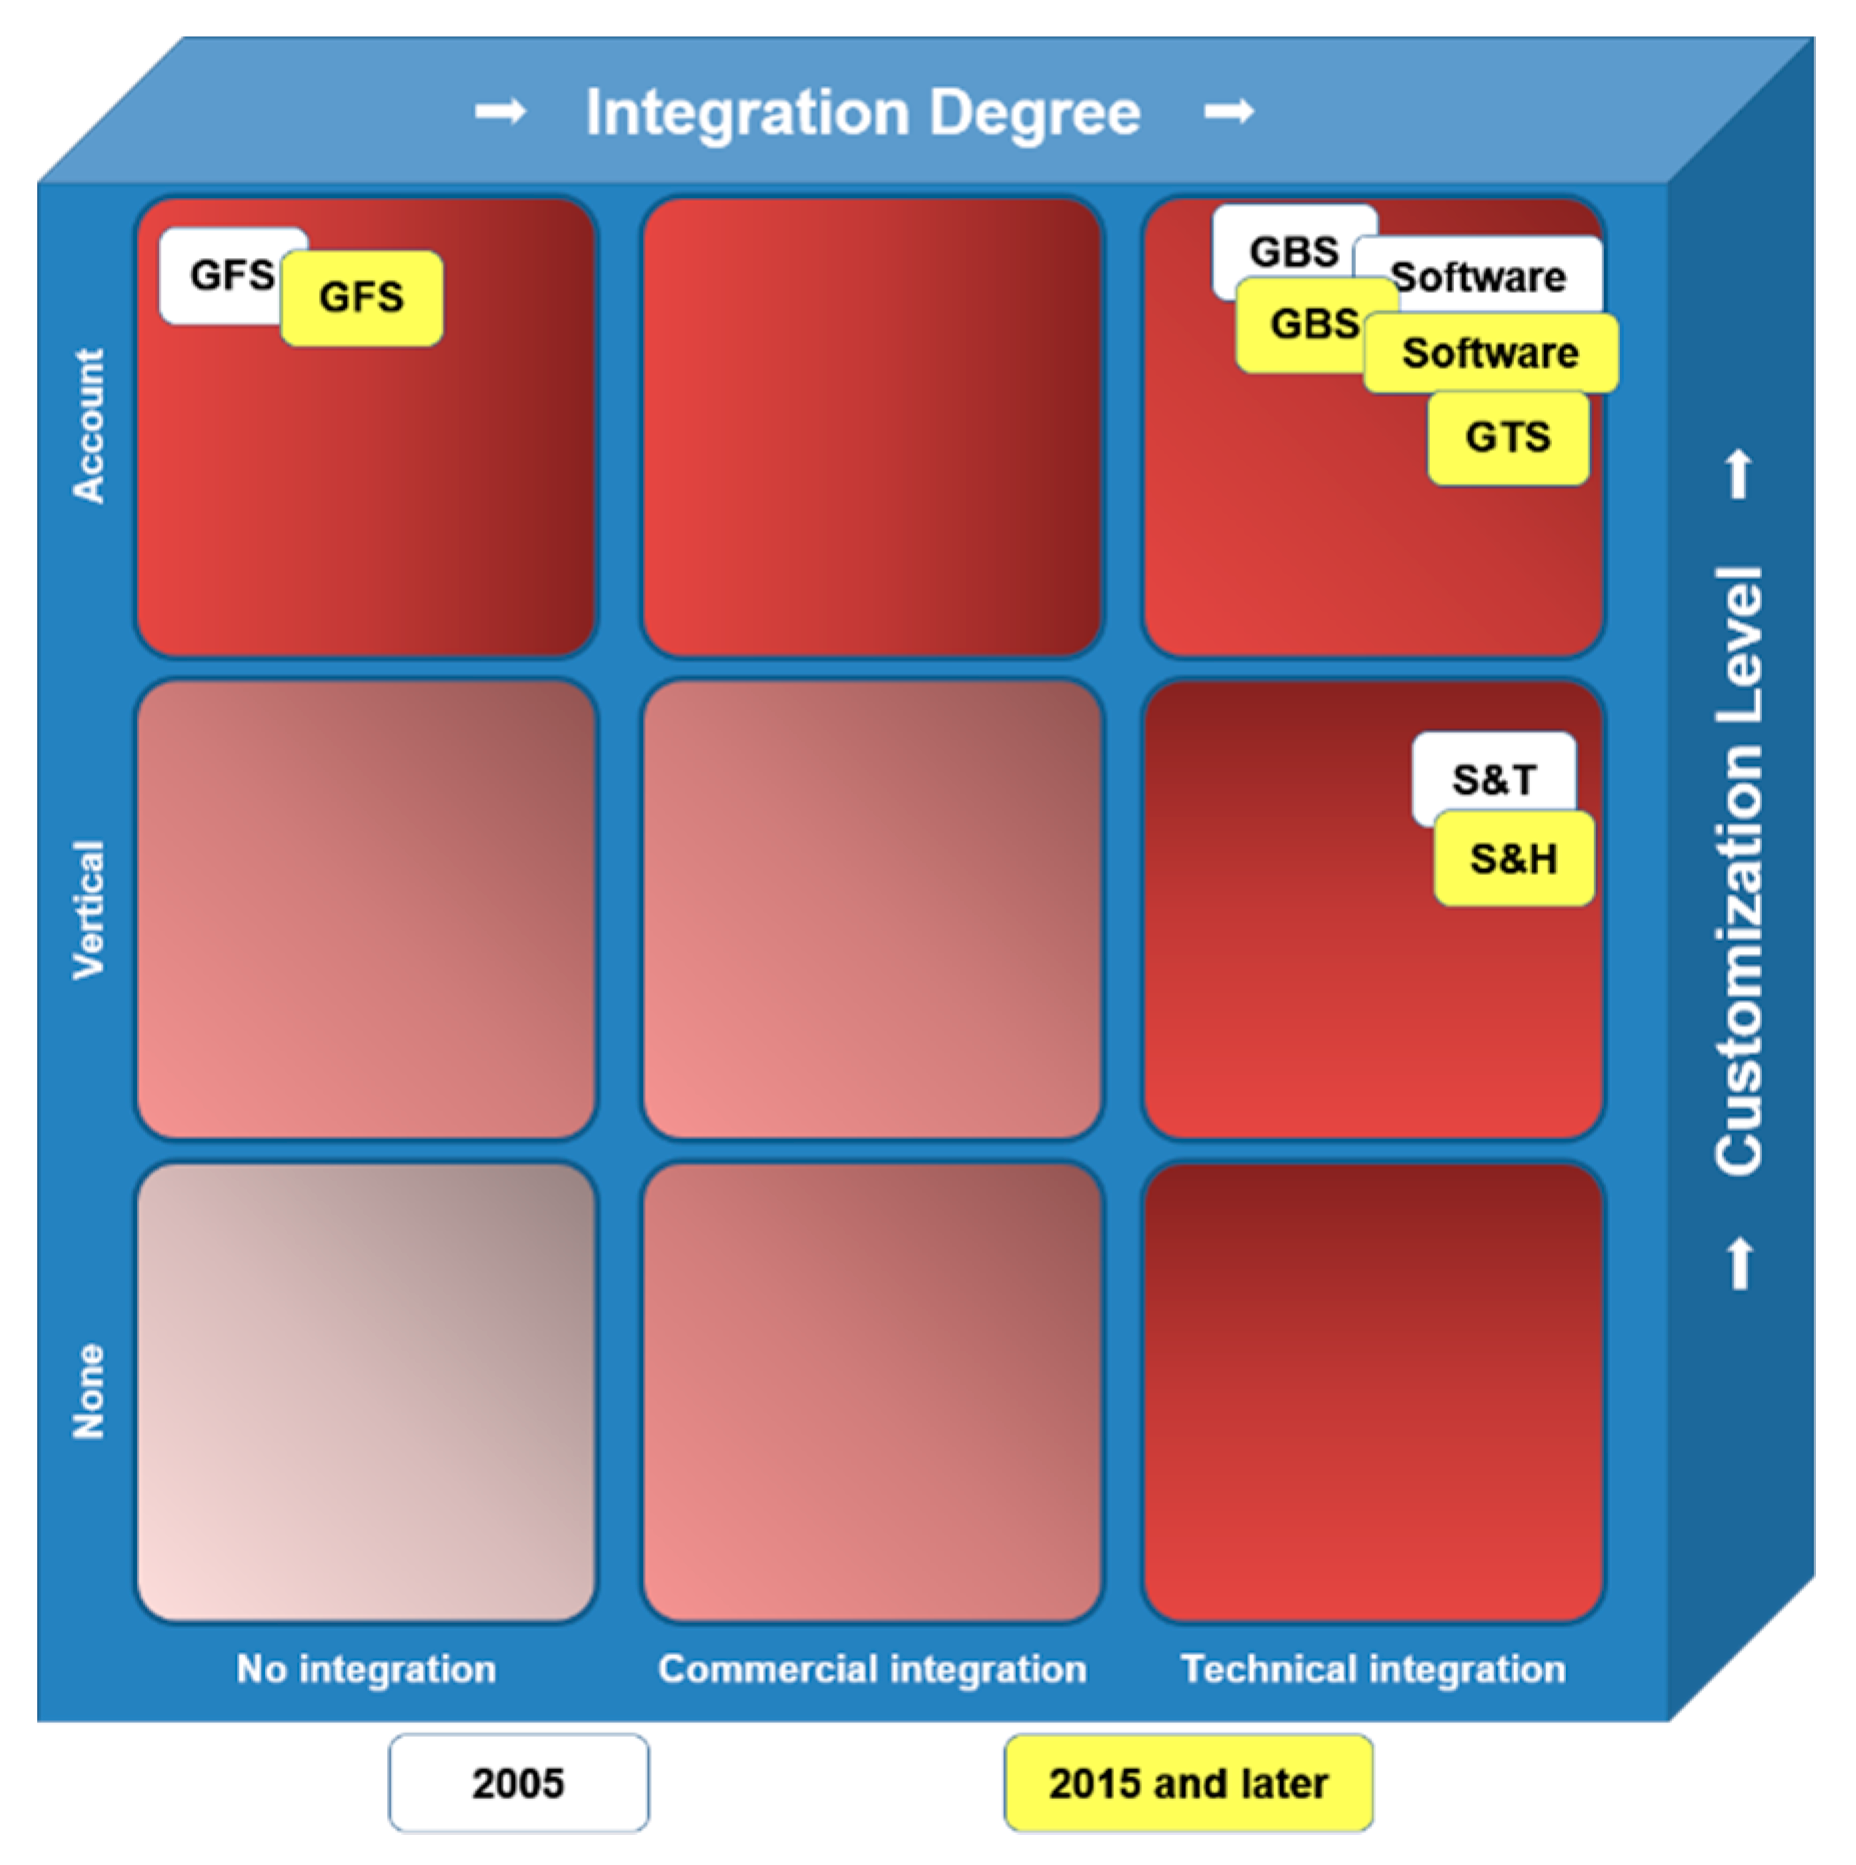
During an observation period (from 2005 until recent years), IBM business segments remained the same, but their priority shifted. To start with, there was only a global services segment, which included every service provided. In the last decade, IBM started focusing more and more on services by splitting global services into two business segments. Furthermore, although IBM already had a strong service-oriented Product Service System (PSS) it increased its efforts in some areas. In addition, it worked towards a result-oriented PSS in terms of its outsourcing [53,54,55,56,57,58,59,60,61,62,63,64].
In Figure 5 [53,54,55,56,57,58,59,60,61,62,63,64], we show the results of the change analysis by IBM Servitization transition in the period between 2005 and recent years. Several terms used in the figure are as follows: Global Business Services (GBS), Global Financial Services (GFS), Global Technology Services (GTS), Systems and Hardware (S&H), and Systems and Technology (S&T).
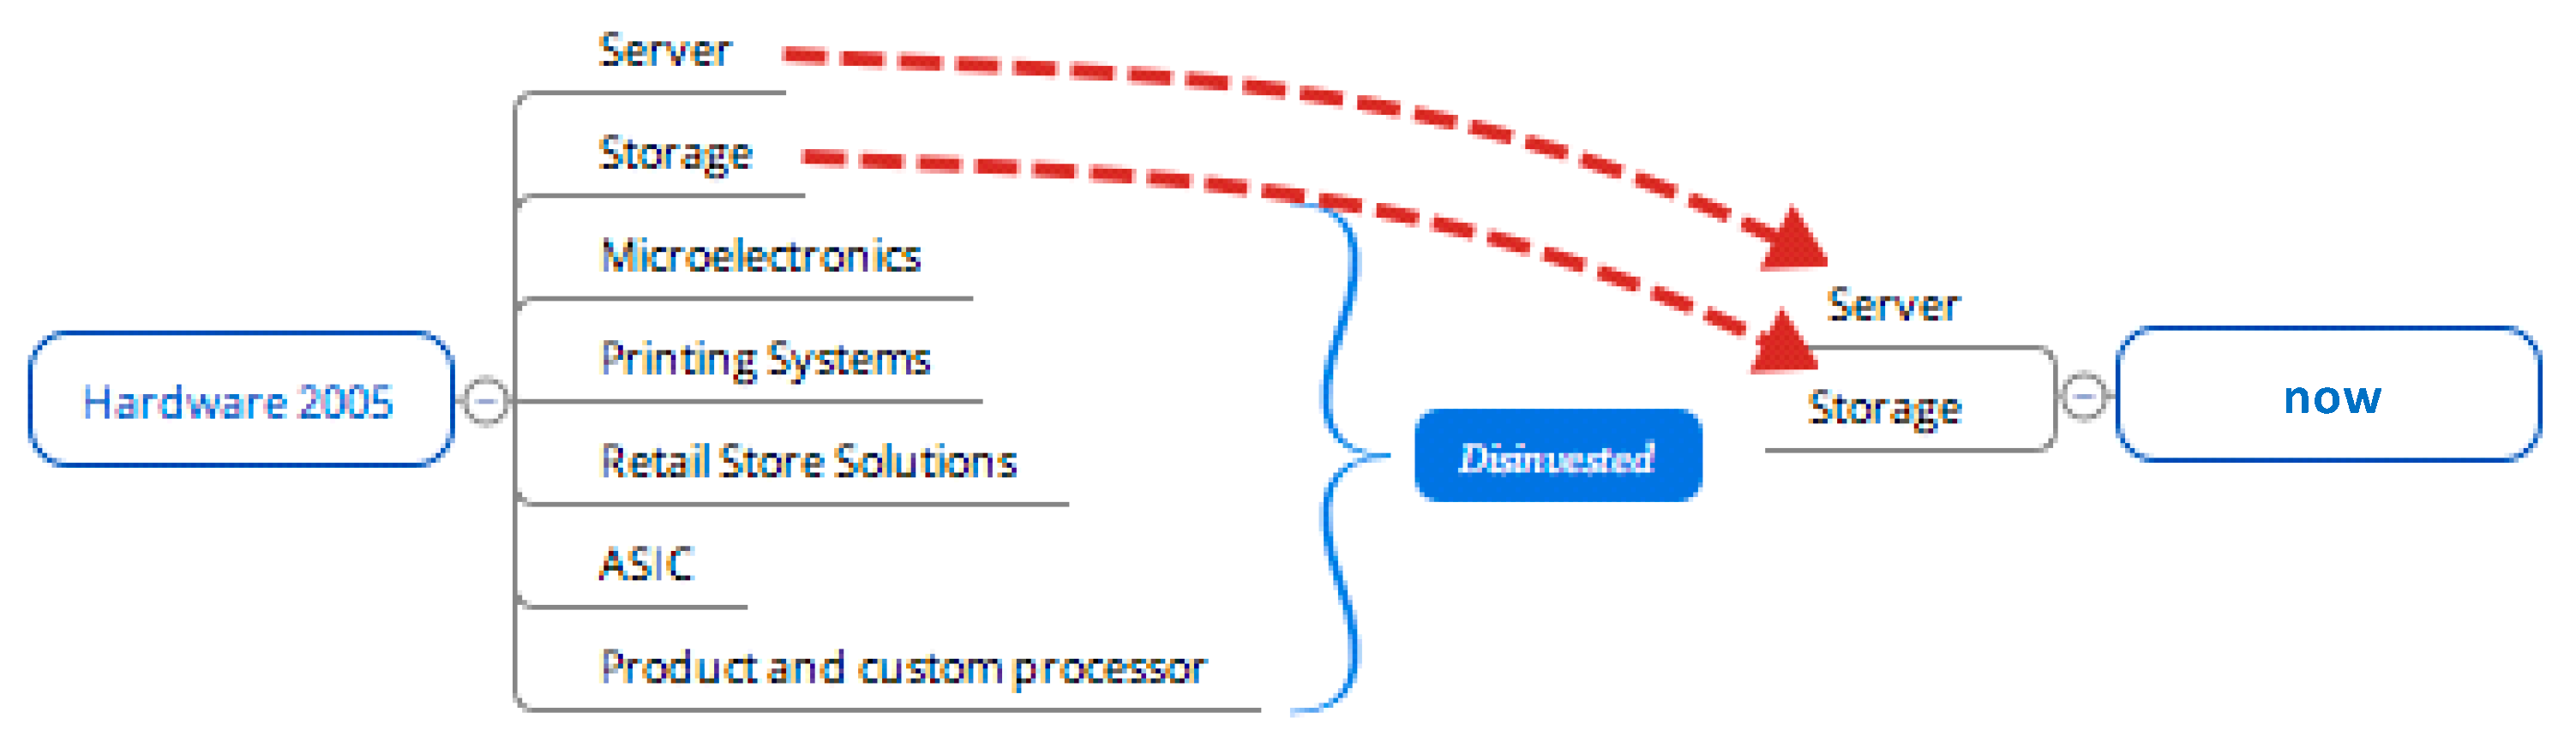
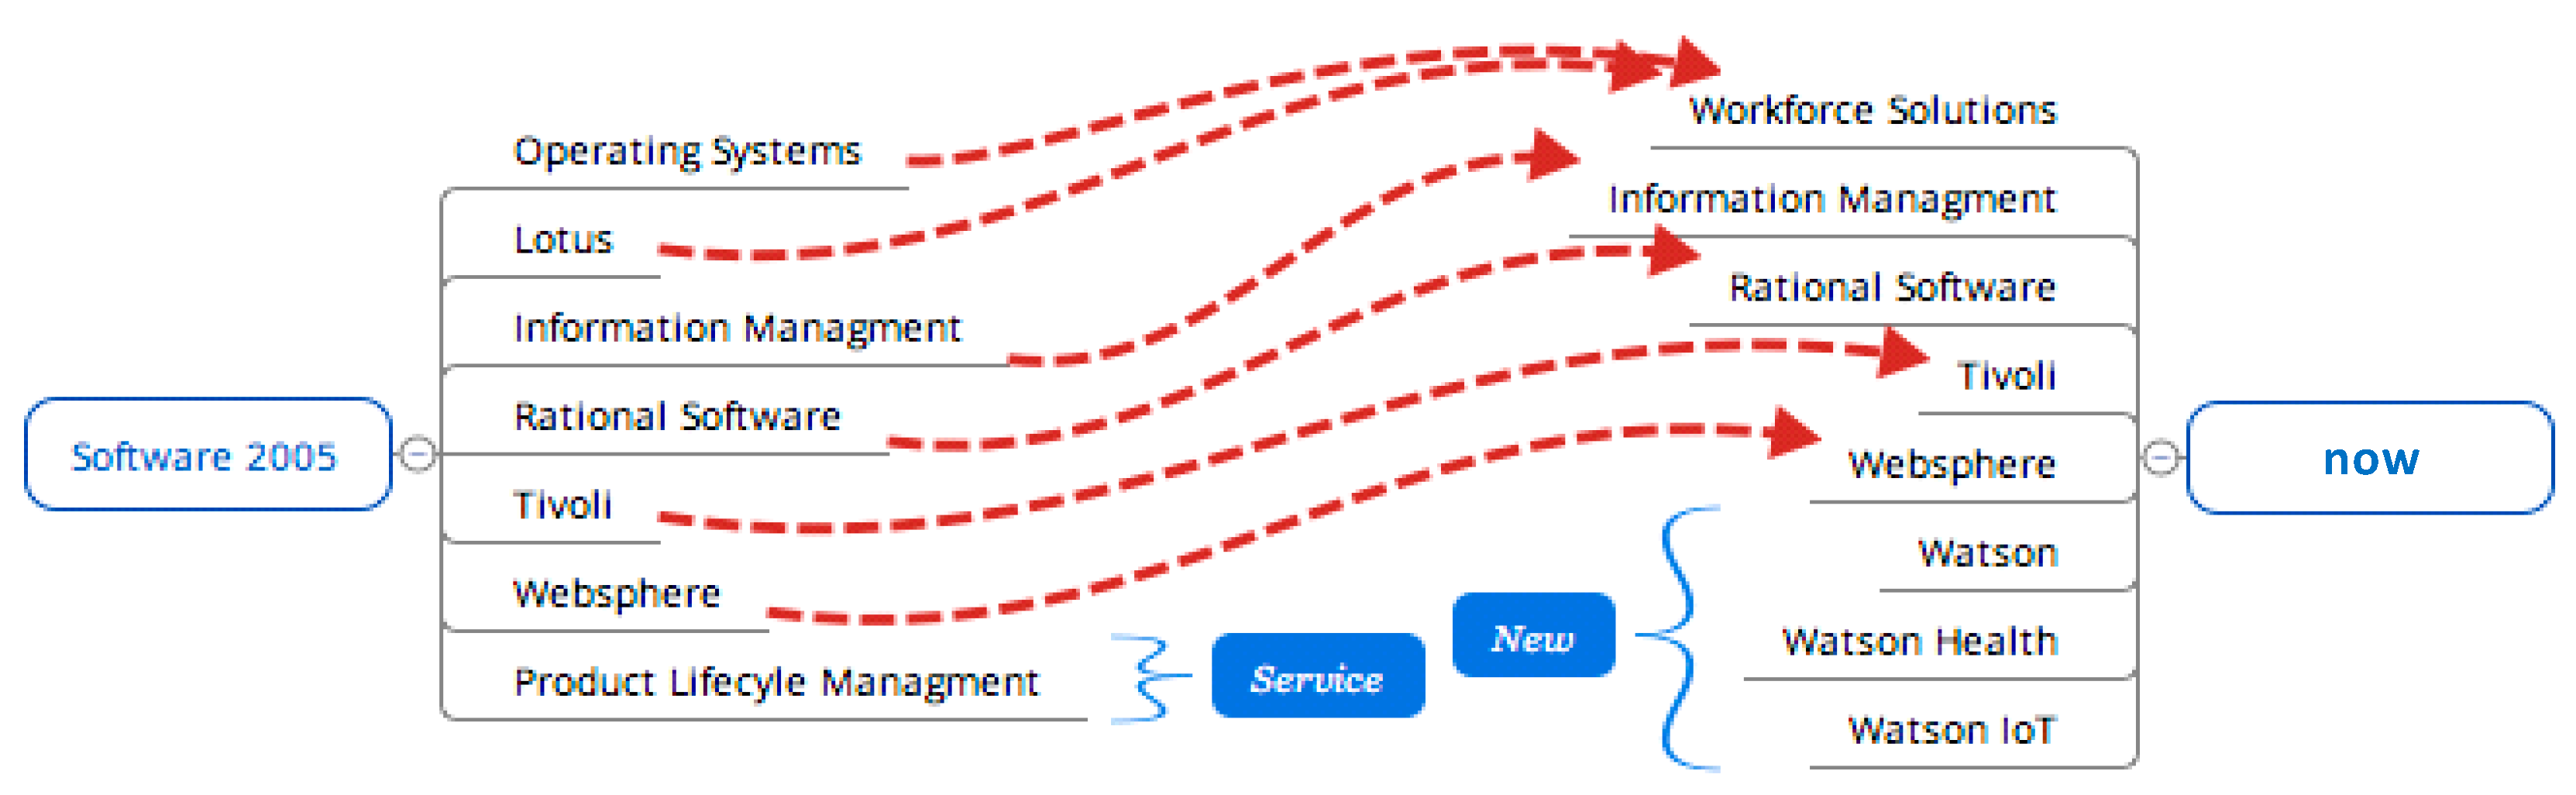
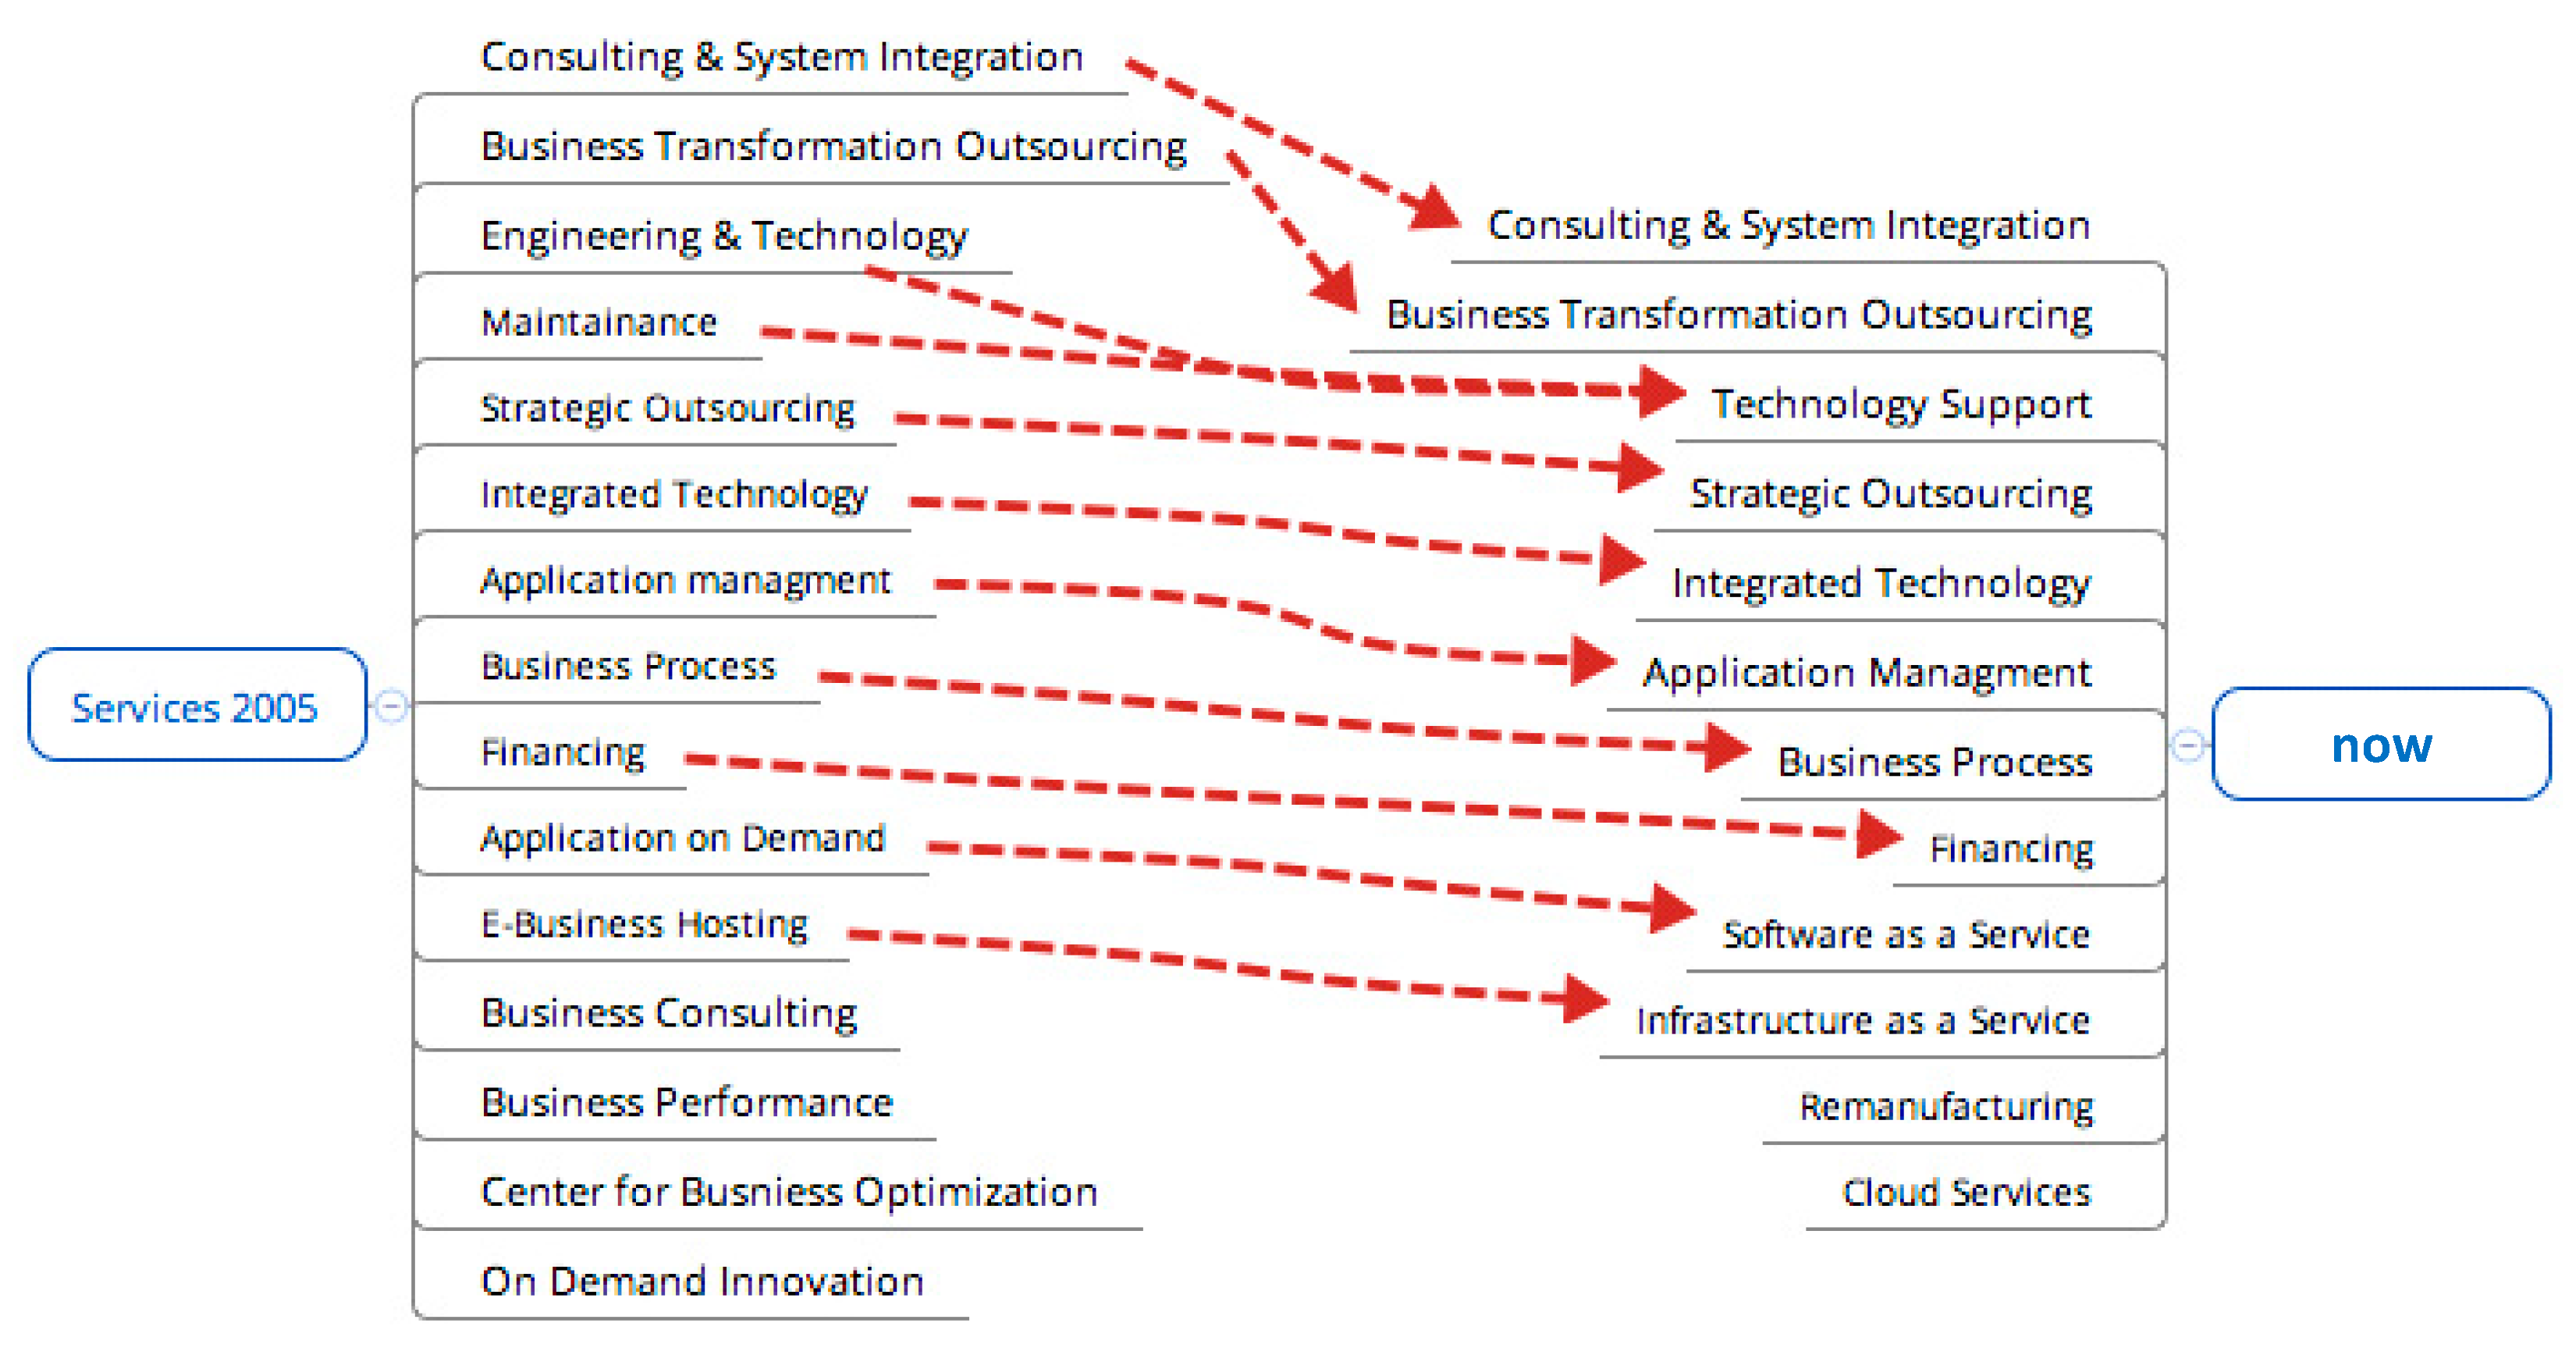
In Figure 6, Figure 7 and Figure 8 [53,54,55,56,57,58,59,60,61,62,63,64], we present the results of our analysis in three primary segments: hardware, software, and services. The analyzed time-period—a decade—showed a shift in all segments towards (IT) Products/Services.
As illustrated in Figure 6, Figure 7 and Figure 8, IBM has decreased the number of products and services they offer. Most of IBM’s hardware business was disinvested, as they did not include it in their new business model. IBM’s software offerings have increased in the last decade. In addition, today, IBM includes advanced innovations to further move towards a result-oriented PSS. Moreover, almost 50% of the software revenue that IBM earns is delivered via their cloud service or on demand. This is further evidence of a switch from selling products to selling services. Through the process of changing from offering individual services to an all-round solution package, many of the services offered over the decade have been bundled and technically integrated [53,54,55,56,57,58,59,60,61,62,63,64].
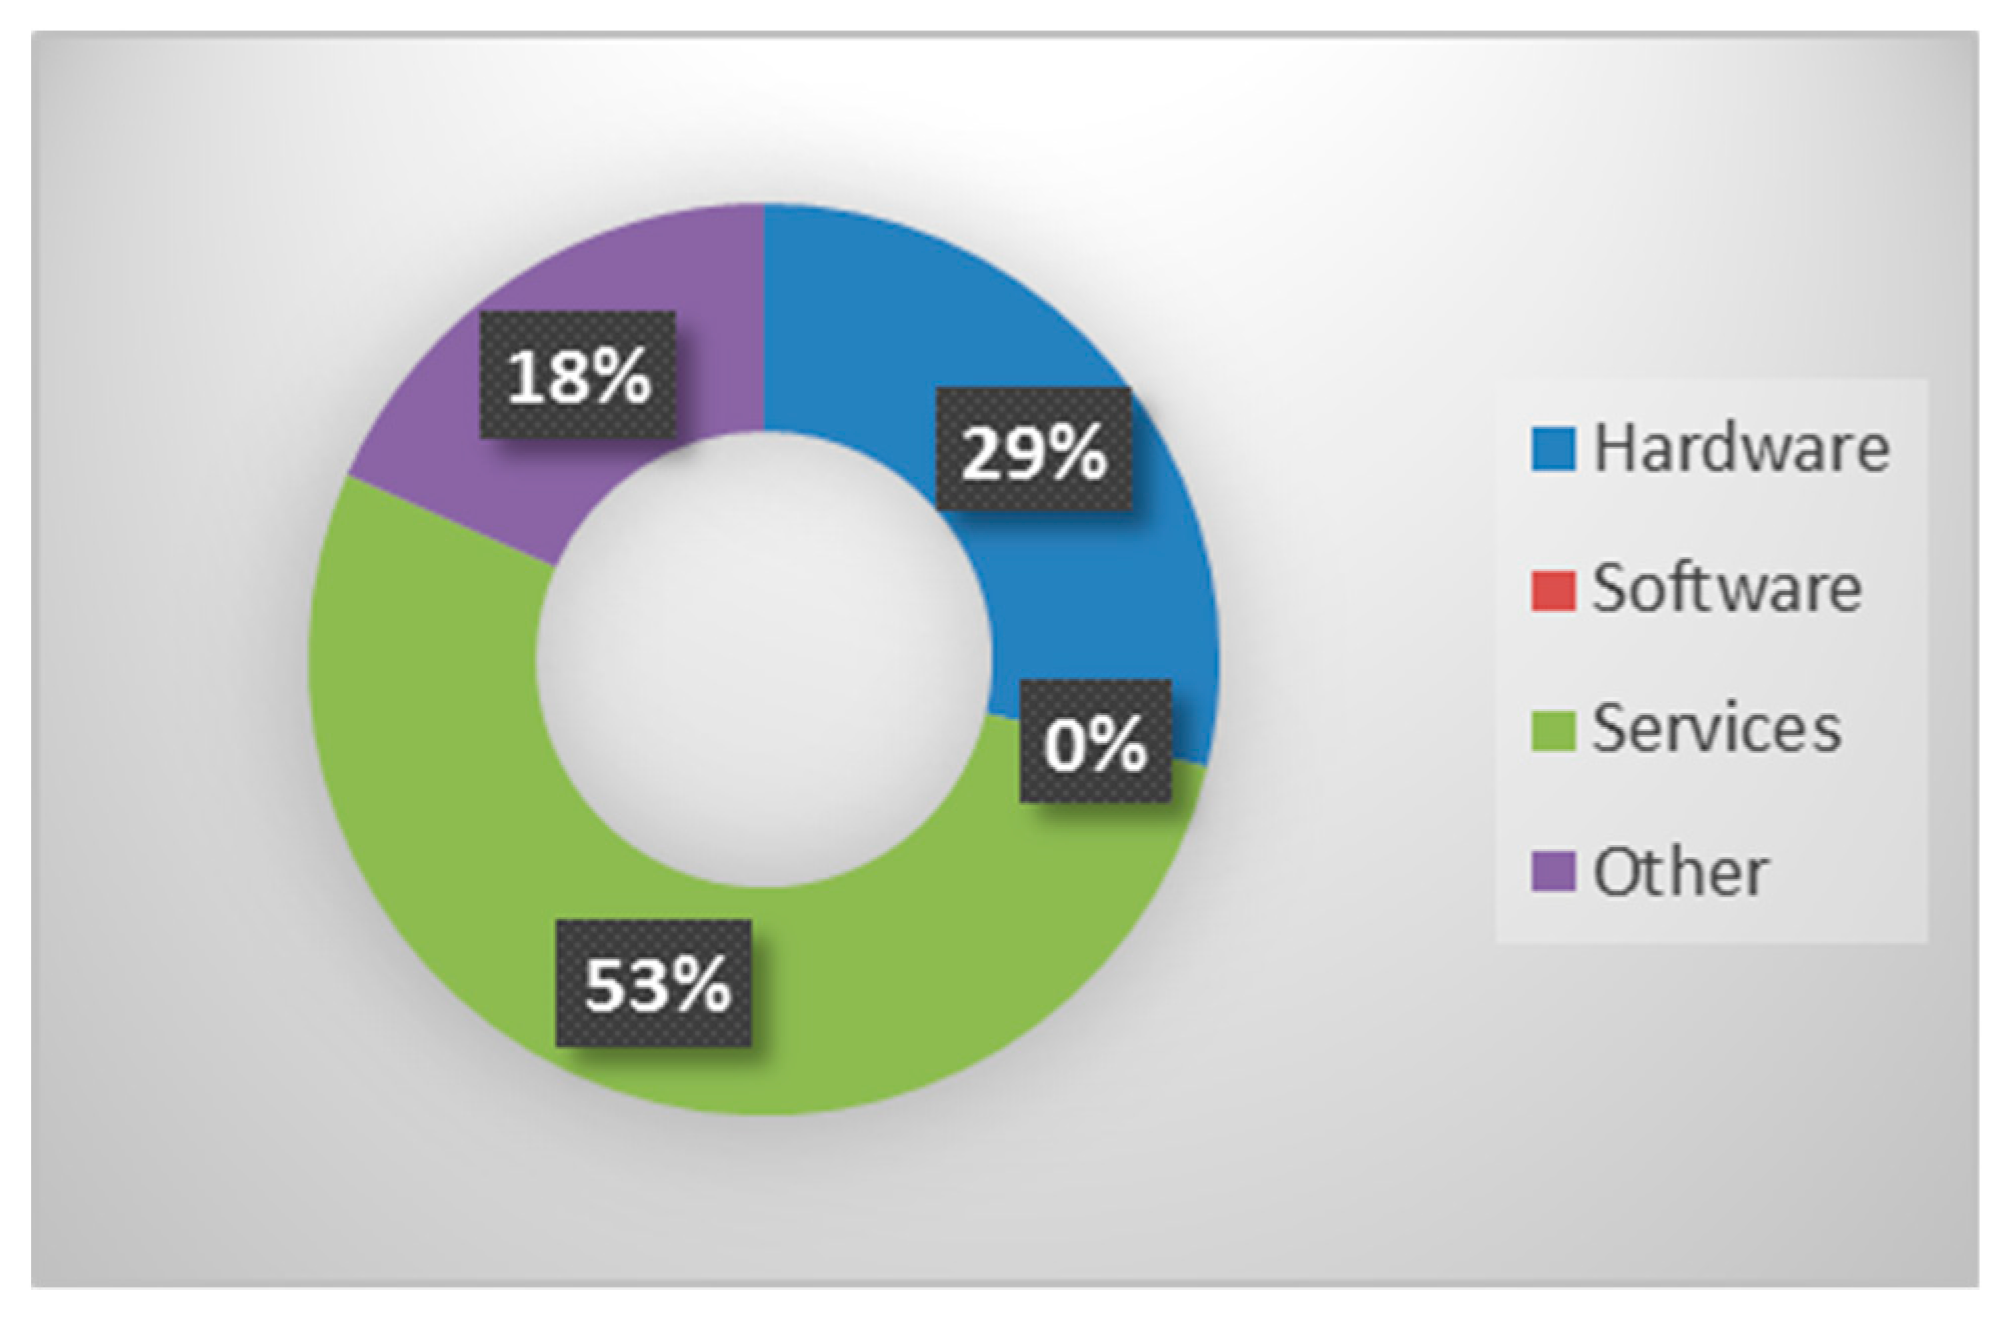
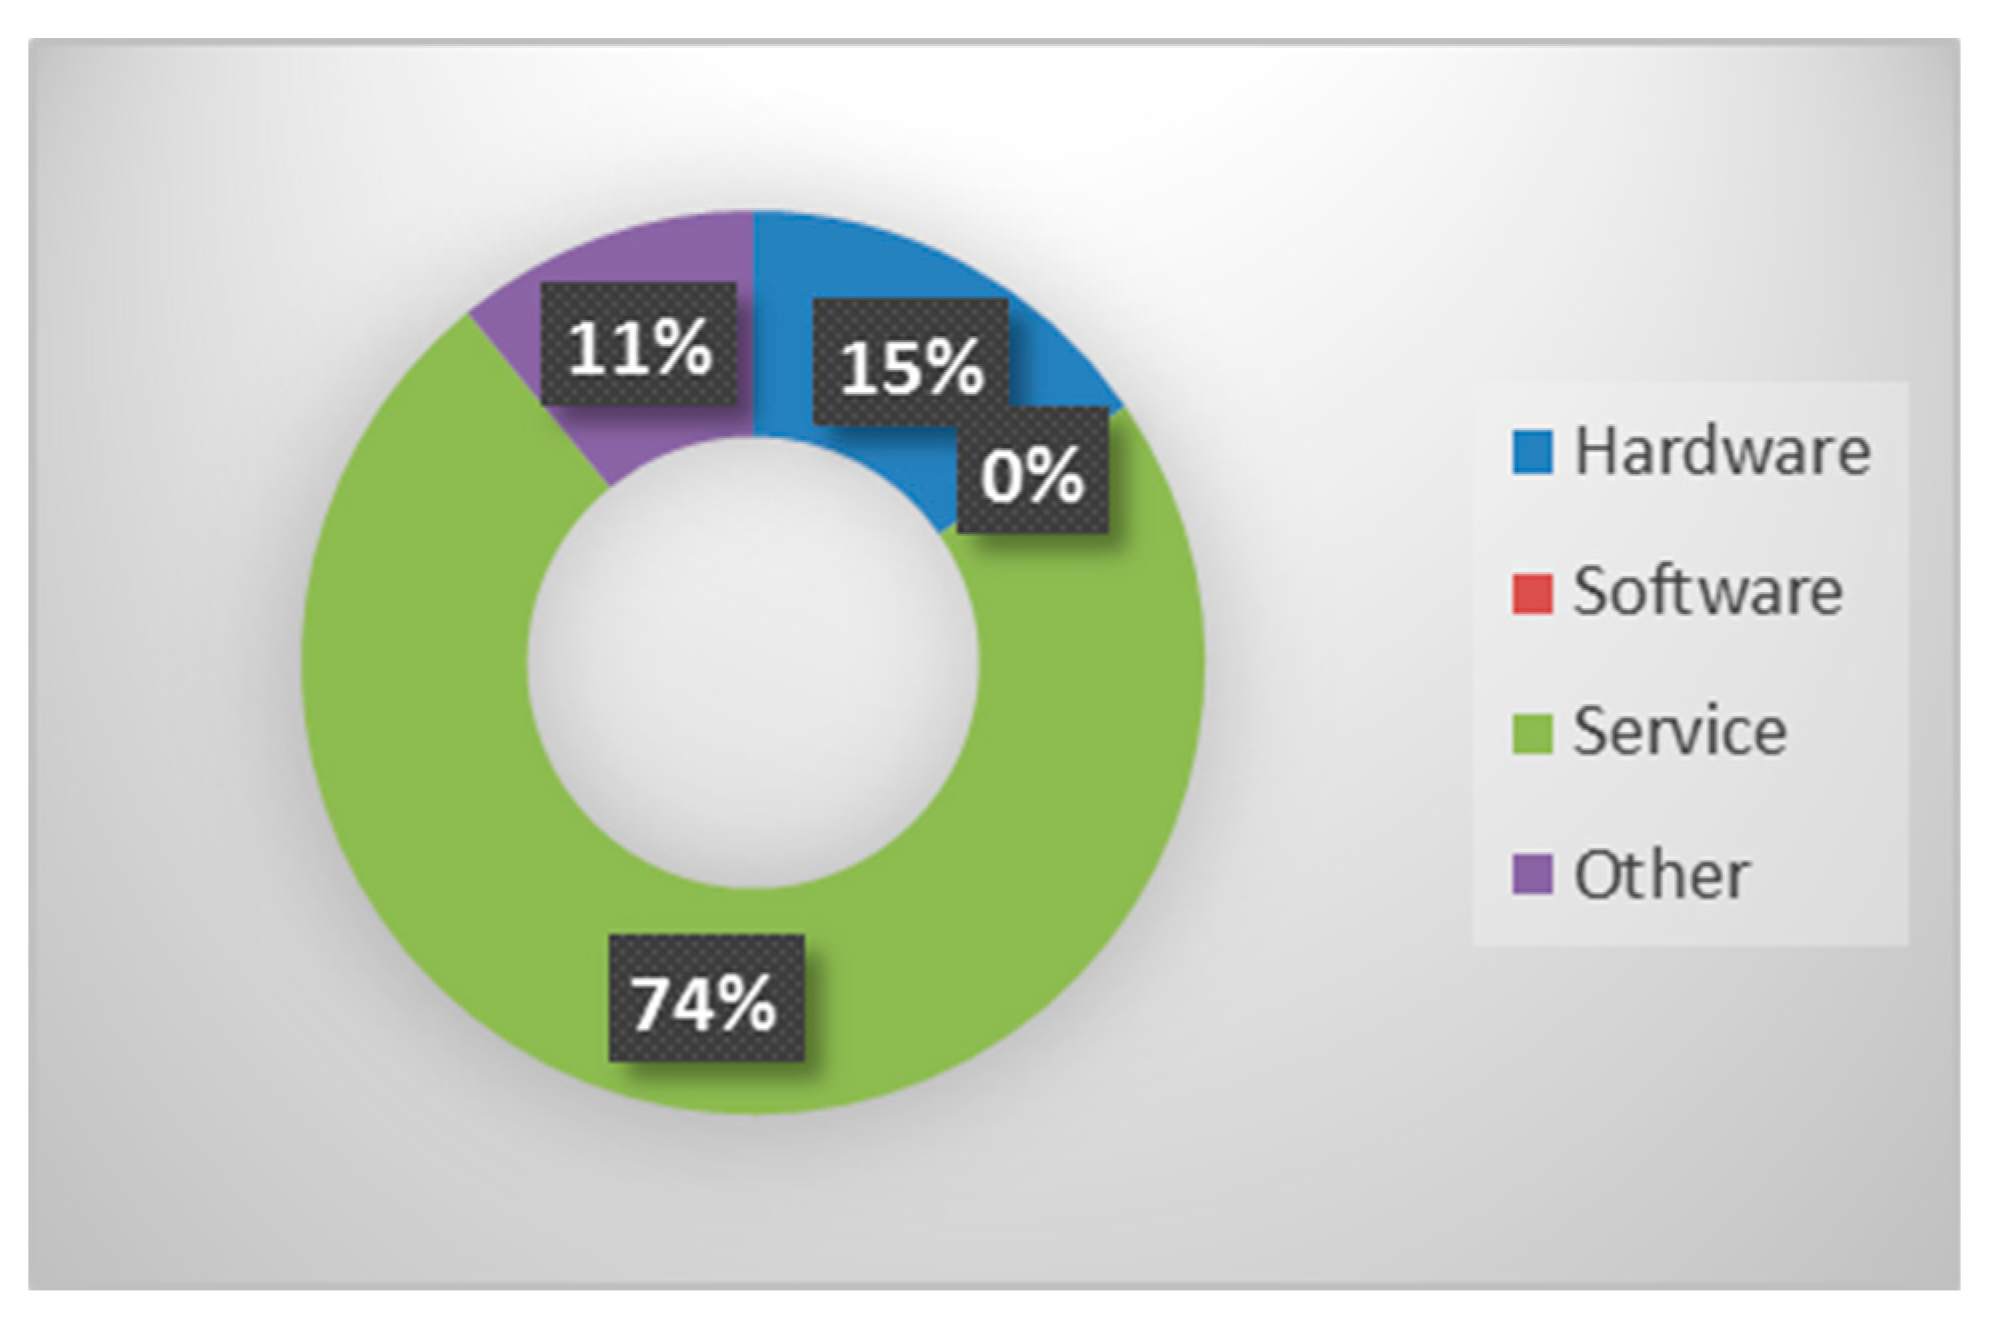
(2) Revenue Distribution
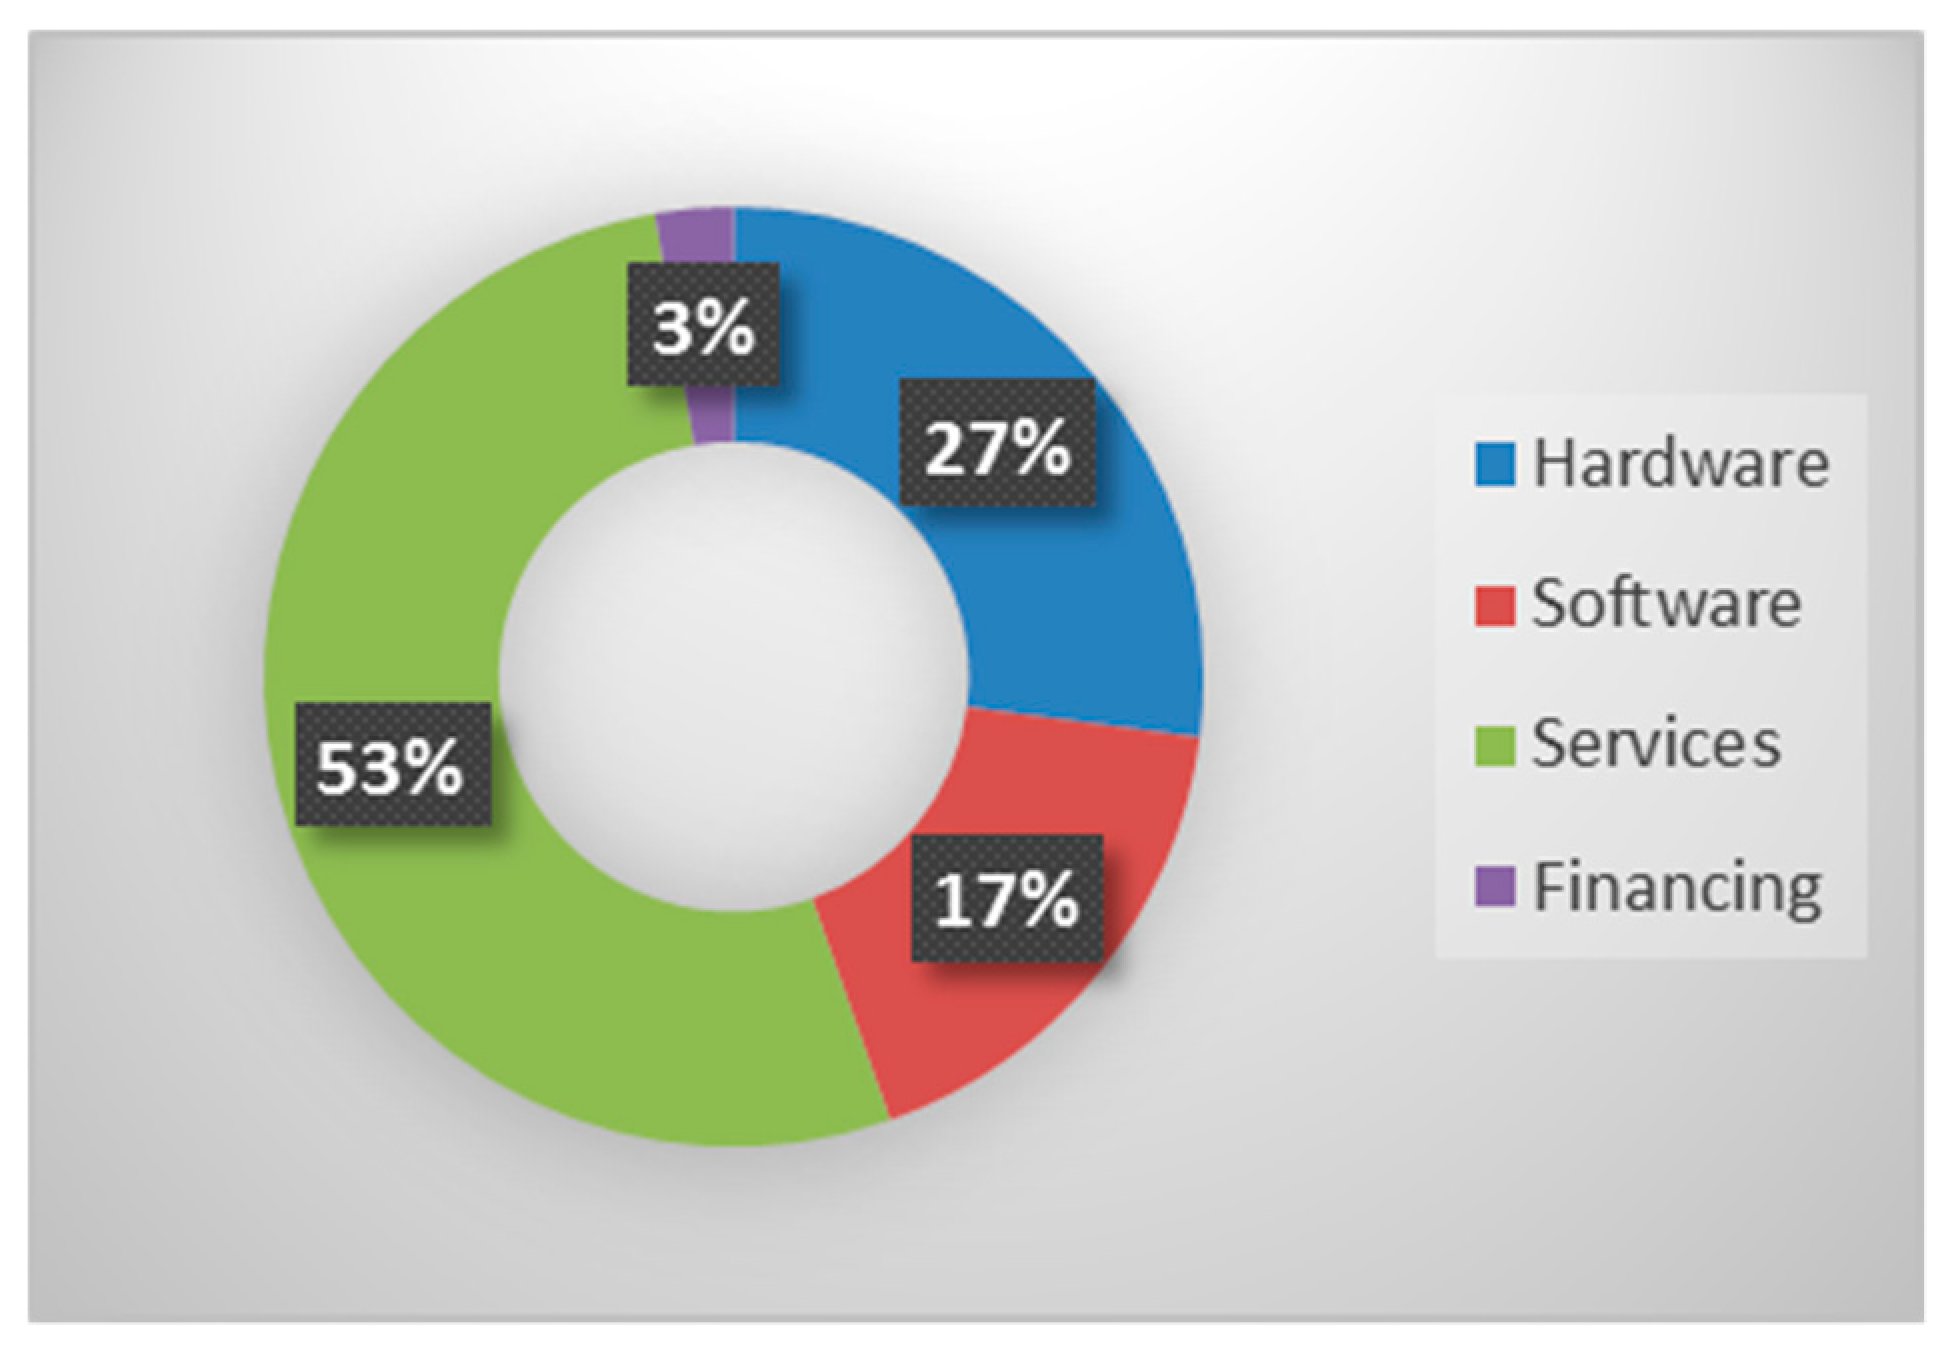
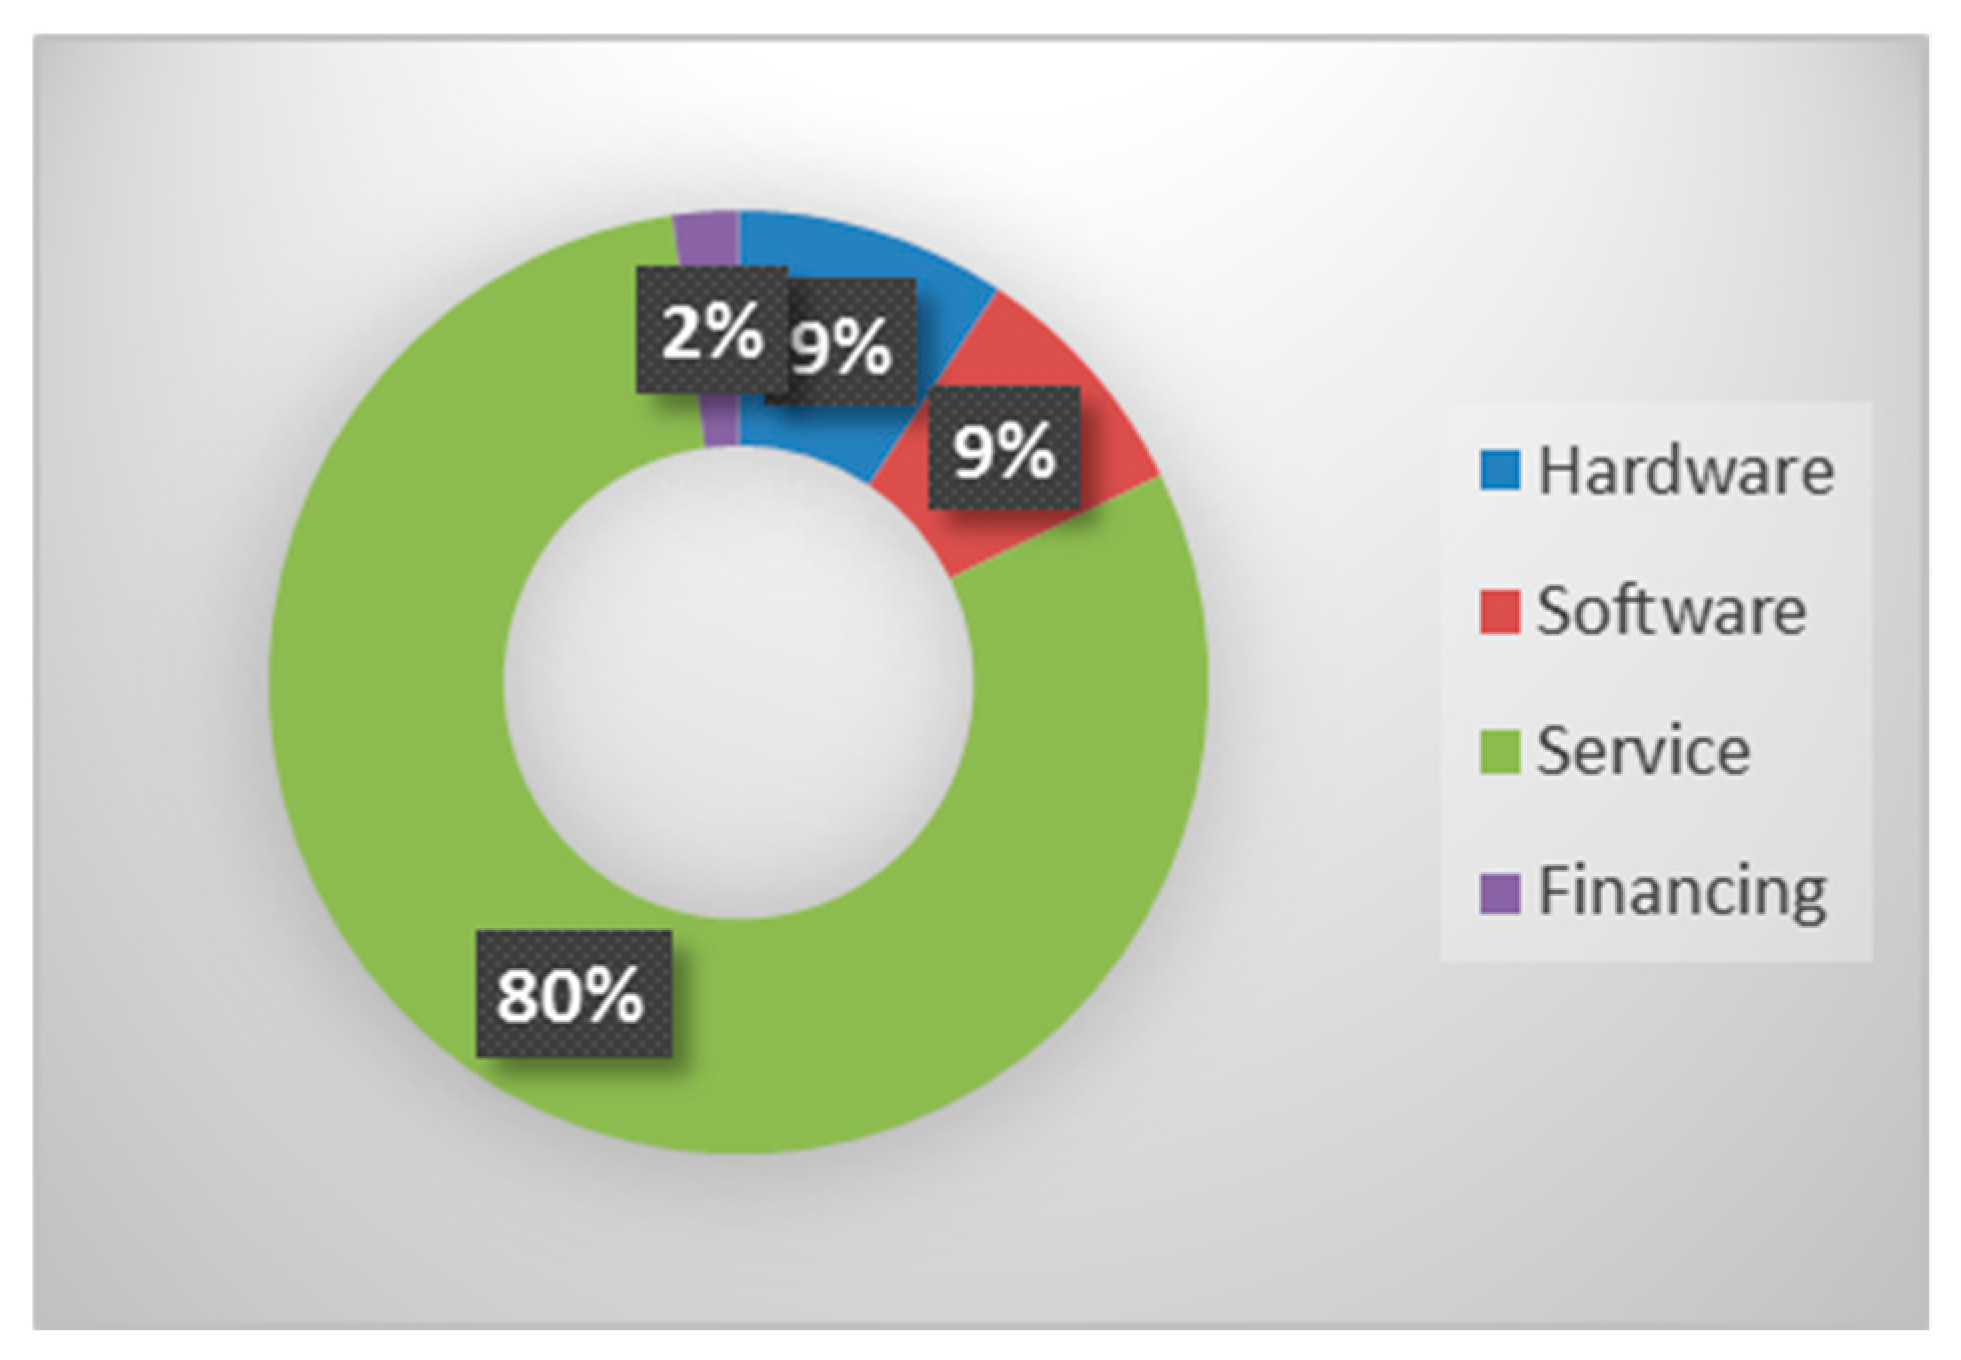
Herein, we perform an assessment of the revenue distribution by using available industrial sources (Figure 9 and Figure 10) [53,63]. The revenue comparison over the decade displays the previous importance of services for IBM in 2005, which was because IBM was one of the key leaders of the Servitization initiative in the IT sector. From 2015, IBM increased their percentage of services, although the primary services global technology and global business services have stagnated [53,54,55,56,57,58,59,60,61,62,63,64].
The explanation for such a high percentage of services being offered from 2015 onwards is an adaptation of the Cloud concept “Software-As-A-Service”, which was a pioneering project in the last decade.
(3) Transition Analysis—Challenges
The most challenging aspect for the IBM was the shift in their sales model. They had to change from long-term contracts to short-term, customized contracts with flexibility. This has been successful, as evidenced by a decrease in the duration of contracts over the 10 year period.
Another challenge was to quickly slow-down their hardware business. Their hardware business was a major factor for switching to an alternative Cloud concept “Infrastructure-as-a-Service”, because customers were spending less on hardware. This, in turn, has resulted in a huge divesture of their hardware segment, as can be observed in Figure 8, and by a 50 percent drop in the revenue.
IBM also had to rethink their acquisitions and instead focus on R&D, which was a crucial to their transition because they had invented important hardware in the past. Currently, they are investing primarily in software and services. This dynamic is represented by the expenditure allocation of R&D and in the number of patents owned in the segment.
With the introduction of the Cloud era, IBM also has had to face the challenge of how they use software or hardware. IBM has been adapting its vision and shifting its focus towards an even more result-oriented PSS. This occurred through a shift to greater service of data analytics [53,54,55,56,57,58,59,60,61,62,63,64].
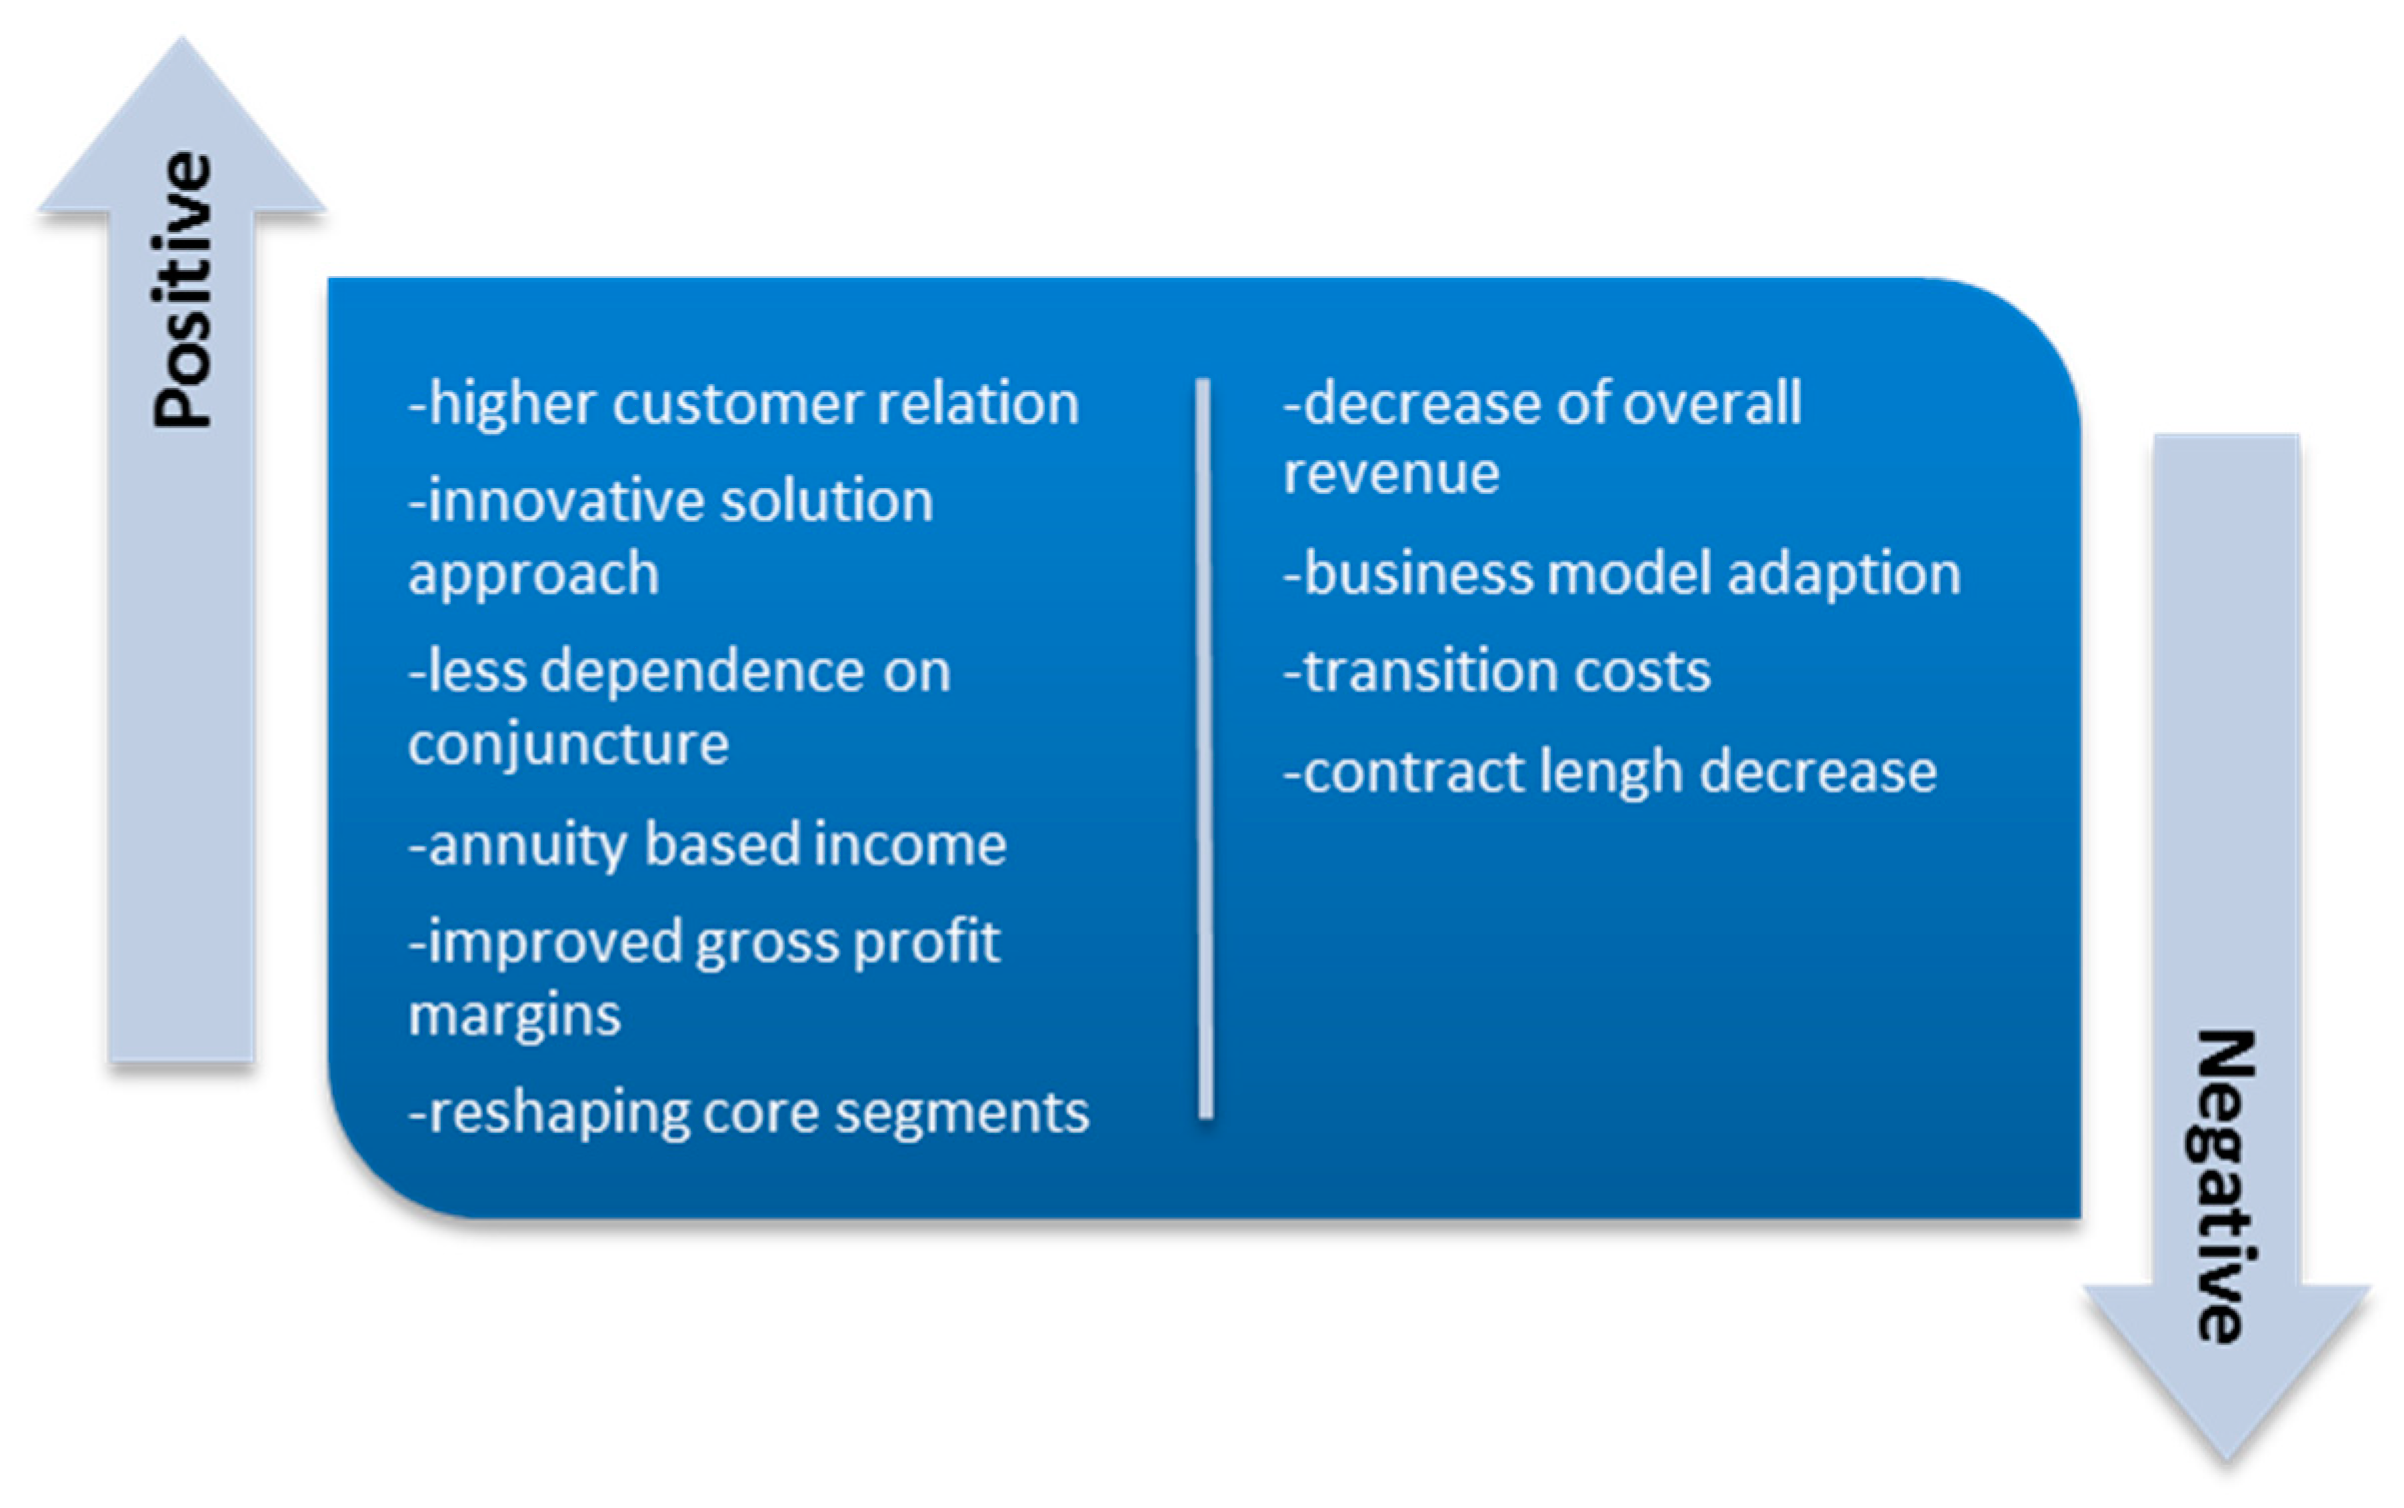
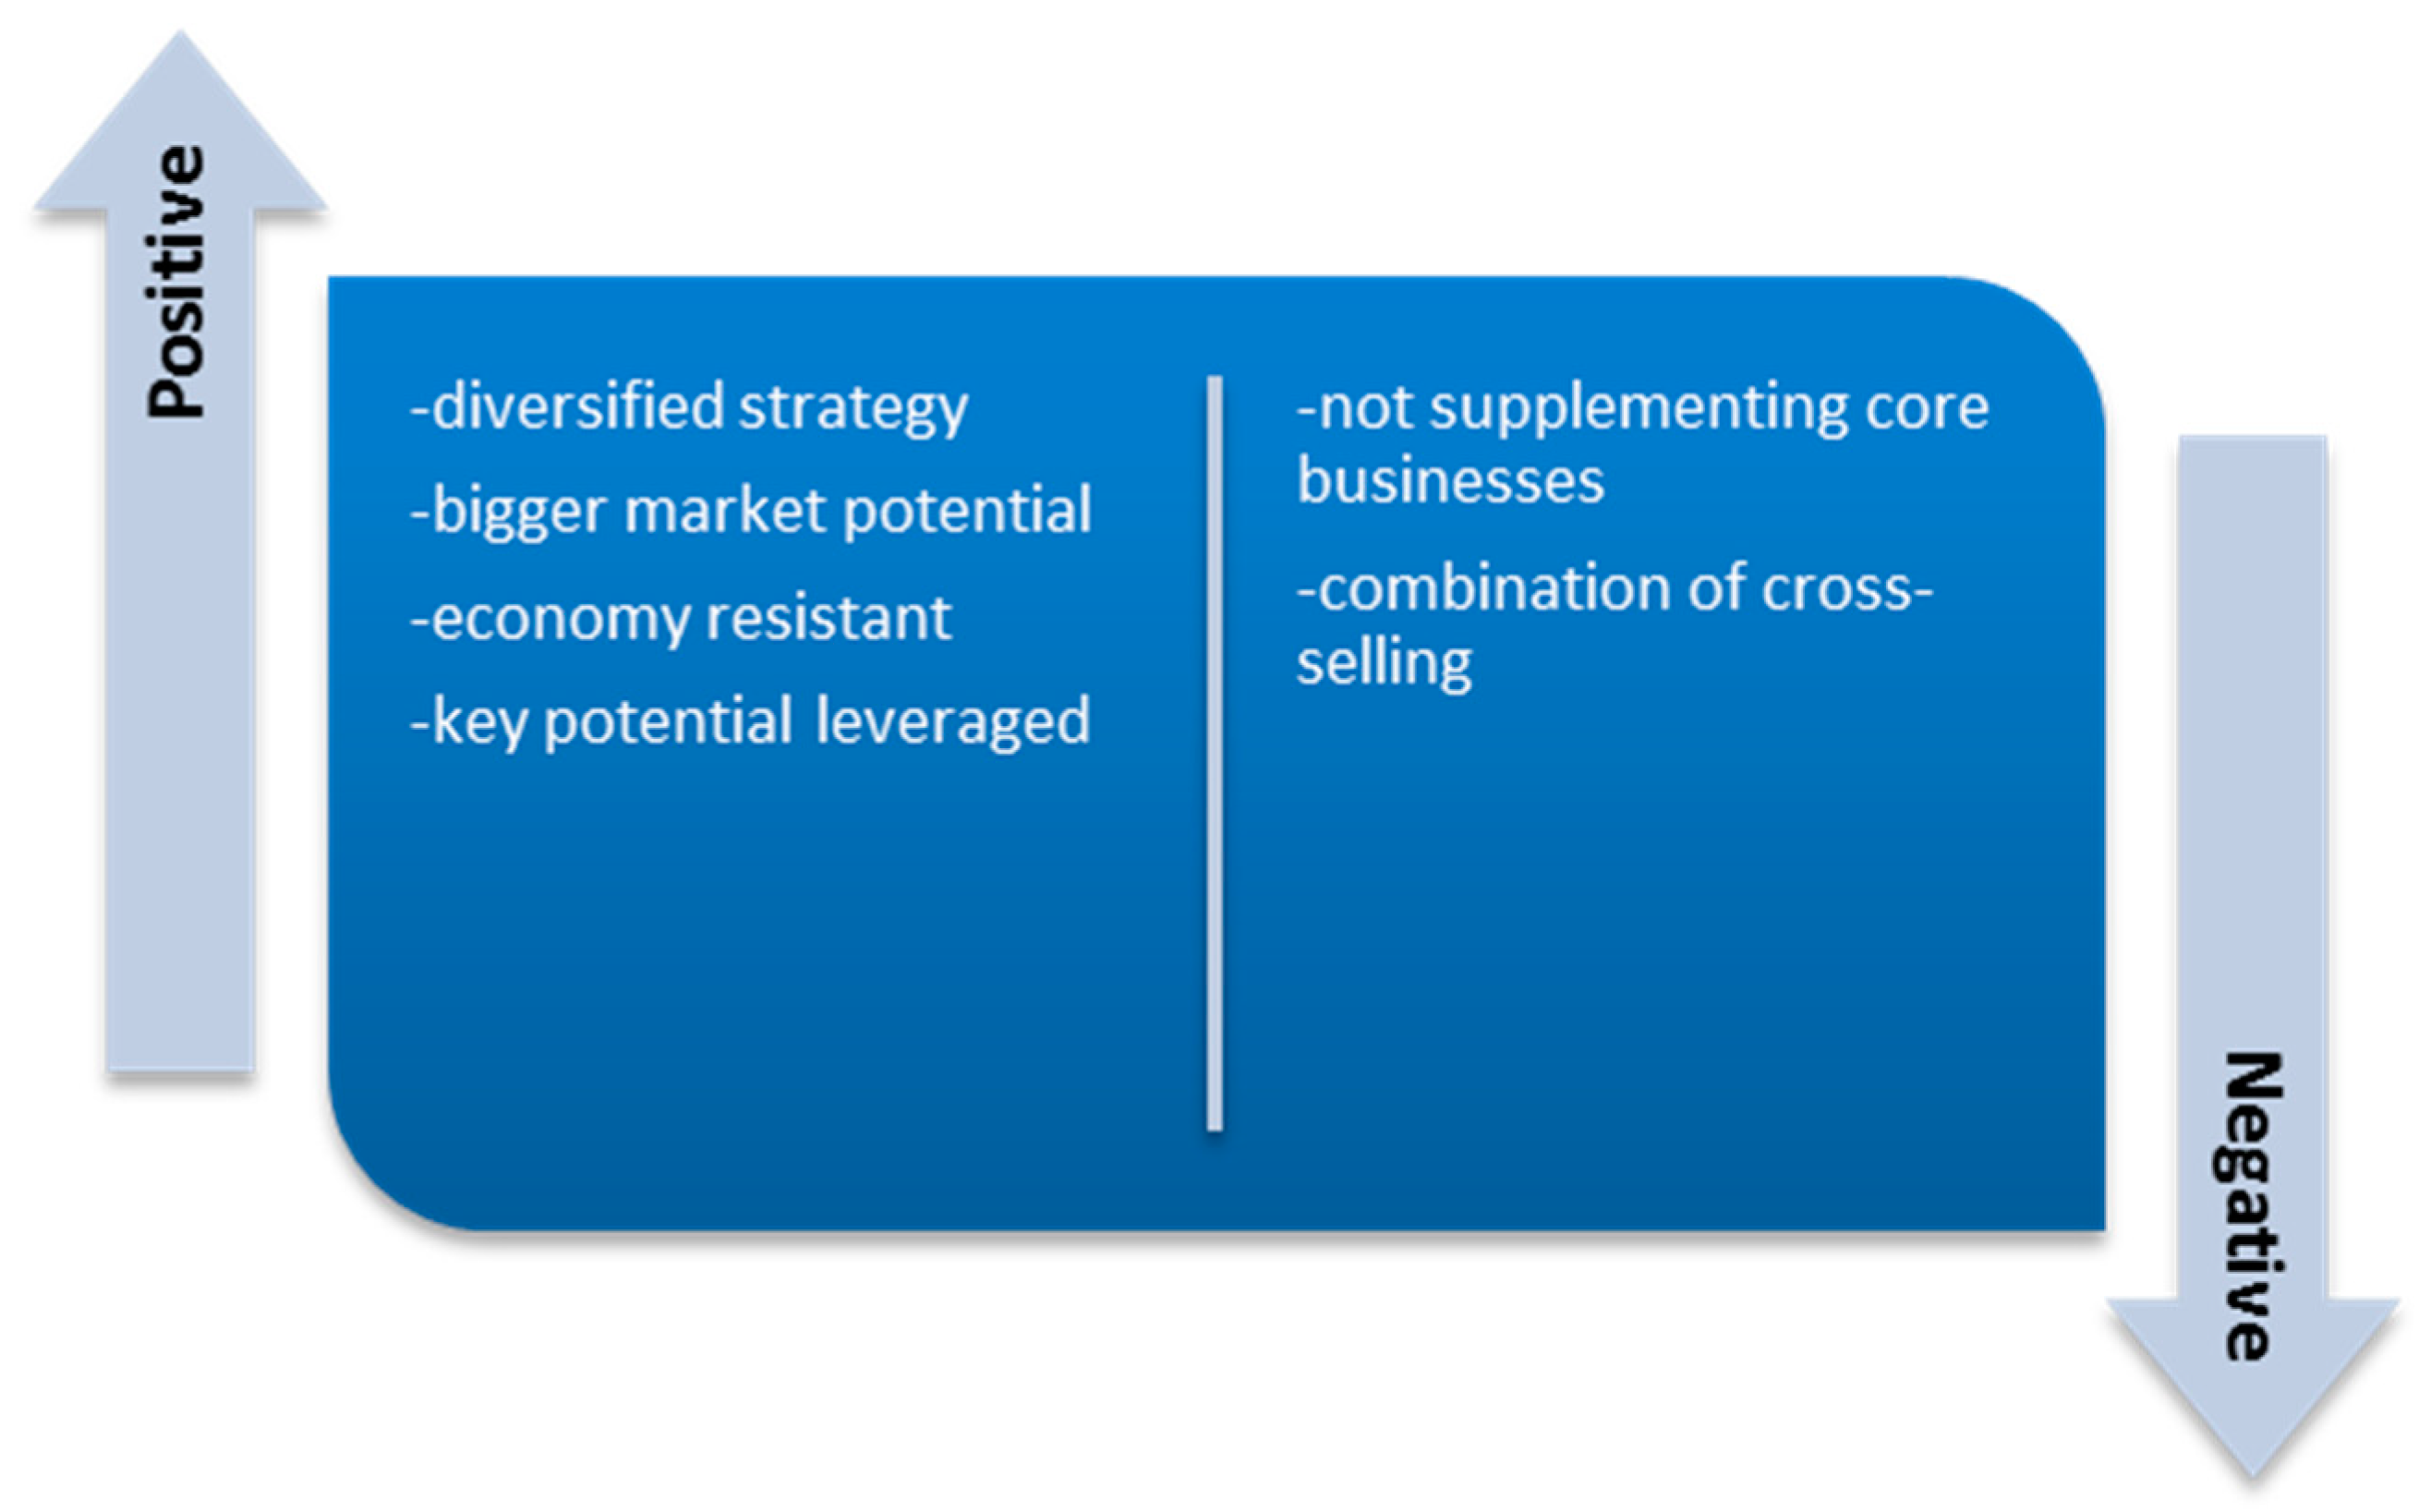
(4) Transition Analysis—Positive and Negative Effects
As with every innovative business model, there are positive and negative effects. Servitization has been affecting IBM, as shown in Figure 11, both in the way they are doing business and in how they reach their customers [53,54,55,56,57,58,59,60,61,62,63,64].
The same can be applied to other major IT players.
3.2. Microsoft Servitization Scenario
(1) Changes Assessment by Business Segment
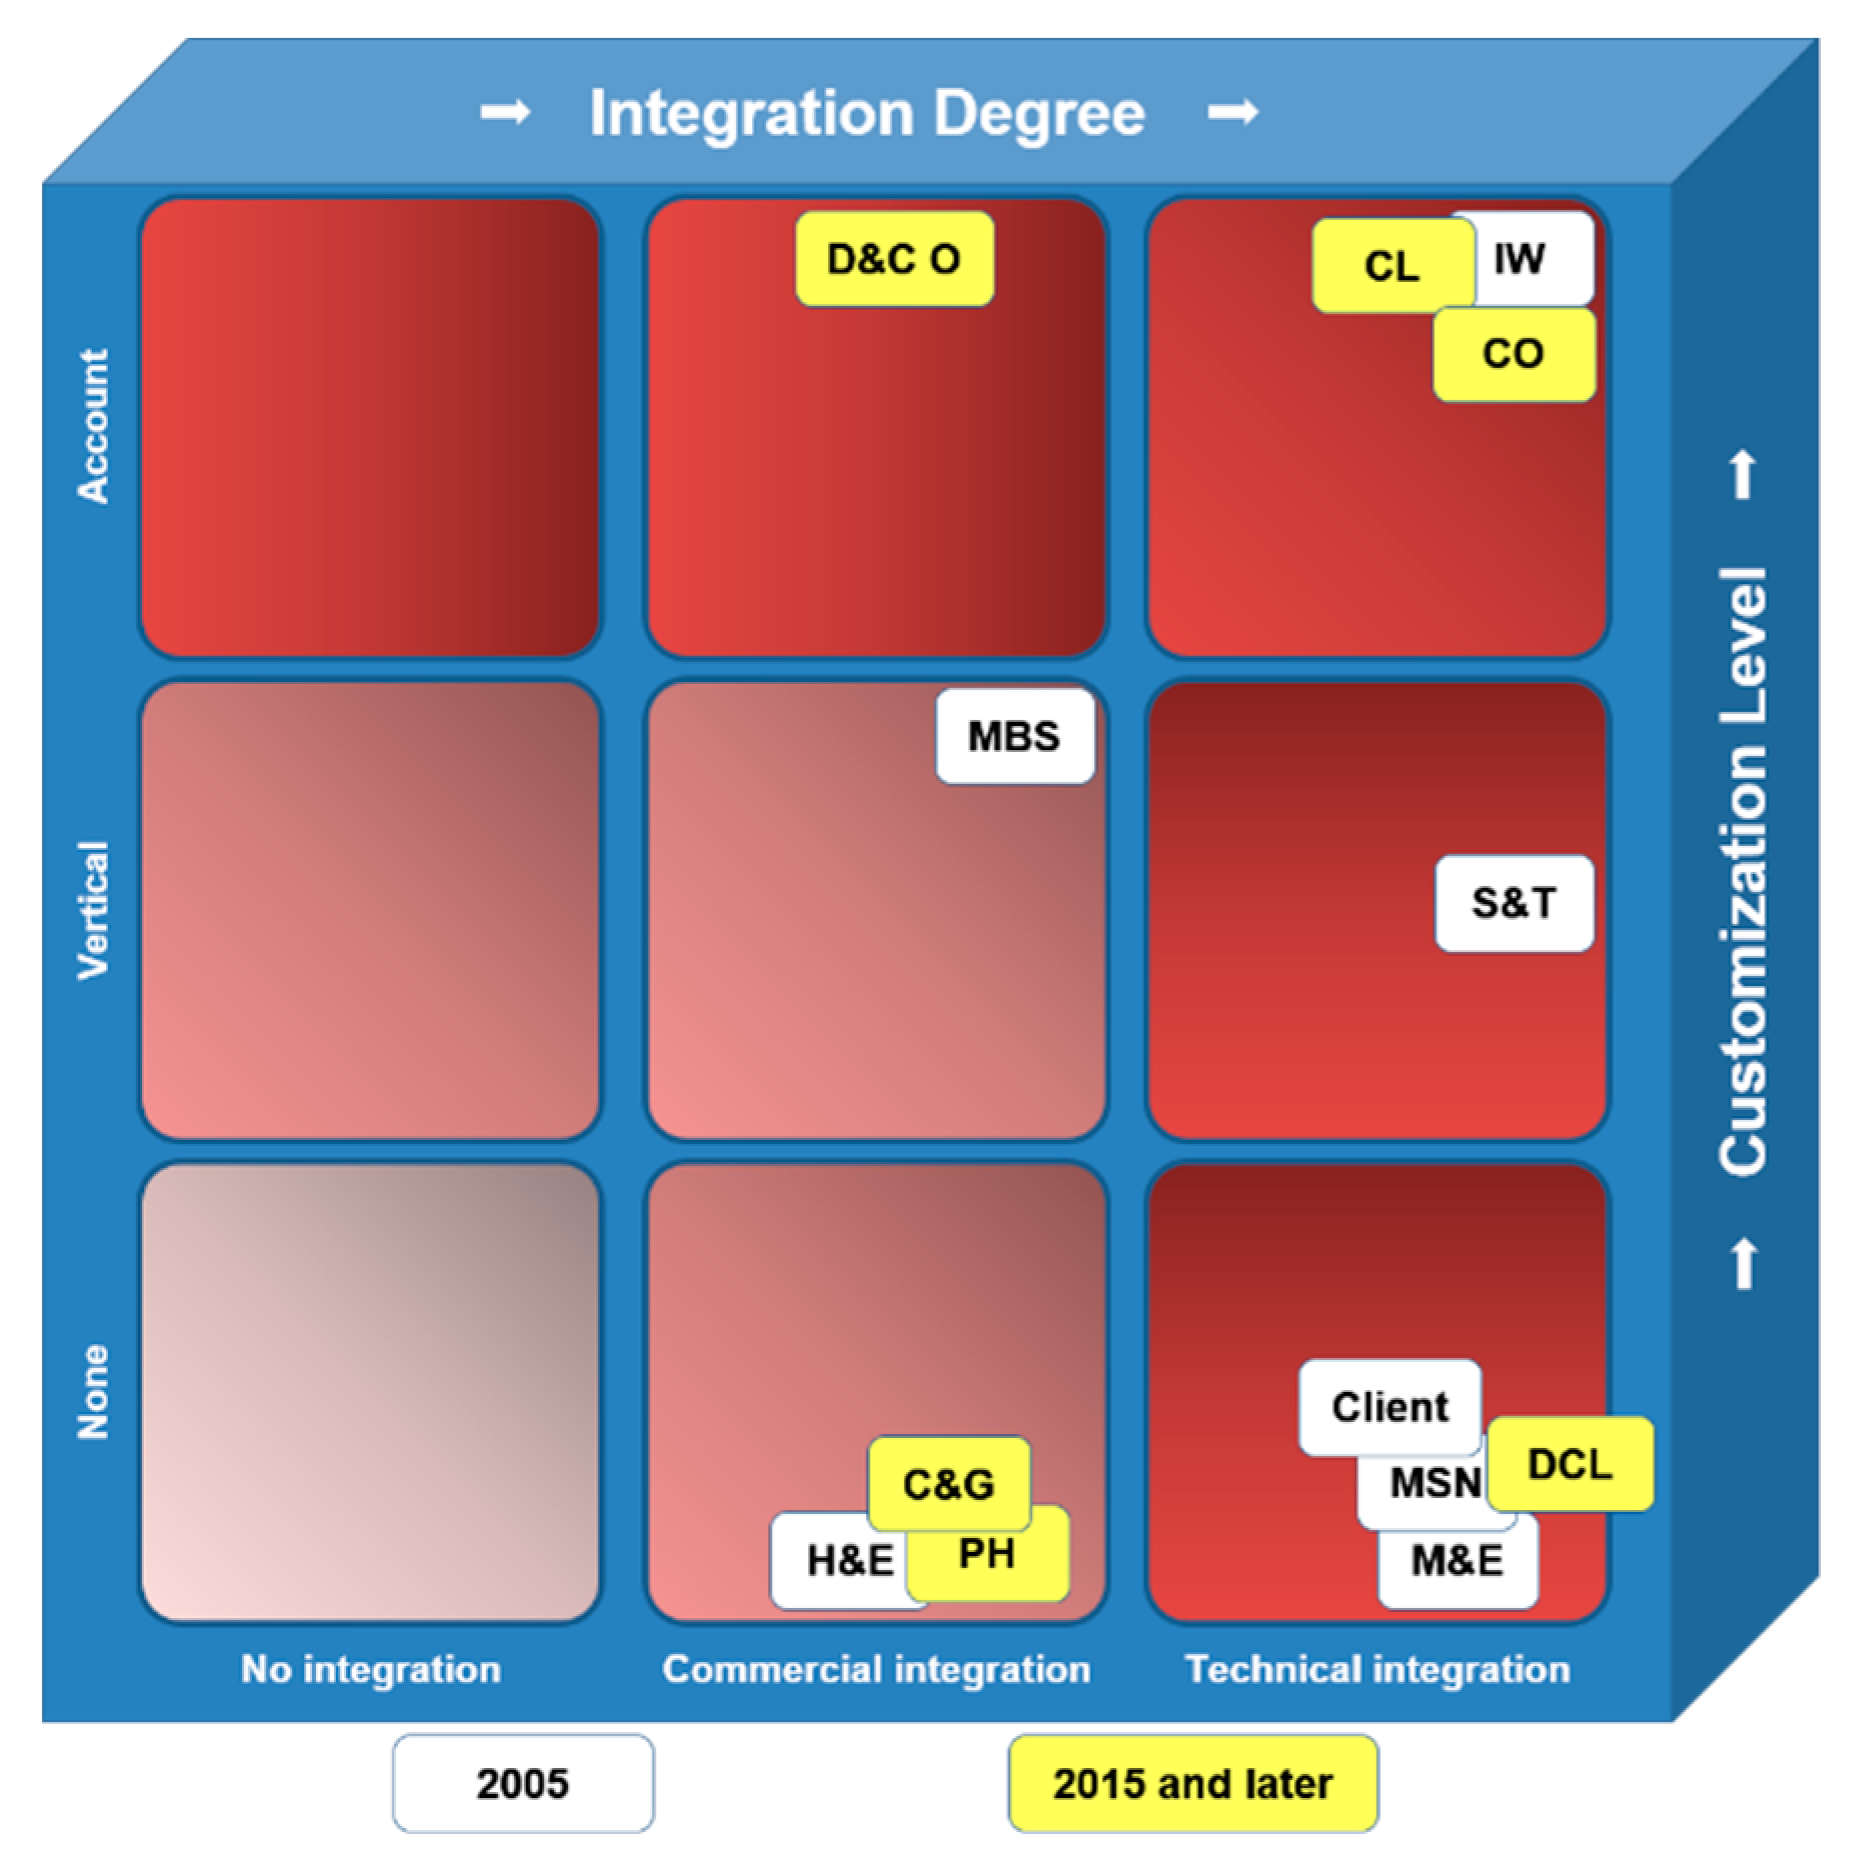
Microsoft went through a long transition from being a software provider to an all-round provider. They changed to a device and services company over the analyzed period [6]. First, they changed their business segments, and included an online service. In 2009, Microsoft added several segments related to the growing importance of cloud-based software and services. In 2014, they finally moved all of their business segments towards the categorization that is currently in use. This includes the device and the consumer segments that cover all experiences a customer can have. Moreover, there are commercial segments whose focus is on delivering enterprise solutions and analyzing future trends [65,66,67,68,69,70,71,72,73,74,75,76].
We present the results of the Microsoft change analysis in Figure 12. Several terms used on the figure are as follows: Computing and Gaming (V&G), Commercial Licensing (CL), Commercial Other (CO), Devices and Consumer Other (D&CO), Devices and Consumer Licensing (DCL), Home and Entertainment (H&E), Information Worker (IW), Mobile and Embedded Devices (M&ED), Microsoft Business Solutions (MBS), Microsoft Network (MSN), Phone Hardware (PH), Systems and Technology (S&T) [39,65,66,67,68,69,70,71,72,73,74,75,76].
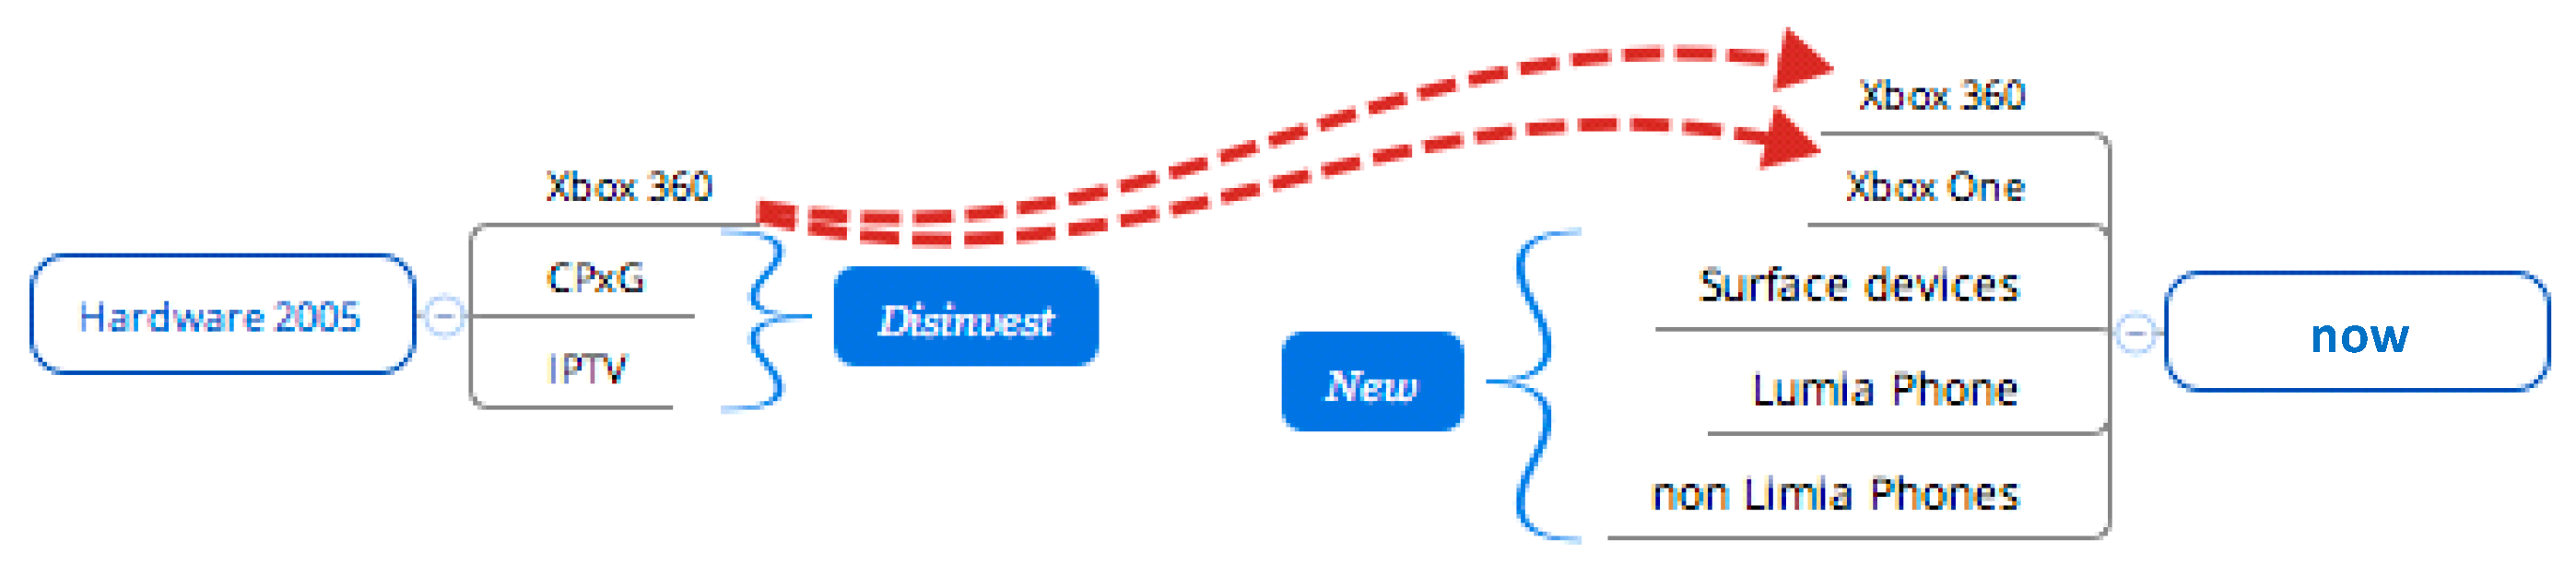
Microsoft started primarily as a software and service company, with a small hardware segment. In the last decade, they have offered experiences with devices such as “Surface” or smartphones (Figure 13, Figure 14 and Figure 15) [65,66,67,68,69,70,71,72,73,74,75,76].
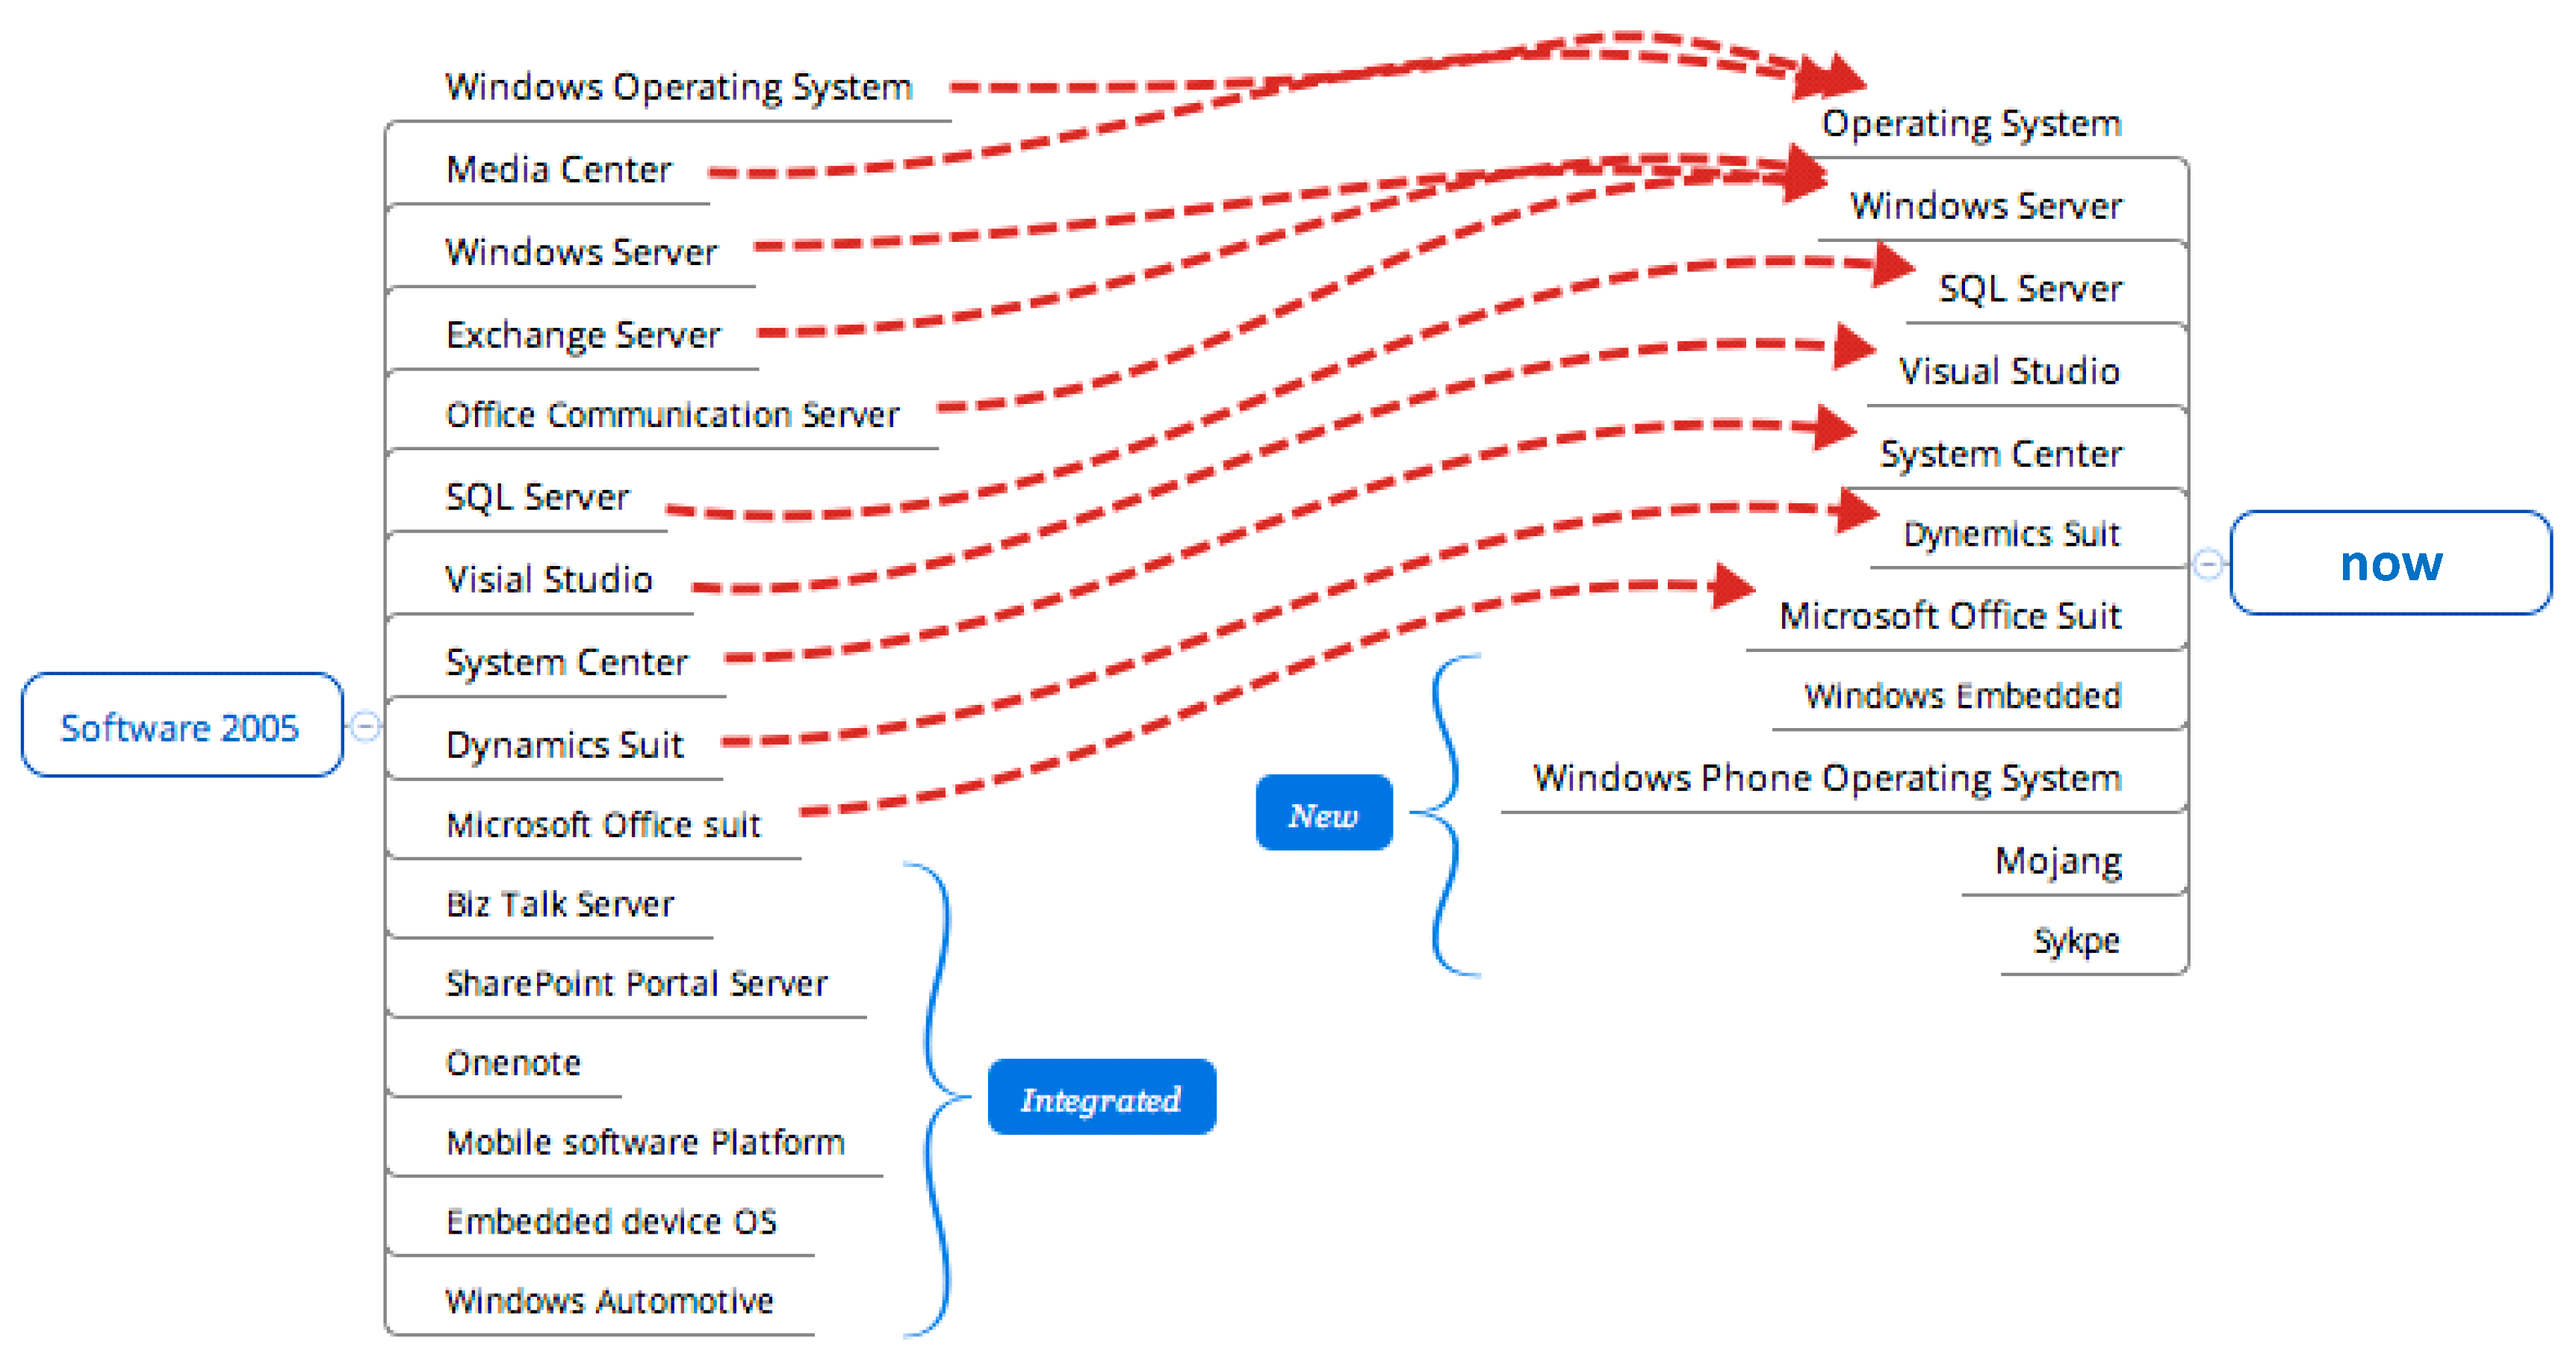
Software products went through a transformation. As old software was updated and improved, new software solutions were added to increase value to enterprises or customers. This has resulted in an acquisition of the game creator Mojang, which is also the focus of the future of virtual reality at Microsoft, and Skype, which is used for enterprise communications.
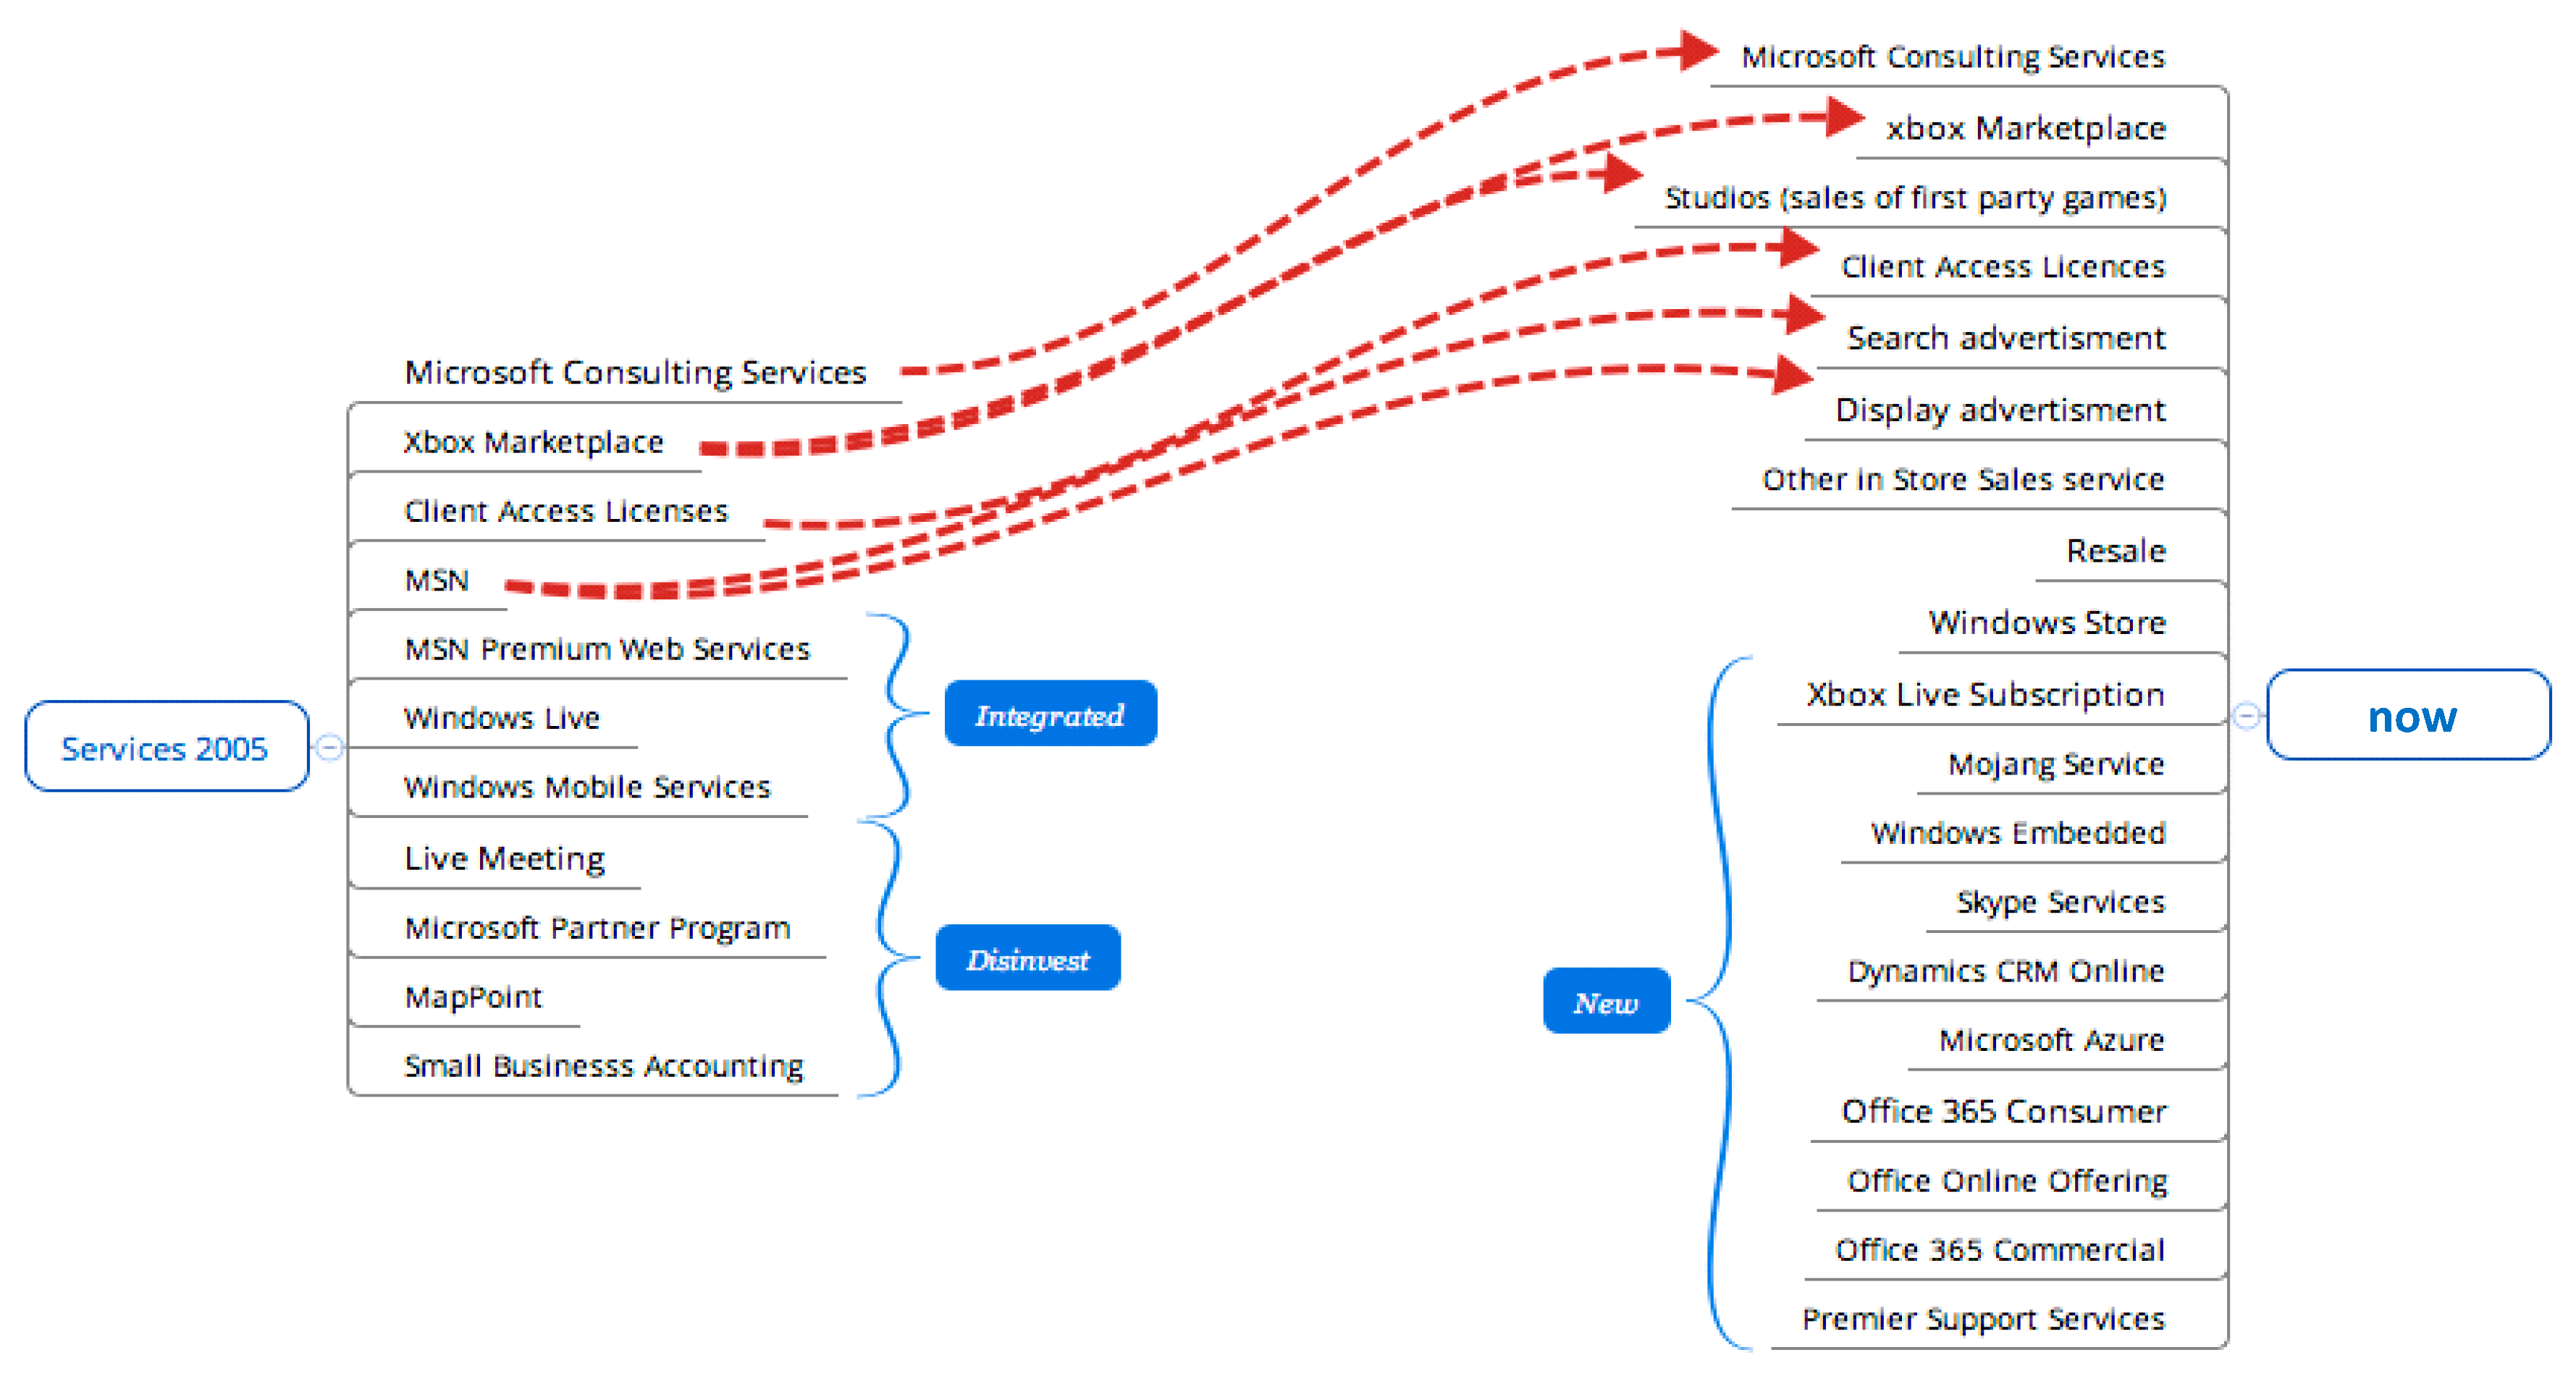
In the last decade, 10 new services were added to the future smart devices in line with the trend towards cloud-based interaction. Microsoft changed their subscription-based services and changed from a product-oriented PSS to more user-oriented PSS. Additionally, they attempt to implement a service model that is usable on all devices and has the same natural interface.
(2) Revenue Distribution
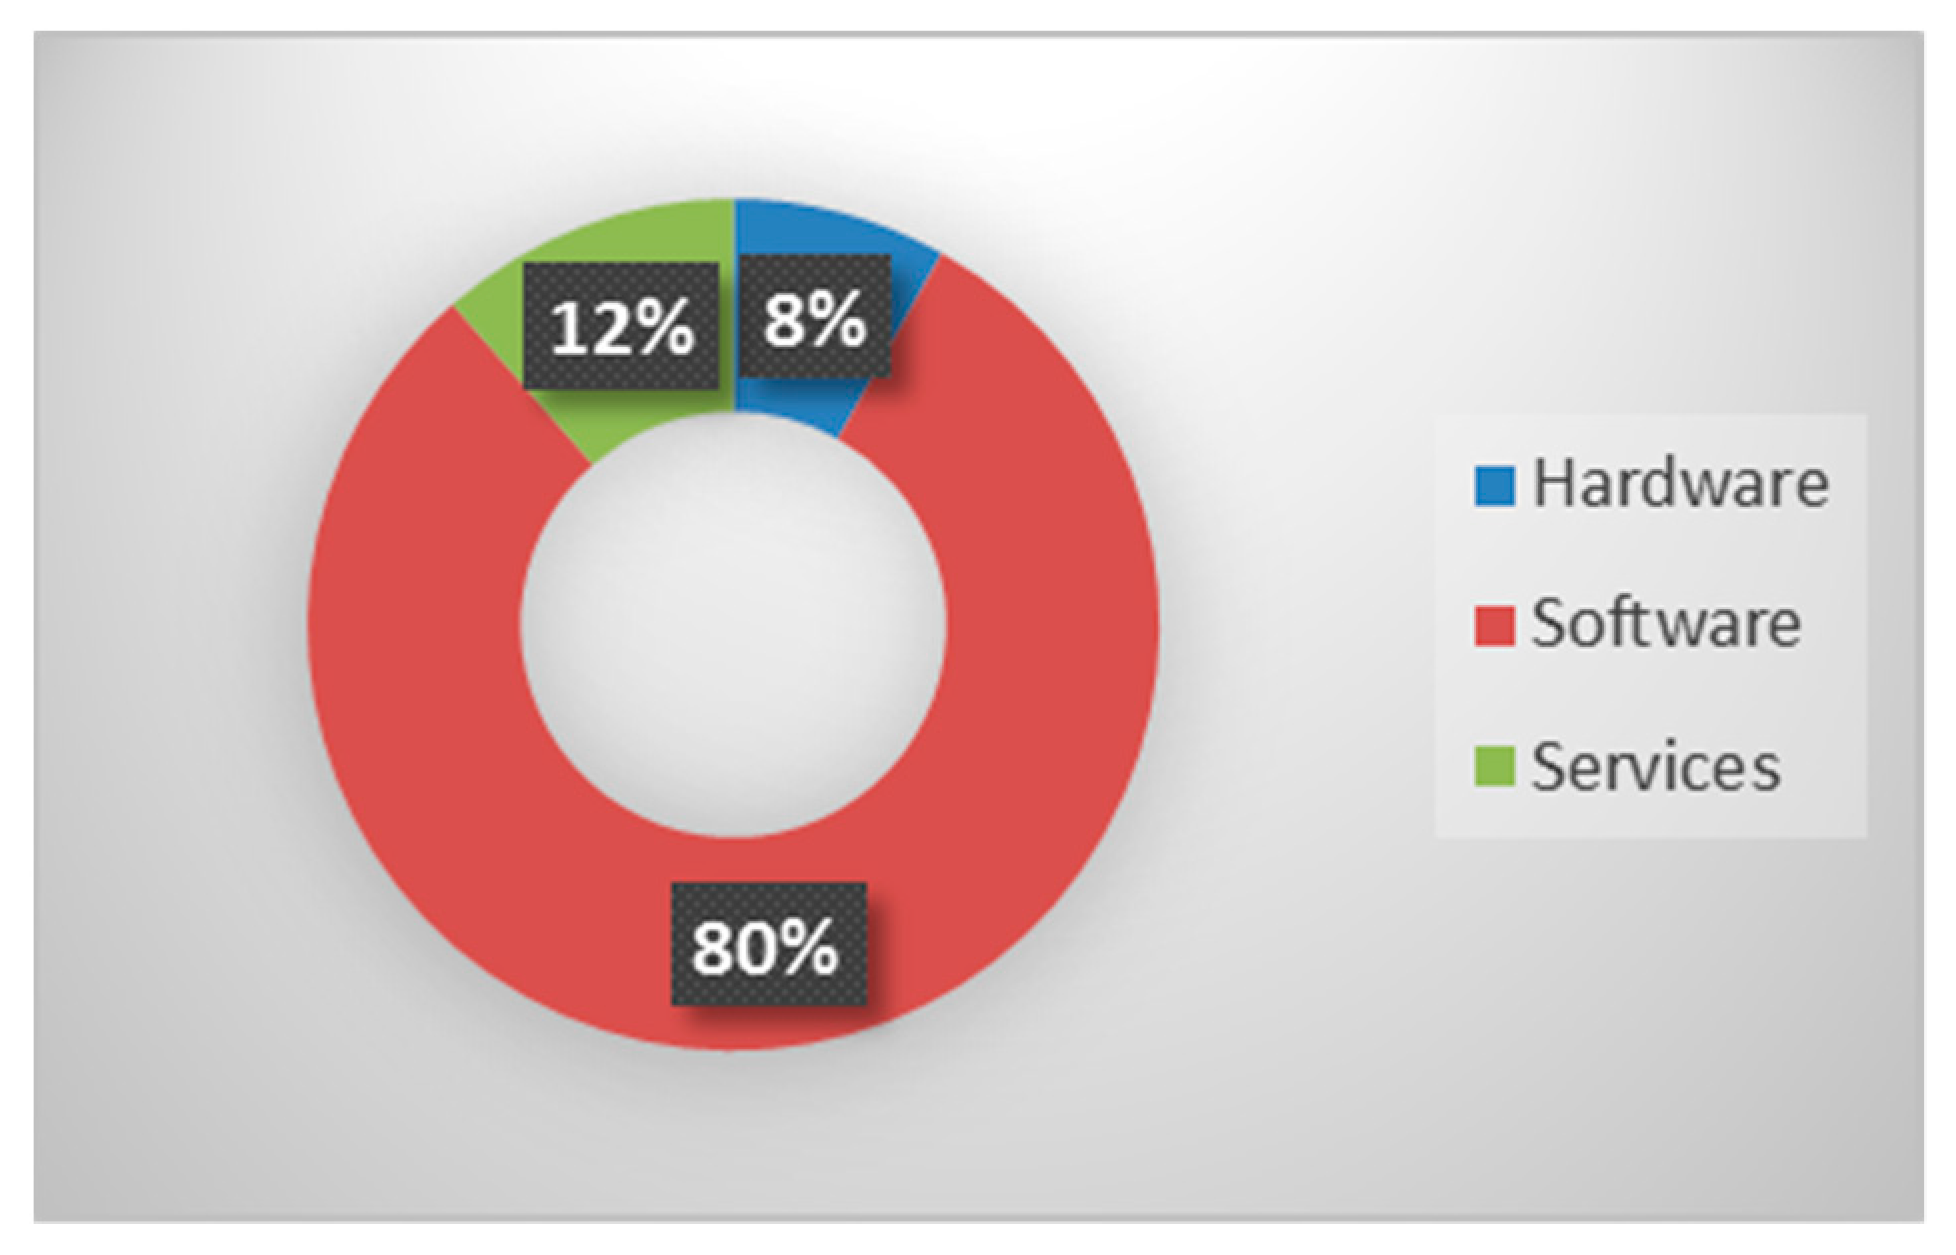
Microsoft increased its revenue by more than 200% over the decade, to almost 94 billion dollars (Figure 16 and Figure 17) [65,66,67,68,69,70,71,72,73,74,75,76]. The software division has sustained losses, while Microsoft has been reshaping and diversifying its business model and core focus. The significant increases in revenue are in the hardware and service divisions. In the hardware division, the acquisition of Nokia and the introduction of the “Surface” augmented revenue streams.
In the service division, the surging cloud revenue that was greater than 20 percent per year shows the desire of companies and customers to opt for software as a service instead of as a licensed product.
(3) Transition Analysis—Challenges
The change in business model was a challenge for Microsoft, as they had to change two aspects—customers and enterprises have different expectations and needs. Additionally, according to their business model, they wanted their products to be available on all devices. Finally, it was necessary to invest in devices/hardware that they had no prior experience with.
In the customer segment, they had to promote a model based on buying a license that is in use for a long time, where customers pay monthly fees with free updates.
In the enterprise segment, Microsoft had to redesign its sales strategy. It still uses their license model for traditional products but, additionally, sells their cloud services and subscription-based models as add-ons. Moreover, their sales strategy had to become flexible, as more and more services were sold and less products.
Another problem for Microsoft was their decreasing profit margin. The software products they sold were high-yielding digital products whose marginal costs approached zero. In comparison, the hardware-only segment yields a small profit margin, or may result in a loss. Services generally have an acceptable profit margin, but Microsoft’s subscription base required a high initial investment with few participants and therefore created little revenue.
Furthermore, Microsoft was challenged with the issue of the duration of contracts. With a licensing agreement, enterprises were bound and interested in a product over multiple years, with product updates. In the subscription model, contract durations are usually monthly or yearly, which requires more sales activity and alternative ways to retain customers.
(4) Transition Analysis—Positive and Negative Effects
In Figure 18 [65,66,67,68,69,70,71,72,73,74,75,76], Microsoft’s positive and negative effects are compared and listed.
In the case of Microsoft, the switch to a full market approach was the primary explanation for the positive and negative effects.
3.3. HP Servitization Scenario
(1) Changes Assessment by Business Segment
HP kept its primary business segments and added products or services to their segments. This strategy was primarily due to their diversified portfolio, which was accumulated beforehand [6]. Additionally, HP decided that its portfolio was too broad. Therefore, they split the company into two corporations, which took effect on November 1, 2015. The old corporation coordinates the personal systems group and printing. The new corporation is responsible for the enterprise segment, enterprise services, HP financial services and the software segment. This step signifies the importance of specific and supplementing segments.
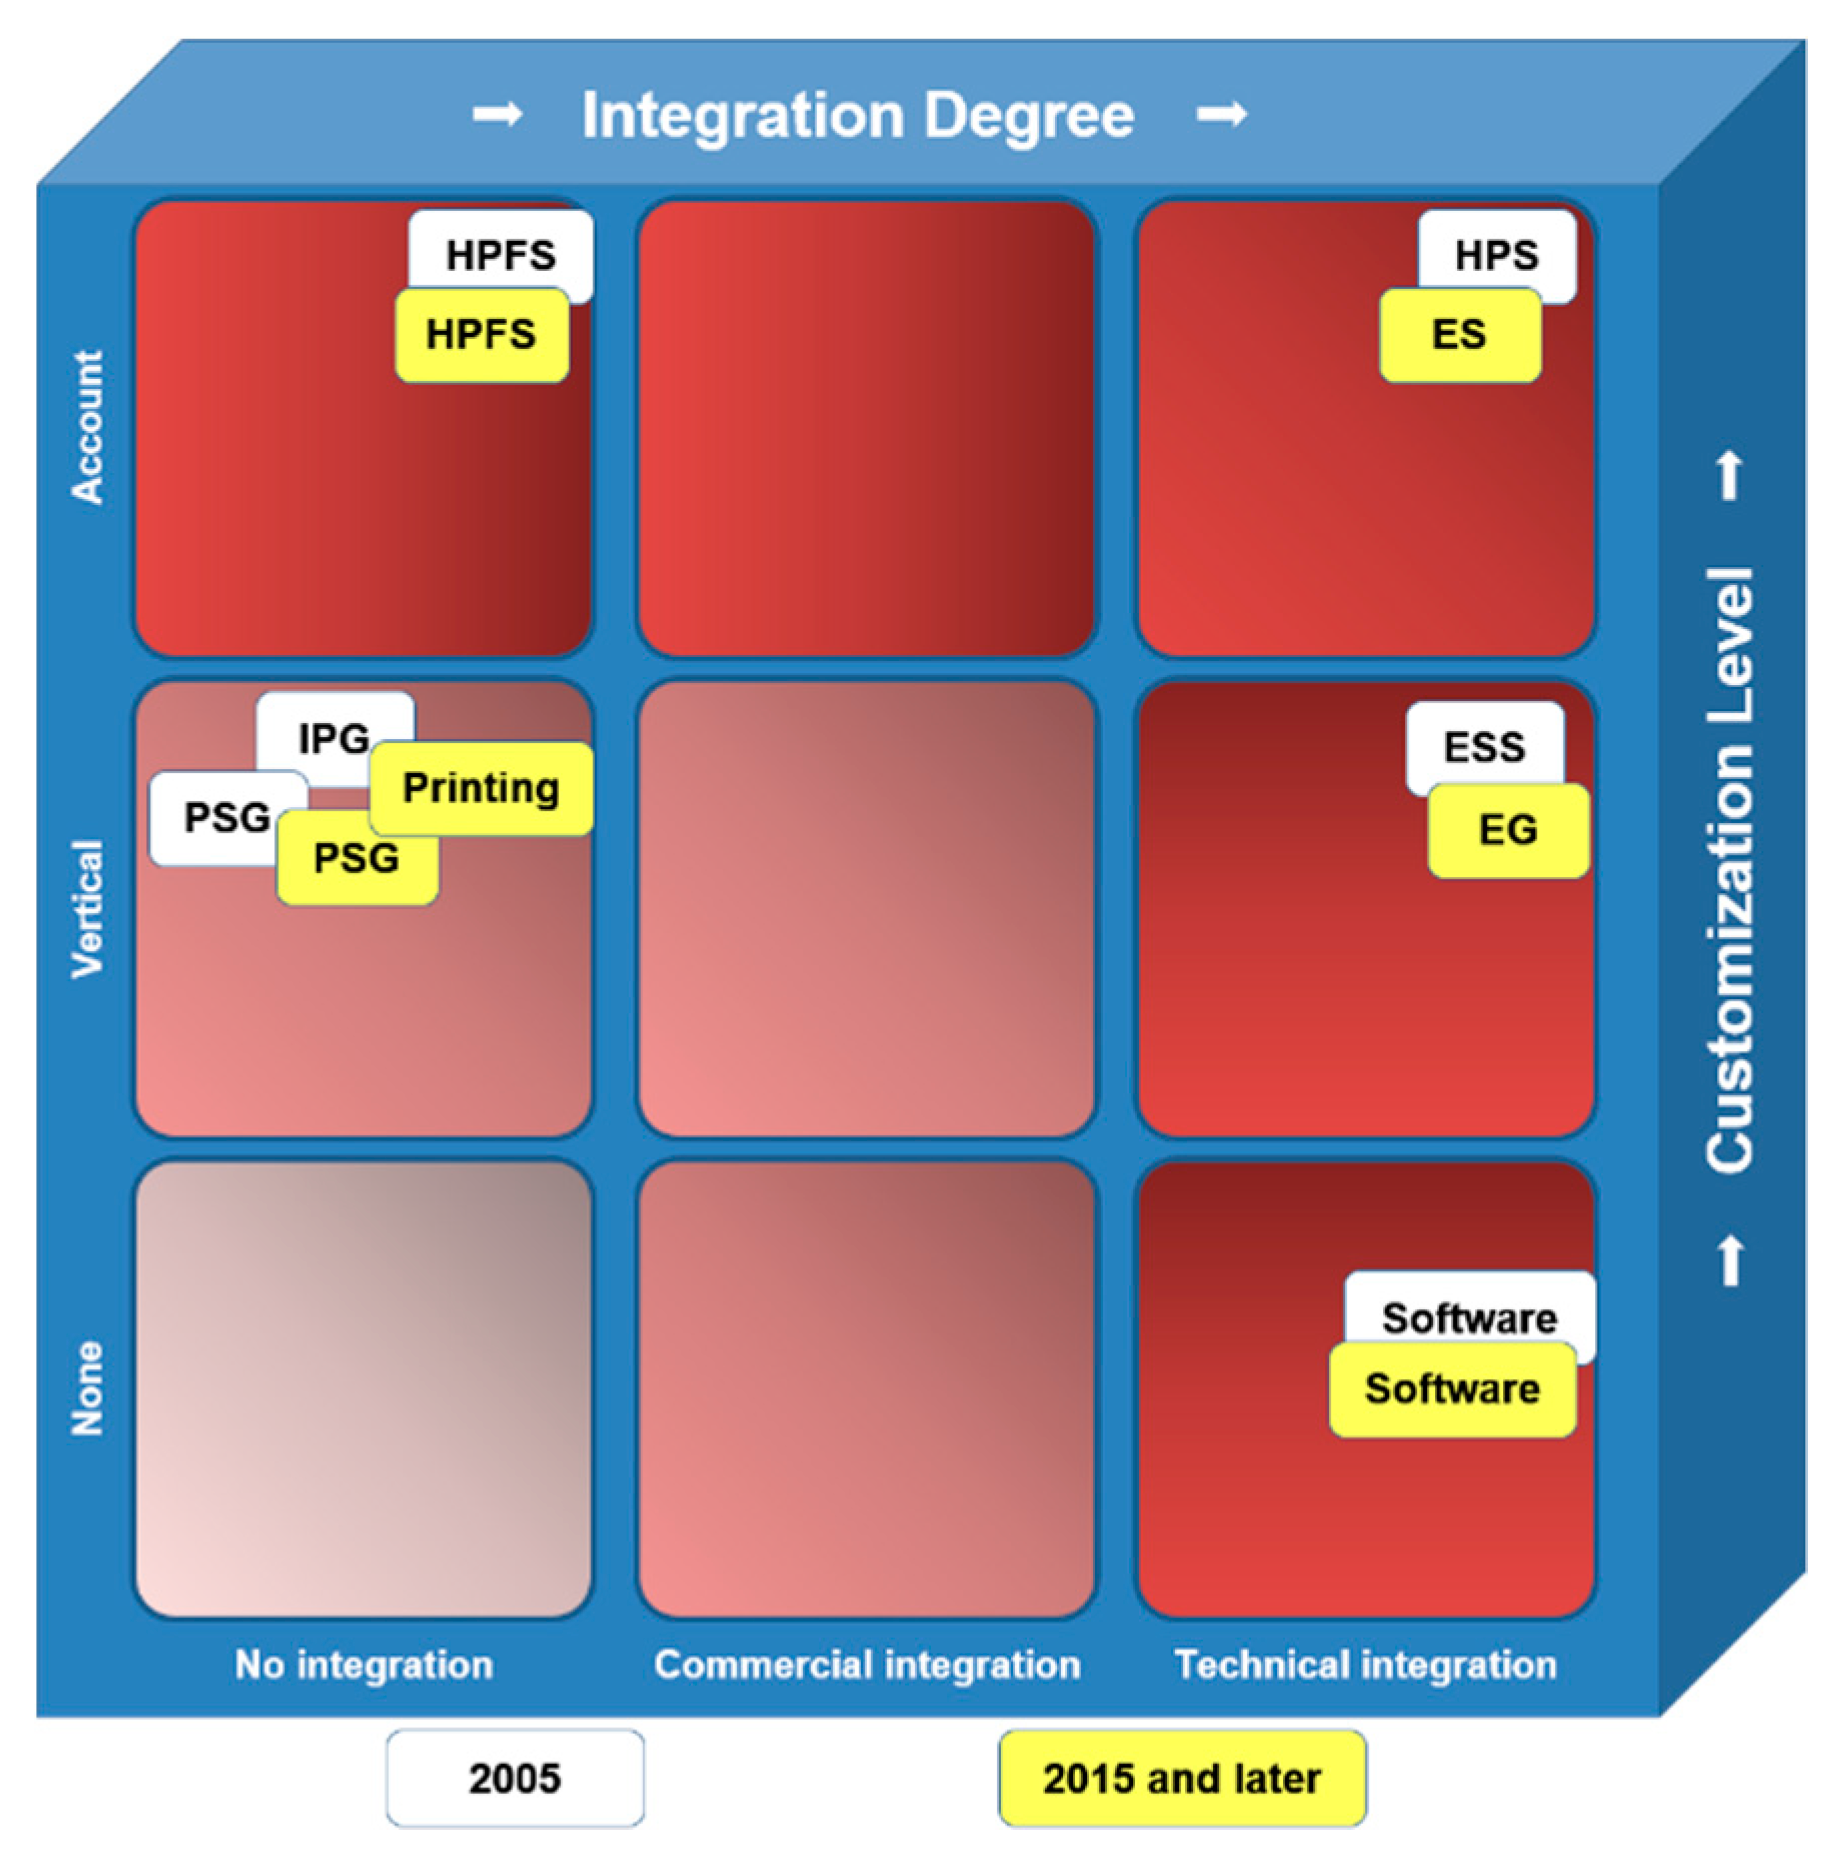
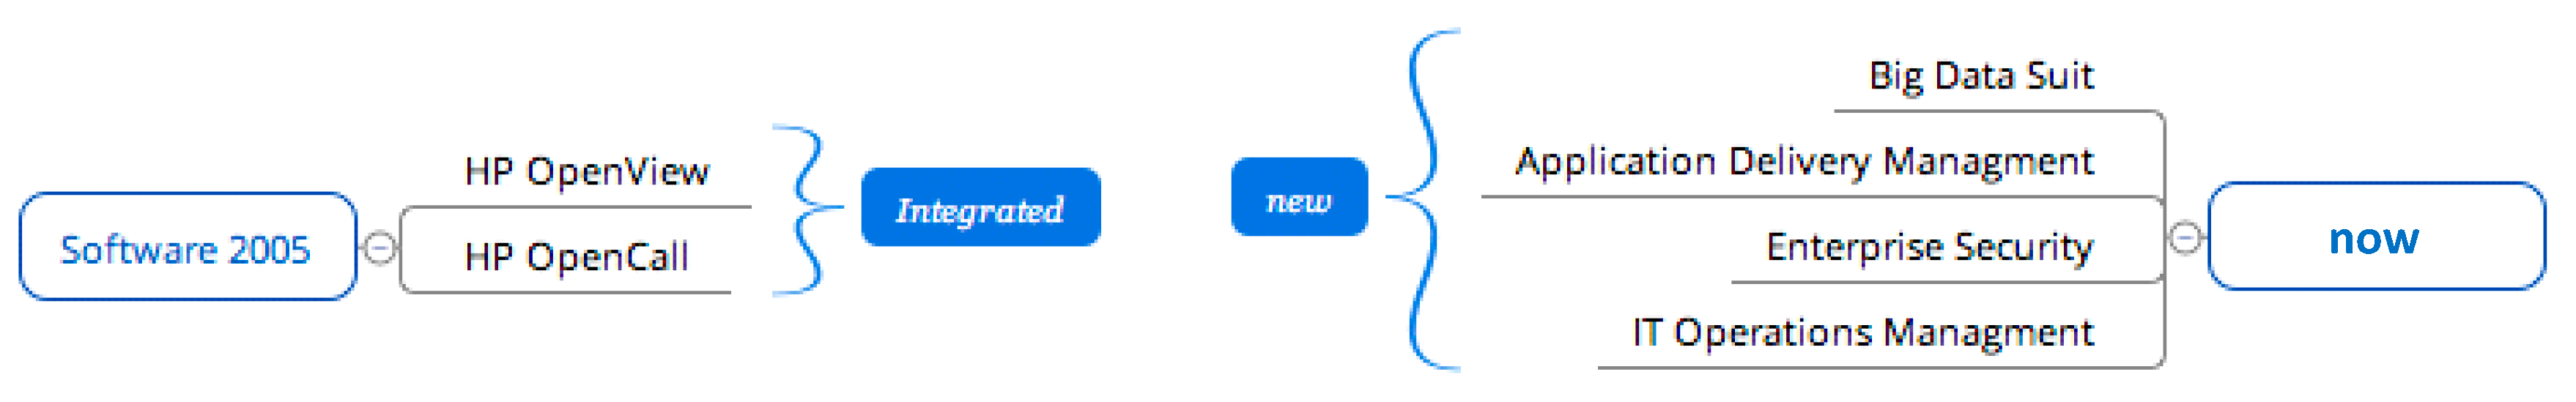
Figure 19 depicts the results of the analysis of the HP transition towards Servitization over a decade, starting from 2005 [39,77,78,79,80,81,82,83,84,85,86,87,88,89].
Several of the terms used in the figure are as follows: Enterprise Group (EG), Enterprise Services (ES), Enterprise Storage and Servers (ESS), HP Financial Services (HPFS), HPS (HP Services), Imaging and Printing Group (IPG), Personal Systems Group (PSG) [77,78,79,80,81,82,83,84,85,86,87,88,89].
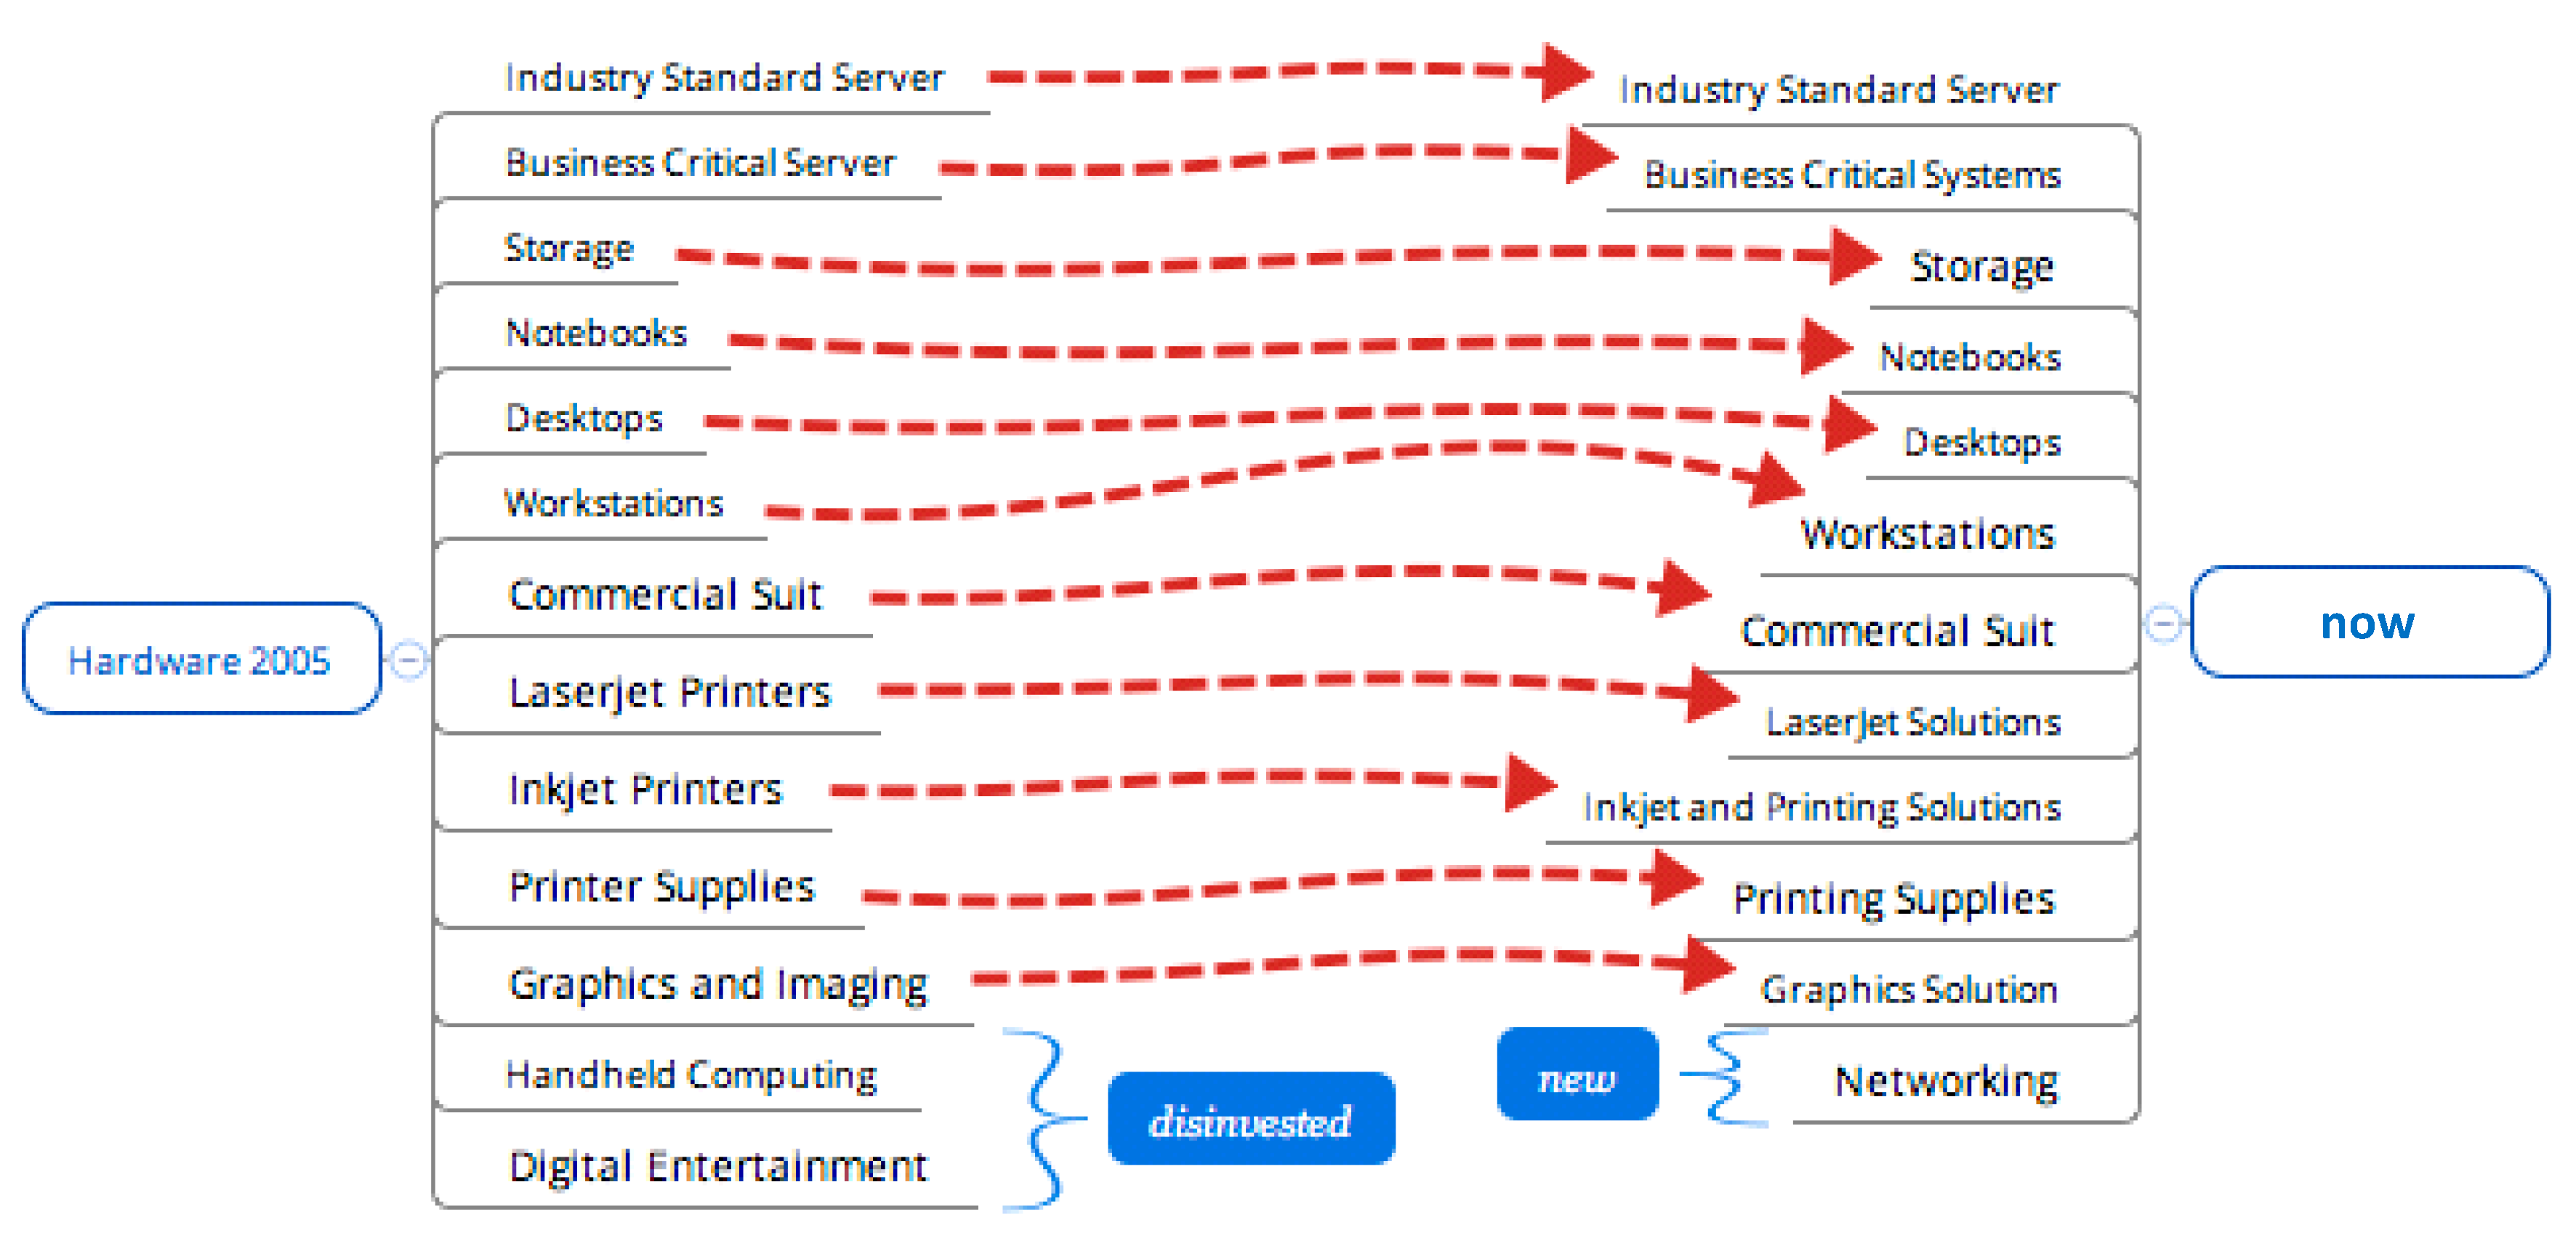
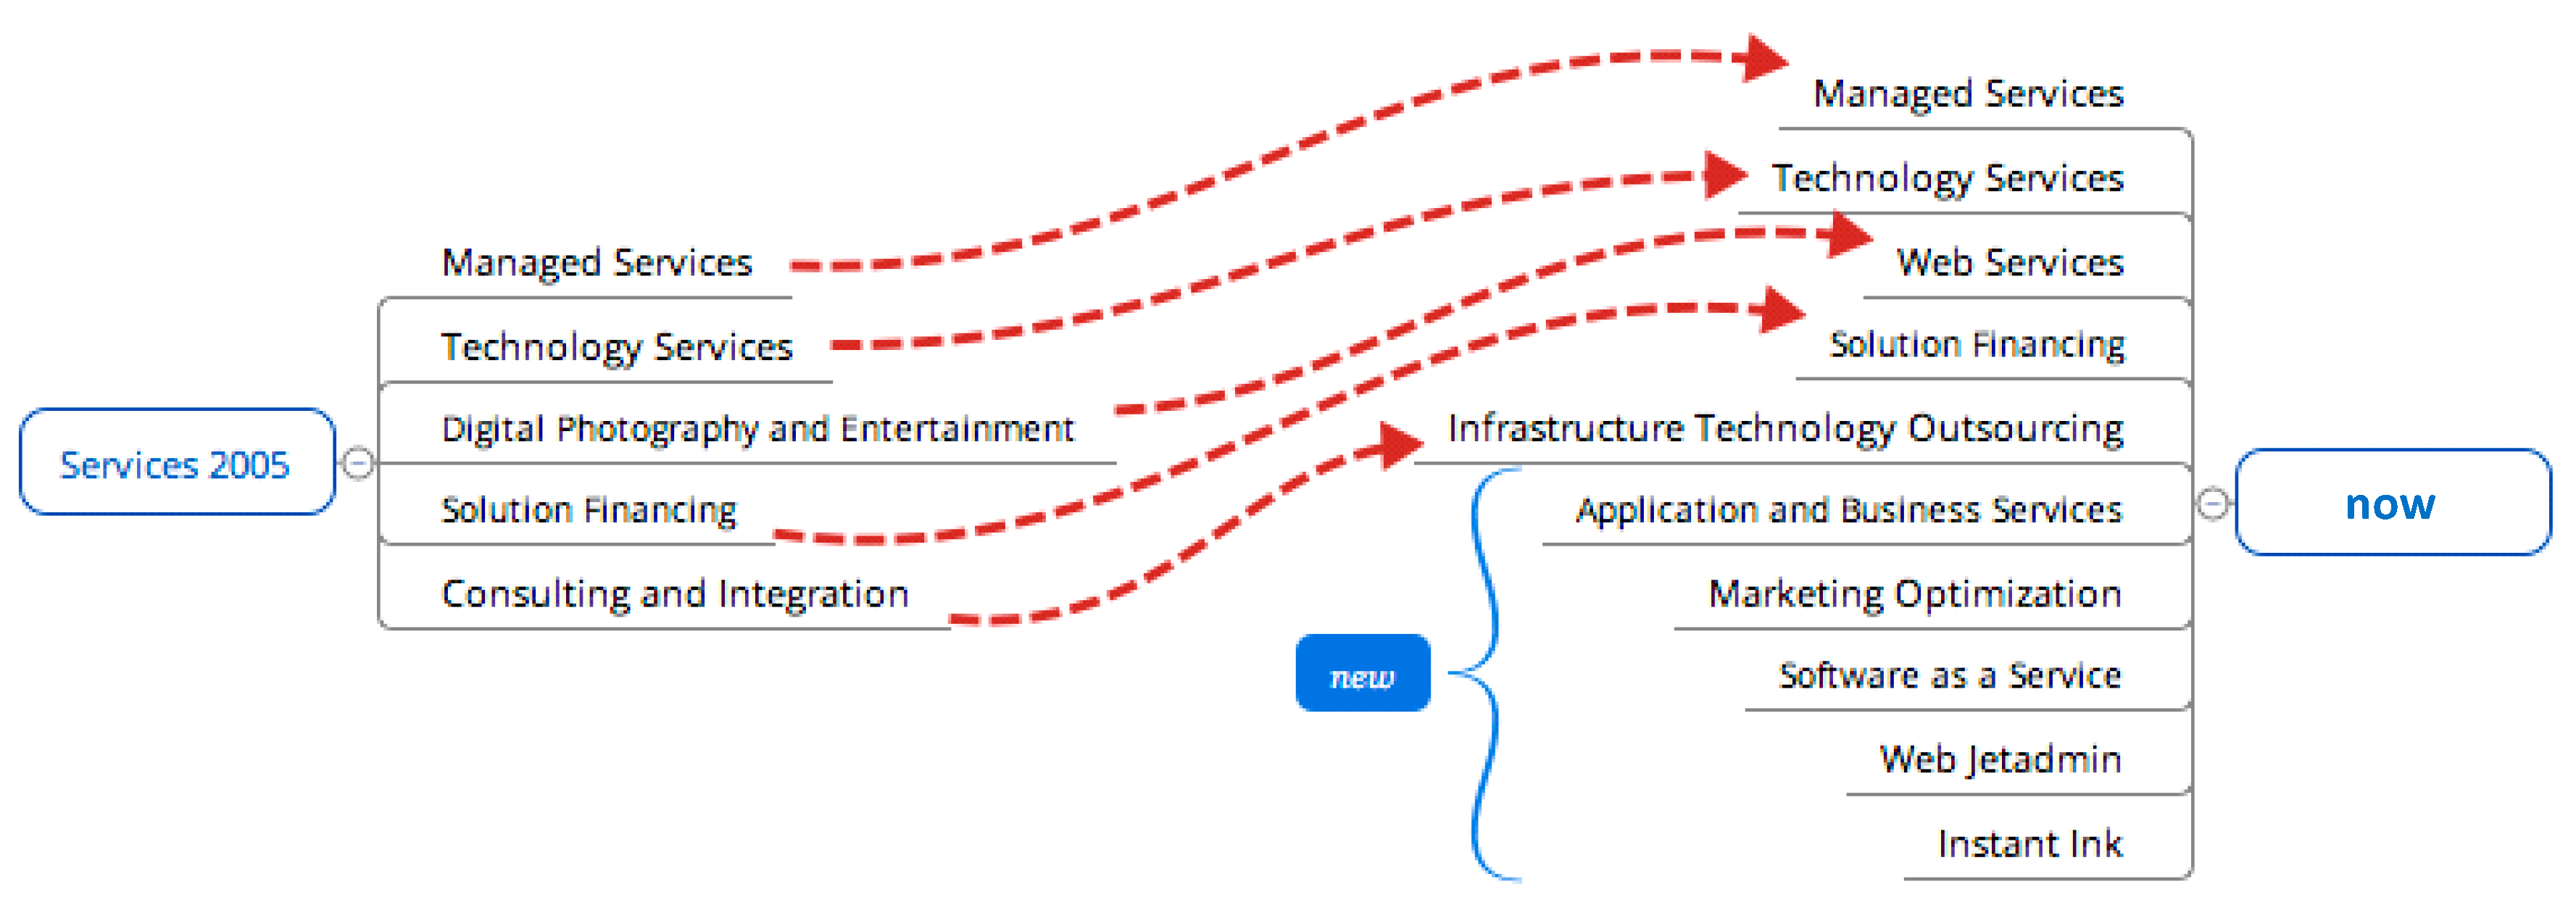
Continuing with our analysis of changes by segment, Figure 20, Figure 21 and Figure 22 [77,78,79,80,81,82,83,84,85,86,87,88,89] show our results. The hardware offering ranges from small PCs to compound servers for enterprises. The core focus on hardware decreased over the period, as HP realized that the entire industry was switching to new IT practices. Another amendment to the hardware offering delivered by HP was their change to selling entire solutions, which were technically integrated hardware, instead of selling products independently.
With the acquisition of various software companies, HP began to propose complementary software applications, which were expected to increase customer satisfaction. Most of the software HP has been selling was previously tested over their own cost-cutting program through the decade.
Through the acquisition of EDS, the service offering changed, and the information transformation services HP delivered increased. Additionally, HP increasingly transitioned to delivering their internal knowledge as a service, as the industry was interested in optimizations and outsourcing.
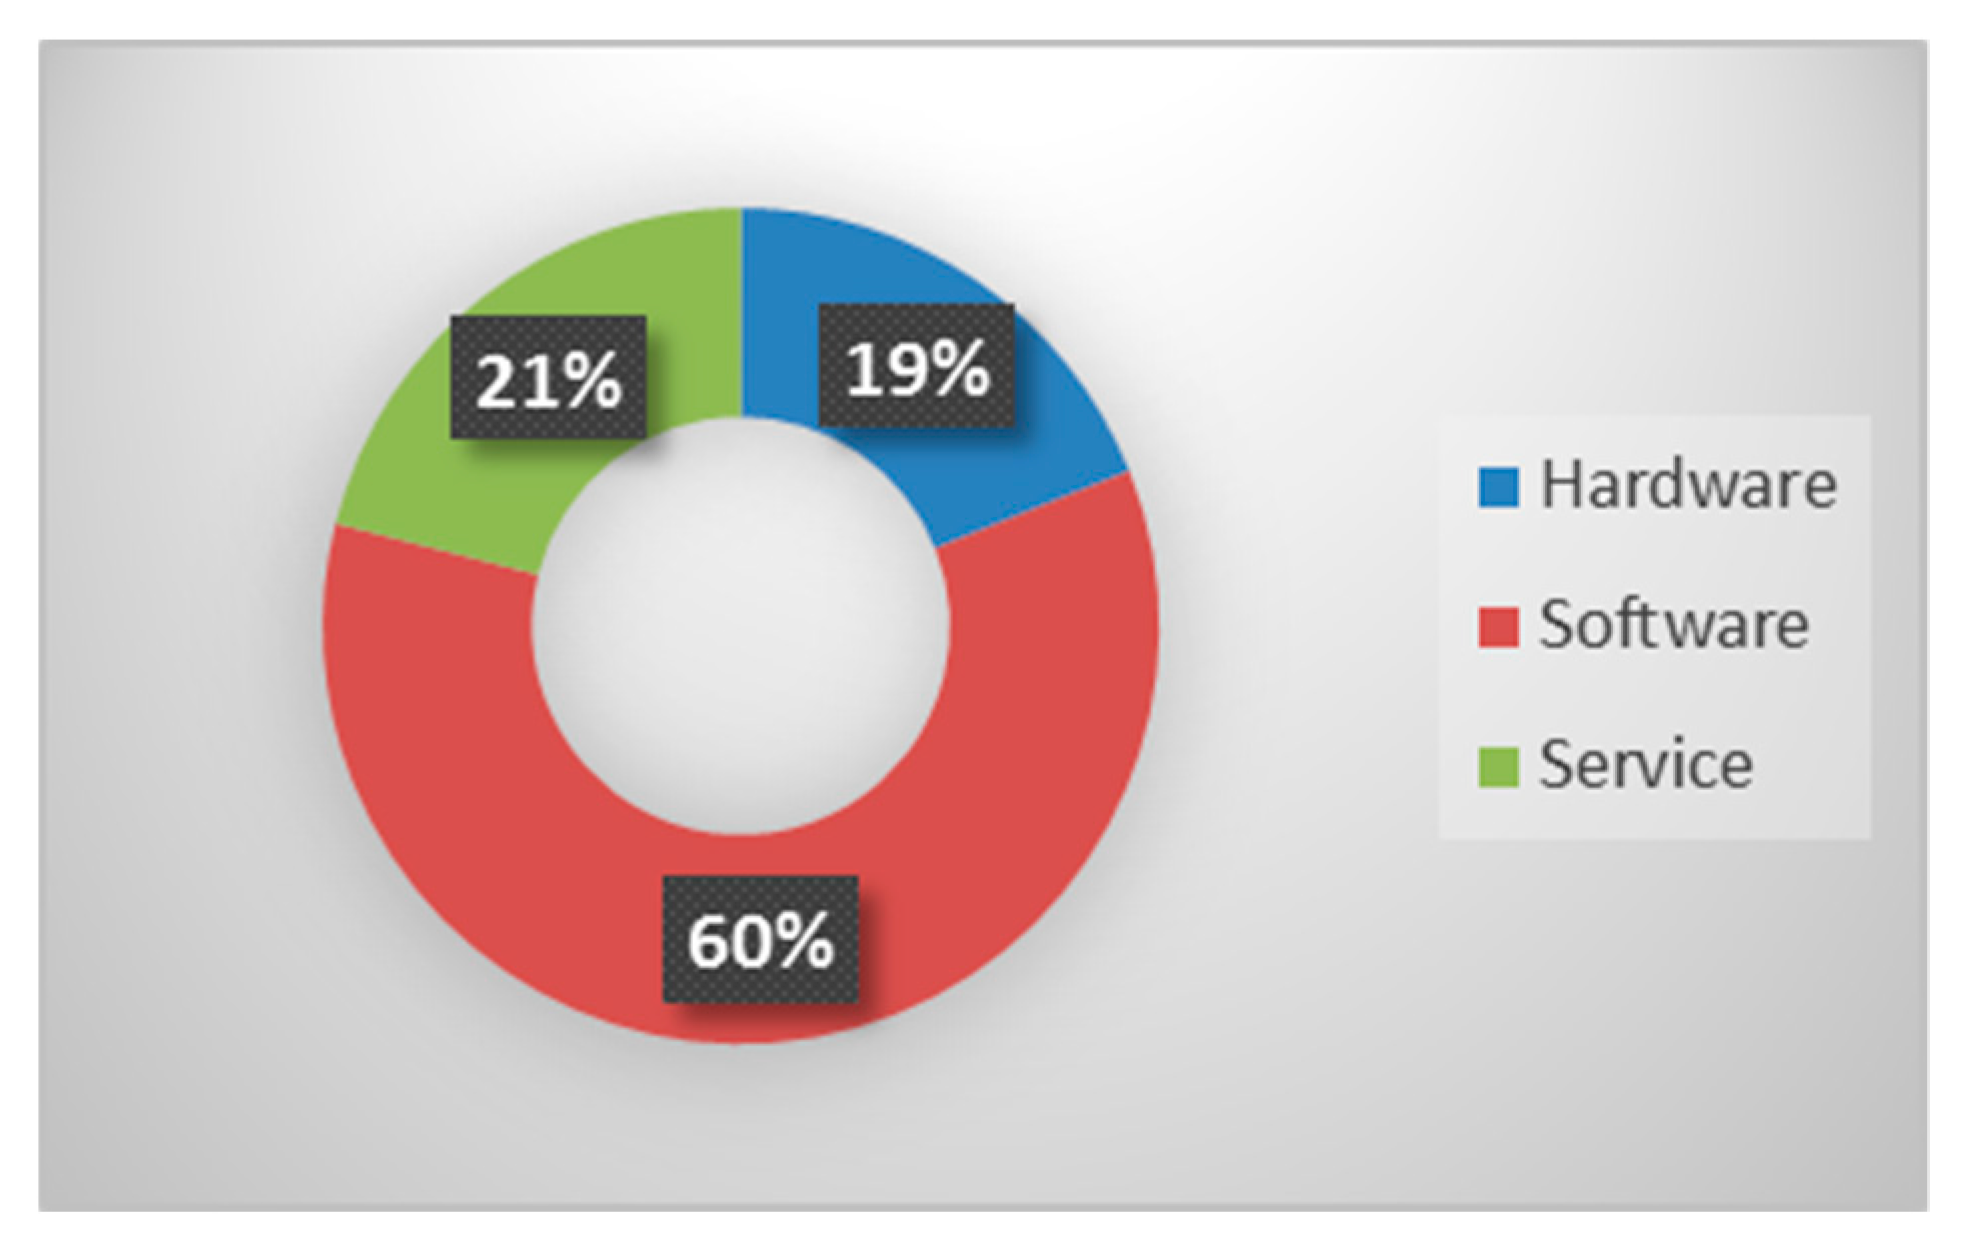
(2) Revenue Distribution
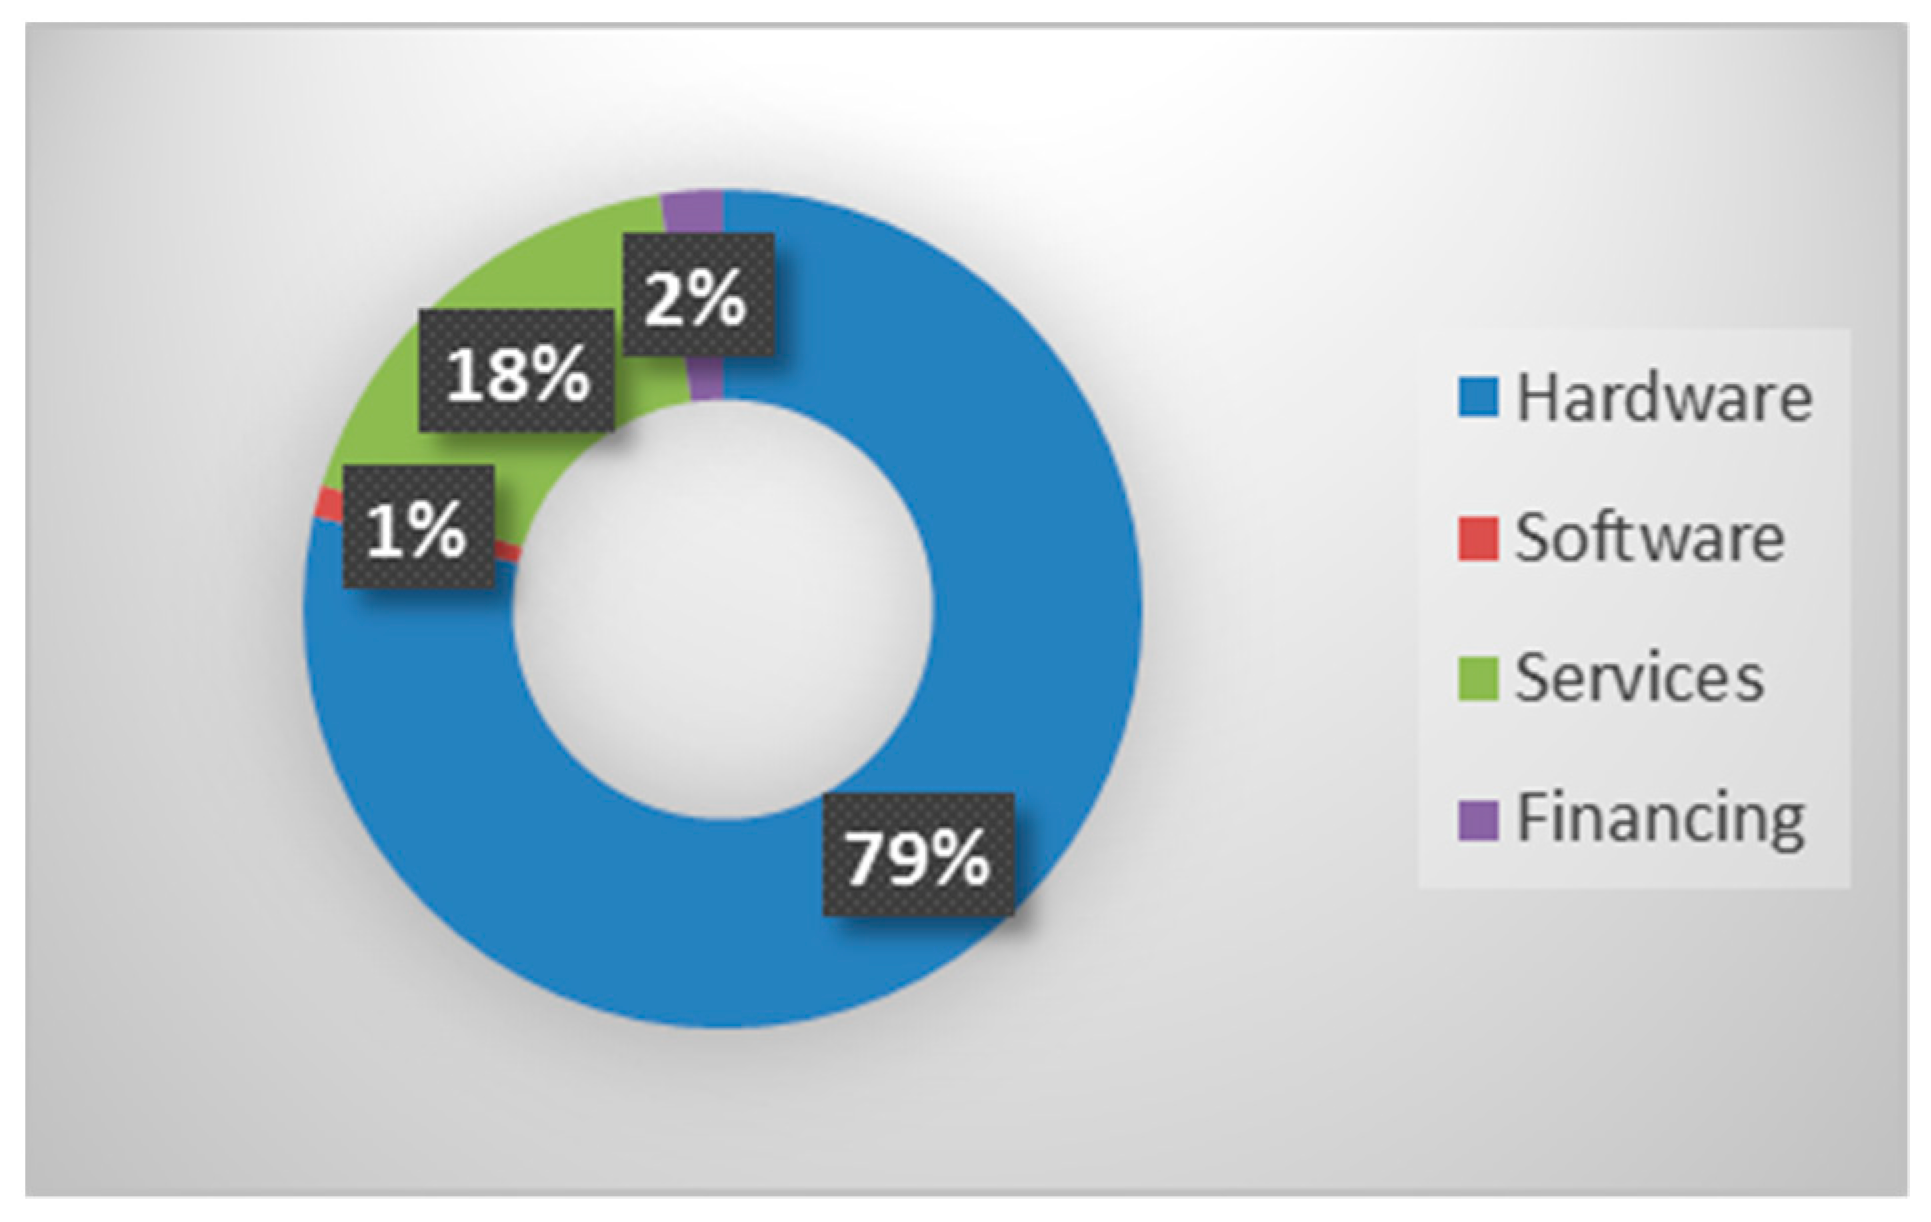
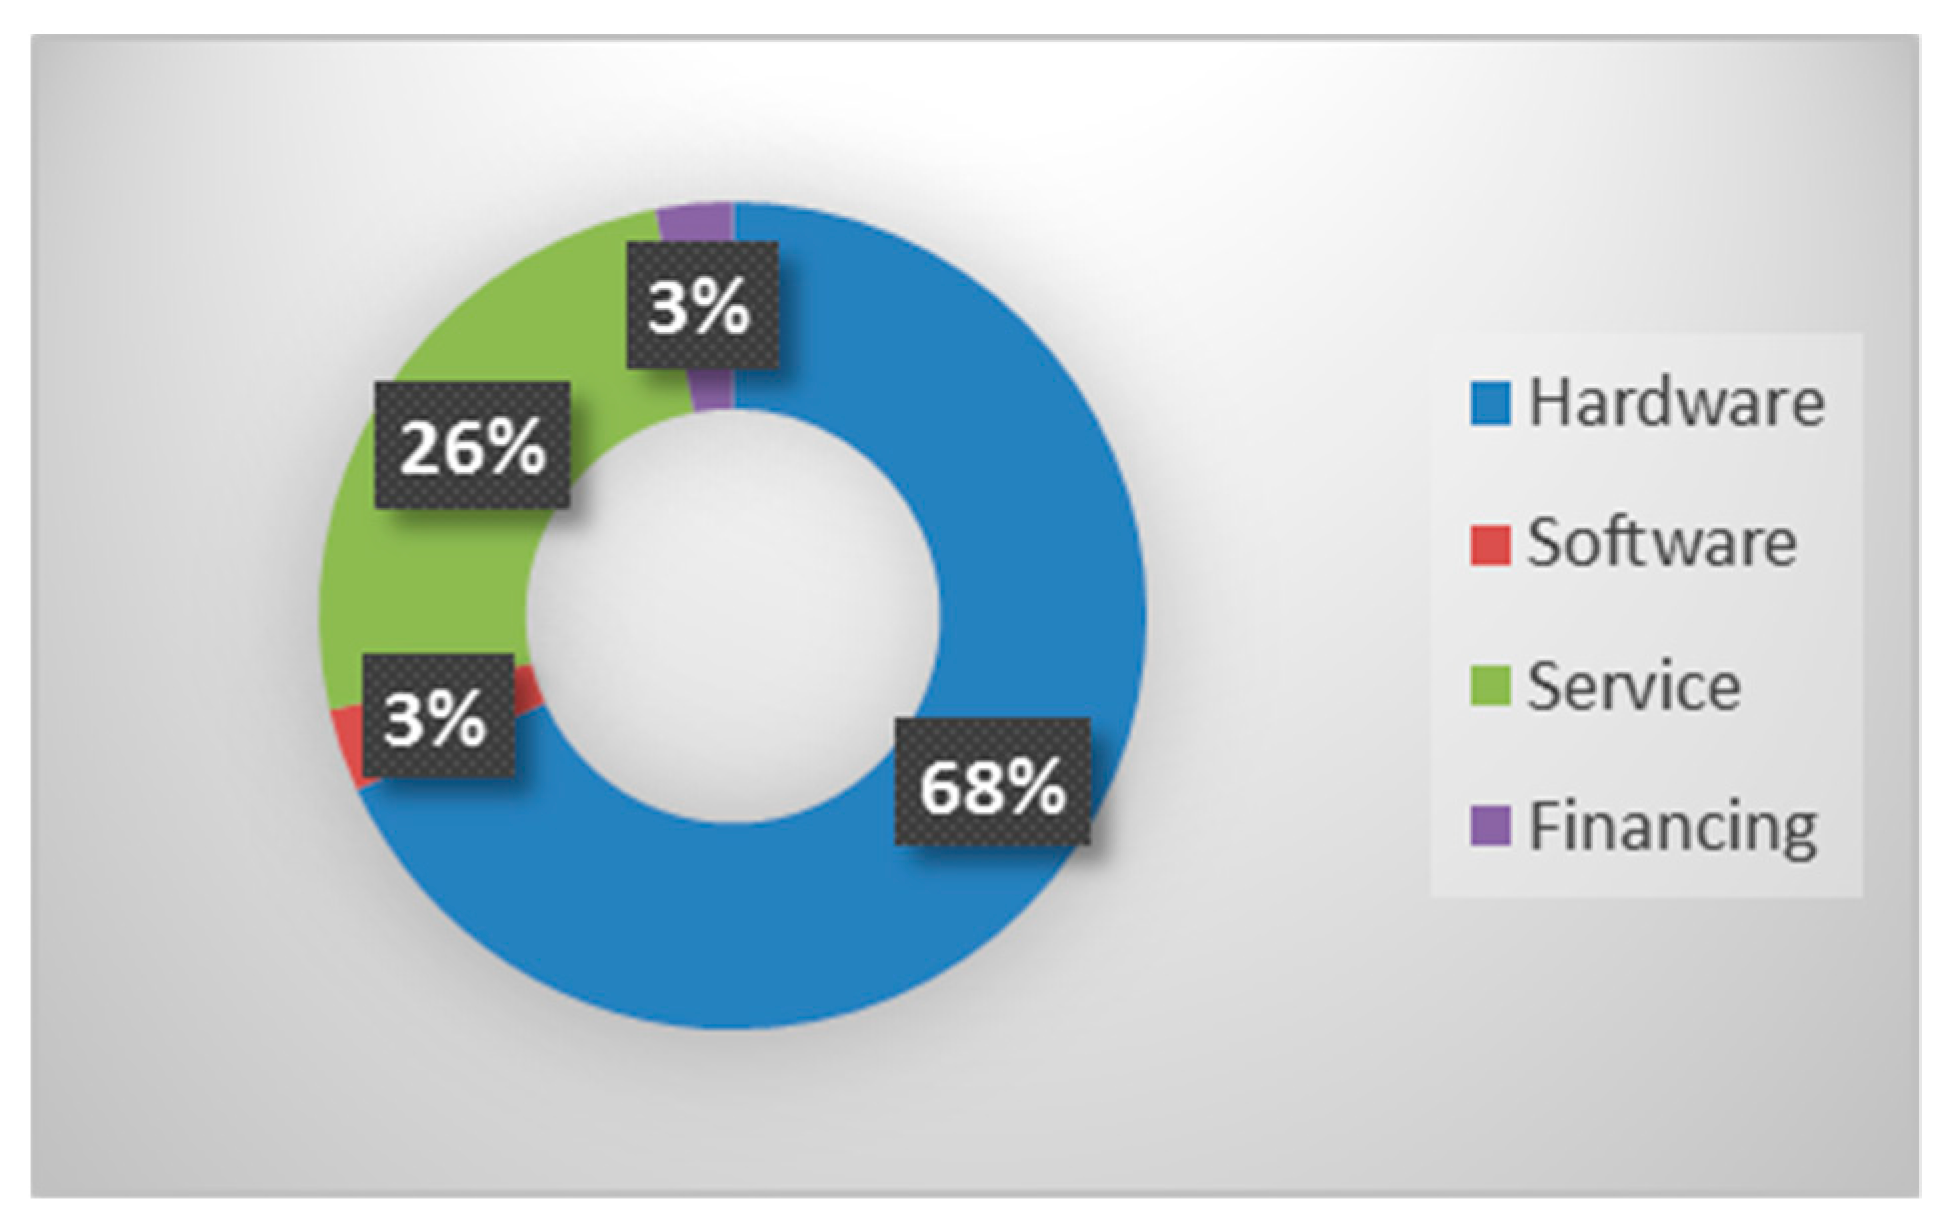
Our analysis indicates that HP remains a hardware-focused IT company. This is illustrated in Figure 23 and Figure 24 [77,78,79,80,81,82,83,84,85,86,87,88,89]. Nevertheless, a decrease in the hardware segment and an increase in software and services has been observed. As the focus of HP shifted towards services, there has been a trend towards a reduction in hardware. Furthermore, a focus on service-oriented PSS has led to a steady increase in the service segment.
(3) Transition Analysis—Challenges
HP had to face a shrinking hardware market. As profit margins were sinking, HP had to address that issue. They attempted to solve the problem with a decrease in labor and through internal process restructuring.
Furthermore, HP was challenged with the requirement that new IT business models had to be adapted to the needs of the customers. This dynamic required a rethinking of key activities and a re-analysis of the market. As the transition only occurred in the enterprise sector and not in the private sector, HP had to diversify its businesses.
Additionally, the shift towards services provoked a significant change in the sales model and generally generated increased gross margins. Hardware usually has gross margins that depend on the contracted materials and suppliers. Services gross margins depend on the company’s internal knowledge base and internal labor, which fluctuates.
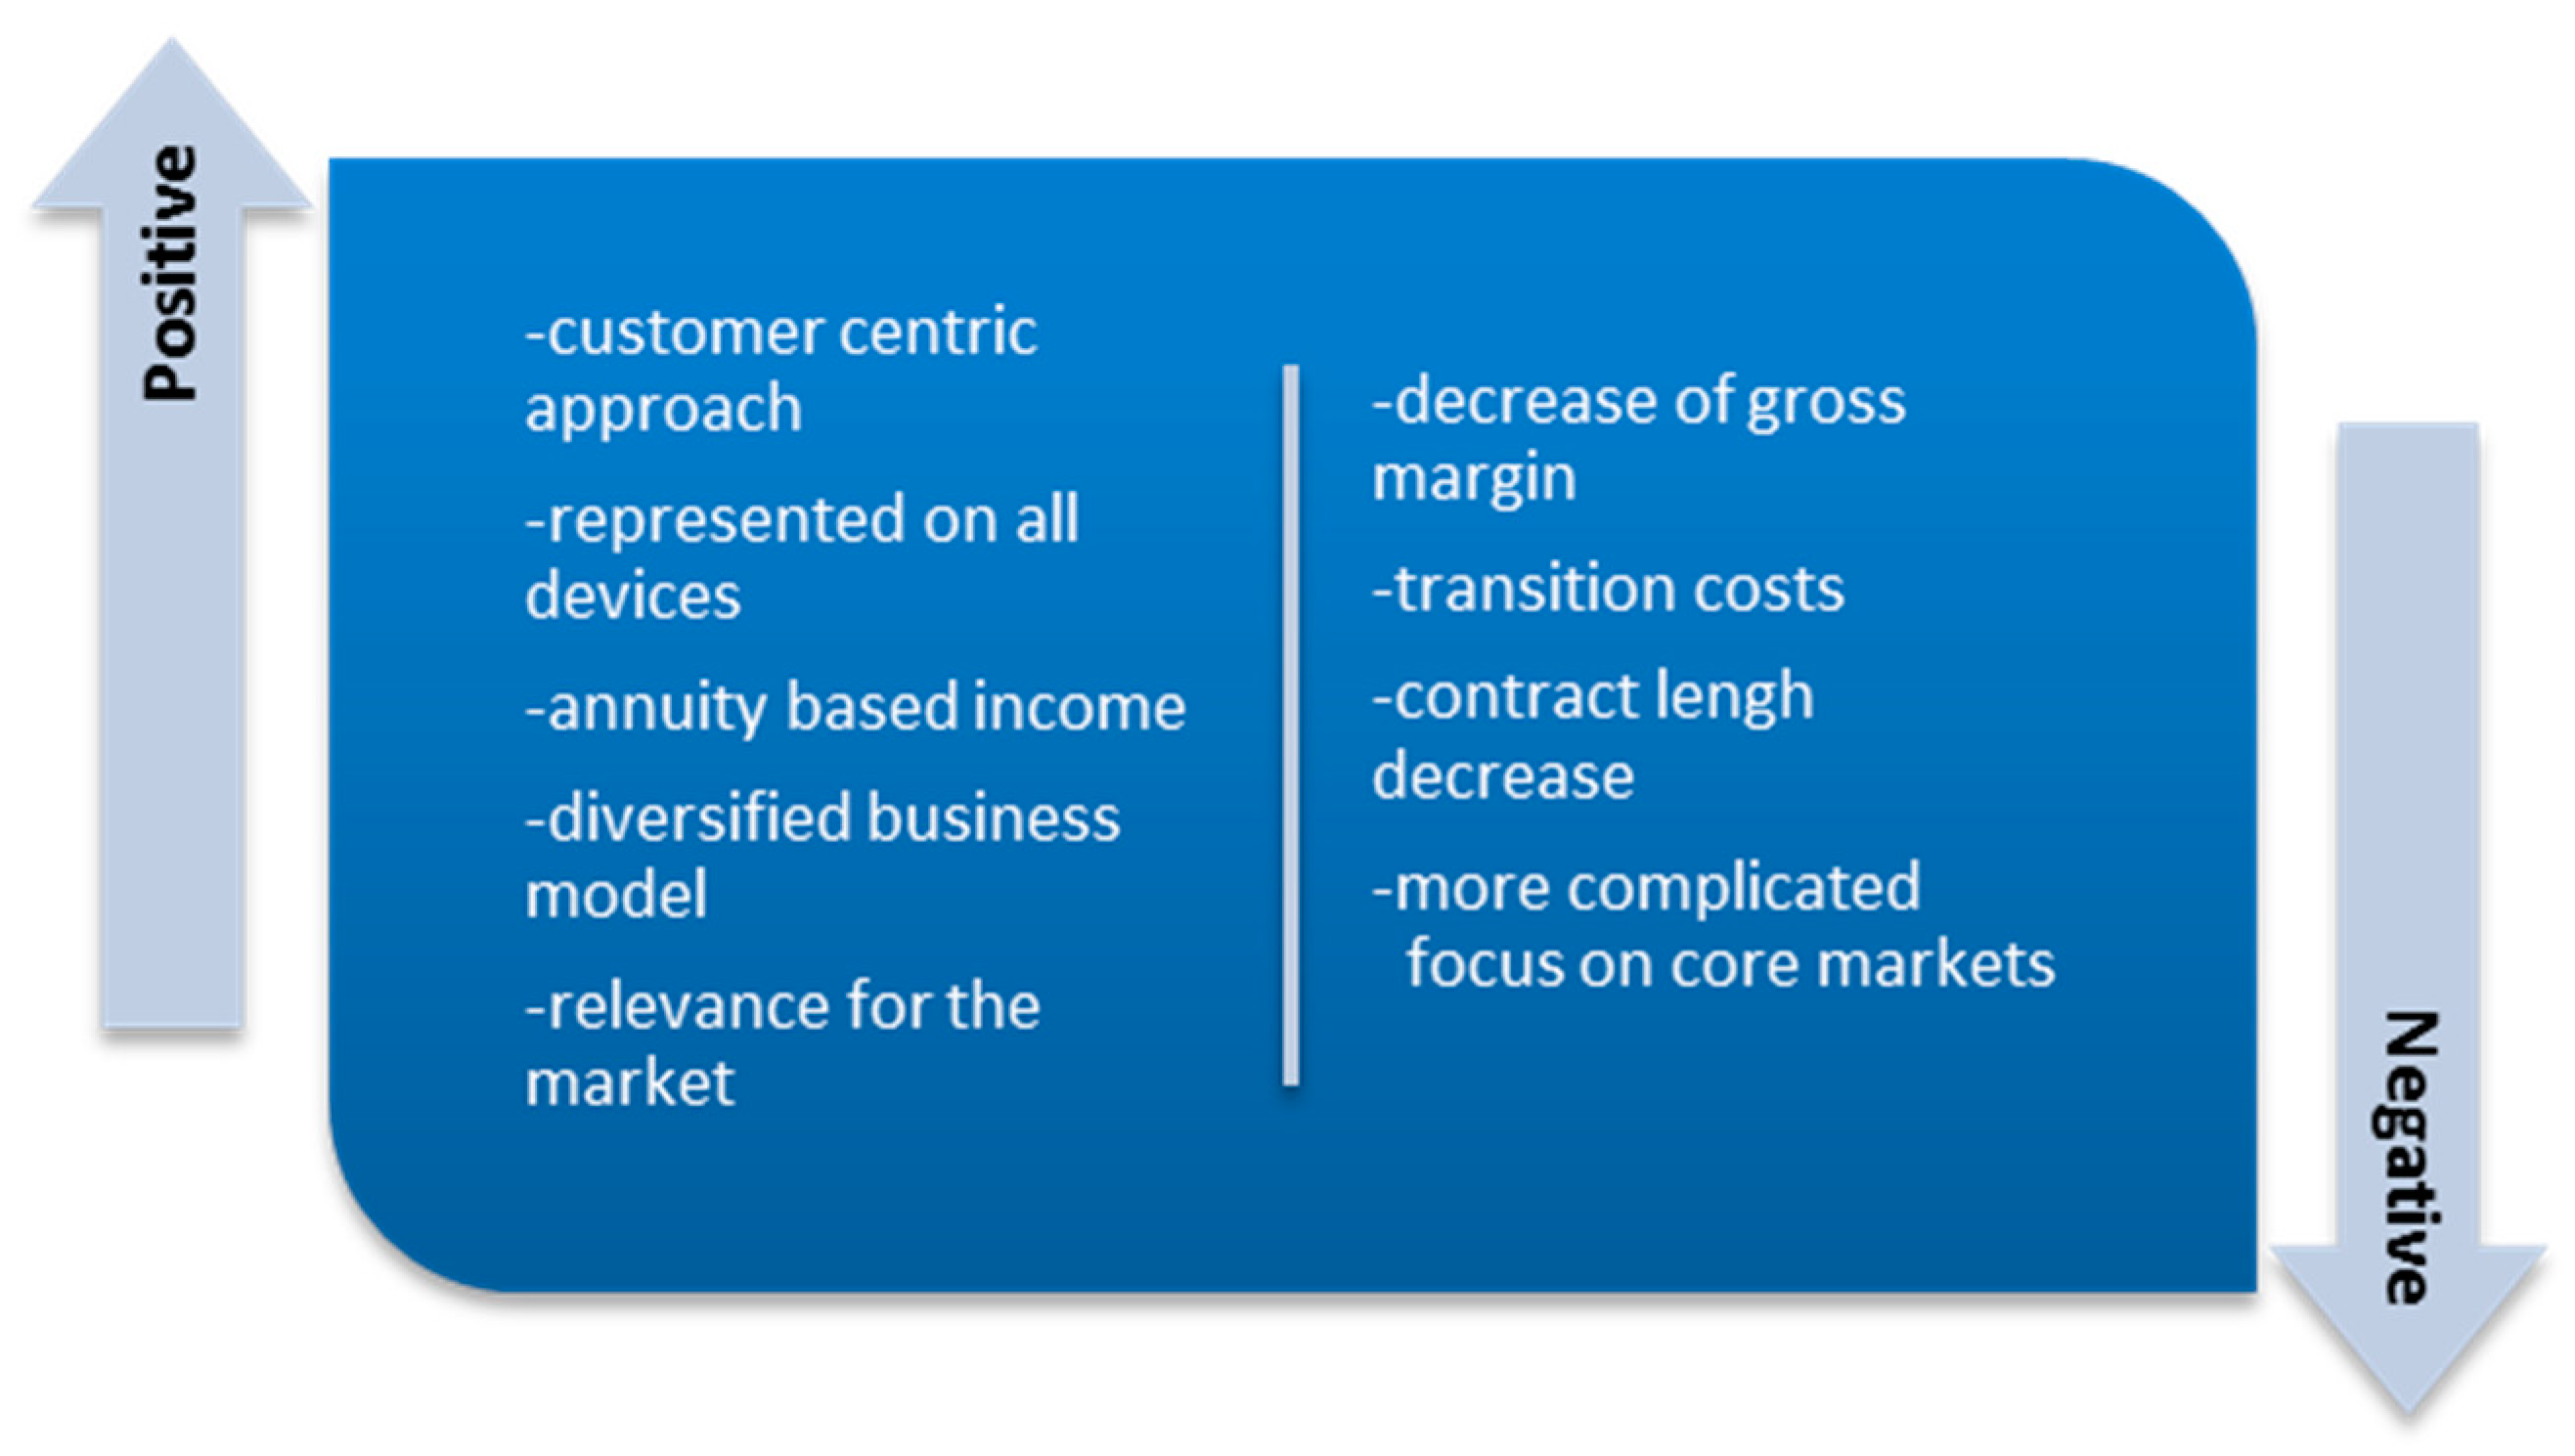
(4) Transition Analysis—Positive and Negative Effects
The consequences of Servitization for HP are illustrated in Figure 25 [77,78,79,80,81,82,83,84,85,86,87,88,89].
The outcome is based on evaluating the positive and negative causes.
3.4. Oracle Servitization Scenario
(1) Changes Assessment by Business Segment
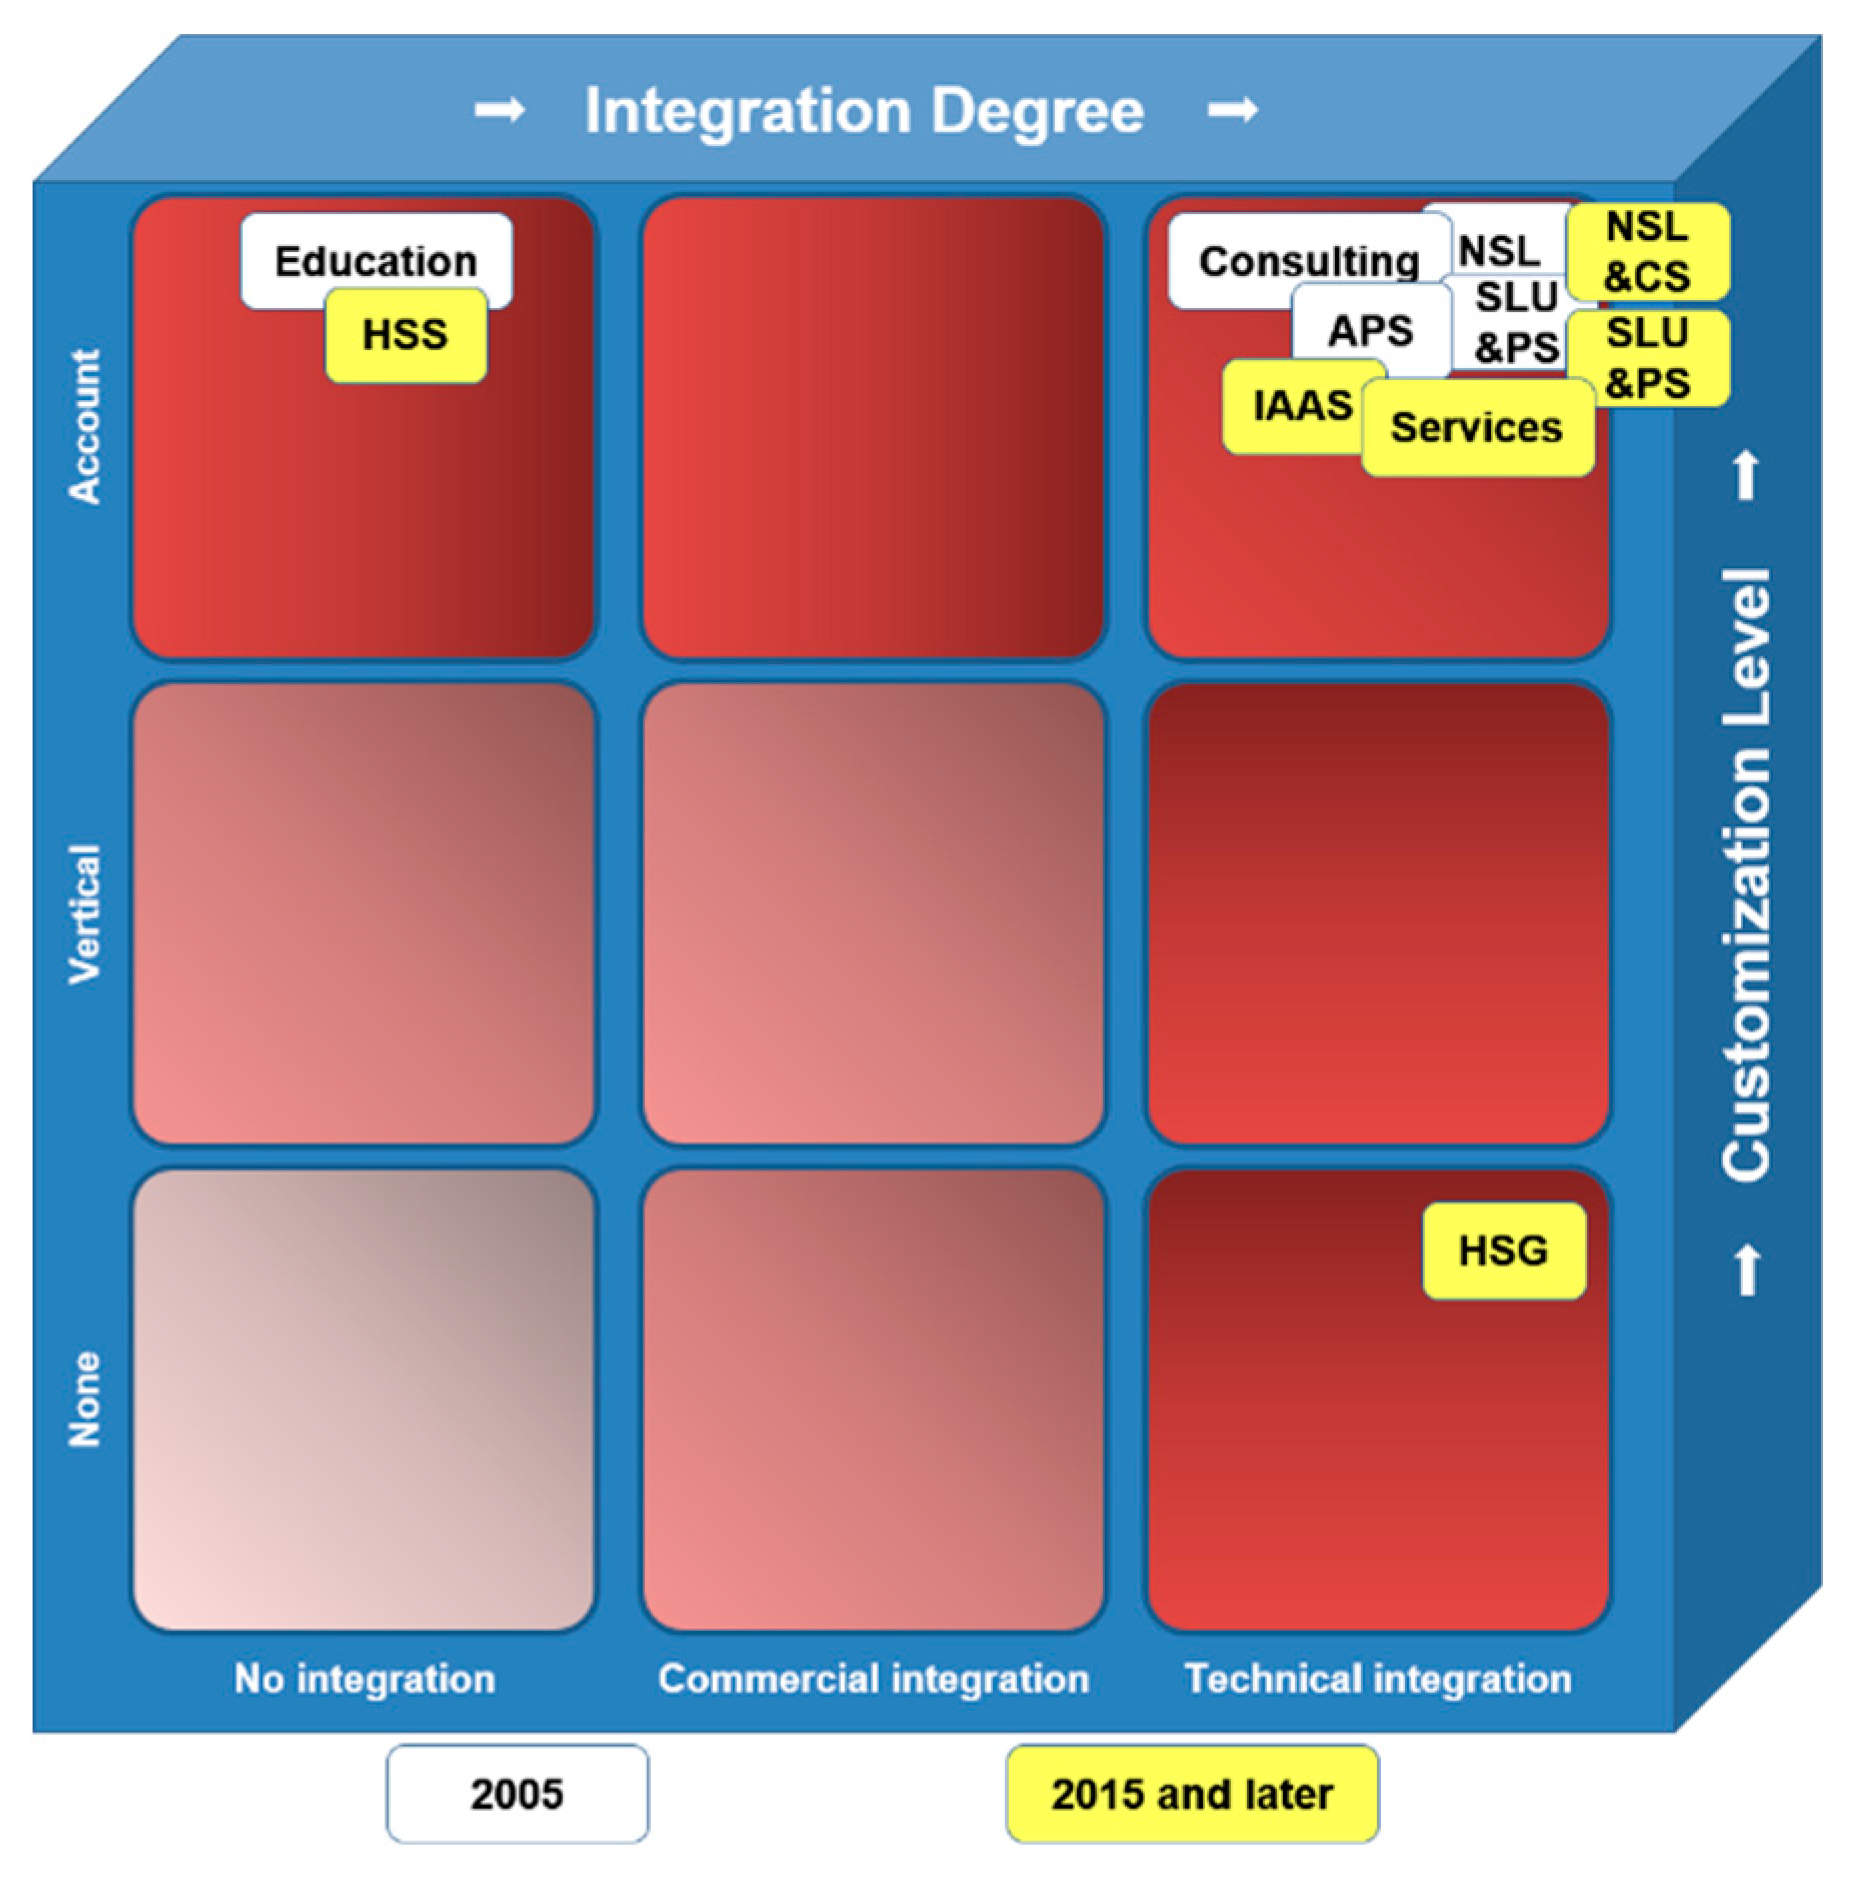
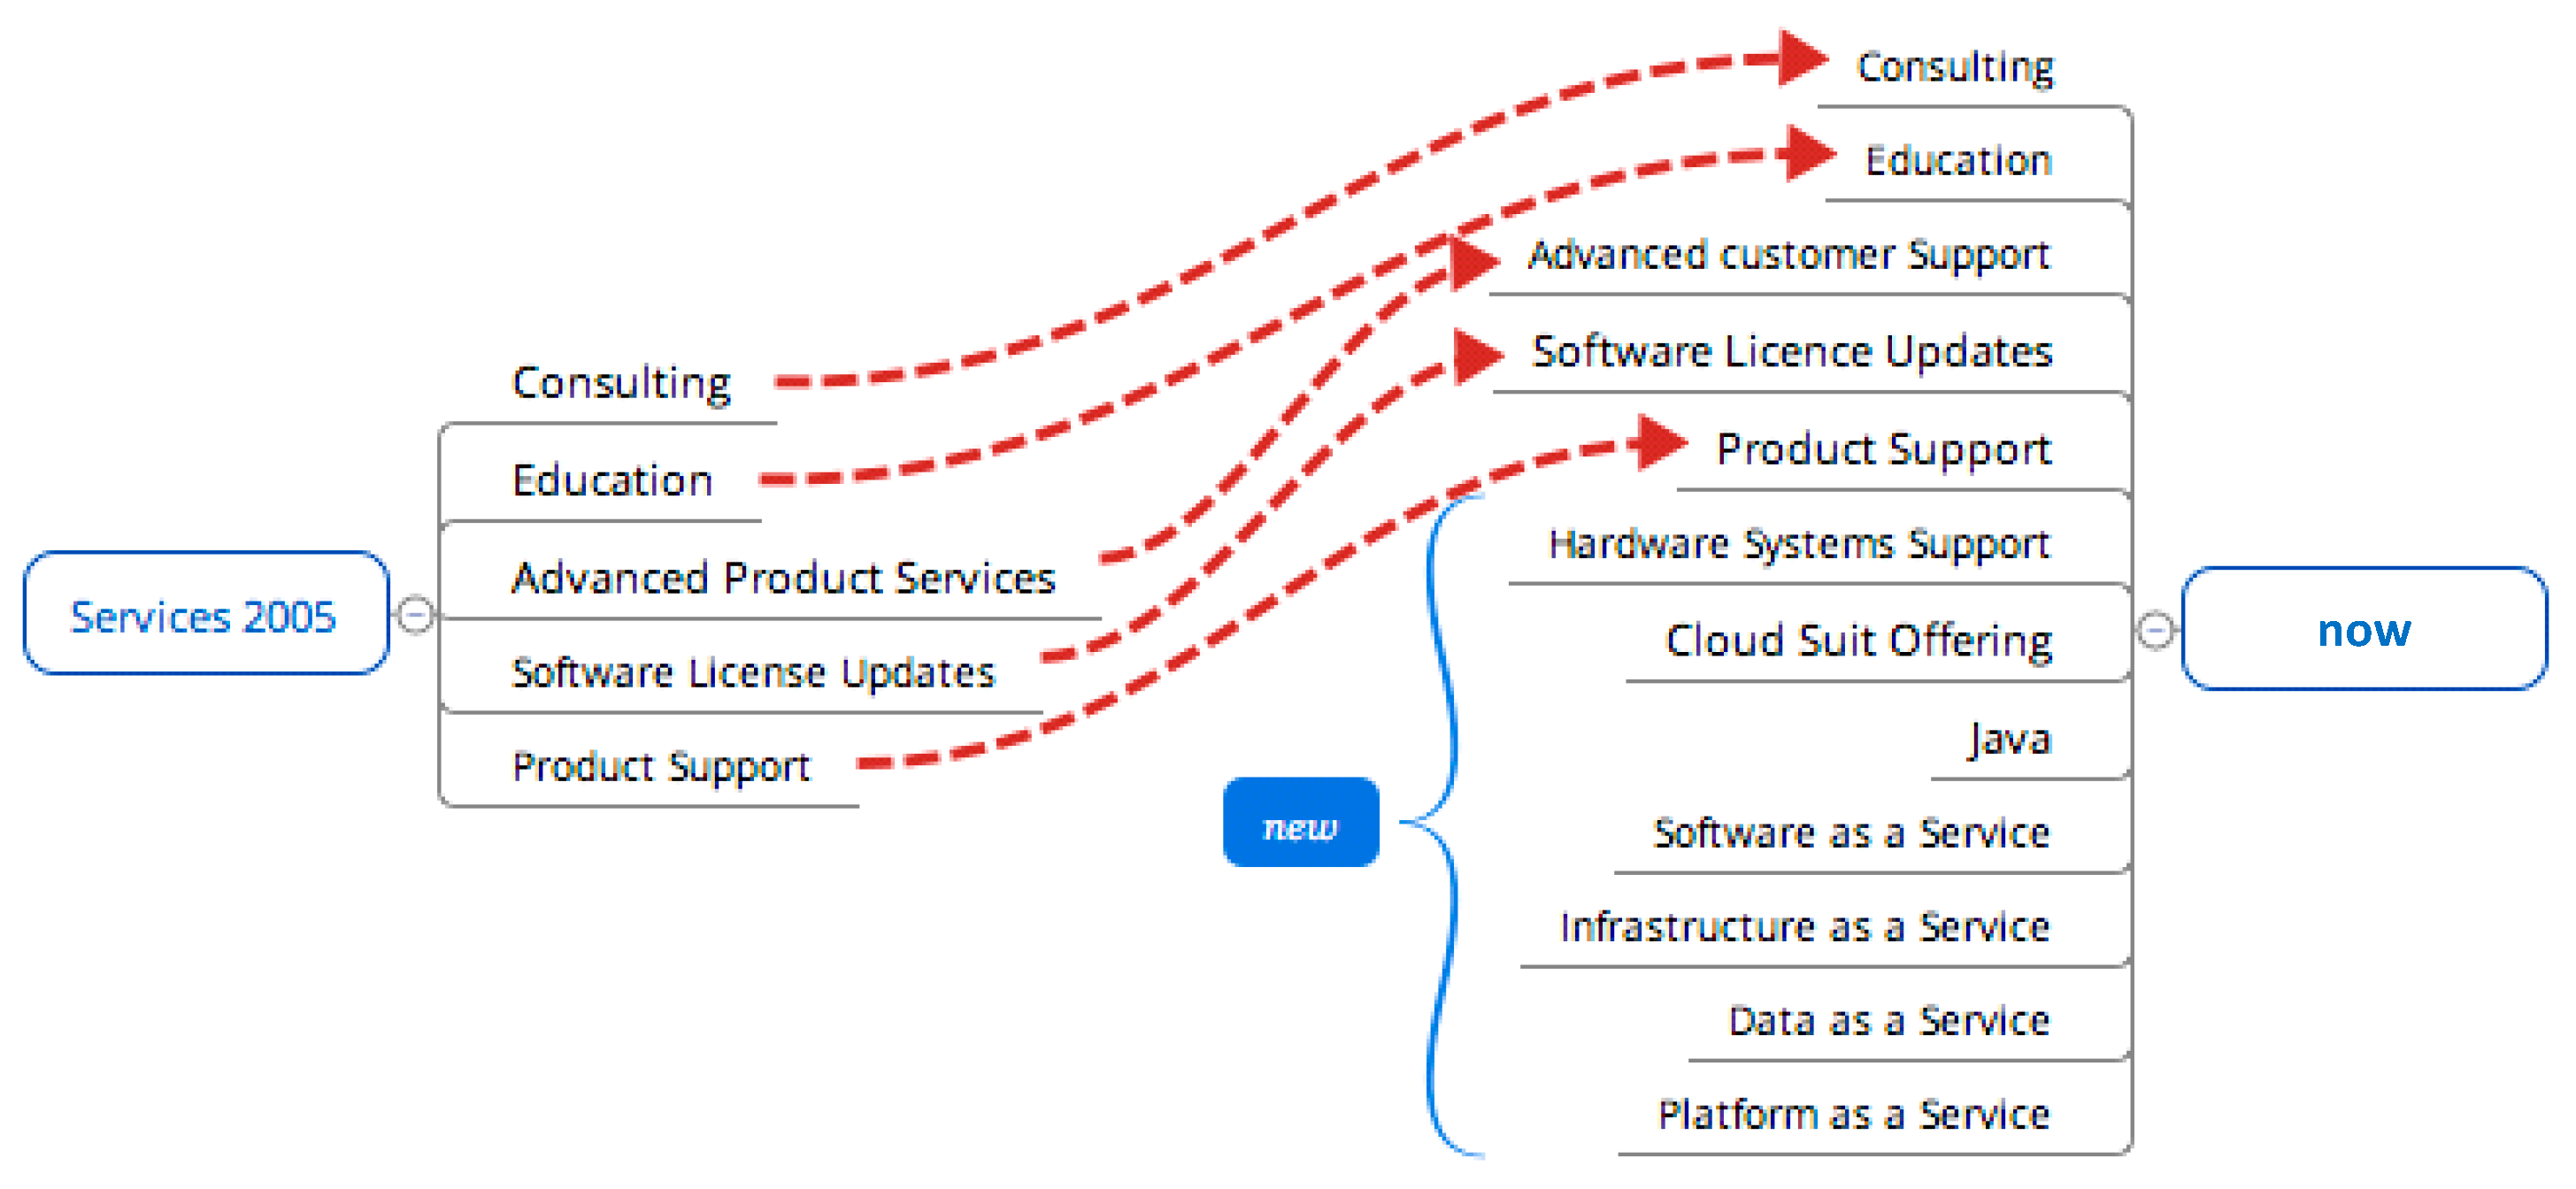
By 2005, Oracle was focusing on software products and services, as illustrated in Figure 26 [39,90,91,92,93,94,95,96,97,98,99,100,101]. They had one core software segment and four service segments. As a result of this core segment mix, Oracle was clustered as a product-oriented PSS, but as it had a positive business model and an organizational structure, it had to switch to a more service-oriented PSS. Over the decade, they added a hardware segment and a hardware support segment through the acquisition of Sun Microsystems and moved their segments towards a cloud-based orientation. Furthermore, Oracle integrated the separate service segments into an all-around service portfolio.
We present, in Figure 26, our examination of Oracle’s changes towards Servitization in the last decade, starting from 2005. The terms used in this figure are as follows: Advanced Product Services (APS), New Software Licenses (NSL), Software License Updates and Product Support (SLU and PS), Hardware System Support (HSS), Infrastructure as a Service (IAAS), New Software Licenses and Cloud Software (NCL&CS), Hardware Systems Group (HSG) [39,90,91,92,93,94,95,96,97,98,99,100,101].
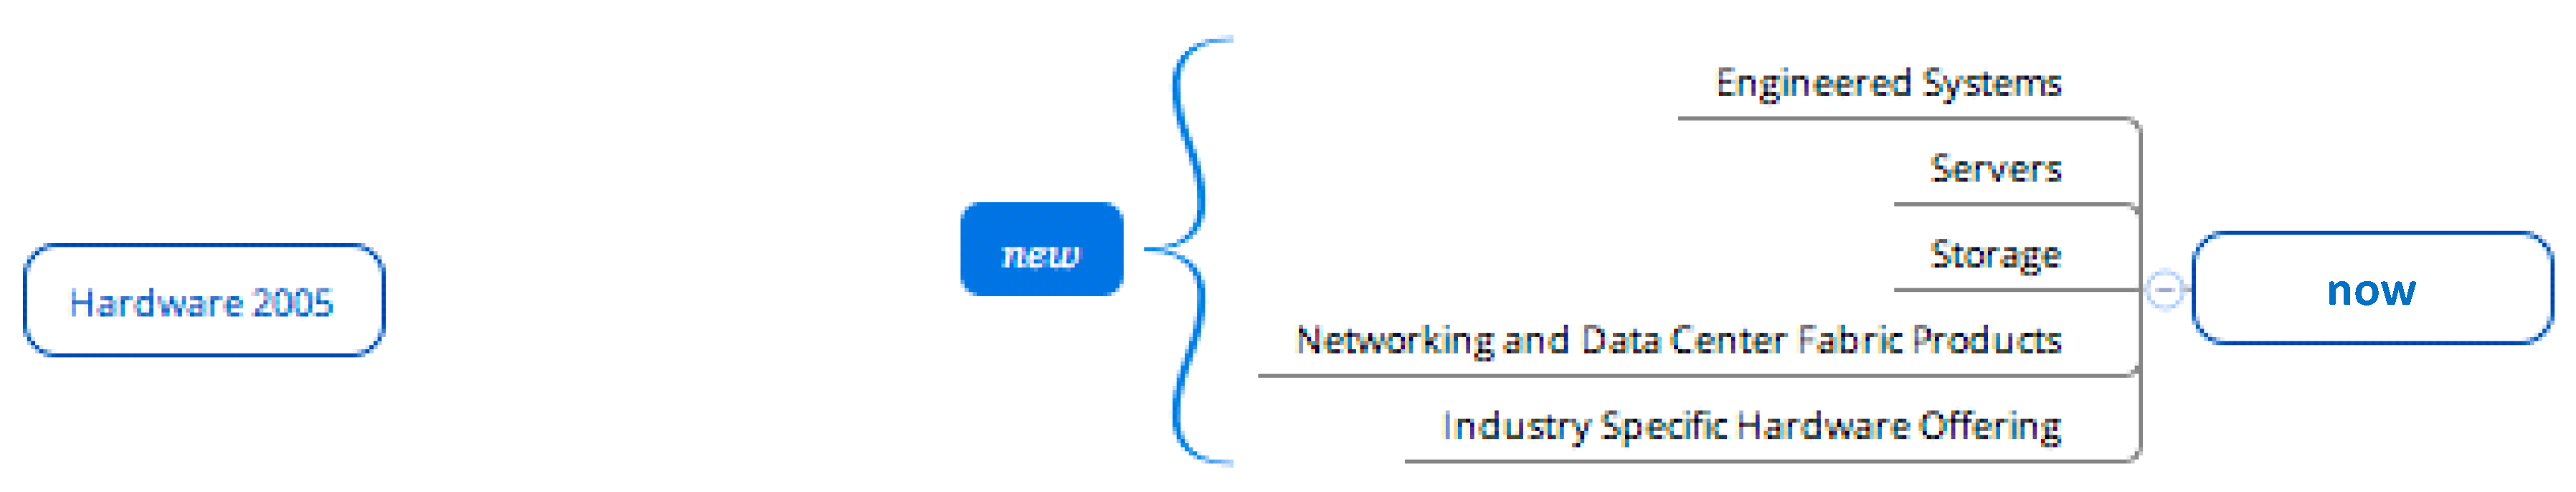
Oracle has increased its hardware offerings over the period analyzed. They have chosen to move towards a more customer-centric approach by delivering the storage hardware with complementary software to add to its value (Figure 27) [90,91,92,93,94,95,96,97,98,99,100,101].
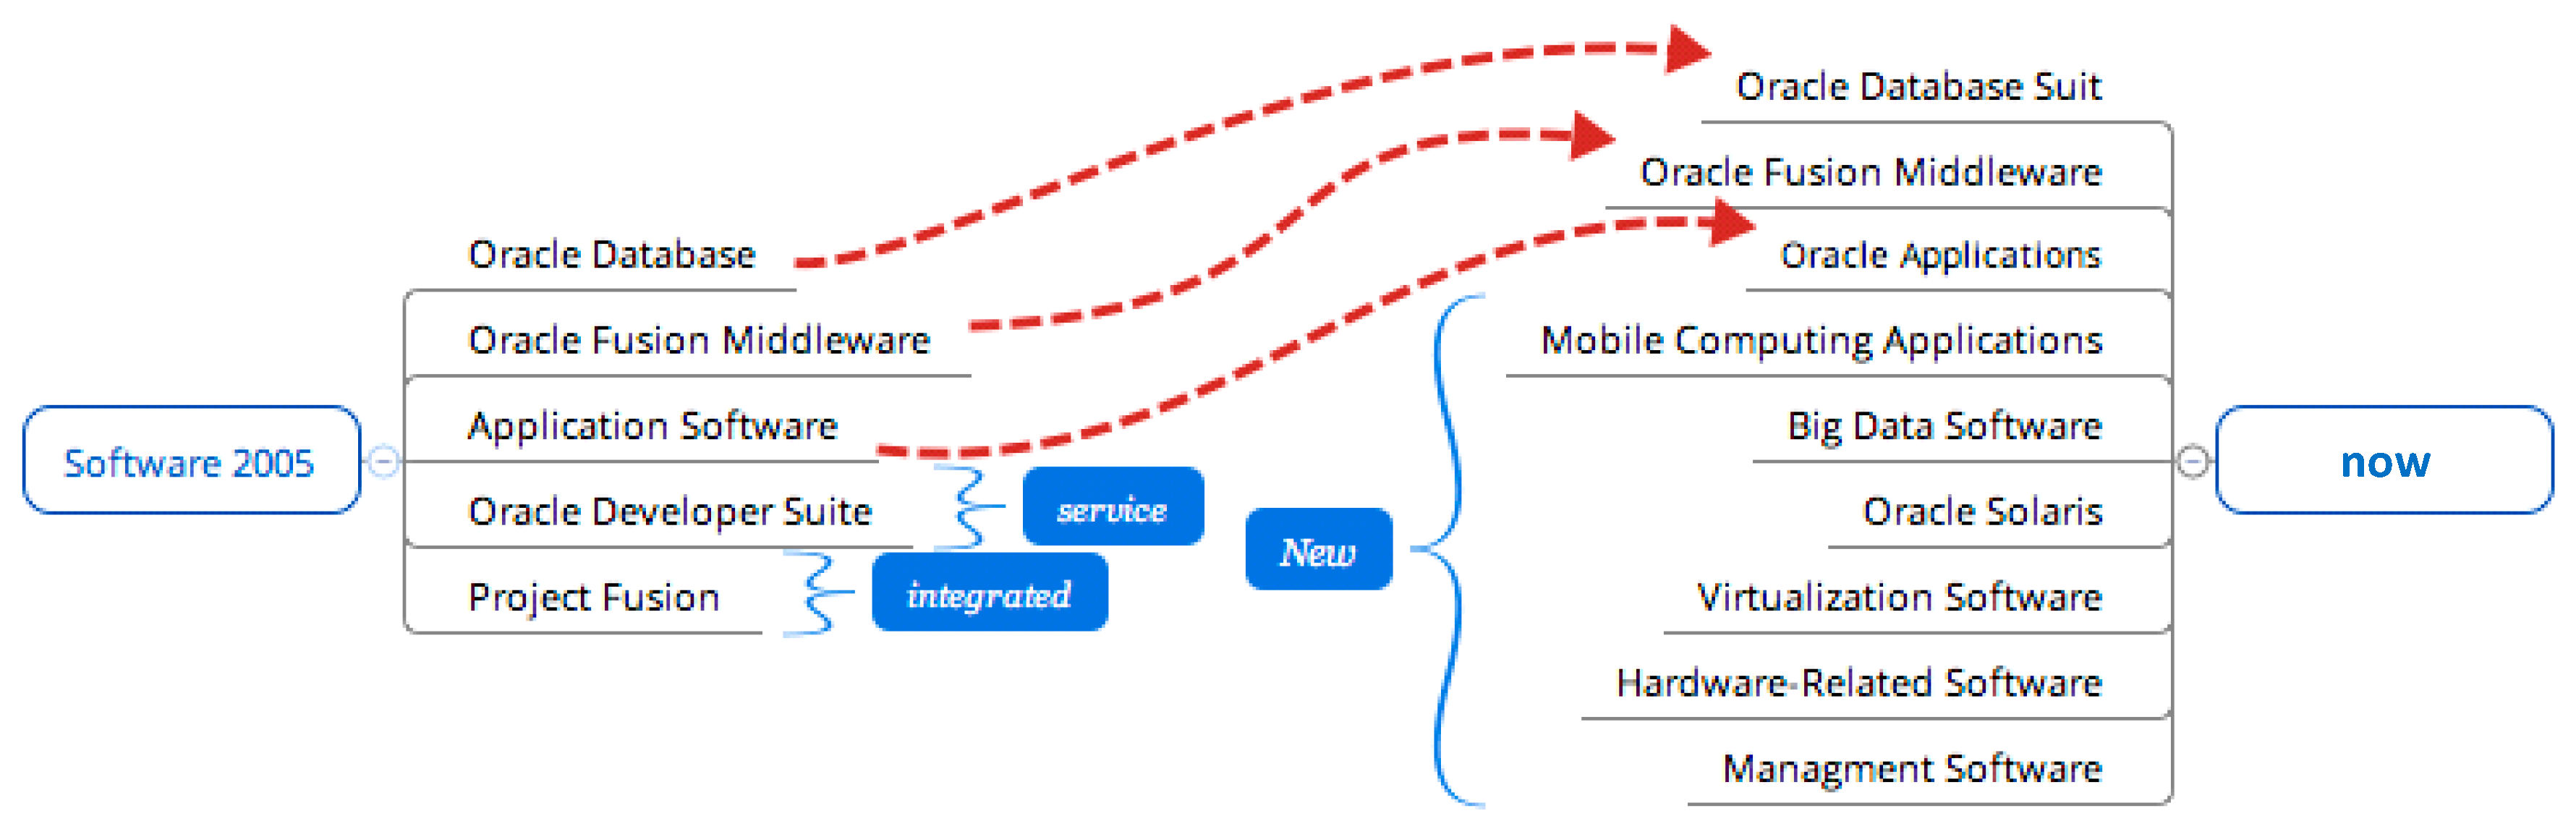
Oracle approached their software offering with the goal that every application must be available on every device that had their mobile computing applications. Furthermore, they added new software that increased the effectiveness of their core software products (Figure 28) [90,91,92,93,94,95,96,97,98,99,100,101].
The services were primarily changed in the researched timeframe, which contrasts with other business segments, as they have been switching their business model towards a user-oriented PSS, which is presented by the complex portfolio offerings of Infrastructure as a Service (IaaS), Data as a Service (DaaS), Platform as a Service (PaaS), and their core software as a cloud service (Figure 29) [90,91,92,93,94,95,96,97,98,99,100,101].
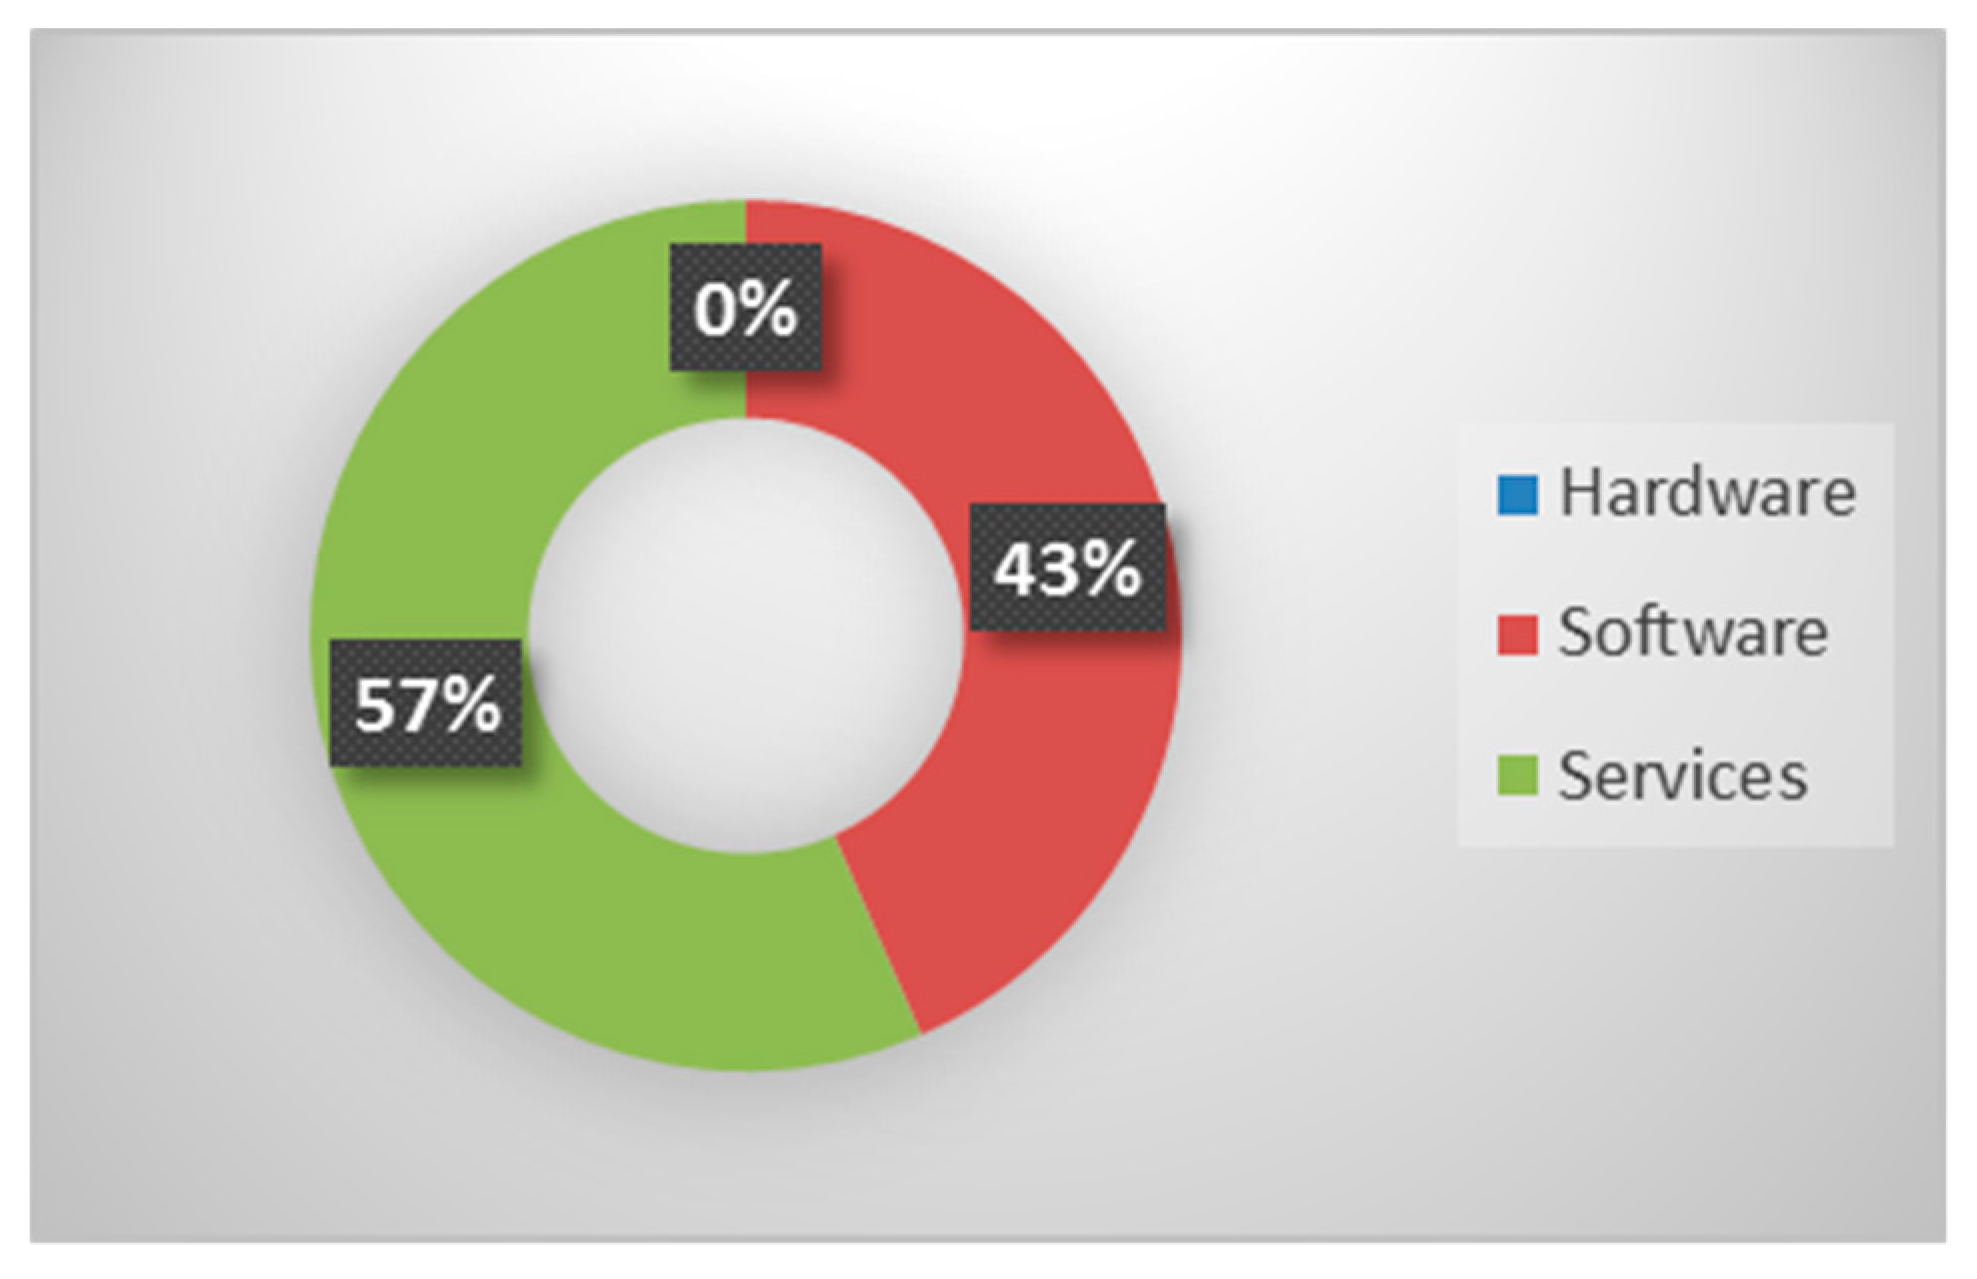
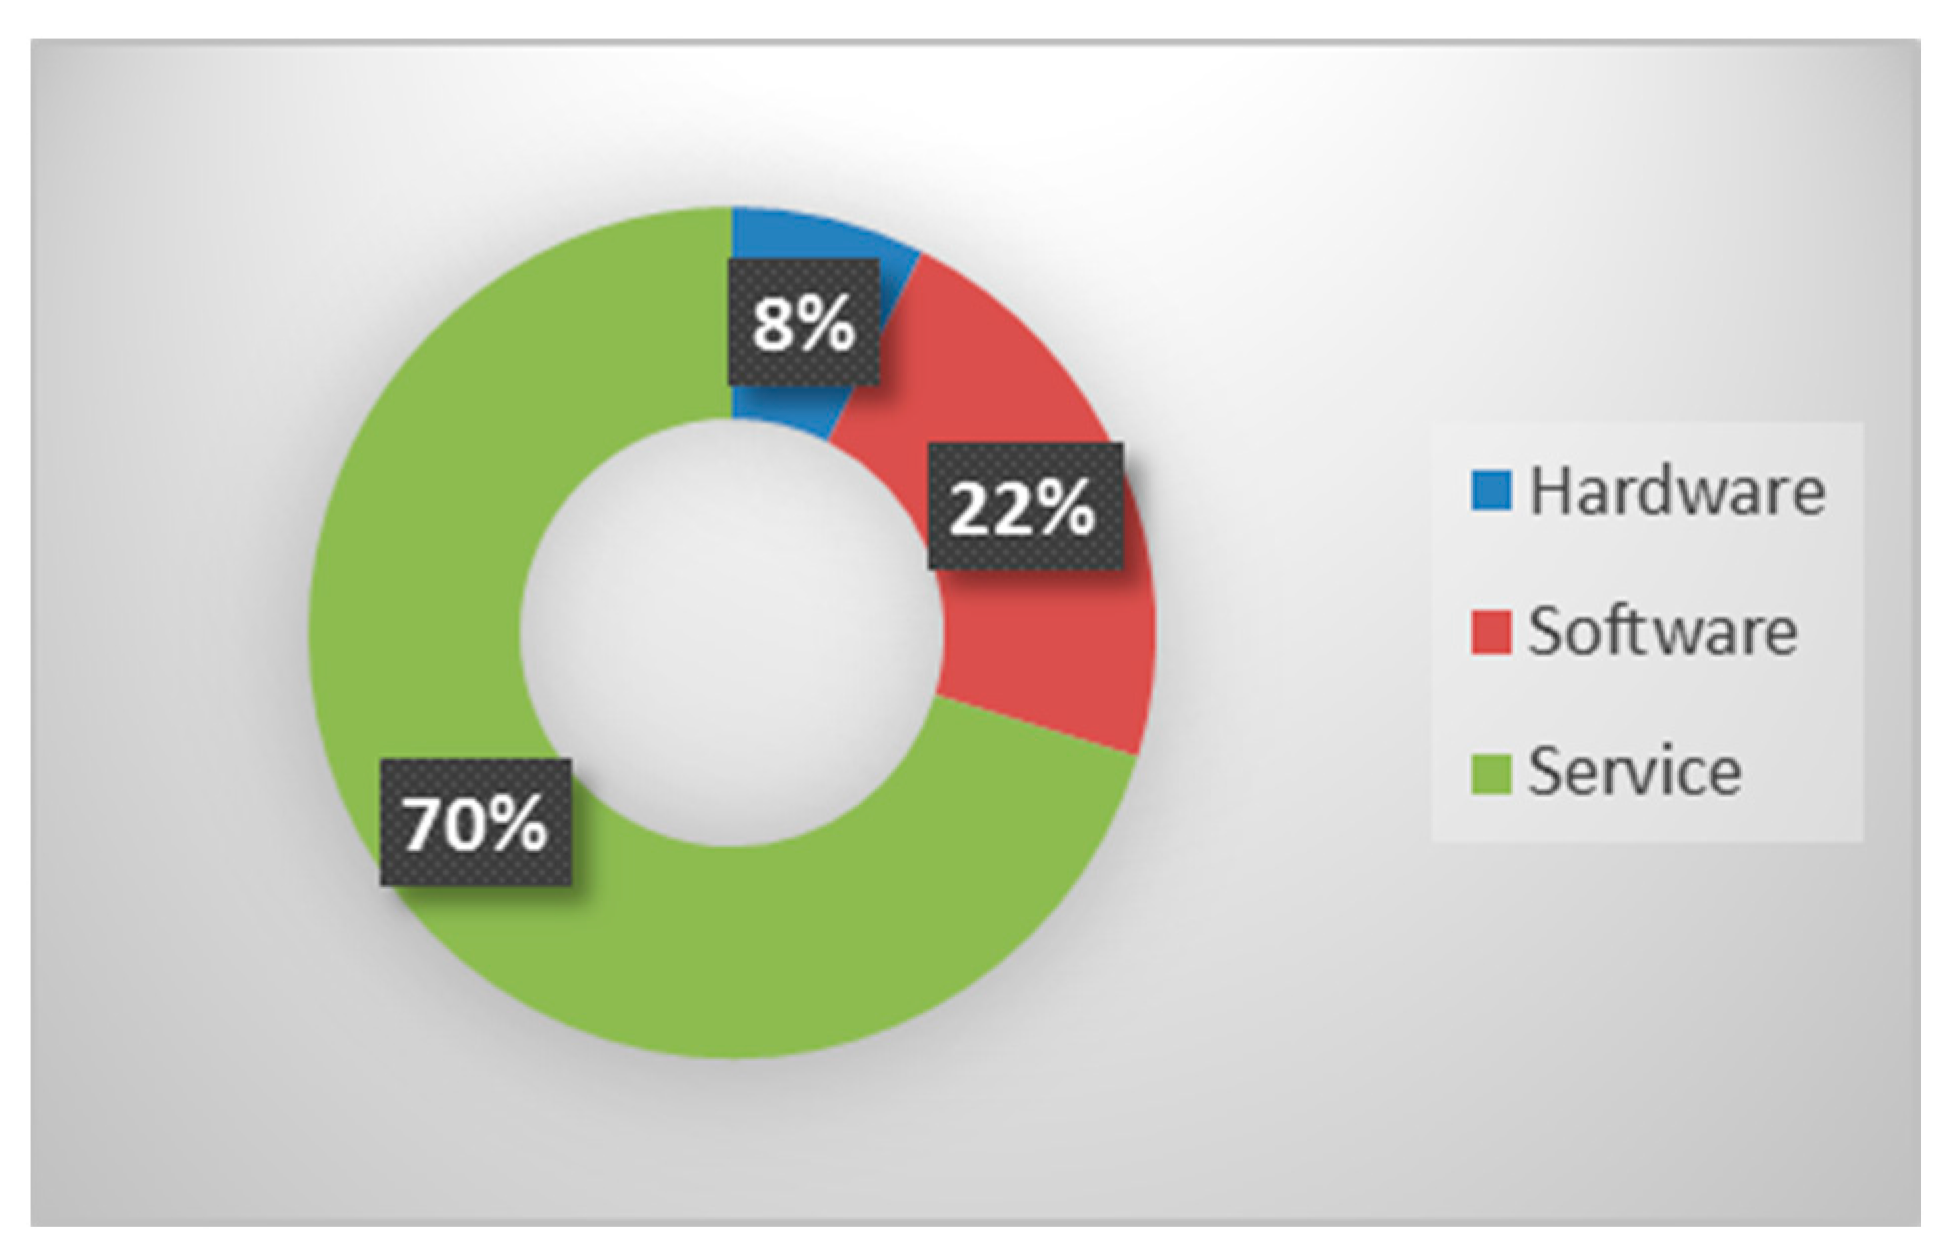
(2) Revenue Distribution
Oracle tripled their revenue over the decade and reached over 38 billion dollars (Figure 30 and Figure 31) of revenue [90,91,92,93,94,95,96,97,98,99,100,101]. This increase is partly due to the acquisition of the hardware business and the general trend of upselling software licenses. Furthermore, as illustrated in Figure 31, the service segment increased by 13 percent. This is the result of a more customer-centric approach and upselling software license updates and product support segments. Additionally, the trend towards cloud services, which were introduced in 2012, showed yearly growth rates above 30 percent.
(3) Transition Analysis—Challenges
Oracle was challenged with the integration of their acquisitions, which were designed towards a customer-centric business model, and with an integration of hardware products, as beforehand they only sold software products and services.
As well as this, they also had to promote and improve the interoperability of their software and hardware, while still producing software that was adaptable to the hardware of their competing hardware vendors.
Another challenging transition was the move towards the Cloud and other related service offerings, as this required a different approach to sales. Additionally, Oracle had to sell their software, while at the same time selling their Cloud services and maintaining revenue growth. This was difficult as Cloud revenue is generated over longer period of time.
Furthermore, Oracle was confronted with a higher demand of customer management, as the services are bound by contract length, and the importance of contract renewal increased.
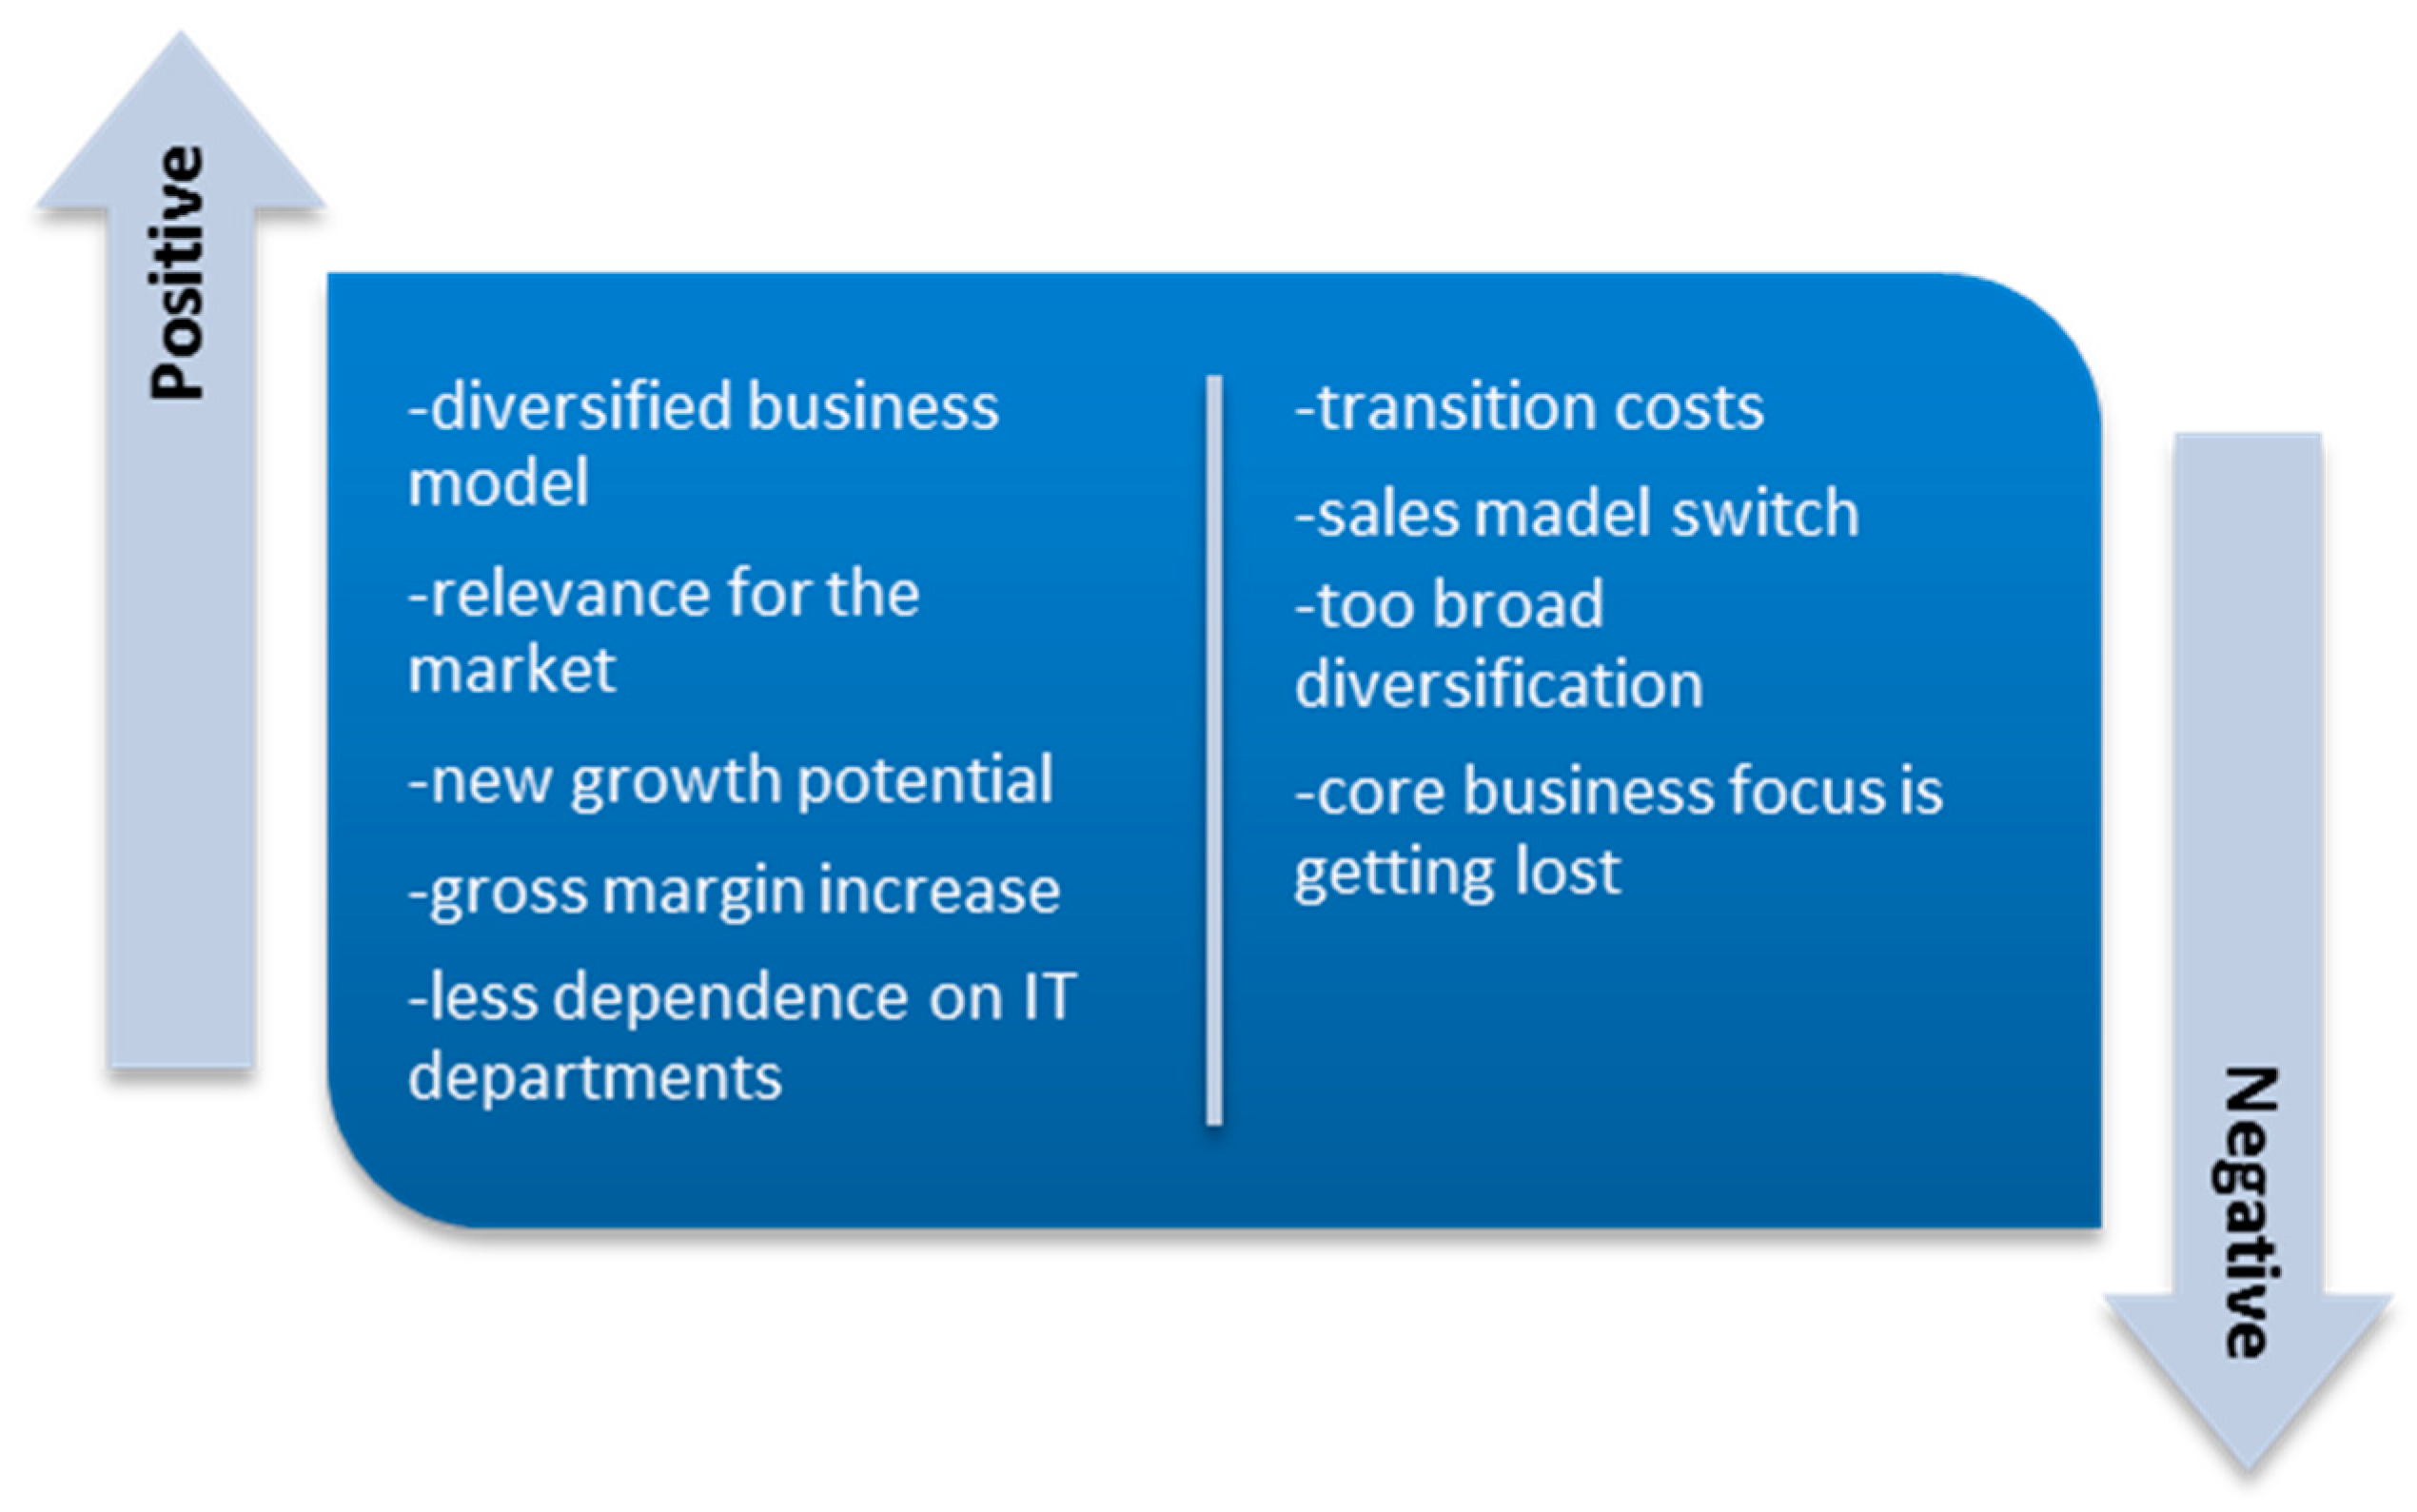
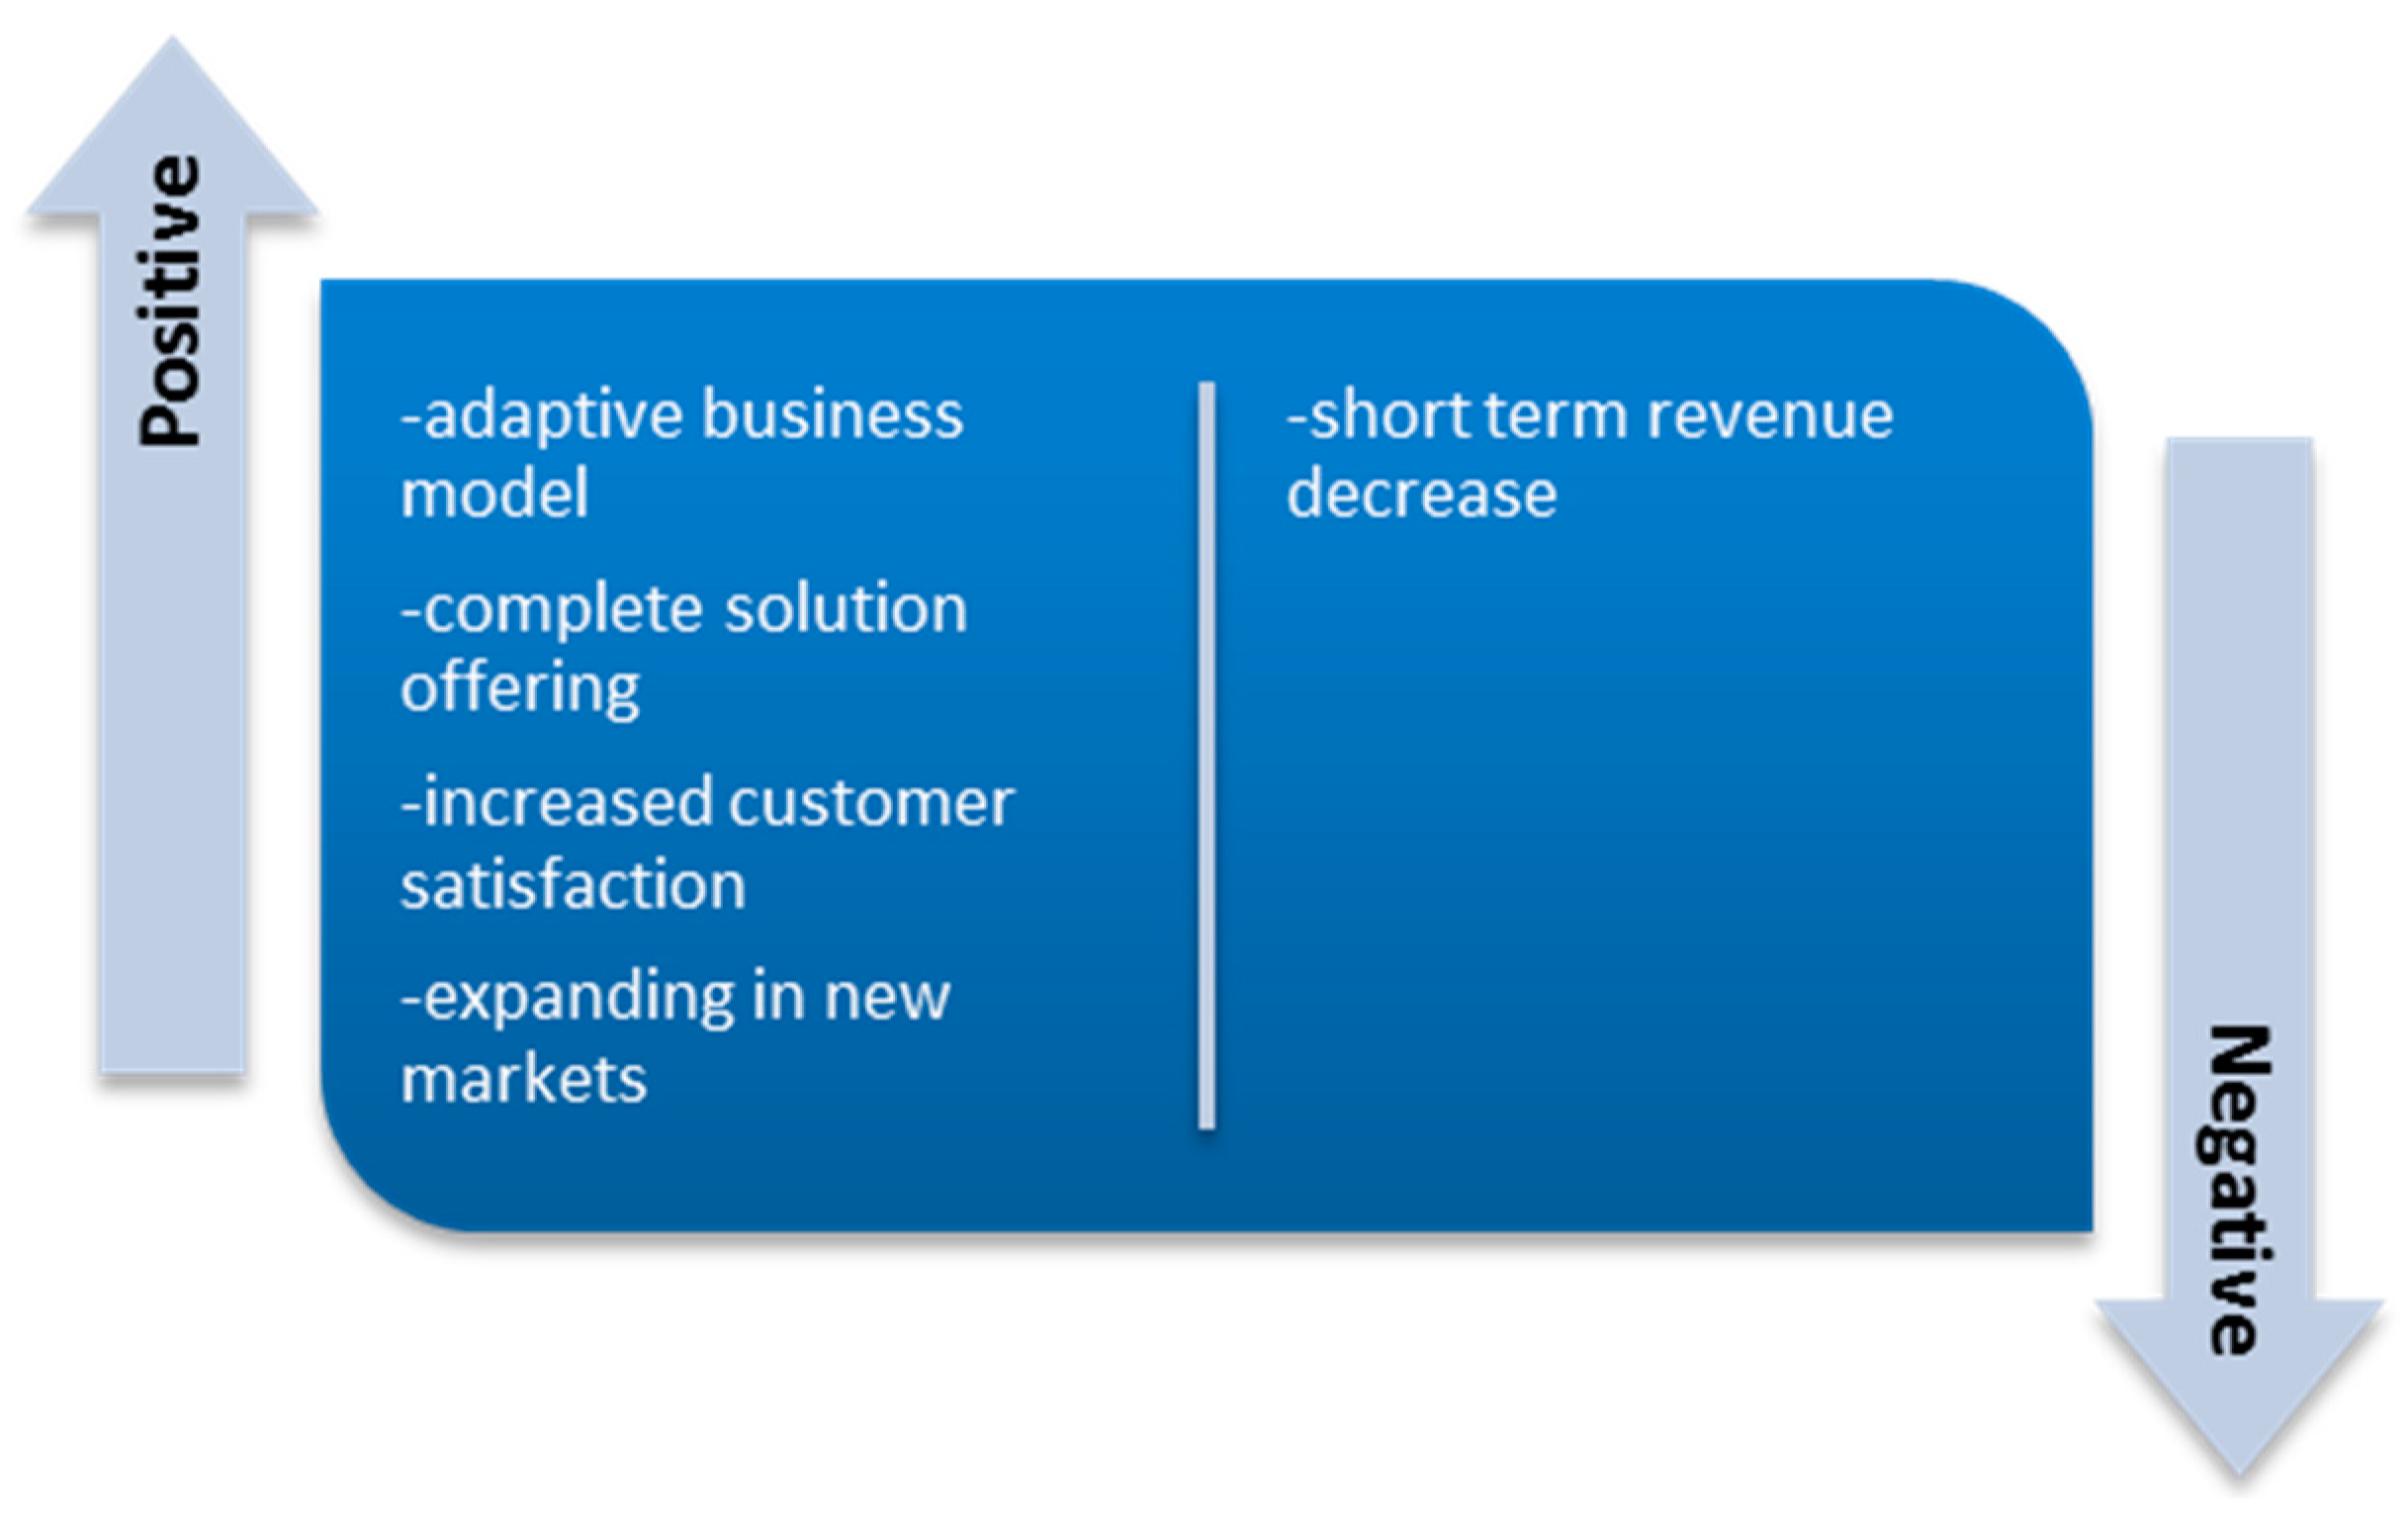
(4) Transition Analysis—Positive and Negative Effects
To conclude, in Figure 32 [90,91,92,93,94,95,96,97,98,99,100,101], the pros and cons of the transition are recorded and summarized.
Oracle gained positive effects from the transition in the long term but suffered a small setback in the short term.
3.5. Xerox Servitization Scenario
(1) Changes Assessment by Business Segment
In the analyzed period, Xerox started with four major segments, of which three were separated into customer segments and one was responsible for marketing and sales. In the last decade, these segments were combined into the document technology segment and two service segments that included business process outsourcing and document outsourcing. This process of moving from a previously service-oriented PSS towards a results-oriented PSS was the result of various acquisitions and an awareness of internal labor knowledge. Due to a diverging core business, Xerox filed for the separation of its businesses by the end of 2015.
Our examination of Xerox’s changes towards Servitization in the last decade, starting from 2005, is shown in Figure 33 [39,102,103,104,105,106,107,108,109,110,111,112,113].
The expressions used in this figure are as follows: Documents Management Office (DMO), Business Process Outsourcing (BPO), Document Outsourcing (DO), Document Technology (DT) [39,102,103,104,105,106,107,108,109,110,111,112,113].
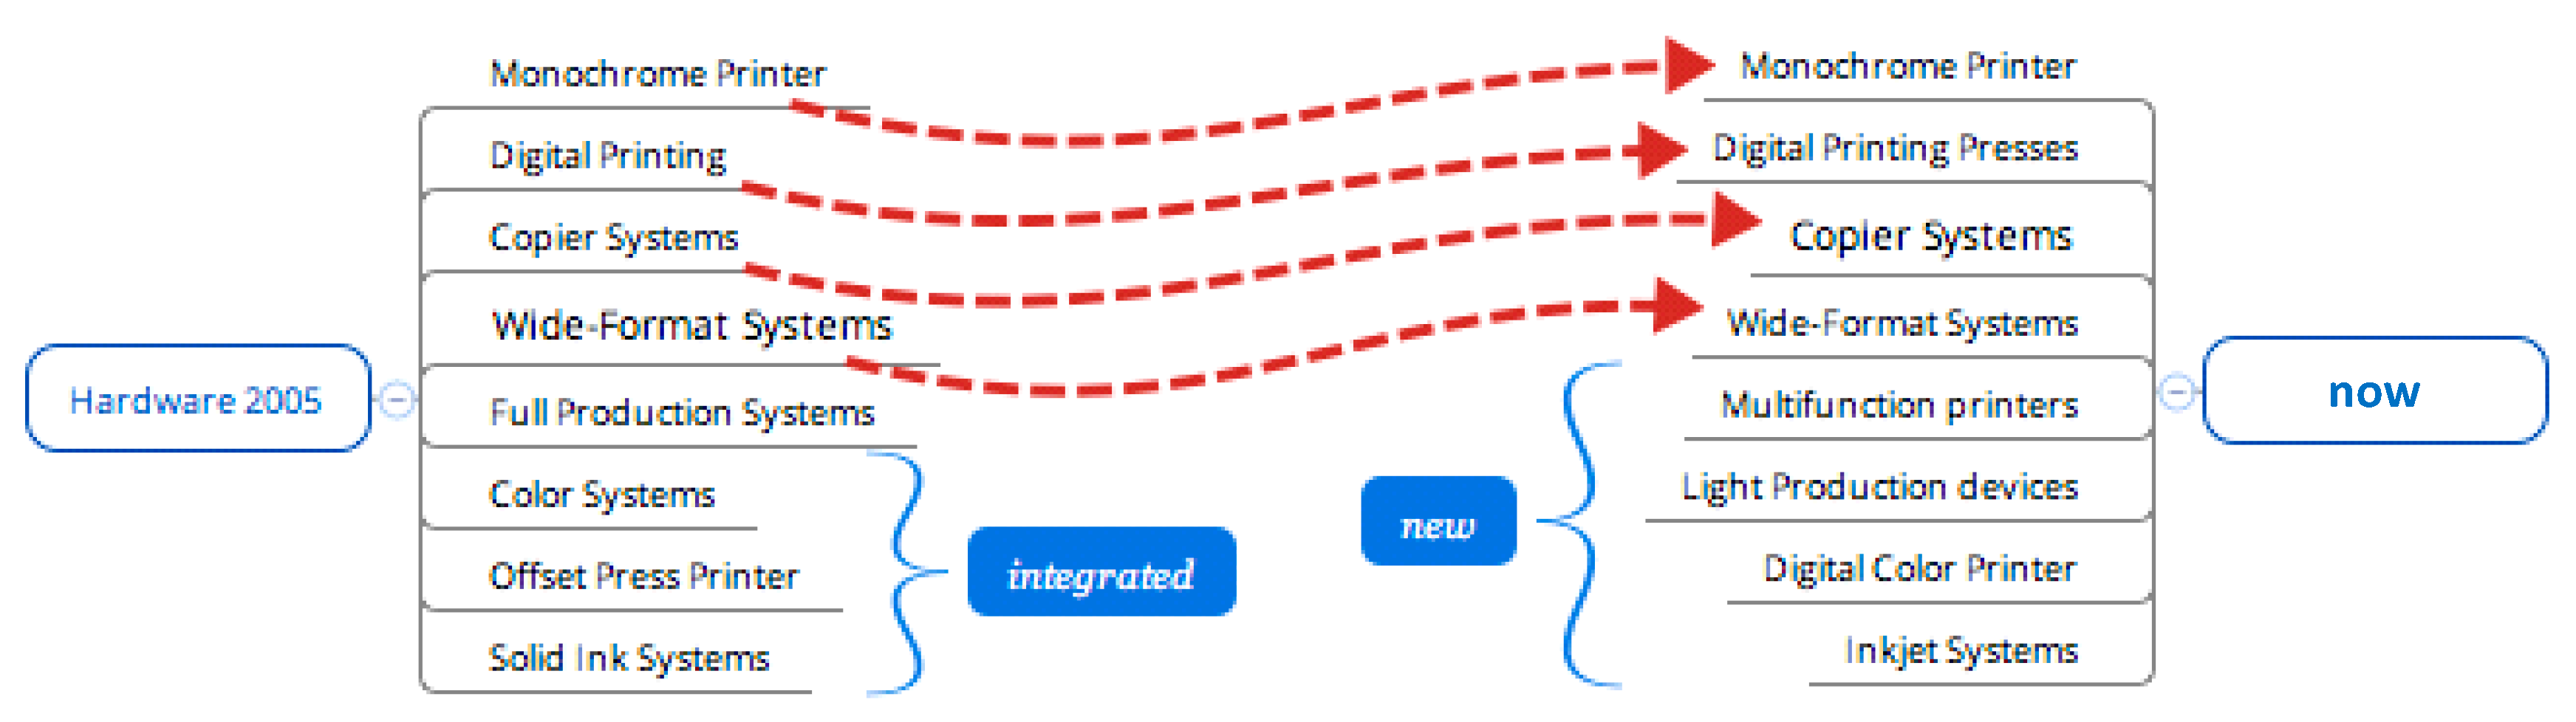
We examined Xerox major segments with regard to Servitization analysis (hardware, software, and services), and our results are shown in Figure 34, Figure 35 and Figure 36 [102,103,104,105,106,107,108,109,110,111,112,113].
Xerox did keep their hardware portfolio, as they were a key player in the document systems market. Furthermore, the sales of hardware were an essential part of their post-sales services’ revenue, which generated high profit margins. Additionally, they added new hardware based on the transformation of color systems and general printing systems.
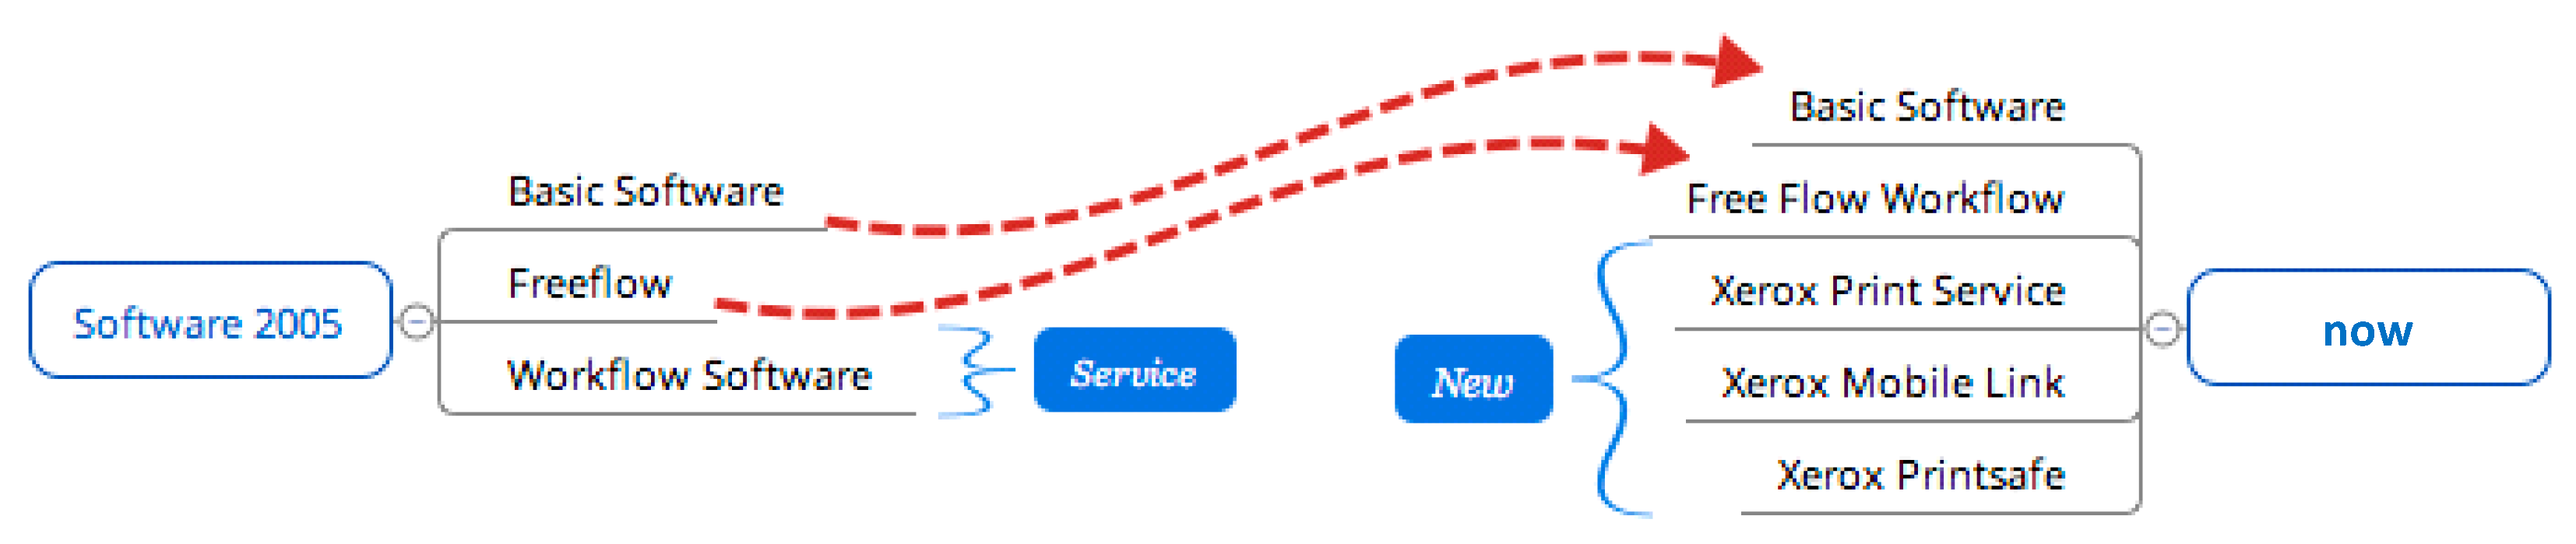
In the last, software was developed by Xerox but never actually sold. The software was mostly delivered with the hardware and supported the original product by improving effectiveness and efficiency.
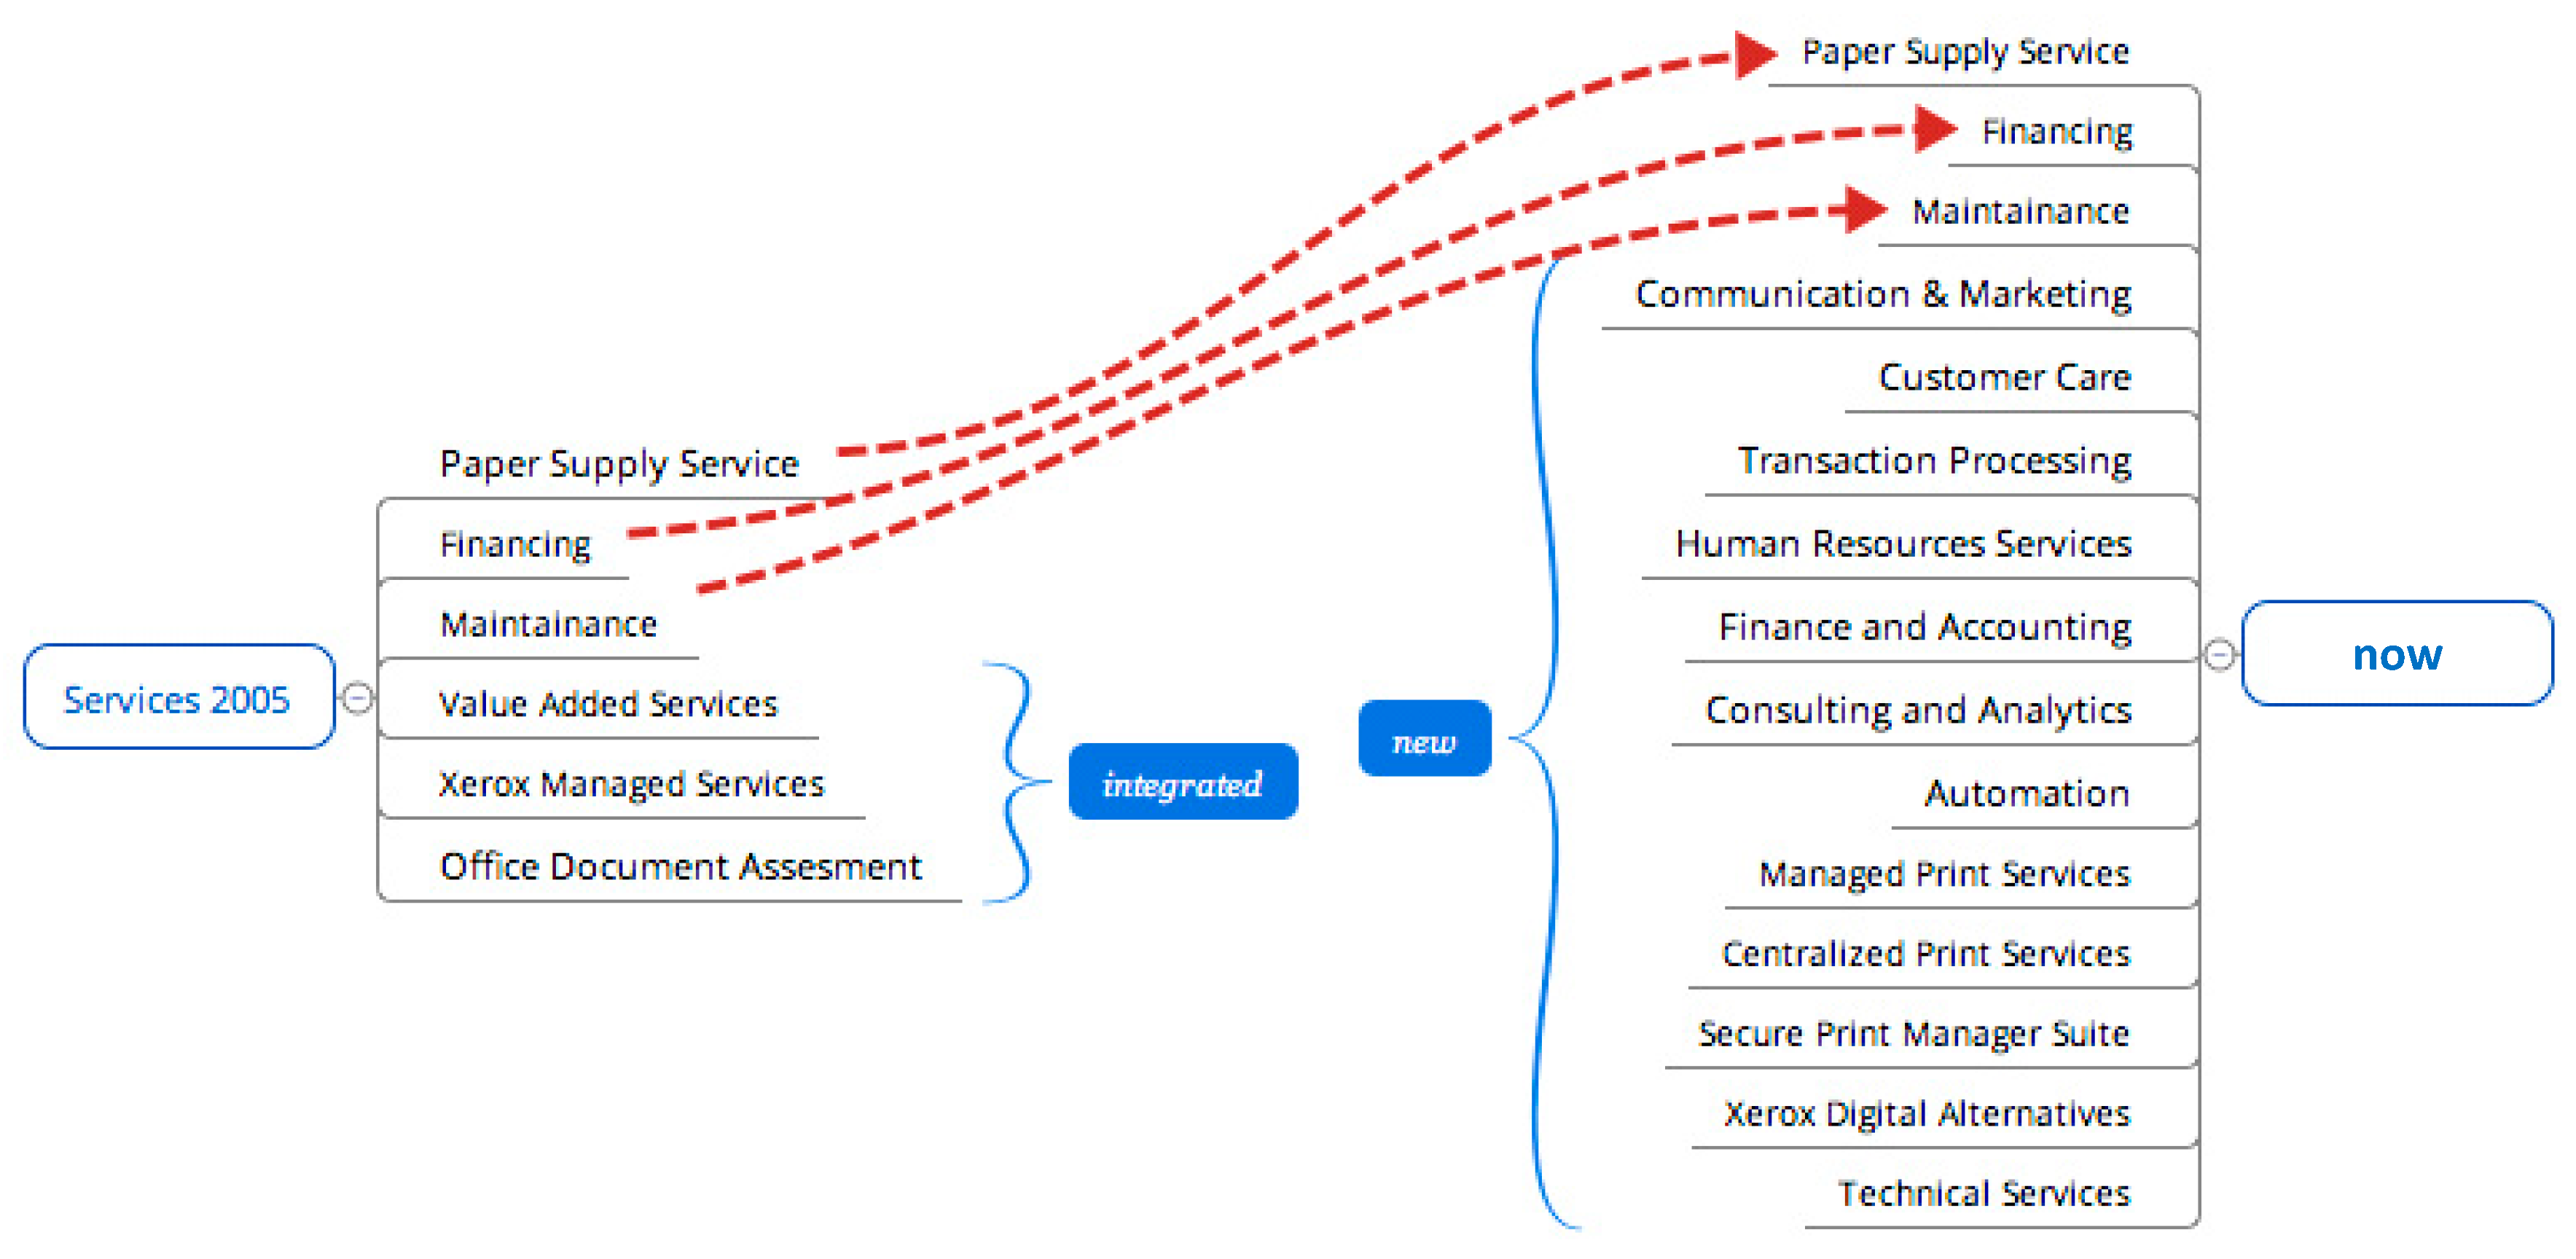
The biggest change over the transition period occurred in the services offered by Xerox, with the acquisition of ACS—a major business process outsourcing services corporation. Many of Xerox’s services are customer-centric and implemented as long-term delivery plans. Additionally, Xerox adapted their business strategy to the needs of customers in the document market by implementing various services for document outsourcing, such as managed print services for large enterprises or centralized print services for small and medium-sized companies.
(2) Revenue Distribution
In 2005, Xerox’s revenue was service-dominant, as most revenue was created by post-sales services and products (Figure 37) [102,103,104,105,106,107,108,109,110,111,112,113]. However, the organizational structure still depended on selling hardware and add-ons to the hardware. In 2015, the entire business model was diversified, and a major source of revenue began to come from delivering services and the decreasing importance of hardware related sales (Figure 38) [102,103,104,105,106,107,108,109,110,111,112,113].
(3) Transition Analysis—Challenges
Xerox had to be related to a changing environment in the document market as new systems, such as color and multifunctional printing systems, evolved. This challenged the research and development of the hardware and the general post-sales offer, which had to adapt to the evolving needs of customers.
The transition towards a results-oriented PSS included two major risks. The acquisition of ACS had a huge impact on the segments delivered and the business model executed. Furthermore, the trend of outsourcing document management in the market required Xerox to adapt their organizational structure and value-generating model.
Additionally, Xerox had to focus on the document market and on the global outsourcing market. These two markets were different in the beginning and this forced them to split their attention between two core businesses that did not complement each other.
(4) Transition Analysis—Positive and Negative Effects
Figure 39 [102,103,104,105,106,107,108,109,110,111,112,113] outlines the advantages and disadvantages Xerox may face due to Servitization.
As with every advanced strategy, there are positive and negative effects. The Servitization has affected Xerox both in how they do their core business and in how they attract current and potential customers.
3.6. General Evaluation of Servitization Similarities and Differences by Five Players
In this subsection, we summarize the common effects of Servitization on the five IT companies studied in this paper. We separate these effects into two aspects, reflecting the similarities and differences among the analyzed five cases. The similarities among all five cases are as follows [77,78,79,80,81,82,83,84,85,86,87,88,89,90,91,92,93,94,95,96,97,98,99,100,101,102,103,104,105,106,107,108,109,110,111,112,113]:
- Market Expansion—All analyzed companies attempted to enter new markets with higher growth potential or higher profit margins by adding services to their portfolios. The approach taken and the market entered depended on the fundamentals of their original core business;
- Transformation of core business—In the last decade, aside from HP, all companies transformed their core businesses, which were either hardware sales or software sales, towards a combination of sales and service delivery. The choice to add services to their core business or increase the importance of the service core business is evidence that Servitization is occurring in the IT industry. Additional evidence is that the growth rate of services has been increasing rapidly;
- Product as a Service—The major players started to offer their customers a new way to interact with them. Instead of buying the products and taking ownership of them, this new method consisted of, depending on the fundamentals of the business, either the rental of the products, as in the cases of IBM, HP and Xerox, or the licensing of/subscribing to the products, as in the cases of Microsoft and Oracle;
- Key Knowledge consulting—Four of the five cases created a new revenue stream, which was generated by offering their accumulated business knowledge to their business model. IBM and HP offered their knowledge of IT infrastructure and helped optimize costs for their customers. Oracle started consultations based on their vast knowledge of data management and the increase in big data analytics;
- Acquisition Integration Challenge—Major switches in business segments were usually triggered by large acquisitions by the companies analyzed. These acquisitions often required a rethinking of the business models of the companies and a long internal integration processes to improve customer satisfaction and return profits.
- Change of PSS—Invariably there was a visible change in their orientation towards a more service dominant PSS. Most companies started with a product-oriented PSS and switched to a use-oriented PSS. In several cases, they took it a step further, to a results-oriented PSS, which is mostly performed by the companies whose foundation was in hardware.
In comparison to the similarities, there are fewer differences for all five cases. However, they are important to mention [77,78,79,80,81,82,83,84,85,86,87,88,89,90,91,92,93,94,95,96,97,98,99,100,101,102,103,104,105,106,107,108,109,110,111,112,113]:
- Separation and Integration—One of the key differences is in the approach companies took towards Servitization. Hardware IT companies first diversified their portfolio with services and then started to separate or disinvest certain product lines to strengthen their new core businesses. Software IT companies previously had a strong mix of software and services and diversified their businesses to include some hardware, to increase their interaction with customers and the synergies of their all-round solutions;
- Cloud Services—Another difference was in the approach to cloud services. Three of the five companies included cloud services as a major segment with growth potential. Notably, Microsoft and Oracle integrated cloud services as the future of their business strategy. IBM integrated cloud services as support and a possible future trend to aid their customers in going digital.
In this subsection, primary Servitization aspects and the choices made by major IT players are discussed as an introduction to possible debates and further research, to help IT enterprises solve various problems and to make the Servitization process smoother.
4. Conclusions
The Servitization transition encompasses alterations to business logic and resource usage, as well as companies’ structural design and their business processes’ performance. Thus, it should be considered a strategic choice to boost competitiveness through product differentiation in service marketplaces.
Furthermore, Servitization tends to increase when a transition involves various industries. This increase, in turn, stimulates continuous changes. Accordingly, consideration of the transition is important for accurate enterprise resource planning and overall business success. However, Servitization studies have been primarily conceptual. Thus, practical research is needed to examine the challenges of real-world companies. To obtain a better understanding of this process/transition in the IT industry, five major players were analyzed in this paper. Based on a foundation of essential definitions and concepts about Servitization, every major player was analyzed by the business segments in which they operate. Then, these business segments were broken down by their offerings—what they delivered to the customers. Depending on the offering, an analysis of the revenue was done. In the last step, the challenges and effects which occurred over the transition were discussed and summarized. After analyzing every major player selected, a comparison and contrast between the cases was performed, and important similarities and differences were highlighted.
To gain an even deeper understanding of Servitization, further analyses must be performed in the IT industry. It is necessary to specify the overall trends and aggregate a possible model, which could be used to support transformation processes. Another option would be that other industries are analyzed based on the same basic key indicators. This, in turn, could provide metadata to support established models or provide direction for the creation of new models.
Author Contributions
Conceptualization, N.K. and L.B.; methodology, N.K. and L.B.; formal analysis, N.K. and L.B.; investigation, L.B.; resources, L.B.; writing—original draft preparation, N.K. and L.B.; supervision, N.K. All authors have read and agreed to the published version of the manuscript.
Funding
This research received no external funding.
Conflicts of Interest
The authors declare no conflict of interest.
References
- Digitalization will Transform the Global Economy-Policy Briefs-IIASA. Available online: http://www.iiasa.ac.at/web/home/resources/publications/IIASAPolicyBriefs/pb20.html (accessed on 26 January 2019).
- Gada, K. The Digital Economy In 5 Minutes. Forbes. Available online: https://www.forbes.com/sites/koshagada/2016/06/16/what-is-the-digital-economy/ (accessed on 26 January 2019).
- The MIT Initiative on the Digital Economy (IDE), MIT Sloan School of Management. A Year of Impact—2018 in Review. Available online: http://ide.mit.edu/sites/default/files/MIT2018report-final-digital_0.pdf (accessed on 26 January 2019).
- Bukht, R.; Heeks, R. Defining, Conceptualising and Measuring the Digital Economy. Working Paper Series Development Informatics, Developed as Part of DIODE: The Development Implications of Digital Economies Strategic Research Network; UK’s Economic and Social Research Council: Swindon, UK, 2017. [Google Scholar]
- Kryvinska, N.; Kaczor, S.; Strauss, C.; Gregus, M. Servitization Strategies and Product-Service-Systems. In Proceedings of the 2014 IEEE World Congress on Services, Anchorage, AK, USA, 27 June–2 July 2014; pp. 254–260. [Google Scholar]
- Bickel, L.; Kryvinska, N. Comparative Analysis of Two Operational Developments within IT Companies’ Servitization—Microsoft and HP. In Proceedings of the 2017 IEEE 5th International Conference on Future 751 Internet of Things and Cloud (FiCloud), Prague, Czech Republic, 21–23 August 2017; pp. 249–256. [Google Scholar]
- Bickel, L.; Kryvinska, N. IBM Case Analysis by Servitization in IT Industry. In Advances in Intelligent Networking and Collaborative Systems (INCoS); Springer: Berlin/Heidelberg, Germany, 2017; pp. 380–388. [Google Scholar]
- Bickel, L.; Kryvinska, N. Servitization Transition in IT Industry—An IBM Scenario Analysis. In Proceedings of the 5th International Conference on Serviceology (ICServ2017), Vienna, Austria, 12–14 July 2017; pp. 295–298. [Google Scholar]
- Kaczor, S.; Kryvinska, N. It is all about Services-Fundamentals, Drivers, and Business Models. Soc. Serv. Sci. J. Serv. Sci. Res. 2013, 5, 125–154. [Google Scholar] [CrossRef]
- Kaczor, S.; Kryvinska, N.; Strauss, C. Pitfalls in Servitization and Managerial Implications. In Proceedings of the Global Conference on Services Management (GLOSERV 2017), Volterra, Tuscany, Italy, 3–7 October 2017; pp. 115–119. [Google Scholar]
- Kryvinska, N.; Kaczor, S.; Strauss, C.; Greguš, M. Servitization-Transition from Manufacturer to Service Provider In the Service Dominant Logic, Network and Systems Theory and Service Science: Integrating three Perspectives for a New Service Agenda. In Proceedings of the Naples Forum on Service 2015, Naples, Italy, 9–12 June 2015. [Google Scholar]
- Kryvinska, N.; Strauss, C.; Kaczor, S. A Scientometric Analysis of Back-end and Front-end Solutions for the Challenges on Enterprises’ Servitization in Digital Era. Comput. Ind. Eng. under review.
- Avlonitis, V.; Frandsen, T.; Hsuan, J.; Karlsson, C. Driving Competitiveness Through Servitization—A Guide for Practitioners. In The CBS Competitiveness Platform, 1st ed.; Copenhagen Business School: Frederiksberg, Denmark, 2014; ISBN 978-87-93226-03-6. [Google Scholar]
- Marks, F.; Ramselaar, L.; Mulder, J.; Muller, H.; Langkamp, S.; Boymans, C. Seeing Things Differently-Servitization in product companies, Creating business value beyond products. In White Paper; Atos Consulting: Bezon, France, 2011. [Google Scholar]
- RapidBI. Critical Success Factors CSF—Analysis. 12 May 2016. Available online: https://rapidbi.com/criticalsuccessfactors/ (accessed on 26 January 2019).
- Rockart, J.F. Chief executives define their own data needs. Harv. Bus. Rev. 1979, 57, 81–93. [Google Scholar] [PubMed]
- Daniel, D.R. Management Information Crisis. Harv. Bus. Rev. 1961, 39, 111–121. [Google Scholar]
- Le Breton, P.P. The Case Study Method and the Establishment of Standards of Efficiency. Acad. Manag. Proc. 1956, 103–104. [Google Scholar] [CrossRef]
- Kreye, M.E.; Jensen, P.L. Key variables of organisation design in servitization. In Proceedings of the 21st International EurOMA Conference European Operations Management Association, Palermo, Italy, 20–25 June 2014. [Google Scholar]
- Martinez, V.; Neely, A.; Urmetzer, F. Seven Critical Success Factors in the Shift to Services. p. 16. Available online: https://www.ifm.eng.cam.ac.uk/insights/servitization/619454seven-critical-success-factors-in-the-shift-to-services/ (accessed on 26 January 2019).
- Servadio, L.; Nordin, F. Critical issues during servitization: An in-depth case study. In Proceedings of the AMA Servsig, International Service Research Conference, Hanken School of Economics, Helsinki, Finland, 7–9 June 2012. [Google Scholar]
- Oláh, J.; Popp, J.; Máté, D. An Examination of Servitization as a Breakthrough Success Factor Along The Supply Chain. SEA-Pract. Appl. Sci. 2017, 15, 373–379. [Google Scholar]
- Smith, A. Wealth of Nations; Library of Economics and Liberty: Indianapolis, IN, USA, 1766; Available online: http://www.econlib.org/library/Smith/smWN.html (accessed on 18 January 2019).
- Parry, G.; Newnes, L.; Huang, X. Goods, Products and Services. In Service Design and Delivery; Springer: Boston, MA, USA, 2011; pp. 19–29. [Google Scholar]
- Gronroos, C. Service Management and Marketing: Customer Management in Service Competition, 3rd ed.; Wiley: Hoboken, NJ, USA, 2007. [Google Scholar]
- Moeller, S. Characteristics of services—A new approach uncovers their value. J. Serv. Mark. 2010, 24, 359–368. [Google Scholar] [CrossRef]
- Shostack, G.L. Breaking Free from Product Marketing. J. Mark. 1977, 41, 73–80. [Google Scholar] [CrossRef]
- Lovelock, C.; Gummesson, E. Whither Services Marketing? In Search of a New Paradigm and Fresh Perspectives. J. Serv. Res. 2004, 7, 20–41. [Google Scholar] [CrossRef] [Green Version]
- Edvardsson, B. Service quality: Beyond cognitive assessment. Manag. Serv. Qual. Int. J. 2005, 15, 127–131. [Google Scholar] [CrossRef]
- Pernul, G. Trust for Digital Products. In Computer Vision—ECCV 2012; Springer: Berlin/Heidelberg, Germany, 2003; pp. 1–5. [Google Scholar]
- Hill, P. Tangibles, Intangibles and Services: A New Taxonomy for the Classification of Output. Can. J. Econ. Rev. Can. Econ. 1999, 32, 426–446. [Google Scholar] [CrossRef]
- Vandermerwe, S.; Rada, J. Servitization of business: Adding value by adding services. Eur. Manag. J. 1988, 6, 314–324. [Google Scholar] [CrossRef]
- Vandermerwe, S.; Matthews, W.; Rada, J. European Manufacturers Shape Up for Services. J. Bus. Strategy 1989, 10, 42–46. [Google Scholar] [CrossRef]
- Wise, R.; Baumgartner, P. Go Downstream: The New Profit Imperative in Manufacturing. Harvard Bus. Rev. 1999. Available online: https://hbr.org/1999/09/go-downstream-the-new-profit-imperative-in-manufacturing (accessed on 21 January 2019).
- Lay, G. Servitization in Industry; Springer: Berlin/Heidelberg, Germany, 2014. [Google Scholar]
- Baines, T.S.; Lightfoot, H.W.; Benedettini, O.; Kay, J.M. The servitization of manufacturing: A review of literature and reflection on future challenges. J. Manuf. Technol. Manag. 2009, 20, 547–567. [Google Scholar] [CrossRef] [Green Version]
- Vandermerwe, S. The market power is in the services: Because the value is in the results. Eur. Manag. J. 1990, 8, 464–473. [Google Scholar] [CrossRef]
- Festo Corp. Customer Specific Solutions; Festo: Esslingen, Germany, 2008; Available online: https://www.festo.com/rep/en-ca_ca/assets/Customer_Solutions_Brochure.pdf (accessed on 10 January 2019).
- McKinsey. Solution Selling—Is the Pain wort the Gain? McKinsey & Company: New York, NY, USA, 2003; Volume 4. [Google Scholar]
- Stremersch, S.; Tellis, G.J. Strategic Bundling of Products and Prices: A New Synthesis for Marketing. J. Mark. 2002, 66, 55–72. [Google Scholar] [CrossRef] [Green Version]
- Davies, A.; Brady, T.; Hobday, M. Organizing for solutions: Systems seller vs. systems integrator. Ind. Mark. Manag. 2007, 36, 183–193. [Google Scholar] [CrossRef] [Green Version]
- Tukker, A. Eight types of product–service system: Eight ways to sustainability? Experiences from SusProNet. Bus. Strategy Environ. 2004, 13, 246–260. [Google Scholar] [CrossRef]
- Neely, A. Exploring the financial consequences of the servitization of manufacturing. Oper. Manag. Res. 2008, 1, 103–118. [Google Scholar] [CrossRef] [Green Version]
- Baines, T.; Lightfoot, H. (Eds.) Made to Serve: How Manufacturers Can Compete Through Servitization and Product-Service Systems; John Wiley & Sons, Inc.: Hoboken, NJ, USA, 2012. [Google Scholar]
- Britchfield, G. State-of-the-Art in Product-Service Systems. 2013. Available online: https://uldamienobrien.wordpress.com/2013/10/12/state-of-the-art-in-product-service-systems/ (accessed on 17 January 2019).
- Kazman, R.; Carrière, S.J.; Woods, S.G. Toward a discipline of scenario-based architectural engineering. Ann. Softw. Eng. 2000, 9, 5–33. [Google Scholar] [CrossRef]
- Sutcliffe, A. Scenario-based requirements analysis. Requir. Eng. 1998, 3, 48–65. [Google Scholar] [CrossRef]
- Kazman, R.; Abowd, G.; Bass, L.; Clements, P. Scenario-based analysis of software architecture. IEEE Softw. 1996, 13, 47–55. [Google Scholar] [CrossRef] [Green Version]
- Bonilla, S.H.; Silva, H.R.O.; Terra da Silva, M.; Franco Gonçalves, R.; Sacomano, J.B. Industry 4.0 and Sustainability Implications: A Scenario-Based Analysis of the Impacts and Challenges. Sustainability 2018, 10, 3740. [Google Scholar] [CrossRef] [Green Version]
- Carrol, J.M. Five reasons for scenario-based design. In Proceedings of the 32nd Annual Hawaii International Conference on Systems Sciences. 1999. HICSS-32. Abstracts and CD-ROM of Full Papers, Maui, HI, USA, 5–8 January 1999. [Google Scholar]
- Vrakopoulou, M.; Li, B.; Mathieu, J.L. Chance Constrained Reserve Scheduling Using Uncertain Controllable Loads Part I: Formulation and Scenario-Based Analysis. IEEE Trans. Smart Grid 2019, 10, 1608–1617. [Google Scholar] [CrossRef]
- Goeke, L.; Pousttchi, K. A Scenario-Based Analysis of Mobile Payment Acceptance. In Proceedings of the 2010 Ninth International Conference on Mobile Business and 2010 Ninth Global Mobility Roundtable (ICMB-GMR), Athens, Greece, 13–15 June 2010; pp. 371–378. [Google Scholar]
- IBM Corp. 2005 Annual Report. Available online: Ftp://public.dhe.ibm.com/annualreport/2005/2005_ibm_annual.pdf (accessed on 7 January 2019).
- IBM Corp. 2006 Annual Report. Available online: Ftp://public.dhe.ibm.com/annualreport/2006/2006_ibm_annual.pdf (accessed on 7 January 2019).
- IBM Corp. 2007 Annual Report. Available online: Ftp://public.dhe.ibm.com/annualreport/2007/2007_ibm_annual.pdf (accessed on 7 January 2019).
- IBM Corp. 2008 Annual Report. Available online: Ftp://public.dhe.ibm.com/annualreport/2008/2008_ibm_annual.pdf (accessed on 7 January 2019).
- IBM Corp. 2009 Annual Report. Available online: https://www.ibm.com/annualreport/2009/2009_ibm_annual.pdf (accessed on 7 January 2019).
- IBM Corp. 2010 Annual Report. Available online: Ftp://public.dhe.ibm.com/annualreport/2010/2010_ibm_annual.pdf (accessed on 7 January 2019).
- IBM Corp. 2011 Annual Report. Available online: https://www.ibm.com/annualreport/2011/bin/assets/2011_ibm_annual.pdf (accessed on 7 January 2019).
- IBM Corp. 2012 Annual Report. Available online: https://www.ibm.com/annualreport/2012/bin/assets/2012_ibm_annual.pdf (accessed on 8 January 2019).
- IBM Corp. 2013 Annual Report. Available online: https://www.ibm.com/annualreport/2013/bin/assets/2013_ibm_annual.pdf (accessed on 5 January 2019).
- IBM Corp. 2014 Annual Report. Available online: https://www.ibm.com/annualreport/2014/bin/assets/IBM-Annual-Report-2014.pdf (accessed on 7 January 2019).
- IBM Corp. 2015 Annual Report. Available online: https://www.ibm.com/annualreport/2015/assets/img/2016/02/IBM-Annual-Report-2015.pdf (accessed on 5 January 2019).
- IBM Corp. Available online: http://www.ibm.com/us-en/ (accessed on 5 January 2019).
- Microsoft Corp. 2005 Annual Report. Available online: https://www.microsoft.com/investor/reports/ar05/staticversion/10k_dl_dow.html (accessed on 11 January 2019).
- Microsoft Corp. 2006 Annual Report. Available online: https://www.microsoft.com/investor/reports/ar06/staticversion/10k_dl_dow.html (accessed on 11 January 2019).
- Microsoft Corp. 2007 Annual Report. Available online: https://www.microsoft.com/investor/reports/ar07/staticversion/10k_dl_dow.html (accessed on 11 January 2019).
- Microsoft Corp. 2008 Annual Report. Available online: https://www.microsoft.com/investor/reports/ar08/10k_dl_dow.html (accessed on 11 January 2019).
- Microsoft Corp. 2009 Annual Report. Available online: https://www.microsoft.com/investor/reports/ar09/10k_dl_dow.html (accessed on 11 January 2019).
- Microsoft Corp. 2010 Annual Report. Available online: https://www.microsoft.com/investor/reports/ar10/10k_dl_dow.html (accessed on 11 January 2019).
- Microsoft Corp. 2011 Annual Report. Available online: https://www.microsoft.com/investor/reports/ar11/download_center.html (accessed on 11 January 2019).
- Microsoft Corp. 2012 Annual Report. Available online: https://www.microsoft.com/investor/reports/ar12/download-center/index.html (accessed on 11 January 2019).
- Microsoft Corp. 2013 Annual Report. Available online: https://www.microsoft.com/investor/reports/ar13/download-center/index.html (accessed on 11 January 2019).
- Microsoft Corp. 2014 Annual Report. Available online: https://www.microsoft.com/investor/reports/ar14/download-center.html (accessed on 11 January 2019).
- Microsoft Corp. 2015 Annual Report. Available online: https://www.microsoft.com/investor/reports/ar15/download-center/index.html (accessed on 11 January 2019).
- Microsoft Corp. Available online: https://www.microsoft.com/en-us (accessed on 11 January 2019).
- HP Inc. 2005 Annual Report. Available online: http://h30261.www3.hp.com/~/media/Files/H/HP-IR/documents/reports/2006/05ar-graphics.pdf (accessed on 5 January 2019).
- HP Inc. 2006 Annual Report. Available online: http://h30261.www3.hp.com/~/media/Files/H/HP-IR/documents/reports/2007/hp-2006ar.pdf (accessed on 5 January 2019).
- HP Inc. 2007 Annual Report. Available online: http://h30261.www3.hp.com/~/media/Files/H/HP-IR/documents/reports/2008/hp-annual-report-2007.pdf (accessed on 5 January 2019).
- HP Inc. 2008 Annual Report. Available online: http://h30261.www3.hp.com/~/media/Files/H/HP-IR/documents/reports/2009/hewlettpackard-2008-ar.pdf (accessed on 5 January 2019).
- HP Inc. 2009 Annual Report. Available online: http://h30261.www3.hp.com/~/media/Files/H/HP-IR/documents/reports/2010/hewlett-packardannualreport2009.pdf (accessed on 5 January 2019).
- HP Inc. 2010 Annual Report. Available online: http://h30261.www3.hp.com/~/media/Files/H/HP-IR/documents/reports/2011/hewlett-packard-annual-report-final-pdf.pdf (accessed on 4 January 2019).
- HP Inc. 2011 Annual Report. Available online: http://h30261.www3.hp.com/~/media/Files/H/HP-IR/documents/reports/2012/2011-annual-report.pdf (accessed on 4 January 2019).
- HP Inc. 2012 Annual Report. Available online: http://h30261.www3.hp.com/~/media/Files/H/HP-IR/documents/reports/2013/hp-10-kar-searchable.pdf (accessed on 4 January 2019).
- HP Inc. 2013 Annual Report. Available online: http://h30261.www3.hp.com/~/media/Files/H/HP-IR/documents/reports/2014/hpq-annual-report-2013.pdf (accessed on 4 January 2019).
- HP Inc. 2014 Annual Report. Available online: http://h30261.www3.hp.com/~/media/Files/H/HP-IR/documents/reports/2015/hpq-annual-report-2014.pdf (accessed on 5 January 2019).
- HP Inc. 2015 Annual Report. Available online: http://h30261.www3.hp.com/~/media/Files/H/HP-IR/documents/reports/2016/2015-form-10k.pdf (accessed on 5 January 2019).
- HP Inc. Available online: http://www.hp.com/country/us/en/welcome.html (accessed on 2 January 2019).
- HP Enterprise Company. Available online: https://www.hpe.com/us/en/home.html (accessed on 2 January 2019).
- Oracle Corp. Annual Report. Available online: http://d1lge852tjjqow.cloudfront.net/CIK-0001341439/8f89365c-f24d-4318-a4eb-76f4369afe8c.pdf (accessed on 2 January 2019).
- Oracle Corp. Annual Report. Available online: http://d1lge852tjjqow.cloudfront.net/CIK-0001341439/13409113-9264-4cc2-880b-0608458080ab.pdf (accessed on 2 January 2019).
- Oracle Corp. Annual Report. Available online: http://d1lge852tjjqow.cloudfront.net/CIK-0001341439/cc70d156-4a8f-4110-a423-b1908f6af43f.pdf (accessed on 2 January 2019).
- Oracle Corp. Annual Report. Available online: http://d1lge852tjjqow.cloudfront.net/CIK-0001341439/73e4159f-767e-4a02-9ced-f38420fb3fe0.pdf (accessed on 2 January 2019).
- Oracle Corp. Annual Report. Available online: http://d1lge852tjjqow.cloudfront.net/CIK-0001341439/5890e138-346b-456e-9a0f-0ef3693e9d45.pdf (accessed on 2 January 2019).
- Oracle Corp. Annual Report. Available online: http://d1lge852tjjqow.cloudfront.net/CIK-0001341439/fef751b6-6c47-46e6-b96c-cebdba155d6f.pdf (accessed on 2 January 2019).
- Oracle Corp. Annual Report. Available online: http://d1lge852tjjqow.cloudfront.net/CIK-0001341439/5ba3ac88-481f-4ef0-98e1-278fc99ac7a5.pdf (accessed on 2 January 2019).
- Oracle Corp. Annual Report. Available online: http://d1lge852tjjqow.cloudfront.net/CIK-0001341439/dfeeb28c-b033-4299-88d8-0e58524dfdff.pdf (accessed on 2 January 2019).
- Oracle Corp. Annual Report. Available online: http://d1lge852tjjqow.cloudfront.net/CIK-0001341439/34075018-f2c1-4907-9c92-dd96f56f49fa.pdf (accessed on 2 January 2019).
- Oracle Corp. Annual Report. Available online: http://d1lge852tjjqow.cloudfront.net/CIK-0001341439/495da947-b778-4d53-89be-fa66ffb9c3a9.pdf (accessed on 3 January 2019).
- Oracle Corp. Annual Report. Available online: http://d1lge852tjjqow.cloudfront.net/CIK-0001341439/ee127b2b-13a7-4bdb-a384-d27bb7c5bddb.pdf (accessed on 3 January 2019).
- Oracle Corp. Available online: https://www.oracle.com/index.html (accessed on 3 January 2019).
- Xerox Corp. 2005 Annual Report. Available online: http://www.xerox.com/annualreport/2005/Xerox_Annual_Report_05.pdf (accessed on 8 January 2019).
- Xerox Corp. 2006 Annual Report. Available online: http://www.xerox.com/annualreport/2006/Xerox_Annual_Report_06.pdf (accessed on 8 January 2019).
- Xerox Corp. 2007 Annual Report. Available online: http://www.xerox.com/annualreport/2007/Xerox_Annual_Report_07.pdf (accessed on 8 January 2019).
- Xerox Corp. 2008 Annual Report. Available online: http://www.xerox.com/annualreport/2008/2008_annual_report.pdf (accessed on 8 January 2019).
- Xerox Corp. 2009 Annual Report. Available online: http://www.xerox.com/annual-report-2009/pdfs/2009_Annual_Report.pdf (accessed on 8 January 2019).
- Xerox Corp. 2010 Annual Report. Available online: http://www.xerox.com/annual-report-2010/pdfs/2010_Annual_Report.pdf (accessed on 8 January 2019).
- Xerox Corp. 2011 Annual Report. Available online: https://www.xerox.com/assets/pdf/2011_Annual_Report.pdf (accessed on 8 January 2019).
- Xerox Corp. 2012 Annual Report. Available online: https://www.xerox.com/assets/pdf/partners/studiocom/annual/2012_Xerox_Annual_Report.pdf (accessed on 8 January 2019).
- Xerox Corp. 2013 Annual Report. Available online: http://www.xerox.com/annual-report-2013/assets/xerox-oar-2013-full.pdf (accessed on 8 January 2019).
- Xerox Corp. 2014 Annual Report. Available online: http://www.xerox.com/annual-report-2014/assets/Xerox2014AnnualReport.pdf (accessed on 8 January 2019).
- Xerox Corp. 2015 Annual Report. Available online: http://www.xerox.com/annual-report-2015/pdfs/Xerox-2015-Annual-Report.pdf (accessed on 8 January 2019).
- Xerox Corp. Available online: http://www.xerox.com (accessed on 8 January 2019).
Figure 1.
Value of Digital Economy.

Figure 2.
Scopes of Digital Economy.

Figure 3.
Servitization Transition Approaches.

Figure 4.
Switch from Ownership to access.

Figure 5.
IBM Servitization Transition – Changes Analysis.

Figure 6.
Hardware Offering (own illustration according to the IBM annual reports).

Figure 7.
Software Offering (own illustration according to the IBM annual reports).

Figure 8.
Service Offering (own illustration according to the IBM annual reports).

Figure 9.
Own Illustration of the IBM Revenue 2005.

Figure 10.
Own Illustration of the IBM Revenue from 2015.

Figure 11.
Positive/Negative Effects of Servitization - IBM.

Figure 12.
Own illustration after McKinsey and according to Microsoft’s annual reports.

Figure 13.
Own Illustration of Hardware Offering according to Microsoft’s annual reports.

Figure 14.
Own Illustration of Software Offering according to Microsoft’s annual reports.

Figure 15.
Own Illustration of Services Offering according to Microsoft’s annual reports.

Figure 16.
Own Illustration of Microsoft Revenue 2005.

Figure 17.
Own Illustration of Microsoft Revenue from 2015.

Figure 18.
Positive/Negative Effects of Servitization—Microsoft.

Figure 19.
Own illustration after McKinsey and according to HP’s annual reports.

Figure 20.
Own Illustration of Hardware Offering according to HP’s annual reports.

Figure 21.
Own Illustration of Software Offering according to HP’s annual reports.

Figure 22.
Own Illustration of Services Offering according to HP’s annual reports.

Figure 23.
Own Illustration of HP Revenue 2005.

Figure 24.
Own Illustration of HP Revenue 2015 and later.

Figure 25.
Positive/Negative Effects of Servitization—HP.

Figure 26.
Own illustration after McKinsey and according to Oracle’s annual reports.

Figure 27.
Own Illustration of Hardware Offering by Analyzing Oracle’s annual reports.

Figure 28.
Own Illustration of Software Offering by Analyzing Oracle’s annual reports.

Figure 29.
Own Illustration of Service Offering by analyzing Oracle’s annual reports.

Figure 30.
Own illustration of Oracle Revenue 2005.

Figure 31.
Own Illustration of Oracle Revenue 2015 and later.

Figure 32.
Positive/Negative Effects of Servitization - Oracle.

Figure 33.
Own illustration after McKinsey and according to Xerox’s annual reports.

Figure 34.
Own Illustration of Hardware Offering by Analyzing Xerox’s annual reports.

Figure 35.
Own Illustration of Software Offering by Analyzing Xerox’s annual reports.

Figure 36.
Own Illustration of Services Offering by Analyzing Xerox’s annual report.

Figure 37.
Own illustration of Xerox Revenue 2005.

Figure 38.
Own Illustration of Xerox Revenue 2015 and later.

Figure 39.
Positive/Negative Effects of Servitization - Xerox.


Table 1.
Attributes of Digital Products (adapted from [30]).
Table 1.
Attributes of Digital Products (adapted from [30]).
| Transmutable | slight changes create new goods with different features |
| Non-rival | the use of one person does not decrease its usefulness to others |
| Indestructible | using it will not wear off the product |
| Infinitely reproducible | it can be easily reproduced, and every copy is the same as the original |
| Indivisible | there can only be an entire product because the code would be broken if you split it in half |
| Virtual | they are only accessible over a network |
| Invaluable | difficult to put a monetary value on them as duplication is unlimitedly possible |
© 2020 by the authors. Licensee MDPI, Basel, Switzerland. This article is an open access article distributed under the terms and conditions of the Creative Commons Attribution (CC BY) license (http://creativecommons.org/licenses/by/4.0/).
Share and Cite
MDPI and ACS Style
Kryvinska, N.; Bickel, L. Scenario-Based Analysis of IT Enterprises Servitization as a Part of Digital Transformation of Modern Economy. Appl. Sci. 2020, 10, 1076. https://doi.org/10.3390/app10031076
AMA Style
Kryvinska N, Bickel L. Scenario-Based Analysis of IT Enterprises Servitization as a Part of Digital Transformation of Modern Economy. Applied Sciences. 2020; 10(3):1076. https://doi.org/10.3390/app10031076
Chicago/Turabian StyleKryvinska, Natalia, and Lukas Bickel. 2020. "Scenario-Based Analysis of IT Enterprises Servitization as a Part of Digital Transformation of Modern Economy" Applied Sciences 10, no. 3: 1076. https://doi.org/10.3390/app10031076
Note that from the first issue of 2016, this journal uses article numbers instead of page numbers. See further details here.