1. Introduction
Age-related macular degeneration (AMD) is the leading cause of vision impairment and severe visual loss amongst older individuals in developed countries [
1]. A global meta-analysis has shown that it was estimated that the number of people with age-related macular degeneration was approximately 196 million in 2020, increasing to 288 million in 2040 [
2]. Therefore, it is indeed a significant public health problem.
Choroidal neovascularization (CNV) is the hallmark of exudative AMD. Progression of CNV can result in fluid exudation, subretinal hemorrhage, subretinal fibrosis, photoreceptor damage, and eventually vision loss [
3]. Early detection of CNV in patients with exudative AMD is critical for early treatment and the prevention of vision loss [
4]. Both fluorescein angiography (FA) and indocyanine green angiography (ICGA) are chief diagnostic methods for CNV detection [
5]. However, both modalities are considered invasive and time consuming, requiring intravenous dye injections, while also posing a potential risk for anaphylaxis [
6].
Optical coherence tomography (OCT) is a non-invasive modality for acquiring cross-sectional volumetric images of the tissues. In the recent past, it has been widely used as a diagnostic tool in the field of dermatology and ophthalmology. For example, the findings of OCT can help clinicians diagnose and determine the extent of skin and choroidal tumor [
7,
8], For detecting the presence of CNV, OCT enables visualization of the morphological features of the fibrovascular complex and the exudative fluid accumulation. However, it cannot distinguish vasculature from fibrous and other surrounding tissues clearly. Therefore, the precise location and activity of the CNV cannot be determined [
9].
Optical coherence tomographic angiography (OCTA) is a novel imaging tool, which allows visualization of the retinal and choroidal microvasculature in vivo by detecting intravascular blood flow [
10]. In general, OCTA monitors blood flow through detecting changes in reflectivity, which are thought to be related to the dynamic motion of red blood cells, and are facilitated by sequential cross-sectional scans, which are then repeated at the same location over time. This process is repeated throughout many cross-sectional locations in the area of interest to create a volumetric (three-dimensional) vascular map [
11].
Because it is based upon flow motion detection, there is no need for contrast dye injections. Additionally, the OCTA image could be obtained in only 30–60 s, which is quicker when compared to FA and ICGA, both of which require approximately 10–30 min. Furthermore, layer-by-layer and three-dimensional volumetric analyses of the chorioretinal vascular architecture are possible using OCTA imaging, which could not be performed through the use of conventional imaging modalities such as FA and ICGA. Precise localization of CNV is important for the purpose of both evaluating therapeutic effects and predicting prognoses.
OCTA is a safe, fast, and noninvasive method for the diagnosis and analysis of microvascular abnormalities associated with retinal vascular disease and AMD. However, CNV lesions are found in a variety of shapes, sizes, and locations, with the flow visualization within these structures possibly being significantly different. Moreover, OCTA images are degraded by projection and corrupted by speckle noise, resulting in a low contrast between CNV and its background [
12]. Therefore, interpretation of the images acquired through the use of this technology remains challenging.
We intend to propose a judgment architecture in order to assist ophthalmologists in implementing CNV more efficiently. Since OCTA images often have a large amount of noise, we must try to remove the noise in order to find the main blood vessel region. To do this we first converted the color space to the CIELAB color space, retain the L-channel, and remove the A-channel and B-channel to reduce unnecessary information in the image, while retaining as much important information as possible in the original image. The main blood vessel area was then extracted using Otsu’s method, and most of the noise was removed, so as not to interfere with the subsequent recognition effect. Finally, in these main blood vessels, the method for the thinning of the morphology and the endpoint connection was used, and the eccentricity used as a feature to judge CNV.
This paper proposes a method for finding the CNV region. We use some image segmentation methods to find the clearer blood vessels, and then create the difference in its appearance to allow the computer to identify the CNV. We hope this method could be applied in the medical field in the future to reduce both the burden on doctors and the time required for disease diagnosis.
2. Materials and Methods
We collected the clinical data of subjects visiting a tertiary referral center, the Taichung Veterans General Hospital, Taichung, Taiwan, and obtained Institutional Review Board approval, and all research conformed to the tenets of the Declaration of Helsinki.
Seventeen subjects were enrolled in this study. Every participant had CNV which had been confirmed by FA and ICGA with signs of leakage. OCTA was performed by a commercial spectral domain (SD) OCT system with an axial resolution of 5 μm in tissue.
2.1. Flow Chart of the Proposed Method
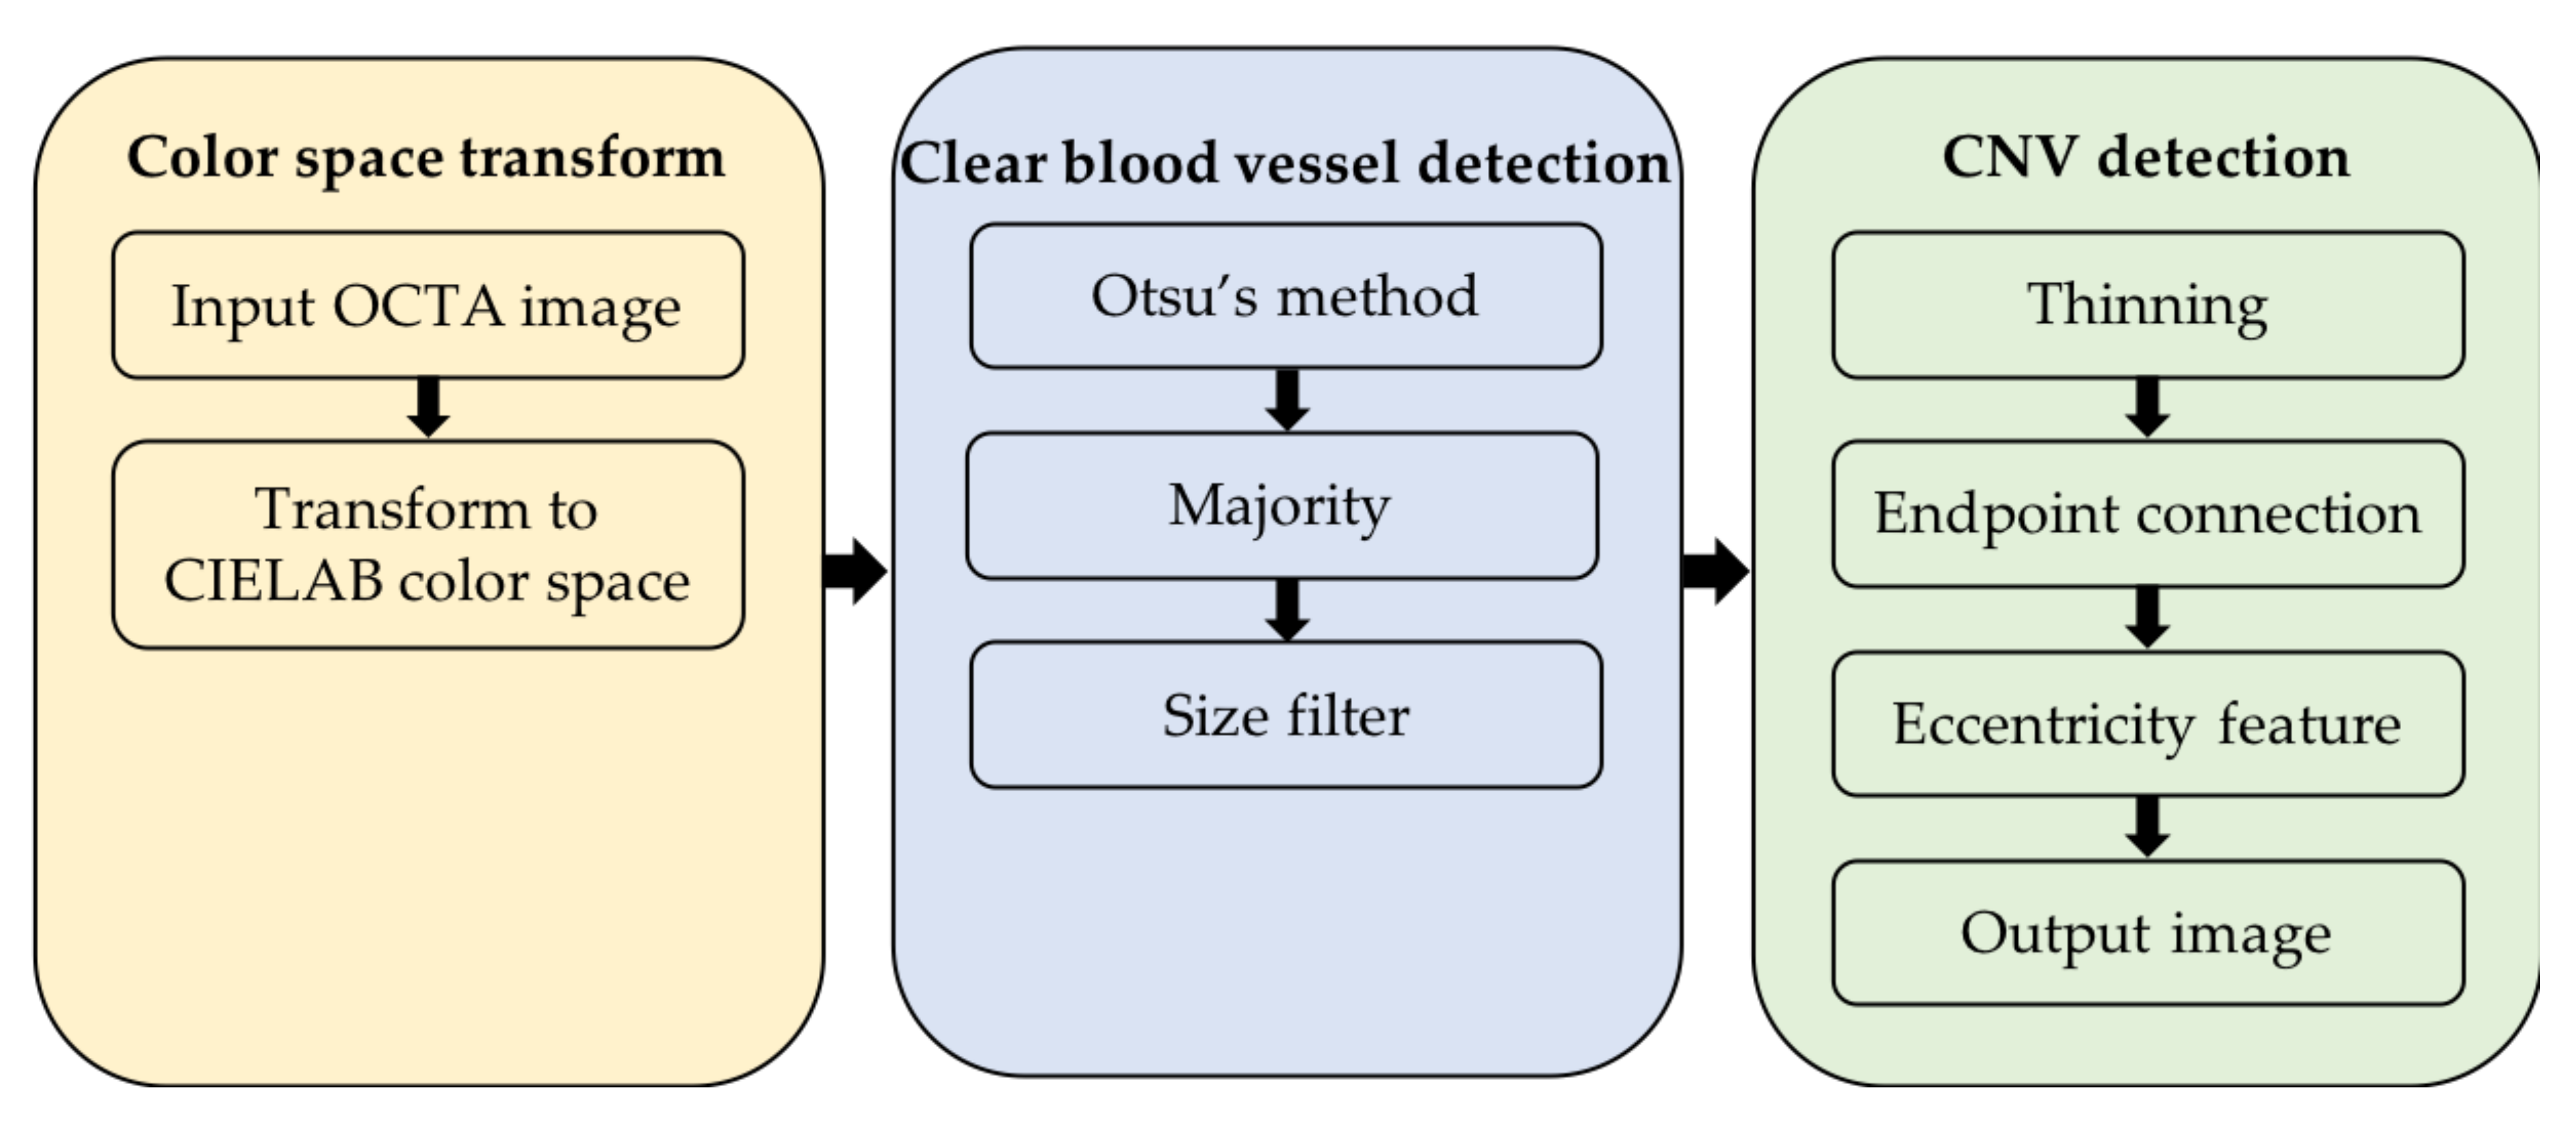
Figure 1 shows the flow chart of the search plan proposed in this paper. The chart can be divided into three major parts: (i) Color space transform; (ii) clear blood vessel detection; and (iii) choroidal neovascularization (CNV) detection.
2.2. Color Space Transform
The CIELAB color space is mainly composed of three dimensions: L, a, and b, where the L channel represents information on brightness, and a and b represent the dimension of color components [
13,
14,
15]. Lab colors are designed to approximate human vision. Its L component closely matches human brightness perception. Therefore, modifying the L component can be used to adjust the brightness contrast. These transformations are difficult in RGB. Many “colors” in Lab space go beyond the visual field of human vision; transforming brightness, chroma, and even hue in processing. Dan Margulis claims that it is useful to use imaginary colors between multiple steps in image manipulation [
16]. This article uses the L channel in CIELAB to make grayscale images for the next steps.
Since the RGB color space cannot be directly transformed to the CIELAB color space, we must first transform it into the CIEXYZ color space before converting it to the CIELAB color space. The conversion method of CIEXYZ is to reduce the range of the
R,
G, and
B channels to [0,1] through Equation (1), then we can obtain the
X,
Y, and
Z channels in the CIEXYZ color space through Equation (2).
After obtaining the
X,
Y, and
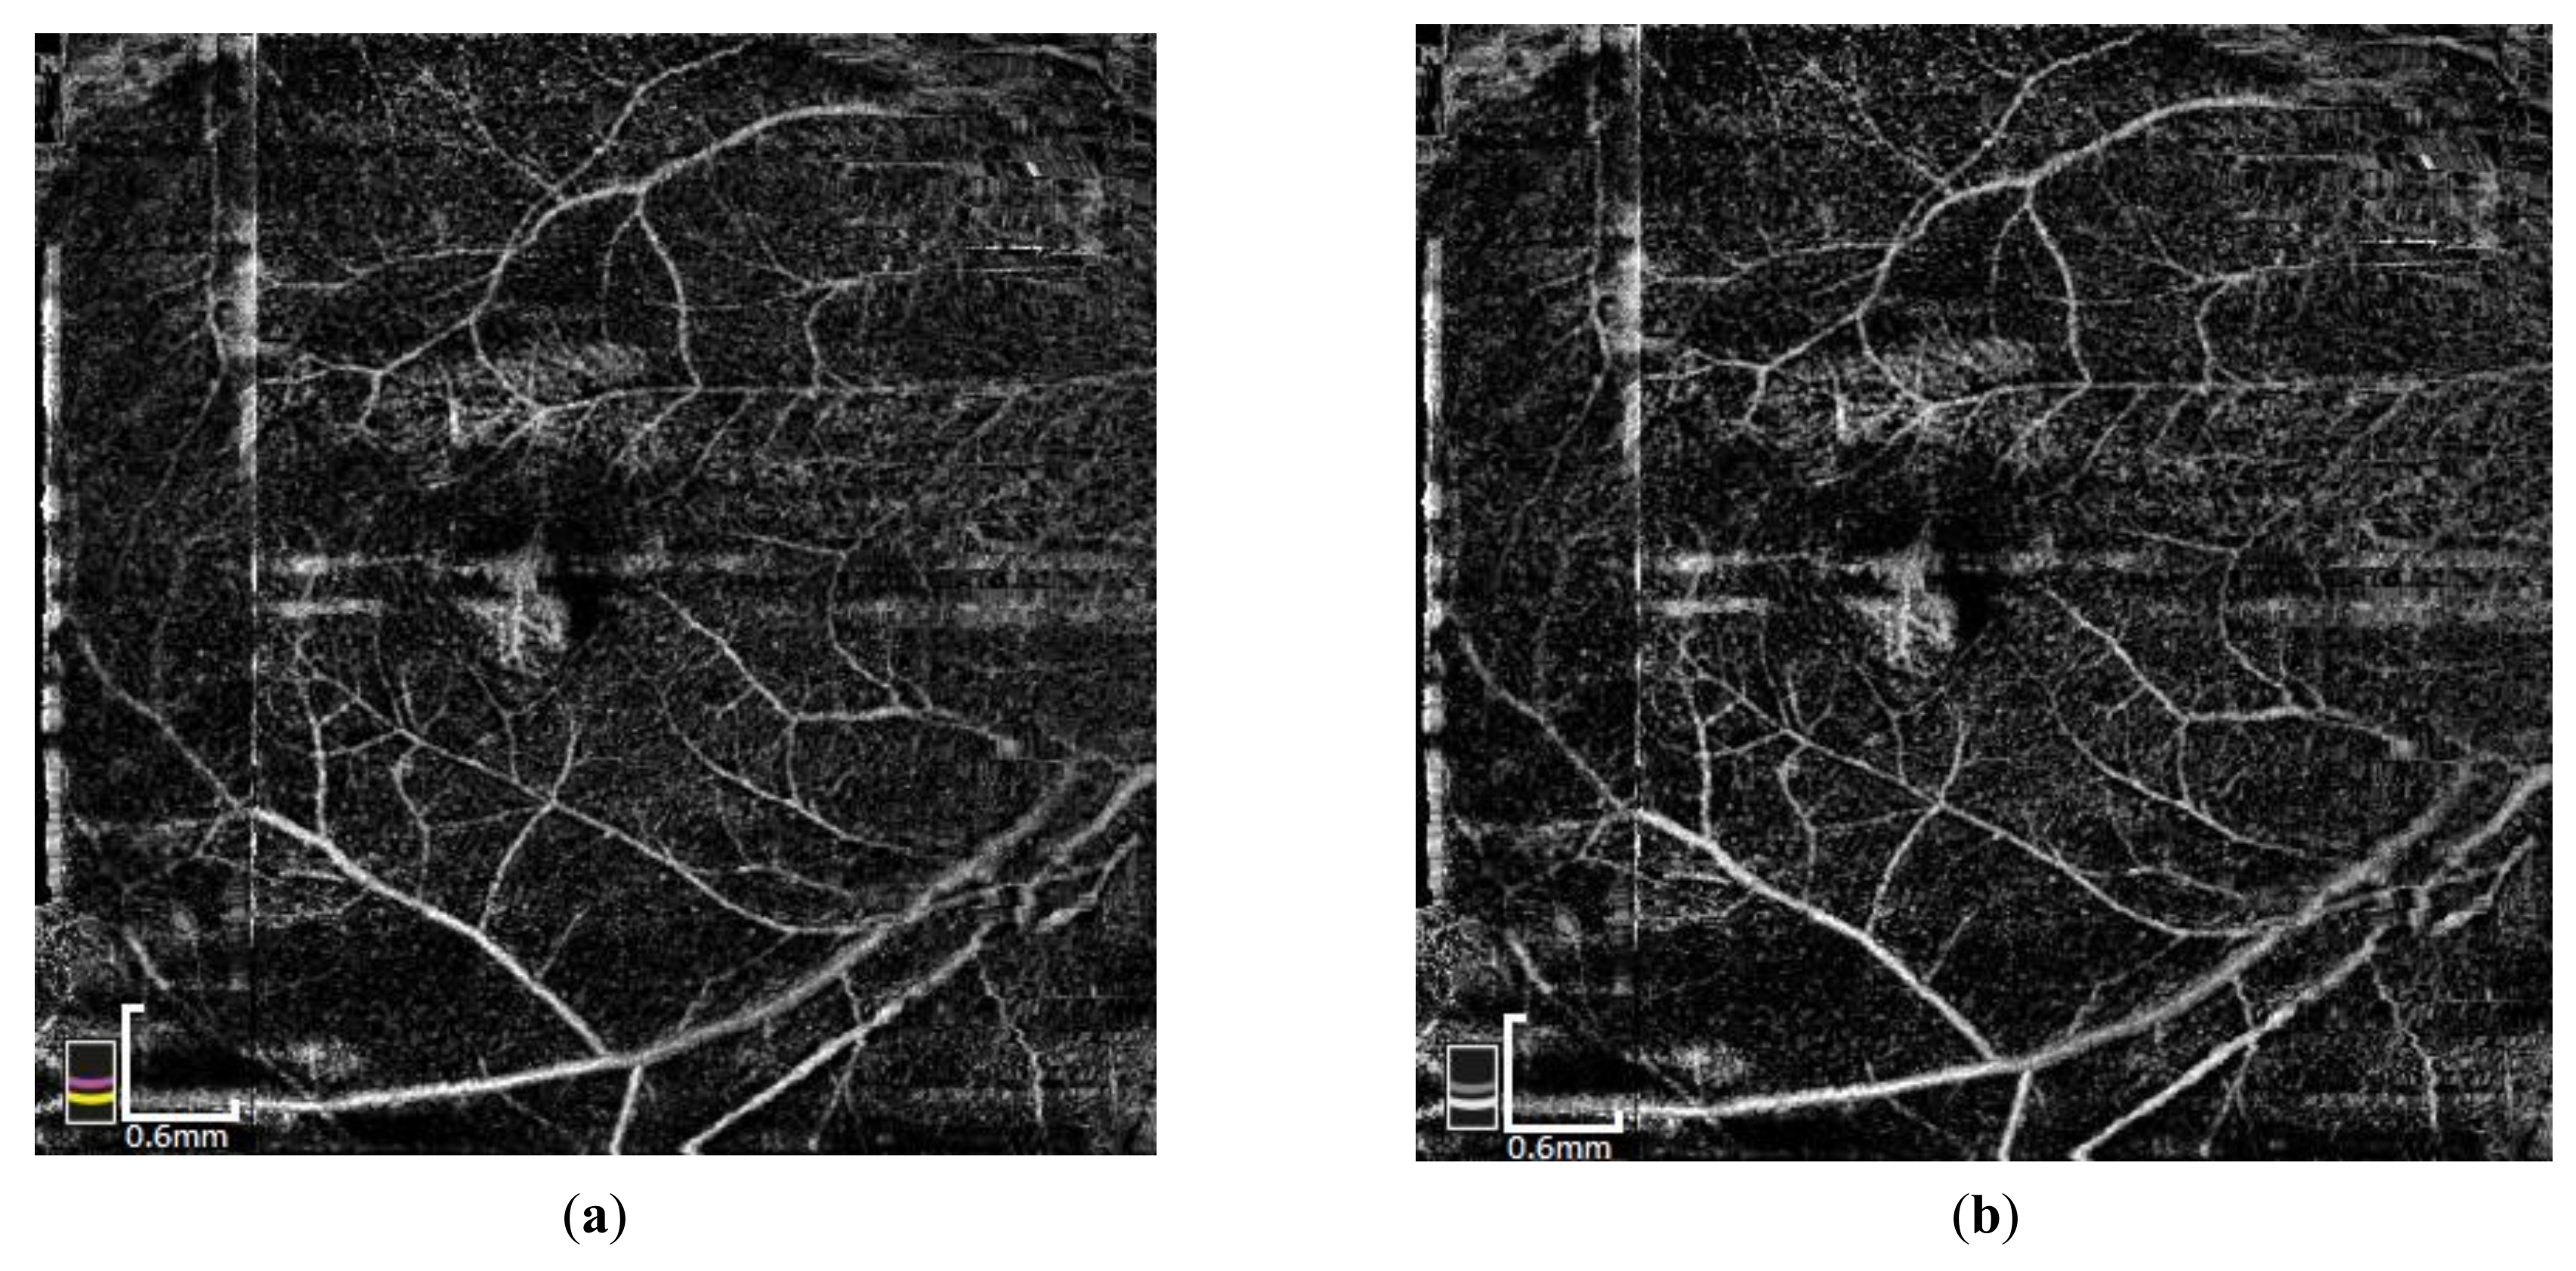
Z channels, they are then converted into three values of X_0, Y_0, and Z_0 using Equation (3). Finally, we can then obtain the L, a, and b channels in the CIELAB color space through the conversion of Equations (4) to (6). We will only choose the L-channel, which provides information on the brightness. The range of the L-channel value is between 0 and 100, and can represent pure black to pure white. You can see the example of the L-channel image in
Figure 2, and although we only chose L-channel information, the image still did not change much.
2.3. Clear Blood Vessel Detection
Because OCTA has too much noise, in order to find clearer blood vessels, our proposed method involves three image segmentation and noise reduction methods: Otsu’s method, Majority, and Size filter.
2.3.1. Otsu’s Method
Otsu’s method is a threshold method on an image histogram. For an image with a brightness range of 1 to L, a threshold value of T is found from the histogram, and pixel values are divided into two different classes; with the one greater or equal to T belonging to the object class, and another one belonging to the background class. The object class may contain blood vessels and a small amount of noise. It is used to separate the objects we wish to obtain, and remove the background which we would not want [
17,
18]. The main goal of Otsu’s method is to find the threshold that minimizes intra-group variation. To achieve this goal, we must first calculate the average grayscale value of the object and background through Equations (7) and (8) on the hypothetical threshold value
t:
where
represents the probability of the grayscale value
i in the entire image. After the average value is obtained, the variation of the object and the background can be calculated by Equations (9) and (10):
Next, adding the two variations, the sum of the intra-group variation can be obtained, as shown in Equation (11):
Otsu’s method is looking for the threshold value T that maximizes the intra-group variation, which can be defined as Equation (12). This is obtained by calculating each possible integer threshold and selecting the maximum intra-group variances. The corresponding value T comes as a threshold:
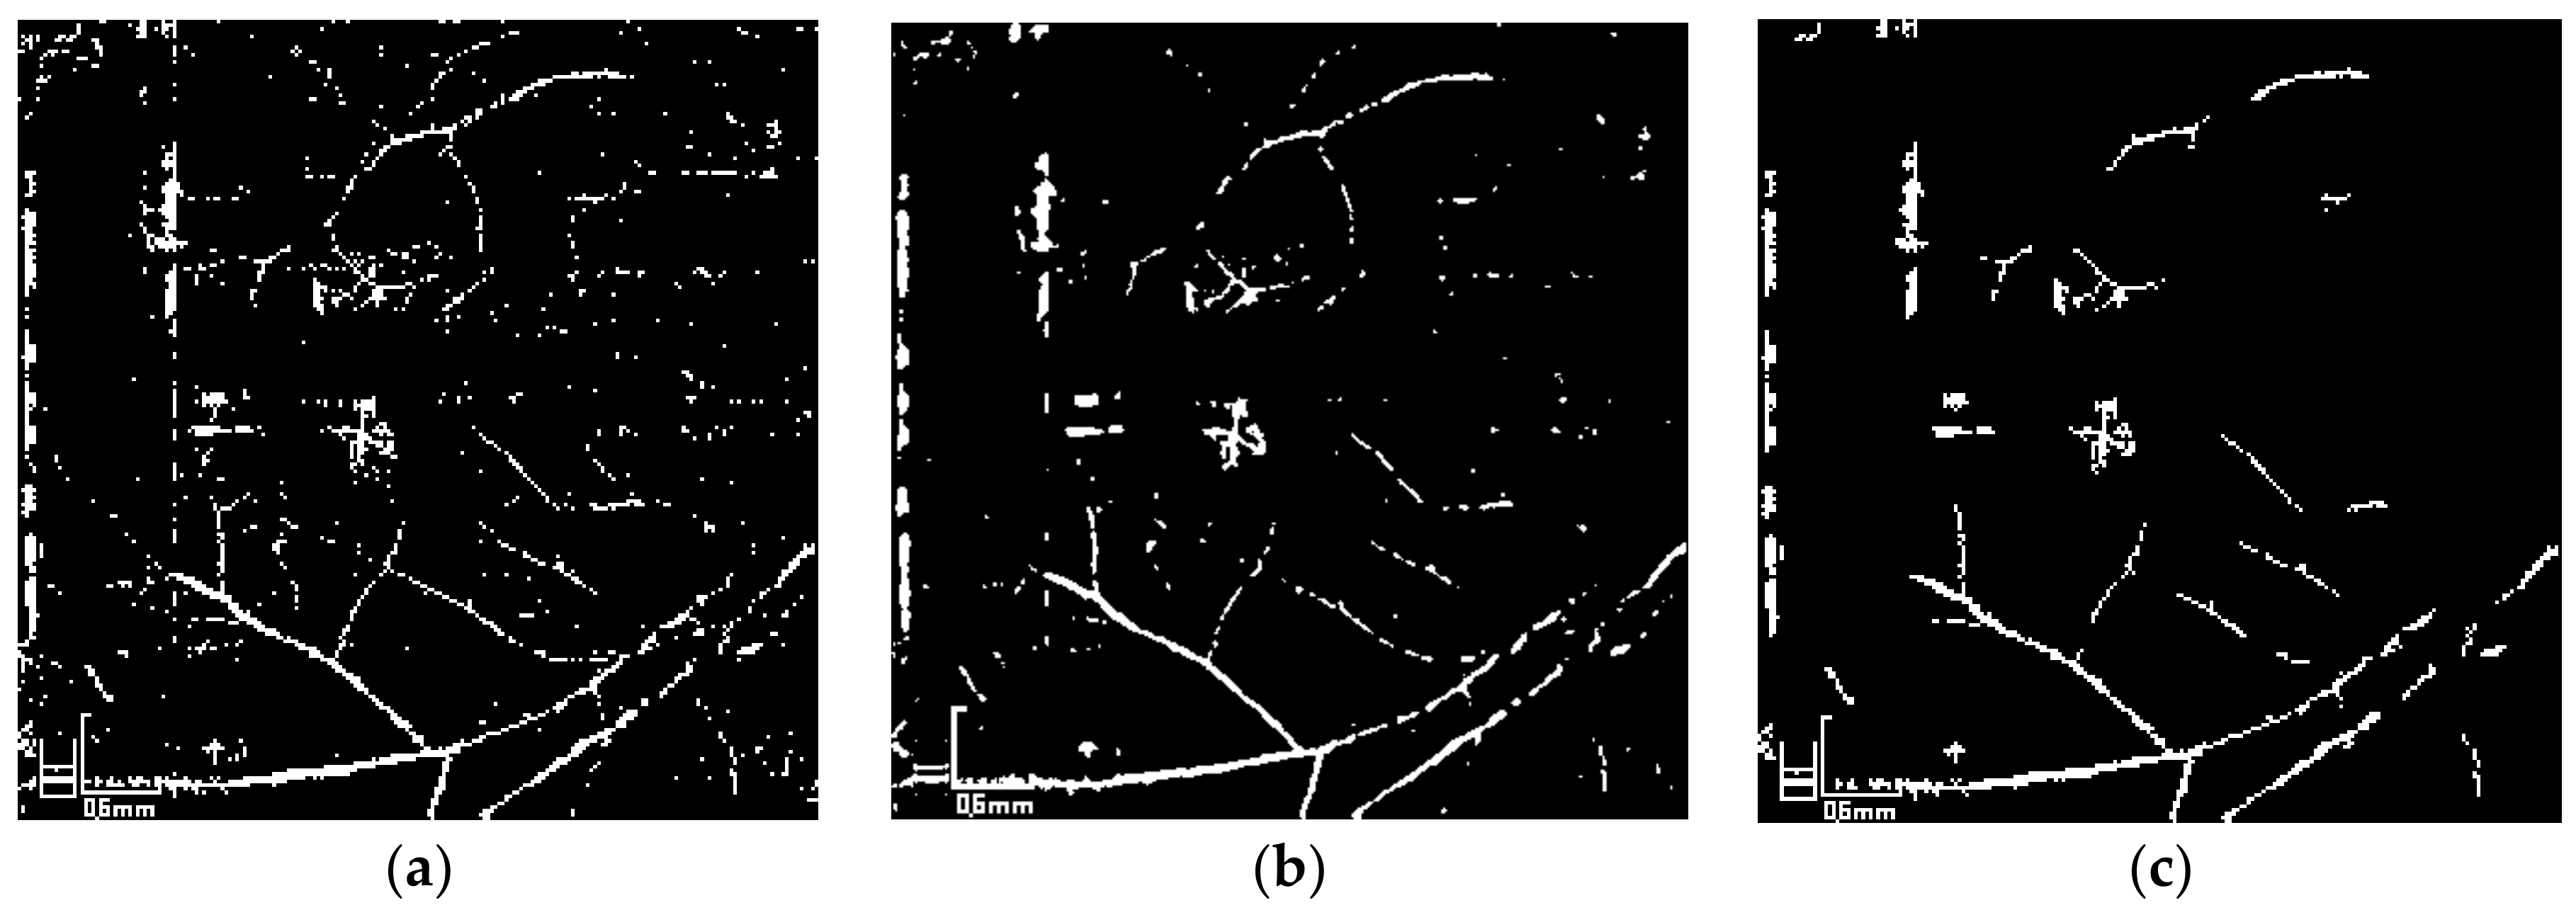
Since the range of the L-channel is a real number from 0 to 100, we change all the values into integer values by rounding down when we use Otsu’s method, and then convert it into a histogram to perform the calculation of Otsu’s method. In this article, Otsu’s method was used twice to separate the main objects, because if using Otsu’s method only one time, too many noise pixels will be determined as objects. Therefore we need to carry out Otsu’s method twice, so that the object can be selected currently.
2.3.2. Majority
After the binary image is obtained, the blood vessel we want can be marked as white, but since the OCTA image is subject to considerable interference by the noise, some methods are used in this paper to remove these noise pixels. In the first step, we adopted the Majority method in mathematical morphology [
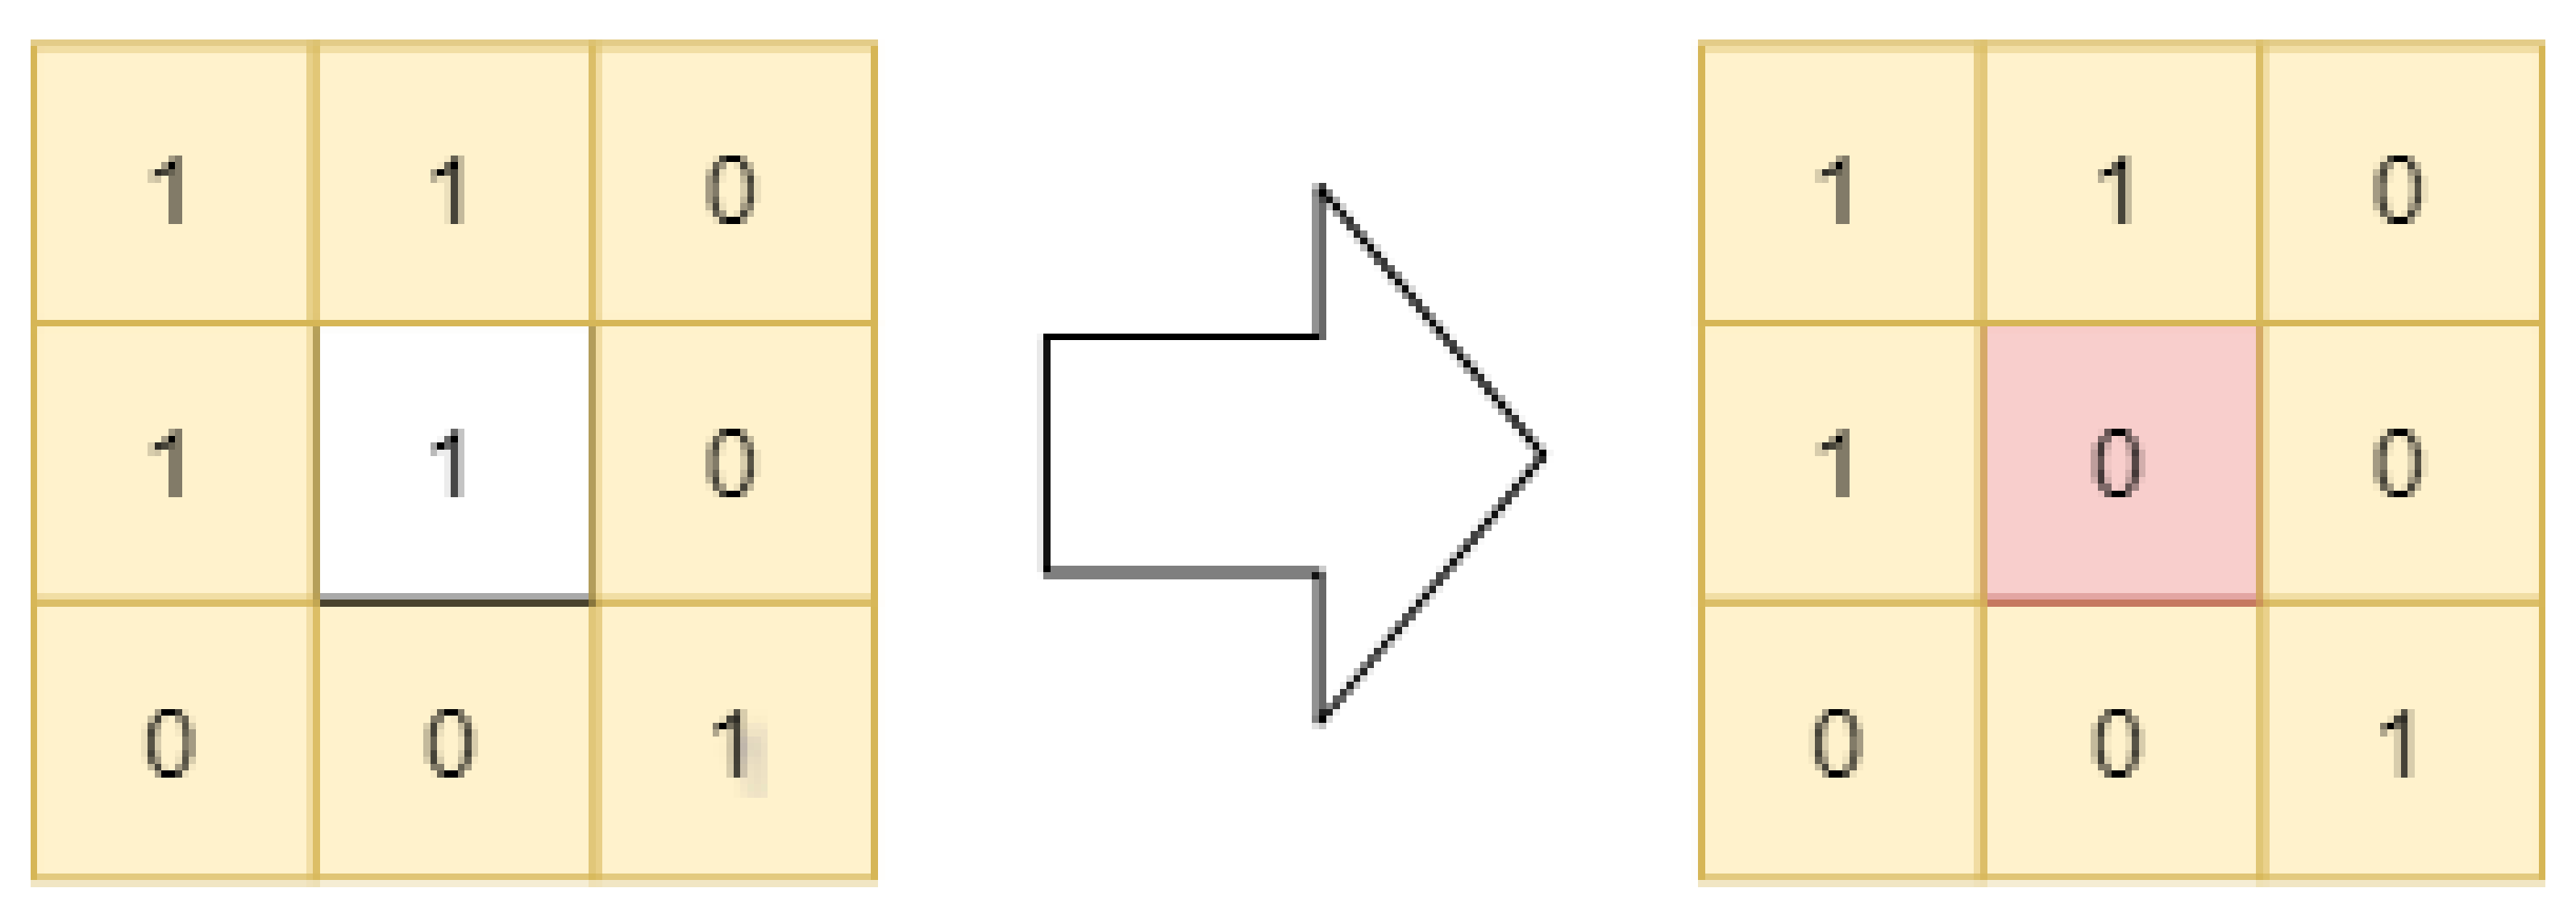
19]. The majority is to observe the eight pixels around for each pixel in the binary image. If there are more than five pixels which are white (value equal to 1), change the color of the center pixel to white (value equal to 1), otherwise set it to black (value equal to 0). As shown in
Figure 3, there are only four white pixels (value equal to 1) among the eight pixels, so it will be set to black (value equal to 0). This way, the noise pixels that are not part of the blood vessel position can be initially removed.
2.3.3. Size Filter
Although the Majority method is used to remove the noise pixels, there will still be some noise pixels remaining, so this article will go on to explain use of the Size filter method. Prior to introducing the Size filter method, we will first explain the concept of connected-component labeling. In the binary image, the value on each pixel point is 0 or 1. The value of 1 can be imagined as a road, where 0 has no way to walk. For any pixel point, if the adjacent location has a value of 1, it can walk to that location and continue to walk in other directions. Subsequently, all the pixel locations it can walk to will form a region, called the connected-component, where the walking of the adjacent position is mainly divided into two modes—4-connectivity and 8-connectivity. The mode 4-connectivity means that the direction of walking is limited to four types of up, down, left, and right; while 8-connectivity has added an extra four types to 4-connectivity—left-hand side, lower left, upper right, and lower right—for eight directions in total. In a binary image, different connected-components can be formed according to different connectivity modes.
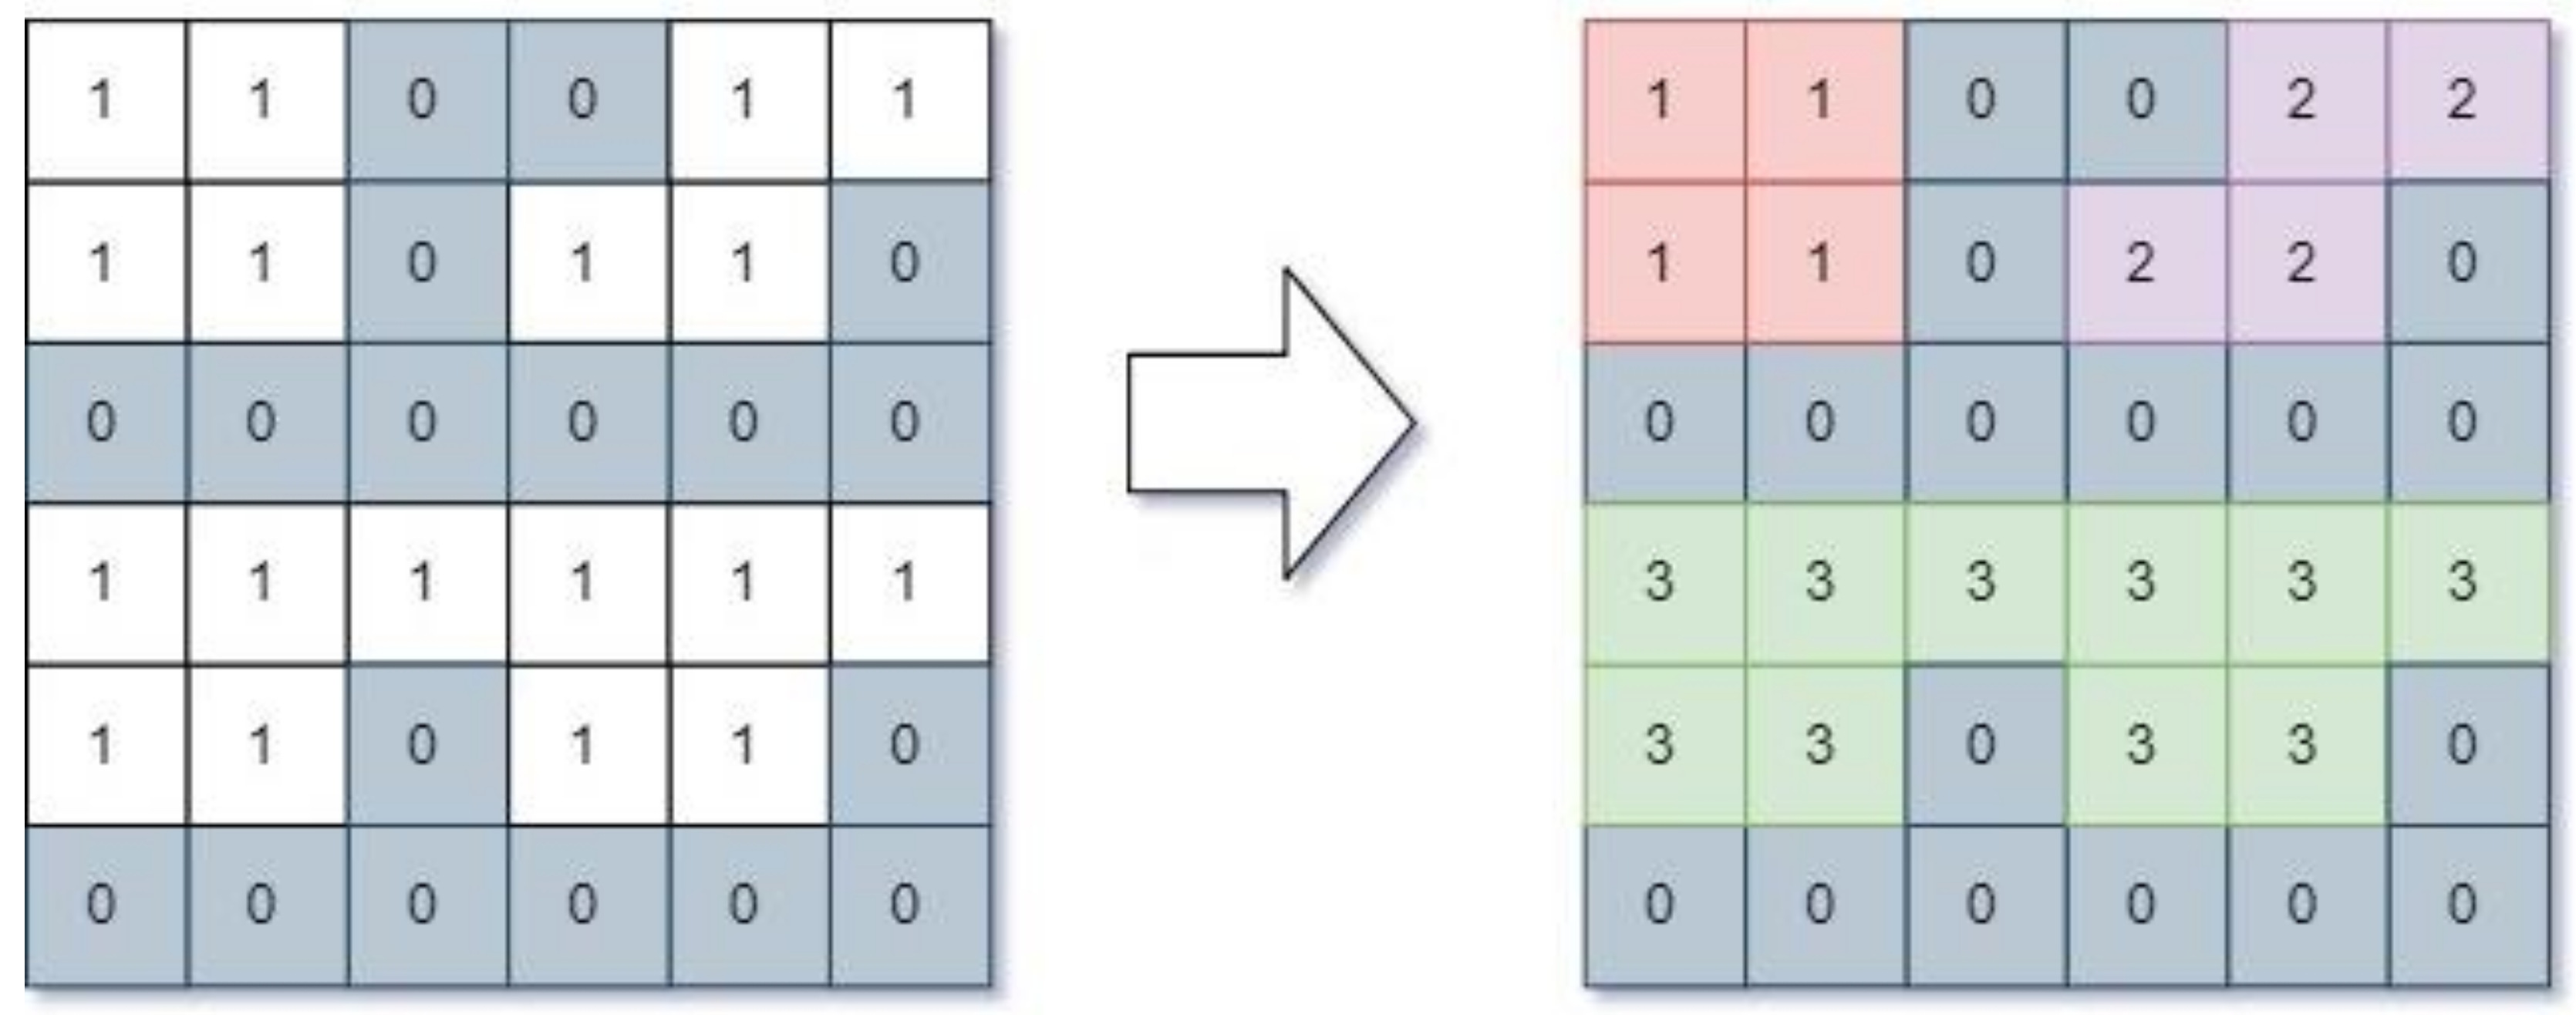
Figure 4 is an example of 8-connectivity mode, with the different connected-components represented by different colors and label numbers. Since the remaining noise is an isolated existence, the noise pixel points will form their own connected-components, and its number of pixels in the connected-component will be quite rare. Therefore, the Size filter used for this article was to remove the region whose connected-component area was smaller than the specified size, thus avoiding the influence of the noise on the subsequent processing. In
Figure 4, if the Size filter is set to pass only the area with an area larger than 4, the areas with label numbers 1 and 2 will be replaced by black. The connected-components mode we used was 8-connectivity.
Figure 5 shows each step taken for clear blood vessel detection.
2.4. Choroidal Neovascularization (CNV) Detection.
After identifying the clearer vascular regions, we wanted to use the shape of the blood vessel to identify the CNV; however, the thickness of the blood vessel may cause misjudgment to occur during subsequent recognition; therefore, we must pre-process the blood vessels into the same width as was prior. The method we used was the thinning of morphology, which can reduce the thickness of the vascular regions down to the width of one pixel without having all the shapes disappear [
20]. By using this approach, the shape of the region appears clearer, allowing for accurate recognition on the next step, giving the shape of the feature a more defined effect. The thinning method is used to remove the pixel point for each pixel in the binary image. As long as the two conditions, named as G1 and G2, are satisfied, and a repeat of this action is done until the image is not changed, then you can get a blood vessel image with a thickness of the width of one pixel. The conditions of G1 and G2 are as shown as Equations (13) to (15).
Condition G1:
is the value of eight neighboring pixels on each center pixel.
Condition G2:
is the value of eight neighboring pixels on each center pixel.
Because the OCTA image is subject to a large amount of noise interference, the blood vessel is prone to shape breakage or even fracture when the image segment was processed in the previous steps. If the regions containing the blood vessels cannot be completely presented, this will inevitably lead to errors in shape judgment; therefore, we must reconnect these broken parts. The approach taken in this paper is to first locate all of the endpoints, which is the end point of the blood vessel in each connected-component. If the endpoints of two different connected-components are fairly close together, we will connect them. For every two different connected-components, we only selected the two nearest endpoints to connect, and through this method, the broken blood vessels were reconnected.
Among them, the endpoint finding algorithm in each connected-component is that of each pixel location. If the eight neighboring pixels around the center pixel have only one value equal to 1, we can treat it as an endpoint. For each endpoint, we looked for all the pixel locations in its 5 × 5 mask. If the endpoints of other different connected-components can be found in this mask, and they are the nearest two endpoints between two connected-components, we will connect the two endpoints to each other through a straight line. This way the broken blood vessels can be connected to avoid the influence of subsequent judgment.
After locating the main vascular region and performing the thinning process, we started to search for the location of the CNV. The feature used in this paper is the eccentricity. The eccentricity is independent of the region size and directionality, but only effected by the shape [
21]. Since the shape of CNV is different from that of general blood vessels, the eccentricity of CNV should also be significantly different. Therefore, we try to use eccentricity to find CNV. The eccentricity represents the relationship between the major axis and the minor axis on an ellipse. On the binary image, for each connected region, the two pixel points which are at the farthest distance in each connected-component are first connected to a line. This line will be our long axis, before we then find a minimum ellipse that can surround the corresponding connected-component. In this ellipse, the eccentricity is calculated by Equation (16), where this value is used as a feature of the connected-component.
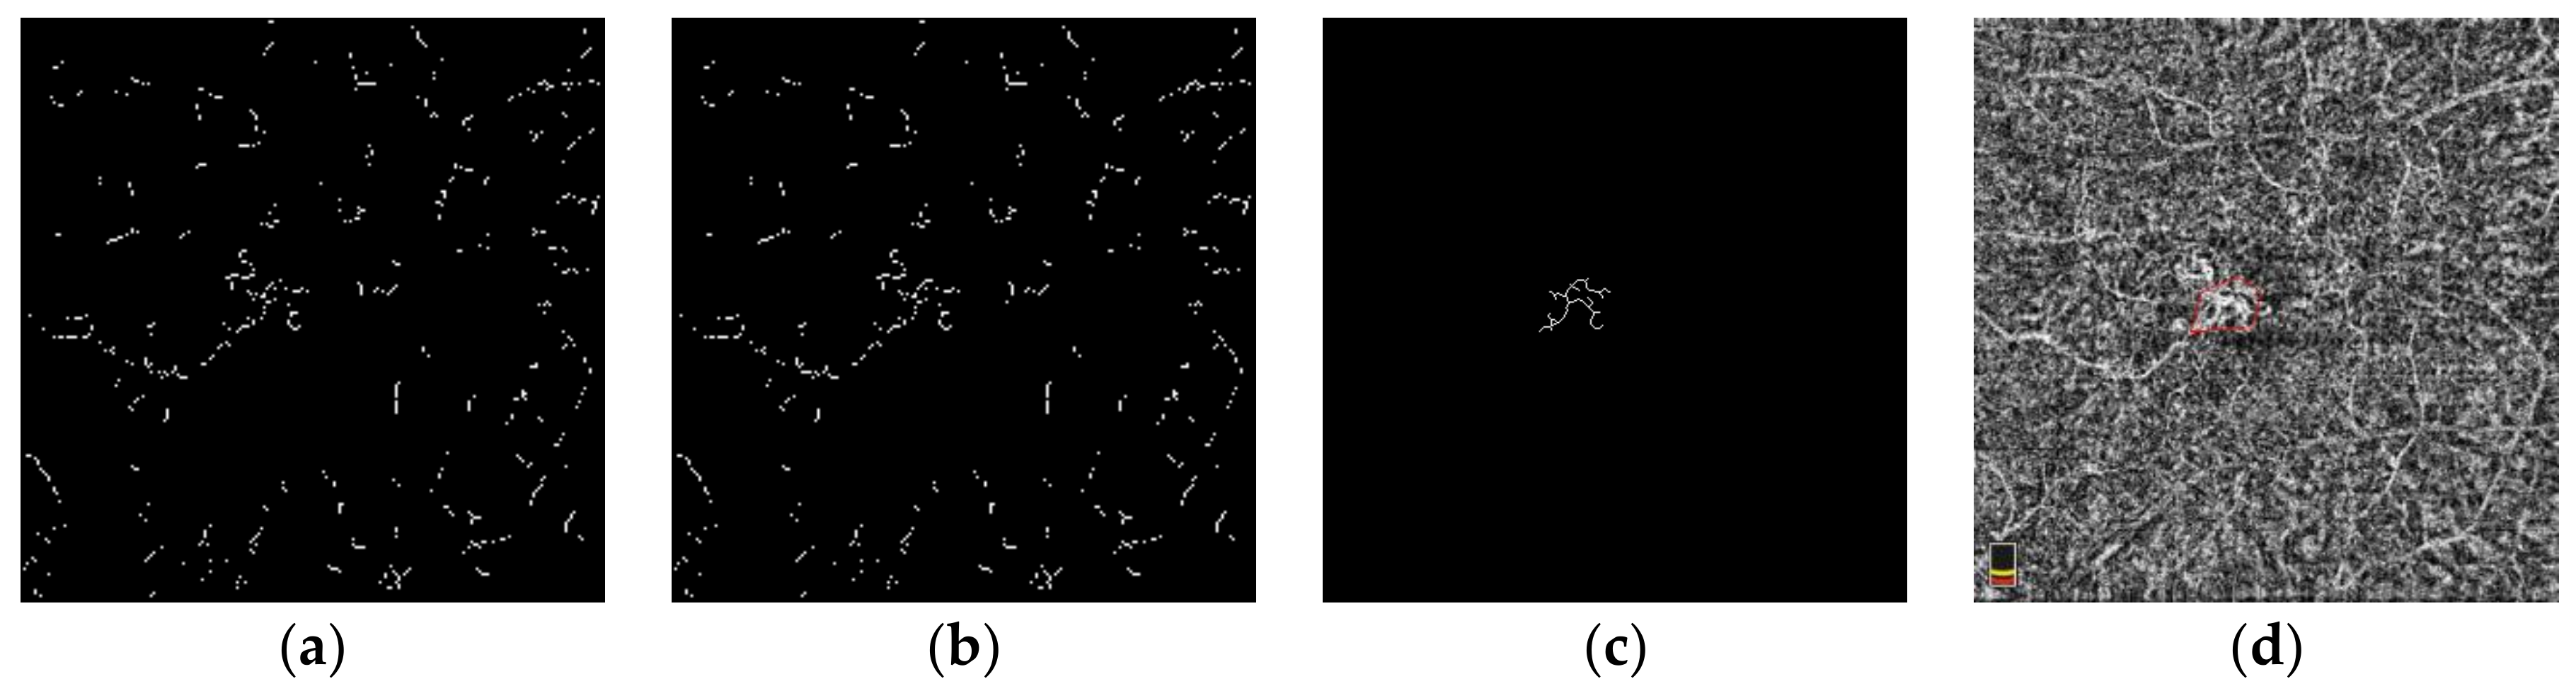
Figure 6 shows the example of each step in CNV detection.
3. Results
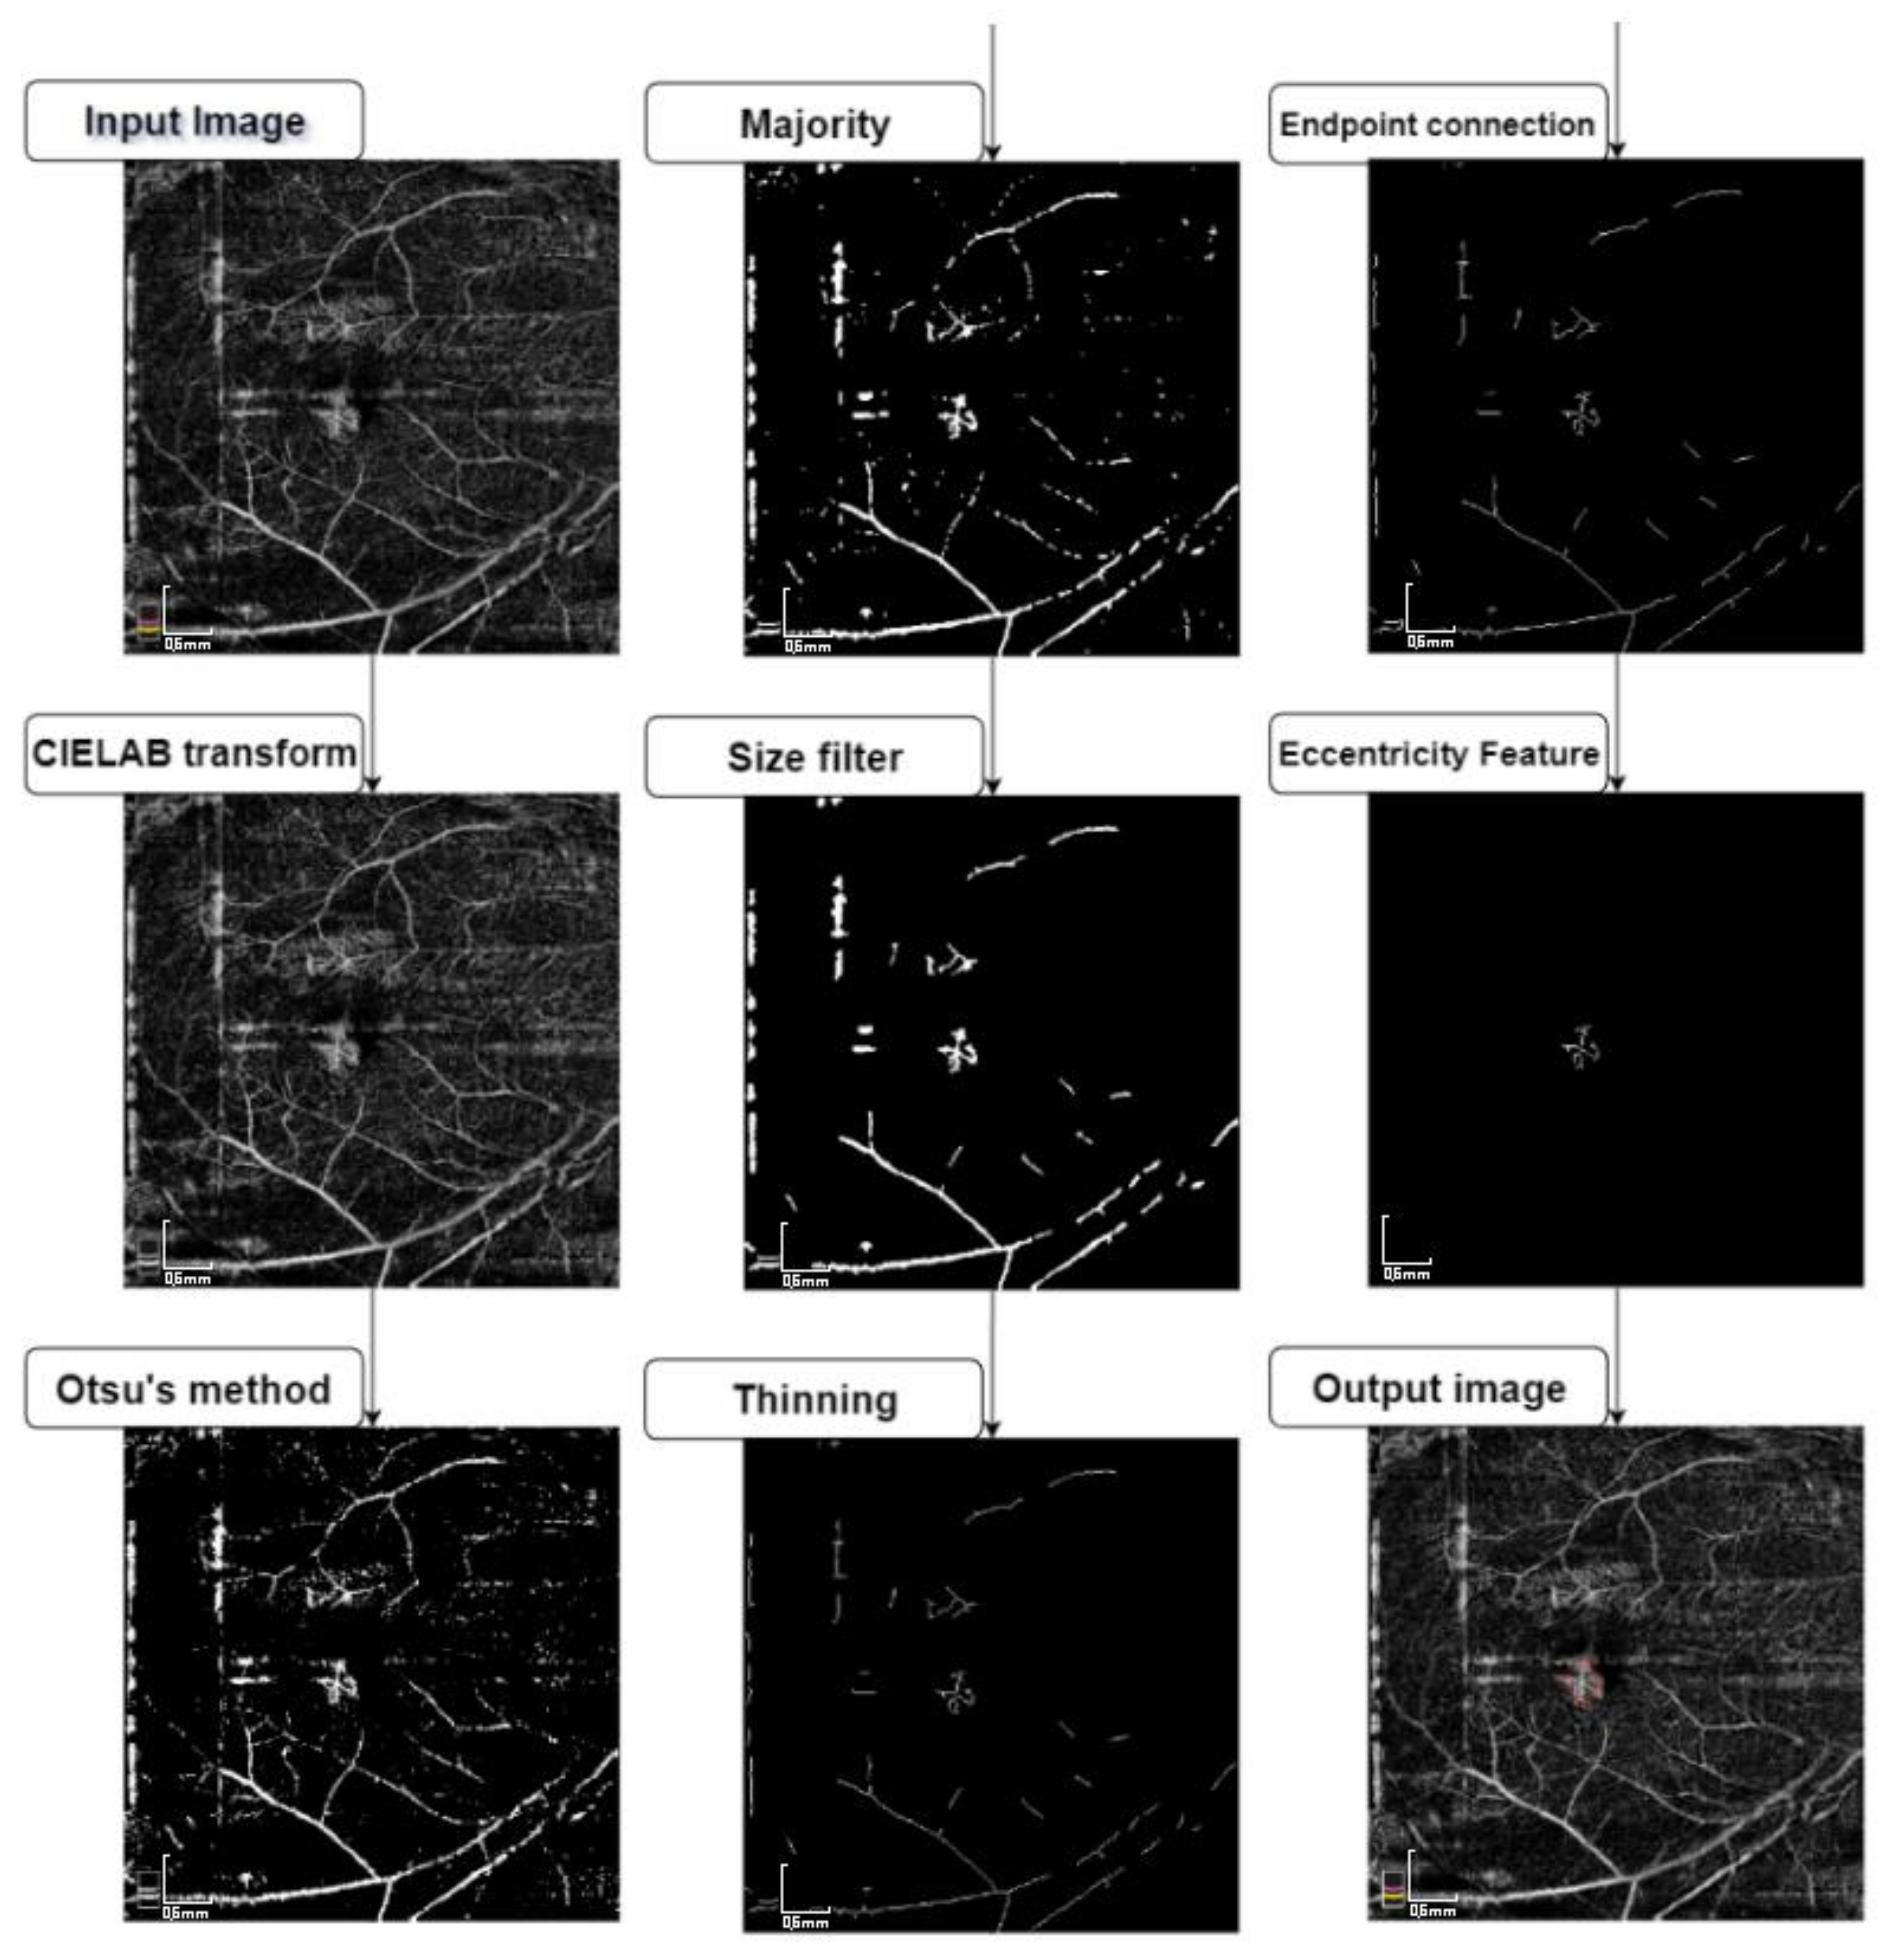
Several optical coherence tomography (OCTA) images were used in the experiment to test whether the scheme we proposed could locate the choroidal neovascularization (CNV). The result of each processing stage is shown in
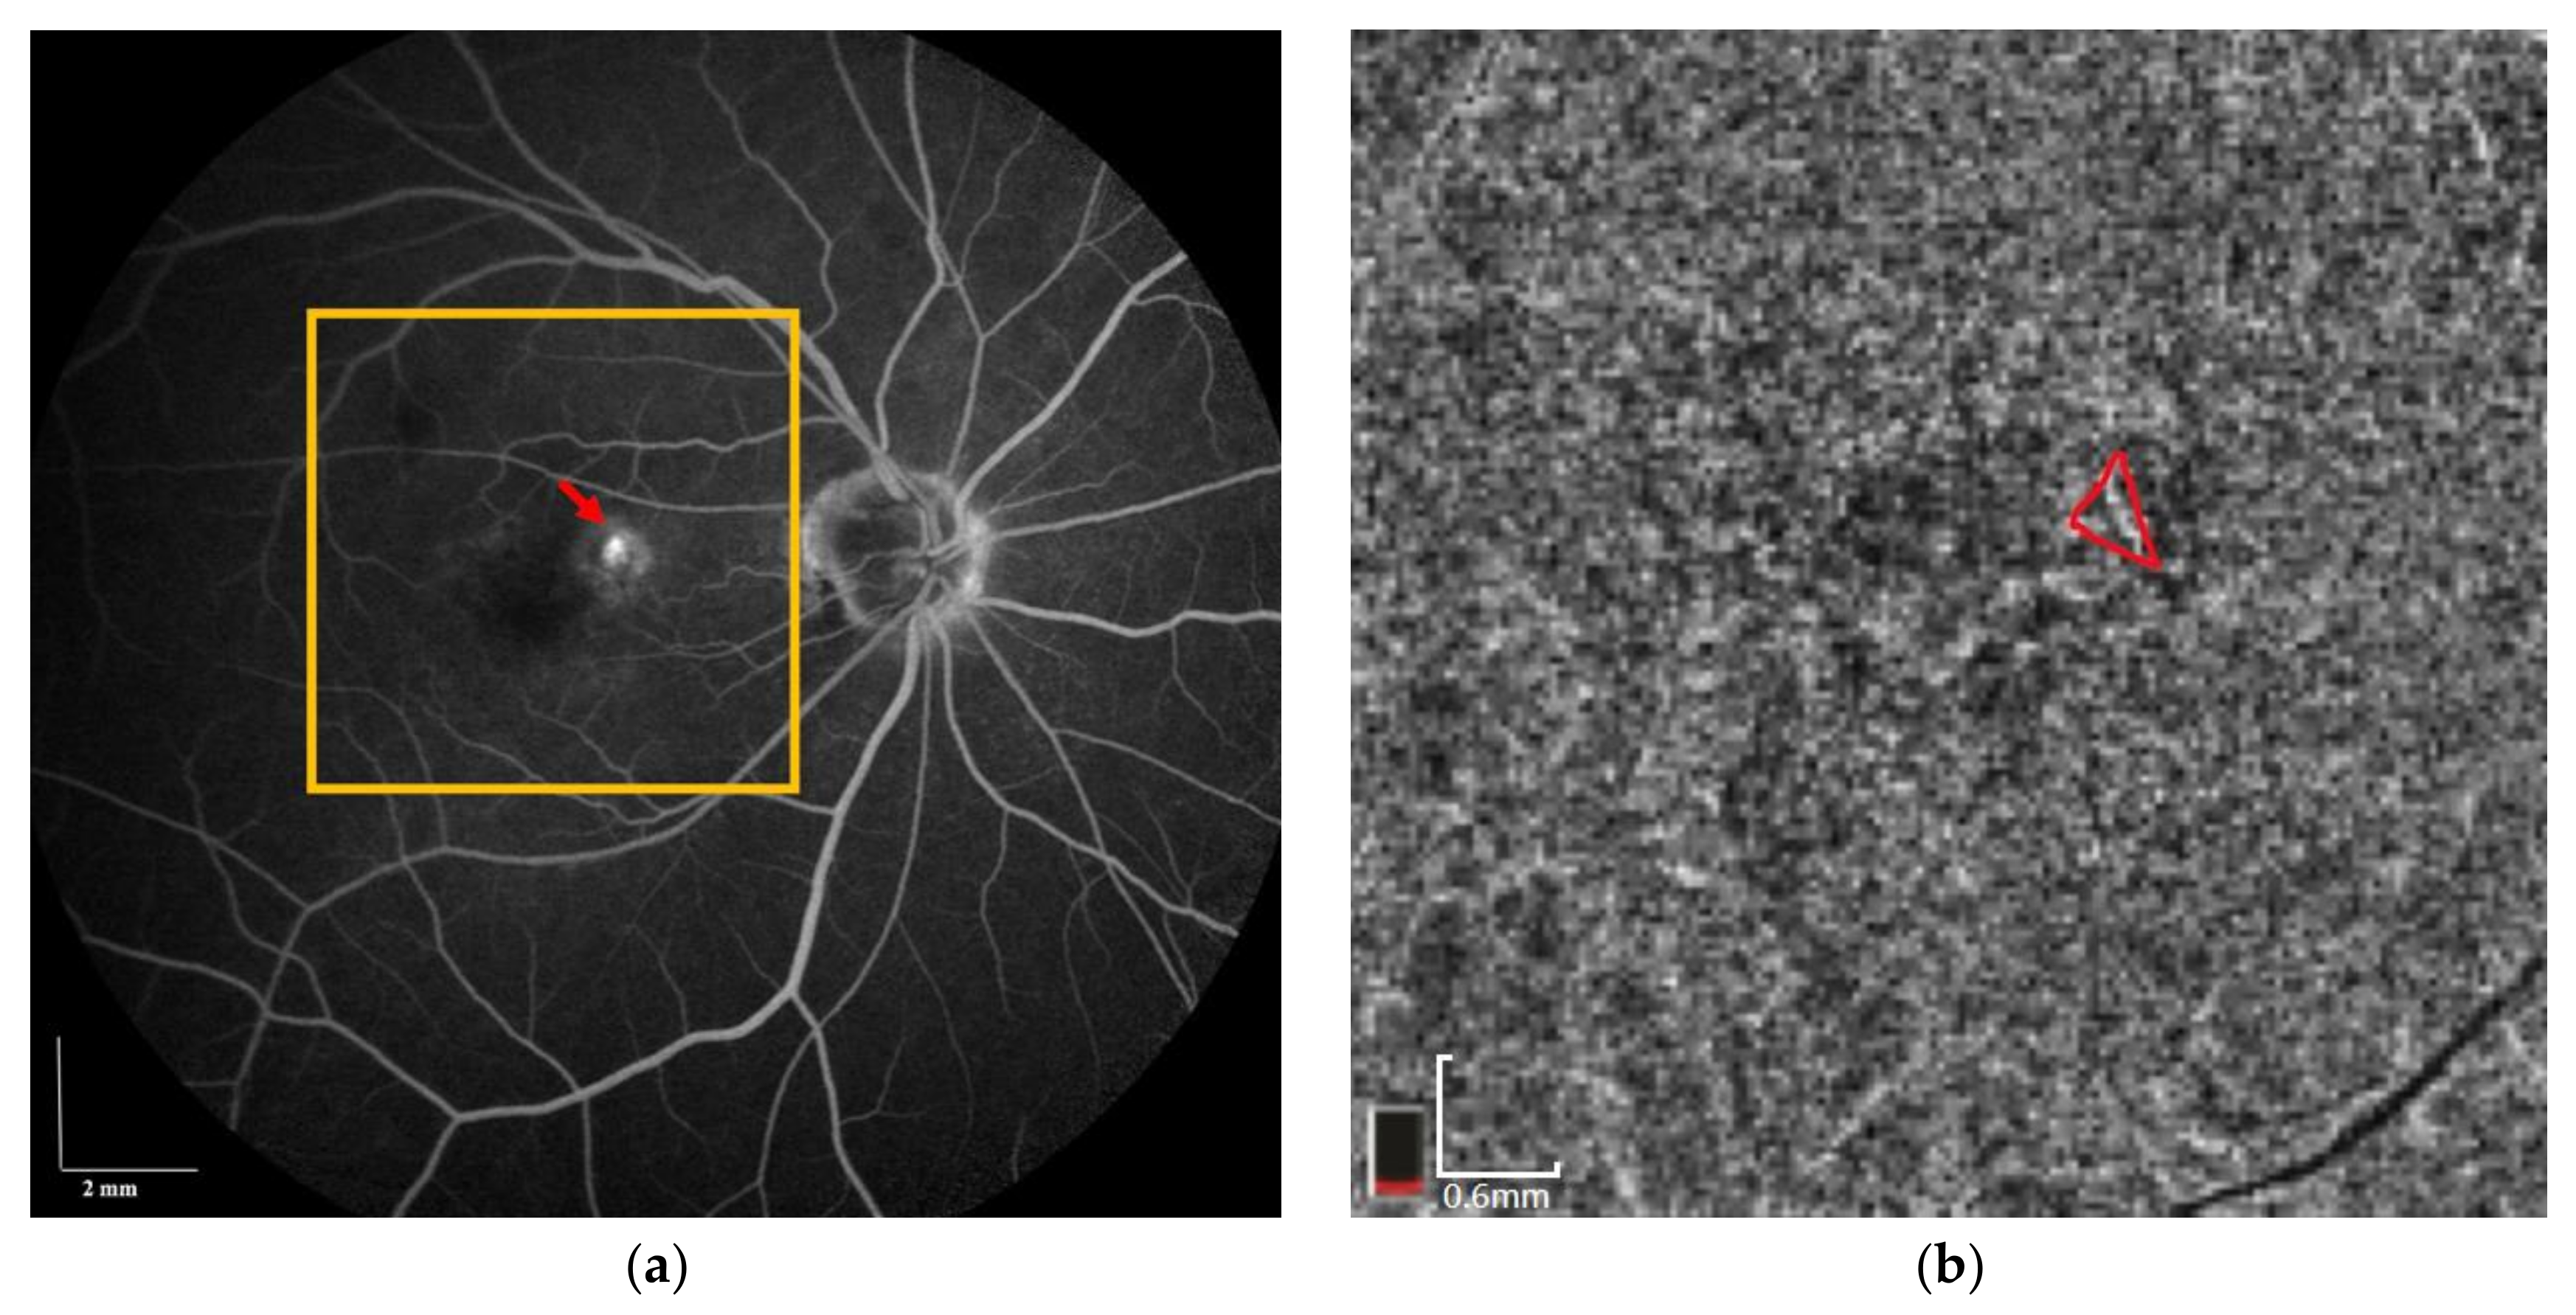
Figure 7. We compared our results with the image of FAG/ICGA (
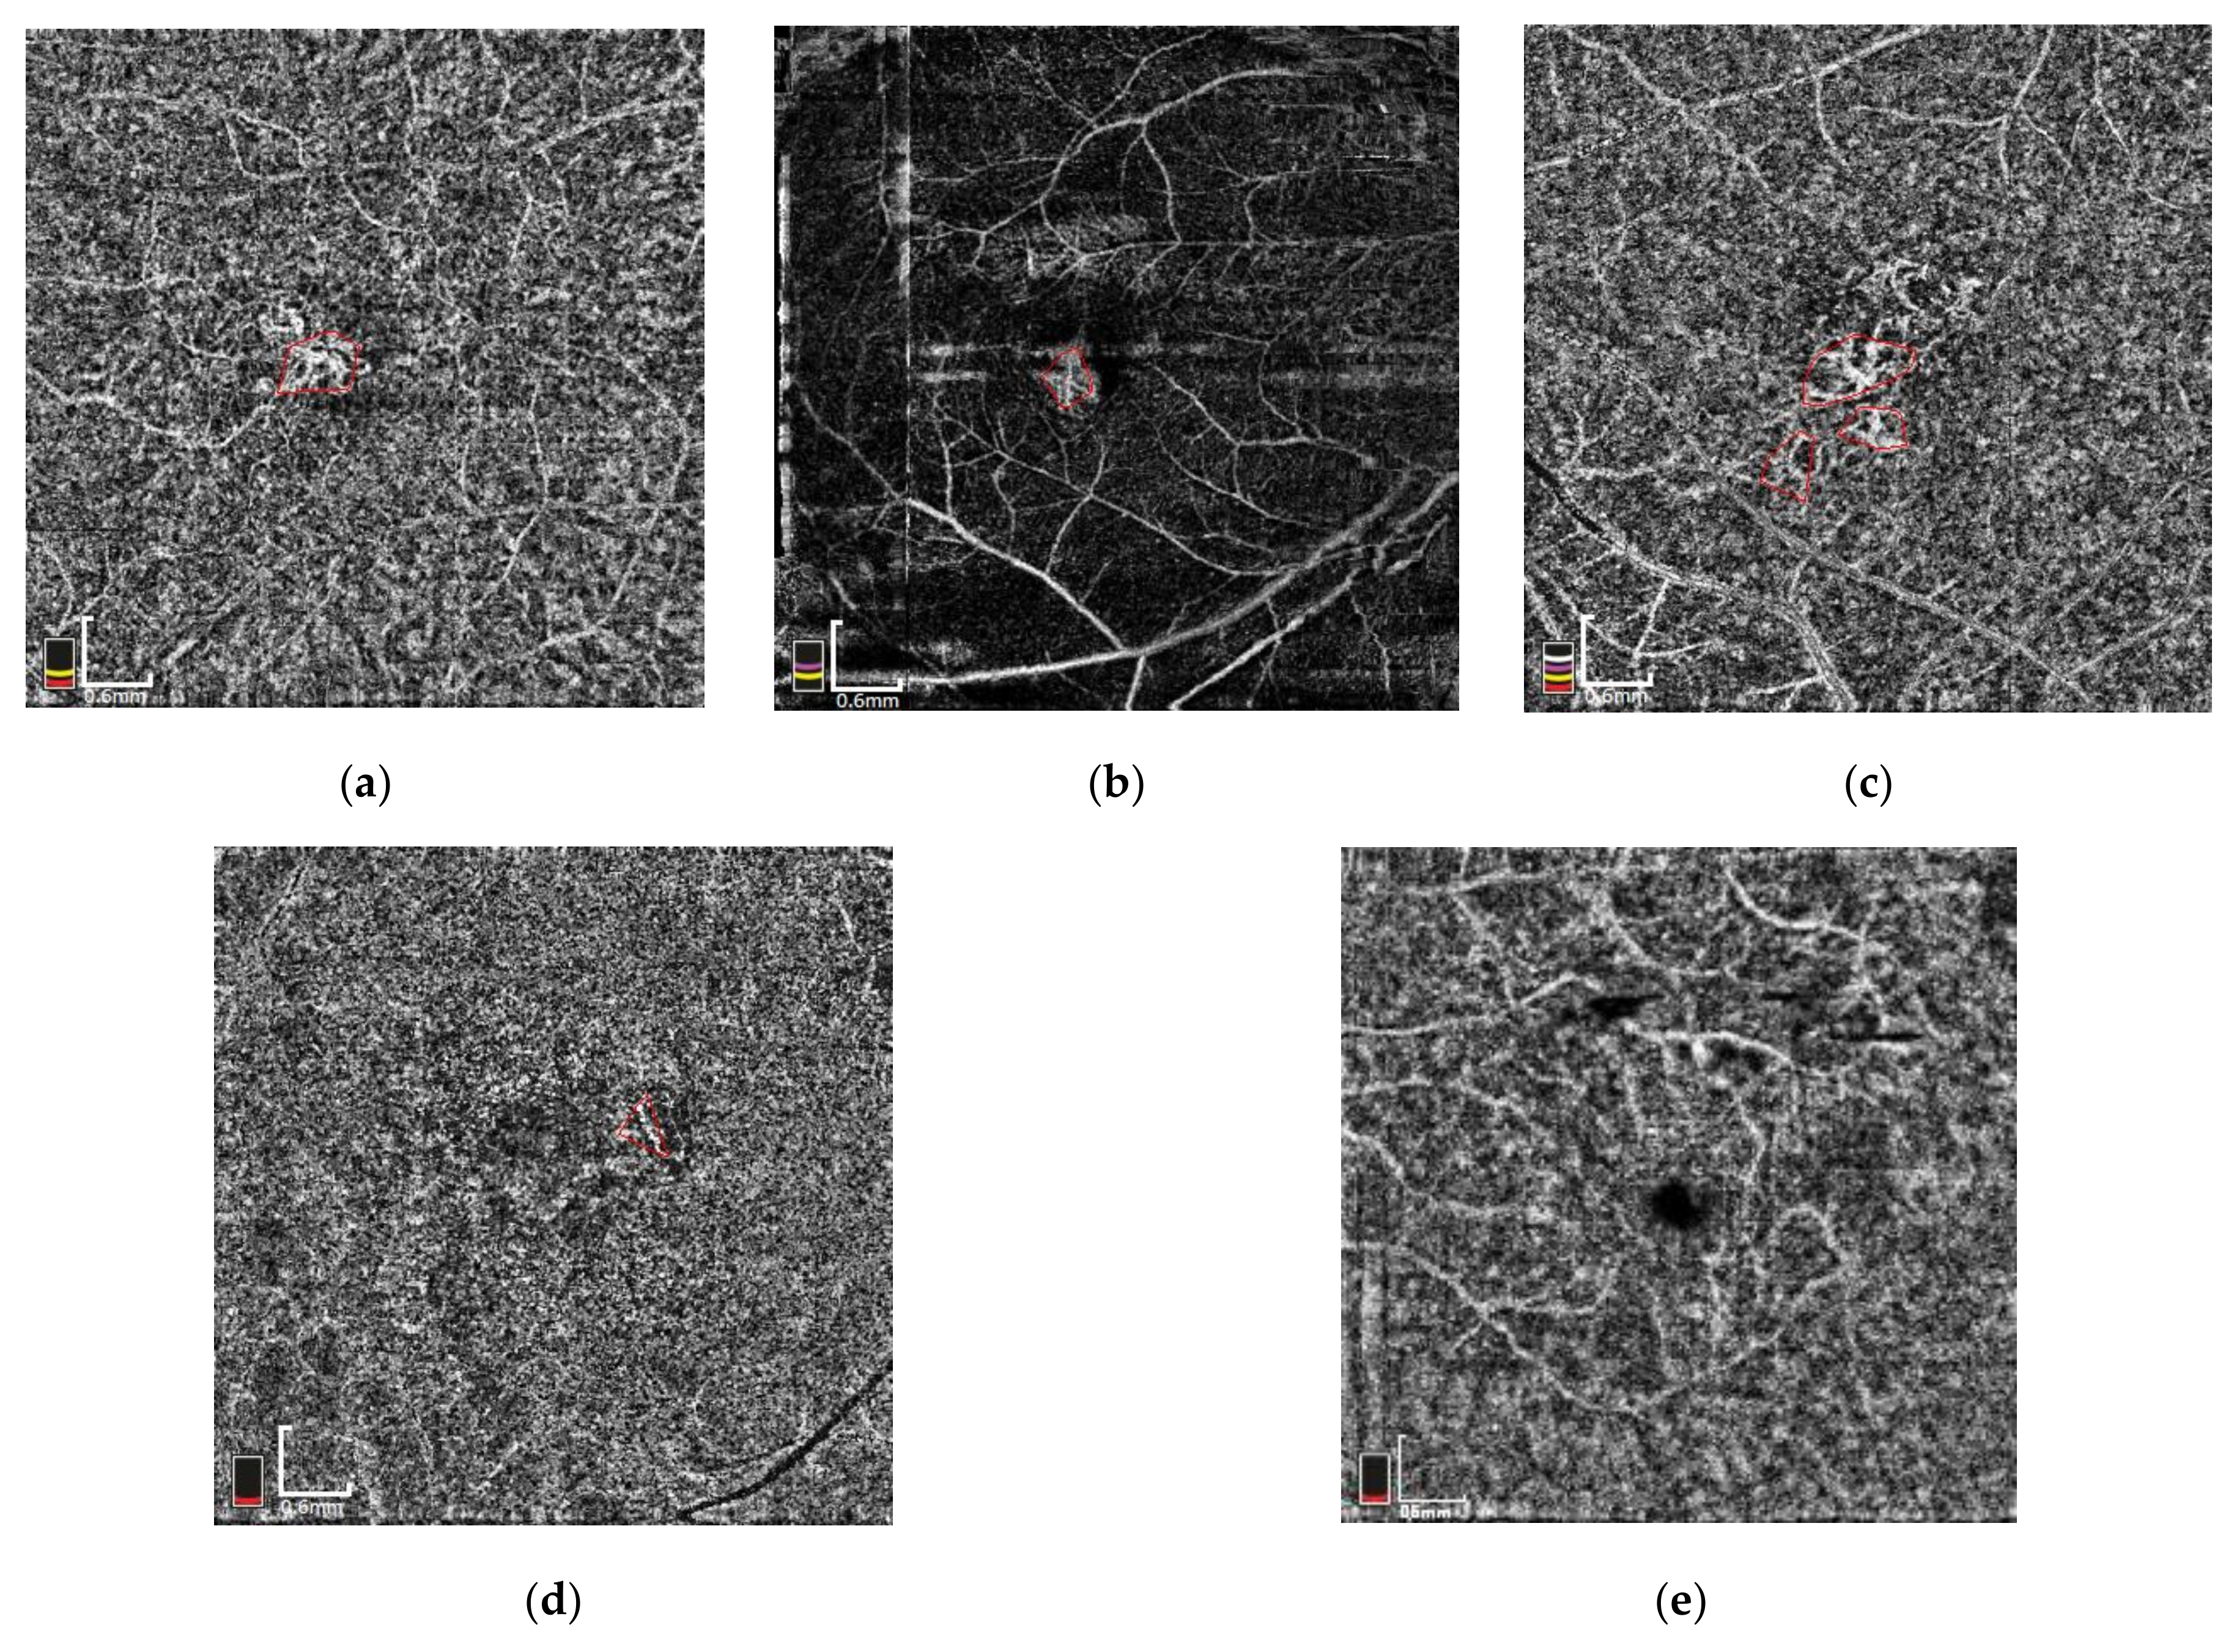
Figure 8). Some detection results for different patients are shown in
Figure 9. As can be seen in
Figure 9, most of the images contain a lot of noise. Even when using the naked eye, it is quite difficult to find the region containing the blood vessels. For
Figure 7, since the original image is a color image, when an image is input into the computer, we used a CIELAB color transform to extract the L-channel, and then used that as a grayscale image for the next processing step. As can be seen from the image, even if we convert to a grayscale image, the color of the image does not change much, implying that this conversion method strongly retains the original color brightness information.
Figure 7 also shows that Otsu’s method can separate the blood vessels from the background, but unfortunately they will contain some of the noise. However, when compared to the noise of the original image, this is quite clear. Since there still remain some noise points which interfere with the blood vessel region, we used the majority and Size filter to solve this problem. This was quite effective for noise cancellation, and retained the blood vessel region as best as possible.
Finally, we used eccentricity as a feature to search for CNV. Through research done on various cases, we know that CNV has a variety of different appearances. Even so, the scheme proposed in this paper can be used to identify them. It is a pity that the last case in
Figure 9 was not found in our experiment. However, this image has CNV on the FA image, but in fact no such vascular structure was found on the OCTA images. This is mainly because this case does not have any clear CNV on the OCTA image, such that our scheme was unable to find it. This also means that our method did not find the CNV with the indefinite shape. Thus, no hard to define areas will be found. In fact, our approach can reduce the possibility of excessive misjudgment, thus indicating that the proposed method is indeed effective.
4. Discussion
The feature of exudative AMD is its development of CNV with associated exudation in the form of intra-/subretinal fluid and subretinal hemorrhage. Subclinical CNV is an abnormal choroidal vessel, passing through breaks in Bruch’s membrane in the eyes, that experiences no overlying exudation or hemorrhage. The rate of conversion of subclinical CNV to exudative AMD has been studied. In two recent prospective cohort studies [
22,
23], the risk of exudation of the eyes through subclinical CNV was shown to be approximately 15 times greater when compared with eyes in the absence of subclinical CNV. Given the noninvasive and time-efficient nature of OCTA imaging in relation to conventional angiography, it can be used to provide images of the choroidal vasculature, and may detect subclinical CNV which is asymptomatic and occurs prior to the development of exudation.
In order to evaluate the diagnostic accuracy of OCTA, several studies have investigated the sensitivity and specificity of CNV detection with OCTA, as compared to FA. The sensitivity rate from OCTA ranged from 81% to 87%, with the corresponding specificities being 91–98% [
24,
25]. Therefore, the use of OCTA imaging could be considered as a reliable tool for CNV diagnosis and follow-up.
An accurate segmentation and quantification of CNV is required during both disease diagnosis and follow up. Up until now, CNV has been delineated manually and is an operator-dependent task. Generally, vessel segmentation methods include an enhancement of vascular structures and the separation of tubular components of the image into vessel and non-vessel structures [
26]. After undergoing two Otsu methods, the blood vessels can be separated from the background. Unfortunately they will still contain some noise; however, this becomes very clear when compared to the noise of the original image. The biggest disadvantage of the Otsu method is that when the CNV is the same as the noise value, it can never be separated. For these noise points that interfere with the blood vessel region, we use a Majority and Size filter to solve this problem, as this is very effective in both eliminating noise and retaining the blood vessel region as best as possible.
Although efforts are always made to protect the blood vessel region from being removed during the process of eliminating noise, there still remains a small number of broken blood vessels. The thinning of morphology and endpoint connection can effectively solve the problem of broken blood vessels. Finally, using the eccentricity as a feature of the resolution CNV, we can find the CNV in most images. But a few CNVs cannot be found with eccentricity. This also means that our method cannot find a CNV with an indeterminate shape. At the same time, it will not locate areas that are difficult to define. In practice, this can reduce the possibility of excessive misjudgments.
There were some limitations of our study. First, we used a relatively small sample size, so further studies on a larger scale should be performed in order to evaluate the sensitivity and specificity of our method. Second, some artifacts such as motion artifacts and projection artifacts may also limit the detection accuracy and quantification of CNV. However, we used ICGA to verify the CNV complexes, which is compatible with the OCTA findings in our method. This proved to be the strength within our study.


