
Fish Processing and Digestion Affect Parvalbumins Detectability in Gilthead Seabream and European Seabass
 ,
,  , , and
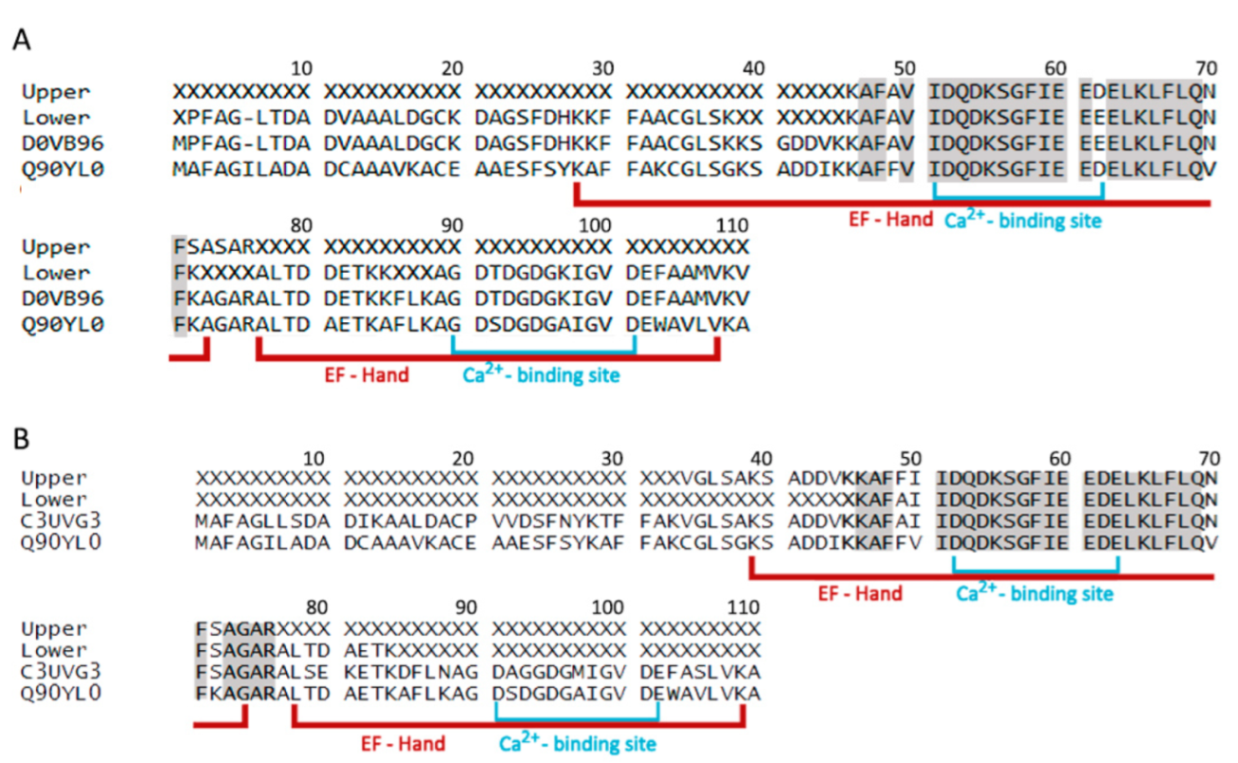
Abstract
:Simple Summary
Abstract
1. Introduction
2. Material and Methods
2.1. Fish and Ethical Legislation
2.2. Protein Extraction
2.3. Parvalbumin Purification
2.4. Identification of Parvalbumin by Mass Spectrometry
2.5. Biomolecular Characterization by Circular Dichroism
2.6. In Vitro Simulation of the Gastrointestinal Tract
2.7. Sandwich ELISA
2.8. Fish Muscle Processing and Conservation
2.9. Statistical Analyses
3. Results and Discussion
3.1. Parvalbumin Purification
3.2. Parvalbumin Identification
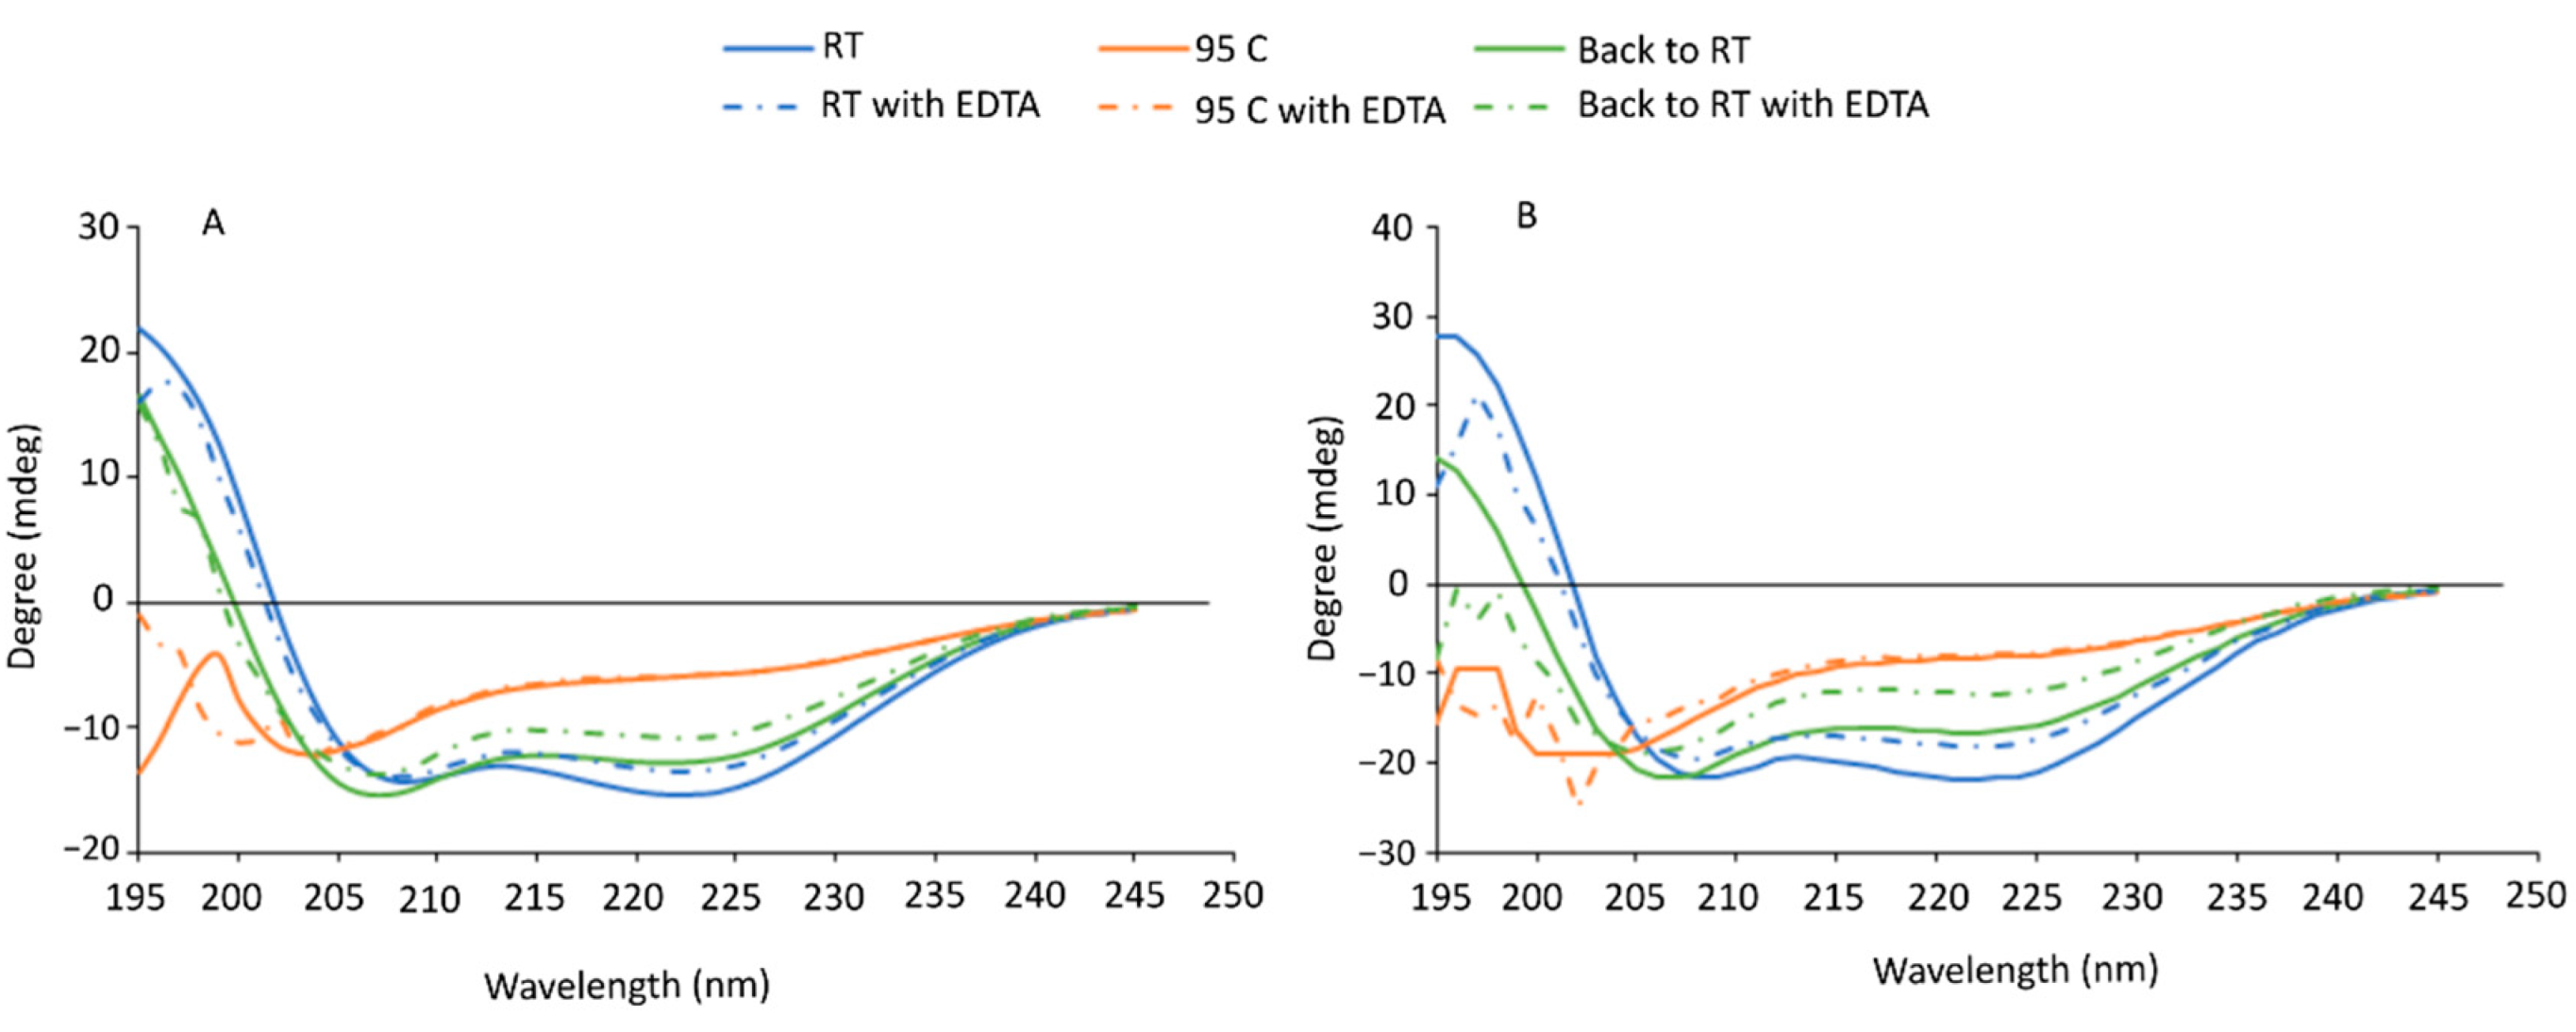
3.3. Circular Dichroism
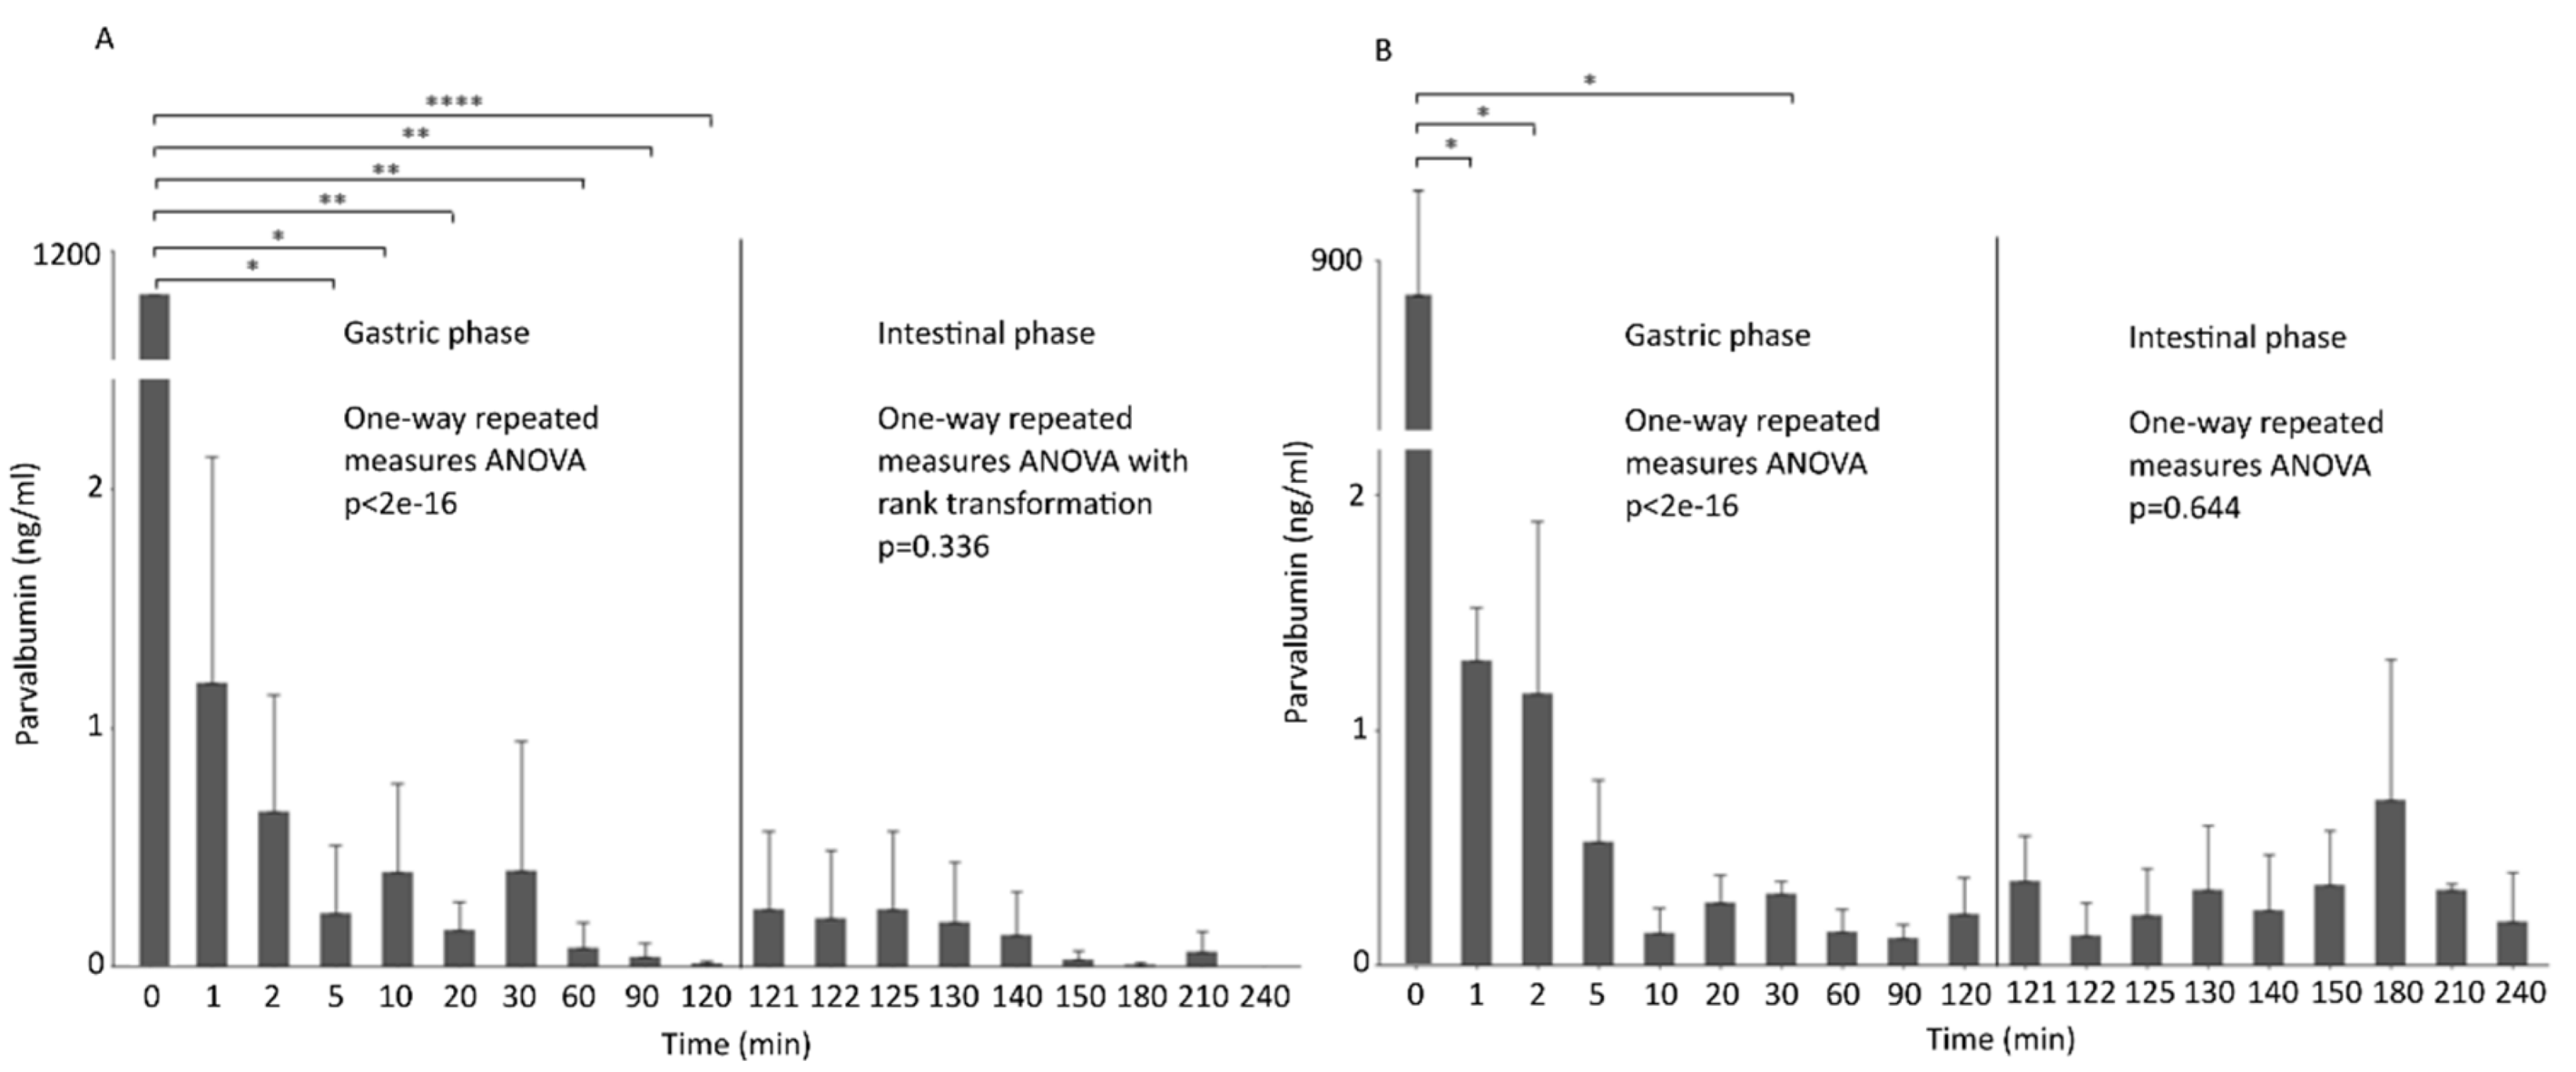
3.4. Parvalbumin Digestion
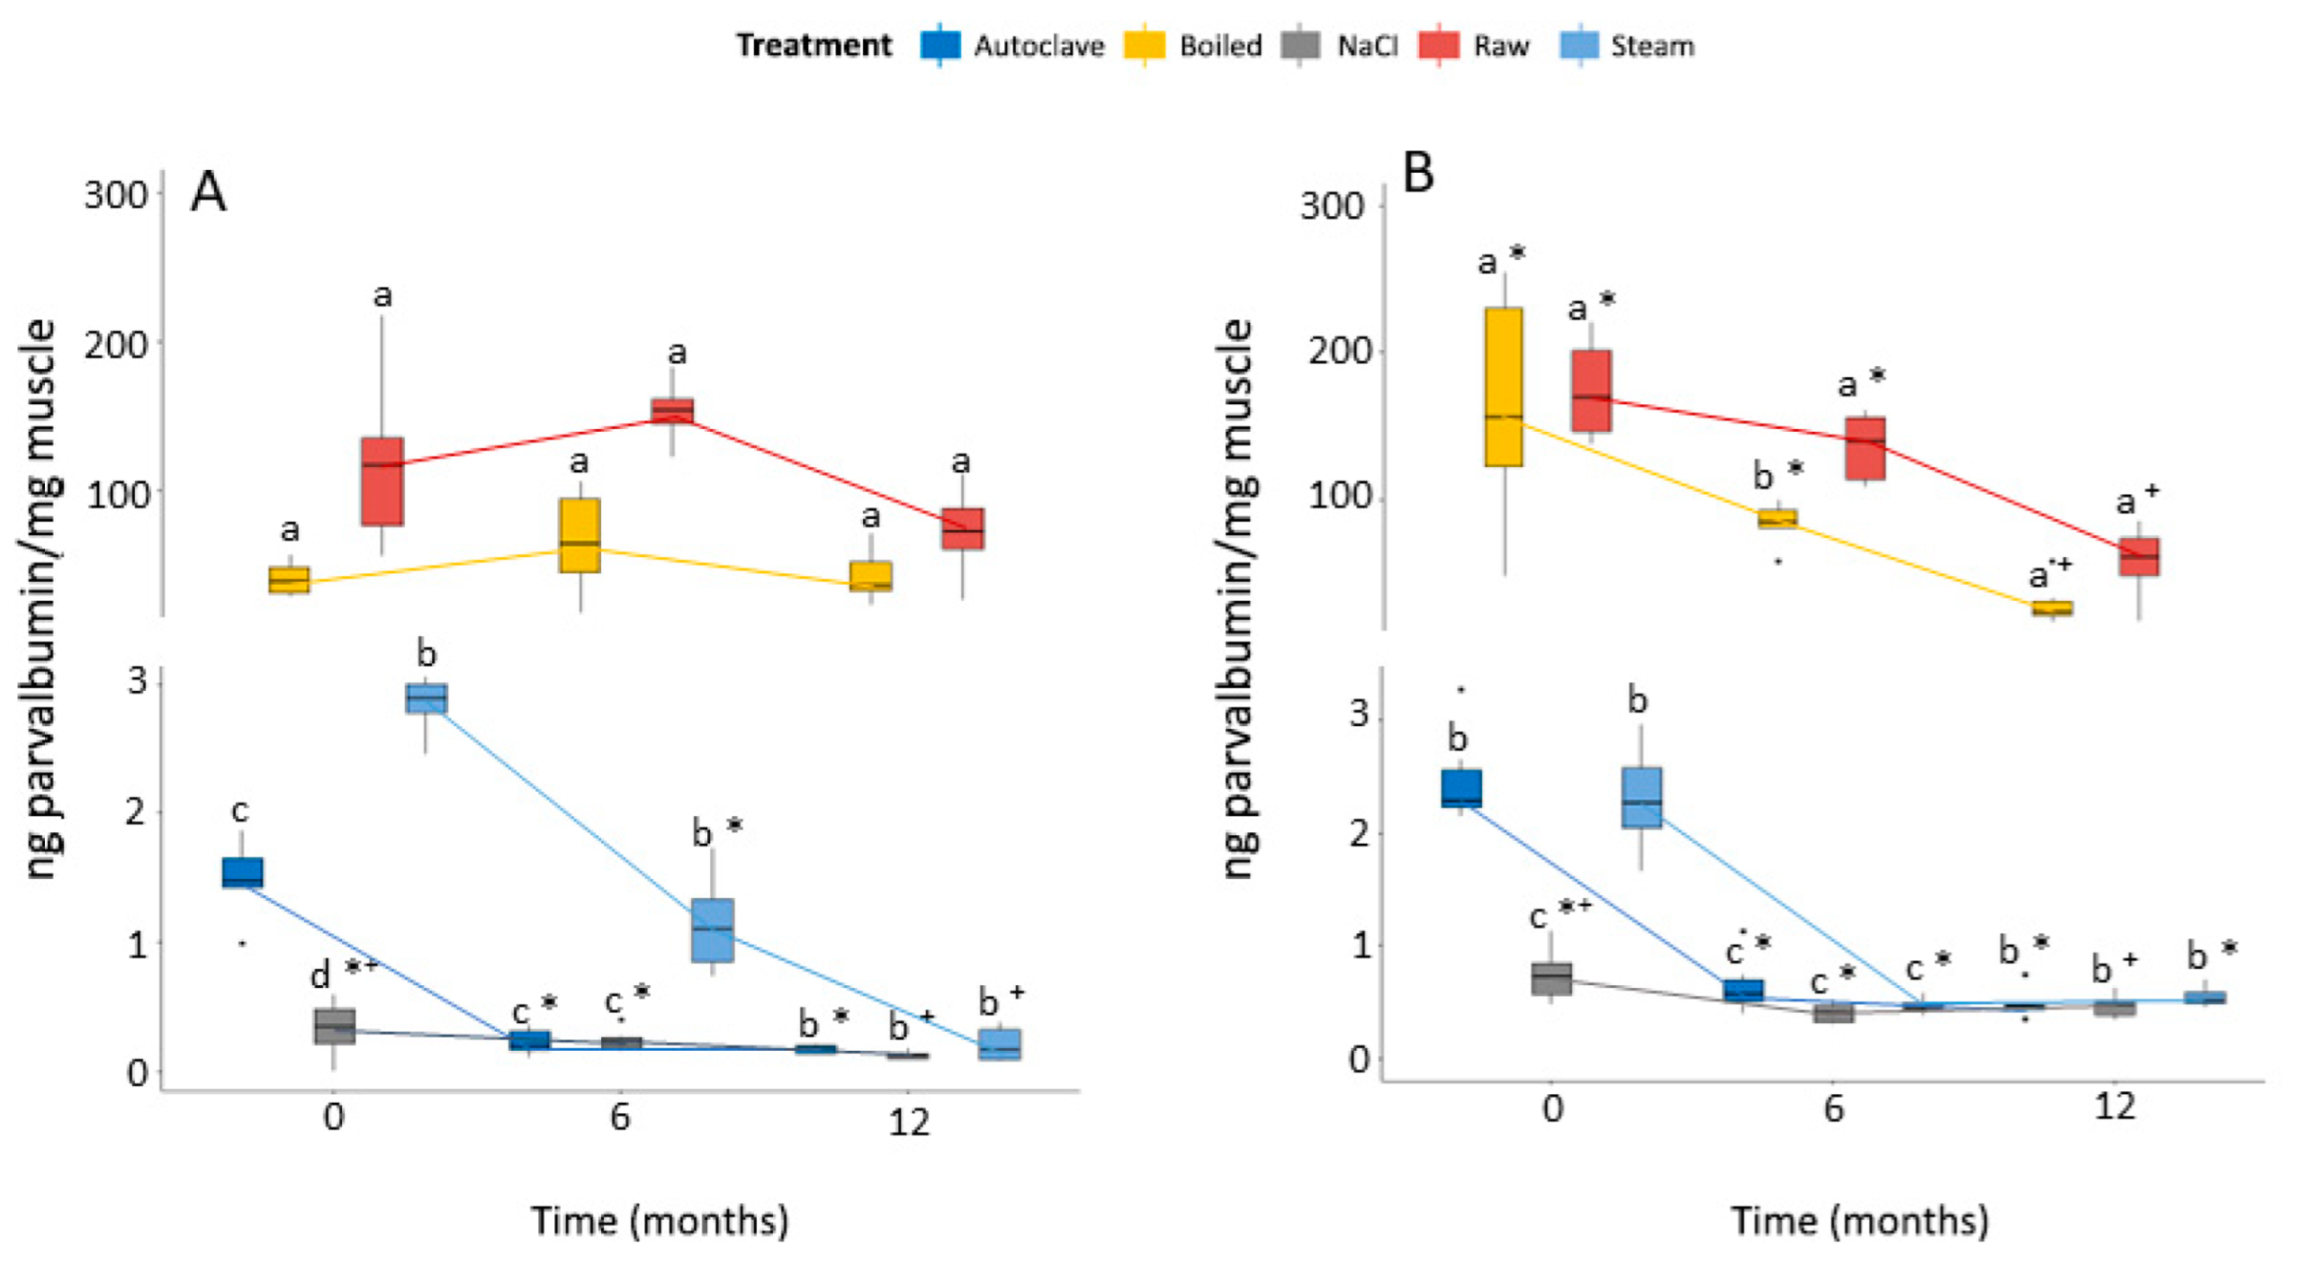
3.5. Fish Processing and Conservation
4. Conclusions
Supplementary Materials
Author Contributions
Funding
Institutional Review Board Statement
Acknowledgments
Conflicts of Interest
References
- Pal, J.; Shukla, B.; Maurya, A.K.; Verma, H.O.; Pandey, G.; Amitha, A. A review on role of fish in human nutrition with special emphasis to essential fatty acid. Int. J. Fish. Aquat. Stud. 2018, 6, 427–430. [Google Scholar]
- Cerqueira, M.; Schrama, D.; Silva, T.S.; Colen, R.; Engrola, S.A.D.; Conceicao, L.E.C.; Rodrigues, P.M.L.; Farinha, A.P. How tryptophan levels in plant-based aquafeeds affect fish physiology, metabolism and proteome. J. Proteom. 2020, 221, 103782. [Google Scholar] [CrossRef]
- FAO. The State of World Fisheries and Aquaculture 2022. Towards Blue Transformation; Food and Agriculture Organization: Rome, Italy, 2022; pp. 1–236. [Google Scholar]
- European Commission. The EU fish market: 2021 edition. In European Market Observatory for Fisheries and Aquaculture Products (EUMOFA); Publications Office of the European Union: Luxembourg, UK, 2021. [Google Scholar]
- O’Brady, K. Allergies. In Encyclopedia of Evolutionary Psychological Science; Shackelford, T.K., Weekes-Shackelford, V.A., Eds.; Springer International Publishing: Cham, Switzerland, 2021; pp. 205–207. [Google Scholar]
- Xepapadaki, P.; Christopoulou, G.; Stavroulakis, G.; Freidl, R.; Linhart, B.; Zuidmeer, L.; Lakoumentas, J.; van Ree, R.; Valenta, R.; Papadopoulos, N.G. Natural History of IgE-Mediated Fish Allergy in Children. J. Allergy Clin. Immunol. Pract. 2021, 9, 3147–3156.e3145. [Google Scholar] [CrossRef]
- Schrama, D.; Czolk, R.; Raposo de Magalhães, C.; Kuehn, A.; Rodrigues, P.M. Fish Allergenicity Modulation Using Tailored Enriched Diets—Where Are We? Front. Physiol. 2022, 13, 1–8. [Google Scholar] [CrossRef]
- Kalic, T.; Kuehn, A.; Aumayr, M.; Bartra, J.; Bindslev-Jensen, C.; Codreanu-Morel, F.; Domínguez, O.; Forstenlechner, P.; Hemmer, W.; Kamath, S.D.; et al. Identification of Potentially Tolerated Fish Species by Multiplex IgE Testing of a Multinational Fish-Allergic Patient Cohort. J. Allergy Clin. Immunol. Pract. 2022, 22, 2198–2213. [Google Scholar] [CrossRef]
- WHO/IUIS Allergen Nomenclature Database. Available online: http://www.allergen.org (accessed on 1 October 2022).
- Kourani, E.; Corazza, F.; Michel, O.; Doyen, V. What we know about fish allergy by the end of the decade? J. Investig. Allergol. Clin. Immunol. 2020, 29, 414–421. [Google Scholar] [CrossRef]
- Silva, T.S.; Cordeiro, O.; Richard, N.; Conceição, L.E.C.; Rodrigues, P.M. Changes in the soluble bone proteome of reared white seabream (Diplodus sargus) with skeletal deformities. Comp. Biochem. Physiol. Part D Genom. Proteom. 2011, 6, 82–91. [Google Scholar] [CrossRef]
- Schwaller, B. The continuing disappearance of “pure” Ca2+ buffers. Cell. Mol. Life Sci. 2009, 66, 275–300. [Google Scholar] [CrossRef]
- Chen, L.; Hefle, S.L.; Taylor, S.L.; Swoboda, I.; Goodman, R.E. Detecting Fish Parvalbumin with Commercial Mouse Monoclonal Anti-frog Parvalbumin IgG. J. Agric. Food Chem. 2006, 54, 5577–5582. [Google Scholar] [CrossRef]
- Kuehn, A.; Scheuermann, T.; Hilger, C.; Hentges, F. Important Variations in Parvalbumin Content in Common Fish Species: A Factor Possibly Contributing to Variable Allergenicity. Int. Arch. Allergy Immunol. 2010, 153, 359–366. [Google Scholar] [CrossRef]
- Carrera, M.; Canas, B.; Gallardo, J.M. Rapid direct detection of the major fish allergen, parvalbumin, by selected MS/MS ion monitoring mass spectrometry. J. Proteom. 2012, 75, 3211–3220. [Google Scholar] [CrossRef]
- Carrera, M.; González-Fernández, Á.; Magadán, S.; Mateos, J.; Pedrós, L.; Medina, I.; Gallardo, J.M. Molecular characterization of B-cell epitopes for the major fish allergen, parvalbumin, by shotgun proteomics, protein-based bioinformatics and IgE-reactive approaches. J. Proteom. 2019, 200, 123–133. [Google Scholar] [CrossRef]
- Laberge, M.; Wright, W.W.; Sudhakar, K.; Liebman, P.A.; Vanderkooi, J.M. Conformational Effects of Calcium Release from Parvalbumin: Comparison of Computational Simulations with Spectroscopic Investigations. Biochemistry 1997, 36, 5363–5371. [Google Scholar] [CrossRef]
- Dasanayaka, B.P.; Li, Z.; Pramod, S.N.; Chen, Y.; Khan, M.U.; Lin, H. A review on food processing and preparation methods for altering fish allergenicity. Crit. Rev. Food Sci. Nutr. 2020, 62, 1951–1970. [Google Scholar] [CrossRef]
- Bernhisel-Broadbent, J.; Strause, D.; Sampson, H.A. Fish hypersensitivity. II: Clinical relevance of altered fish allergenicity caused by various preparation methods. J. Allergy Clin. Immunol. 1992, 90, 622–629. [Google Scholar] [CrossRef]
- Pérez-Tavarez, R.; Carrera, M.; Pedrosa, M.; Quirce, S.; Rodríguez-Pérez, R.; Gasset, M. Reconstruction of fish allergenicity from the content and structural traits of the component β-parvalbumin isoforms. Sci. Rep. 2019, 9, 16298. [Google Scholar]
- Birot, S.; Madsen, C.B.; Kruizinga, A.G.; Christensen, T.; Crépet, A.; Brockhoff, P.B. A procedure for grouping food consumption data for use in food allergen risk assessment. J. Food Compos. Anal. 2017, 59, 111–123. [Google Scholar] [CrossRef]
- Crevel, R. Food allergen risk assessment and management. In Handbook of Food Allergen Detection and Control; Woodhead Publishing: Cambridge, UK, 2015; pp. 41–66. [Google Scholar]
- Moreno, F.J. Gastrointestinal digestion of food allergens: Effect on their allergenicity. Biomed. Pharmacother. 2007, 61, 50–60. [Google Scholar] [CrossRef]
- Fernández-Tomé, S.; Hernández-Ledesma, B. Gastrointestinal Digestion of Food Proteins under the Effects of Released Bioactive Peptides on Digestive Health. Mol. Nutr. Food Res. 2020, 64, 2000401. [Google Scholar] [CrossRef]
- Vanga, S.K.; Singh, A.; Raghavan, V. Review of conventional and novel food processing methods on food allergens. Crit. Rev. Food Sci. Nutr. 2017, 57, 2077–2094. [Google Scholar] [CrossRef]
- Somkuti, J.; Bublin, M.; Breiteneder, H.; Smeller, L. Pressure-temperature stability, Ca2+ binding, and pressure-temperature phase diagram of cod parvalbumin: Gad m 1. Biochemistry 2012, 51, 5903–5911. [Google Scholar] [CrossRef] [PubMed]
- Sletten, G.; Van Do, T.; Lindvik, H.; Egaas, E.; Florvaag, E. Effects of Industrial Processing on the Immunogenicity of Commonly Ingested Fish Species. Int. Arch. Allergy Immunol. 2010, 151, 223–236. [Google Scholar] [CrossRef] [PubMed]
- Schrama, D.; Raposo de Magalhães, C.; Cerqueira, M.; Carrilho, R.; Farinha, A.P.; Rosa da Costa, A.M.; Gonçalves, A.; Kuehn, A.; Revets, D.; Planchon, S.; et al. Effect of creatine and EDTA supplemented diets on European seabass (Dicentrarchus labrax) allergenicity, fish muscle quality and omics fingerprint. Comp. Biochem. Physiol. Part D Genom. Proteom. 2022, 41, 100941. [Google Scholar] [CrossRef] [PubMed]
- De Magalhaes, C.R.; Schrama, D.; Fonseca, F.; Kuehn, A.; Morisset, M.; Ferreira, S.R.; Goncalves, A.; Rodrigues, P.M. Effect of EDTA enriched diets on farmed fish allergenicity and muscle quality; a proteomics approach. Food Chem. 2020, 305, 125508. [Google Scholar] [CrossRef] [PubMed]
- Schrama, D.; Cerqueira, M.; Raposo, C.S.; Rosa da Costa, A.M.; Wulff, T.; Gonçalves, A.; Camacho, C.; Colen, R.; Fonseca, F.; Rodrigues, P.M. Dietary Creatine Supplementation in Gilthead Seabream (Sparus aurata): Comparative Proteomics Analysis on Fish Allergens, Muscle Quality, and Liver. Front. Physiol. 2018, 9, 1844. [Google Scholar] [CrossRef] [Green Version]
- Kalic, T.; Morel-Codreanu, F.; Radauer, C.; Ruethers, T.; Taki, A.C.; Swoboda, I.; Hilger, C.; Hoffmann-Sommergruber, K.; Ollert, M.; Hafner, C. Patients allergic to fish tolerate ray based on the low allergenicity of its parvalbumin. J. Allergy Clin. Immunol. Pract. 2019, 7, 500–508.e511. [Google Scholar] [CrossRef]
- Kuehn, A.; Codreanu-Morel, F.; Lehners-Weber, C.; Doyen, V.; Gomez-André, S.A.; Bienvenu, F.; Fischer, J.; Ballardini, N.; Van Hage, M.; Perotin, J.M. Cross-reactivity to fish and chicken meat–a new clinical syndrome. Allergy 2016, 71, 1772–1781. [Google Scholar] [CrossRef]
- Raith, M.; Zach, D.; Sonnleitner, L.; Woroszylo, K.; Focke-Tejkl, M.; Wank, H.; Graf, T.; Kuehn, A.; Pascal, M.; Muñoz-Cano, R.M. Rational design of a hypoallergenic Phl p 7 variant for immunotherapy of polcalcin-sensitized patients. Sci. Rep. 2019, 9, 7802. [Google Scholar] [CrossRef] [Green Version]
- Sreerama, N.; Woody, R.W. Estimation of protein secondary structure from circular dichroism spectra: Comparison of CONTIN, SELCON, and CDSSTR methods with an expanded reference set. Anal. Biochem. 2000, 287, 252–260. [Google Scholar] [CrossRef]
- Minekus, M.; Alminger, M.; Alvito, P.; Ballance, S.; Bohn, T.; Bourlieu, C.; Carriere, F.; Boutrou, R.; Corredig, M.; Dupont, D.; et al. A standardised static in vitro digestion method suitable for food-an international consensus. Food Funct. 2014, 5, 1113–1124. [Google Scholar] [CrossRef] [Green Version]
- Akkerdaas, J.; Totis, M.; Barnett, B.; Bell, E.; Davis, T.; Edrington, T.; Glenn, K.; Graser, G.; Herman, R.; Knulst, A.; et al. Protease resistance of food proteins: A mixed picture for predicting allergenicity but a useful tool for assessing exposure. Clin. Transl. Allergy 2018, 8, 30. [Google Scholar] [CrossRef] [PubMed] [Green Version]
- Kuehn, A.; Hilger, C.; Graf, T.; Hentges, F. Protein and DNA-based assays as complementary tools for fish allergen detection. Allergol. Sel. 2017, 1, 120. [Google Scholar] [CrossRef] [PubMed]
- Yanar, Y.; Celik, M.; Akamca, E. Effects of brine concentration on shelf-life of hot-smoked tilapia (Oreochromis niloticus) stored at 4 C. Food Chem. 2006, 97, 244–247. [Google Scholar] [CrossRef]
- Zimmerman, D.W.; Zumbo, B.D. Relative power of the Wilcoxon test, the Friedman test, and repeated-measures ANOVA on ranks. J. Exp. Educ. 1993, 62, 75–86. [Google Scholar] [CrossRef]
- Klueber, J.; Schrama, D.; Rodrigues, P.; Dickel, H.; Kuehn, A. Fish allergy management: From component-resolved diagnosis to unmet diagnostic needs. Curr. Treat. Options Allergy 2019, 6, 322–337. [Google Scholar] [CrossRef] [Green Version]
- Untersmayr, E.; Jensen-Jarolim, E. The effect of gastric digestion on food allergy. Curr. Opin. Allergy Clin. Immunol. 2006, 6, 214–219. [Google Scholar] [CrossRef]
- Jiang, X.; Rao, Q. Effect of Processing on Fish Protein Antigenicity and Allergenicity. Foods 2021, 10, 969. [Google Scholar] [CrossRef]
- De Jongh, H.H.; Robles, C.L.; Timmerman, E.; Nordlee, J.A.; Lee, P.-W.; Baumert, J.L.; Hamilton, R.G.; Taylor, S.L.; Koppelman, S.J. Digestibility and IgE-binding of glycosylated codfish parvalbumin. BioMed Res. Int. 2013, 2013, 756789. [Google Scholar] [CrossRef] [Green Version]
- Bugajska-Schretter, A.; Grote, M.; Vangelista, L.; Valent, P.; Sperr, W.R.; Rumpold, H.; Pastore, A.; Reichelt, R.; Valenta, R.; Spitzauer, S. Purification, biochemical, and immunological characterisation of a major food allergen: Different immunoglobulin E recognition of the apo- and calcium-bound forms of carp parvalbumin. Gut 2000, 46, 661–669. [Google Scholar] [CrossRef] [Green Version]
- Kelly, S.M.; Jess, T.J.; Price, N.C. How to study proteins by circular dichroism. Biochim. Biophys. Acta 2005, 1751, 119–139. [Google Scholar] [CrossRef]
- Zhang, Z.; Zhang, R.; McClements, D.J. Control of protein digestion under simulated gastrointestinal conditions using biopolymer microgels. Food Res. Int. 2017, 100, 86–94. [Google Scholar] [CrossRef] [PubMed]
- Brodkorb, A.; Egger, L.; Alminger, M.; Alvito, P.; Assunção, R.; Ballance, S.; Bohn, T.; Bourlieu-Lacanal, C.; Boutrou, R.; Carrière, F. INFOGEST static in vitro simulation of gastrointestinal food digestion. Nat. Protoc. 2019, 14, 991–1014. [Google Scholar] [CrossRef] [PubMed]
- Untersmayr, E.; Poulsen, L.K.; Platzer, M.H.; Pedersen, M.H.; Boltz-Nitulescu, G.; Skov, P.S.; Jensen-Jarolim, E. The effects of gastric digestion on codfish allergenicity. J. Allergy Clin. Immunol. 2005, 115, 377–382. [Google Scholar] [CrossRef] [PubMed]
- Koziolek, M.; Schneider, F.; Grimm, M.; Modebeta, C.; Seekamp, A.; Roustom, T.; Siegmund, W.; Weitschies, W. Intragastric pH and pressure profiles after intake of the high-caloric, high-fat meal as used for food effect studies. J. Control. Release 2015, 220, 71–78. [Google Scholar] [CrossRef] [PubMed]
- Besler, M.; Steinhart, H.; Paschke, A. Stability of food allergens and allergenicity of processed foods. J. Chromatogr. B Biomed. Sci. Appl. 2001, 756, 207–228. [Google Scholar] [CrossRef]
- Bhat, Z.F.; Morton, J.D.; Bekhit, A.E.A.; Kumar, S.; Bhat, H.F. Non-thermal processing has an impact on the digestibility of the muscle proteins. Crit. Rev. Food Sci. Nutr. 2021, 62, 7773–7800. [Google Scholar] [CrossRef] [PubMed]
- Lee, P.W.; Nordlee, J.A.; Koppelman, S.J.; Baumert, J.L.; Taylor, S.L. Measuring parvalbumin levels in fish muscle tissue: Relevance of muscle locations and storage conditions. Food Chem. 2012, 135, 502–507. [Google Scholar] [CrossRef]
- Saptarshi, S.R.; Sharp, M.F.; Kamath, S.D.; Lopata, A.L. Antibody reactivity to the major fish allergen parvalbumin is determined by isoforms and impact of thermal processing. Food Chem. 2014, 148, 321–328. [Google Scholar] [CrossRef]
- Kobayashi, Y.; Yang, T.; Yu, C.-T.; Ume, C.; Kubota, H.; Shimakura, K.; Shiomi, K.; Hamada-Sato, N. Quantification of major allergen parvalbumin in 22 species of fish by SDS–PAGE. Food Chem. 2016, 194, 345–353. [Google Scholar] [CrossRef]
- Luo, C.; Guo, Y.; Li, Z.; Ahmed, I.; Pramod, S.N.; Gao, X.; Lv, L.; Lin, H. Lipid emulsion enhances fish allergen parvalbumin’s resistance to in vitro digestion and IgG/IgE binding capacity. Food Chem. 2020, 302, 125333. [Google Scholar] [CrossRef]
- Shibahara, Y.; Uesaka, Y.; Wang, J.; Yamada, S.; Shiomi, K. A sensitive enzyme-linked immunosorbent assay for the determination of fish protein in processed foods. Food Chem. 2013, 136, 675–681. [Google Scholar] [CrossRef] [PubMed]


Publisher’s Note: MDPI stays neutral with regard to jurisdictional claims in published maps and institutional affiliations. |
© 2022 by the authors. Licensee MDPI, Basel, Switzerland. This article is an open access article distributed under the terms and conditions of the Creative Commons Attribution (CC BY) license (https://creativecommons.org/licenses/by/4.0/).
Share and Cite
Schrama, D.; Raposo de Magalhães, C.; Cerqueira, M.; Carrilho, R.; Revets, D.; Kuehn, A.; Engrola, S.; Rodrigues, P.M. Fish Processing and Digestion Affect Parvalbumins Detectability in Gilthead Seabream and European Seabass. Animals 2022, 12, 3022. https://doi.org/10.3390/ani12213022
Schrama D, Raposo de Magalhães C, Cerqueira M, Carrilho R, Revets D, Kuehn A, Engrola S, Rodrigues PM. Fish Processing and Digestion Affect Parvalbumins Detectability in Gilthead Seabream and European Seabass. Animals. 2022; 12(21):3022. https://doi.org/10.3390/ani12213022
Chicago/Turabian StyleSchrama, Denise, Cláudia Raposo de Magalhães, Marco Cerqueira, Raquel Carrilho, Dominique Revets, Annette Kuehn, Sofia Engrola, and Pedro M. Rodrigues. 2022. "Fish Processing and Digestion Affect Parvalbumins Detectability in Gilthead Seabream and European Seabass" Animals 12, no. 21: 3022. https://doi.org/10.3390/ani12213022