
A Novel Cryptocurrency Price Prediction Model Using GRU, LSTM and bi-LSTM Machine Learning Algorithms


Department of Natural, Engineering and Technology Sciences, Arab American University, Ramallah P600, Palestine
*
Author to whom correspondence should be addressed.
AI 2021, 2(4), 477-496; https://doi.org/10.3390/ai2040030
Submission received: 8 September 2021
/
Revised: 4 October 2021
/
Accepted: 5 October 2021
/
Published: 13 October 2021
Abstract
:Cryptocurrency is a new sort of asset that has emerged as a result of the advancement of financial technology and it has created a big opportunity for researches. Cryptocurrency price forecasting is difficult due to price volatility and dynamism. Around the world, there are hundreds of cryptocurrencies that are used. This paper proposes three types of recurrent neural network (RNN) algorithms used to predict the prices of three types of cryptocurrencies, namely Bitcoin (BTC), Litecoin (LTC), and Ethereum (ETH). The models show excellent predictions depending on the mean absolute percentage error (MAPE). Results obtained from these models show that the gated recurrent unit (GRU) performed better in prediction for all types of cryptocurrency than the long short-term memory (LSTM) and bidirectional LSTM (bi-LSTM) models. Therefore, it can be considered the best algorithm. GRU presents the most accurate prediction for LTC with MAPE percentages of 0.2454%, 0.8267%, and 0.2116% for BTC, ETH, and LTC, respectively. The bi-LSTM algorithm presents the lowest prediction result compared with the other two algorithms as the MAPE percentages are: 5.990%, 6.85%, and 2.332% for BTC, ETH, and LTC, respectively. Overall, the prediction models in this paper represent accurate results close to the actual prices of cryptocurrencies. The importance of having these models is that they can have significant economic ramifications by helping investors and traders to pinpoint cryptocurrency sales and purchasing. As a plan for future work, a recommendation is made to investigate other factors that might affect the prices of cryptocurrency market such as social media, tweets, and trading volume.
1. Introduction
Cryptocurrency is a virtual or digital currency used in financial systems [1,2]. It is secured by cryptography that makes it impossible to be counterfeited or double-spent. Furthermore, it is not issued from a central authority or central banks, and it is decentralized virtual currencies that can be converted via cryptographic procedures [3] and this make it distinguishable from traditional currencies. The other feature is that it is created by technology called blockchain [4], which is an extremely complex, and aims to storing data that makes it difficult or impossible to alter, hack, or defraud the system. Bitcoin has begun to carve out a niche for itself, which may either help cryptocurrencies to gain widespread acceptance or be the major cause of their demise. Cryptocurrencies are still in their infancy, and it is difficult to predict whether they will ever be widely used in global markets or not [5]. The most prominent cryptocurrency, Bitcoin, was established in 2009 and for more than two years was the sole Blockchain-based cryptocurrency. Today, however, there are over 5000 cryptocurrencies and 5.8 million active users in the cryptocurrency industry [6]. Because of its intrinsic nature of mixing encryption technology with monetary units, Bitcoin has recently gotten a lot of attention in the disciplines of economics, cryptography, and computer science [7].
Blockchain (BC), the technology that underpins the Bitcoin cryptocurrency system, is widely seen as critical in providing the backbone for assuring greater security and privacy in a variety of other fields, including the Internet of Things (IoT) ecosystem. It is mainly a digital ledger of transactions that is distributed across the entire network of computer systems on the blockchain [8,9]. The blockchain consists of two fundamental components; the first one is a transaction, and the second is a block. The transaction represents the action triggered by the participant, and the block is a data collection that records the transaction and additional details such as the correct sequence and creation timestamp. Blockchain have a signaling system (BloSS) of multi-domain, blockchain-based, cooperative DDoS defense system in which each autonomous system (AS) joins the defensive alliance [10]. Reference [11] reveals that the effects of networks on competition in the nascent cryptocurrency market over a period of time regarding exchange rates among cryptocurrencies depends on two aspects: (1) competition among different currencies and (2) competition among exchanges. There are hundreds of cryptocurrencies, but Bitcoin is the most popular one as it is a stubborn competitor and did not emerge out of the cryptocurrency competition track. As a result, it has become the dominant cryptocurrency. The authors of [12] describe the competition between cryptocurrency as “healthy competition” and suggests that new technology and security innovation. The authors of [13] reveal that Bitcoin and national currencies show volatility shock transmission, while economic policy uncertainty has little effect. The authors of [14] investigate the interaction between big data and cryptocurrency. One of the most appealing marketplaces for financial speculation is the cryptocurrency market, which means that deceptive activities have flourished via social media. Many people have reaped a lot of profits through speculation in the digital markets, but every investment process suffers from many hidden risks and some investors, particularly those with a high risk tolerance, are interested in investing in cryptocurrency. Therefore, market analysts and speculators rely on prediction [15,16]. With variations in predictive power per cryptocurrency, machine learning and artificial intelligence algorithms are moderately appealing [17]. Low-volatility cryptocurrencies are more predictable than high-volatility ones. There is evidence that the usefulness of different information sets varies between machine learning algorithms, implying that prediction is likely to be much more complicated when a set of machine learning algorithms is used [18]. Despite the widespread use of cryptocurrencies for various types of purchases and transactions around the world, there is no consistent opinion on the definition of cryptocurrency or its legal status [19]. Furthermore, the aforementioned situation exacerbates challenges in criminal investigations of cryptocurrency-based money laundering. As a result, law enforcement organizations are having difficulty pinpointing criminals’ identities and proving that they have committed a crime [20]. Focusing on Bitcoin pricing is similar to stock pricing: none of the risk variables that explain stock price movements apply to cryptocurrencies. Furthermore, traditional macroeconomic variables such as currency rates, commodity prices, and macroeconomic factors that affect other assets have little to no impact on most cryptocurrencies [21]. As a result of the cryptocurrency market’s surge in 2017 [22], various governments across the world have begun to move toward standardizing and overseeing digital money. Because of the security of blockchain technology and their economic environment, people have become more confident in using Bitcoin [22]. Although the blockchain provides a high security ecosystem, the research area surrounding the legality of cryptocurrency cannot be isolated from the people who utilize cryptocurrencies for illicit purposes. The legality of cryptocurrencies has been the subject of numerous debates. The authors of [23] discuss the perspectives and the nature of cryptocurrencies in terms of monetary features, legal considerations, economic considerations, and Sharia considerations. Based on the perspective and characteristics of traditional currency, cryptocurrency does not satisfy the characteristics of a currency from an economic standpoint.
There are hundreds of cryptocurrencies in digital markets, but Bitcoin is the most popular and is affected and interacted with by external influences such as the news, social media, and small cryptocurrencies that have a limited market share, which are often not taked into account from investors and traders. Due to the strong relationships between cryptocurrencies, the smaller ones have become a source of shocks that can positively or negatively affect other cryptocurrencies. The authors of [24] reveal that gold as an independent currency can be used as a good hedging instrument to decrease the risk related to unexpected movement in the cryptocurrency market.
Cryptocurrency prices are difficult to forecast due to price volatility and dynamism. Around the world there are hundreds of cryptocurrencies that clients use. In this paper, we focus on three of the most popular ones. As a result, the paper aims to achieve the following by using deep leaning algorithms, which can discover hidden patterns from data, integrate them, and create far more efficient predictions:
- Presenting a comprehensive study of the various existing schemes to predict the prices of BTC, ETH, and LTC cryptocurrencies.
- Using AI algorithms such as LSTM, bi-LSTM, and GRU to accurately predict the prices of cryptocurrencies.
- Utilizing long short-term memory (LSTM), a deep learning algorithm, and Fbprophet, which is an auto machine learning algorithm, for prediction.
- Evaluating the proposed hybrid models using evaluation matrices such as RMSE and MAPE for Bitcoin, Ethereum, and Litecoin.
The main idea behind these models is to achieve a reliable prediction model that investors can rely on based on historical cryptocurrency prices. Moreover, the paper aims to answer the following research questions: ‘How can machine learning algorithms help investors and decision makers to predict cryptocurrency prices?’ and ‘What is the best model for predicting future cryptocurrency prices?’
This section provides an overview of cryptocurrencies and the remainder of the paper is structured as follows: Section 2 describes the literature review and previous work in this field, Section 3 presents the modeling results and the statistical analysis of the data, Section 4 describes the used dataset, Section 5 illustrates the experimental results, Section 6 presents a comparison between the model proposed in this paper and those of other studies in the literature, and Section 7 summarizes the overall conclusions of the paper.
2. Literature Review
Machine learning (ML) is a type of artificial intelligence that can predict the future based on past data. ML-based models have various advantages over other forecasting models as prior research has shown that it not only delivers a result that is nearly or exactly the same as the actual result, but it also improves the accuracy of the result [25]. Examples of machine learning include neural networks (NN), support vector machines (SVM), and deep learning. The authors of [26] demonstrate that incorporating cryptocurrency into a portfolio improves its effectiveness in two ways. The first is to reduce the standard deviation, and the second is to provide investors with more allocation options. The best cryptocurrency allocation was reported to be in the range from 5% to 20%, depending on the risk tolerance of the investor. The authors of [27] focus on time series data forecasting in particular and apply two machine learning algorithms, random forests (RF) and stochastic gradient boosting machine (SGBM). The results show that the ML ensemble technique can be used to anticipate Bitcoin values.
The decision-making process needs to make the appropriate decision at the right time, reducing the risks associated with the investment process. In [28], a hybrid cryptocurrency prediction system based on LSTM and GRU is presented, focusing on two cryptocurrencies, Litecoin and Monero. The authors of [29] use minute-sampled Bitcoin returns over 3 h periods to aggregate RV data. A variety of machine learning methods, including ANN (MLP, GRU, and LSTM), SVM, and ridge regression, were used to predict future values based on past samples, which are compared to the heterogeneous auto-regressive realized volatility (HARRV) model with optimized lag parameters. The findings show that the suggested system correctly predicts prices with high accuracy, indicating that the method may be used to forecast prices for a variety of cryptocurrencies. The authors of [30] employ the traditional support vector machine and linear regression methods to forecast Bitcoin values. This research takes into account a time series prediction made up of everyday Bitcoin closing prices for the creation of Bitcoin prediction models. The authors of [31] used machine learning techniques to address both a multiple regression technique that relies on highly correlated characteristics and a deep learning mechanism that uses a conjugate gradient mechanism in conjunction with a linear search for BTC price prediction. In [32], the price movements of Bitcoin, Ethereum, and Ripple are analyzed. The authors utilize powerful artificial intelligence frameworks, including a fully linked artificial neural network (ANN) and a long short-term memory (LSTM) recurrent neural network, and they discovered that ANN relies more on long-term history, whereas LSTM relies more on short-term dynamics, implying that LSTM is more efficient at extracting meaningful information from historical memory than ANN. The study in [33] on Bitcoin daily price prediction with high-dimensional data reveals that logistic regression and linear discriminant analysis achieve an accuracy of 66%. On the other hand, surpassing (a sophisticated machine learning algorithm) outperforms the benchmark results for daily price prediction, with statistical techniques and machine learning algorithms having the greatest accuracies of 66% and 65.3%, respectively. The study in [34] examines the use of neural networks (NN), support vector machines (SVM), and random forest (RF). The findings demonstrate that machine learning and sentiment analysis may be used to anticipate cryptocurrency markets (with Twitter data alone being able to predict specific coins) and that NN outperforms the other models. In [35], the LSTM model is used to predict and find methods for forecasting Bitcoin on the stock market through Yahoo Finance that may predict a result of more than 12,600 USD in the days after the prediction. Due to the importance of the development of a robust and reliable method for predicting cryptocurrency prices, researchers have focused on more innovative models. In [36], both linear and non-linear time-series components of the stock dataset were used for forecasting using the hybrid model. In the non-linear time series forecast, CNN and Seq2Seq LSTMs were successfully coupled for dynamic modeling of short- and long-term dependent patterns. The study in [37] focused on social factors, which are increasingly being utilized for online transactions throughout the world, by using a multi-linear regression model and that analyzes two big capital market cryptocurrencies, BTC and LTC. The authors of [37] found that the R2 scores were 44% for LTC and 59% for BTC. Ref. [38] used two different LSTM models (a standard LSTM model and an LSTM with an AR(2) model). This study presented a forecasting framework, using an LSTM model to forecast Bitcoin daily prices. The study in [38] found that the model with AR(2) was better than LSTM with an RMSE of 247.33. Researchers in [39] compared three different models (ARIMA, LSTM and GRU) for predicting BTC’s price. The experimental outcomes in [39] showed that ARIMA achieved the best performance with a MAPE of 2.76% and RMSE of 302.53. The study in [40] presented two types of prediction models constructed using Bayesian optimized RNN and LSTM to predict the price of BTC. The study revealed that LSTM showed better performance and achieved an accuracy of 52% and RMSE of 8%.
The investment process mainly depends on the historical price of a cryptocurrency. One of the most important strategies that the investor depends on is building Markov chains. This strategy consists of multiple decision trees that are used to identify the cryptocurrency that is estimated to provide a greater return when sold and then comparing the estimation with the actual figure [41]. Due to the importance of prediction in the investment process that many people depend on to earn revenue, this paper focuses on three models that can predict future cryptocurrency prices using machine learning algorithms and artificial intelligence approaches to achieve accurate prediction models with the aim of helping investors.
3. Materials and Methods
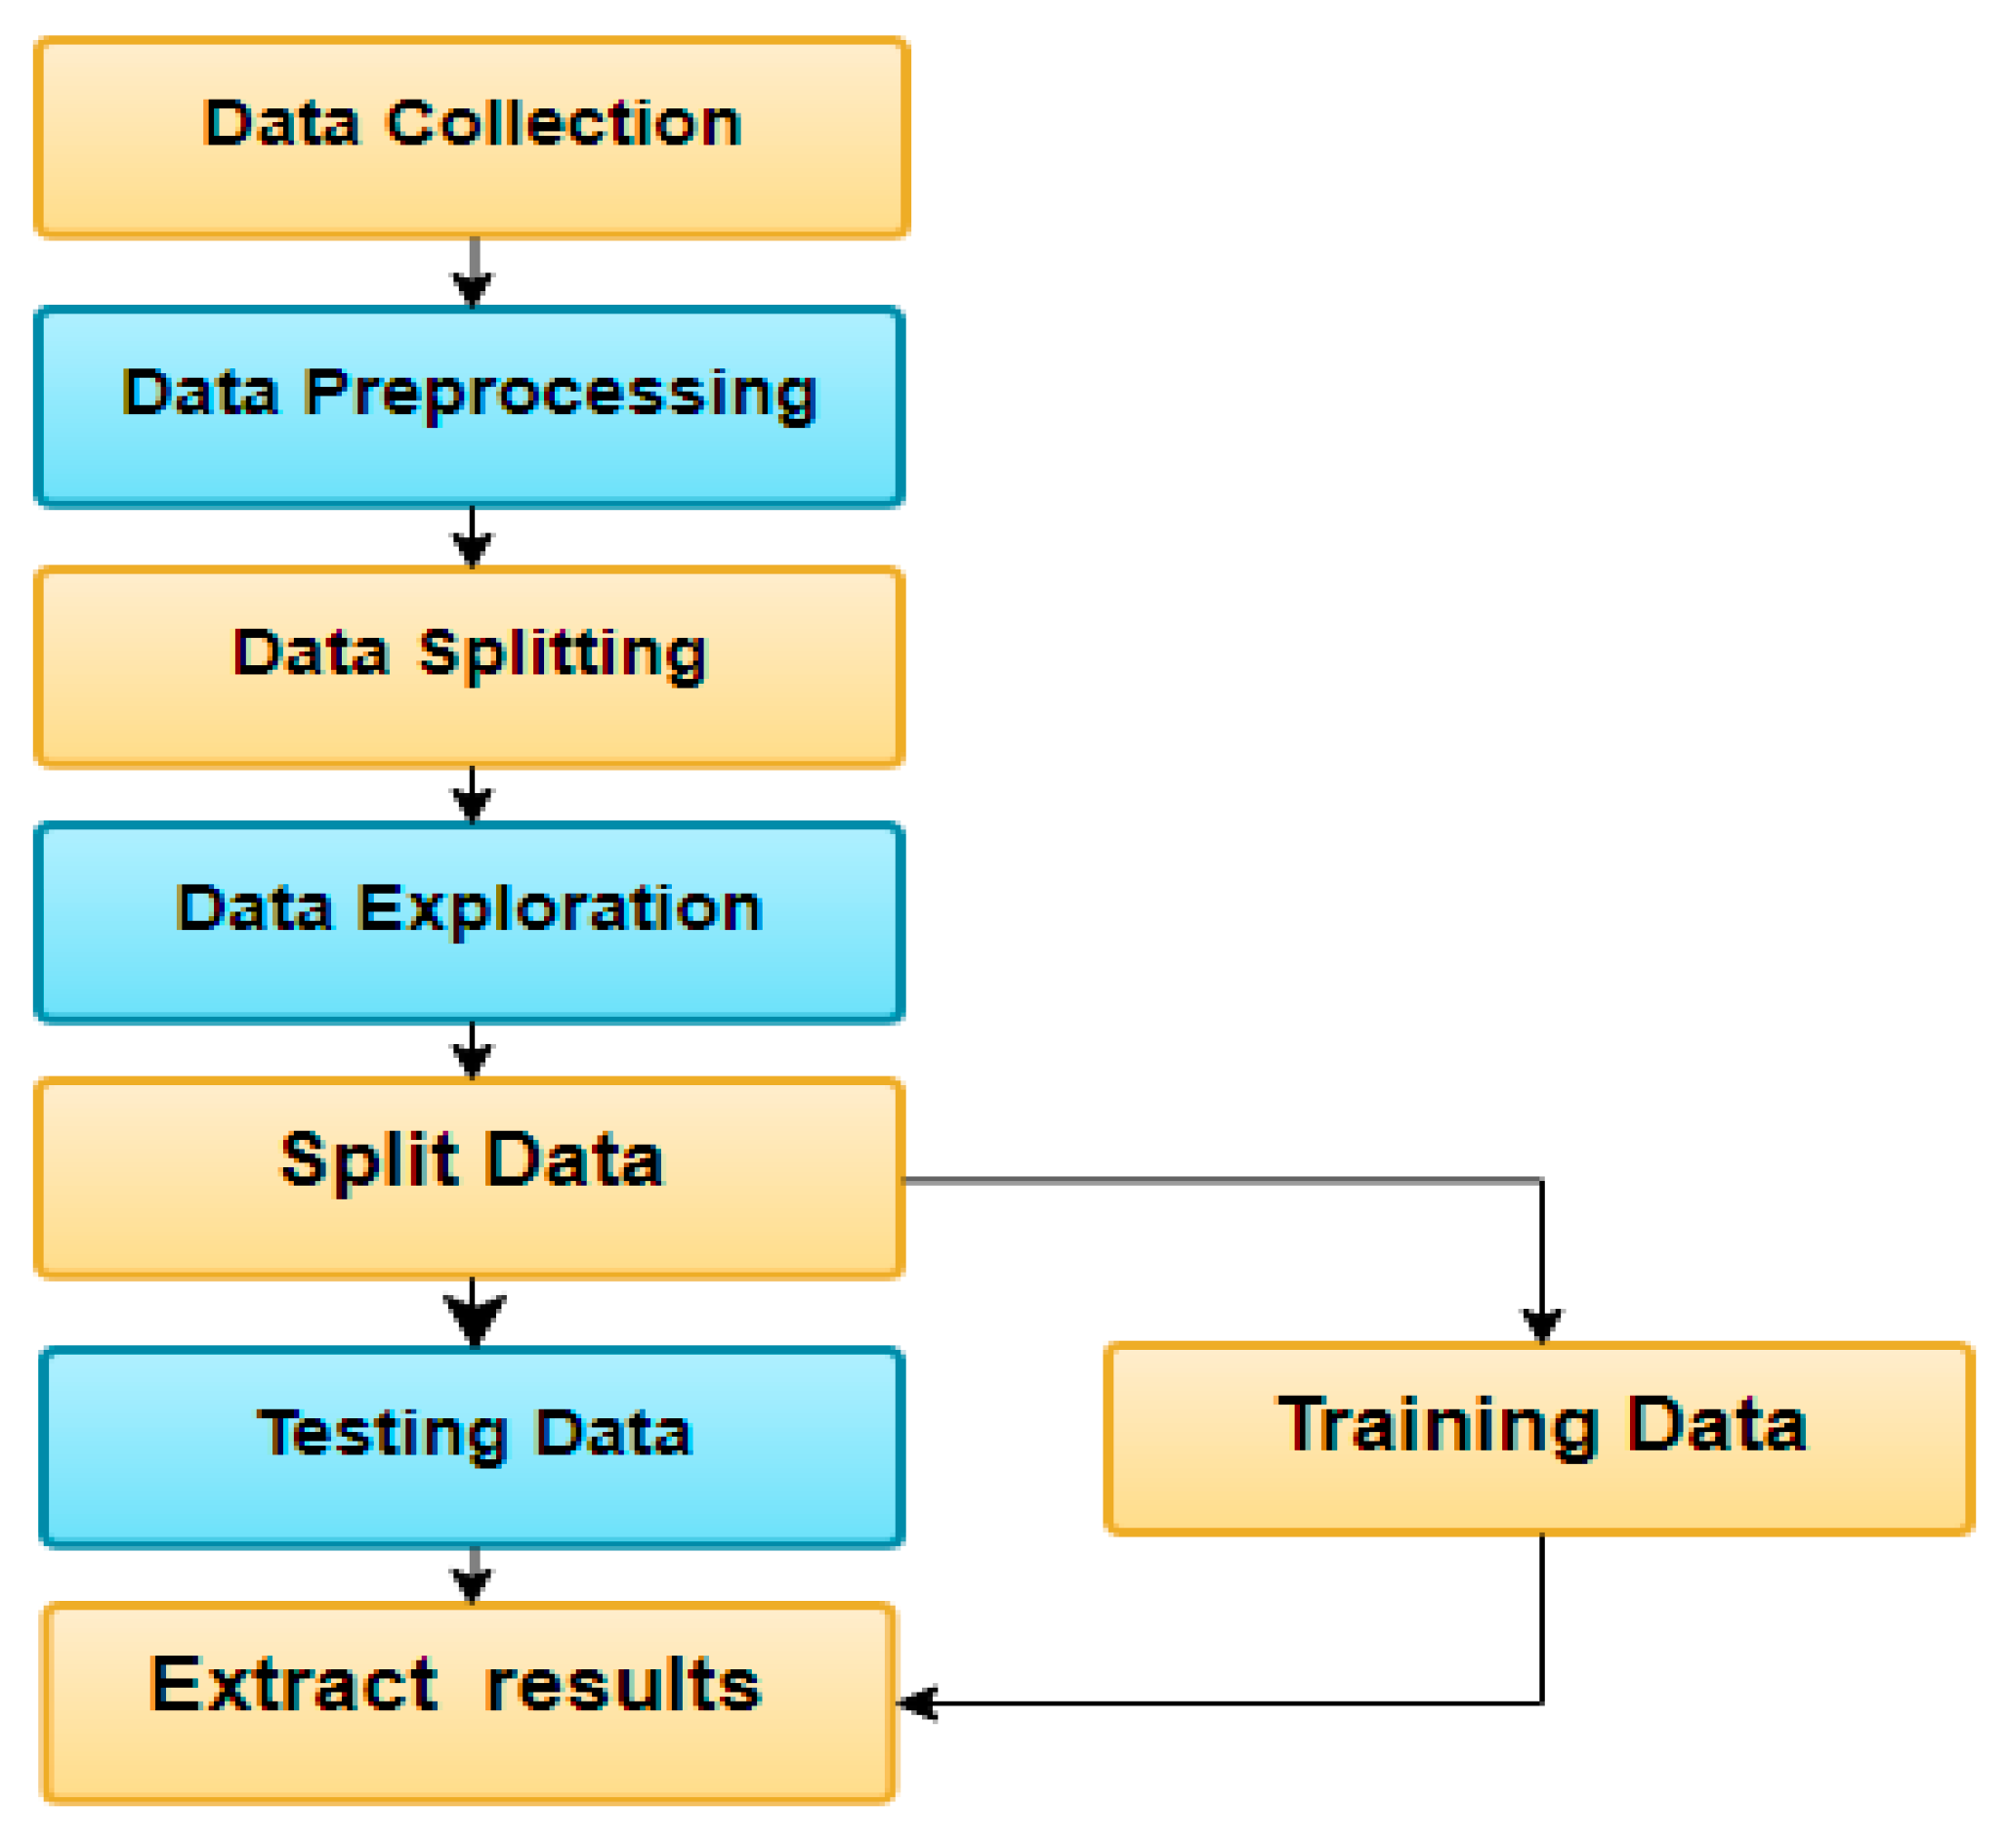
To achieve the aims of this paper, we trained three distinct models for three different forms of cryptocurrency price prediction using historical cryptocurrency prices. Then, in order to evaluate the suggested schemes’ performances, we compare the accuracy of our proposed model to that of current models by following five stages: (1) collecting historical cryptocurrency data; (2) data exploration and visualization; (3) training three types of models; (4) testing the models; and (5) extracting and comparing the results.
In this section, we present and compare three types of algorithms—long short-term memory (LSTM), gated recurrent unit (GRU), and bidirectional LSTM (bi-LSTM)—to predict the price of three types of cryptocurrency based on historical data—Bitcoin (BTC), Litecoin (LTC) and Ethereum (ETH). Figure 1 shows the methodology of processing the dataset. It starts with data collection, then the data visualization process is used to illustrate and explore the data’s behavior and distribution and the relationship between the cryptocurrencies. Next, the models are trained with 80% of the collected dataset [42]. The training dataset is from 22 January 2018 until 22 October 2020 and the testing dataset (20% of the data) is form 22 October 2020 until 30 June 2021. Then, after training the models we tested them. Then, we extracted and compared the results and selected the best model depending on the daily closing price.
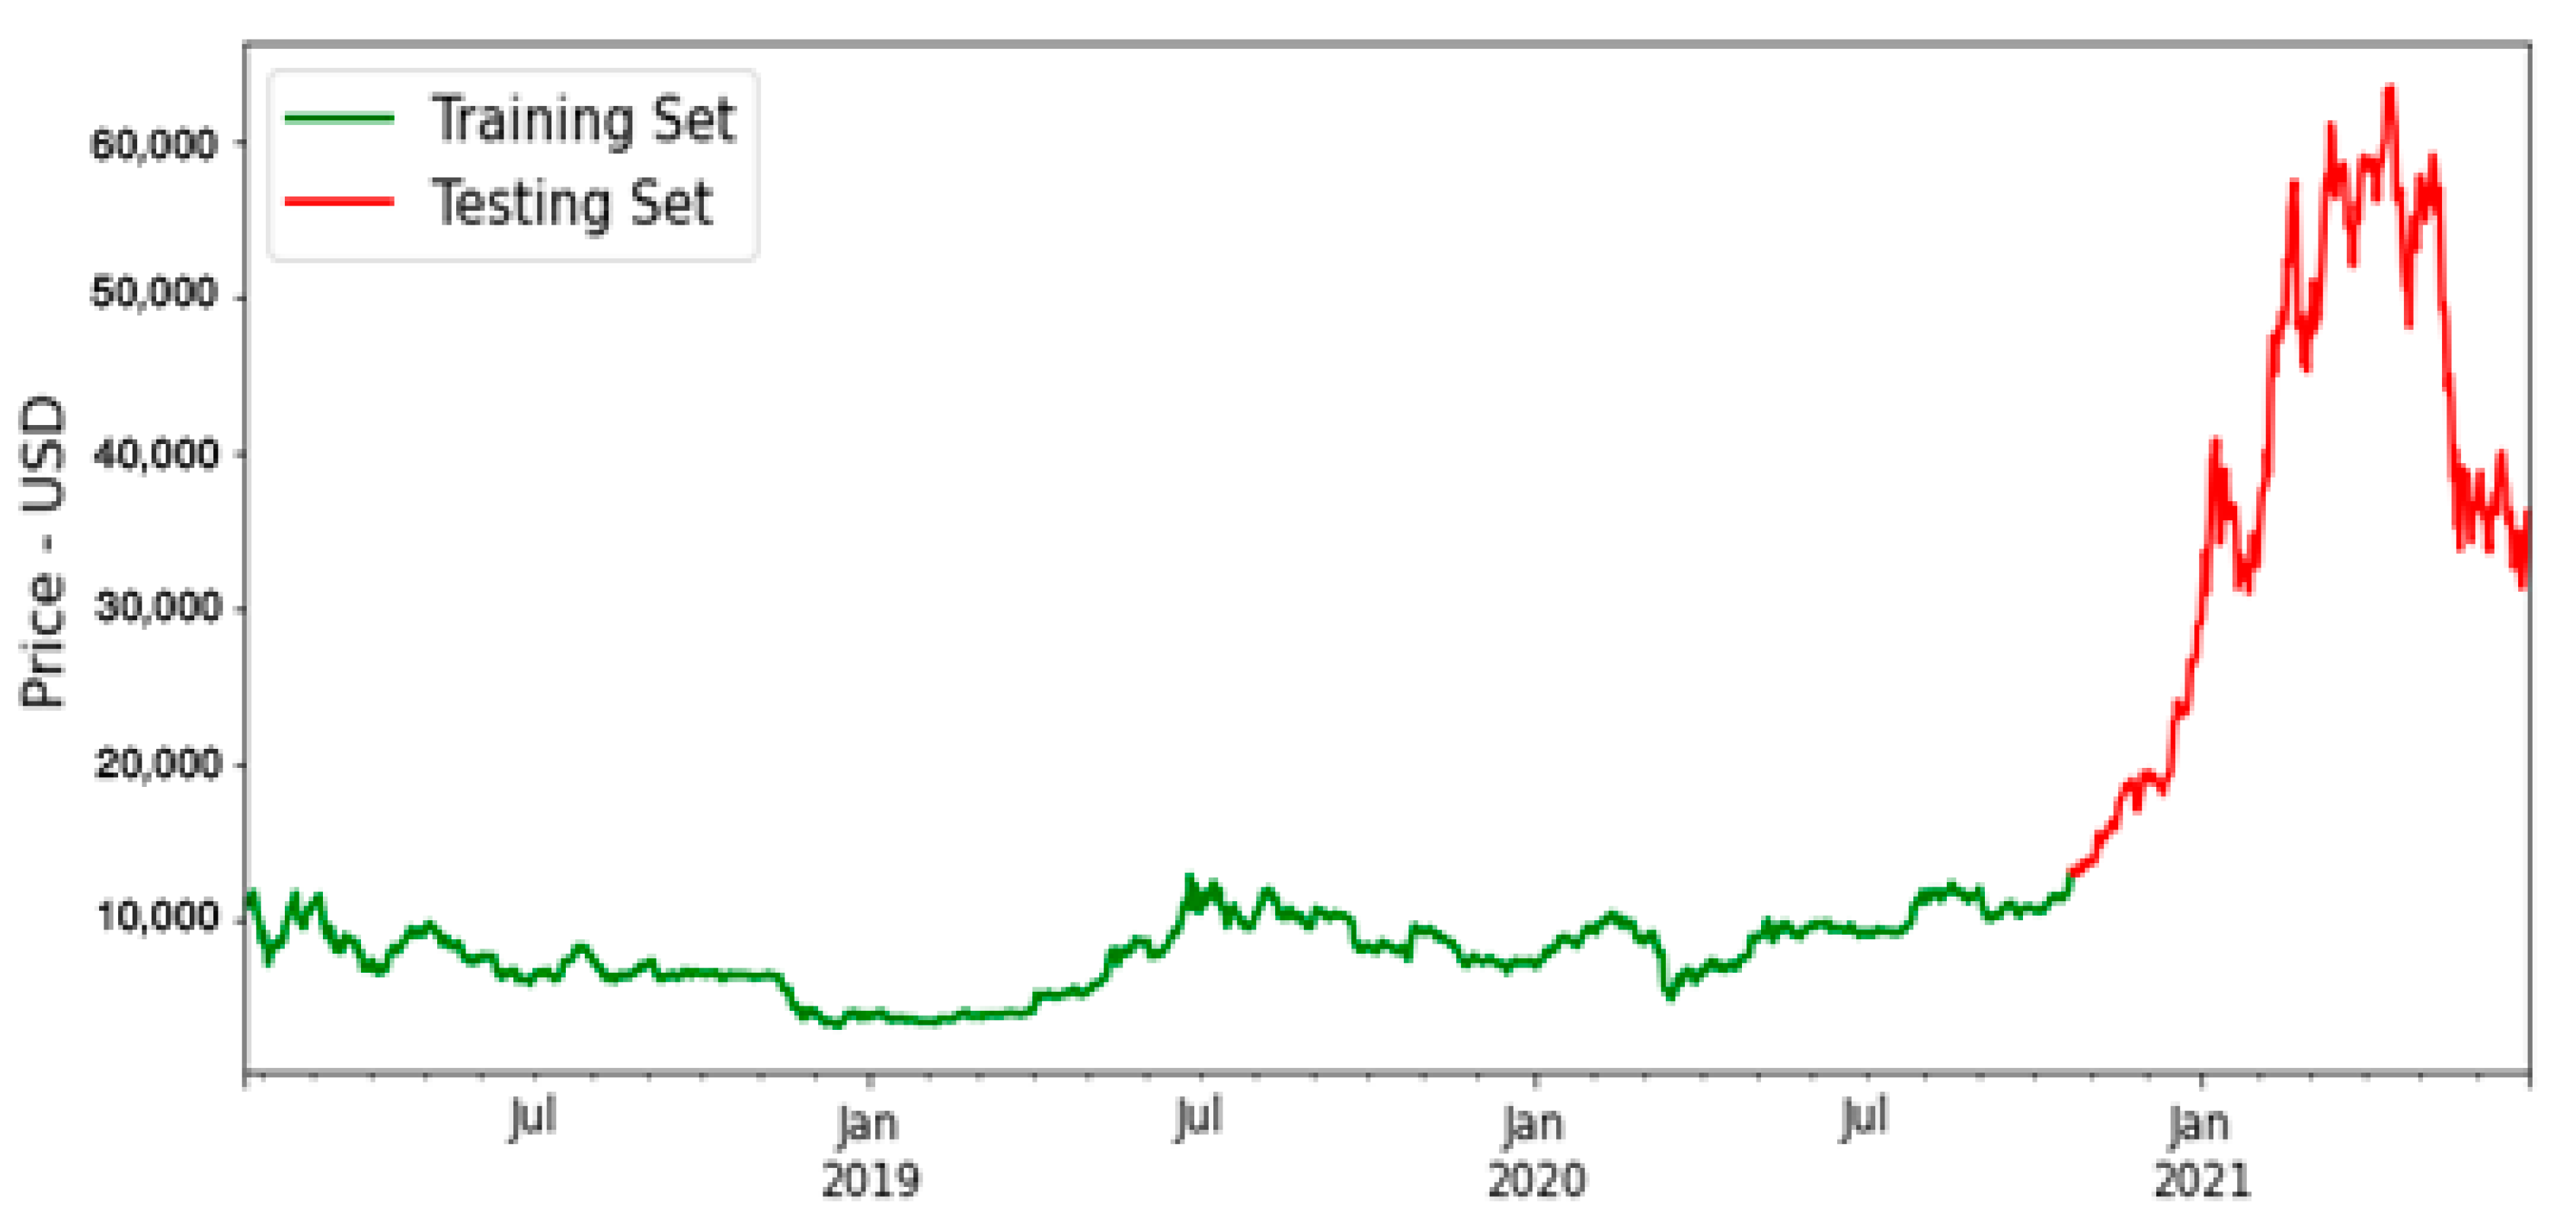
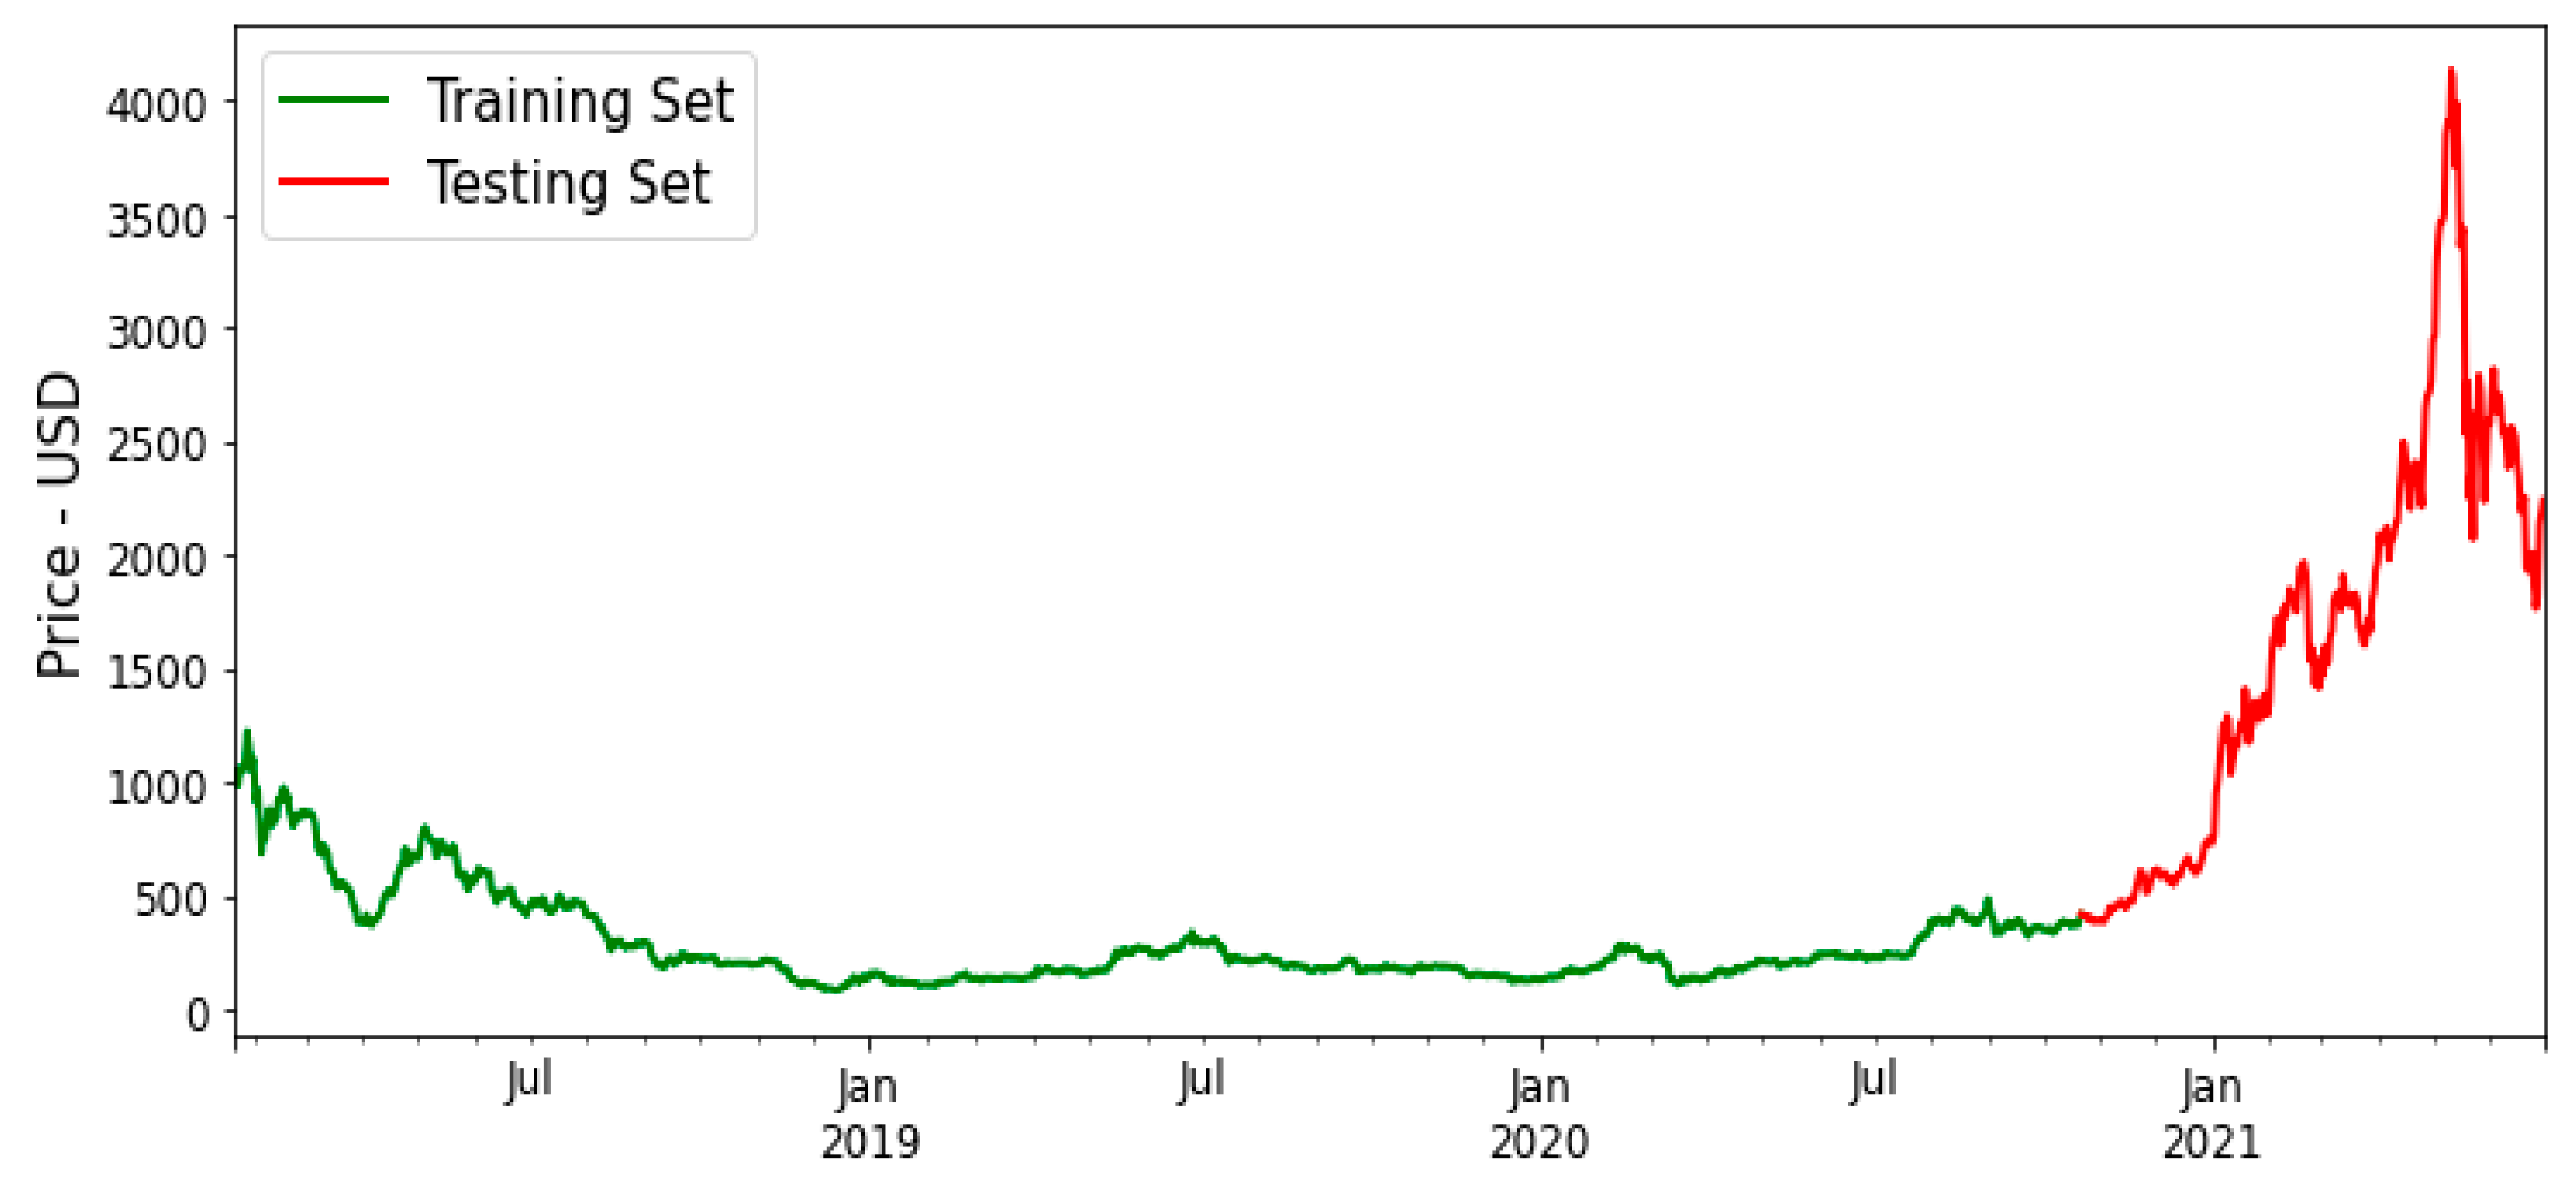
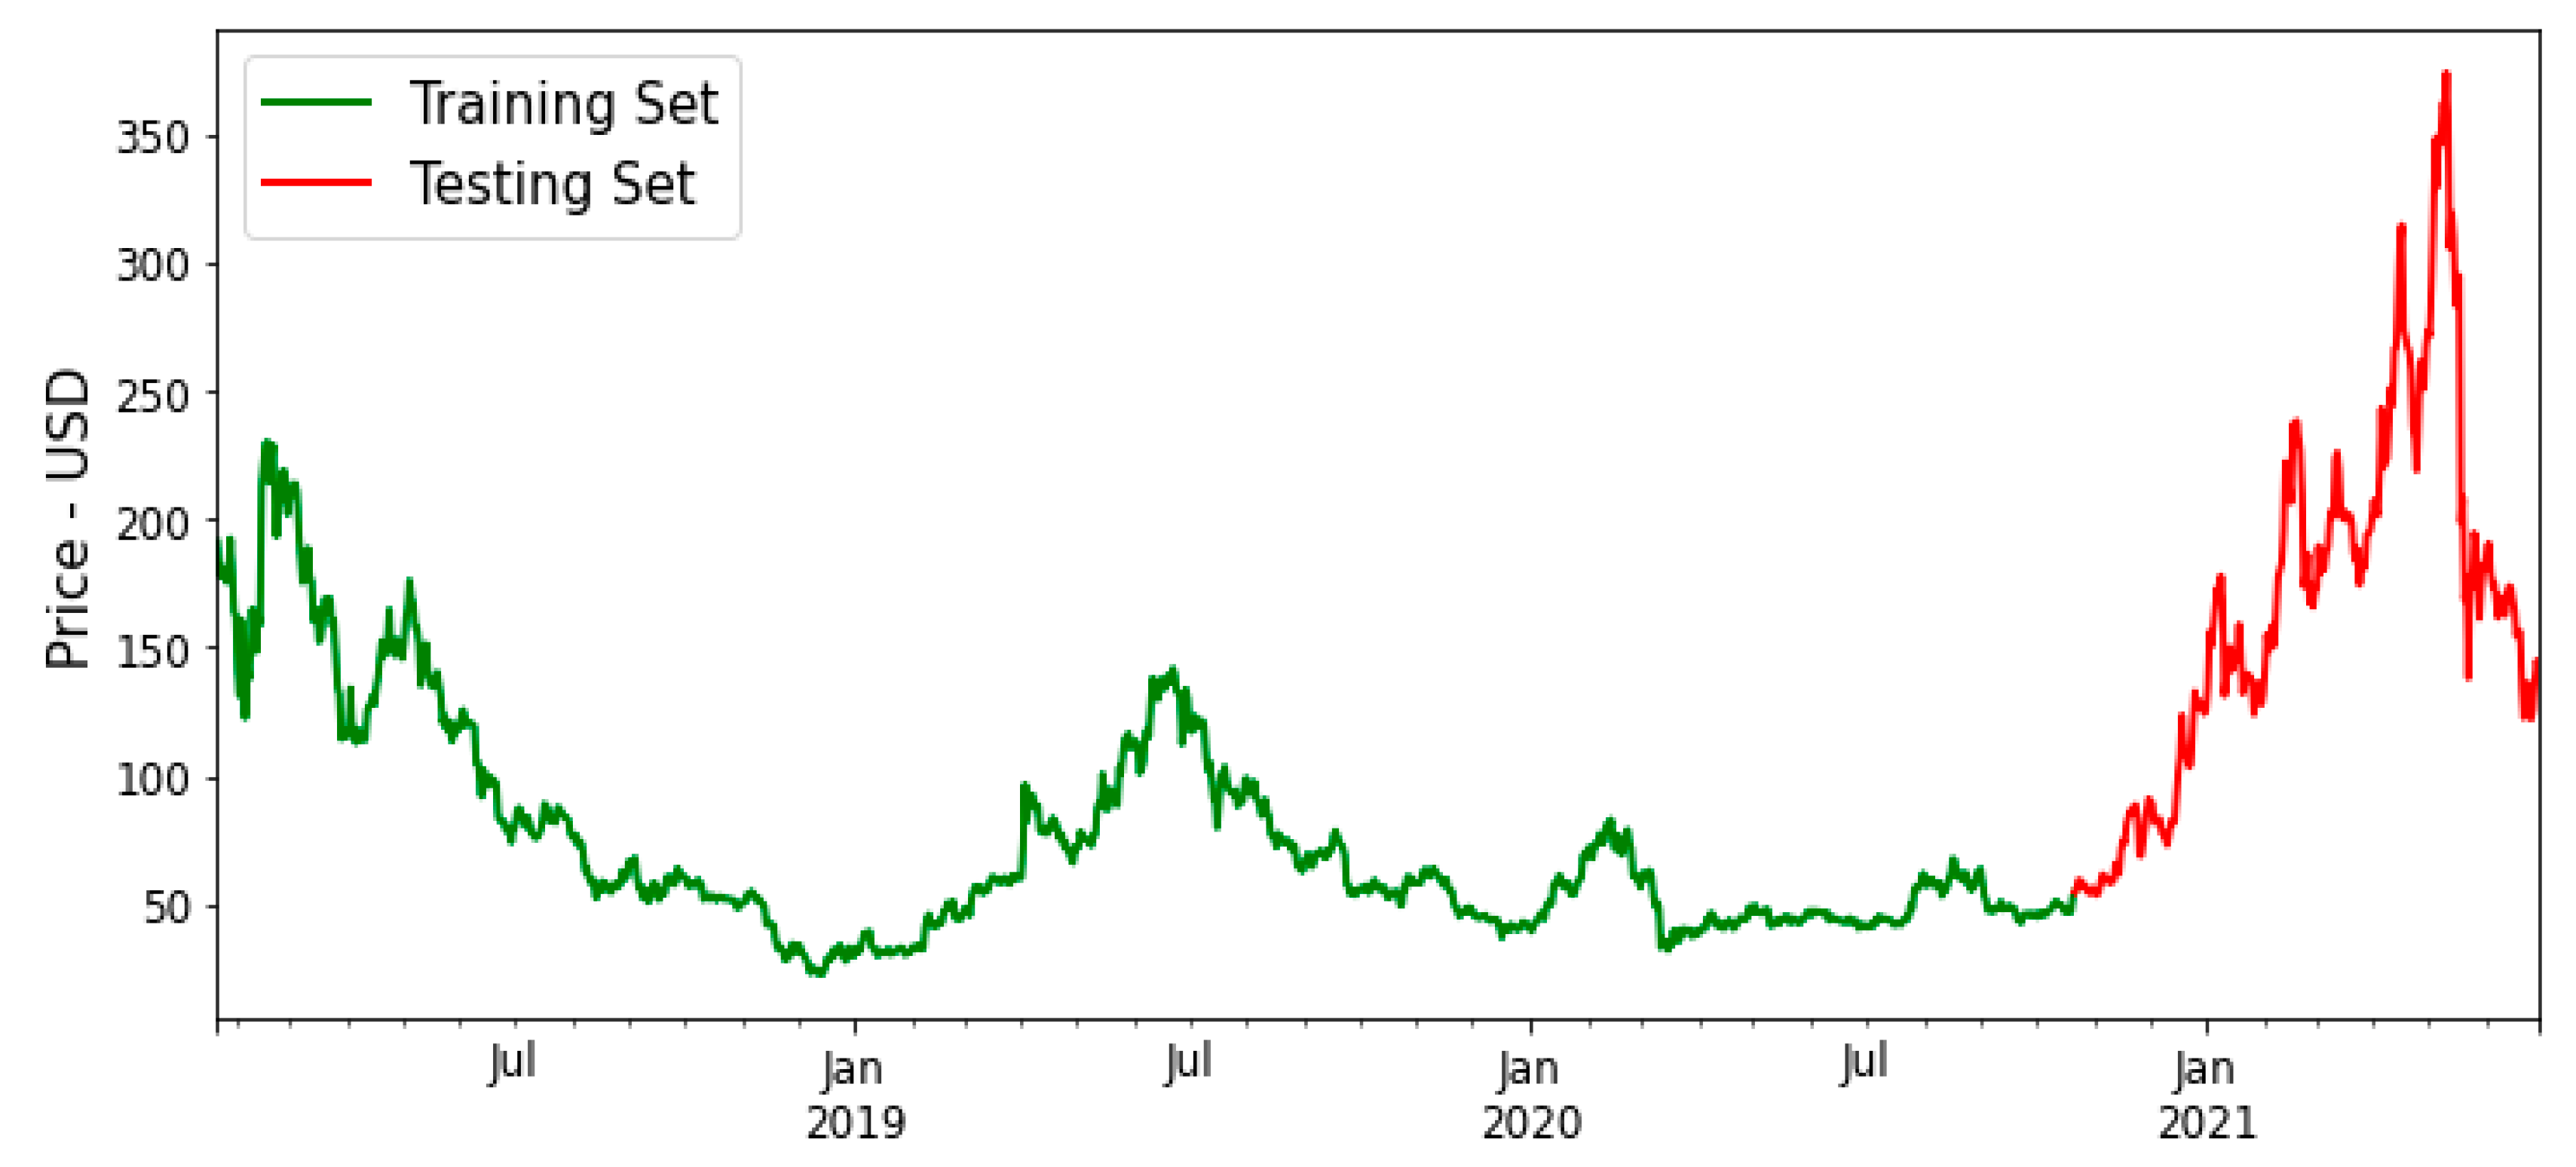
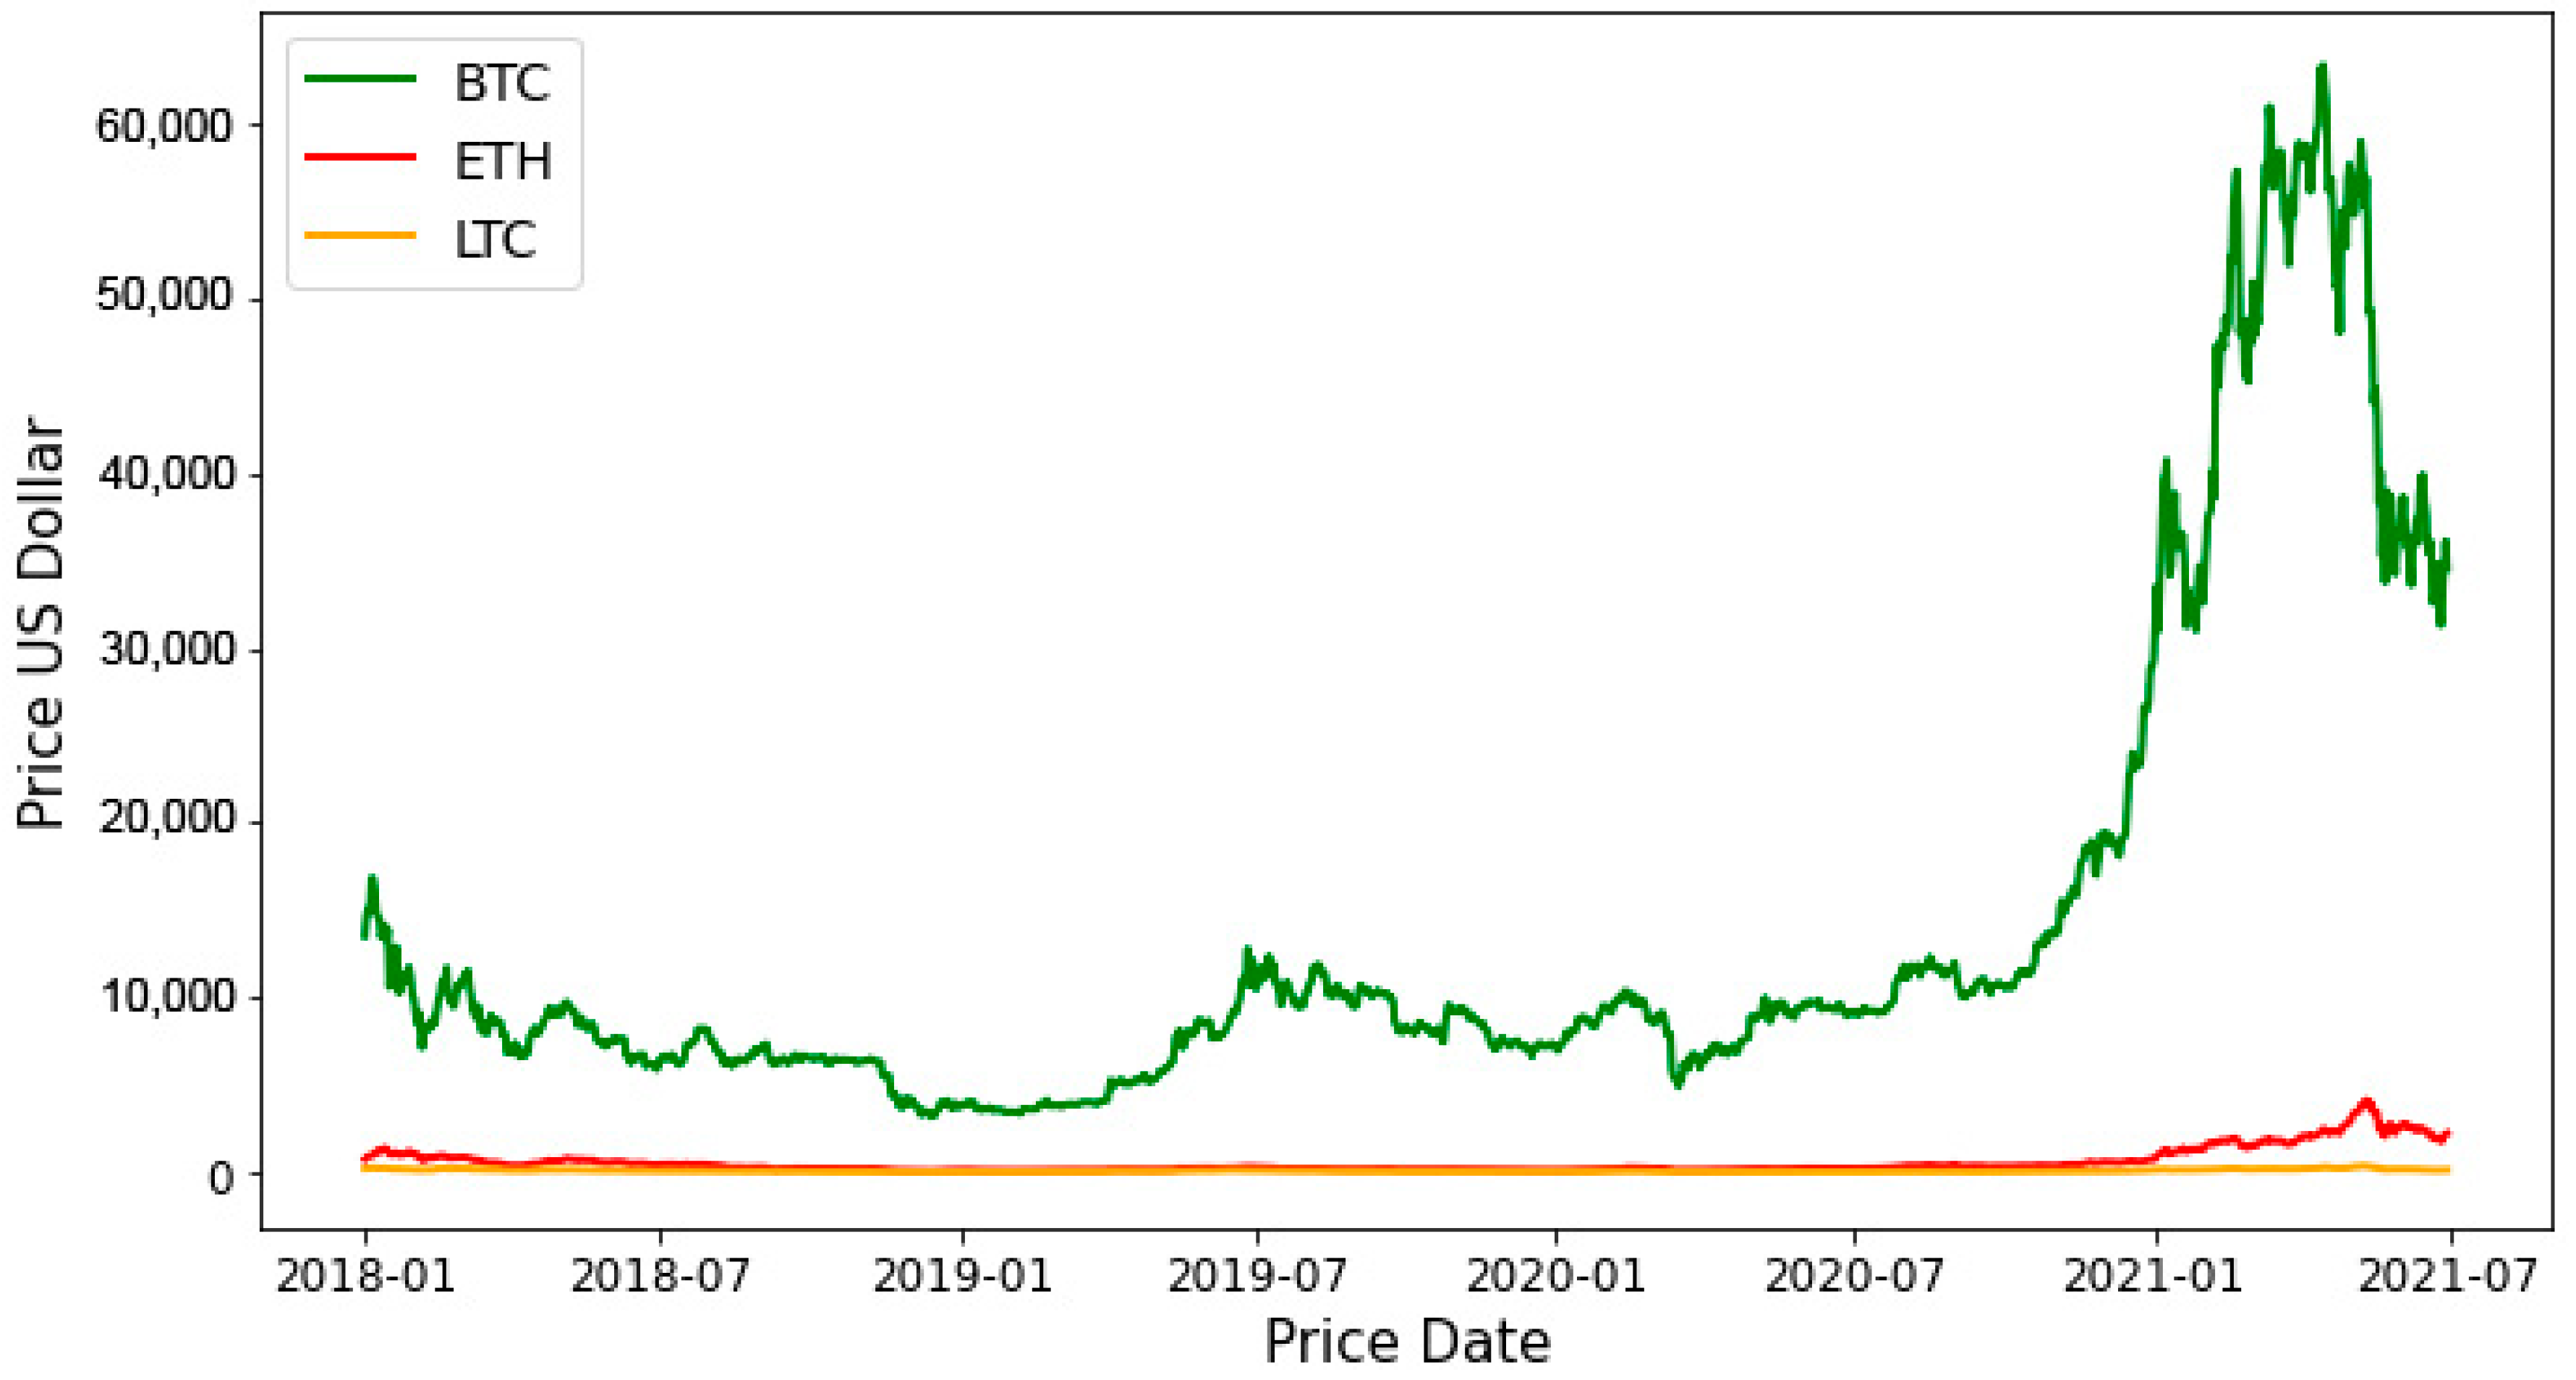
Figure 2, Figure 3 and Figure 4 illustrate the training and testing dataset for every targeted cryptocurrency. We can see that the price for each currency roughly increased and decreased together along the time-series.
Figure 2 illustrates the BTC closing price within the targeted collected dataset. It shows that the closing price increased gradually until the end of 2020, when the price increased suddenly, it reach a high of 63,381 USD in a top of peak of time series.
Figure 3 shows the ETH closing price within the targeted collected dataset. It demonstrates that the closing price increased gradually until the end of 2020, then the price increased suddenly, reaching a high of 4140 USD.
Figure 4 shows the LTC closing price within the targeted collected dataset. It illustrates that the closing price increased gradually until the end of 2020, then the price increased suddenly, reaching a high of 373.64 USD.
3.1. Machine Learning Algorithms
This section demonstrates three types of machine learning algorithms—long short-term memory (LSTM), bidirectional LSTM (bi-LSTM), and gated recurrent unit (GRU).
3.1.1. Long Short-Term Memory (LSTM)
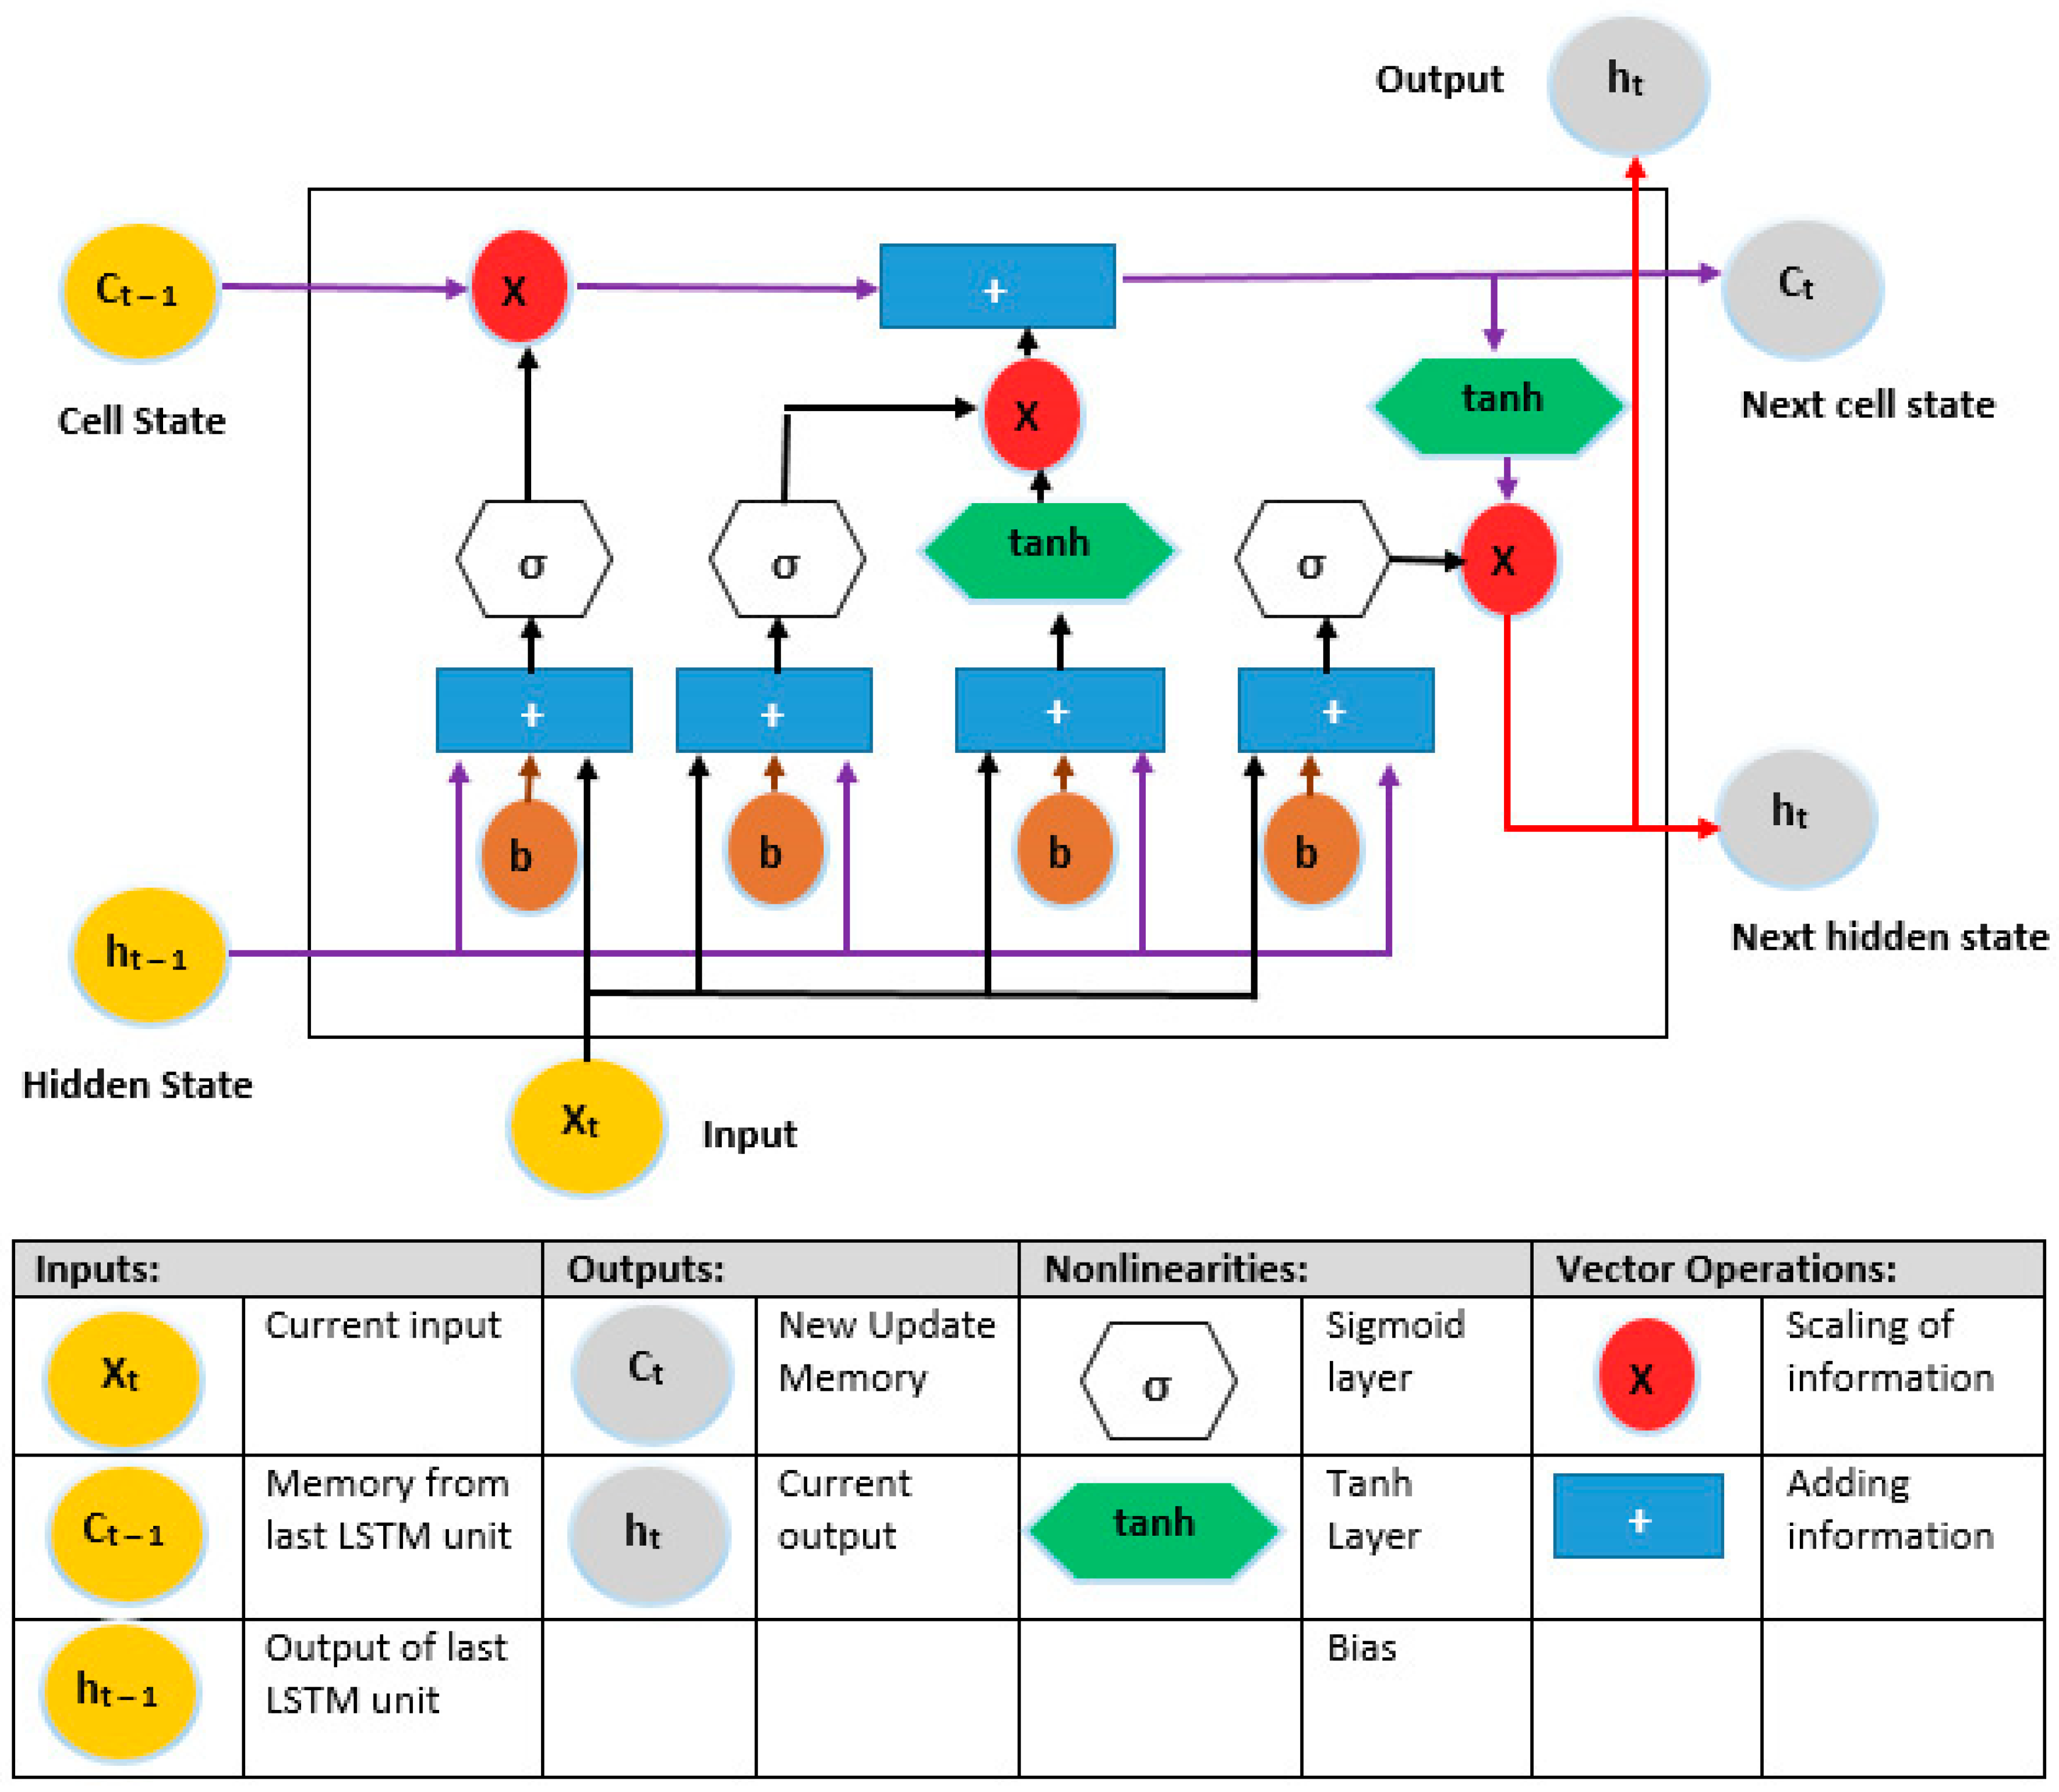
For various learning issues involving sequential data, recurrent neural networks with long short-term memory (LSTM) have emerged as an effective and scalable approach. They are useful for capturing long-term temporal dependencies since they are generic and effective [43]. The LSTM is an RNN-style architecture with gates that govern the flow of information between cells. The input and forget gate structures can modify information traveling along the cell state, with the ultimate output being a filtered version of the cell state based on context from the inputs [44]. The LSTM design has been criticized for being ad hoc and for having a large number of components whose purpose is not immediately clear. As a result, it is unclear whether the LSTM is the best design, and it is likely that better ones exist [45]. Figure 5 illustrates the structure of a LSTM algorithm [46].
The forward training process of the LSTM can be formulated with the following equations:
where , , and denote the activation of the input gate, output gate, and forget gate, respectively; and denote the activation vector for each cell and memory block, respectively; and W and b denote the weight matrix and bias vector, respectively. In addition, denotes the sigmoid function [47].
3.1.2. Bidirectional LSTM (bi-LSTM)
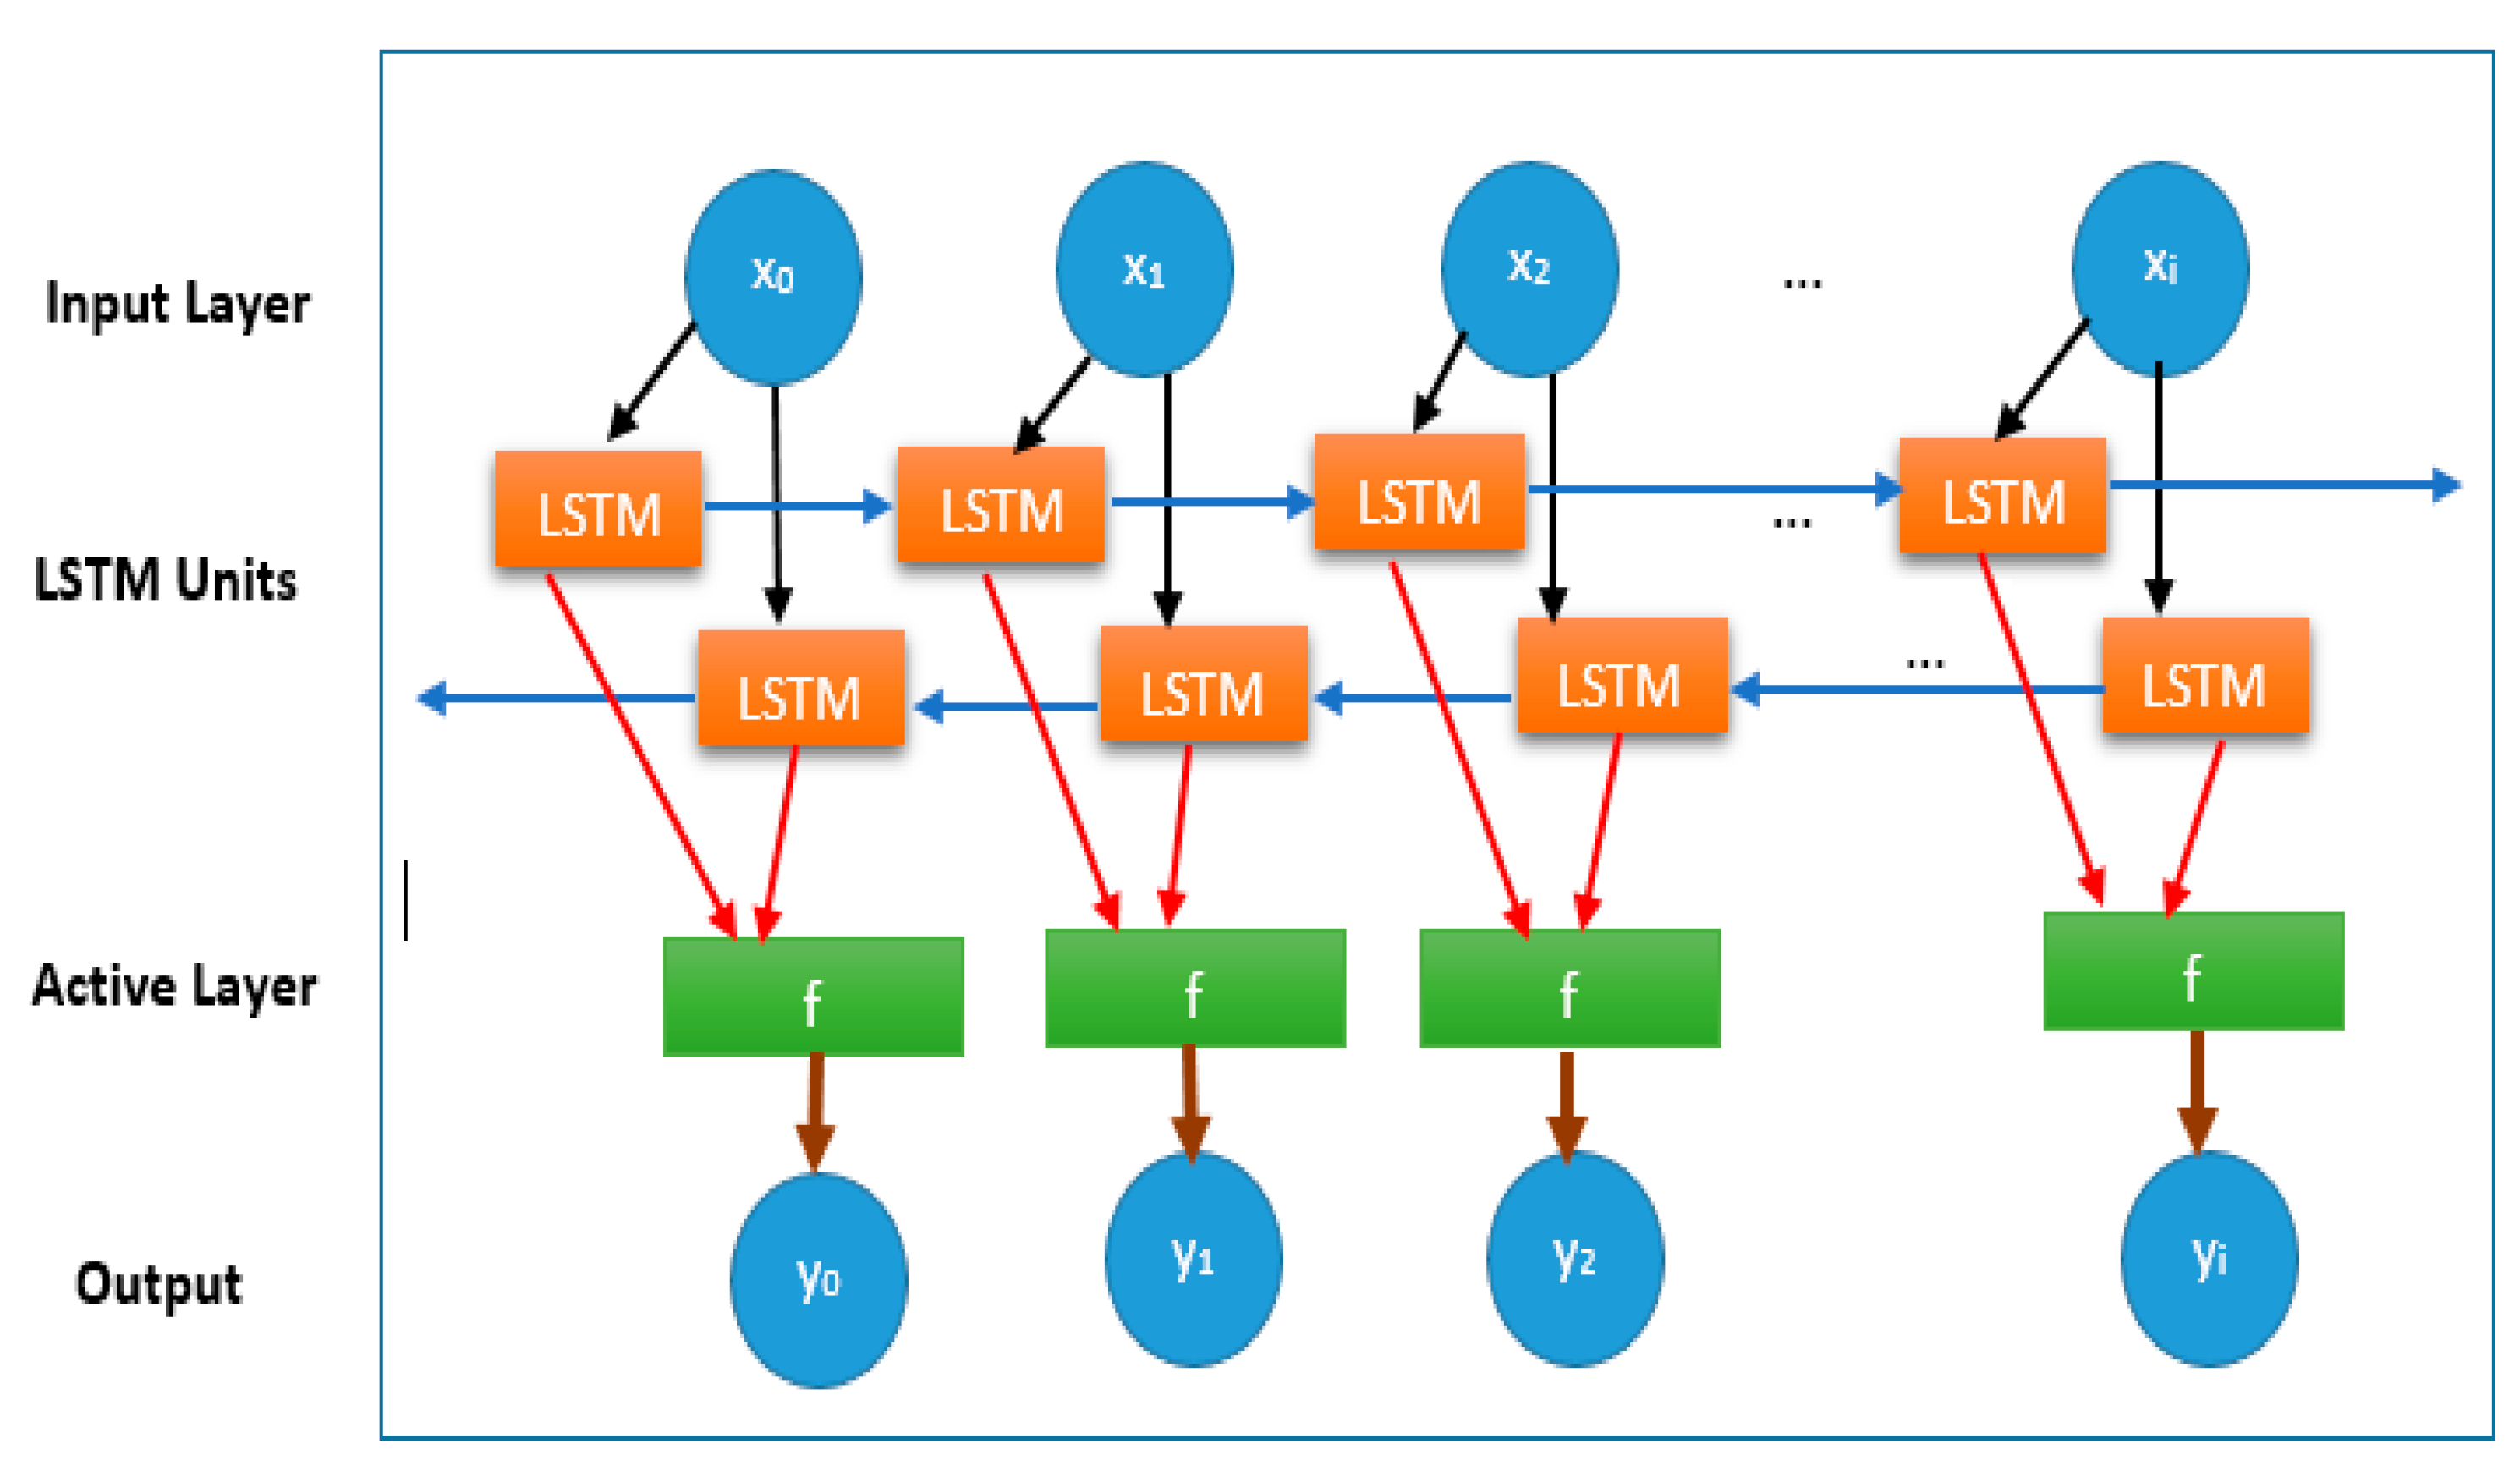
bi-LSTM was created by Schuster and Paliwal [48] to train a network utilizing past and future input data sequences. The input data are processed using two linked layers [49]. Bi-directional LSTM predicts or tags the sequence of each element using a finite sequence based on the context of elements in the past and future. This is the result of two LSTMs running in parallel, one from left to right and the other from right to left. The forecast of a given target signal is known as composite output. This method has proven to be quite beneficial. The forward function of bi-LSTM with inputs of L units and H as the number of hidden units is calculated using Equations (6) and (7), Figure 6 shows a bidirectional LSTM structure [50]. The hidden layer of the bi-directional LSTM network saves two values. A participates in the forward calculation, and A transpose is involved in the reverse calculation. The final output value, y, depends on A and A transpose [51]:
3.1.3. Gated Recurrent Unit (GRU)
Gated recurrent neural networks (Gated RNNs) have demonstrated their effectiveness in a variety of applications requiring sequential or temporal data [52]. The transition functions in hidden units of GRU are given as follows [53]:
where the model parameters include all W , V , and b that are shared by all time steps and learned during the training stage, (.) denotes the element-wise product, and k is a hyper-parameter that represents the dimensionality of hidden vectors. Figure 7 illustrates the GRU structure [54]:
3.2. Evaluation Matrix
The evaluation of the proposed schemes is done using the mean absolute percentage error (MAPE) and the root mean squared error (RMSE).
where and are the actual and forecasted cryptocurrency prices, respectively, and N is the number of samples.
3.3. Data Exploration
When dealing with data, it is useful and important to understand the data distribution and behavior using a stable and meaningful chart to extract the story that the data tells. Figure 8 illustrates the time series for targeted cryptocurrency distributed through the interval between 22 January 2018 and 30 June 2021. It shows that the price increases along with the specific interval depending on the closing price.
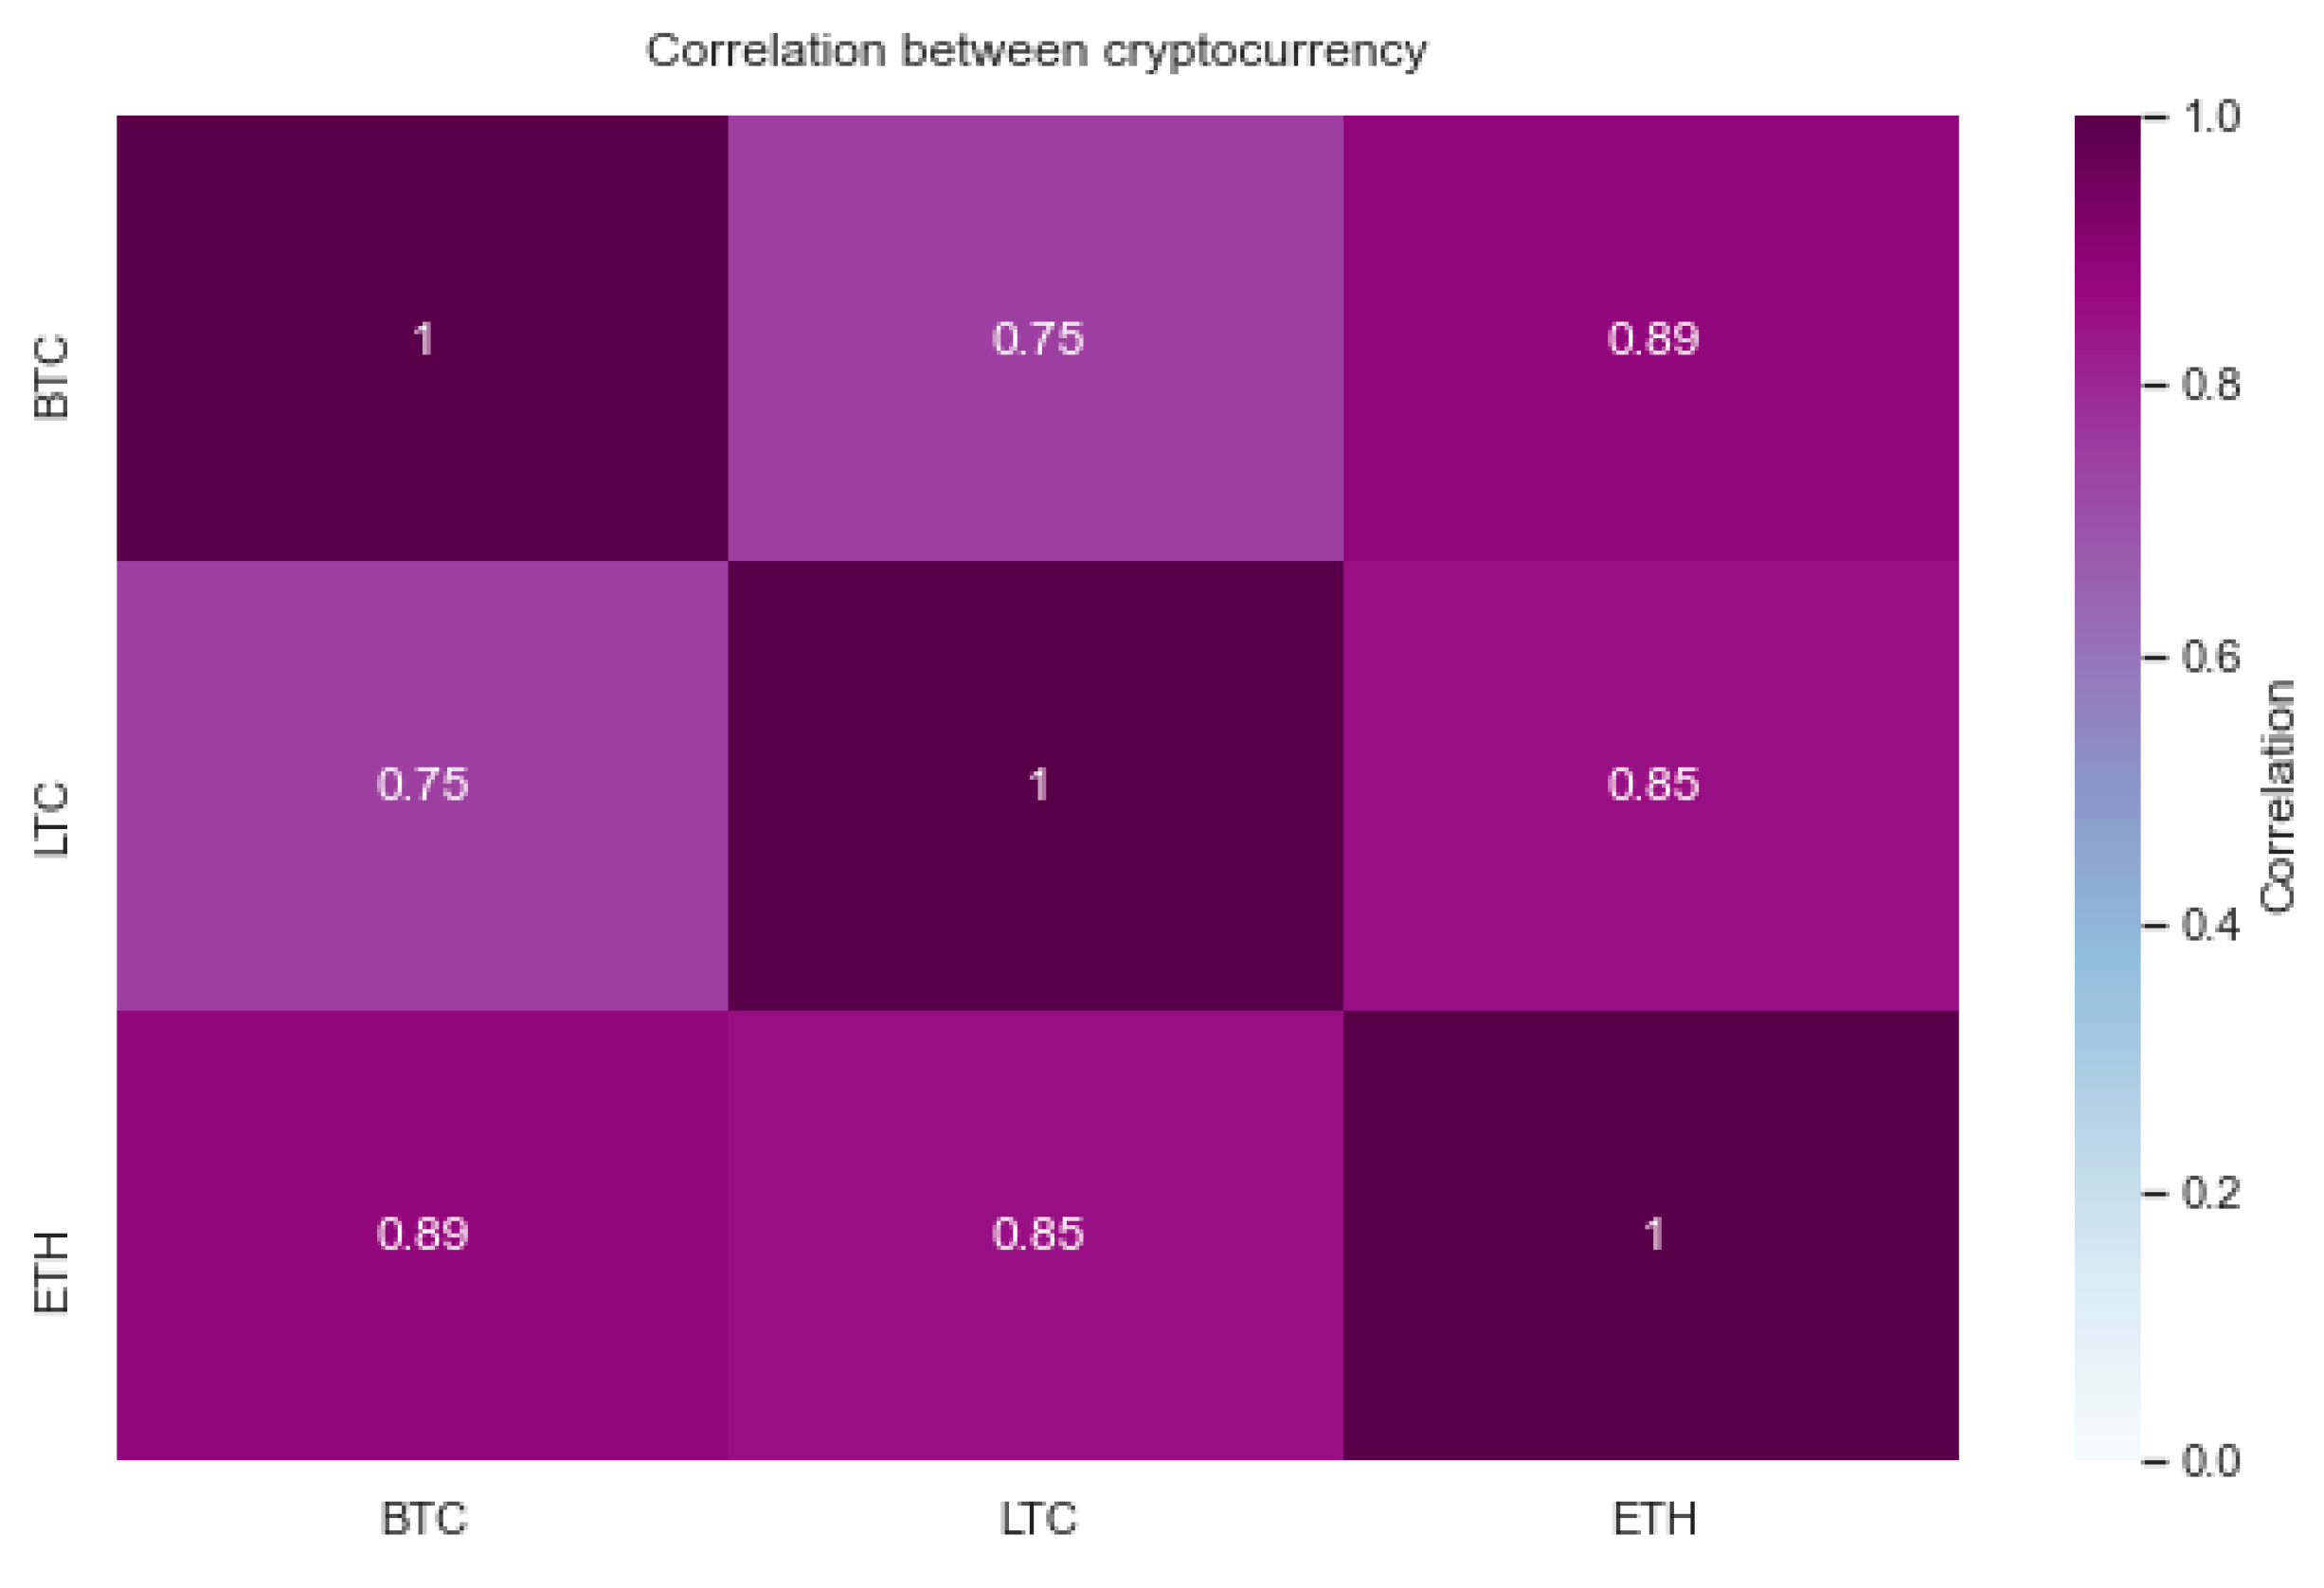
The correlation matrix in Figure 9 illustrates the correlation coefficient between the variables (closing price). The matrix shows a strong positive correlation between different currencies (BTC, LTC, and ETH). This means if one of the targeted cryptocurrencies increases or decreases, the others behave accordingly.
4. Dataset
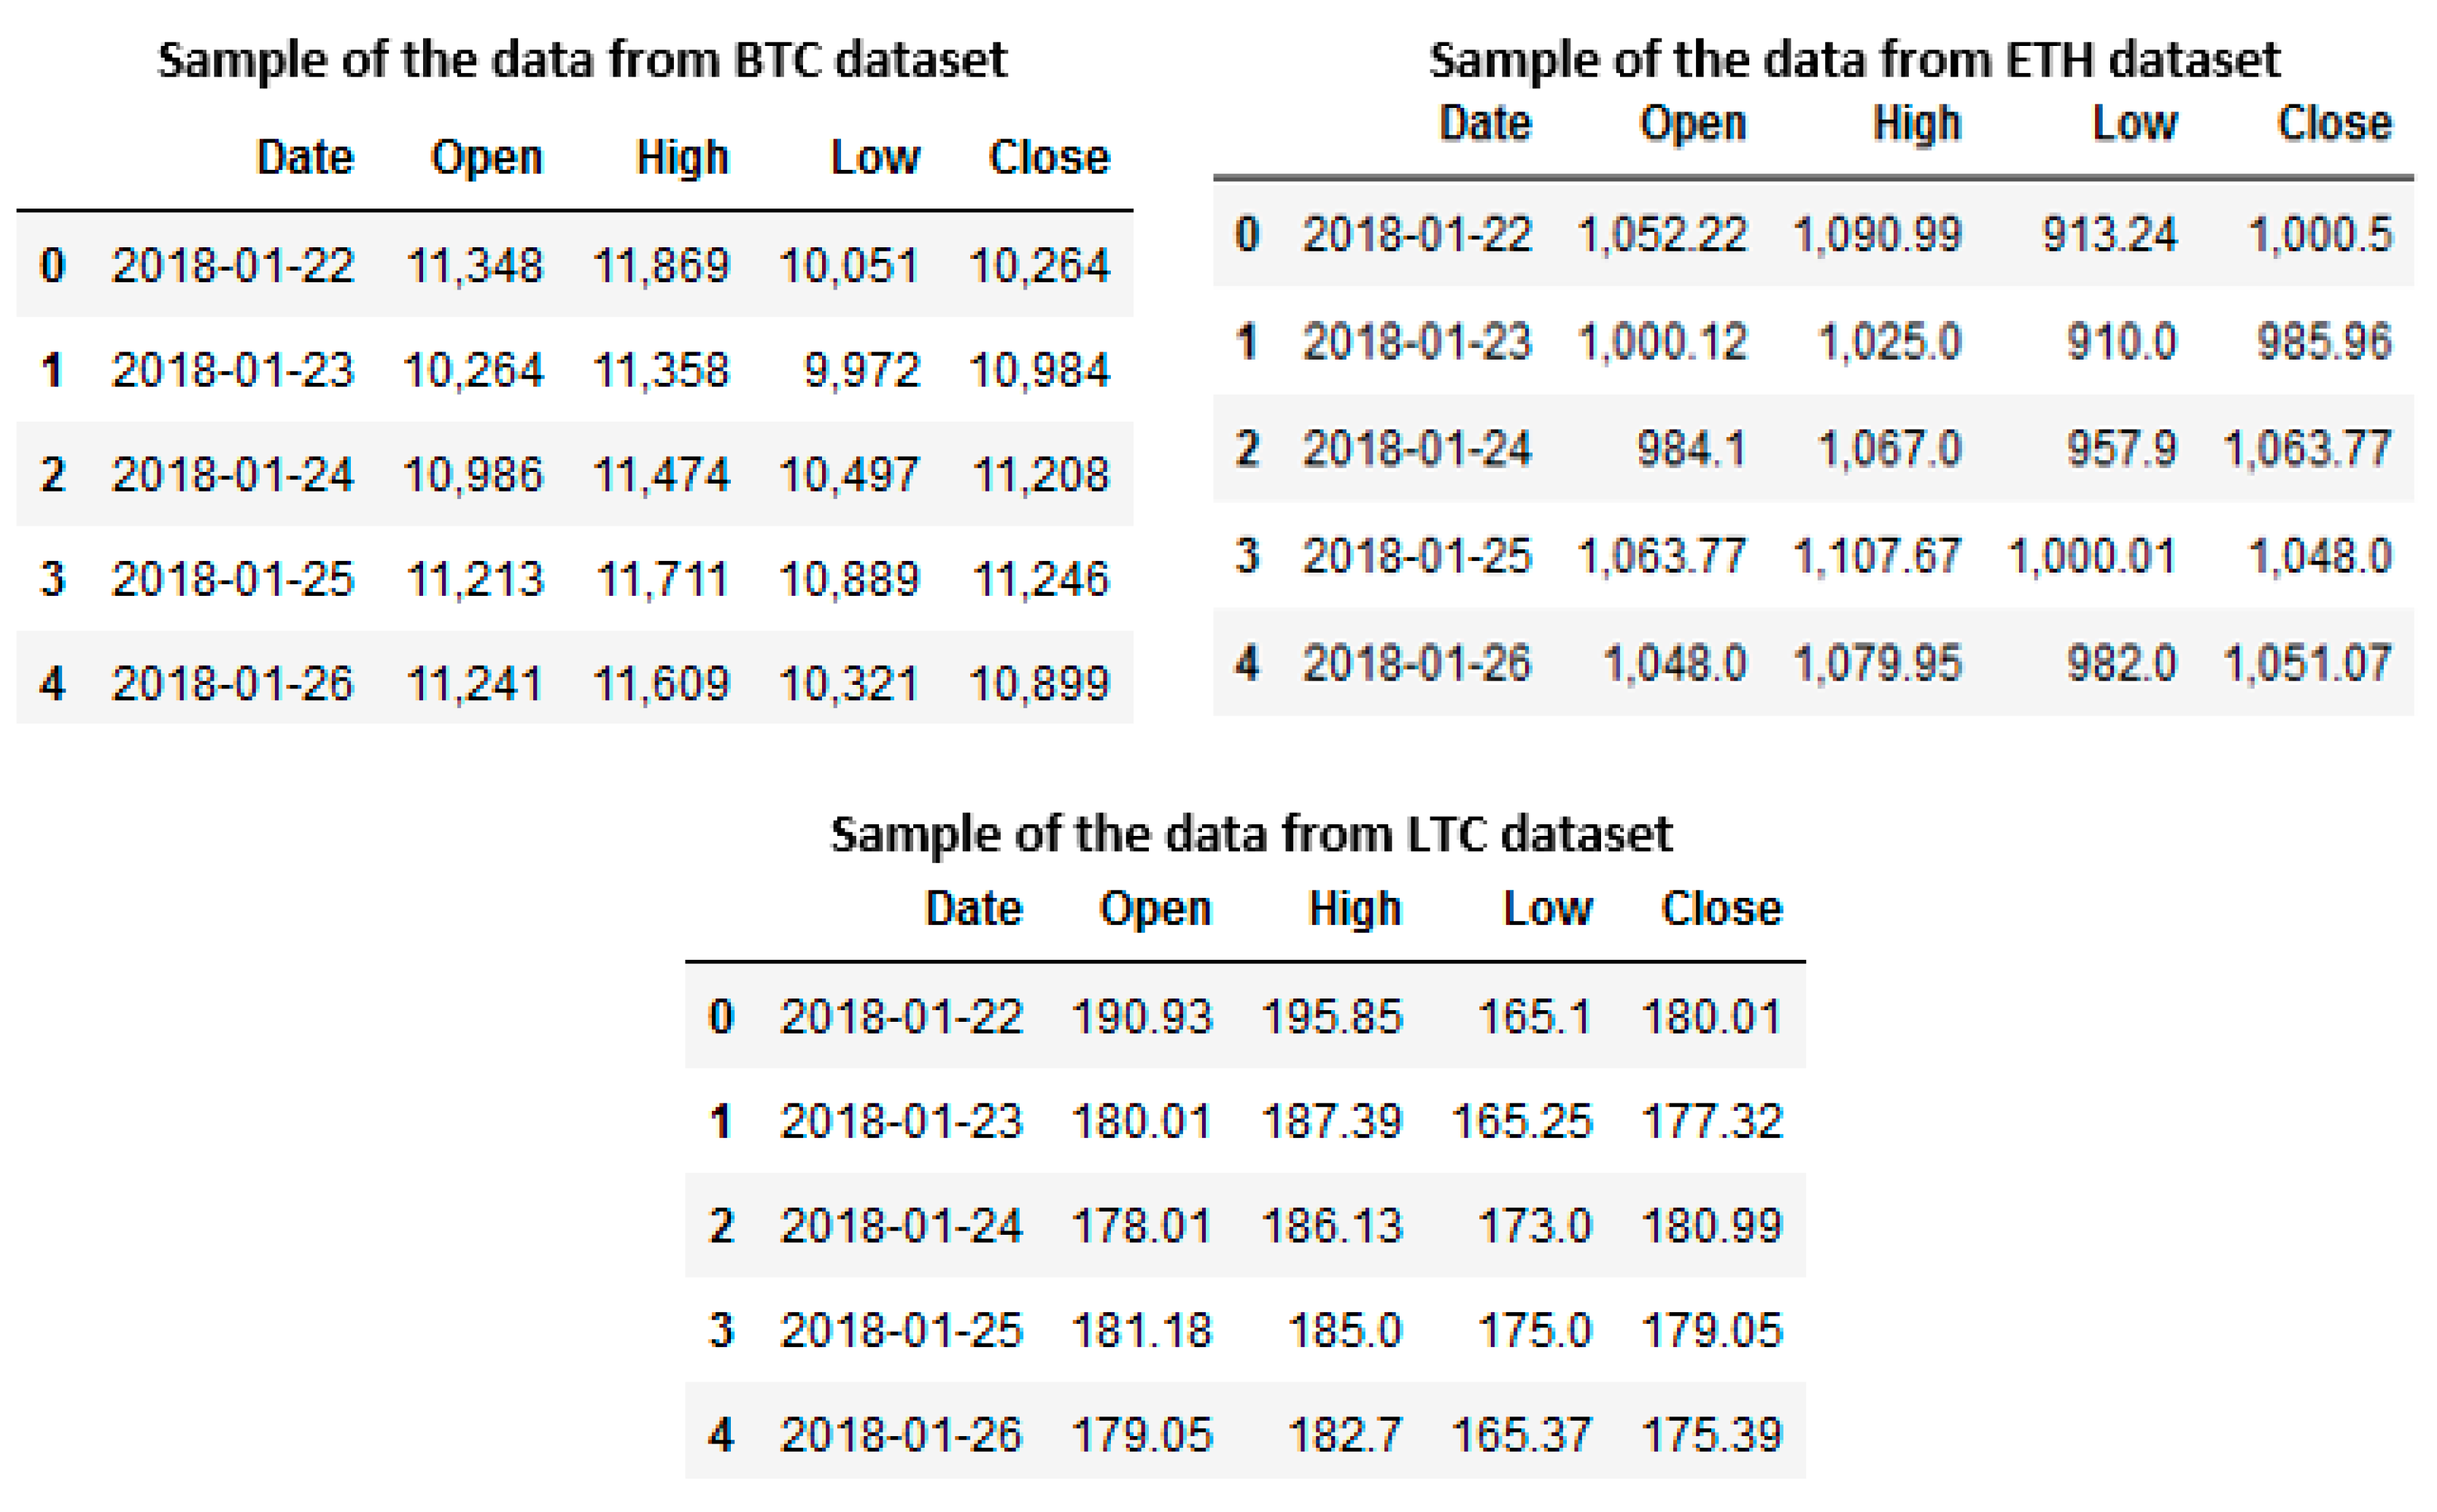
The analyzed dataset was collected from [42], an open-access website. It consists of one .csv file separated into three sheets; the first sheet for Bitcoin (BTC), the second for Litecoin (LTC), and the last sheet for Ethereum (ETH). The recorded prices in the dataset were collected on a daily basis from 1 January 2018 to 30 June 2021. In this research, we used time-series data from [19] with 1277 records. Table 1 illustrates the dataset specification of the targeted cryptocurrency and Figure 10 shows sample data from the dataset.
5. Results
This section shows the results obtained from long short-term memory (LSTM), gated recurrent unit (GRU), and bidirectional LSTM (bi-LSTM) algorithms using three types of popular cryptocurrency: BTC, ETH, and LTC. For each model, the results are illustrated in Table 2, Table 3 and Table 4. The model that gives the lowest RMSE and MAPE is considered the best model. Based on this criteria, all of the models applied to three types of currencies can be considered good models but the GRU was found to be the best of the three. The RMSE of the GRU model is the lowest. Thus, GRU is more capable of predicting long-term dependencies as compared to LSTM and bi-LSTM. This is due to the dependency on past prices. Figure 11, Figure 12, Figure 13, Figure 14, Figure 15, Figure 16, Figure 17, Figure 18 and Figure 19 illustrate the comparisons between the actual and the predicted results. Simulation results from those models indicate that there are few occasions where the forecast result differs from the actual results.
5.1. Results for BTC
The accuracies of these models for BTC cryptocurrency are tabulated in Table 2. The MAPE of the GRU model is the lowest with a value of 0.2454 and the RMSE is 174.129. Therefore, GRU is more capable of predicting BTC trends than LSTM or bi-LSTM, with a small difference between it and the LSTM model. Figure 11, Figure 12 and Figure 13 show a visual representation, comparing the actual and predicted values of the training dataset of the three models for BTC.
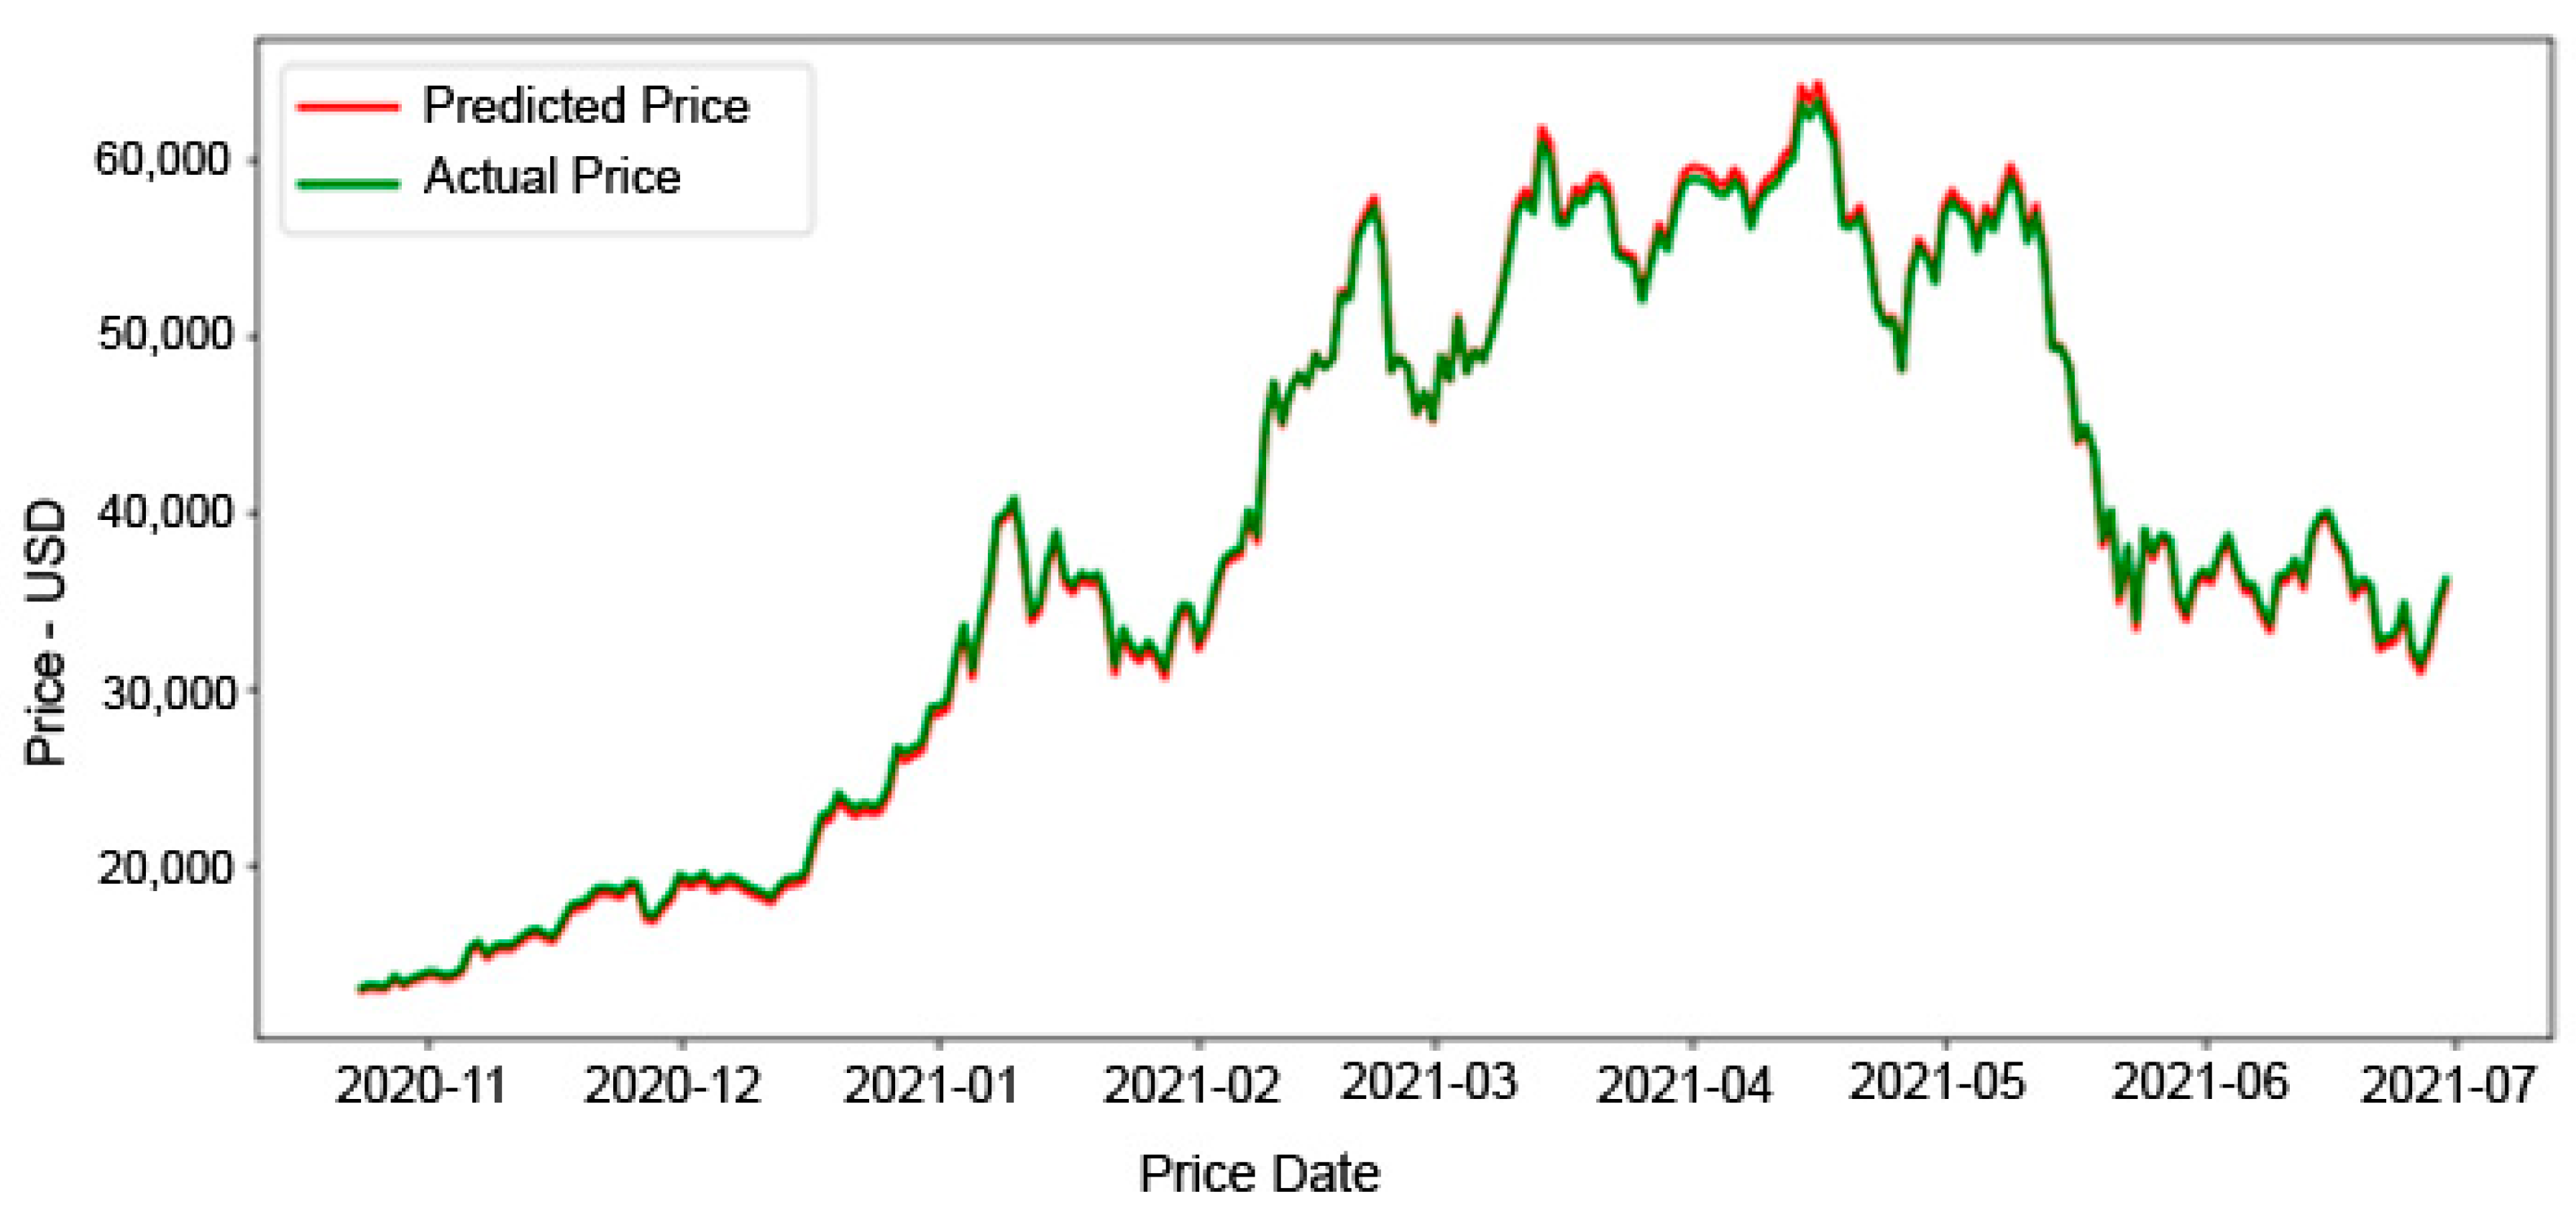
Results presented in Figure 11 compare the actual and LSTM-predicted price of BTC. The graph shows that the predicted and the actual price is approximately the same over the entire interval. This model is considered the second-best model. The mean absolute percentage error for the prediction model (MAPE) of BTC for LSTM is 1.1234%, and the root mean square error (RMSE) is 410.399. Statistical analysis of the data indicates that the predicted price has a mean value of 38,173.258 USD, a maximum value of 64,358.805 USD, and a minimum value of 12,775.013 USD, whereas the actual price has a mean value of 38,249.388 USD, a maximum value of 63,380.999 USD, and a minimum value of 12,941.0 USD. The mean difference between the mean values of the actual and the predicated prices is 76.13 USD.
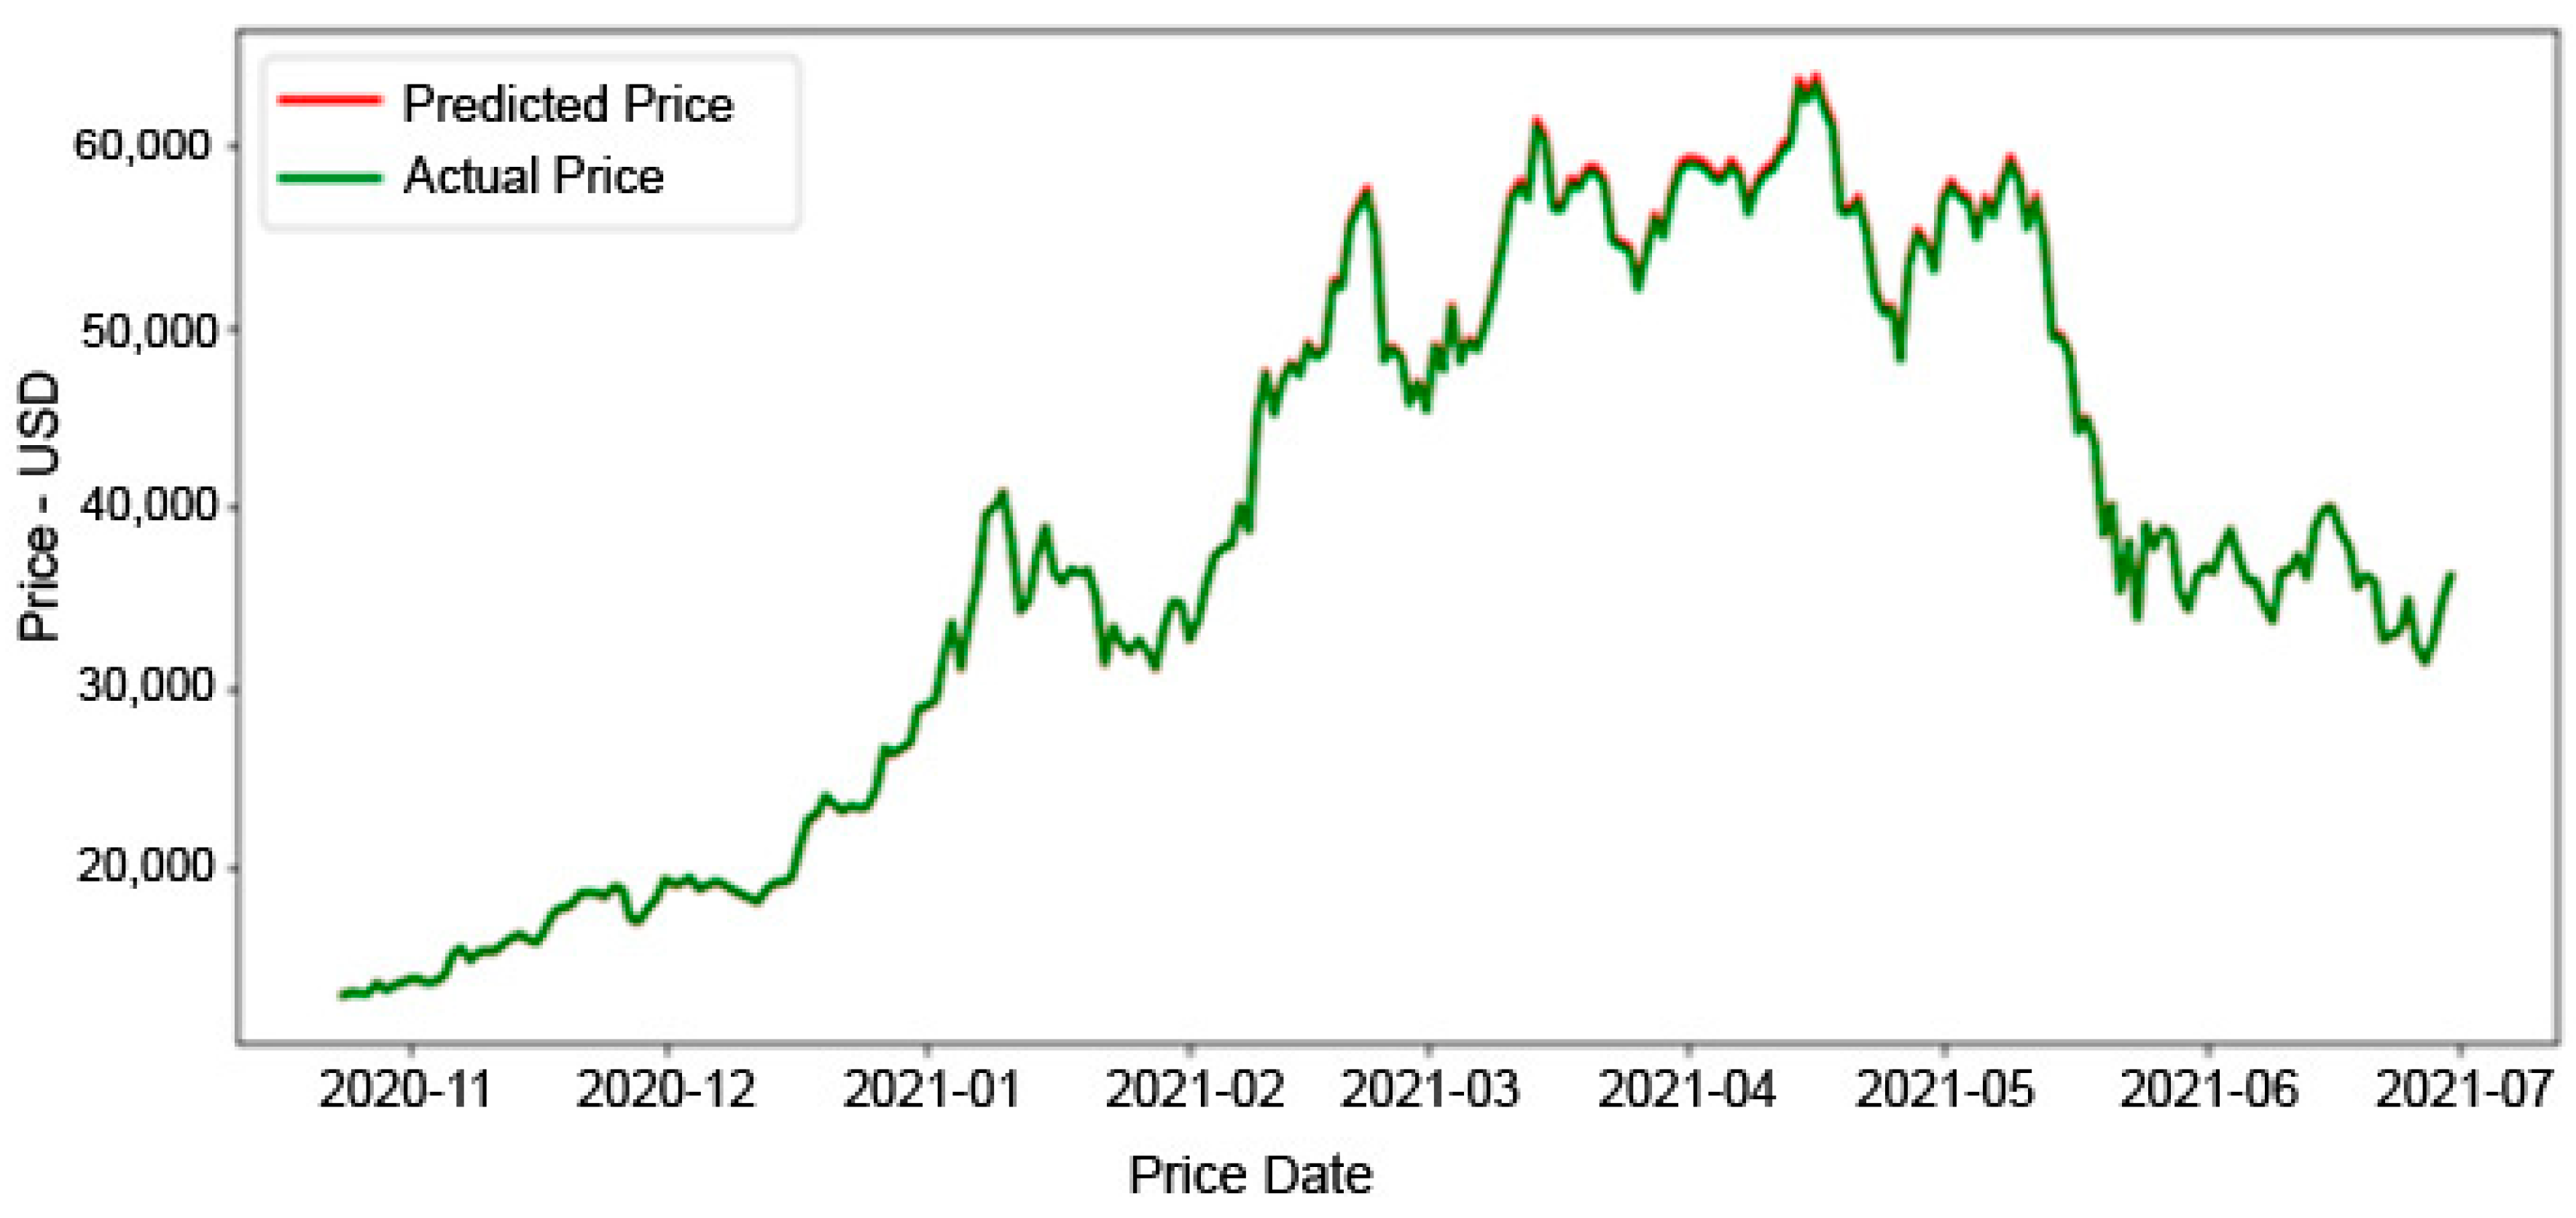
Figure 12 illustrates the comparison between the actual and the predicted price of BTC using the GRU model. The graph shows that the difference between the predicted and the actual price is virtually non-existent along the testing set, with very small differences in the top few peaks of the time series. This model is considered to be the best. The mean absolute percentage error for the prediction model (MAPE) of the GRU model for BTC is 0.2454%, and the root mean square error (RMSE) is 174.29. Statistical analysis of the data indicates that the predicted price has a mean value of 38,333.36 USD, a maximum value of 63,870.605 USD, and a minimum value of 12,936.112 USD, whereas the actual price has a mean value of 38,249.388 USD, a maximum value of 63,380.999 USD, and a minimum value of 12,941.0 USD. The mean difference between the mean values of the actual and the predicated prices is 83.97 USD.
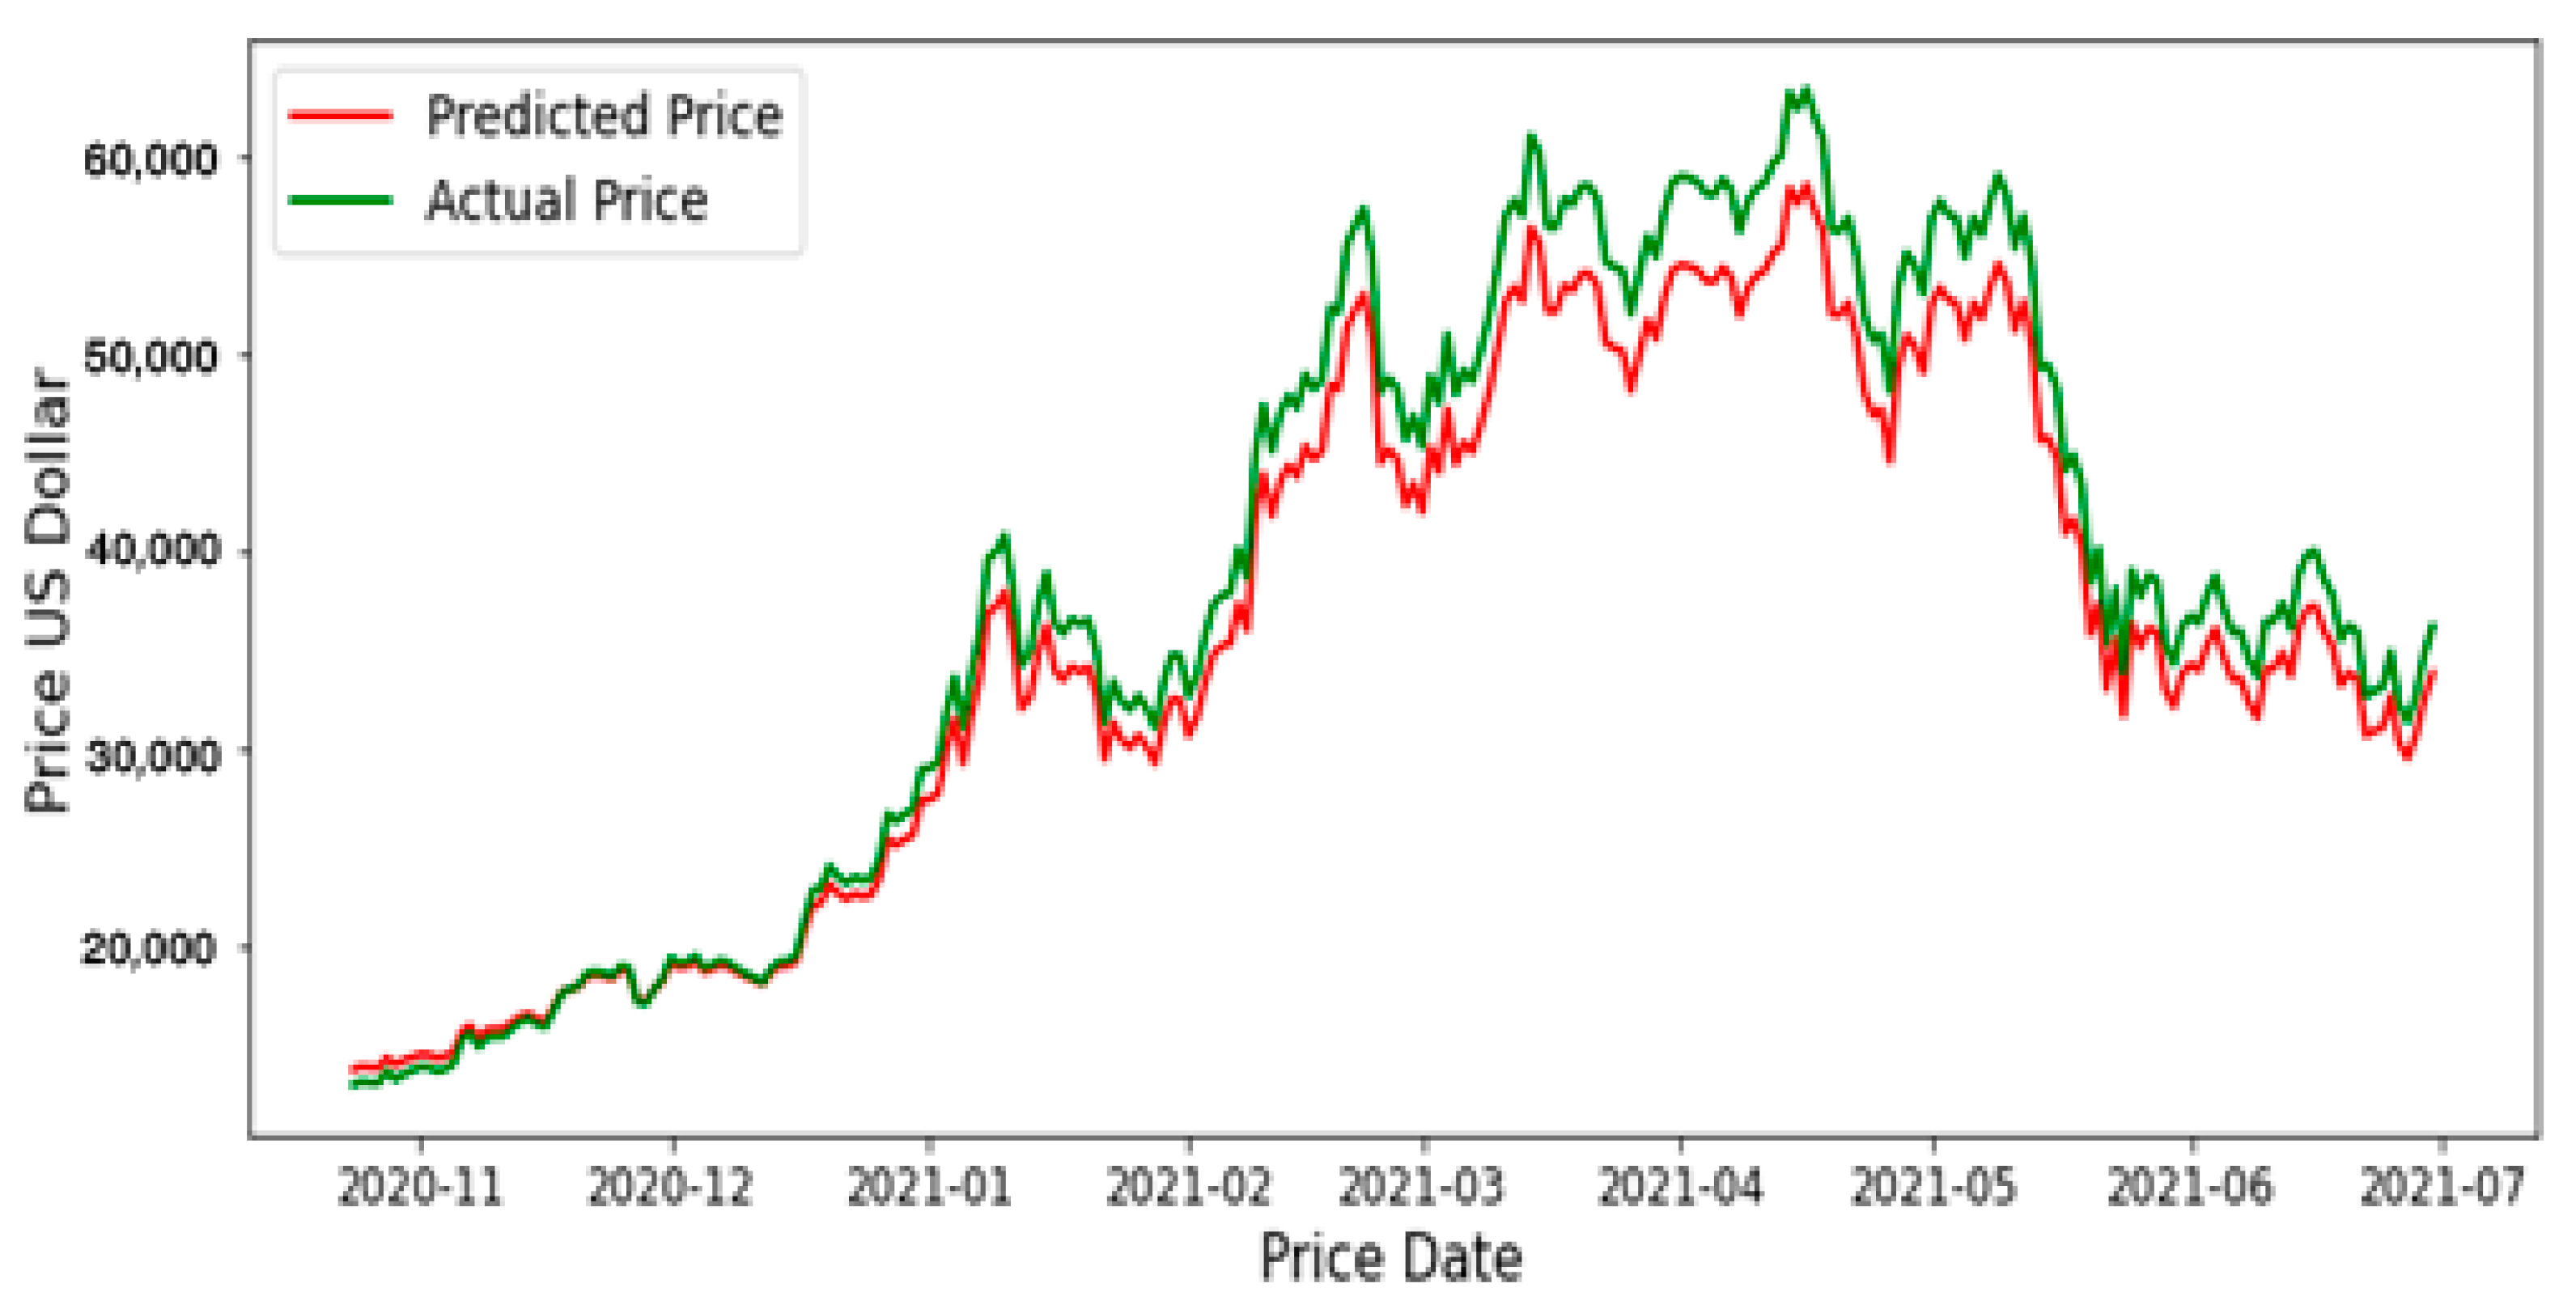
The results in Figure 13 illustrate the comparison between the actual and the predicted price of BTC under the bi-LSTM model. It indicates a greater difference between the actual and the predicted price compared with the LSTM and GRU models. The mean absolute percentage error prediction model (MAPE) from bi-LSTM for BTC is 5.990% and the root mean square error (RMSE) is 2927.006. Statistical analysis of the data indicates that the predicted price has a mean value of 36,735.137 USD, a maximum value of 59,885.746 USD, and a minimum value of 12,941.0 USD, whereas the actual price has a mean value of 38,249.388 USD, a maximum value of 63,380.999 USD, and a minimum value of 13,655.032 USD. The mean differences between the mean values of the actual and the predicated prices is 1514.251 USD.
5.2. Results for ETH
The accuracies of these models for ETH cryptocurrency are tabulated in Table 3. The mean absolute percentage error for the GRU model is the least with a value of 0.8267 and a root mean square error of 26.59. Therefore, GRU proved to be the best predictor compared to LSTM and bi-LSTM for ETH. Figure 14, Figure 15 and Figure 16 show the visual representation of the comparison between the actual and the predicted values of the training dataset of the three models for the ETH.
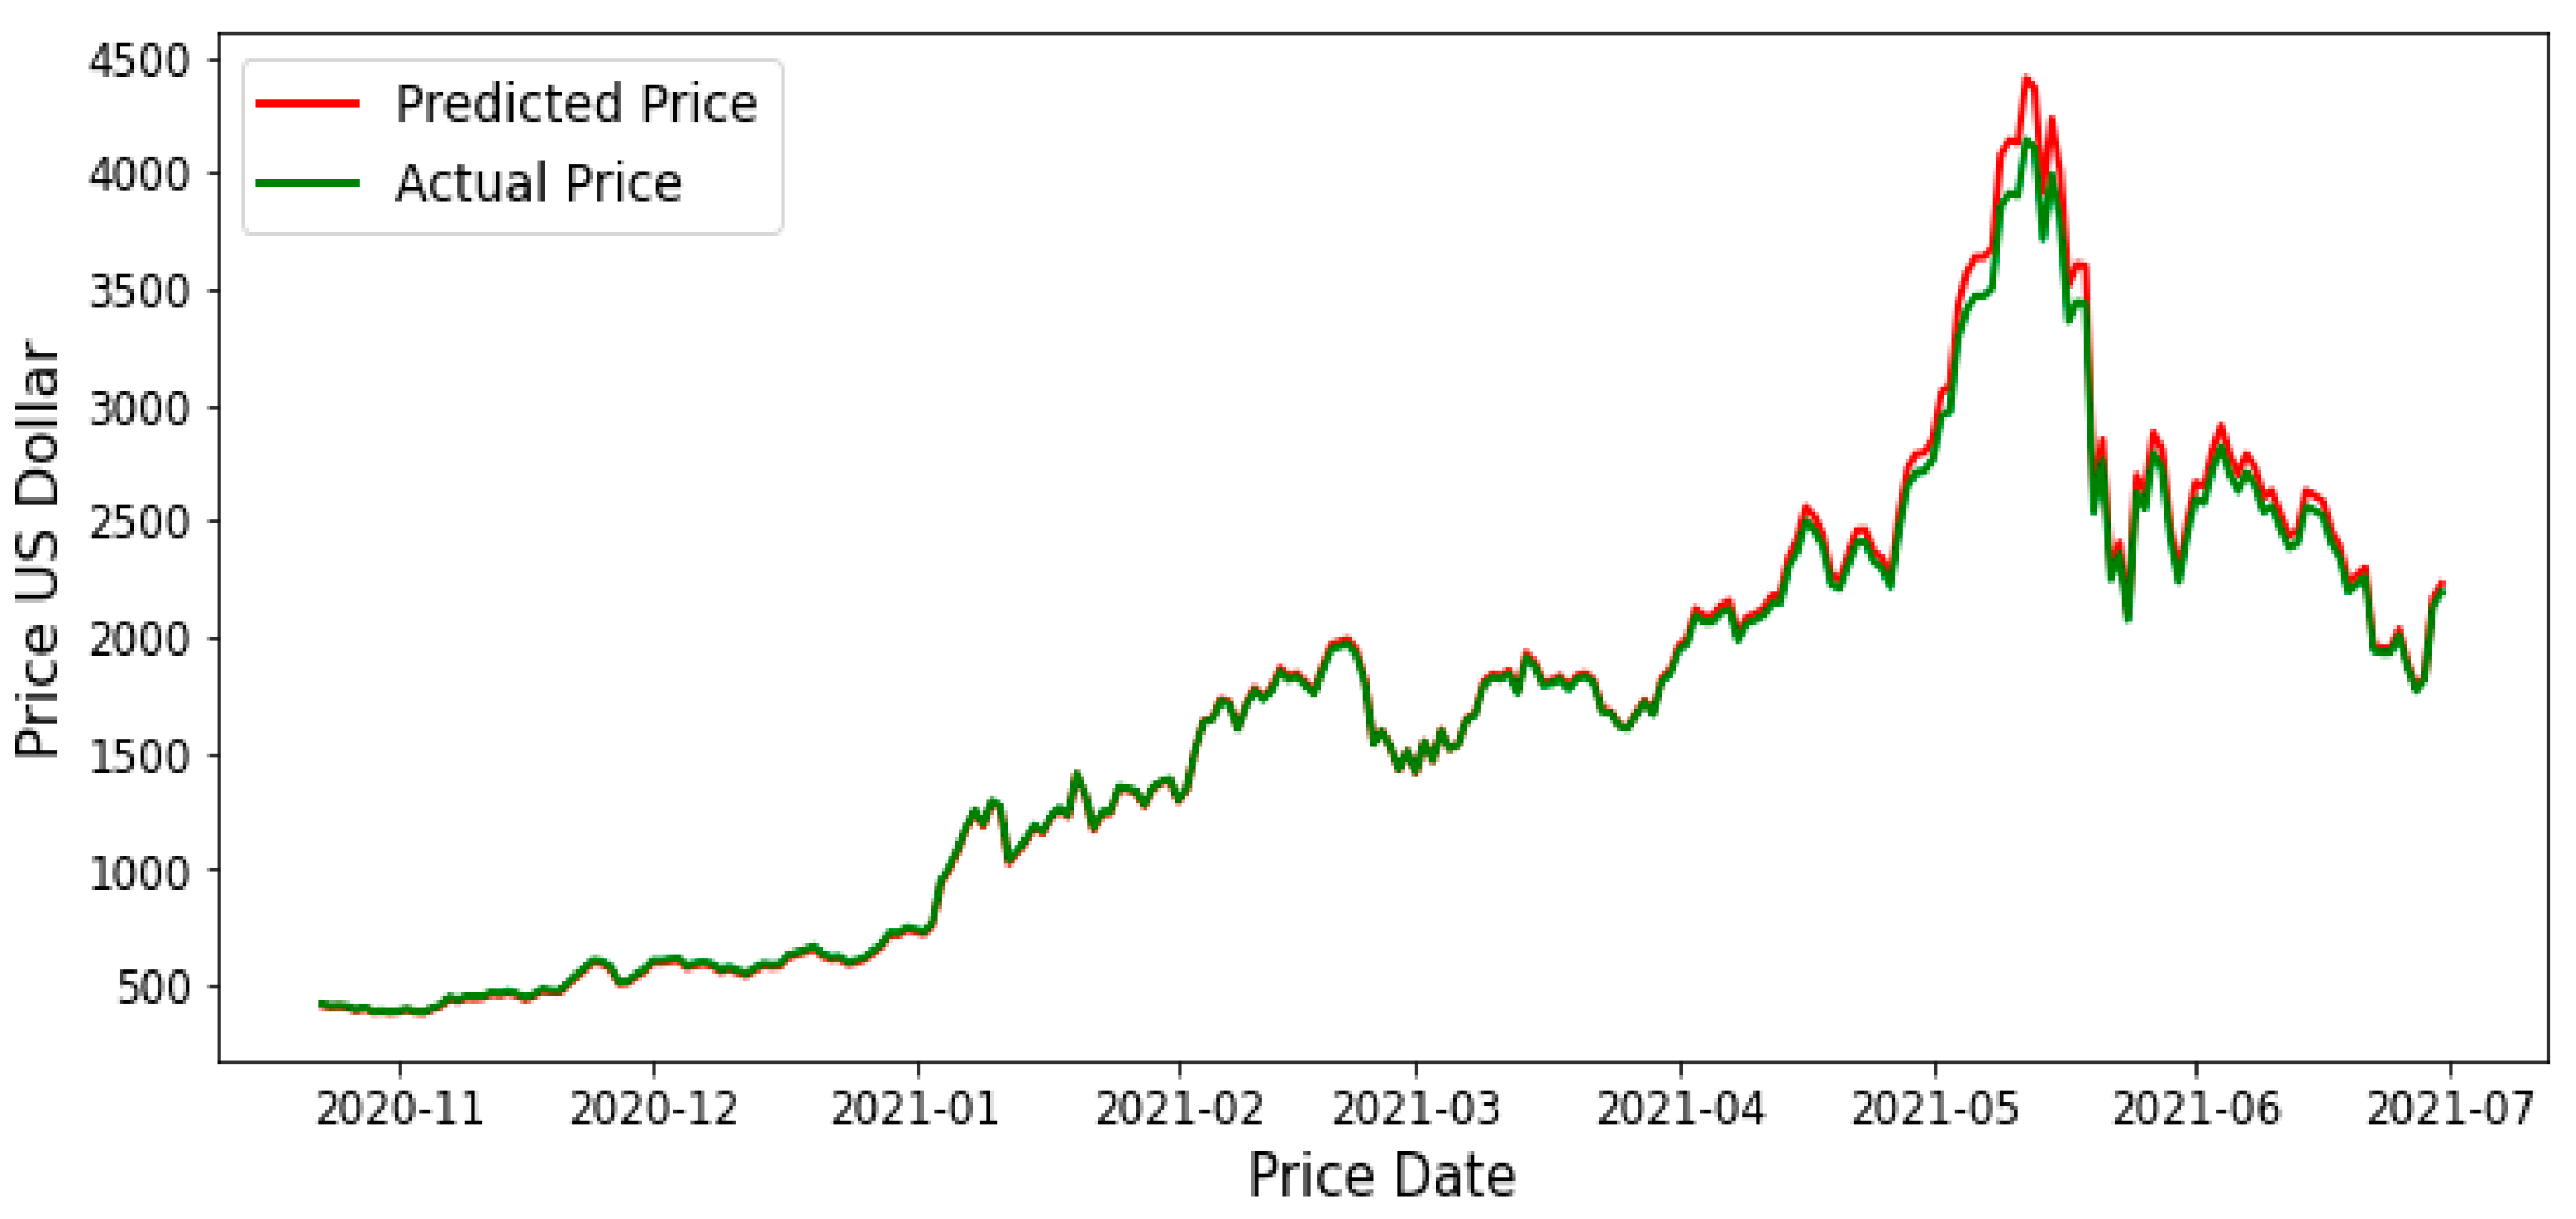
LSTM model for ETH, it represents that the difference between the predicted and the actual price is very small as red and green curves moving over each other’s over the whole period of time of Figure 14. This model is considered the second-best model. The mean absolute percentage error prediction model of ETH for the LSTM model is 1.5489% and the root mean square error is 59.507. Statistical analysis of the data indicates that the predicted price has a mean value of 1663.1392 USD, a maximum value of 4399.33 USD, and a minimum value of 379.41837 USD, whereas the actual price has a mean value of 1636.7091 USD, a maximum value of 4140.0 USD, and a minimum value of 383.35 USD. The mean difference between the mean values of the actual and the predicated prices is 26.43 USD.
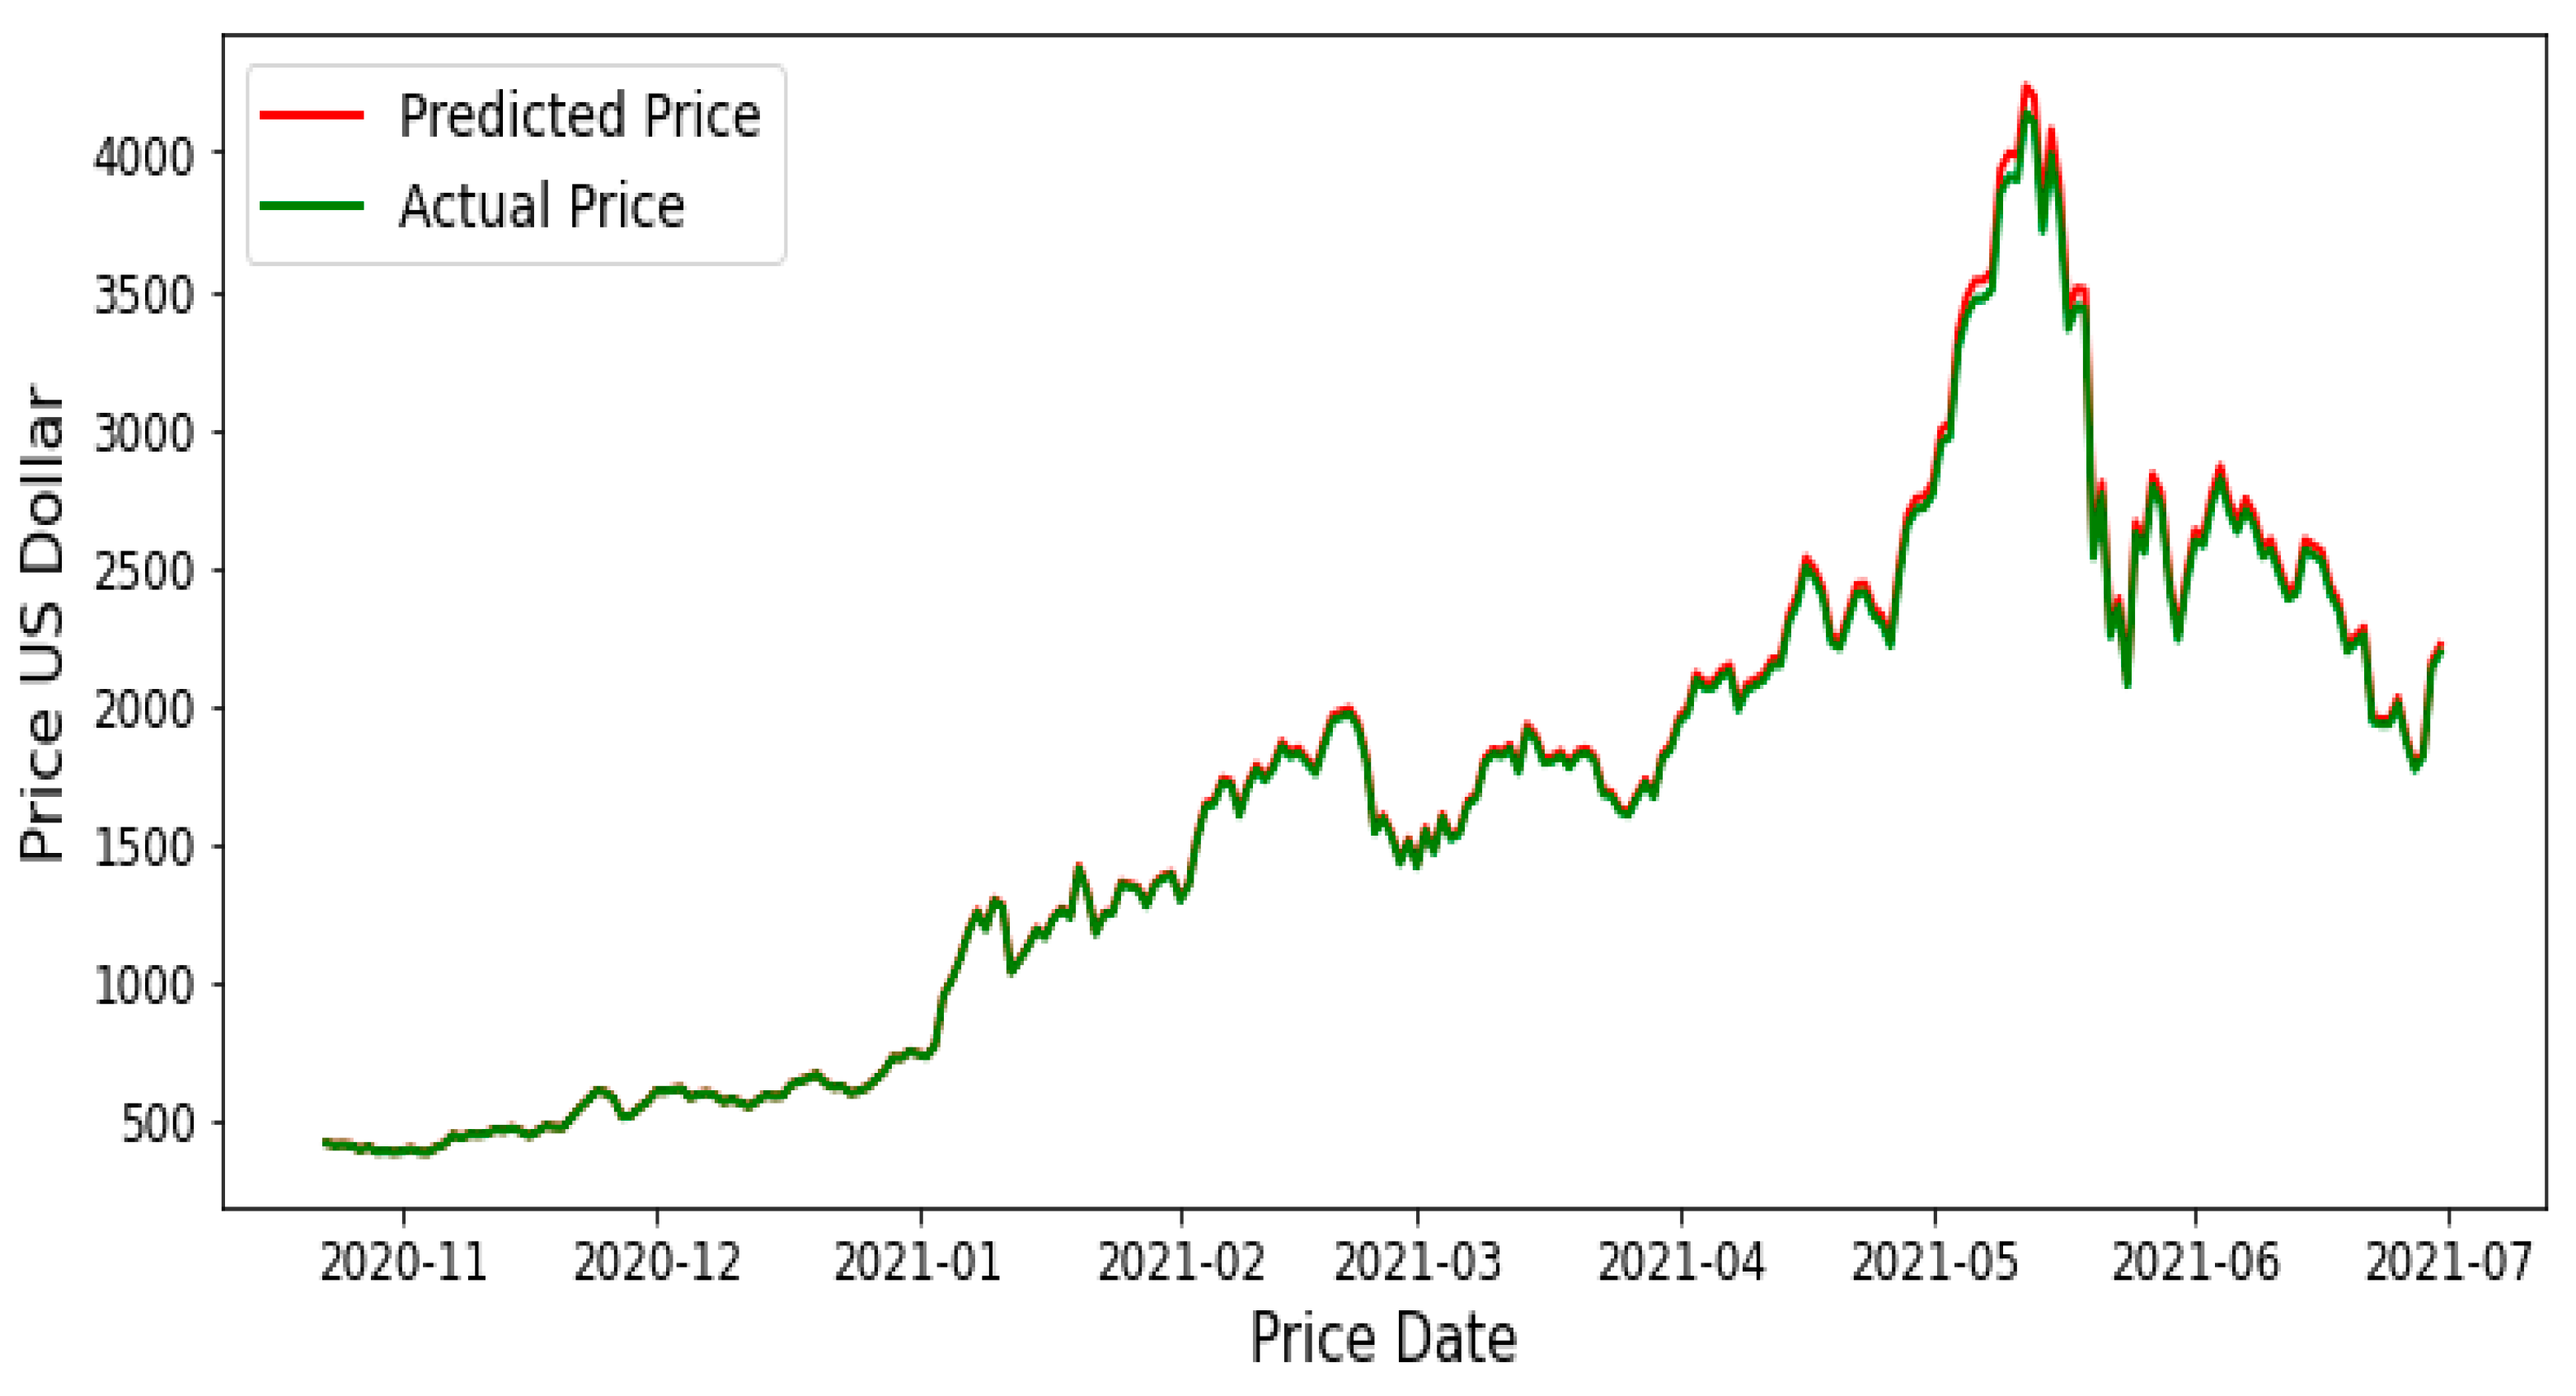
Figure 15 illustrates the comparison between the actual and the predicted price of the GRU model for ETH. It represents a negligible difference between the predicted and the actual price along the testing set of the time series. This model is considered the best with a mean absolute percentage of 0.8267%, and root mean square error of 321.061. Statistical analysis of the data indicates that the predicted price has a mean value of 1655.4645 USD, a maximum value of 4249.46 USD, and a minimum value of 384.33 USD, whereas the actual price has a mean value of 1636.7091 USD, a maximum value of 4140.0 USD, and a minimum value of 383.35 USD. The mean difference between the mean values of the actual and the predicated prices is 18.76 USD.
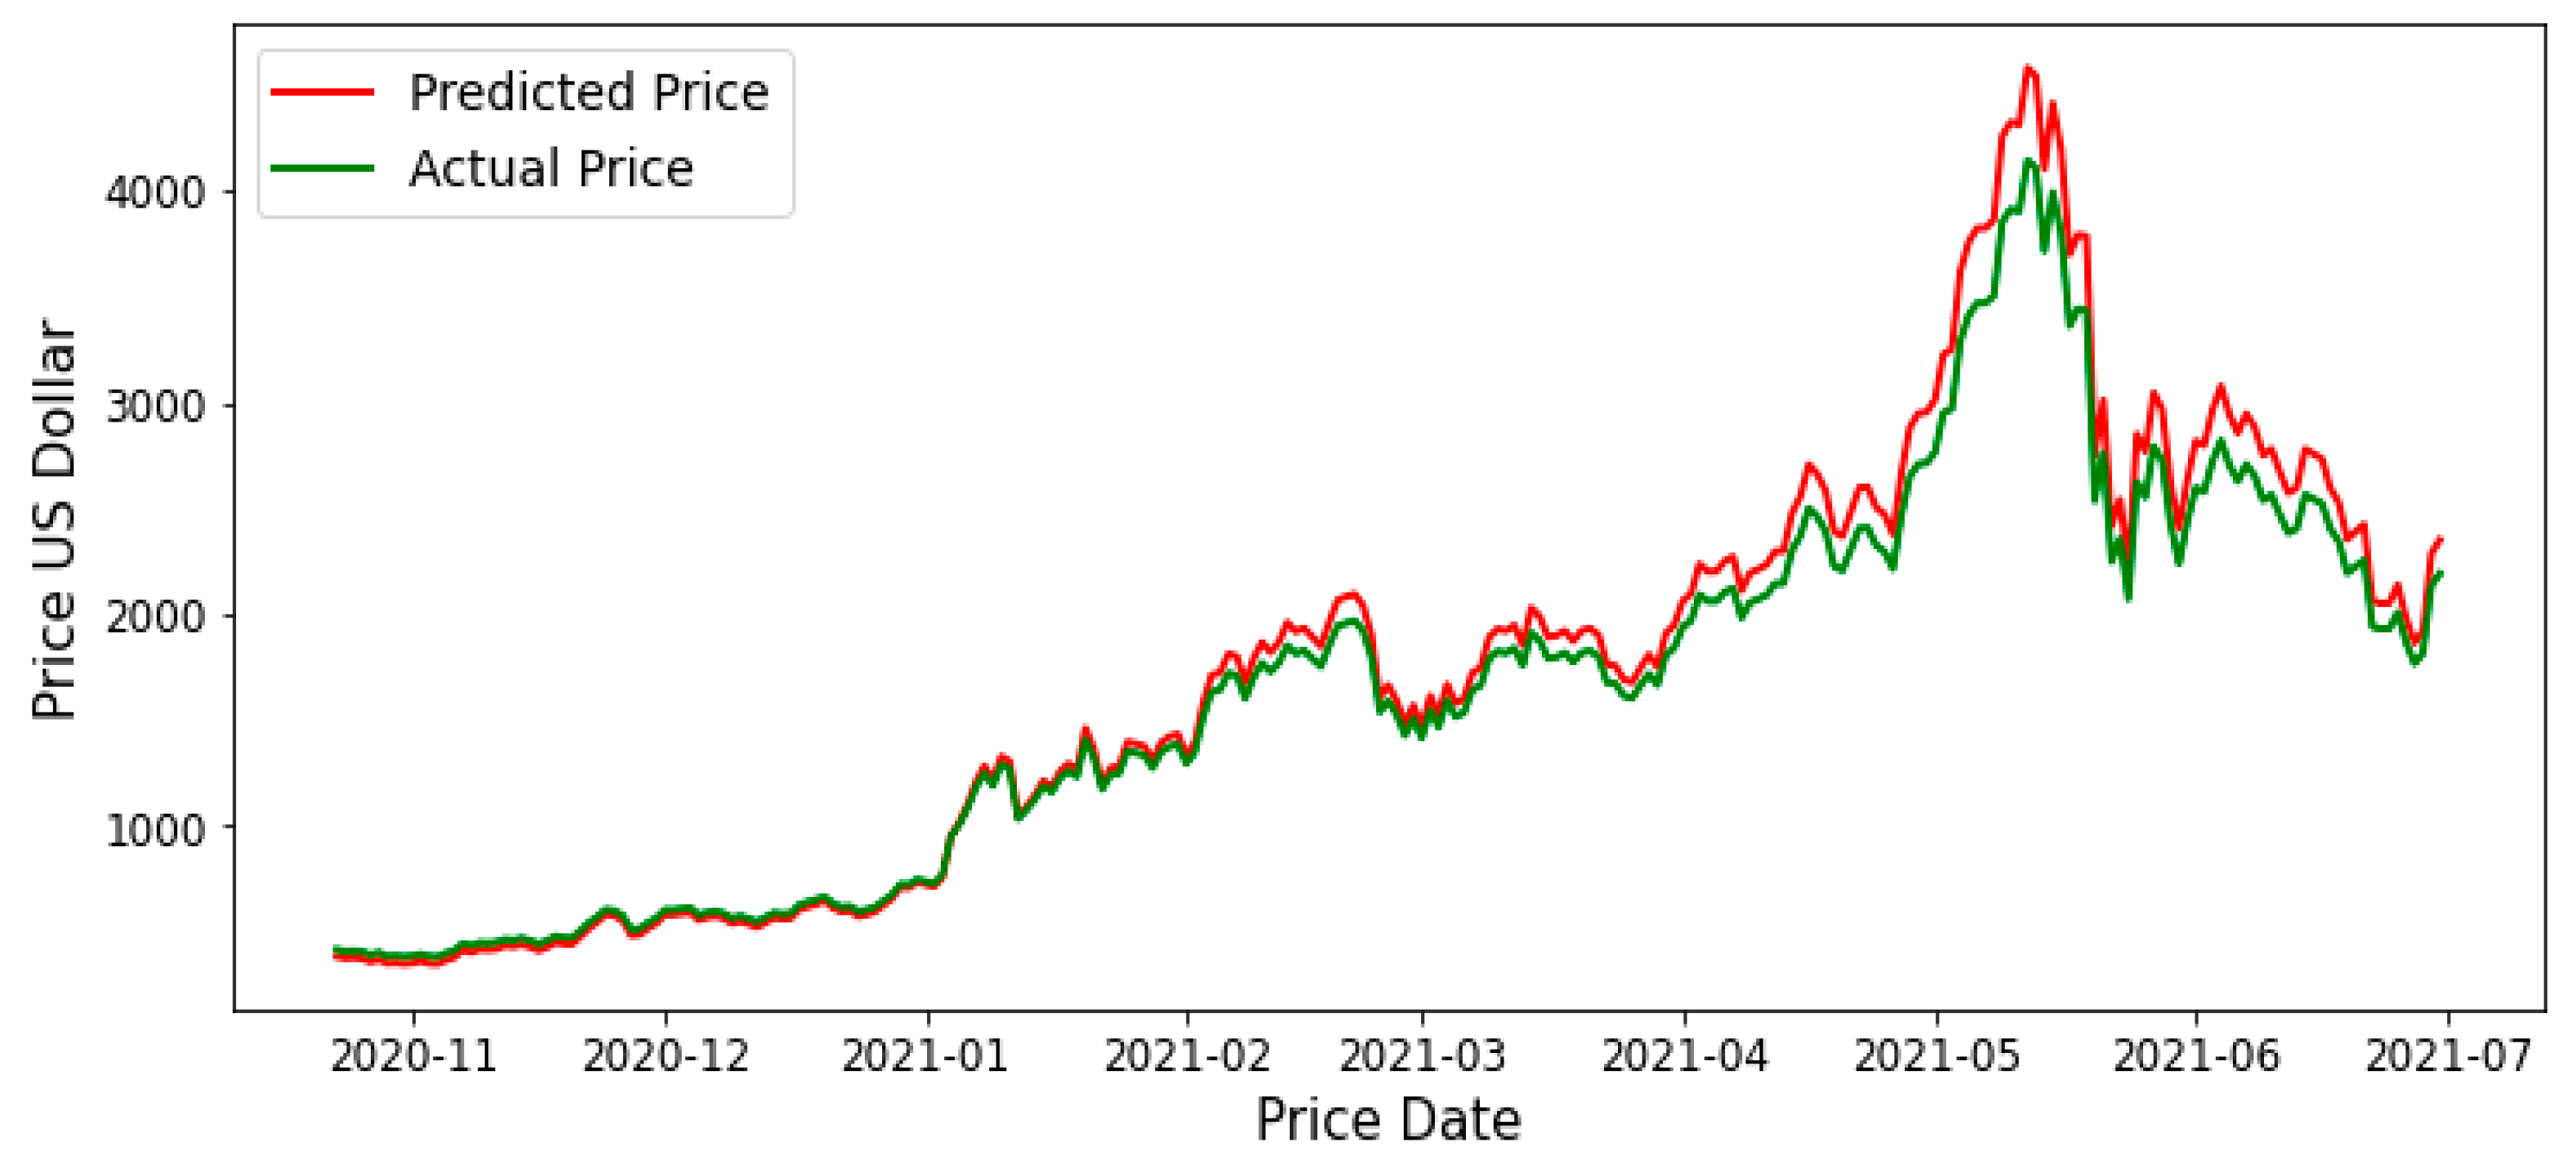
The results in Figure 16 illustrate the comparison between the actual and the predicted price of the bi-LSTM model for ETH. It shows substantial differences between the actual and the predicted price compared with the LSTM and GRU models with mean absolute percentage error of 6.85% and root mean square error of 321.061. Statistical analysis of the data indicates that the predicted price has a mean value of 1733.5935 USD, a maximum value of 4576.371 USD, and a minimum value of 350.24 USD, whereas the actual price has a mean value of 1636.7091 USD, a maximum value of 4140.0 USD, and a minimum value of 383.35 USD. The mean difference between the mean values of the actual and the predicated prices is 96.88 USD.
5.3. Results for LTC
The accuracy of the models for the LTC cryptocurrency are shown in Table 4. The mean absolute percentage error of the GRU model is the lowest with a value of 0.2116 and a root mean square error of 0.825. Therefore, GRU proved to be most capable for prediction as compared to LSTM and bi-LSTM for LTC. Figure 17, Figure 18 and Figure 19 show the visual representation of the data by comparing the actual and the predicted values of training dataset of the three models for LTC.
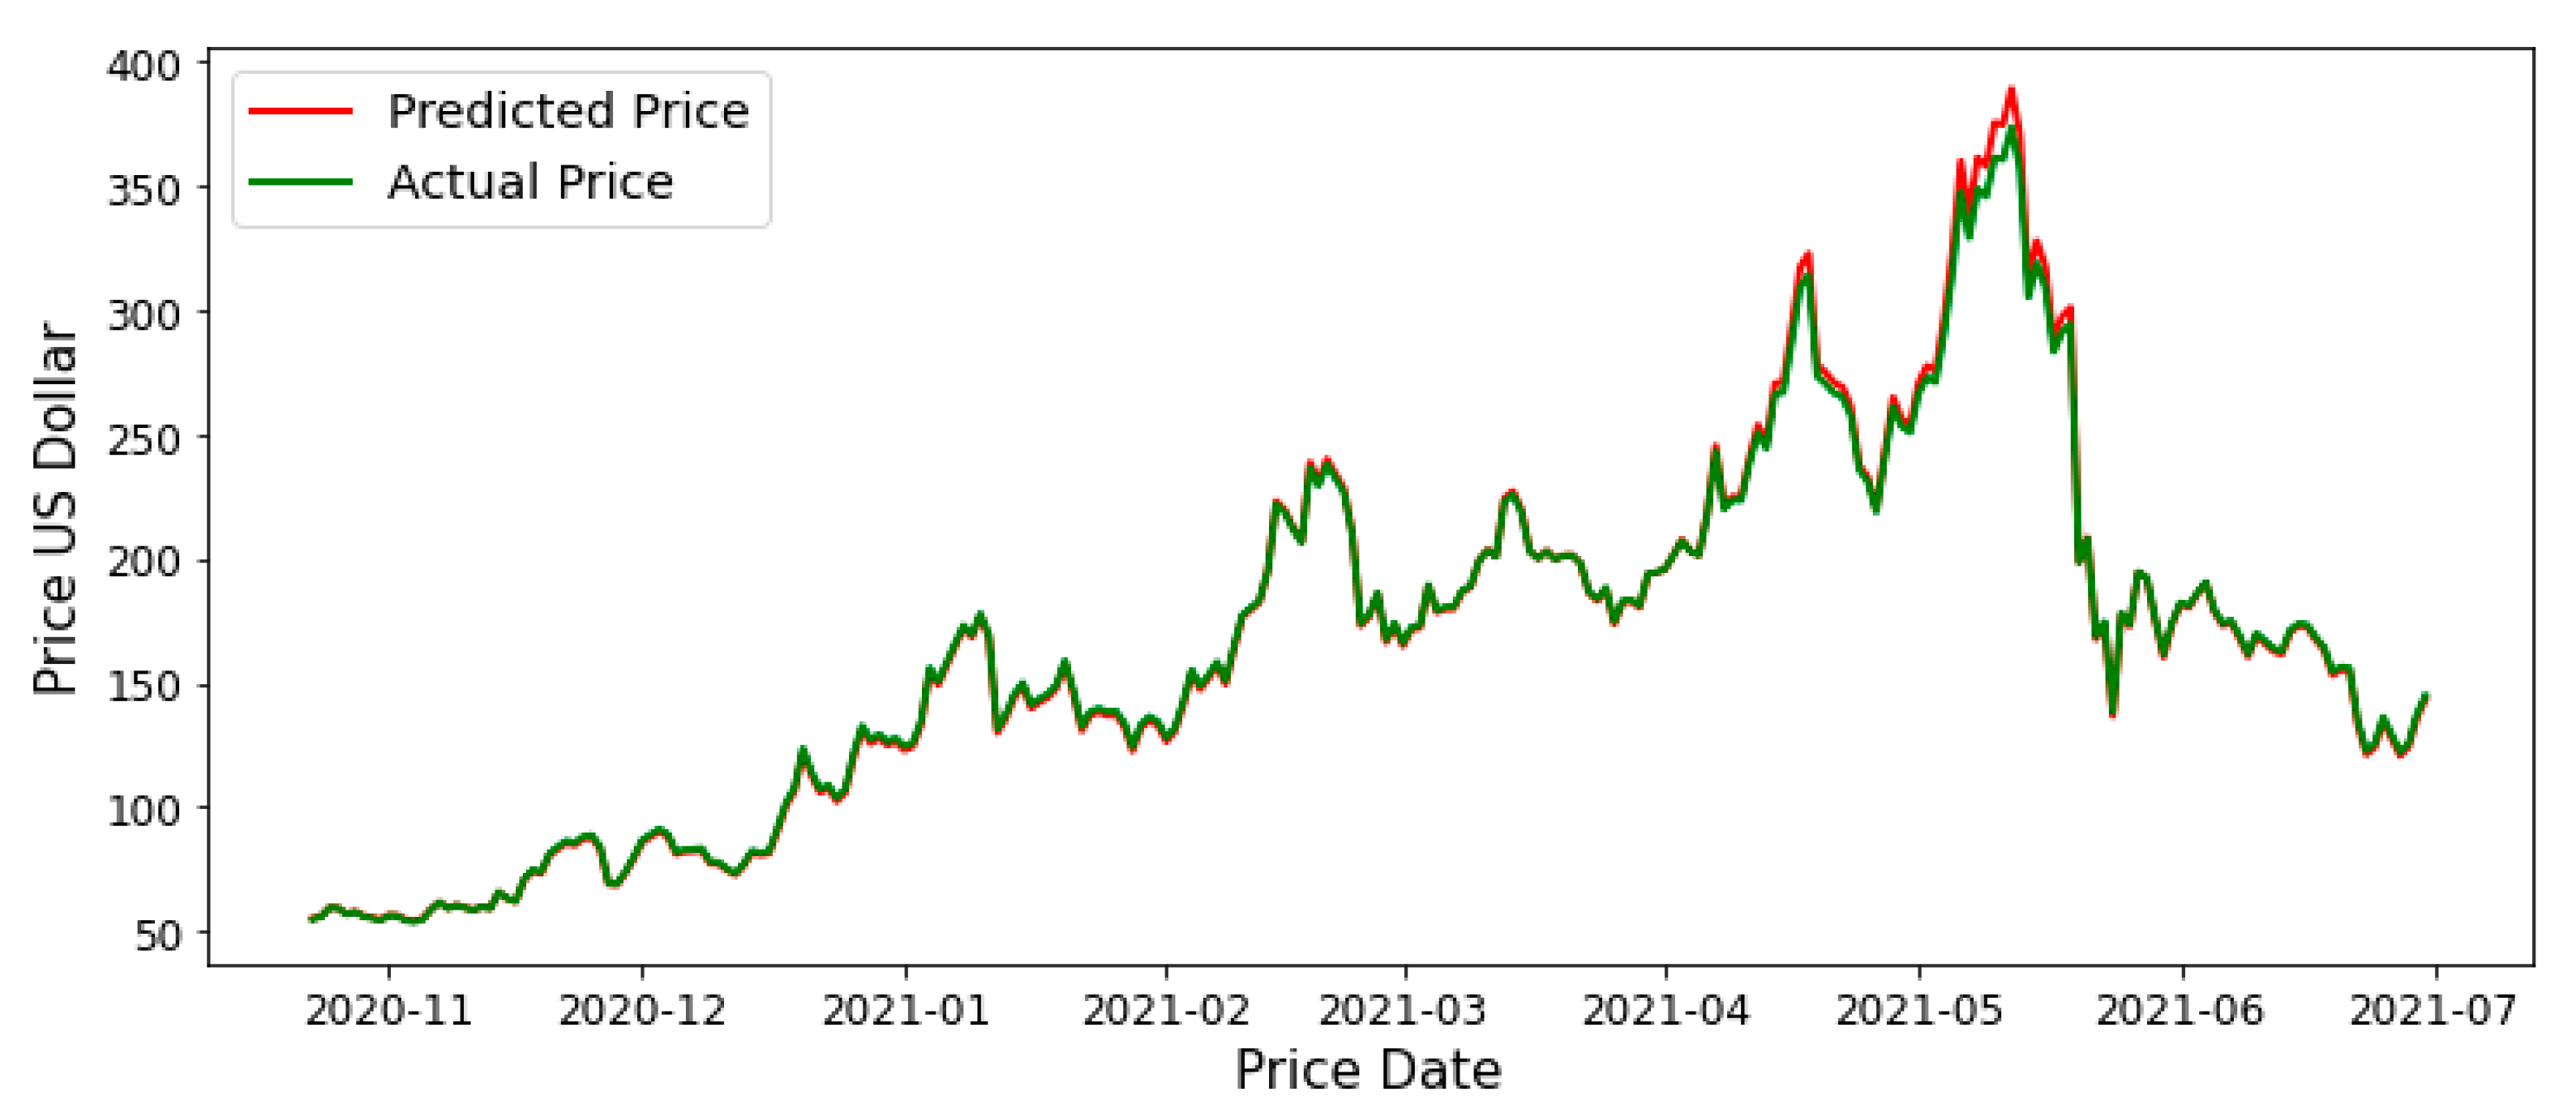
The results in Figure 17 show the comparison between the actual and the predicted price of the LSTM model for LTC. They show that the difference between the predicted and the actual price is very small with a mean absolute percentage error of 0.8474%, and a root mean square error of 3.069. Statistical analysis of the data indicates that the predicted price has a mean value of 166.16 USD, a maximum value of 388.59 USD, and a minimum value of 53.95 USD, whereas the actual price has a mean value of 165.68 USD, a maximum value of 373.64 USD, and a minimum value of 53.64 USD. The mean difference between the mean values of the actual and the predicated prices is 0.48 USD.
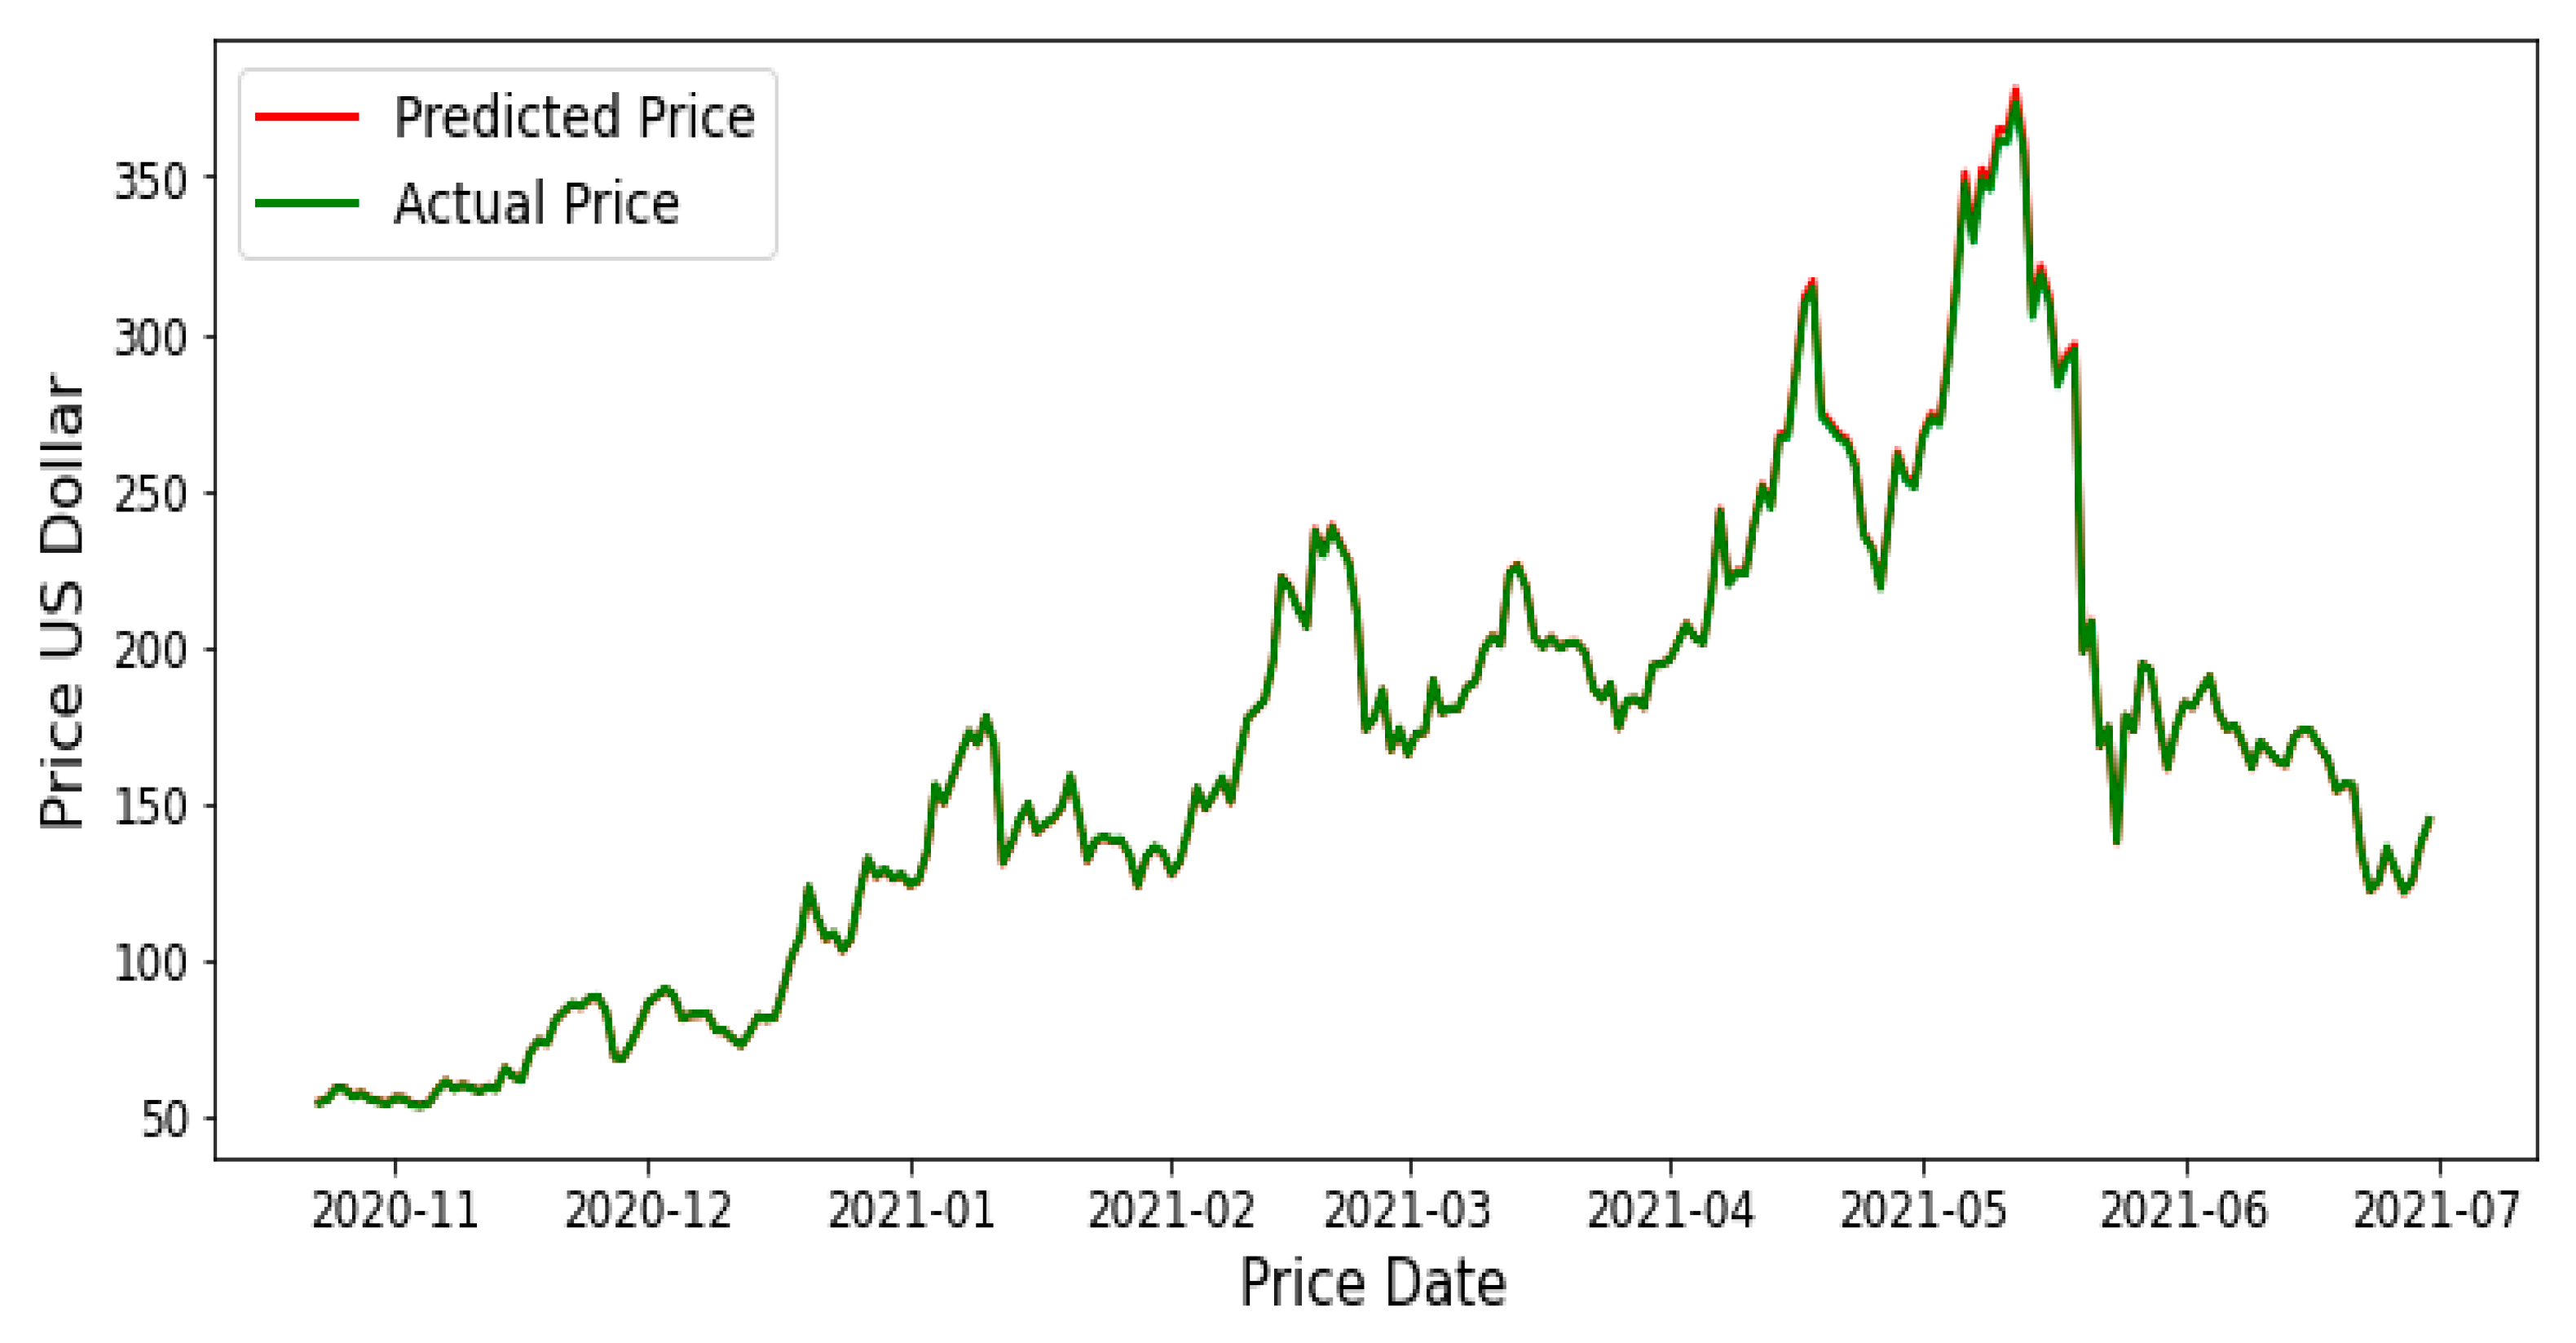
Figure 18 shows the comparison between the actual and the predicted price of the GRU model for LTC. It represents similar trends for both actual and predicted price with a mean absolute percentage error of 0.2116% and a root mean square error of 0.825. This model is considered the best model. Statistical analysis of the data indicates that the predicted price has a mean value of 165.93 USD, a maximum value of 378.10 USD, and a minimum value of 53.84 USD, whereas the actual price has a mean value of 165.68 USD, a maximum value of 373.64 USD, and a minimum value of 53.64 USD. The mean difference between the mean values of the actual and the predicated prices is 0.25 USD.
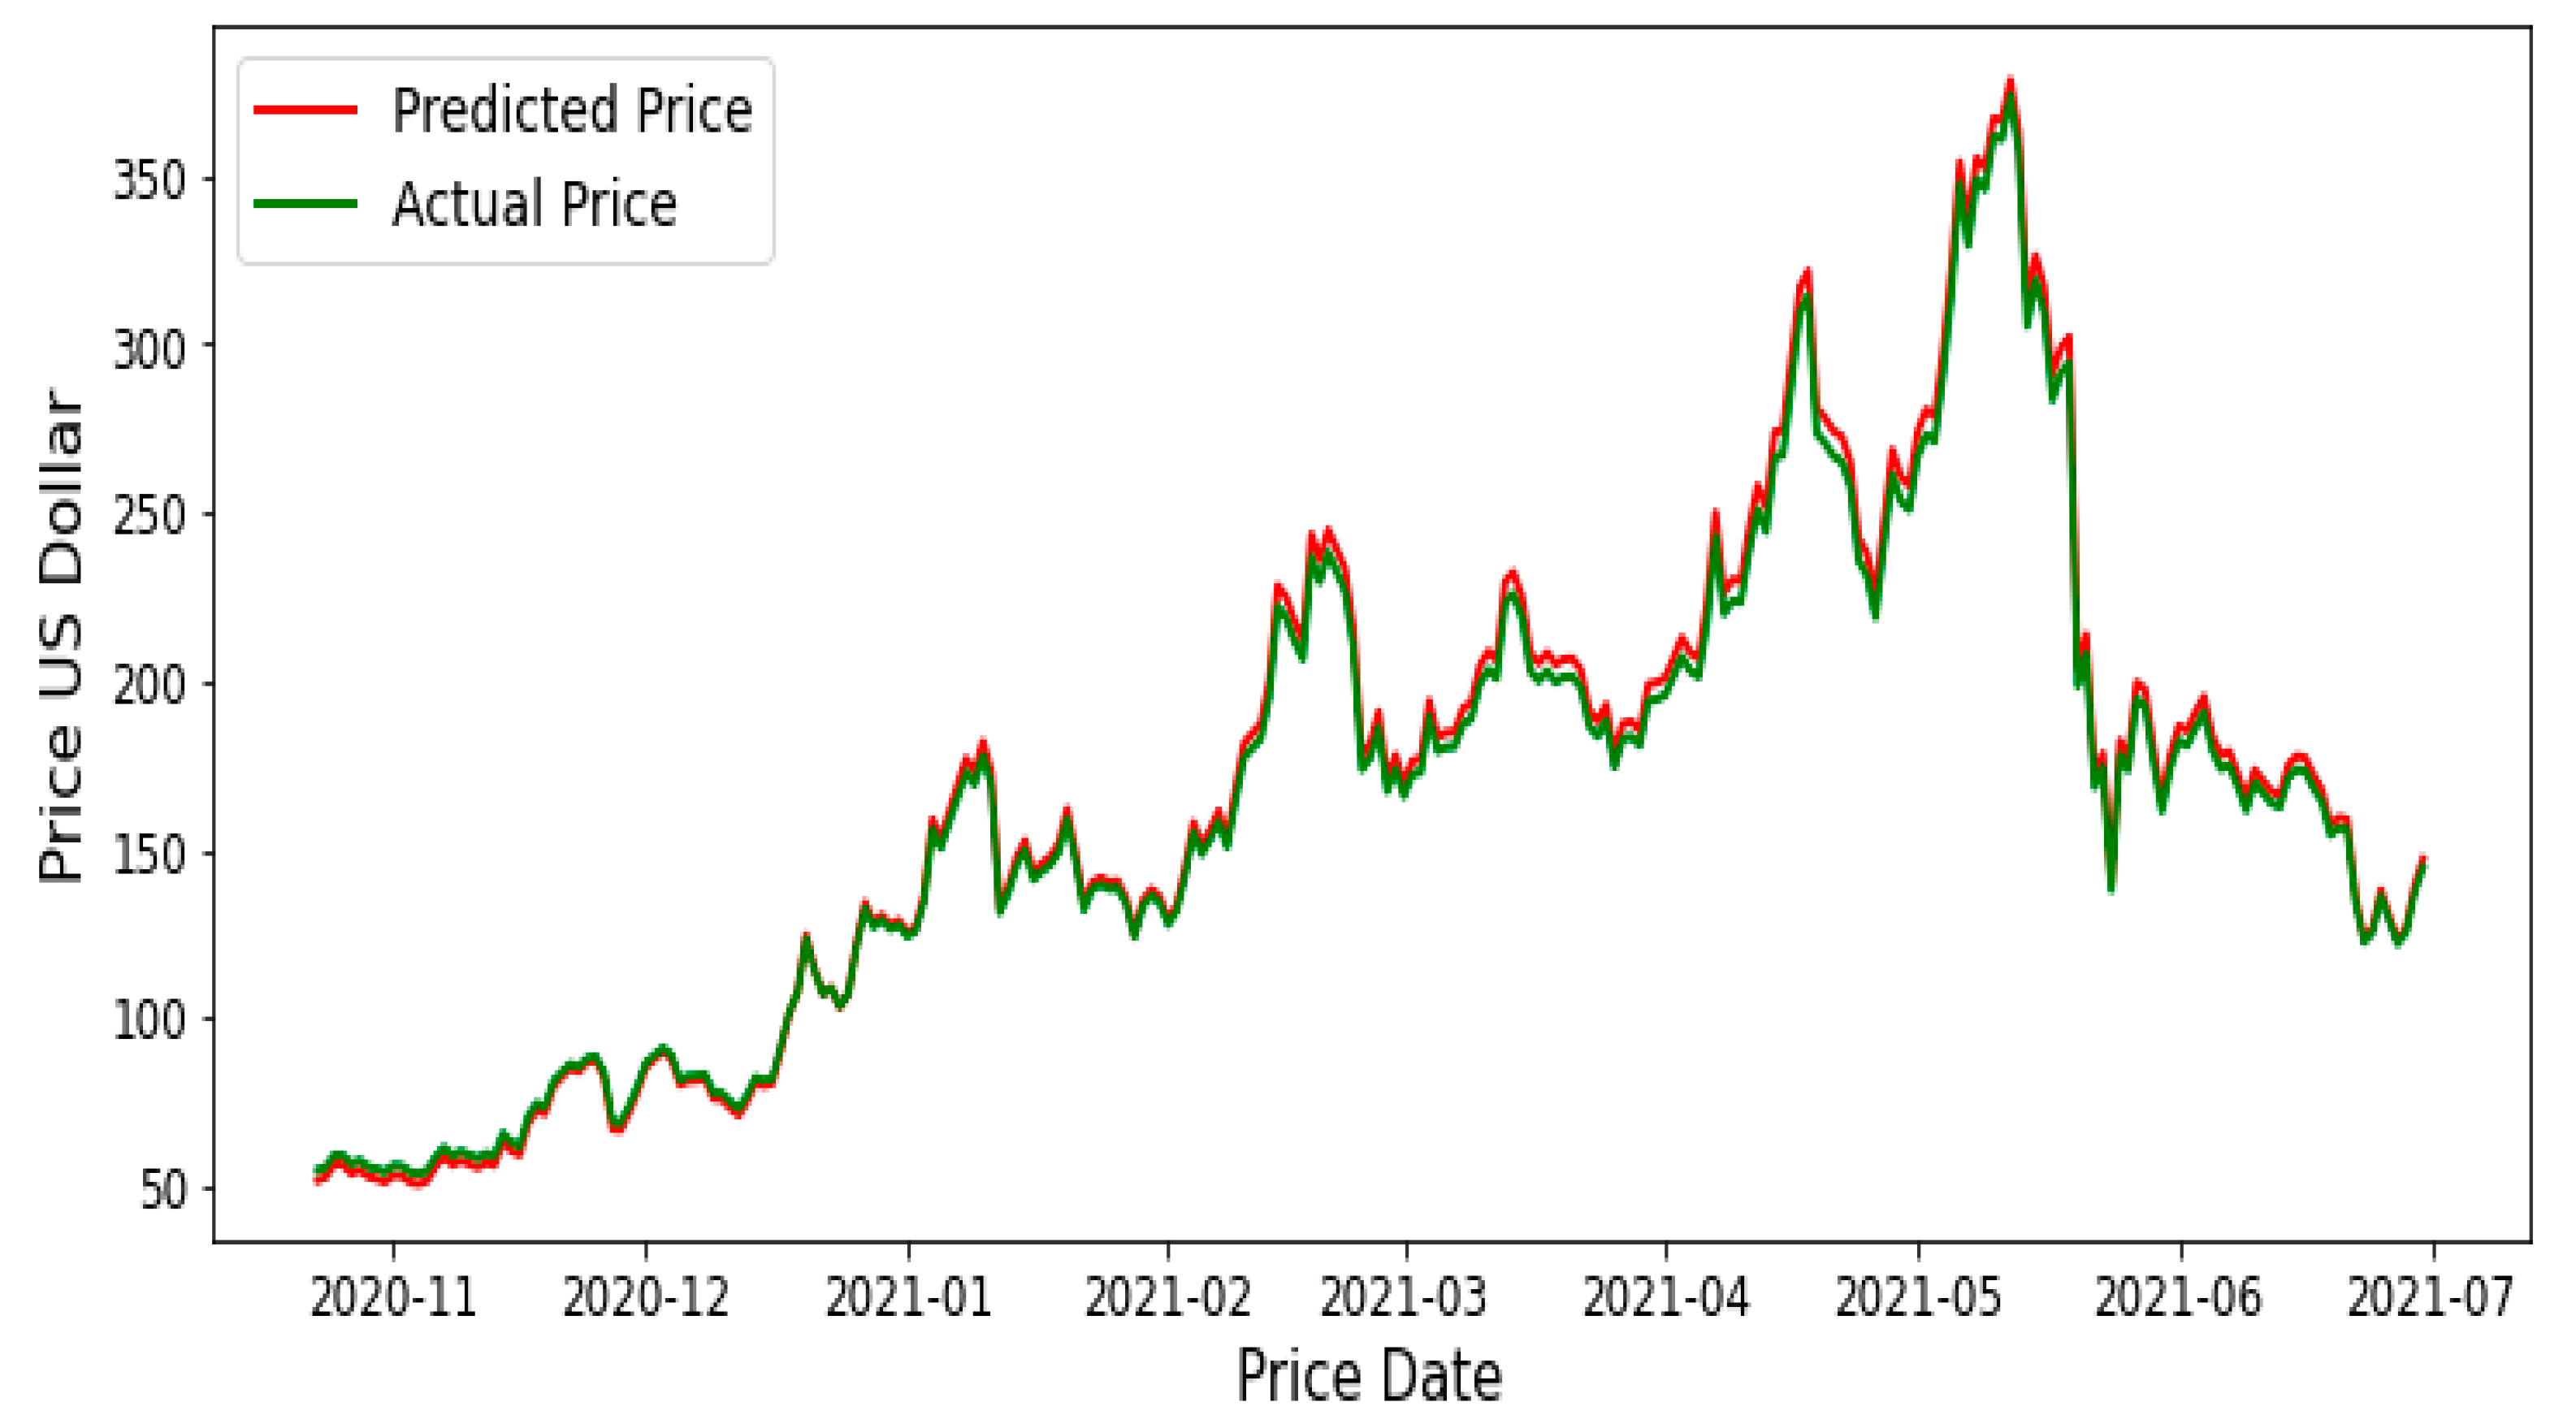
Figure 19 illustrates the comparison between the actual and the predicted price of the bi-LSTM model for LTC. It represents a small difference between the actual and the predicted price with mean absolute percentage error of 2.332% and a root mean square error of 4.307. Statistical analysis of the data indicates that the predicted price has a mean value of 176.75 USD, a maximum value of 378.10 USD, and a minimum value of 51.12 USD, whereas the actual price has a mean value of 165.68 USD, a maximum value of 397.57 USD, and a minimum value of 53.64 USD. The mean difference between the mean values of the actual and the predicated prices is 11.07 USD.
6. Discussion
The proposed model in this research can be considered a reliable and acceptable model for cryptocurrency prediction. Table 5 presents a comparison between the proposed model in this paper and other models in the literature.
Table 5 shows a comparison between the proposed model in this paper and other models in the literature [45,51,53]. The MAPES values of the proposed model in this paper for GRU predicting LTC represents the best performance compared to all other models as the predicted results are very close to the actual results. Results obtained from this paper show that the GRU performed better when predicting the price of all types of cryptocurrency than the LSTM and the bi-LSTM models.
7. Conclusions
In this paper, three types of machine learning algorithm are constructed and used for predicting the prices of three types of cryptocurrency—BTC, ETH, and LTC. Performance measures were conducted to test the accuracy of different models as shown in Table 2, Table 3 and Table 4. Then, we compared the actual and predicted prices. The results show that GRU outperformed the other algorithms with a MAPE of 0.2454%, 0.8267%, and 0.2116% for BTC, ETH, and LTC, respectively. The RMSE for the GRU model was found to be 174.129, 26.59, and 0.825 for BTC, ETH, and LTC, respectively. Based on these outcomes, the GRU model for the targeted cryptocurrencies can be considered efficient and reliable. This model is considered the best model. However, bi-LSTM represents less accuracy than GRU and LSTM with substantial differences between the actual and the predicted prices for both BTC and ETH. The experimental results show that:
- The AI algorithm is reliable and acceptable for cryptocurrency prediction.
- GRU can predict cryptocurrency prices better than LSTM and bi-LSTM but overall all algorithms represent excellent predictive results.
In future work, we will investigate other factors that might affect the prices of the cryptocurrency market, and we will focus on the effect that social media in general and tweets in particular can have on the price and trading volume of cryptocurrencies by analyzing tweets using natural language processing techniques and sentiment analysis.
Author Contributions
M.J.H. designed and built the models, processed the data, and wrote the first draft of the manuscript; A.Y.O. helped in the processing of the data and in the interpretation of the results. A.Y.O. revised and edited the manuscript. All authors have read and agreed to the published version of the manuscript.
Funding
This research is funded by the Arab American University in Palestine.
Data Availability Statement
Data used for this article is publicly available and collected from https://www.marketwatch.com.
Conflicts of Interest
The authors declare no conflict of interest.
References
- Mukhopadhyay, U.; Skjellum, A.; Hambolu, O.; Oakley, J.; Yu, L.; Brooks, R. A brief survey of Cryptocurrency systems. In Proceedings of the 14th Annual Conference on Privacy, Security and Trust (PST), Auckland, New Zealand, 12–14 December 2016; pp. 745–752. [Google Scholar] [CrossRef]
- Rose, C. The Evolution Of Digital Currencies: Bitcoin, A Cryptocurrency Causing A Monetary Revolution. Int. Bus. Econ. Res. J. (IBER) 2015, 14, 617. [Google Scholar] [CrossRef]
- Brenig, C.; Accorsi, R.; Müller, G. Economic Analysis of Cryptocurrency Backed Money Laundering. ECIS 2015 Completed Research Papers. Paper 20. 2015. Available online: https://aisel.aisnet.org/ecis2015_cr/20 (accessed on 16 June 2021).
- Eyal, I. Blockchain Technology: Transforming Libertarian Cryptocurrency Dreams to Finance and Banking Realities. Computer 2017, 50, 38–49. [Google Scholar] [CrossRef]
- DeVries, P. An Analysis of Cryptocurrency, Bitcoin, and the Future. Int. J. Bus. Manag. Commer. 2016, 1, 1–9. [Google Scholar]
- Jang, H.; Lee, J. An Empirical Study on Modeling and Prediction of Bitcoin Prices with Bayesian Neural Networks Based on Blockchain Information. IEEE Access 2017, 6, 5427–5437. [Google Scholar] [CrossRef]
- Saad, M.; Choi, J.; Nyang, D.; Kim, J.; Mohaisen, A. Toward Characterizing Blockchain-Based Cryptocurrencies for Highly Accurate Predictions. IEEE Syst. J. 2019, 14, 321–332. [Google Scholar] [CrossRef]
- Gautam, K.; Sharma, N.; Kumar, P. Empirical Analysis of Current Cryptocurrencies in Different Aspects. In Proceedings of the ICRITO 2020—IEEE 8th International Conference on Reliability, Infocom Technologies and Optimization (Trends and Future Directions), Noida, India, 4–5 June 2020; pp. 344–348. [Google Scholar] [CrossRef]
- Adams, R.; Kewell, B.; Parry, G. Blockchain for Good? Digital Ledger Technology and Sustainable Development Goals. In Handbook of Sustainability and Social Science Research; Filho, W.L., Marans, R., Callewaert, J., Eds.; World Sustainability Series; Springer: Cham, Switzerland, 2018. [Google Scholar] [CrossRef]
- Killer, C.; Rodrigues, B.; Stiller, B. Security Management and Visualization in a Blockchain-based Collaborative Defense. In Proceedings of the ICBC 2019—IEEE International Conference on Blockchain and Cryptocurrency, Seoul, Korea, 14–17 May 2019; pp. 108–111. [Google Scholar] [CrossRef] [Green Version]
- Gandal, N.; Halaburda, H. Competition in the Cryptocurrency Market (September 29, 2014). CESifo Working Paper Series No. 4980. Available online: https://ssrn.com/abstract=2506577 (accessed on 16 June 2021).
- Iwamura, M.; Kitamura, Y.; Matsumoto, T. Is Bitcoin the Only Cryptocurrency in the Town? Economics of Cryptocurrency And Friedrich A. Hayek (February 28, 2014). Available online: https://ssrn.com/abstract=2405790 (accessed on 16 June 2021). [CrossRef] [Green Version]
- Kyriazis, N.A. A Survey on Empirical Findings about Spillovers in Cryptocurrency Markets. J. Risk Financ. Manag. 2019, 12, 170. [Google Scholar] [CrossRef] [Green Version]
- Hassani, H.; Huang, X.; Silva, E. Big-Crypto: Big Data, Blockchain and Cryptocurrency. Big Data Cogn. Comput. 2018, 2, 34. [Google Scholar] [CrossRef] [Green Version]
- Nizzoli, L.; Tardelli, S.; Avvenuti, M.; Cresci, S.; Tesconi, M.; Ferrara, E. Charting the Landscape of Online Cryptocurrency Manipulation. IEEE Access 2020, 8, 113230–113245. [Google Scholar] [CrossRef]
- Rebane, J.; Karlsson, I.; Papapetrou, P.; Denic, S. Seq2Seq RNNs and ARIMA models for Cryptocurrency Prediction: A Comparative Study. In Proceedings of the SIGKDD Workshop on Fintech (SIGKDD Fintech’18), London, UK, 19–23 August 2018. [Google Scholar]
- Rehman, M.U.; Apergis, N. Determining the predictive power between cryptocurrencies and real time commodity futures: Evidence from quantile causality tests. Resour. Policy 2019, 61, 603–616. [Google Scholar] [CrossRef]
- Liew, J.; Li, R.Z.; Budavári, T.; Sharma, A. Cryptocurrency Investing Examined. J. Br. Blockchain Assoc. 2019, 2, 1–12. [Google Scholar] [CrossRef] [Green Version]
- Dyntu, V.; Dykyi, O. Cryptocurrency in the system of money laundering. Balt. J. Econ. Stud. 2019, 4, 75–81. [Google Scholar] [CrossRef]
- Kethineni, S.; Cao, Y. The Rise in Popularity of Cryptocurrency and Associated Criminal Activity. Int. Crim. Justice Rev. 2019, 30, 325–344. [Google Scholar] [CrossRef]
- Liu, Y.; Tsyvinski, A. Risks and Returns of Cryptocurrency. Rev. Financ. Stud. 2020, 34, 2689–2727. [Google Scholar] [CrossRef]
- Valdeolmillos, D.; Mezquita, Y.; González-Briones, A.; Prieto, J.; Corchado, J.M. Blockchain Technology: A Review of the Current Challenges of Cryptocurrency. In Blockchain and Applications. BLOCKCHAIN 2019. Advances in Intelligent Systems and Computing; Prieto, J., Das, A., Ferretti, S., Pinto, A., Corchado, J., Eds.; Springer: Cham, Switzerland, 2020; Volume 1010. [Google Scholar] [CrossRef]
- Yuneline, M.H. Analysis of cryptocurrency’s characteristics in four perspectives. J. Asian Bus. Econ. Stud. 2019, 26, 206–219. [Google Scholar] [CrossRef] [Green Version]
- Huynh, T.L.D.; Nasir, M.A.; Vo, X.V.; Nguyen, T.T. “Small things matter most”: The spillover effects in the cryptocurrency market and gold as a silver bullet. North Am. J. Econ. Financ. 2020, 54, 101277. [Google Scholar] [CrossRef]
- Hitam, N.A.; Ismail, A.R. Comparative Performance of Machine Learning Algorithms for Cryptocurrency Forecasting. Indones. J. Electr. Eng. Comput. Sci. 2018, 11, 1121–1128. [Google Scholar] [CrossRef]
- Andrianto, Y. The Effect of Cryptocurrency on Investment Portfolio Effectiveness. J. Financ. Account. 2017, 5, 229. [Google Scholar] [CrossRef] [Green Version]
- Derbentsev, V.; Babenko, V.; Khrustalev, K.; Obruch, H.; Khrustalova, S. Comparative Performance of Machine Learning Ensemble Algorithms for Forecasting Cryptocurrency Prices. Int. J. Eng. Trans. A Basics 2021, 34, 140–148. [Google Scholar] [CrossRef]
- Patel, M.M.; Tanwar, S.; Gupta, R.; Kumar, N. A Deep Learning-based Cryptocurrency Price Prediction Scheme for Financial Institutions. J. Inf. Secur. Appl. 2020, 55, 102583. [Google Scholar] [CrossRef]
- Miura, R.; Pichl, L.; Kaizoji, T. Artificial Neural Networks for Realized Volatility Prediction in Cryptocurrency Time Series. In Advances in Neural Networks—ISNN 2019; Lu, H., Tang, H., Wang, Z., Eds.; Lecture Notes in Computer Science; Springer: Cham, Switzerland, 2019; Volume 11554. [Google Scholar] [CrossRef]
- Karasu, S.; Altan, A.; Sarac, Z.; Hacioglu, R. Prediction of Bitcoin prices with machine learning methods using time series data. In Proceedings of the 26th Signal Processing and Communications Applications Conference (SIU), Izmir, Turkey, 2–5 May 2018. [Google Scholar] [CrossRef]
- Saad, M.; Mohaisen, A. Towards characterizing blockchain-based cryptocurrencies for highly-accurate predictions. In Proceedings of the IEEE INFOCOM—IEEE Conference on Computer Communications Workshops (INFOCOM WKSHPS), Honolulu, HI, USA, 15–19 April 2018. [Google Scholar] [CrossRef]
- Yiying, W.; Yeze, Z. Cryptocurrency Price Analysis with Artificial Intelligence. In Proceedings of the 5th International Conference on Information Management (ICIM), Cambridge, UK, 24–27 March 2019; pp. 97–101. [Google Scholar] [CrossRef]
- Chen, Z.; Li, C.; Sun, W. Bitcoin price prediction using machine learning: An approach to sample dimension engineering. J. Comput. Appl. Math. 2019, 365, 112395. [Google Scholar] [CrossRef]
- Valencia, F.; Gómez-Espinosa, A.; Valdés-Aguirre, B. Price Movement Prediction of Cryptocurrencies Using Sentiment Analysis and Machine Learning. Entropy 2019, 21, 589. [Google Scholar] [CrossRef] [Green Version]
- Ferdiansyah, F.; Othman, S.H.; Radzi, R.Z.R.M.; Stiawan, D.; Sazaki, Y.; Ependi, U. A LSTM-Method for Bitcoin Price Prediction: A Case Study Yahoo Finance Stock Market. In Proceedings of the ICECOS—3rd International Conference on Electrical Engineering and Computer Science, Batam, Indonesia, 2–3 October 2019; pp. 206–210. [Google Scholar] [CrossRef]
- Zhao, Y.; Chen, Z. Forecasting stock price movement: New evidence from a novel hybrid deep learning model. J. Asian Bus. Econ. Studies 2021. ahead-of-print. [Google Scholar] [CrossRef]
- Jain, A.; Tripathi, S.; Dwivedi, H.D.; Saxena, P. Forecasting Price of Cryptocurrencies Using Tweets Sentiment Analysis. In Proceedings of the 11th International Conference on Contemporary Computing (IC3), Noida, India, 2–4 August 2018; pp. 1–7. [Google Scholar] [CrossRef]
- Wu, C.-H.; Lu, C.-C.; Ma, Y.-F.; Lu, R.-S. A New Forecasting Framework for Bitcoin Price with LSTM. In Proceedings of the IEEE International Conference on Data Mining Workshops (ICDMW), Singapore, 17–20 November 2018; pp. 168–175. [Google Scholar] [CrossRef]
- Yamak, P.T.; Yujian, L.; Gadosey, P.K. A Comparison between ARIMA, LSTM, and GRU for Time Series Forecasting. In Proceedings of the 2nd International Conference on Algorithms, Computing and Artificial Intelligence, Sanya, China, 20–22 December 2019; pp. 49–55. [Google Scholar] [CrossRef]
- McNally, S.; Roche, J.; Caton, S. Predicting the Price of Bitcoin Using Machine Learning. In Proceedings of the 26th Euromicro International Conference on Parallel, Distributed and Network-based Processing (PDP), Cambridge, UK, 21–23 March 2018; pp. 339–343. [Google Scholar] [CrossRef] [Green Version]
- Lazo, J.G.L.; Medina, G.H.H.; Guevara, A.V.; Talavera, A.; Otero, A.N.; Cordova, E.A. Support System to Investment Management in Cryptocurrencies. In Proceedings of the 2019 7th International Engineering, Sciences and Technology Conference, IESTEC, Panama, Panama, 9–11 October 2019; pp. 376–381. [Google Scholar] [CrossRef]
- Market Watch Which Provides the Latest Stock Market, Financial and Business News. Available online: https://www.marketwatch.com (accessed on 16 June 2021).
- Greff, K.; Srivastava, R.K.; Koutnik, J.; Steunebrink, B.R.; Schmidhuber, J. LSTM: A Search Space Odyssey. IEEE Trans. Neural Netw. Learn. Syst. 2017, 28, 2222–2232. [Google Scholar] [CrossRef] [Green Version]
- Sherratt, F.; Plummer, A.; Iravani, P. Understanding LSTM Network Behaviour of IMU-Based Locomotion Mode Recognition for Applications in Prostheses and Wearables. Sensors 2021, 21, 1264. [Google Scholar] [CrossRef] [PubMed]
- Jozefowicz, R.; Zaremba, W.; Sutskever, I. An empirical exploration of Recurrent Network architectures. In Proceedings of the 32nd International Conference on Machine Learning (ICML), Lille, France, 6–11 July 2015; Volume 3, pp. 2332–2340. [Google Scholar]
- Le, X.-H.; Ho, H.V.; Lee, G.; Jung, S. Application of Long Short-Term Memory (LSTM) Neural Network for Flood Forecasting. Water 2019, 11, 1387. [Google Scholar] [CrossRef] [Green Version]
- Li, X.; Peng, L.; Yao, X.; Cui, S.; Hu, Y.; You, C.; Chi, T. Long short-term memory neural network for air pollutant concentration predictions: Method development and evaluation. Environ. Pollut. 2017, 231, 997–1004. [Google Scholar] [CrossRef]
- Kwak, G.H.; Park, C.W.; Ahn, H.Y.; Na, S.; Il, L.; Do, K.; Park, N.W. Potential of bidirectional long short-term memory networks for crop classification with multitemporal remote sensing images. Korean J. Remote. Sens. 2020, 36, 515–525. [Google Scholar] [CrossRef]
- Althelaya, K.A.; El-Alfy, E.-S.M.; Mohammed, S. Evaluation of bidirectional LSTM for short-and long-term stock market prediction. In Proceedings of the 9th International Conference on Information and Communication Systems (ICICS), Irbid, Jordan., 3–5 April 2018. [Google Scholar] [CrossRef]
- Yildirim, Ö. A novel wavelet sequence based on deep bidirectional LSTM network model for ECG signal classification. Comput. Biol. Med. 2018, 96, 189–202. [Google Scholar] [CrossRef] [PubMed]
- Yang, S. Research on Network Behavior Anomaly Analysis Based on Bidirectional LSTM. In Proceedings of the IEEE 3rd Information Technology, Networking, Electronic and Automation Control Conference (ITNEC), Chengdu, China, 15–17 March 2019. [Google Scholar] [CrossRef]
- Dey, R.; Salemt, F.M. Gate-variants of Gated Recurrent Unit (GRU) neural networks. In Proceedings of the IEEE 60th International Midwest Symposium on Circuits and Systems (MWSCAS), Boston, MA, USA, 6–9 August 2017. [Google Scholar] [CrossRef] [Green Version]
- Zhao, R.; Wang, D.; Yan, R.; Mao, K.; Shen, F.; Wang, J. Machine Health Monitoring Using Local Feature-Based Gated Recurrent Unit Networks. IEEE Trans. Ind. Electron. 2018, 65, 1539–1548. [Google Scholar] [CrossRef]
- Su, Y.; Kuo, C.-C.J. On extended long short-term memory and dependent bidirectional recurrent neural network. Neurocomputing 2019, 356, 151–161. [Google Scholar] [CrossRef] [Green Version]
Figure 1.
Methodology of processing data and model selection.

Figure 2.
Training and testing dataset for BTC.

Figure 3.
Training and testing dataset for ETH.

Figure 4.
Training and testing dataset for LTC.

Figure 5.
The structure of a long short-term memory (LSTM) algorithm.

Figure 6.
The structure of a bi-directional LSTM (bi-LSTM) algorithm.

Figure 7.
The cell model of a GRU block diagram.

Figure 8.
Time series with closing prices for BTC, ETH, and LTC.

Figure 9.
Correlation matrix for the cryptocurrencies BTC, LTC, and ETH.

Figure 10.
Screenshot showing a sample of the data from the BTC, ETH, and LTC dataset.

Figure 11.
Actual and predicted price of BTC using the LSTM model.

Figure 12.
Actual and predicted price of BTC using the GRU model.

Figure 13.
Actual and predicted price of BTC using the bi-LSTM model.

Figure 14.
Actual and predicted price of ETH using the LSTM model.

Figure 15.
Actual and predicted price of ETH using the GRU model.

Figure 16.
Actual and predicted price of ETH using the bi-LSTM model.

Figure 17.
Actual and predicted price of LTC using the LSTM model.

Figure 18.
Actual and predicted price of LTC using the GRU model.

Figure 19.
Actual and predicted price of LTC using the bi-LSTM model.


Table 1.
Dataset specification.
| Variable Name | Variable Description | Data Type |
|---|---|---|
| Date | Date of Observation | Date |
| Open | Opening price on the given day | Number |
| High | High price on the given day | Number |
| Low | Low price on the given day | Number |
| Close | Close price on the given day | Number |
Table 2.
BTC models results.
| Model | RMSE | MAPE |
|---|---|---|
| LSTM | 410.399 | 1.1234% |
| bi-LSTM | 2927.006 | 5.990% |
| GRU | 174.129 | 0.2454% |
Table 3.
ETH models results.
| Model | RMSE | MAPE |
|---|---|---|
| LSTM | 59.507 | 1.5498% |
| bi-LSTM | 321.061 | 6.85% |
| GRU | 26.59 | 0.8267% |
Table 4.
LTC model results.
| Model | RMSE | MAPE |
|---|---|---|
| LSTM | 3.069 | 0.8474% |
| bi-LSTM | 4.307 | 2.332% |
| GRU | 0.825 | 0.2116% |
Table 5.
A comparison between previous work and the model proposed in this paper.
| Reference | Cryptocurrency | Method | Result |
|---|---|---|---|
| [51] | BTC, LTC | Multi-linear regression model | R2 score: 44% for LTC and 59% for BTC |
| [45] | BTC | Logistic regression and linear discriminant analysis | LR: 66% LDA: 65.3% |
| [53] | BTC | ARIMA, LSTM and GRU. | RMSE ARIMA: 302.53, LSTM: 603.68 GRU: 381.34 |
| This paper | BTC | LSTM, GRU, and bi-LSTM | GRU MAPE: 0.2454% RMSE: 174.129 LSTM MAPE: 1.1234% RMSE: 410.399 bi-LSTM MAPE: 5.990% RMSE: 2927.006 |
| This paper | ETH | LSTM, GRU, and bi-LSTM | GRU MAPE: 0.8267% RMSE: 26.59 LSTM MAPE: 1.5498% RMSE: 59.507 bi-LSTM MAPE: 6.85% RMSE: 321.061 |
| This paper | LTC | LSTM, GRU, and bi-LSTM | GRU MAPE: 0.2116% RMSE: 0.825 LSTM MAPE: 0.8474% RMSE: 3.069 bi-LSTM MAPE: 2.332% RMSE: 4.307 |
Publisher’s Note: MDPI stays neutral with regard to jurisdictional claims in published maps and institutional affiliations. |
© 2021 by the authors. Licensee MDPI, Basel, Switzerland. This article is an open access article distributed under the terms and conditions of the Creative Commons Attribution (CC BY) license (https://creativecommons.org/licenses/by/4.0/).
Share and Cite
MDPI and ACS Style
Hamayel, M.J.; Owda, A.Y. A Novel Cryptocurrency Price Prediction Model Using GRU, LSTM and bi-LSTM Machine Learning Algorithms. AI 2021, 2, 477-496. https://doi.org/10.3390/ai2040030
AMA Style
Hamayel MJ, Owda AY. A Novel Cryptocurrency Price Prediction Model Using GRU, LSTM and bi-LSTM Machine Learning Algorithms. AI. 2021; 2(4):477-496. https://doi.org/10.3390/ai2040030
Chicago/Turabian StyleHamayel, Mohammad J., and Amani Yousef Owda. 2021. "A Novel Cryptocurrency Price Prediction Model Using GRU, LSTM and bi-LSTM Machine Learning Algorithms" AI 2, no. 4: 477-496. https://doi.org/10.3390/ai2040030