Article

Response of Bt and Non-Bt Cottons to High Infestations of Bollworm (Helicoverpa zea Boddie) and Tobacco Budworm (Heliothis virescens (F.)) under Sprayed and Unsprayed Conditions

by
Kerry C. Allen
*,
Randall G. Luttrell
,
Nathan S. Little
,
Katherine A. Parys
and
Omaththage P. Perera
USDA-ARS Southern Insect Management Research Unit, 141 Experiment Station Road, Stoneville, MS 38776, USA
*
Author to whom correspondence should be addressed.
Agronomy 2019, 9(11), 759; https://doi.org/10.3390/agronomy9110759
Submission received: 21 September 2019 / Revised: 1 November 2019 / Accepted: 12 November 2019 / Published: 15 November 2019
(This article belongs to the Special Issue Integrating Pest Management into Agricultural Production Systems)

Abstract

:
Early-maturing and full-season Bt and non-Bt cottons were exposed to high densities of tobacco budworm (Heliothis virescens (F.)) and bollworm (Helicoverpa zea Boddie) in 0.04 ha field cages during the summers of 2011 and 2012 to measure the possible need for supplemental use of insecticides on Bt cotton. Fruit survival within-season and at-harvest was carefully mapped on individual plants within comparative plots of all cottons untreated and sprayed with lambda-cyhalothin (0.0448 kg a.i./ha) or chlorantraniliprole (0.1009 kg a.i./ha) following insect infestations. Differences in lint yields among cotton maturity groups were not always detected, but early-maturing Bt cottons were among the higher yielding experimental plots for both years. Depending on the insecticide treatment, average harvested fruit ranged from 0.3 to 7.1 open bolls per plant for non-Bt cotton plots, while Bt cotton plots ranged from 1.8 to 7.5 open bolls per plant during the two-year study. Bt cottons generally protected fruit from insect damage and resulted in final yields comparable to those of insecticide sprayed Bt and non-Bt cottons. Unsprayed non-Bt cottons were significantly damaged by insects in these high-infestation environments.

1. Introduction

Cotton engineered to express insecticidal toxins from Bacillus thuringiensis (Bt) is arguably one of the greatest technical advancements in cotton insect control in United States history, perhaps comparable to the eradication of the boll weevil (Anthonomus grandis (Boheman)) [1]. In a previous review of Bt cotton refuge requirements, it was estimated that domestic benefits from Bt cotton adoption in the U.S. was approximately 150 to 250 million USD [2]. These benefits were linked to increased yields and reductions in the usage of synthetic insecticides. While Bt cotton provides high-levels of control of tobacco budworm (Heliothis virescens (F.)) and pink bollworm (Pectinophora gossypiella (Saunders)), which dramatically reduced the impact of these key pests., susceptibility among the different insect species attacking cotton varies even to multiple-trait Bt cotton that expresses more than one Bt toxin [3,4,5]. It has provided economic control of bollworm (Helicoverpa zea Boddie) and suppression of various Spodoptera spp., but it has not eliminated problems from these lepidopteran pests. Bt cotton in some areas of the U.S., especially the Midsouth and Southeast, is routinely over-sprayed with insecticides (including the diamide and pyrethroid groups) to control bollworm [6].
Supplemental oversprays and, more importantly, the need for additional insecticidal control of non-lepidopteran pests limit the potential ecological and environmental advantages of Bt cotton. Edge and Benedict [7] assessed the global economic, environmental, and social benefits of Bt cotton after the first five years of commercial use and reported that in addition to significant direct economic benefits to growers, Bt cotton was an effective method of controlling lepidopteran pests that was safer to humans and the environment than insecticides. While current insecticide oversprays to Bt cotton are economically beneficial and necessary under some pest infestation levels [6,8,9], progress has been made in reducing insecticide use in Bt cotton systems [10]. Many researchers have recognized the potential for positive synergy between preservation of natural biological control and the selective activity of Bt cotton in systems with reduced use of broad-spectrum insecticides [10,11,12,13,14]. The primary obstacle to realizing this synergy is the continued need and use of broad-spectrum insecticides that hamper natural controls for lepidopteran pests [15,16].
While oversprays of Bt cotton have shown enhanced control of high densities of bollworm attacking cotton in North Carolina [8,17,18,19] and probably other states [6], most of these citable experiments involve oversprays of insecticide that reduce natural control from predators and parasitoids. This is useful information in demonstrating the insecticidal activity of Bt cotton, but it may understate overall effectiveness of Bt cotton in a system with abundant natural enemies and inadvertently advocate for additional insecticide use. Oversprays of Bt cotton for bollworm control also elevate the overall costs of insect control. In the Midsouthern United States in 2016 [20], where almost all cotton was planted to Bt varieties, entomologists in the states of Arkansas, Louisiana, Mississippi, Missouri and Tennessee estimated that growers carried out 6.2, 5.7, 7.0, 7.3, and 5.4 applications of insecticide on cotton, respectively, for all insect pests. Most of these applications (3 to 4) were directed at Lygus lineolaris (Palisot de Beauvois), which was likely the most critical pest that encourages insecticide use in cotton. The estimated number of applications for bollworm ranged from 0.5 applications in Missouri to 1.1 applications in Louisiana, which were similar to previous studies [6]. Costs of transgenic seed averaged across all cotton acreage, ranged from $19.69 per hectare in Arkansas, where a sizable portion of growers planted non-Bt varieties, to $66.52 per hectare in Mississippi, where all cotton was estimated to be Bt cotton.
Luttrell and Jackson [6] reviewed the status of H. zea as a pest of Bt cotton in the U.S. and concluded that historical variability in H. zea response to Bt toxins, erratic field control since the early testing of Bt cottons, and dramatic increases in corn acreages across the southern U.S. have contributed to the perceived need to spray Bt cotton. Jackson et al. [8] discussed the need to overspray Bt cotton with insecticides in North Carolina (USA) where large populations of H. zea produced on corn induced high infestations to cotton late in the season. In these studies, statistically similar numbers of fourth and fifth instar larvae were found on Bt cotton expressing a single Cry1Ac gene (Bollgard®, Monsanto Company, St. Louis, MO, USA) and conventional non-Bt cotton. The single trait Bt cotton had fewer damaged bolls and estimated next generation moths than the conventional cotton. Dual trait Bt cotton expressing both Cry1Ac and Cry2Ab2 genes (Bollgard II®, Monsanto Company, St. Louis, MO, USA) had fewer fourth and fifth instar larvae, damaged bolls and next generation moths than both the single trait Bt cotton and the conventional cotton. Given these examples of the North Carolina growing system, and the need for ad hoc control of other non-lepidopteran pests with insecticides, some of which are effective against H. zea, oversprays of Bt cotton are justified at the production level. However, this practice may not properly value long-term ecological costs and can potentially create a management environment of unnecessary crop protection. Little et al. [21] discussed this tendency for unwarranted crop protection in their recent studies designed to measure relative benefits of oversprays of microbial and chemical insecticides on Bt cotton.
Little et al. [21] also found no statistically significant benefit for supplemental control of bollworm in Bt cotton at the densities encountered during the study in the Mississippi Delta, but there was a numerical increase in yield for treated Bt cotton. The presence of this non-significant numerical advantage for oversprays to Bt cotton creates a dilemma for crop managers and a possible management environment where uncertainly encourages excessive use of unnecessary applications. Entomological research has failed to resolve this question. In environments like those described by Jackson et al. [8], oversprays of Bt cotton are clearly needed. However, the densities observed in these production systems are much higher than those typically encountered in the Midsouth. More empirical data are needed in actual production environments to determine the frequency of true benefit from oversprays applied against bollworm.
Reported here are experiments conducted in large-field cages where Bt and non-Bt cottons were exposed to high densities of laboratory-reared H. zea and H. virescens. The objective of the study was to determine the temporal associations between fruit protection and final yield in insecticide-treated and untreated Bt and non-Bt cotton varieties using detailed observations of fruit survival within season and at harvest.

2. Materials and Methods

Small plots of seven different cotton varieties were established in three large field-cages (0.04 ha each) at the Jamie Whitten Delta States Research Center in Stoneville, MS, USA to study the effects of high densities of tobacco budworm and bollworm larvae on insecticide-treated and untreated Bt and non-Bt cottons. The experiment was conducted as a 3 × 7 factorial in 2011 (three insecticide treatments × seven varieties) (planted 3 May 2011) and as a 5 × 7 factorial in 2012 (five insecticide treatments × seven varieties) (planted 9 May 2012).
Each cage included three five-row sections of cotton with two unplanted blank rows between the three five-row sections. Each five-row section was 30 m long and row spacing was 76.2 cm. Seven individual plots (~4.3 m long) representing each of seven different cotton varieties were planted with a tractor mounted planter in each of the five-row sections of each cage. After emergence, plants were hand thinned within a row to a desired density of seven to nine plants per m. A total of 21 individual plots were established within each of the three cages. The three five-row sections of each cage, each containing seven different plots (varieties), were randomly assigned to one of three different insecticide treatments (untreated, lambda-cyhalothin (Karate Z®, Syngenta Crop Protection™, Greensboro, NC, USA), and chlorantraniliprole (Coragen®, DuPont™, Wilmington, DE, USA)) in 2011. In 2012, two of the three five-row sections were split with two rows receiving a single application of either Karate Z or chlorantraniliprole (Prevathon®, DuPont™, Wilmington, DE, USA) (Karate-1, Prevathon-1) and two rows receiving an additional application of either Karate Z or Prevathon (Karate-2, Prevathon-2). The center row was treated once when the first applications were made. The third five-row section was untreated. The insecticides and rates used both years were lambda-cyhalothin (Karate Z 2.08 CS) at 44.8 g of active ingredient per ha and chlorantraniliprole (Coragen 1.67 SC in 2011 and Prevathon 0.43 SC in 2012) at 101 g of active ingredient per ha.
The cotton varieties planted in the cages included four early-maturing varieties (ARK48 (University of Arkansas, Fayetteville, AR, USA), DP121, DP0912and PHY375 (Delta and Pine Land Company, Scott, MS, USA)) and three full-season cotton varieties (MD25 (USDA-ARS, Beltsville, MD, USA), DP174, and DP1048 (Delta and Pine Land Company, Scott, MS, USA) (Table 1). DP0912 and DP1048 express Bollgard II traits from Monsanto Company (St. Louis, MO, USA; Bt toxins Cry1Ac and Cry2Ab2). PHY375 expresses WideStrike® traits from Dow Chemical Company (Midland, MI, USA; Bt toxins Cry1Ac and Cry1F). ARK48 is an early-maturing non-Bt variety developed by Fred Bourland at the University of Arkansas [22]. MD25 is a full-season cotton developed by Bill Meredith and colleagues at the USDA ARS in Stoneville, MS [23]. Table 1 provides a summary of the attributes and abbreviations for the varieties used in the study.
Cages were infested with bollworm and tobacco budworm moths from laboratory colonies maintained at the USDA ARS Southern Insect Management Research Unit in Stoneville, MS. Both colonies have been reared continuously since the early 1980s. Procedures for rearing the insects followed published protocols [24]. Pupae were obtained from large rearing trays, visually sexed to confirm a ~50:50 male to female ratio, grouped into samples of ~50 pupae in 3.78 L cardboard cartons and held under stable environmental conditions (28 °C, 14:10 light:dark, relative humidity ~80%) until pupal eclosion. Near the time of expected adult emergence, pupae were observed daily, and cages were prepared for release of the insects. When significant emergence of moths began (5–10% emergence from puparia), the cardboard cartons holding ~50 pupae and emerged moths were taken to the center of each cage and placed on concrete blocks late in the afternoon. The number of moths released varied from 400 bollworm and 400 tobacco budworm moths to 200 bollworm and 200 tobacco budworm moths per cage. The cages were observed daily to confirm the presence of the moths. Visual observations confirmed that large numbers of moths were present within each cage on all release dates across both years of the study. Efforts were not made to count the number of moths, but they were very common and visually apparent on plants and on the sides of the cages.
Observations within the growing season included random examinations of plants within the cages to detect heliothine eggs and larvae and damage to cotton fruiting structures. At three times during each year, five consecutive plants from random outside rows in each plot were cut at the soil surface and removed from the cage. All 1st position fruiting sites were examined from node zero (cotyledon) to top of the plant to record number of nodes, retention of fruit on each defined position and presence of insects. On other dates, samples of 10 or more plants were examined by visual searches of the top five nodes, where fruit retentions and the presence of heliothine eggs and larvae were recorded.
At harvest, one-meter sections of interior rows undisturbed by within-season monitoring were removed from the cages by cutting plants at the soil surface. The samples were bundled, labeled, and transported to a vacant greenhouse where they were later processed to record the amount of seed cotton at each fruiting site on each plant. This process was referred to as “box mapping” following previously published procedures [25,26]. Data were organized by mainstem and branch nodes as described by Jenkins and McCarty [26]. Fruit and seed cotton from vegetative branches were pooled and distributed over the other positions. For purposes of comparing time (date of fruit initiation), we assumed that new mainstem nodes were produced in three days and that branch nodes (fruiting sites) were produced every six days.
In August of 2012, a bioassay experiment was conducted to measure survival of H. zea and H. virescens larvae from the same laboratory colonies used to infest the cages. Excised plant tissues (upper leaves) were collected from the untreated plots of each variety (Table 1) in each cage. Upper terminal leaves (first fully expanded leaf from the top of the plant) were cut from plants, placed in 0.9 L plastic bags, and brought back to the laboratory and fed to neonate larvae. Fresh plant tissue was placed in 37 mL plastic cups, inoculated with a single neonate and capped with a plastic lid. Trays containing the inoculated cups were kept in an environmental chamber (Percival Scientific, Perry, IA, USA) on a 14:10 light:dark cycle at 28 °C. Fresh excised tissue was collected approximately every other day and added to or used to replace dried leaves as necessary. The instar of each surviving larva was recorded daily for seven days. Surviving larvae were placed on artificial wheat germ diet [24] after 7 days of exposure to the different cotton lines and subsequently observed weekly for additional mortality and pupation.

Data Analysis

All within-season and end-of-season harvest data were studied by AOV using a 3 × 7 factorial design (three insecticide treatments × seven varieties) in 2011 and a 5 × 7 factorial design (five insecticide treatments × seven varieties) in 2012. Means were separated using Tukey’s HSD test in JMP 11.1.1. (SAS Institute Inc. 2013, Cary, NC, USA) Patterns of 1st position fruit retention versus mainstem node and end-of-year cumulative cotton production versus date of fruit initiation were developed as graphs using Sigma Plot 12.3 (Systat Software, San Jose, CA, USA). For the bioassay experiment, mortality of larvae at 7 days and survival of larvae to pupation were studied for cotton line effects by AOV. Differences among cotton lines were grouped by LSD at p = 0.05 (Figure 6).

3. Results

3.1. Insect Densities

During 2011, no differences were detected in number of heliothine eggs oviposited among the different varieties on two different egg sampling dates during 2011 (Table 2). Two days after the first release of moths (18 July 2011) and immediately before the first application of insecticides (20 July 2011), densities averaged 11.3 ± 0.377 (SEM) eggs per plant. Insecticidal treatment of larvae is recommended at four larvae per 100 plants [27]. The potential infestation was more than 250-fold that of critical treatment densities. Five days later, immediately before the second release of moths (25 July 2011) and three days prior to the second application of insecticides (28 July 2011), the number of eggs averaged 0.72 ± 1.38 (SEM) per plant (Table 2). Accurate assessments of the number of larvae were not attempted because of the uniform and relatively high densities of small neonate larvae (i.e., almost all plants had at least one larva in the top five nodes regardless of the variety). Larval assessments were made on 15 August 2011, about two weeks after both foliar insecticide treatments, and a few differences among treatments were detected. Most treatments had no larvae, but larvae were observed on three untreated varieties and five variety/insecticide treatment combinations (Table 2). Surviving larvae from the insecticide treatments may have been progeny from later oviposition by residual moths in the cage, or given the small size of plots, movement of larvae from other plots was possible [28].
During 2012, densities of eggs/plant on 23 July 2012, five days after the first release of moths (18 July 2012) and one day before the first application of insecticides (24 July 2012), were 13–23-fold greater than that of treatment threshold densities for larvae (4/100 plants; Table 3 and Table 4). Mean densities on the full season BG 2 cotton (MBG2) variety were greater than those on early-season non-Bt (BCONV) cotton. Densities of larvae in the top five nodes did not vary among varieties but were 0.5 to 2.5-fold that of threshold density levels (Table 4). On 6 August, 13 days after the first application of insecticide and four days after the second release of moths (2 August 2012), significant differences in the number of eggs or larvae/plant were not detected (Table 3), and mean densities ranged from 0.03 to 0.17/plant while densities of larvae ranged from 0.13 to 0.37/plant. On 13 August 2012 (six days after the second application of insecticides (7 August 2012)), only a few insects were found, and densities were not significantly different from zero (Table 3).

3.2. Within-Season Retention of 1st Postion Fruit

Temporal patterns of 1st position fruit retention are shown for 2011 and 2012 studies in Figure 1 and Figure 2, respectively. Associated number of nodes and fruit per plant are summarized in Table 5, Table 6, Table 7 and Table 8. These different patterns of seasonal fruit retention illustrate the protection of different aged fruit from insects at different times of the season.
Visual differences in the pattern of fruit retention on early-maturing varieties (BBG2, BCONV, BVAR, and BWS) were evident, but not as drastic as those for the full-season cottons (MBG2, MCONV, and MVAR). The survival of 1st position fruit to harvest in 2011 was drastically reduced on untreated plots of the two full season non-Bt cotton varieties MCONV and MVAR (Figure 1). When both of these varieties were sprayed with insecticides, retention of 1st position fruit was comparable to that of the other varieties. Untreated Bt cotton varieties (BBG2, BWS, and MBG2) in 2011 generally had fruit survival levels comparable to that of insecticide sprayed Bt and non-Bt cotton (Figure 1). BBG2, an early-maturing Bt cotton, retained almost all of the fruit present on the second (25 July 2011) and third (8 August 2011) within-season observation dates. Only a portion of the early fruit observed on nodes 10–15 on 13 July 2011 was lost before harvest. Fruit lost before harvest on the two other Bt cottons (BWS and MBG2) were fruit present on plants on the second and third within-season observation dates. Insecticide treatments to the full-season non-Bt cottons (MCONV and MVAR) reduced the loss of a significant portion of more early-season fruit recorded on the plants at the first within-season observation (Figure 1).
Similar differences were observed in 2012 (Figure 2), although the overall survival rate of 1st position fruit to harvest was much less than that of 2011 on all varieties and all five insecticide treatment options (Figure 2). Insecticide treatments applied to the full-season non-Bt cottons (MCONV and MVAR) again illustrated the importance of insecticide sprays to non-Bt cottons under the high insect infestations in these cage experiments. Significant numbers of 1st position fruit on the plants in all varieties on 17 July 2012 and 3 August 2012 were lost, suggesting a common environmental or pest impact across the entire experiment.
During 2011, significant differences (p < 0.0001) in the uppermost fruiting nodes per plant were found among plants treated with different insecticides on 13 July 2011, but no differences were observed among the various interactions of insecticide and variety (Table 5). Differences were observed for varieties on the first within-season sample date (13 July 2011, p = 0.0318) with plants from the early-maturing non-Bt variety (BVAR) having higher fruiting nodes than the full-season Bt cotton, MBG2. On the first sample date, average uppermost fruiting nodes per plant was also greatest for Coragen-treated cotton (average of 16.6 nodes per plant) and least for untreated cotton (14.5 nodes per plant) plots. This was different on the second observation date when Coragen-treated cotton (average of 19.1 nodes per plant) had lower fruiting nodes than the untreated and Karate-treated cotton (20.6 and 21.1 nodes per plant, respectively). No effects of variety, insecticide, or the interaction between varieties and insecticides were evident on 1 August. At harvest, significant effects (p < 0.001) were observed for both variety and insecticide and for the interaction between variety and insecticide. It should be noted that this reflects only open bolls at harvest; information on the number of green (unopen) bolls at harvest was not included in the analysis as these fruit did not contribute to final yield. The early-maturing non-Bt (BVAR) cotton treated with Karate, the untreated full-season non-Bt varieties (MCONV and MVAR) had fewer nodes with open bolls than most other treatments. Untreated BVAR and untreated MBG2 cotton was intermediate in the number of nodes with open bolls at harvest (Table 5).
There was a significant effect of variety on the number of fruit per plant at the first observation date in 2011 (Table 6). BBG2, the early-season Bt cotton, had more fruit than BCONV, the early-season non-Bt cotton. All other varieties had fruit loads intermediate between the two. At the second within-season observation date (25 July 2011), there was a significant (p = 0.0047) effect of insecticide treatment with Coragen-treated plants having fewer fruit per plant than the Karate-treated and untreated plants. This is unexplained and perhaps indicative of the inherent variation among plots in the study. It could possibly also be an unknown factor associated with the Coragen treatment. By 1 August, there were significant interactions among varieties and insecticide in the number of fruit remaining on the plants. More fruit was observed on BBG2 plots treated with Coragen, untreated BCONV plots, and Karate treated BWS plots than BWS untreated and MCONV plots treated with Karate (Table 6). All other plots had similar mean numbers of fruit. It should be noted that total fruit includes fruit of all ages and plants with significant insect damage could be compensating for damage by adding additional fruit and plants with less damage could be maturing larger, more mature fruit. At harvest, significant effects of both variety (p < 0.0001) and insecticide (p < 0.0001) were observed for the mean number of surviving fruit. The insecticide-treated plots had more fruit than the untreated plots. BBG2 and BWS, the two early-maturing Bt cottons, had more fruit per plant than the early-maturing non-Bt cotton (BCONV and BVAR, and full season Bollgard II (MBG2)) plots (Table 6).
In 2012, significant effects of insecticide treatment were observed for the highest fruiting nodes per plant on all four sample dates (Table 7). No significant interactions between variety and insecticide treatment were observed, but significant effects of variety were observed on the last within-season observation date (15 August 2012) and at harvest (20 October 2012). Prevathon treated cotton had higher fruiting nodes per plant than Karate treated cotton on the first and second within-season sample dates. By 1 August 2012, all insecticide-treated cotton had higher nodes with fruit than the untreated cottons. At harvest, plots treated twice with Prevathon or Karate had more nodes with open bolls than untreated plots. Those treated with one application of Prevathon or Karate had intermediate numbers of nodes with open bolls which was between those of the twice treated plots and the untreated plots (Table 7).
During 2012, significant effects of insecticide were detected in the number of 1st position fruit on plants on 17 July 2012, 15 August 2012and at harvest on 20 October 2012 (Table 8). Significant effects of variety were measured at harvest but not on within-season sample dates. Interactions between variety and insecticide were not detected in mean number of fruit per plant in the 2012 study. Prevathon-treated cotton, both one and two applications of Prevathon had more fruit per plant on 15 August than untreated cotton. Karate-treated cotton had fruit loads no different from those of Prevathon-treated cotton or the untreated plots. At harvest, more 1st position fruits were measured on the early-season Bt cottons, BBG2 and BWS, than on all other cottons (Table 8).

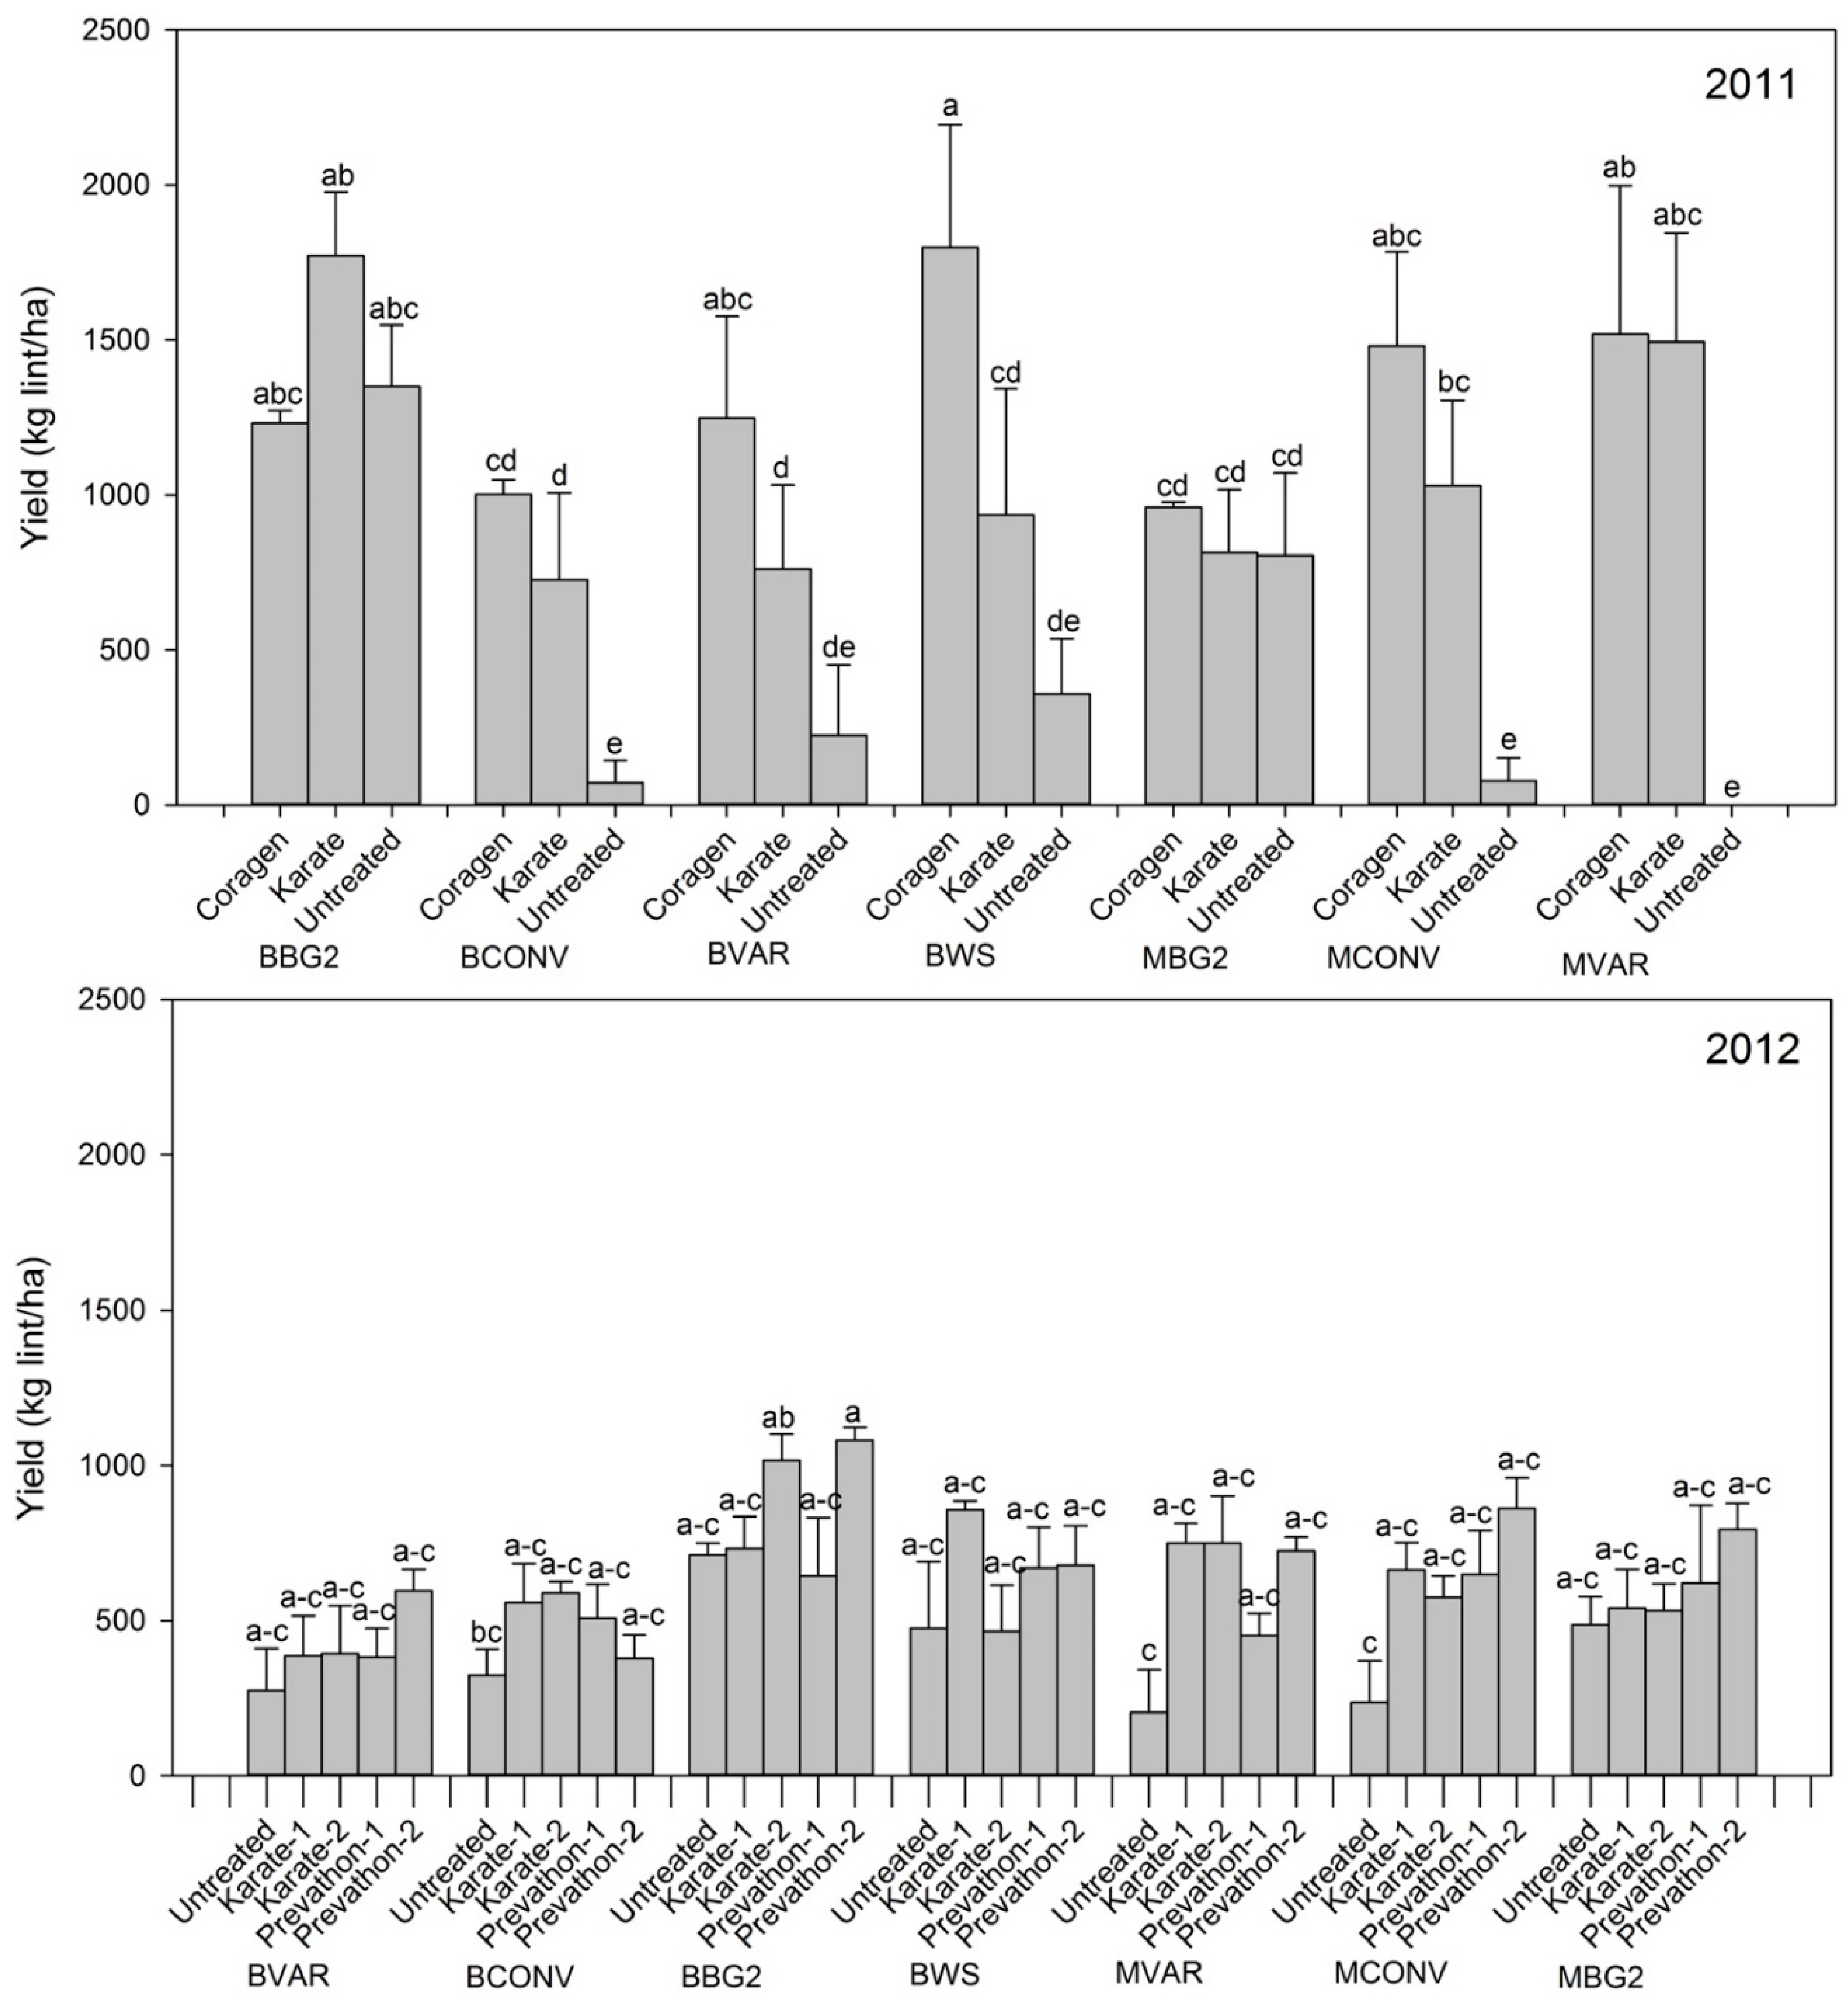
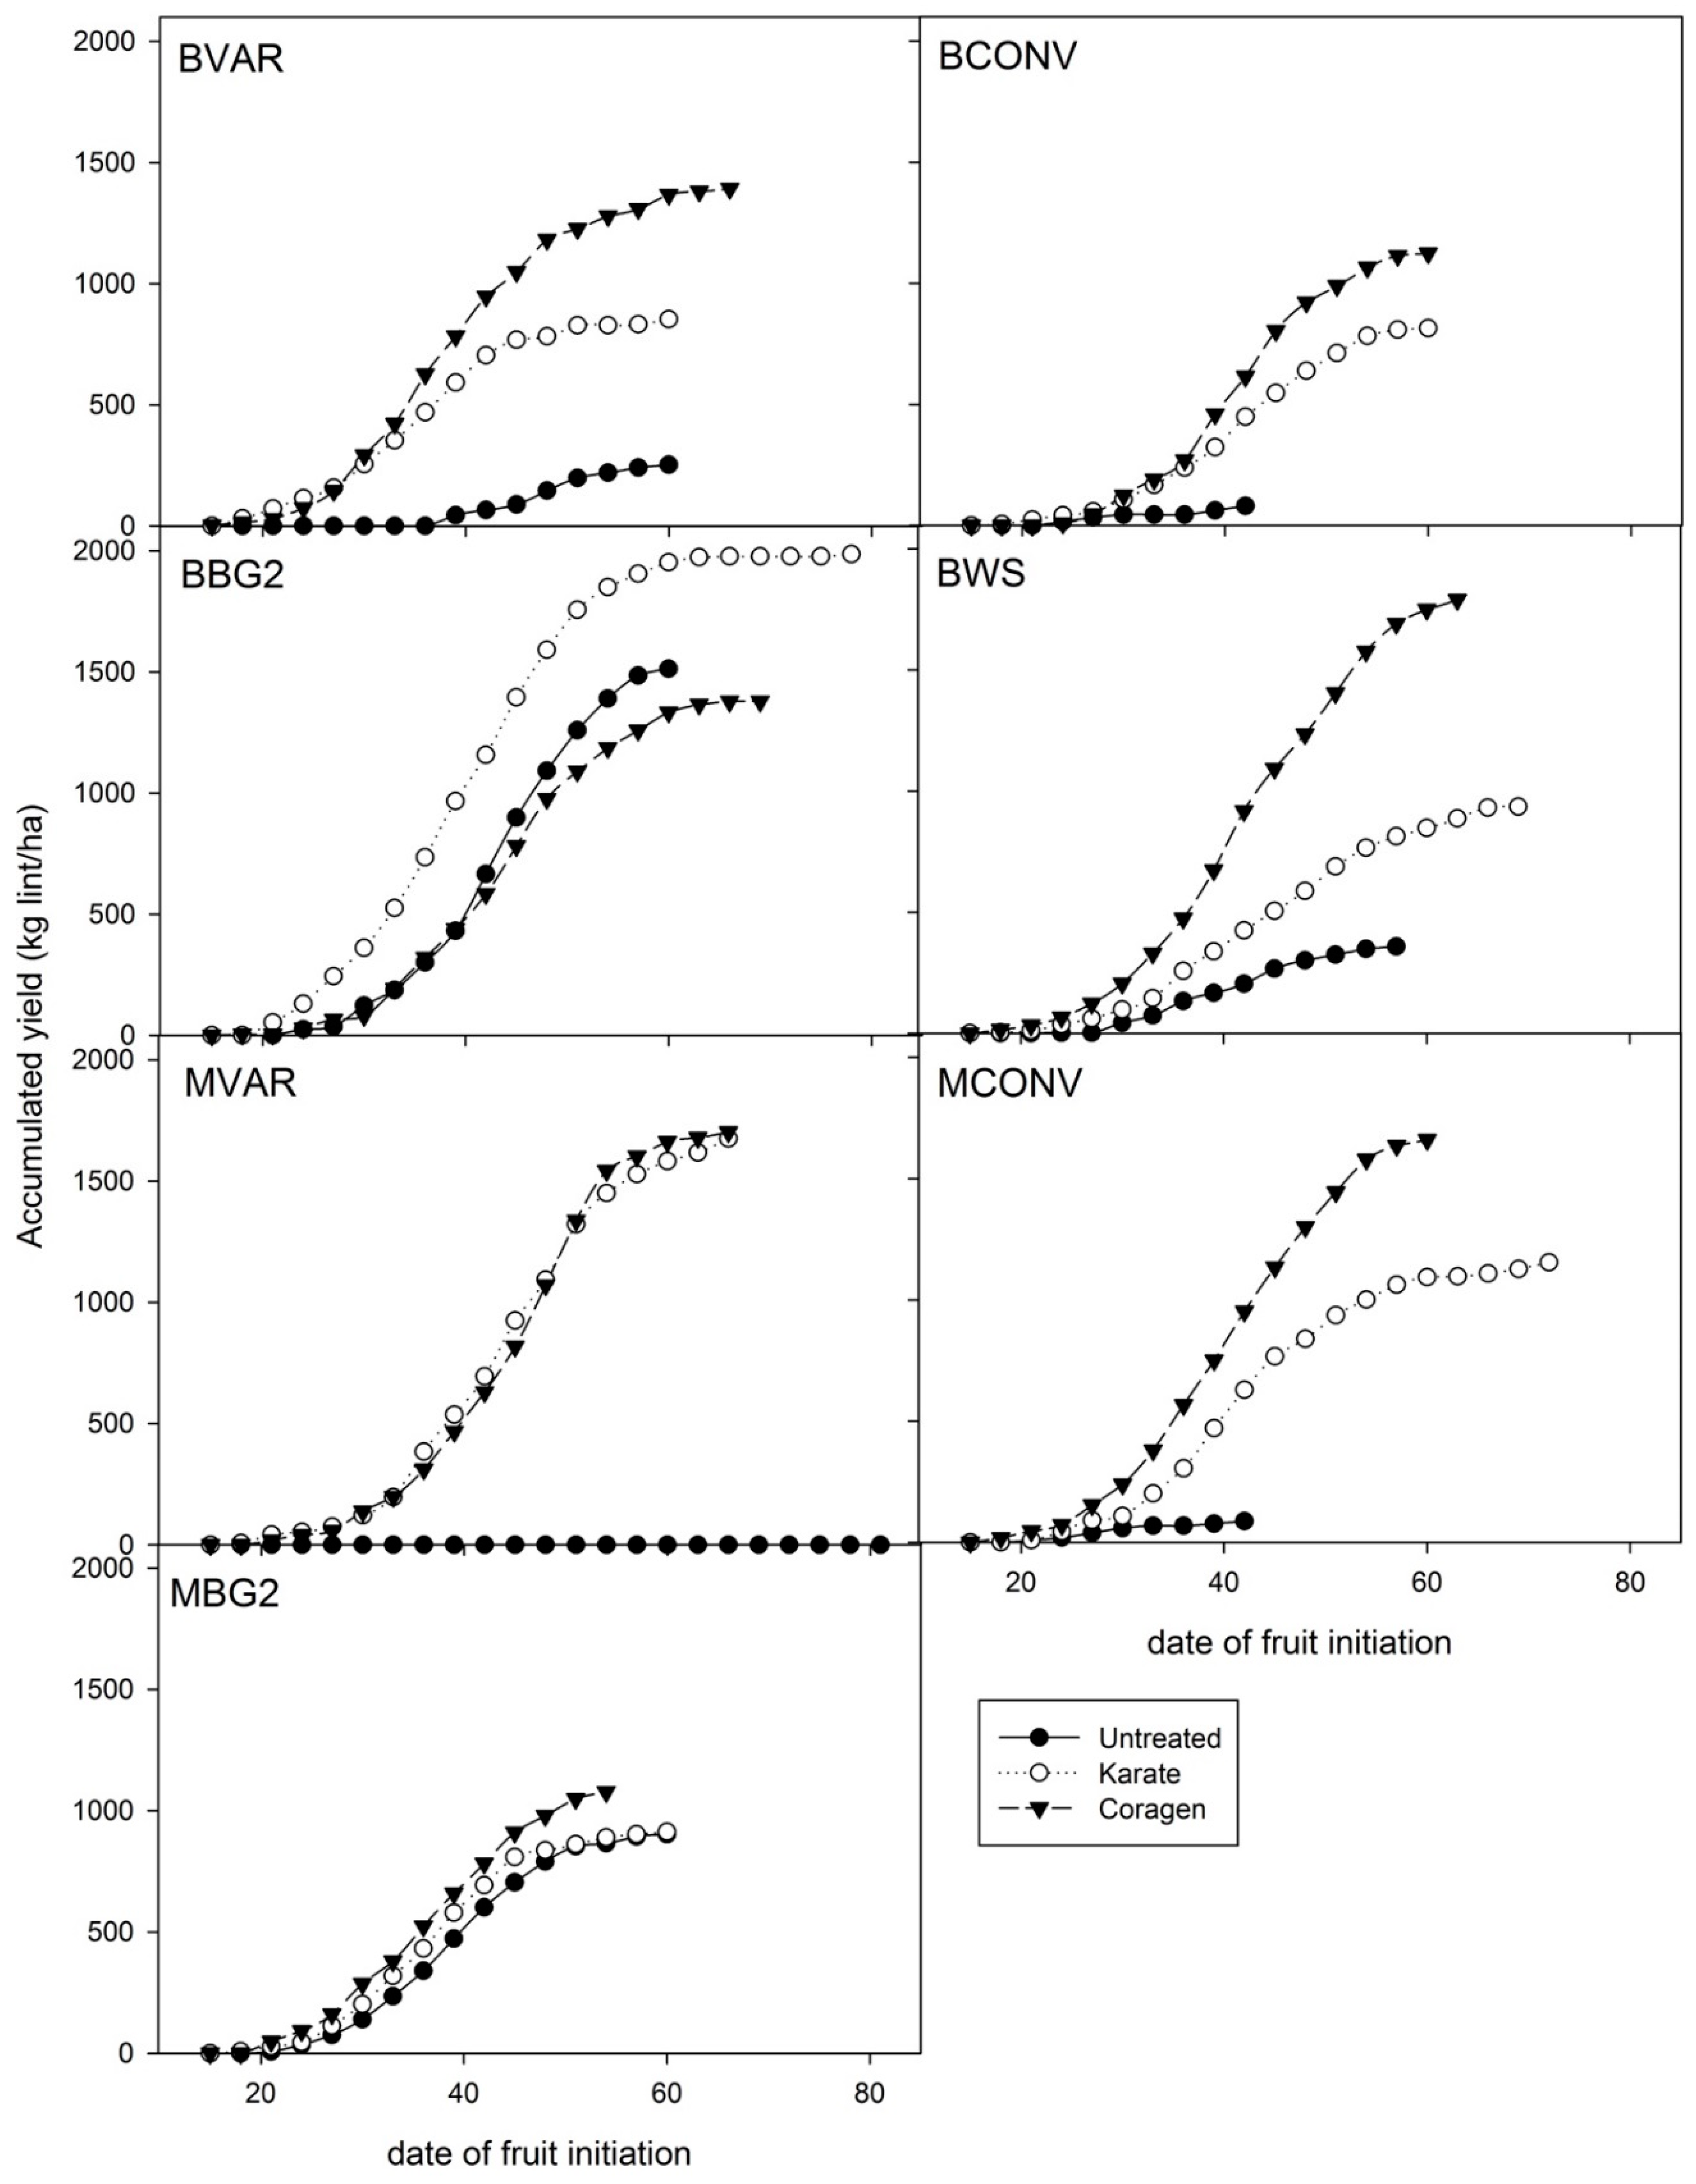
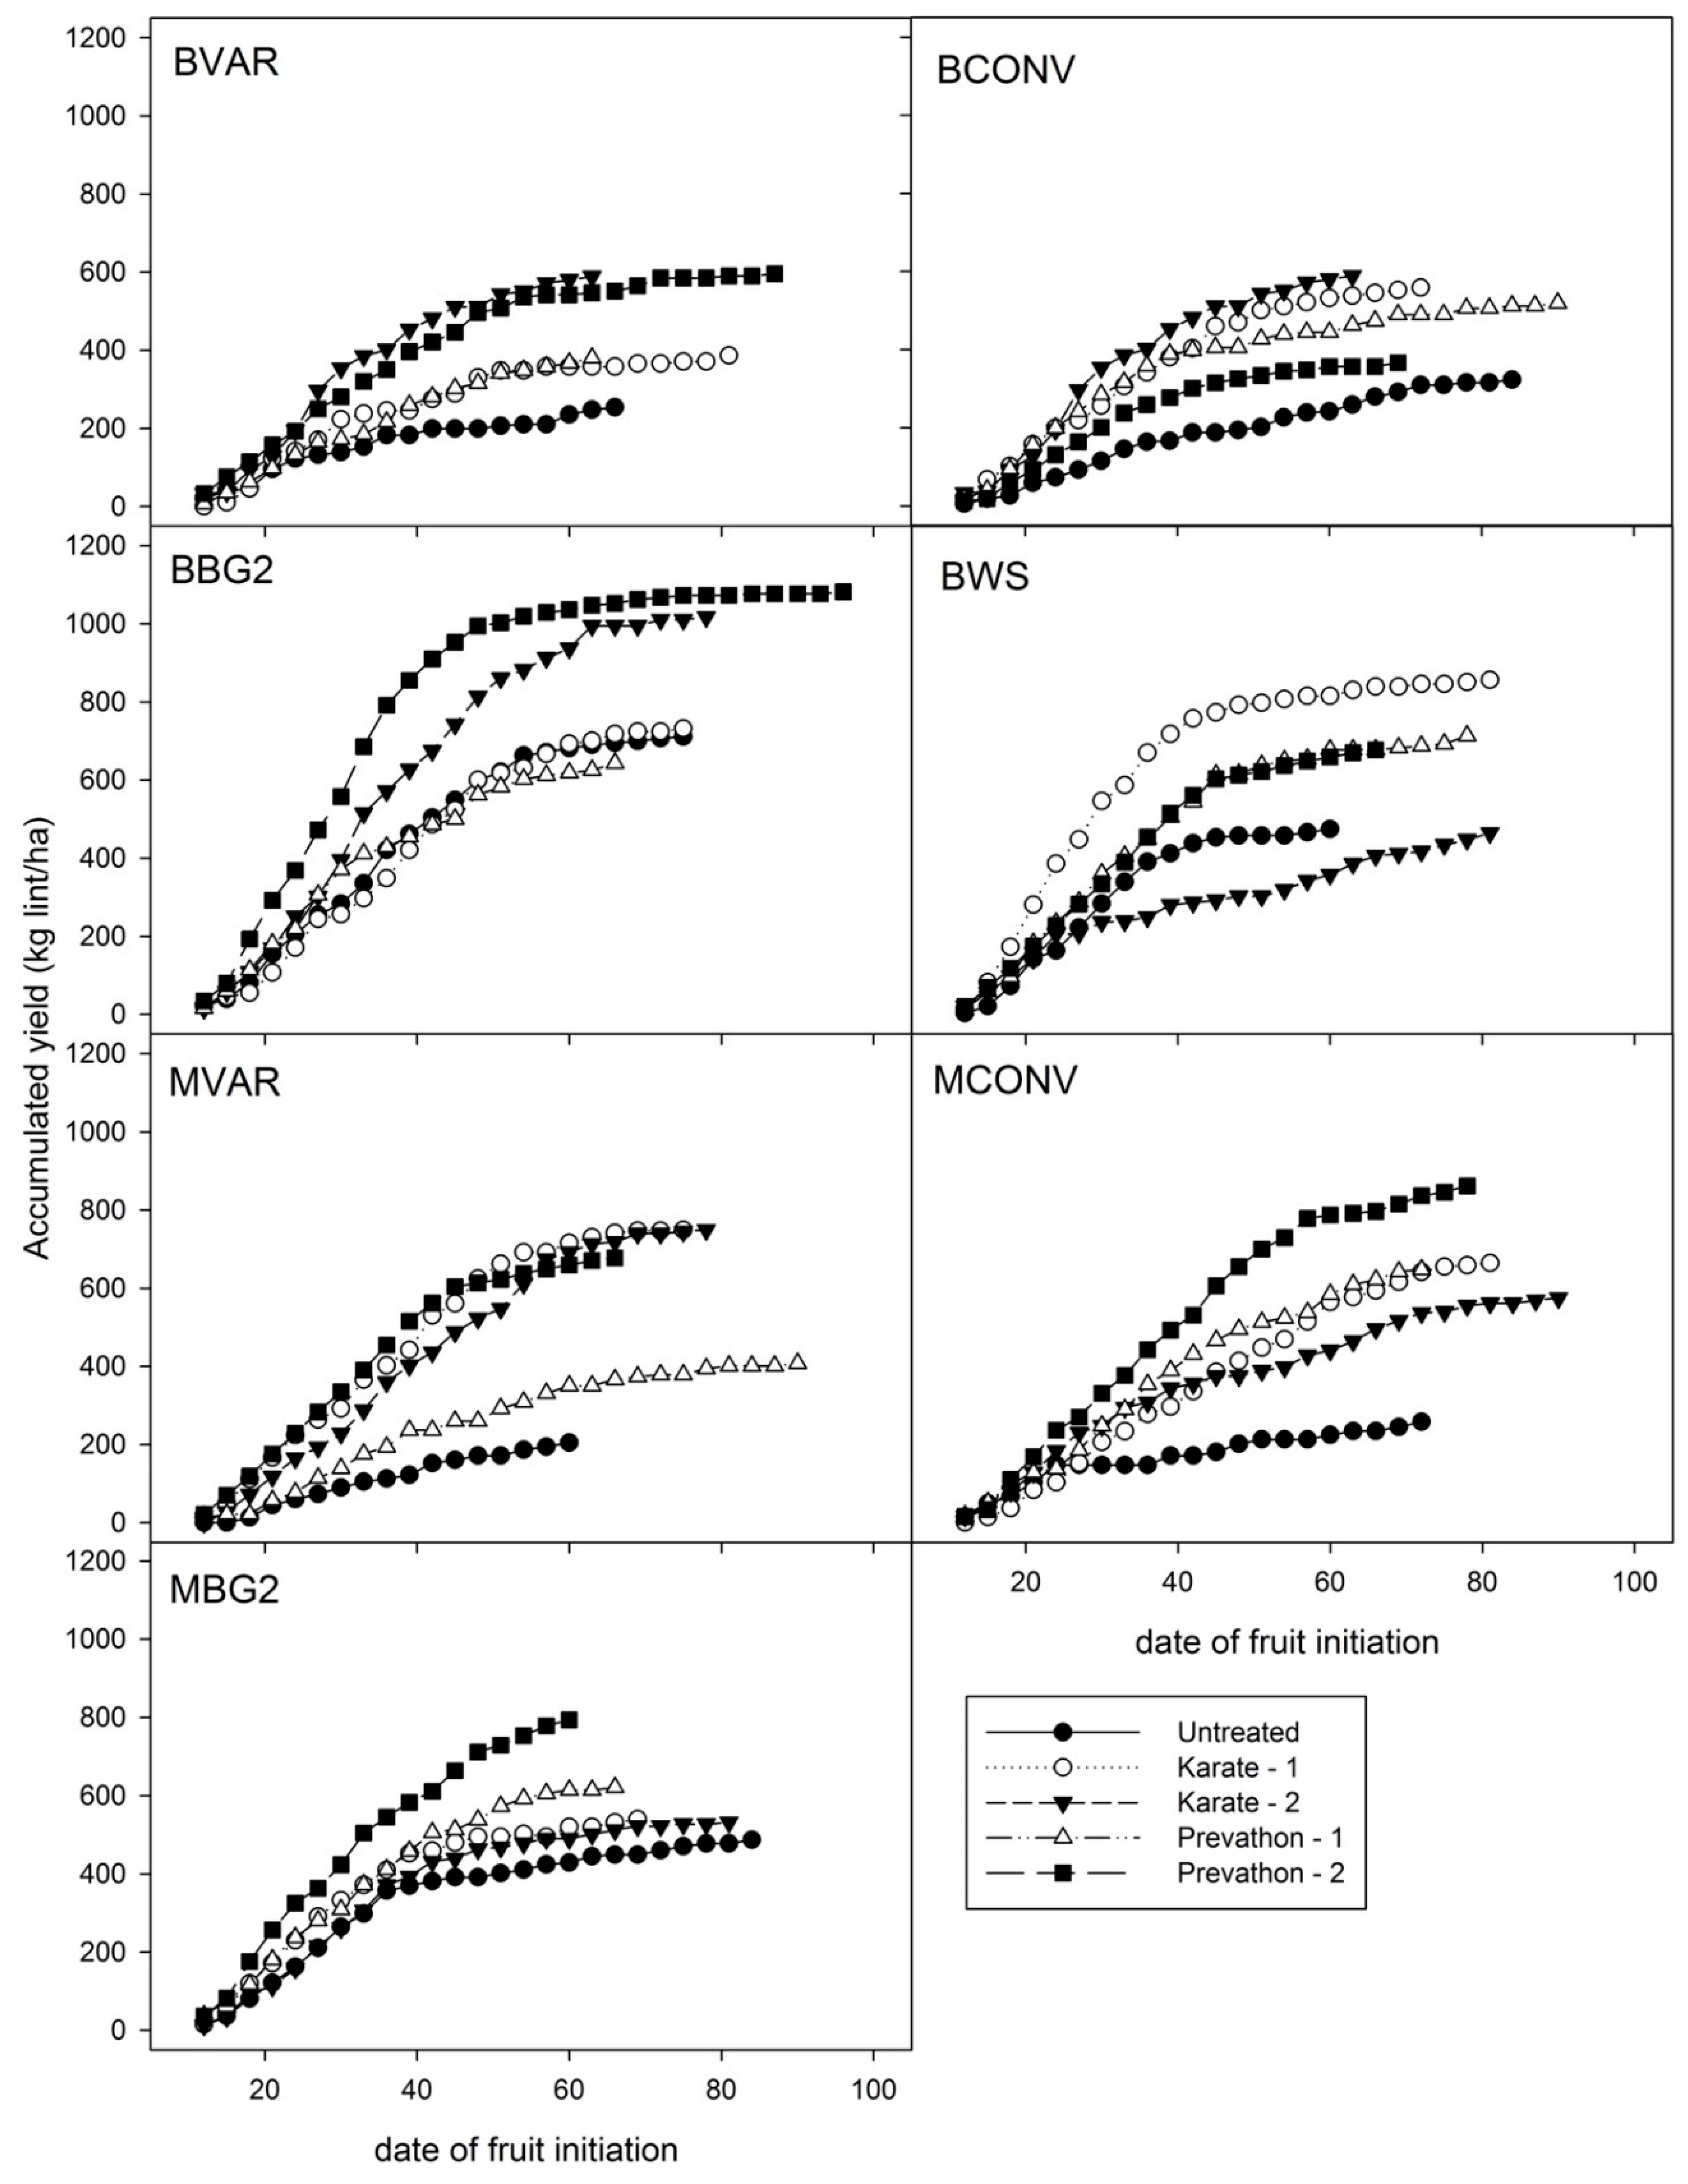
3.3. Overall Yield Response

Total final yield expressed as kg of lint/ha (Figure 3) was estimated based on the combined sample of hand-harvested fruit from all fruiting position on all plants in each experimental plot. Lint weight was estimated assuming a 40% turnout (i.e., 40% of seed cotton weight is assumed to be lint). Significant effects of variety (df = 6, F = 2.9704, p = 0.0165) and insecticide (df = 2, F = 19.7673, p < 0.0001) were detected on total final yield in 2011. The interaction between variety and insecticide (df = 12, F = 1.9264, p = 0.0586) was marginally significant and differences among treatments are shown in Figure 3. The highest average yield was BWS cotton sprayed with Coragen (2016 kg lint/ha). Interestingly, BWS sprayed with Karate or untreated had reduced yield under the conditions of the 2011 experiment (Figure 3). Yields of all early-maturing cottons (BVAR, BCONV, BBG2, BWS) did not differ when sprayed with Coragen. Yield of BBG2 cotton did not vary with insecticide treatment. Untreated BBG2 cotton yield was not significantly different from that of BBG2 sprayed with Karate or Coragen, and it was not different from the highest yield observed (BWS-Coragen). The full-season, late-maturing cottons (MVAR, MCONV, MBG2) tended to have lower yields than the early-maturing cottons with the exception of MVAR-Coragen (Figure 3). Yields of MBG2, a late-season Bt cotton, did not differ between insecticide treatments. As with BBG2, yields of the untreated cotton were statistically equal to that of plots treated with Karate or Coragen. Yields of untreated non-Bt cottons (BVAR, BCONV, MVAR, and MCONV) were dramatically reduced and not significantly different from MVAR-untreated which produced no cotton (Figure 3).
In 2012, total final yield was significantly influenced by variety (df = 6, F = 5.2665, p = 0.0002) and insecticide treatment (df = 4, F = 6.4879, p = 0.0002). The interaction between variety and insecticide was not significant (df = 24, F = 0.09956, p = 0.4825). There was no significant difference in total yield of Bt cotton varieties. The early-season Bt varieties (BBG2 and BWS) had higher yields than three of the non-Bt cotton varieties (BVAR, BCONV, and MVAR). Yield of the non-Bt MCONV and the late-season Bt (MBG2) was intermediate between that of the early-season Bt and non-Bt cottons (Figure 3). Plots treated with insecticide yielded more than those not treated with insecticide. Differences between one or two applications of insecticide were not detected.

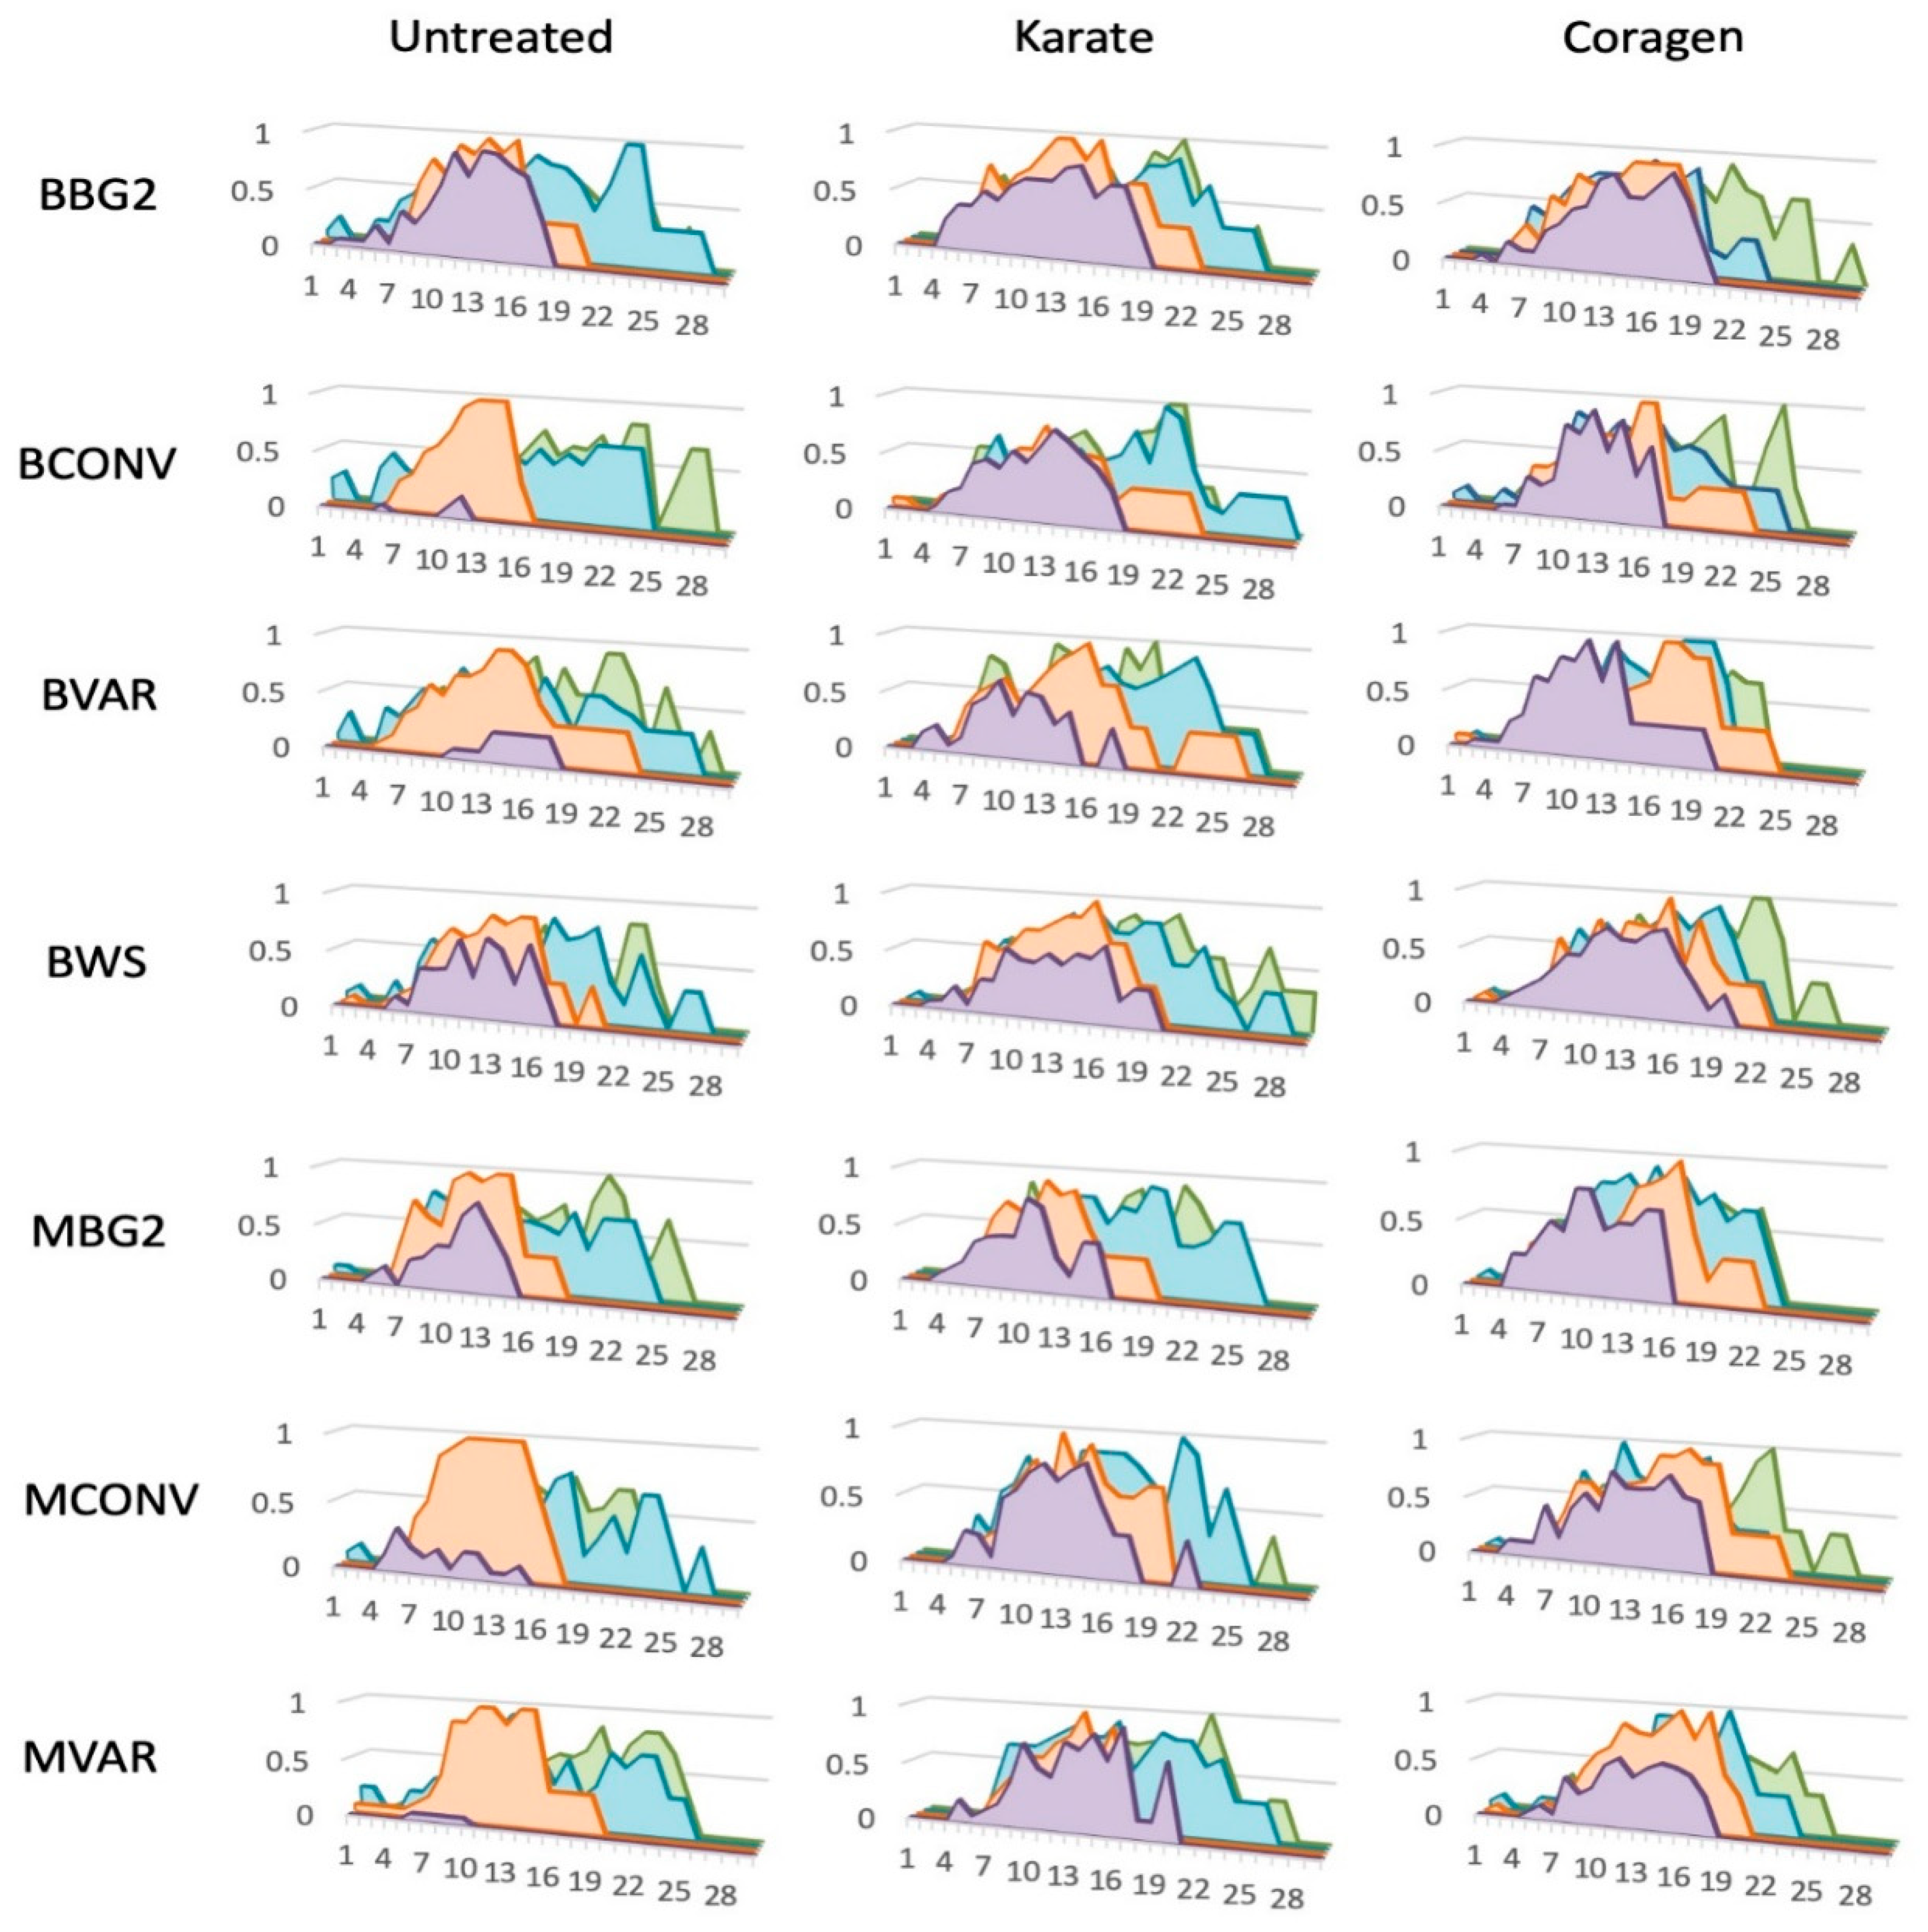
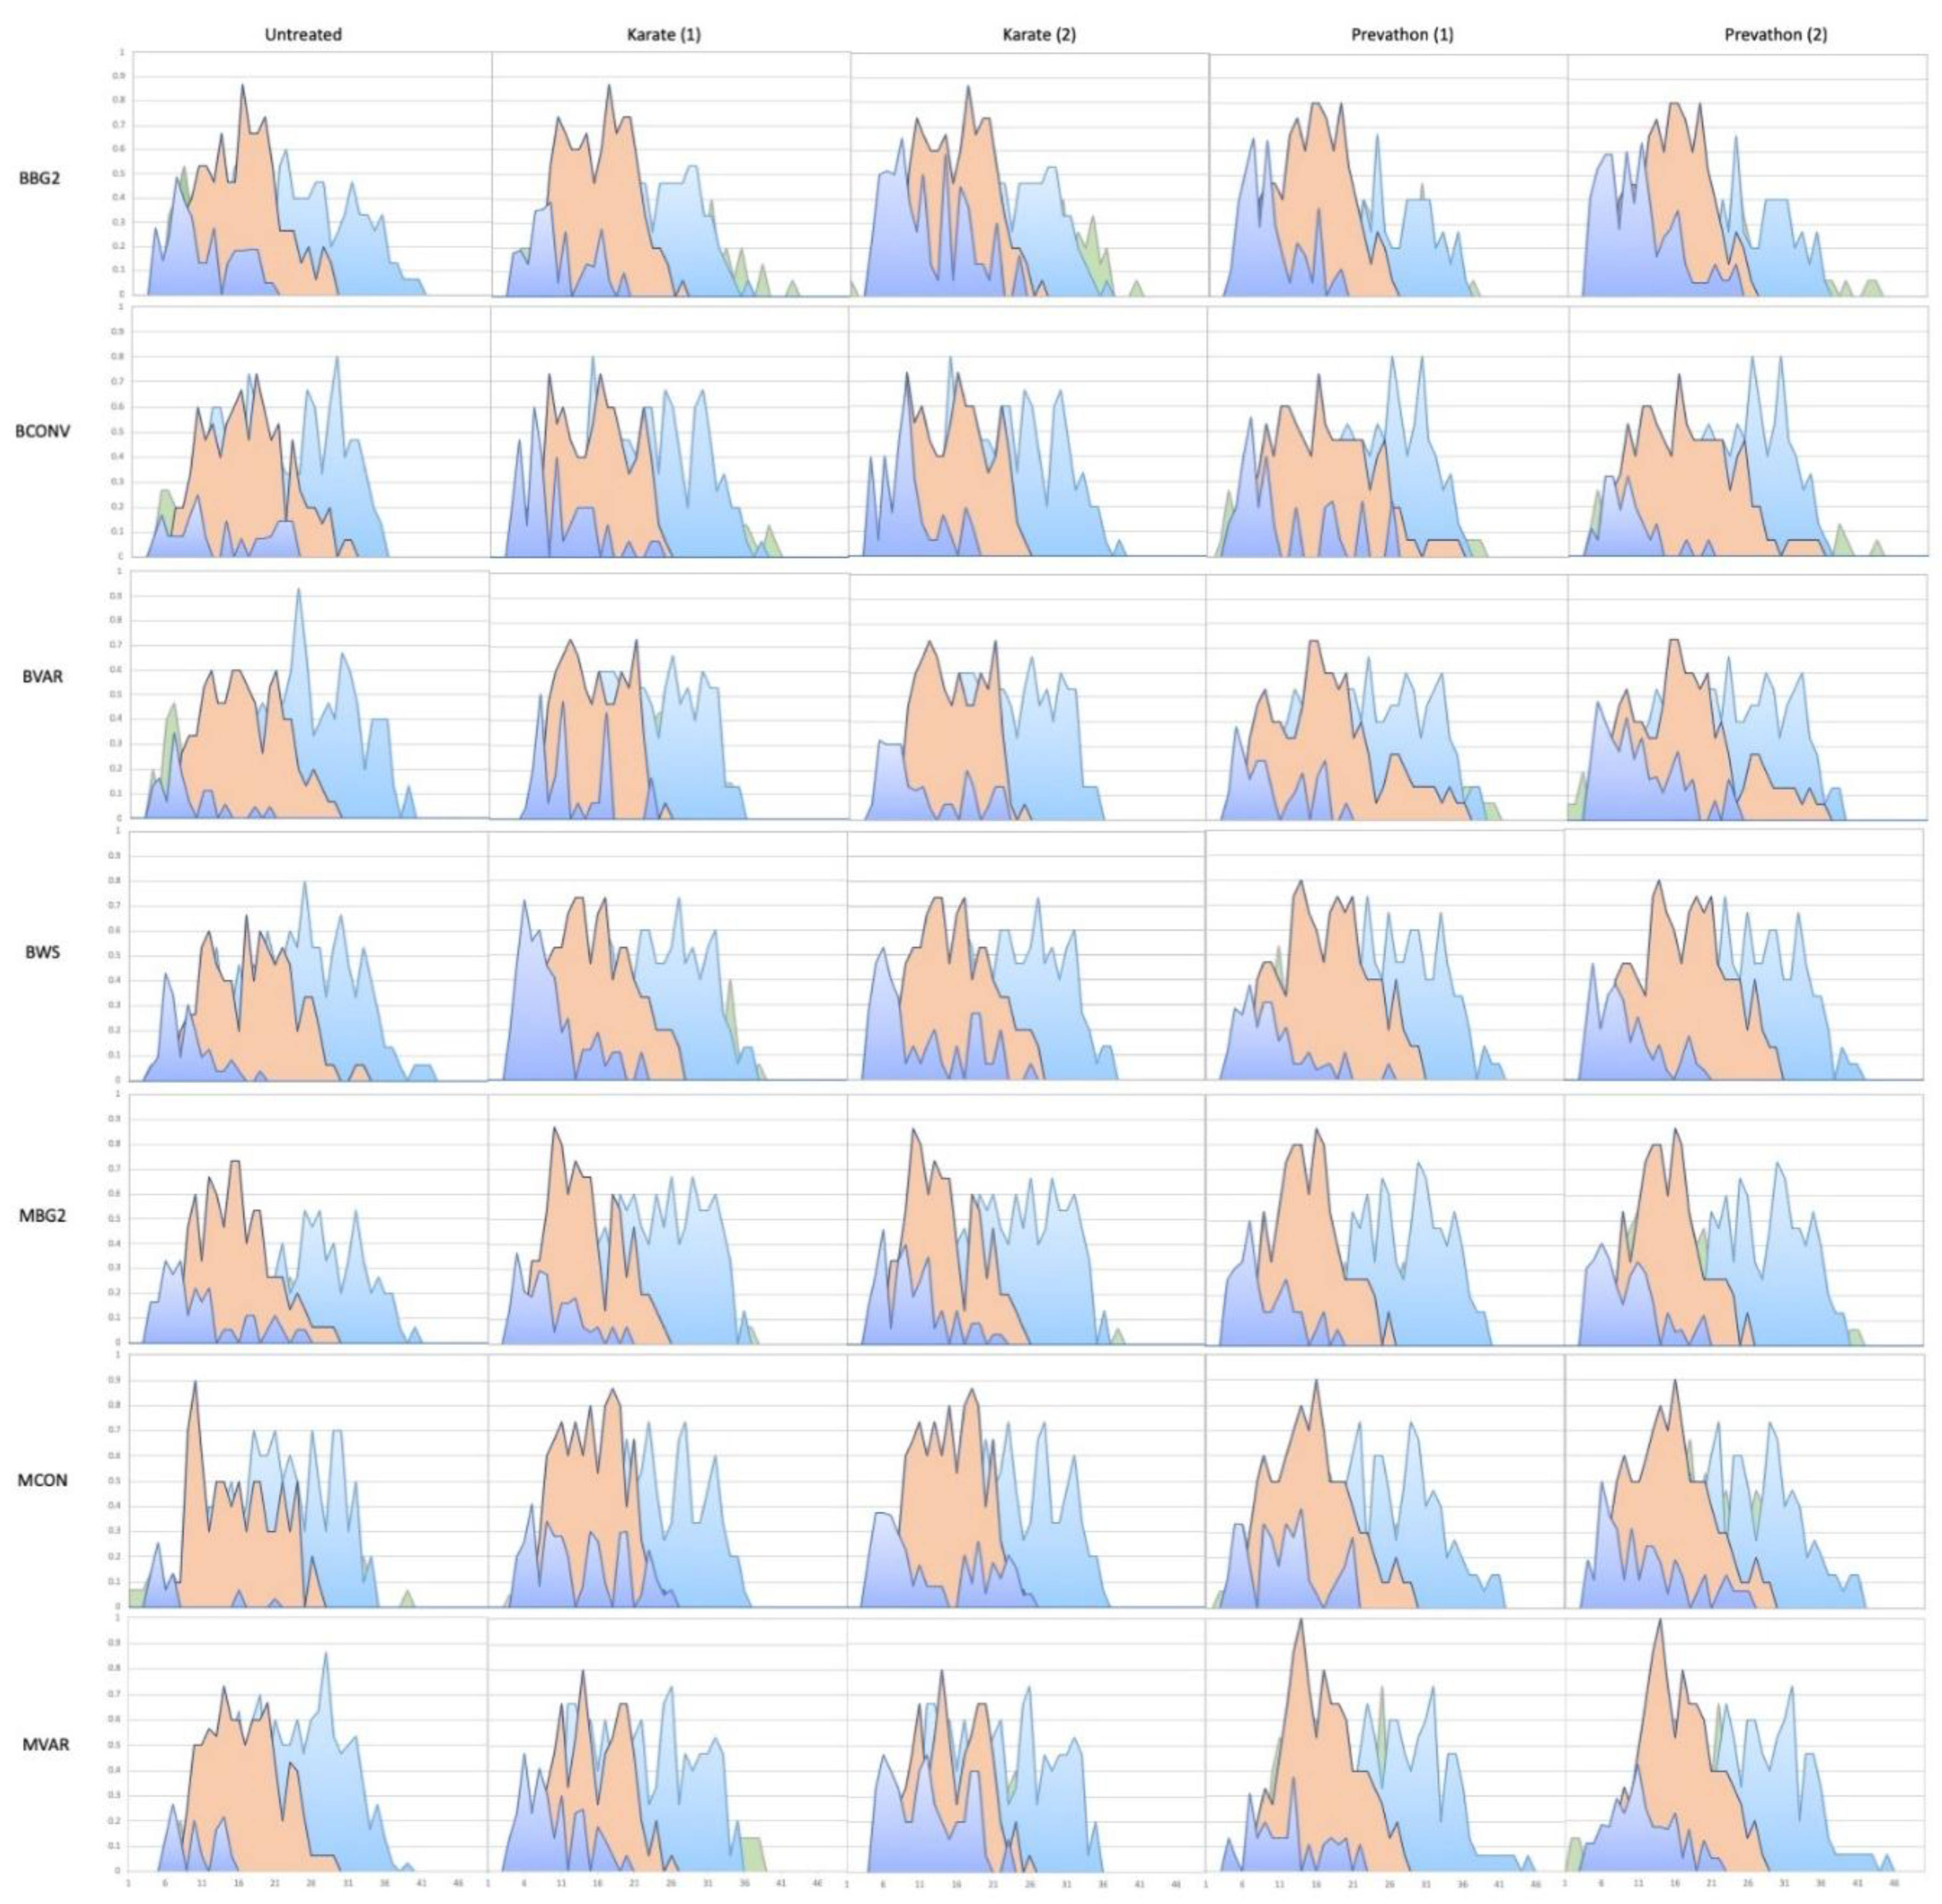
3.4. End of Seaon Box Maps of Harvested Fruit

As indicated in total final yield (Figure 3), the yield of all untreated non-Bt cottons (BVAR, BCONV, MVAR, MCONV) was either zero or not significantly different from zero. This was also illustrated in the temporal patterns of yield (Figure 4) where final yield was plotted versus estimated date of fruit initiation. Insecticide treatments generally enhanced the survival of fruit initiated 30 to 42 days after formation of the cotyledonary node. Yield from fruit initiated 60 or more days post cotyledonary node was also more evident on insecticide treated and Bt cottons. Some of the untreated non-Bt and Bt cottons had late-season harvestable fruit (e.g., BCONV, MBG2) that contributed very little to total yield. BWS cotton treated with Coragen (Figure 4) accumulated yield at a faster rate than untreated BWS cotton, indicating the benefit of treating this Bt cotton. Karate treated BWS cotton accumulated yield at a rate above that observed for Coragen-treated and untreated BWS cotton. Significant variety by insecticide interactions were observed in the average date of fruit initiation (p = 0.0214) and grams of lint (p = 0.0396) observed at harvest (Table 9). In general, Bt cottons and insecticide treated non-Bt cottons had higher average dates of fruit initiation for cotton fruit and grams of lint at harvest.
Consistent with trends in the 2012 total final yield (Figure 3), less dramatic differences were observed among varieties and insecticide treatments in trends of fruit accumulation as compared to that of 2011 studies. However, rates of final yield accumulation were clearly different for untreated and insecticide-treated, full-season, non-Bt cottons (MVAR and MCONV) (Figure 5). Less evident differences were observed in the rates of accumulation of harvestable lint for early-season varieties, and generally for Bt cottons. However, BBG2 treated twice with Prevathon and BWS treated once with Karate appeared to benefit from the insecticide oversprays (Figure 5). In 2012, there were no significant effects of variety or insecticide treatment on the average date of fruit initiation for surviving fruit or grams of lint at harvest (Table 10).

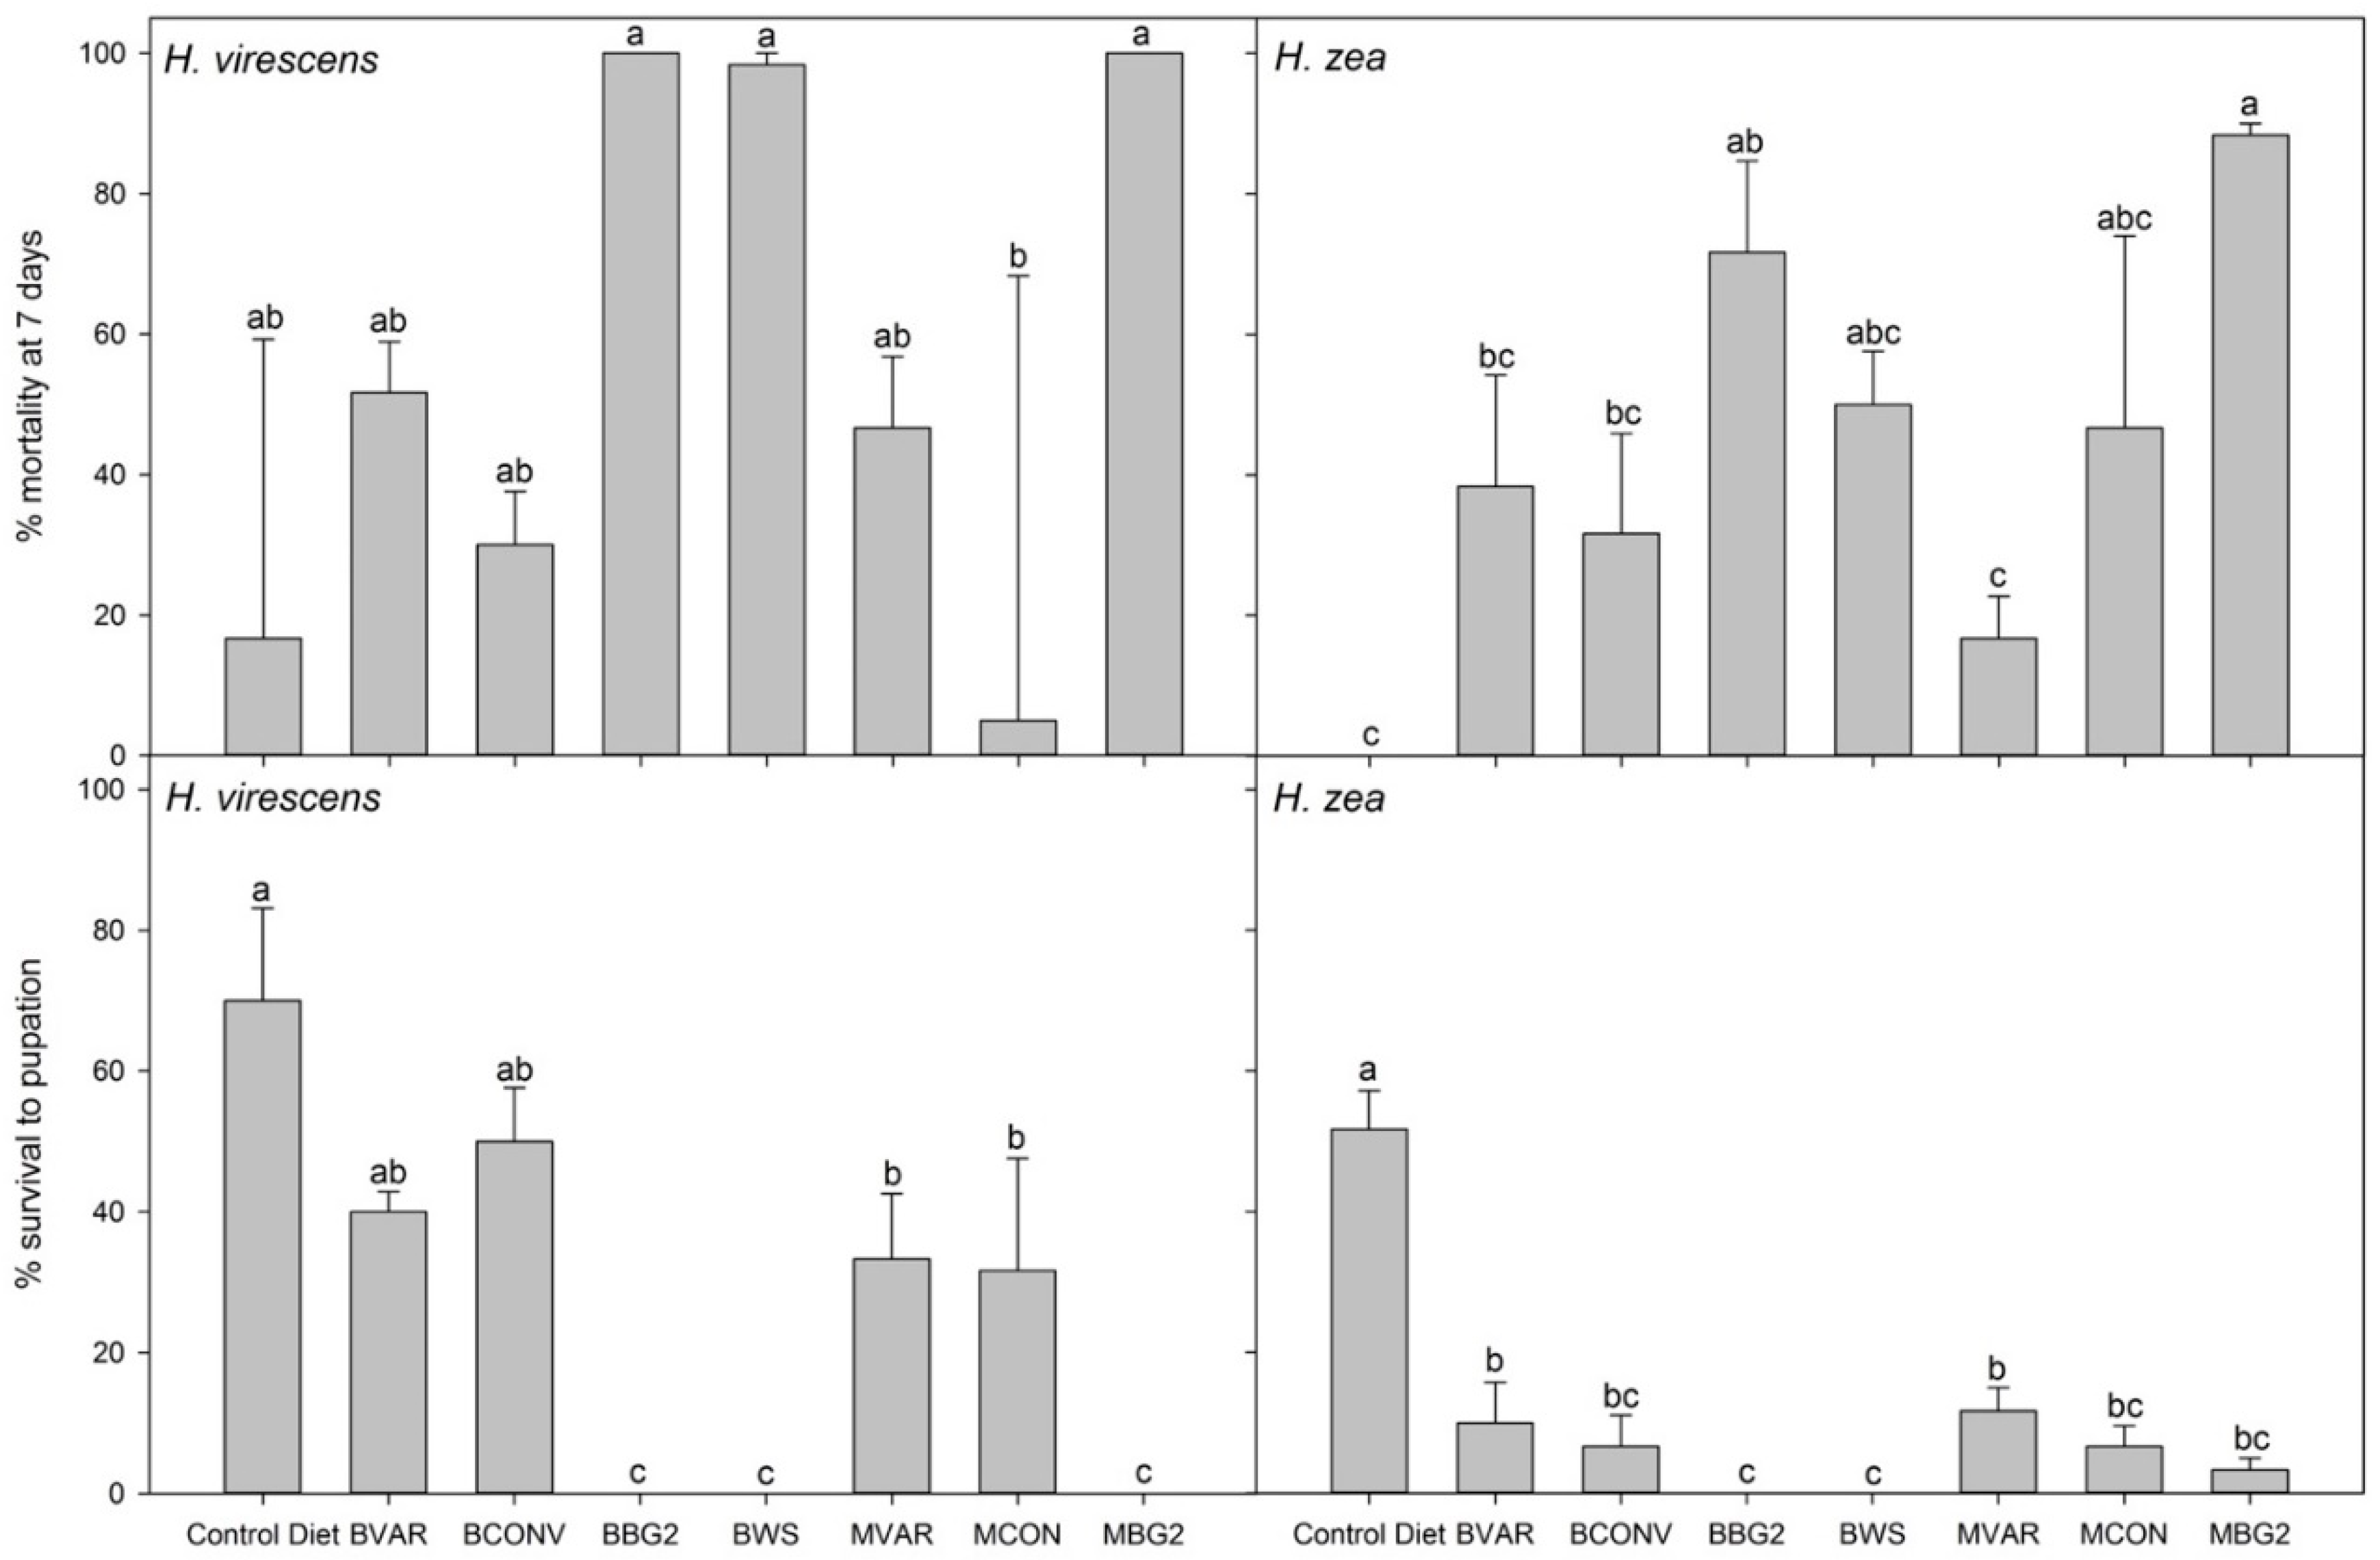
3.5. Bioassays of Cotton Plant Tissue

Mortality of neonate H. virescens and H. zea larvae fed upper leaves from the different cotton varieties for seven days is summarized in Figure 6. Effects of variety on mortality of H. virescens at 7 days were not significant at p = 0.05 (df = 7, F = 2.2406, p = 0.0942) because of variability among replicates and mortality in the control insects fed meridic diet (mean (SEM) mortality of 16.7 ± 42.5%). However, the effects of Bt cotton were still evident in the LSD grouping of treatment effects. Mortality of H. virescens larvae fed tissues from the Bt cotton varieties, BBG2, BWS, or MBG2, was 100% for all replicates at seven days. This compares to a low rate of mortality (5%) on the non-Bt cotton MCONV. Less variability among replicates was observed with the H. zea assays (Figure 6), and no mortality was observed for larvae in the meridic diet control. Mortality data at seven days with H. zea fed cotton leaf tissues was also not significant at p = 0.05 (df = 7, F = 2.4297, p = 0.0746), but the Bt cottons resulted in mortality levels similar to that of MBG2 (mean (SEM) of 70.0 ± 13.18%). Mortality on all cottons, including the non-Bt varieties was higher than that of the control diet treatment. Mortality of larvae fed non-Bt varieties was statistically similar and generally less than that of MBG2, with the exception of MCONV.

4. Discussion

Under the extreme insect infestations of this cage study, Bt cotton traits and foliar insecticides provided obvious, but not perfect, levels of insect control. Some fruit loss was observed with all treatments. Although significant interactions between variety and insecticide effects were observed with a few of the measured metrics in 2011 (number of larvae/plant on 15 August 2011(Table 5); mean number fruit/plant on 1 August 2011(Table 6), average date of fruit initiation/g of lint harvested (Table 9)), most of the metrics included significant main effects of variety and insecticide with no interaction between the two. In general, the Bt varieties protected the plants from insect damage, and the insecticide sprays protected the plants from insect damage. Statistical differences among Bt varieties were rare, but the early-season Bt cotton (BBG2) commonly had less fruit loss and greater yield than other treatments. The bioassay experiment included experimental variability but clearly demonstrated the higher susceptibility of H. virescens to the Bt cottons (Figure 6). There was no measurable survival to pupation for H. virescens. Overall survival of H. zea to pupation was unexpectedly low in the bioassays, but there was some measurable survival on the full-season Bt (MBG2) cotton to pupation confirming the higher tolerance of H. zea for the Bt toxins expressed in the plants. Both insecticides, lambda-cyhalothin and chlorantraniliprole, provided insect control comparable to the Bt traits. The lack of differences between the two insecticide chemistries was expected since the cages were infested with laboratory-reared colonies of the two pest species with little or no previous exposure to either chemistry. As with the North Carolina environment and almost predictable movement of high densities of bollworm from corn to cotton [8,17,18,29]), there was a definite advantage to spraying non-Bt cotton with either of the insecticides (Figure 1, Figure 2 and Figure 3). The need to treat Bt cotton was less clear, but the widestrike (BWS) cotton variety treated with Coragen yielded significantly more lint/ha than untreated BWS cotton (Figure 3), and sprayed Bt cottons tended to have less insect damage and higher yield. Although insect densities were higher in this study, overall results were generally similar to those of Little et al. [21] where there was a numerical but non-significant higher yield in treated Bt cotton.
Differences in insect numbers were not clearly evident and were not expected, given the stronger emphasis on measuring fruit loss and yield in these cage studies. The relatively small plots limited detailed assessments of insect densities, and while there was abundant evidence of fruit damage and aborted fruit, observations of high densities of fourth or fifth instar caterpillars were not common. The last sample date for larvae occurred 21 and 11 days after the inoculation of cages with moths during 2011 and 2012, respectively, and few larvae were detected. After the second insecticide spray each year, only a few observations of the plants were made until harvest. There may have been some survival of fourth or fifth instar caterpillars, especially in 2012 studies, that may have damaged older, larger fruiting structures. There is some visual evidence of this in Figure 1 and Figure 2.
To better explain the major differences between Bt and non-Bt fruit retention when untreated or sprayed with insecticide, data for all 1st position fruit observations were combined across Bt and non-Bt treatments when untreated and insecticide-treated and studied by AOV. The general lack of significant interactions between variety and insecticide treatment throughout this study supports this generalized examination. Results are summarized in Table 11. Significant differences among the variety–insecticide groups in number of 1st position fruit per plant were evident for only one within-season sample date, and harvest dates for both years. In all three of these observations, less fruit was observed on unsprayed non-Bt cotton. Insecticide-treated Bt and non-Bt cotton had statistically more fruit per plant than the unsprayed non-Bt cotton. Unsprayed Bt cotton was intermediate among treatments with numbers of fruit statistically comparable to the insecticide-treated cottons (Table 9).
The intent of the detailed efforts to track fruit retention, nodal development, and yield by individual fruiting positions was to carefully understand the ability of untreated Bt cotton to protect fruit and preserve yield when challenged with extreme, unusually high densities of tobacco budworm and bollworm. Across the wide-scope of different metrics summarized, unsprayed Bt cotton provided protection statistically comparable to that of insecticide-treated non-Bt and Bt cotton. Non-significant numerical advantages for insecticide-treated Bt cotton were also noted consistently throughout the experiment. While these various observation metrics helped us understand when damage occurred, final overall conclusions were similar to those of total final yield (Figure 3) and temporal patterns of yield accumulation (Figure 4 and Figure 5) estimated from box mapping of final yield [25,26]. The common correlation of rate of nodal development with final yield and associated correlations between fruit retention and final yield support the extensive work by the University of Arkansas to develop the COTMAN expert system to manage cotton crop development [30]. Interested readers are referred to the introductory chapters in the COTMAN manual [30] for an explanation of the linkage between cotton node development, fruit retention, and yield.
Untreated Bt cotton provided levels of cotton fruit protection comparable to that of insecticide treated Bt and non-Bt cotton in this cage experiment. The insecticidal activity of the plants was documented by bioassay of H. virescens and H. zea fed leaf tissue from plants in the cages in 2012, and temporal patterns of with-season 1st position fruit retention and end-of-season box mapping of final yield confirmed the fruit-protection capabilities of Bt cotton and insecticide treatments against susceptible populations of these pests. These results provide confidence that Bt toxins can protect cotton from severe damage when challenged with high densities of bollworm. Additional field experiments are needed to further study options for reducing current tendencies to over-spray Bt cotton, especially options to control Lygus spp. and other sucking pests not susceptible to Bt toxins. While no clear statistical advantage of overspraying Bt cotton with insecticides was measured in this cage study, the consistent trend for a slight numerical but non-significant yield increase is consistent with the observations of Little et al. [21] and needs additional studies.

Author Contributions

Conceptualization, K.C.A. and R.G.L.; Formal analysis, K.C.A., R.G.L. and K.A.P.; Investigation, K.C.A., R.G.L. and N.S.L.; Methodology, K.C.A., R.G.L., N.S.L. and O.P.P.; Writing—original draft, K.C.A. and R.G.L.; Writing—review & editing, K.C.A., R.G.L., N.S.L., K.A.P. and O.P.P.

Funding

This research was conducted as a component of two National Program 304 Plant Protection and Quarantine projects of the USDA Agricultural Research Service (Project 6066-22000-084-00D Integrated Insect Pest and Resistance Management in Corn, Cotton, Sorghum, Soybean and Sweet Potato; and Project 6066-22000-085-00D Innovative Strategies for Insect Resistance Management in Bt Cotton).

Acknowledgments

The authors acknowledge the assistance of Larry Adams, Chris Johnson, Chad Roberts, Dquan Wilson, and Jesse King in conducting the cage studies. Kenya Dixon, KeAndrea Brown, and Yolanda Harvey assisted with data summaries. Henry Winters assisted with rearing insects used for release in cages. Thank you to Maribel Portilla and Yu Cheng Zhu for reviewing an earlier version of this manuscript. Mention of trade names or commercial products in this publication is solely for the purpose of providing specific information and does not imply recommendation or endorsement by the U.S. Department of Agriculture or the Agricultural Research Service.

Conflicts of Interest

The authors declare no conflict of interest.

References

  1. Luttrell, R.G.; Teague, T.G.; Brewer, M.J. Cotton insect pest management. In Cotton, 2nd ed.; Fang, D.D., Percey, R.G., Eds.; Agronomy Monograph 57; American Society of Agronomy: Madison, WI, USA; Crop Science Society: Fitchburg, WI, USA; Soil Science Society of America: Madison, WI, USA, 2015; pp. 509–546. [Google Scholar]
  2. Frisvold, G.B.; Reeves, J.M. The costs and benefits of refuge requirements: The case of Bt cotton. Ecol. Econ. 2008, 65, 87–97. [Google Scholar] [CrossRef]
  3. Luttrell, R.G.; Wan, L.; Knighten, K. Variation in susceptibility of noctuid (lepidoptera) larvae attacking cotton and soybean to purified endotoxin proteins and commercial formulations of Bacillus thuringiensis. J. Econ. Entomol. 1999, 92, 21–32. [Google Scholar] [CrossRef]
  4. MacIntosh, S.C.; Stone, T.B.; Sims, S.R.; Hunst, P.L.; Greenplate, J.T.; Marrone, P.G.; Perlak, F.J.; Fischoff, D.A.; Fuchs, R.L. Specificity and efficacy of purified Bacillus thuringiensis proteins against economically important insects. J. Invertebr. Pathol. 1990, 56, 258–266. [Google Scholar] [CrossRef]
  5. Stewart, S.D.; Adamczyk, J.J., Jr.; Knighten, K.S.; Davis, F.M. Impact of Bt cottons expressing one or two insecticidal proteins of Bacillus thuringiensis Berliner on growth and survival of noctuid (lepidoptera) larvae. J. Econ. Entomol. 2001, 94, 752–760. [Google Scholar] [CrossRef]
  6. Luttrell, R.G.; Jackson, R.E. Helicoverpa zea and Bt Cotton in the United States. GM Crops Food 2012, 3, 213–227. [Google Scholar] [CrossRef]
  7. Edge, J.M.; Benedict, J.H.; Carroll, J.P.; Reding, H.K. Bollgard cotton: An assessment of global economic, environmental, and social benefits. J. Cotton Sci. 2001, 5, 121–136. [Google Scholar]
  8. Jackson, R.E.; Bradley, J.R., Jr.; Van Duyn, J.W.; Gould, F. Comparative production of Helicoverpa zea (lepidoptera: Noctuidae) from transgenic cotton expressing either one or two Bacillus thuringiensis proteins with and without insecticide oversprays. J. Econ. Entomol. 2004, 97, 1719–1725. [Google Scholar] [CrossRef]
  9. Little, N.S.; Catchot, A.L.; Allen, K.C.; Gore, J.; Musser, F.R.; Cook, D.R.; Luttrell, R.G. Supplemental control with diamides for heliothines in Bt Cotton. Southwest. Entomol. 2017, 42, 15–26. [Google Scholar] [CrossRef]
  10. Naranjo, S.E. Impact of Bt transgenic cotton on integrated pest management. J. Agric. Food Chem. 2011, 59, 5842–5851. [Google Scholar] [CrossRef]
  11. Mascarenhas, V.J.; Luttrell, R.G. Combined effect of sublethal exposure to cotton expressing the endotoxin protein of Bacillus thuringiensis and natural enemies on survival of bollworm (lepidoptera: Noctuidae) larvae. Environ. Entomol. 1997, 26, 939–945. [Google Scholar] [CrossRef]
  12. Naranjo, S.E.; Ellsworth, P.C. Arthropod communities and transgenic cotton in the western United States: Implications for biological control. In Proceedings of the 1st International Symposium on Biological Control of Arthropods, Honolulu, HI, USA, 14–18 January 2002; pp. 284–291. [Google Scholar]
  13. Head, G.; Moar, W.; Eubanks, M.; Freeman, B.; Ruberson, J.; Hagerty, A.; Turnipseed, S. A multiyear, large-scale comparison of arthropod populations on commercially managed Bt and non-Bt cotton fields. Environ. Entomol. 2005, 34, 1257–1266. [Google Scholar] [CrossRef]
  14. Torres, J.B.; Ruberson, J.R. Spatial and temporal dynamics of oviposition behavior of bollworm and three of its predators in Bt and non-Bt cotton fields. Entomol. Exp. Appl. 2006, 120, 11–13. [Google Scholar] [CrossRef]
  15. Naranjo, S.E.; Luttrell, R.G. Cotton arthropod IPM. In Integrated Pest Management: Concepts, Tactics, Strategies and Case Studies; Ratcliffe, E.B., Hutchinson, W.D., Cancelado, R.E., Eds.; Cambridge University Press: New York, NY, USA, 2009; p. 529. [Google Scholar]
  16. Luttrell, R.G. Cotton pest management: Part 2. A US perspective. Annu. Rev. Entomol. 1994, 39, 527–542. [Google Scholar] [CrossRef]
  17. Lambert, A.L.; Bradley, J.R., Jr.; Van Duyn, J.W. Effects of natural enemy conservation and planting date on the susceptibility of Bt cotton to Helicoverpa zea in North Carolina. In Proceedings of the Beltwide Cotton Conferences, Nashville, TN, USA, 9–12 January 1996; pp. 931–935. [Google Scholar]
  18. Mahaffey, J.S.; Bradley, J.R., Jr.; Van Duyn, J.W. Bt cotton: Field performance in North Carolina under conditions of unusually high bollworm populations. In Proceedings of the Beltwide Cotton Conferences, San Antonio, TX, USA, 4–7 January 1995; pp. 795–798. [Google Scholar]
  19. Reisig, D.D.; Huseth, A.S.; Batcheler, J.S.; Aghaee, M.A.; Braswell, L.; Burrack, H.J.; Flanders, K.; Greene, J.K.; Herbert, D.A.; Jacobson, A.; et al. Long-term empirical and observational evidence of practical Helicoverpa zea resistance to cotton with pyramided Bt toxins. J. Econ. Entomol. 2018, 111, 1824–1833. [Google Scholar] [CrossRef]
  20. Williams, M.R. Cotton Insect Losses-2015. In Proceedings of the Beltwide Cotton Conferences, New Orleans, LA, USA, 5–7 January 2016; pp. 507–526. [Google Scholar]
  21. Little, N.S.; Luttrell, R.G.; Allen, K.C.; Perera, O.P.; Parys, K.A. Effectiveness of microbial and chemical insecticides for supplemental control of bollworm on Bt and non-Bt cottons. J. Econ. Entomol. 2017, 110, 1039–1051. [Google Scholar] [CrossRef]
  22. Bourland, F.M.; Jones, D.C. Registration of ‘UA48’ cotton cultivar. J. Plant Regist. 2011, 6, 15–18. [Google Scholar] [CrossRef]
  23. Meredith, W.R., Jr.; Nokes, W.S. Registration of MD 9ne and MD 25 high-fiber-quality germplasm lines of cotton. J. Plant Regist. 2011, 5, 202–206. [Google Scholar] [CrossRef]
  24. Blanco, C.A.; Portilla, M.; Abel, C.A.; Winters, H.; Ford, R.; Streett, D. Soybean flour and wheat germ proportions in artificial diet and their effect on the growth rates of tobacco budworm, Heliothis virescens. J. Insect Sci. 2009, 9, 1–9. [Google Scholar] [CrossRef]
  25. Allen, K.C.; Luttrell, R.G.; Parker, C.D., Jr. Influence of within-season densities of heliothines and tarnished plant bugs on variability in end-of-season cotton yield mapping. J. Cotton Sci. 2009, 133, 11–22. [Google Scholar]
  26. Jenkins, J.N.; McCarty, J.C., Jr. Useful Tools in Managing Cotton Production: End of Season Plant Maps; Bulletin 1024; Mississippi State University: Starkville, MS, USA, 1995. [Google Scholar]
  27. Allen, K.C.; Andrews, G.; Burdine, B.; Catchot, A.; Cook, D.; Dodds, D.; Gore, J.; Howell, M.; Jackson, R.; Larson, E.; et al. Insect Control Guide for Agronomic Crops; Mississippi State University Extension Service: Starkville, MS, USA, 2011; p. 104. [Google Scholar]
  28. Parker, C.D., Jr.; Luttrell, R.G. Interplant movement of Heliothis virescens (lepidoptera: Noctuidae) larvae in pure and mixed plantings of cotton with and without the expression of the CryIA(c) delta-endotoxin protein of Bacillus thuringiensis. J. Econ. Entomol. 1999, 92, 837–845. [Google Scholar] [CrossRef]
  29. Storer, N.P.; Peck, S.L.; Gould, F.; Van Duyn, J.W.; Kennedy, G.C. Spatial processes in the evolution of resistance in Helicoverpa zea (lepidoptera: Noctuidae) to Bt transgenic corn and cotton in a mixed agroecosystem: A biology-rich stochastic simulation model. J. Econ. Entomol. 2003, 96, 156–172. [Google Scholar] [CrossRef] [PubMed]
  30. Danforth, D.M.; O’Leary, P.F. (Eds.) COTMAN Expert System 5.0. User’s Manual; Argricultural Experiment Station Bulletin; University of Arkansas: Fayetteville, AR, USA, 1998; p. 198. [Google Scholar]
Figure 1. Retention of 1st position fruit (probability of fruit at different mainstem nodes) on different plant mapping dates and at harvest during 2011. Plant mapping is indicated on 13 July 2011 (orange), 25 July 2011 (blue), 1 August 2011 (green) and at harvest (6 October 2011; purple). The x-axis indicates the mainstem node number (from bottom to top of plant), while the y-axis indicates probability of fruit at each node.
Agronomy 09 00759 g001
Figure 2. Retention of 1st position fruit (probability of fruit at different mainstem nodes) during 2012. Plant map dates are indicated on 17 July 2012 (green), 3 August 2012 (blue), 15 August 2012 (orange) and at harvest (20 October 2012; purple). Dates are presented from earliest (furthest back on the graph) to harvest (foremost). The left column of graphs shows the pattern of fruit retention on untreated plants, while the other columns show comparative patterns for the same variety treated once or twice with Karate or Prevathon. The x-axis indicates the mainstem node number (from bottom to top of plant), while the y-axis indicates probability of fruit at each node.
Agronomy 09 00759 g002
Figure 3. Total final yield (kg lint/ha) in 2011 and 2012 cage studies (data bars labeled with similar letters do not differ significantly (p = 0.05), Tukey’s HSD test).
Agronomy 09 00759 g003
Figure 4. Cumulative yield (kg lint/ha) versus date of fruit initiation in 2011 studies.
Agronomy 09 00759 g004
Figure 5. Cumulative yield (kg lint/ha) versus date of fruit initiation in 2012 studies.
Agronomy 09 00759 g005
Figure 6. Mortality of H. virescens and H. zea larvae fed upper terminal leaves from different Bt and non-Bt cotton varieties for seven days, and subsequent survival to pupation. Bars (± SEM) with no common letters within an individual graph differ significantly (LSD, p = 0.05).
Agronomy 09 00759 g006
Table 1. Attributes of cotton varieties planted during 2011 and 2012.
VarietyAbbreviationTraitMaturity
ARK48BVARNon-BtEarly
DP121BCONVNon-BtEarly
DP0912BBG2Bollgard IIEarly
PHY375BWSWidestrikeEarly
MD25MVARNon-BtFull
DP174MCONVNon-BtFull
DP1048MBG2Bollgard IIFull
Table 2. Mean insect densities ± SEM observed in cage study plots in 2011. Means not followed by a common letter indicate significant differences between treatments based on LSD at p < 0.05.
VarietyInsecticide Commercial NameEggs/Plant
20 July 2011
Eggs/Plant
25 July 2011
Larvae/Plant
15 Aug 2011
BBG2Coragen8.47 ± 1.142 0.67 ± 0.27 0.1 ± 0.072 cd
BBG2Karate10.27 ± 1.59 0.87 ± 0.256 0 ± 0 d
BBG2Untreated10.6 ± 1.45 0.8 ± 0.312 0 ± 0 d
BCONVCoragen12.93 ± 0.954 1.07 ± 0.358 0.3 ± 0.107 b
BCONVKarate13.27 ± 1.406 0.33 ± 0.159 0 ± 0 d
BCONVUntreated11.33 ± 1.728 0.93 ± 0.345 0.3 ± 0.107 b
BVARCoragen12.4 ±1.279 1.33 ± 0.681 0.5 ± 0.129 a
BVARKarate13 ± 1.483 1.53 ± 0.533 0 ± 0 d
BVARUntreated11.13 ± 0.576 0.8 ± 0.296 0 ± 0 d
BWSCoragen12.27 ± 1.66 0.73 ± 0.33 0.3 ± 0.107 b
BWSKarate9.93 ± 1.248 0.93 ± 0.267 0 ± 0 d
BWSUntreated8.57 ± 1.137 0.21 ± 0.114 0 ± 0 d
MBG2Coragen10.87 ± 0.827 0.73 ± 0.248 0.4 ± 0.111 ab
MBG2Karate11.4 ± 2.537 0.73 ± 0.228 0 ± 0 d
MBG2Untreated11.44 ± 1.228 0.31 ± 0.151 0.06 ± 0.043 d
MCOBVCoragen12.47 ± 1.664 0.33 ± 0.159 0 ± 0 d
MCONVKarate11.07 ± 1.631 0.67 ± 0.252 0 ± 0 d
MCONVUntreated11.33 ± 0.95 0.6 ± 0.163 0.27 ± 0.108 bc
MVARCoragen11.53 ± 1.129 0.33 ± 0.211 0 ± 0 d
MVARKarate11.13 ± 1.897 0.4 ± 0.131 0 ± 0 d
MVARUntreated12 ± 1.47 0.67 ± 0.232 0.07 ± 0.067 d
Table 3. Mean egg densities ± SEM observed in cage study plots in 2012. Means not followed by a common letter indicate significant differences between treatments based on LSD at p < 0.05.
VarietyInsecticide Commercial NameEggs/Plant
23 July 2012
Eggs/Plant
6 August 2012
Eggs/Plant
13 August 2012
BBG2
BBG2
Karate-1 0.13 ± 0.063 0
BBG2Karate-2 0
BBG2Prevathon-1 0.13 ± 0.063 0
BBG2Prevathon-2 0
BBG2Untreated0.83 ± 0.017 ab0.03 ± 0.033 0
BCONVKarate-1 0.2 ± 0.074 0
BCONVKarate-2 0
BCONVPrevathon-1 0.17 ± 0.069 0
BCONVPrevathon-2 0
BCONVUntreated0.52 ± 0.1 b0.1 ± 0.056 0
BVARKarate-1 0.1 ± 0.056 0
BVARKarate-2 0
BVARPrevathon-1 0.17 ± 0.069 0
BVARPrevathon-2 0
BVARUntreated0.88 ± 0.1 ab0.1 ± 0.056 0
BWSKarate-1 0.1 ± 0.056 0
BWSKarate-2 0
BWSPrevathon-1 0.2 ± 0.074 0
BWSPrevathon-2 0.05 ± 0.05
BWSUntreated0.72 ± 0.017 ab0.13 ± 0.063 0
MBG2Karate-1 0.17 ± 0.069 0
MBG2Karate-2 0
MBG2Prevathon-1 0.17 ± 0.069 0
MBG2Prevathon-2 0
MBG2Untreated0.92 ± 0.033 a0.13 ± 0.063 0
MCONVKarate-1 0.1 ± 0.056 0
MCONVKarate-2 0
MCONVPrevathon-1 0.17 ± 0.069 0
MCONVPrevathon-2 0
MCONVUntreated0.85 ± 0.083 ab0.07 ± 0.046 0
MVARKarate-1 0.07 ± 0.046 0
MVARKarate-2 0
MVARPrevathon-1 0.17 ± 0.069 0
MVARPrevathon-2 0
MVARUntreated0.7 ± 0.1 ab0.13 ± 0.063 0
Table 4. Mean larval densities ± SEM observed in cage study plots in 2012.
VarietyInsecticideLarvae/Plant
23 July 2012
Larvae/Plant
6 August 2012
Larvae/Plant
13 August 2012
BBG2Karate-1 0.2 ± 0.074 0
BBG2Karate-2 0
BBG2Prevathon-1 0.2 ± 0.074 0
BBG2Prevathon-2 0
BBG2Untreated0.02 ± 0.017 0.37 ± 0.089 0
BCONVKarate-1 0.13 ± 0.063 0
BCONVKarate-2 0
BCONVPrevathon-1 0.23 ± 0.079 0
BCONVPrevathon-2 0
BCONVUntreated0.1 ± 0.039 0.27 ± 0.082 0
BVARKarate-1 0.27 ± 0.082 0
BVARKarate-2 0
BVARPrevathon-1 0.17 ± 0.069 0
BVARPrevathon-2 0
BVARUntreated0.1 ± 0.039 0.23 ± 0.079 0
BWSKarate-1 0.27 ± 0.082 0
BWSKarate-2 0
BWSPrevathon-1 0.23 ± 0.079 0
BWSPrevathon-2 0
BWSUntreated0.02 ± 0.017 0.27 ± 0.082 0
MBG2Karate-1 0.13 ± 0.063 0
MBG2Karate-2 0
MBG2Prevathon-1 0.17 ± 0.069 0
MBG2Prevathon-2 0
MBG2Untreated0.1 ± 0.023 0.23 ± 0.079 0
MCONVKarate-1 0.27 ± 0.082 0
MCONVKarate-2 0
MCONVPrevathon-1 0.2 ± 0.074 0
MCONVPrevathon-2 0
MCONVUntreated0.1 ± 0.036 0.3 ± 0.085 0.05 ± 0.05
MVARKarate-1 0.2 ± 0.074 0
MVARKarate-2 0
MVARPrevathon-1 0.17 ± 0.069 0
MVARPrevathon-2 0
MVARUntreated0.1 ± 0.017 0.2 ± 0.074 0
Table 5. Mean ± SEM uppermost node bearing fruit per plant on three within-season sample dates and at total nodes with open bolls at harvest in 2011. Means not followed by a common letter indicate significant differences between treatments based on LSD at p < 0.05.
VarietyInsecticide Commercial NameUppermost Node
13 July 2011
Uppermost Node
25 July 2011
Uppermost Node
1 August 2011
Nodes with Open Bolls at Harvest
6 October 2011
BBG2Coragen16.5 ± 0.53218.9 ± 0.44621.2 ± 0.90116.3 ± 0.622 a
BBG2Karate15.6 ± 0.71621.3 ± 0.58318.9 ± 0.76815.6 ± 0.505 a
BBG2Untreated15.3 ± 0.48520.9 ± 0.80819.9 ± 0.89214.4 ± 1.025 a
BCONVCoragen16.1 ± 0.73620 ± 0.6420.9 ± 0.86714.4 ± 0.631 a
BCONVKarate15.6 ± 0.84421.4 ± 0.83820 ± 0.55214.2 ± 0.813 a
BCONVUntreated14.1 ± 0.3320.1 ± 0.51122.5 ± 0.76112.9 ± 1.429 a
BVARCoragen18.3 ± 0.7919 ± 0.44720 ± 0.58612.9 ± 0.808 a
BVARKarate16 ± 0.84521.9 ± 0.62120.2 ± 0.6498.3 ± 1.899 b
BVARUntreated15.1 ± 0.87620.5 ± 0.9120.8 ± 0.9329.4 ± 3.894 ab
BWSCoragen15.8 ± 0.82918.9 ± 0.59719.7 ± 0.92915.2 ± 0.96 a
BWSKarate15.8 ± 0.64921.7 ± 0.7421.9 ± 1.01614.6 ± 1.675 a
BWSUntreated15 ± 0.6120.5 ± 0.8519.6 ± 0.91813.1 ± 0.589 a
MBG2Coragen16.2 ± 0.57118.6 ± 0.63819.2 ± 0.71212.5 ± 0.682 a
MBG2Karate14.3 ± 0.59120.1 ± 0.90420.8 ± 0.65611.8 ± 1.244 a
MBG2Untreated13.9 ± 0.40320.4 ± 0.63220.1 ± 0.8449.8 ± 1.235 ab
MCONVCoragen17.4 ± 0.80918.9 ± 0.42520.6 ± 0.75515.6 ± 0.521 a
MCONVKarate16.3 ± 0.70820.9 ± 0.62820.7 ± 0.83114.2 ± 1.028 a
MCONVUntreated13.7 ± 0.56520.7 ± 0.78520.3 ± 0.416 ± 2.471 b
MVARCoragen16.1 ± 0.59319.5 ± 0.37619.7 ± 0.77315.4 ± 0.618 a
MVARKarate14.4 ± 0.42320.5 ± 0.96520.2 ± 0.75115.8 ± 0.757 a
MVARUntreated14.2 ± 0.41821 ± 0.6420.9 ± 0.7332.5 ± 2.5 b
Table 6. Mean ± SEM number 1st position fruit per plant on three within-season sample dates and at harvest in 2011. Means not followed by a common letter indicate significant differences between treatments based on LSD at p < 0.05.
VarietyInsecticide Commercial NameFruit/Plant
13 July 2011
Fruit/Plant
25 July 2011
Fruit/Plant1
August 2011
Fruit/Plant Harvest
6 October 2011
BBG2Coragen7.8 ± 0.656 9.5 ± 0.456 9.8 ± 0.712 a5.7 ± 0.597
BBG2Karate7.7 ± 0.621 10.3 ± 0.475 7.5 ± 0.878 ab7.5 ± 0.904
BBG2Untreated6.8 ± 0.368 10.7 ± 0.422 7.7 ± 0.621 ab5.2 ± 0.654
BCONVCoragen5.7 ± 0.433 8.9 ± 0.749 8.5 ± 0.925 ab4.5 ± 0.376
BCONVKarate6.2 ± 0.699 8.7 ± 0.539 8.7 ± 0.771 ab5.1 ± 0.691
BCONVUntreated5.8 ± 0.327 9.5 ± 0.446 10.5 ± 0.661 a0.3 ± 0.141
BVARCoragen7.4 ± 0.838 9.7 ± 0.54 8.7 ± 0.747 ab6 ± 0.75
BVARKarate7.2 ± 0.705 10.3 ± 0.396 9.5 ± 0.533 ab3.4 ± 0.872
BVARUntreated7.2 ± 0.547 9.5 ± 0.568 8.7 ± 0.959 ab2.2 ± 1.158
BWSCoragen6.3 ± 0.566 9.1 ± 0.452 8.3 ± 0.939 ab6 ± 0.78
BWSKarate6.9 ± 0.53 10.5 ± 0.624 11.1 ± 0.646 a6.5 ± 0.976
BWSUntreated7.4 ± 0.58 10.1 ± 0.467 6.6 ± 0.894 b3.6 ± 0.456
MBG2Coragen6.1 ± 0.51 9.1 ± 0.636 7.3 ± 0.773 ab4.9 ± 0.401
MBG2Karate6 ± 0.425 9.8 ± 0.536 9.1 ± 0.456 ab4.8 ± 0.716
MBG2Untreated6.3 ± 0.546 9.5 ± 0.465 9.3 ± 0.8 ab1.8 ± 0.393
MCONVCoragen7.9 ± 0.827 9.4 ± 0.308 8.7 ± 0.803 ab7.1 ± 1.19
MCONVKarate7.1 ± 0.643 10.4 ± 0.515 5.8 ± 0.788 b5.1 ± 0.619
MCONVUntreated6.7 ± 0.419 9.5 ± 0.467 8.9 ± 0.473 ab3.3 ± 1.521
MVARCoragen6.8 ± 0.67 8.9 ± 0.496 7.3 ± 0.813 ab6.2 ± 0.757
MVARKarate5.1 ± 0.452 10.5 ± 0.716 8.1 ± 0.978 ab6.1 ± 1.106
MVARUntreated7.0 ± 0.535 10.2 ± 0.36 9.4 ± 0.702 ab1.3 ± 1.25
Table 7. Mean ± SEM uppermost node bearing fruit per plant on three within-season sample dates and total nodes with open bolls at harvest in 2012.
VarietyInsecticide Commercial NameUppermost Node
17 July 2012
Uppermost Node
3 August 2012
Uppermost Node
15 August 2012
Nodes with Open Bolls at Harvest
20 October 2012
BBG2Karate-116.7 ± 0.66723.3 ± 9.73321 ± 6.5338.3 ± 2.675
BBG2Karate-2 23.3 ± 8.413.3 ± 6.017
BBG2Prevathon-116.7 ± 1.20225 ± 11.917.3 ± 5.7339.3 ± 4.122
BBG2Prevathon-2 21.7 ± 814.3 ± 6.178
BBG2Untreated16.3 ± 1.45323 ± 11.33321 ± 6.810 ± 3.381
BCONVKarate-116.3 ± 1.33324 ± 11.46717.7 ± 4.88.7 ± 3.333
BCONVKarate-2 12.3 ± 3.28.3 ± 3.344
BCONVPrevathon-120.7 ± 3.71224 ± 11.13317.3 ± 6.1336 ± 3.156
BCONVPrevathon-2 19 ± 7.0676.7 ± 2
BCONVUntreated18 ± 1.52824 ± 11.7334.3 ± 1.28 ± 1.869
BVARKarate-115 ± 123.7 ± 11.26718.7 ± 6.3676 ± 2.293
BVARKarate-2 16.7 ± 4.68 ± 2.556
BVARPrevathon-119.7 ± 3.1826.7 ± 11.53318.7 ± 6.5117 ± 2.378
BVARPrevathon-2 18.3 ± 5.46710.7 ± 4.289
BVARUntreated17 ± 1.15526.7 ± 12.33312.3 ± 4.1335 ± 1.327
BWSKarate-117.7 ± 0.33323 ± 10.73320.7 ± 6.811 ± 4.644
BWSKarate-2 18.7 ± 5.8679.7 ± 3.733
BWSPrevathon-119.7 ± 2.02825.3 ± 11.06720 ± 6.9339.7 ± 2.808
BWSPrevathon-2 15.7 ± 59.7 ± 3.128
BWSUntreated19 ± 1.52826 ± 11.93314 ± 4.3338 ± 2
MBG2Karate-116 ± 122.3 ± 1115 ± 4.2677.7 ± 2.333
MBG2Karate-2 18.3 ± 4.89 ± 3.075
MBG2Prevathon-115.7 ± 0.66726.7 ± 12.73318.3 ± 6.5338.3 ± 2.944
MBG2Prevathon-2 19.3 ± 8.06710 ± 3.333
MBG2Untreated16.7 ± 2.90626.5 ± 12.817.7 ± 5.49.3 ± 2.667
MCONVKarate-115.7 ± 0.33323.3 ± 1118.5 ± 3.710 ± 3.905
MCONVKarate-2 14 ± 4.66712 ± 3.698
MCONVPrevathon-118.7 ± 2.02825.3 ± 12.619 ± 5.88 ± 3.5
MCONVPrevathon-2 22 ± 911 ± 3.644
MCONVUntreated17 ± 122.5 ± 11.312.3 ± 3.0673.3 ± 0.689
MVARKarate-114.3 ± 0.66724 ± 11.66715 ± 4.8678.7 ± 3.133
MVARKarate-2 16.7 ± 5.66712 ± 4.8
MVARPrevathon-118 ± 2.08227.7 ± 13.416 ± 6.6676 ± 2.33
MVARPrevathon-2 20 ± 7.73312.3 ± 3.3
MVARUntreated17.3 ± 1.76427 ± 13.29.3 ± 2.2674 ± 1.25
Table 8. Mean ± SEM number 1st position fruit per plant on three within-season sample dates and at harvest in 2012.
VarietyInsecticide Commercial NameFruit/Plant
7 July 2012
Fruit/Plant
3 August 2012
Fruit/Plant
15 August 2012
Fruit/Plantat Harvest
20 October 2012
BBG2Karate-19.7 ± 0.249.7 ± 0.8226.5 ± 0.5772.7 ± 2.028
BBG2Karate-2 8.4 ± 0.3336 ± 1.856
BBG2Prevathon-19.5 ± 0.29111.9 ± 15.7 ± 3.184.1 ± 1.856
BBG2Prevathon-2 8 ± 1.2026.2 ± 0.882
BBG2Untreated8.9 ± 0.74211.3 ± 3.0556.8 ± 3.6063.4 ± 0.577
BCONVKarate-18.5 ± 0.46711.5 ± 1.7324.8 ± 1.4533.3 ± 0.882
BCONVKarate-2 3.2 ± 1.3333.3 ± 0.822
BCONVPrevathon-19.7 ± 0.88211.1 ± 1.1556.1 ± 3.183.2 ± 1
BCONVPrevathon-2 7.1 ± 1.5282 ± 1.667
BCONVUntreated9.1 ± 0.46711.7 ± 1.1551.2 ± 0.6671.9 ± 1
BVARKarate-18.2 + 0.211.3 ± 0.8826.4 ± 3.8442.3 ± 1.528
BVARKarate-2 4.6 ± 3.7122.6 ± 1
BVARPrevathon-110 ± 0.411.5 ± 0.8825.6 ± 2.8482.4 ± 1.732
BVARPrevathon-2 5.5 ± 1.6674.3 ± 2.848
BVARUntreated8.2 ± 0.612.3 ± 0.6674.1 ± 2.0281.3 ± 0.577
BWSKarate-19.3 ± 0.52110.7 ± 0.5776.8 ± 1.2024.6 ± 1
BWSKarate-2 5.9 ± 1.2023.7 ± 2.186
BWSPrevathon-111 ± 0.91711.1 ± 4.1776.9 ± 1.5282.8 ± 0.882
BWSPrevathon-2 5 ± 1.2023.1 ± 1.453
BWSUntreated8.5 ± 0.66711.9 ± 1.1554.3 ± 2.5172 ± 2.887
MBG2Karate-18.6 ± 0.411 ± 1.6674.3 ± 2.6462.3 ± 2.333
MBG2Karate-2 4.8 ± 1.4533.1 ± 1.528
MBG2Prevathon-18.8 ± 112.7 ± 2.4046.5 ± 3.2832.9 ± 3.18
MBG2Prevathon-2 8.1 ± 3.183.3 ± 0.577
MBG2Untreated7.9 ± 0.81112.8 ± 2.55.4 ± 2.3332.7 ± 1.764
MCONVKarate-19.6 ± 0.75711 ± 1.2023.7 ± 3.53.9 ± 1.155
MCONVKarate-2 4.7 ± 4.5833.7 ± 0.577
MCONVPrevathon-110.3 ± 0.26712.6 ± 2.4045.8 ± 3.2153.5 ± 2.082
MCONVPrevathon-2 9 ± 2.0823.6 ± 2.082
MCONVUntreated8.1 ± 0.111.3 ± 1.53.1 ± 5.0440.7 ± 0.333
MVARKarate-17.5 ± 0.40611.7 ± 0.5774.9 ± 3.4643.1 ± 2.728
MVARKarate-2 5.7 ± 3.934.8 ± 1
MVARPrevathon-110.1 ± 0.63613.4 ± 1.4536.7 ± 3.0552.3 ± 1.732
MVARPrevathon-2 7.7 ± 1.1553.3 ± 1.856
MVARUntreated8.7 ± 0.35313.2 ± 1.7322.3 ± 2.2.9631.3 ± 1
Table 9. Mean days after planting ± SEM of fruit initiation per surviving fruit and g of lint ± SEM harvested in 2011 box maps. Means not followed by a common letter indicate significant differences between treatments based on LSD at p < 0.05
Variety Insecticide Commercial NameAverage Days after PlantingAverage Lint Weight (g)
BBG2Coragen46.3 ± 0.883 a45.8 ± 0.892 ab
BBG2Karate41.7 ± 1.003 a–c41.2 ± 1.026 a–e
BBG2Untreated45 ± 1.06 a44.5 ± 1.265 a–c
BCONVCoragen38.5 ± 2.434 bc38.4 ± 2.662 c–e
BCONVKarate41.9 ± 1.971 ab41.3 ± 1.921 a–e
BCONVUntreated32.4 ± 0cd32.7 ± 0 ef
BVARCoragen38.5 ± 2.434 bc38.4 ± 2.662 c–e
BVARKarate41.9 ± 1.971 ab41.3 ± 1.921 a–e
BVARUntreated------
BWSCoragen46.6 ± 1.318 a46.2 ± 1.565 ab
BWSKarate42.4 ± 4.27 ab42.4 ± 3.522 a–d
BWSUntreated41.5 ± 1.583 a–c41.4 ± 0.942 a–e
MBG2Coragen37.8 ± 3.564 bc37.6 ± 3.755 de
MBG2Karate37.7 ± s.461 bc38 ± 2.133 c–e
MBG2Untreated40.7 ± 0.452 a–c40.2 ± 0.373 b–e
MCONVCoragen42.2 ± 1.249 ab41.6 ± 1.254 a–e
MCONVKarate42.9 ± 3.53 ab41.9 ± 3.504
MCONVUntreated27.2 ± 3.167 d27.2 ± 3.219
MVARCoragen47.2 ± 2.31846.9 ± 2.648
MVARKarate45.3 ± 0.455 a45.2 ± 0.293 ab
MVARUntreated------
Table 10. Average days after planting ± SEM of fruit initiation per surviving fruit and g of lint harvested in 2012 box maps.
VarietyInsecticide Commercial NameAverage Days after PlantingAverage Lint Weight (g)
BBG2Karate-138.7 ± 3.42537.8 ± 3.671
BBG2Karate-237 ± 137.4 ± 0.898
BBG2Prevathon-134.1 ± 3.12434.5 ± 3.43
BBG2Prevathon-232.8 ± 2.98632.5 ± 2.952
BBG2Untreated36.9 ± 1.79535.4 ± 0.849
BCONVKarate-133.7 ± 3.43333.5 ± 3.52
BCONVKarate-231.8 ± 0.55632 ± 0.655
BCONVPrevathon-131.8 ± 6.40731.5 ± 6.078
BCONVPrevathon-229.5 ± 5.37829.1 ± 5.115
BCONVUntreated43.1 ± 10.17642.6 ± 10.584
BVARKarate-139.3 ± 5.67738.6 ± 5.732
BVARKarate-235.9 ± 4.61935.2 ± 5.774
BVARPrevathon-135.6 ± 4.78635.1 ± 4.332
BVARPrevathon-233 ± 5.24132.5 ± 5.841
BVARUntreated32.4 ± 6.49633.1 ± 7.582
BWSKarate-132.3 ± 4.14931.9 ± 4.842
BWSKarate-239.1 ± 3.70339.8 ± 4.285
BWSPrevathon-130.2 ± 4.29429.9 ± 4.365
BWSPrevathon-230.8 ± 4.26430.9 ± 4.2
BWSUntreated28.9 ± 2.2428.7 ± 2.099
MBG2Karate-131.4 ± 1.61331.3 ± 1.784
MBG2Karate-233.8 ± 2.67133.9 ± 2.213
MBG2Prevathon-131.4 ± 2.65831 ± 1.909
MBG2Prevathon-232.1 ± 2.25831.9 ± 2.289
MBG2Untreated36.8 ± 5.75136.1 ± 5.937
MCONVKarate-145.2 ± 1.90744.3 ± 2.163
MCONVKarate-242.1 ± 5.99543.1 ± 7.114
MCONVPrevathon-139.6 ± 5.70139.3 ± 5.772
MCONVPrevathon-237.7 ± 5.80337 ± 5.167
MCONVUntreated26.1 ± 5.79826.4 ± 5.557
MVARKarate-136 ± 1.97135.7 ± 2.025
MVARKarate-240.2 ± 2.06339.3 ± 1.964
MVARPrevathon-145.5 ± 7.12845.7 ± 7.302
MVARPrevathon-237.2 ± 1.50336.4 ± 1.672
MVARUntreated37.4 ± 4.47538.3 ± 5.058
Table 11. Mean (SEM) total 1st position fruit per plant across untreated and insecticide-treated Bt and non-Bt cotton plots in 2011 and 2012 studies. Treatment means within an observation date that are followed by common letters do not differ significantly (p = 0.05, Tukey’s HSD Test). Treatment means within an observation date with no letters are not significant.
2011
13 July 201125 July 20111 August 20116 October 2011
(Harvest)
Untreated Bt6.8(0.318)10.1(0.346)7.9(0.784)3.5(0.982) ab
Insecticide Bt6.8(0.327)9.7(0.243)8.9(0.593)5.9(0.416) a
Untreated non Bt6.7(0.309)9.7(0.175)9.4(0.403)1.8(0.639) b
Insecticide non Bt6.7(0.332)9.6(0.26)8.2(0.403)5.4(0.409) a
2012
17 July 20123 August 201215 August 201220 October 2012
(Harvest)
Untreated Bt8.4(0.291)12(0.436)5.5(0.723) ab2.7(0.404) ab
Insecticide Bt9.5(0.348)11.2(0.42)6.4(0.385) a3.7(0.367) a
Untreated non Bt8.5(0.232)12.1(0.413)2.7(0.614) b1.3(0.245) b
Insecticide non Bt9.2(0.364)11.8(0.292)5.8(0.372) a3.2(0.192) a

