
Correlations between R, G, and B Values, Pigment Concentration, and Nitrogen Status in Three Ornamental Potted Plants


1
Agronomy Department of Superior School Engineering, University of Almeria, CIAIMBITAL, Agrifood Campus of International Excellence ceiA3, Ctra. Sacramento s/n, La Cañada de San Urbano, 04120 Almería, Spain
2
Faculty of Technical Education for Development, Catholic University of Santiago of Guayaquil, Av. C. J. Arosemena Km. 1.5, Guayaquil 09014671, Ecuador
*
Author to whom correspondence should be addressed.
†
The authors contributed equally to this work.
Agronomy 2023, 13(1), 177; https://doi.org/10.3390/agronomy13010177
Submission received: 23 October 2022
/
Revised: 31 December 2022
/
Accepted: 2 January 2023
/
Published: 5 January 2023
(This article belongs to the Section Horticultural and Floricultural Crops)
Abstract
:Image technologies have been used for real-time estimation of nitrogen (N) and leaf chlorophyll (Chl) concentrations as well as for photosynthetic properties. The aim of this work was to establish correlations between RGB values and chlorophyll and nitrogen concentrations in three ornamental potted plants. We evaluated the RGB values, nitrogen status, and chlorophyll concentrations in the leaves of Peperomia obtusifolia, Maytenus senegalensis, and Rosmarinus officinalis. The correlation between the RGB values and the chlorophyll and nitrogen concentrations in the leaves was different for each species, since baby rubber correlated with the R and G values, the confetti tree correlated with the G and B values, and rosemary correlated with the R, G, and B values. The correlation between the normalized RGB (rgb) values and the color parameters and the chlorophyll and nitrogen concentrations showed R2 values lower than 0.70 in all species. Moreover, the estimation of vegetation indices was not effective due to the lack of correlations between these indices and the chlorophyll and nitrogen concentrations in the leaves of each species. According to the findings, rosemary exhibited the best association between the RGB values and chlorophyll and nitrogen concentrations in the leaves.
1. Introduction
Photosynthesis is the essential process for plant growth, producing oxygen, and organic material [1]. Chlorophyll (Chl) a and b are responsible for harvesting light and the conversion of light energy to stored chemical energy [2]. The amount of solar radiation absorbed by a leaf is a function of photosynthetic pigment concentration. Hence, chlorophyll concentration is directly linked to the photosynthetic potential of a plant and to its primary production capacity [3]. In addition, nitrogen is a necessary constituent of chlorophyll and many other proteins associated with leaf color, plant vigor, yield, and quality [4].
Close relationships have been reported between leaf chlorophyll and nitrogen concentrations in a number of crops such as barley [5], rice [6], and wheat [7]. Traditional measurements of chlorophyll concentration have involved spectrophotometric measures of chlorophyll in acetone [8] or ethanol [9]. Determination of nitrogen concentration is usually through the Kjeldahl method [10]. These methodologies are direct and accurate, but are laborious, time-consuming, and destructive to leaves [11]; therefore, the use of non-destructive techniques could be a useful tool because they are rapid and less expensive but are generally less accurate [12].
In a recent review, leaf color charts, SPAD meters, and other digital chlorophyll meters such as the Hydro N tester and digital imaging (RGB) have been reported as adequate methodologies to establish relationships between N and chlorophyll concentrations in crops [13]. This experiment was focused on the use of digital imaging (RGB).
Multi-spectral imaging technologies, used in satellites and drones, have provided novel methods for research in the agricultural sector [14,15]. Nevertheless, using the images from these devices requires several preprocessing steps and applying various algorithms which are often complex [16,17]. Out of the multi-spectral bands, the information provided by the red, green, and blue bands may suffice for conducting many studies. RGB (red–green–blue)-based image analysis has been applied in agriculture for various purposes such as weed identification [18], quantification of turf grass color [19], and quantitative analysis of variable physiological processes across leaf surfaces [20]. This methodology has also been used to estimate chlorophyll concentration and nitrogen status in crops [21]. Moreover, this is an instantaneous in situ measurement and is easily applicable for the cultivation of ornamental plants.
The economic importance of the production of potted plants, which has seen an increase on the south-eastern coast of Spain in recent years, indicates that it would be beneficial to develop a quick, non-destructive estimation of chlorophyll concentration and nitrogen status in order to better match fertilizer nitrogen applications with actual plant demand. Currently, local growers use visual color estimation to manage nitrogen fertigation resulting in a more intuitive than accurate N supply. Nevertheless, this estimation allows for correlation of the aesthetic value of ornamental plants via color (RGB) with the nitrogen and chlorophyll concentration in leaf, thus allowing for a more precise N supply. There are also no reference values regarding these relationships for the plants that were studied; therefore, the aim of this work was to establish correlations between the RGB values and chlorophyll and nitrogen concentrations in leaves in three ornamental potted plants.
2. Materials and Methods
2.1. Plant Material and Experimental Site
Data were collected from three different experiments. Three species, baby rubber (Peperomia obtusifolia L.), confetti tree (Maythenus senegalensis Lam. Exell), and rosemary (Rosmarinus officinalis L.), were chosen because of their importance in the Mediterranean region ornamental trade [22,23,24]. Rooted cuttings (plants) of baby rubber (average height: 35 cm), confetti tree (average height: 36 cm), and rosemary (average height: 20 cm) were obtained from a local nursery and transplanted into 1.5 L polyethylene containers with a mixture of sphagnum peat moss and Perlite 80:20 (v/v). The cultivation cycles of each species were the following: the baby rubber was grown for one year (June 2005 to June 2006), the confetti tree was grown for eight weeks (11 February to 5 April 2013), and the rosemary was grown for nine weeks (25 February to 6 May 2014) following the recommendations of local growers. All of the species were fertigated with a standard nutrient solution reported by Jimenez and Caballero [25] for the adequate growth of ornamental plants in the Mediterranean region. The solution contained (in mg L–1): 22 phosphorus (P), 84 nitrogen (N), 64 sulphur (S), 117 potassium (K+), 80 calcium (Ca2+), and 34 magnesium (Mg2+). Every day, 70 mL (45% of the container capacity) was added manually during the experimental growing period. The microclimatic conditions inside the greenhouse for the experimental period of each species were the following: baby rubber plants (average temperatures of 25 ± 4 °C and 65 ± 4% relative humidity RH), confetti tree plants (average temperatures of 17 ± 2 °C and 66 ± 4% RH) and rosemary plants (average temperatures of 20 ± 2 °C and 64 ± 4% RH).
2.2. Image Acquisition and Processing
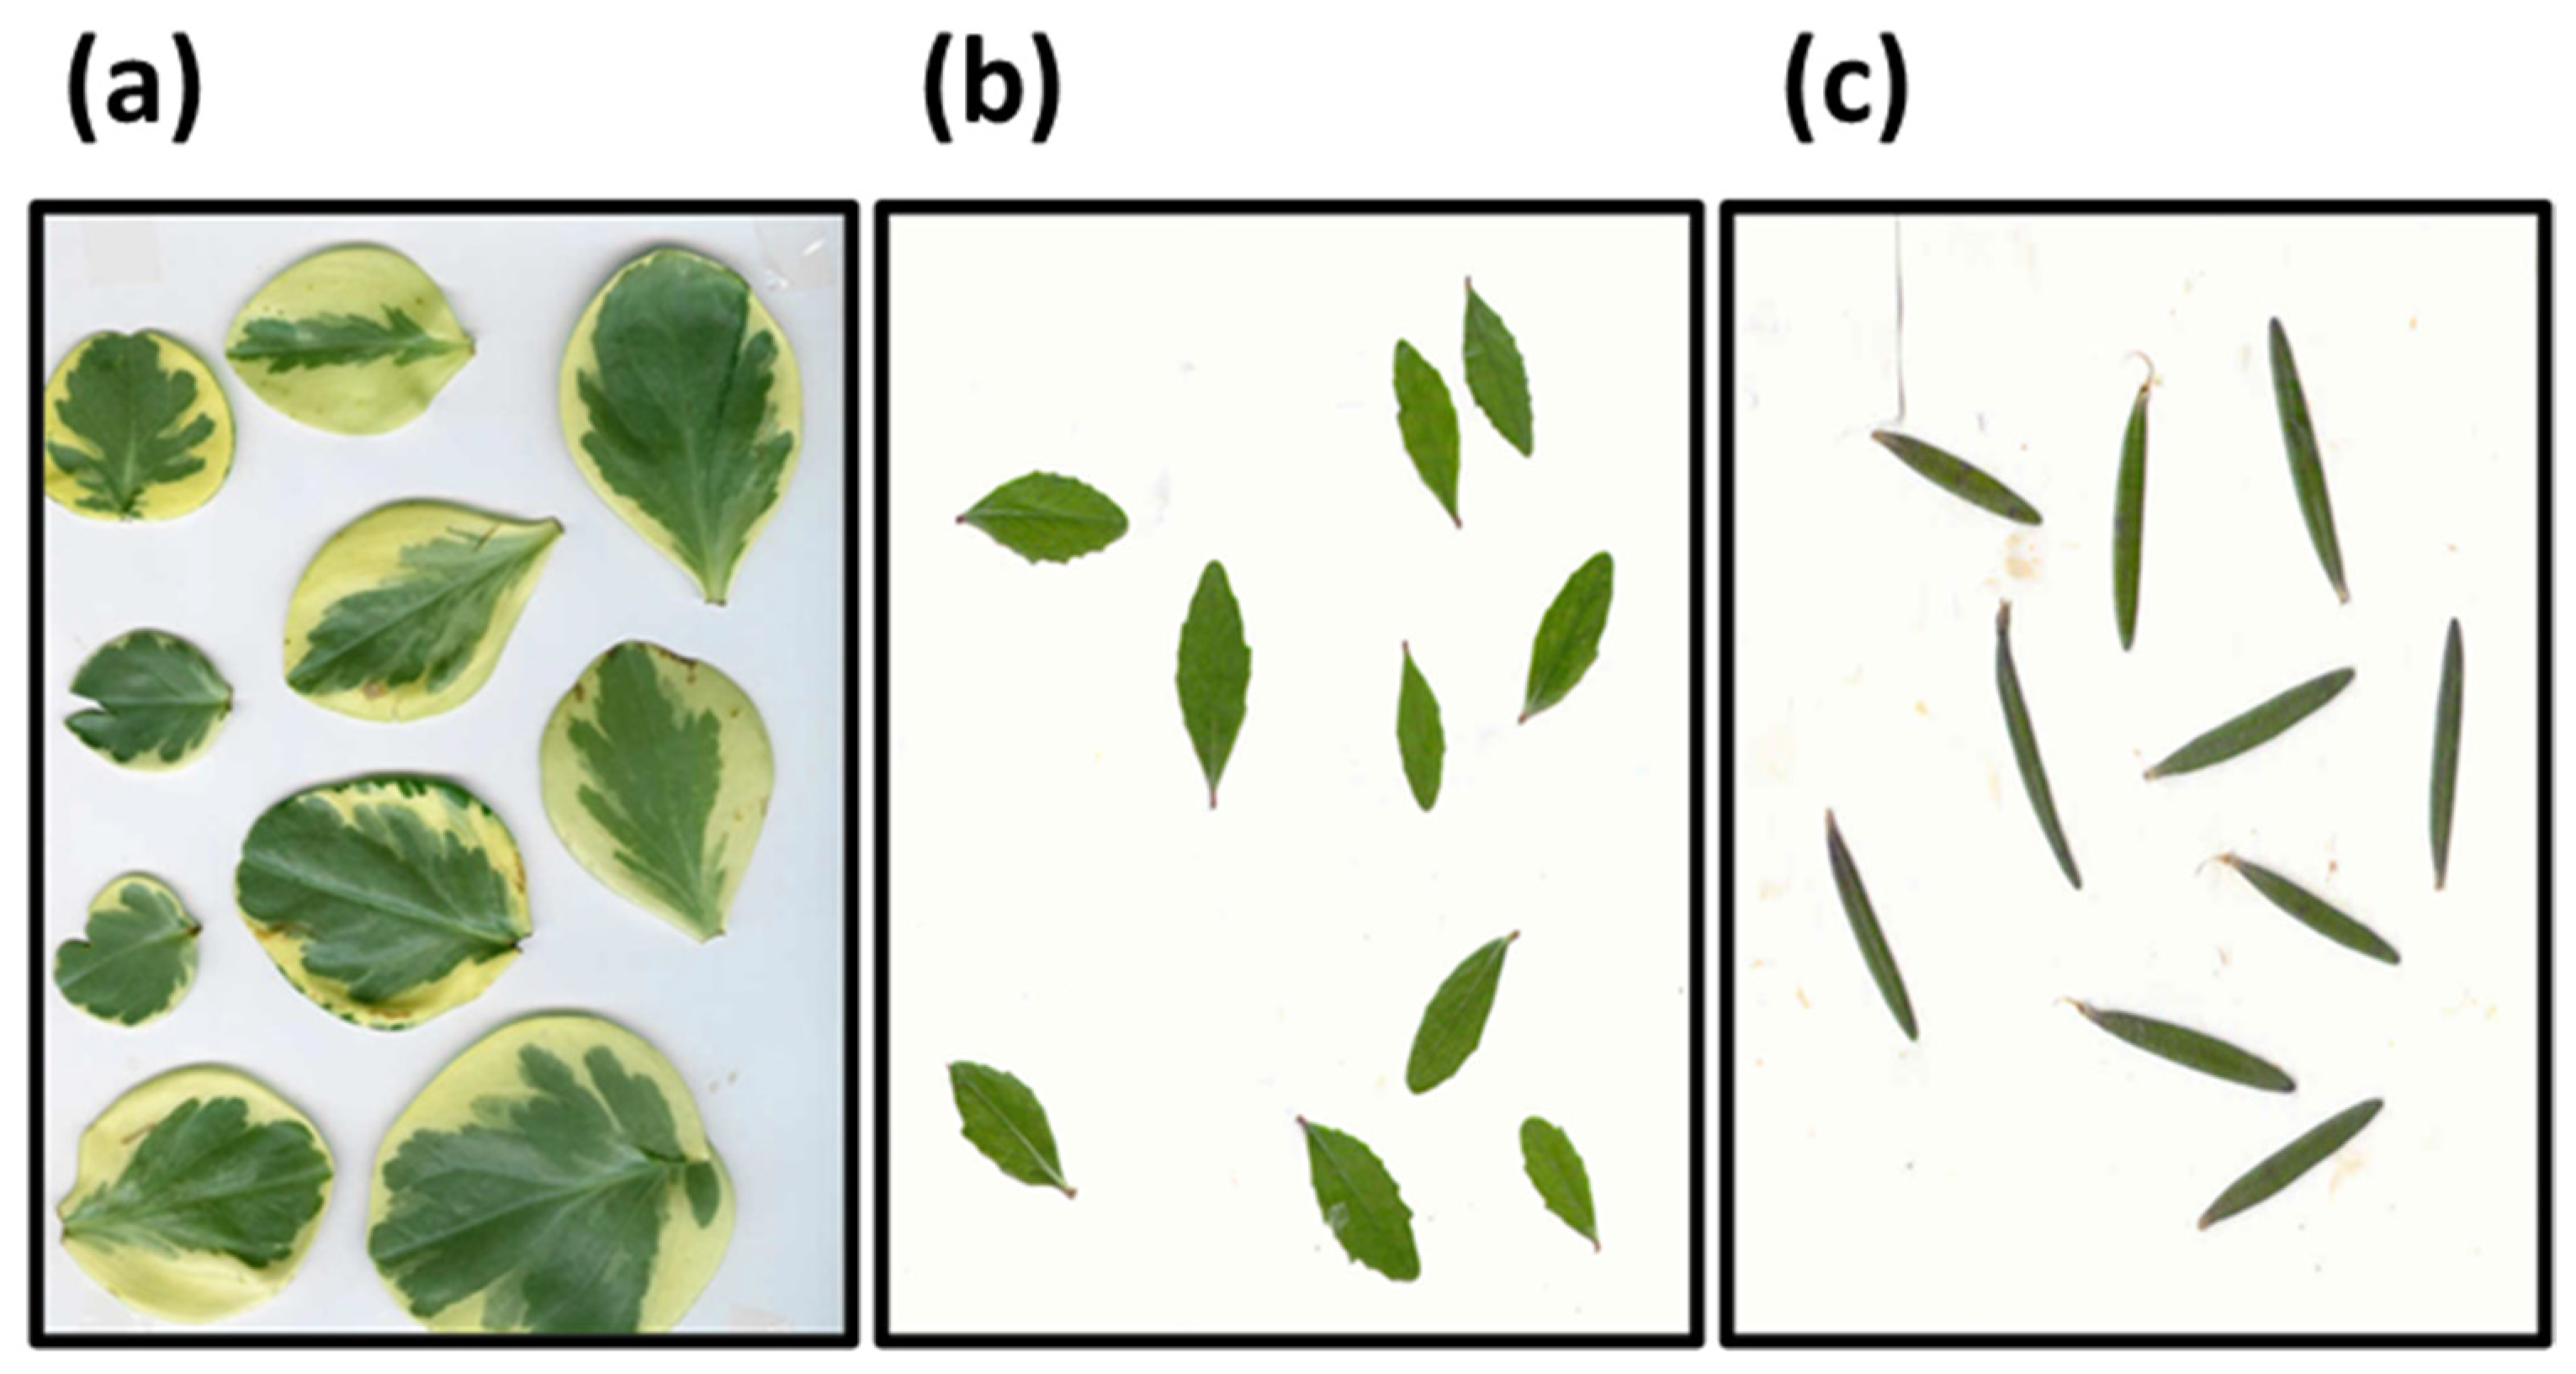
The youngest fully expanded leaves (10 leaves per plant and 12 randomly plants per species) were excised in order to reduce the possible variability between the leaf samples linked to environmental factors. Fully expanded leaves after collection in each plant were immediately scanned to reduce the timing period between samples’ collection in order to avoid the deterioration of the leaves, the closure of stomata, or the loss of leaf turgidity. Scanning of the leaves was carried out with the most recent scanner models in each experimental period. The leaves of baby rubber were scanned on a HP scan jet scanner (2200c; HP enterprise; Palo Alto, CA, USA) and the leaves of the other two species were scanned on a HP scan jet scanner (G2410; HP enterprise; Palo Alto, CA, USA) with a 300 pixels per inch (ppi) resolution, 24 bits color depth, and a constant luminosity. Image acquisition at constant luminosity ruled out the possibility of false signals. The reference area was the whole leaf without petiole in each sample (Figure 1). Digitized images of 120 leaves per species were stored as Adobe Photoshop (*.psd) files.
Digital leaf images were processed with Adobe Photoshop CS6 (Adobe System Software, Dublin, Ireland) to obtain a color histogram. From the histogram, the brightness of primary colors red (R), green (G), and blue (B) was recorded. The brightness ratio of normalized values (rgb) was calculated using the following Equations (1)–(3) proposed by Yadav, et al. [26].
r = R/(R + G + B)
g = G/(R + G + B)
b = B/(R + G + B)
2.3. Calculation of Vegetation Indices
The following combination indices green minus red (GMR) and green divided by red (GDR) and the vegetation index (VI) were also calculated based on Vesali et al. [27] (Equations (4)–(6)), where R, and G denote the average values of red and green in each contact image, respectively.
GMR = G − R
GDR = G/R
VI = (G − R)/(G + R)
2.4. Determination of Chlorophyll Concentration
After obtaining the images, a 1.2 cm-diameter leaf punch was used to cut leaf disks from four fully expanded leaves from each of the four replicate plants per species. The samples were placed in test tubes and wrapped in aluminum foil to protect against light degradation. Extraction of Chl a and b was performed by submerging 0.1 g of fresh leaves in 5 mL of methanol at room temperature (15 °C) for 24 h. The supernatant was removed, and the photosynthetic pigment concentrations were determined colorimetrically at their respective wavelengths in a spectrophotometer (Shimadzu UV-1201; Columbia, MD, USA): Chl a (λ = 666 nm) and Chl b (λ = 653 nm) following the methodology reported by Wellburn [28].
2.5. Determination of Nitrogen Status
Chemical analyses were performed on the same leaves that had been used for the chlorophyll concentration described above. The remaining leaves, after punches were taken, were oven-dried at 60 °C until they reached a constant weight and then they were milled (Grindomix GM 200, Retsch Gmbh, Haan, Germany), with the mill being cleaned between samples. The samples were then divided into two subsamples. One subsample was used to analyze the nitrate (NO3) concentration using water extraction and HPLC as described by Csáky and Martínez-Grau [29]. The other subsample was mineralized with 96% sulfuric acid (H2SO4) in the presence of P-free hydrogen peroxide (H2O2, 30% (w/v)) at 300 °C and it was used for the determination of organic N [30] concentration. The total N concentration was calculated as the sum of the organic N and NO3− concentration.
2.6. Statistical Analysis
Regression analyses were performed to find the relationship between the RGB values, vegetation indices, pigment concentration, and nitrogen status in the leaves in each species. The correlation (r) and determination (R2) coefficients were computed (p < 0.05) to measure the strength of the relationship between these variables. All of the statistical analyses were performed using Statgraphics Plus for Windows (version 5.1; Statpoint Technologies, Warrenton, VA, USA).
3. Results
3.1. Ranges of RGB Values in the Different Species Studied
The range of RGB values recorded in the different species are shown in Table 1. Peperomia obtusifolia showed R, G, and B values ranging from 95.01 to 81.22, 123.32 to 114.09, and 73.56 and 63.94; respectively. Maytenus senegalensis showed R, G, and B values ranging from 91.92 to 87.85, 123.65 to 108.38, and 44.46 to 34.48, respectively. Rosmarinus officinalis showed R, G, and B values ranging from 105.90 to 90.70, 111.60 to 100.45, and 72.20 to 61.50, respectively.
3.2. Correlations of RGB Values, Vegetation Indices, Pigment Concentration, and Nitrogen Status in Baby Rubber Plants
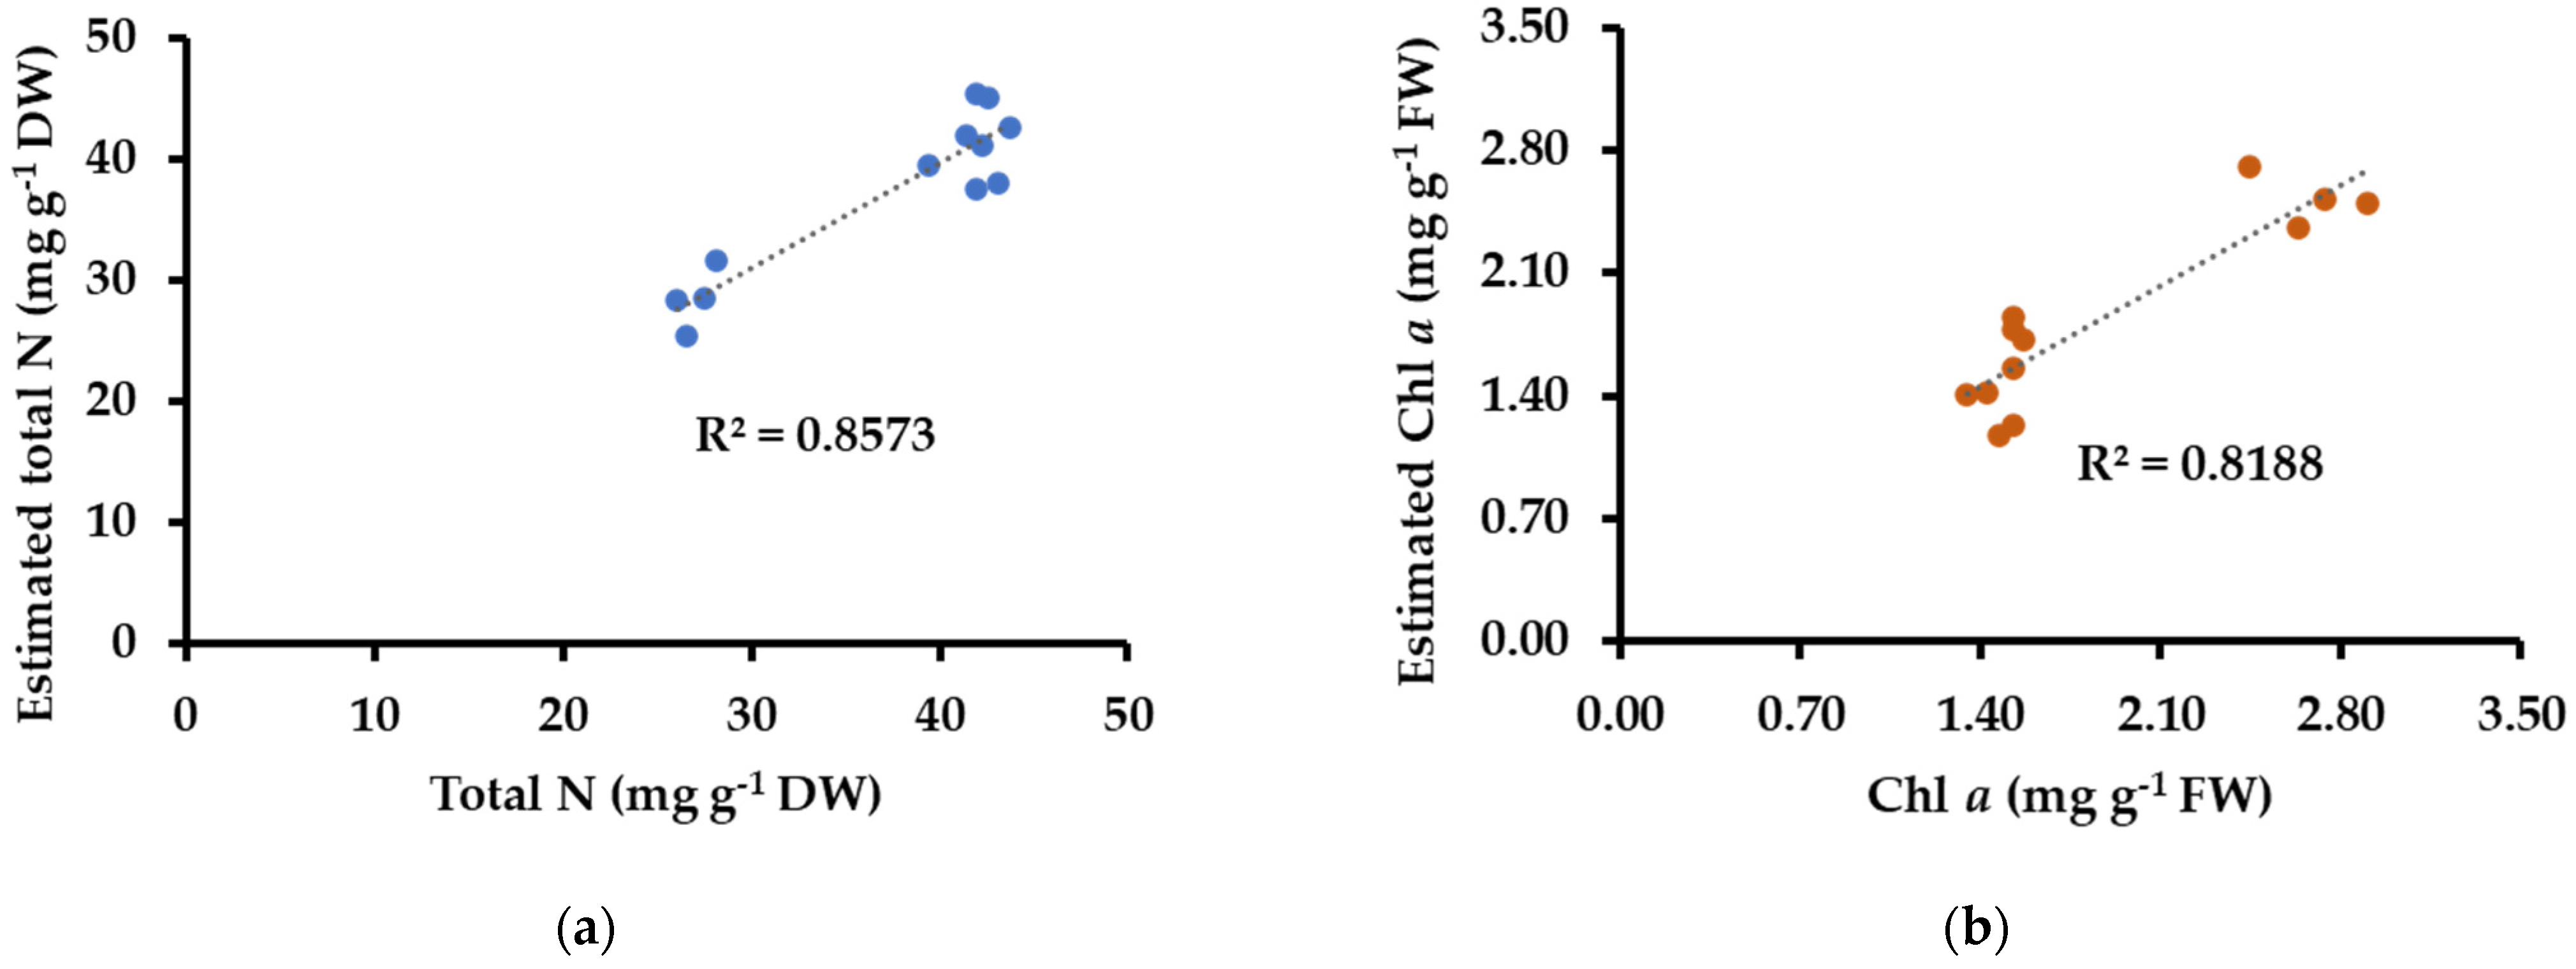
The total N concentration showed a positive correlation with R, G, r values, and VI and a negative correlation with GMR and GDR indices (with R2 values higher than 0.69). On the other hand, Chl a, Chl b, and Chl a + b had a positive correlation with the vegetation indices (GMR, GDR, and VI, respectively) and a negative correlation with R, G, and r values. The B, g, and b values were not well correlated with the total N and chlorophyll concentrations (Table 2. The values of R and G were strongly correlated (R2~0.80) with total N, Chl a, Chl b, and Chl a + b in the determined equations (Table 3 and Figure 2).
3.3. Correlations of RGB Values, Vegetation Indices, Pigment Concentration, and Nitrogen Status in Confetti Tree Plants
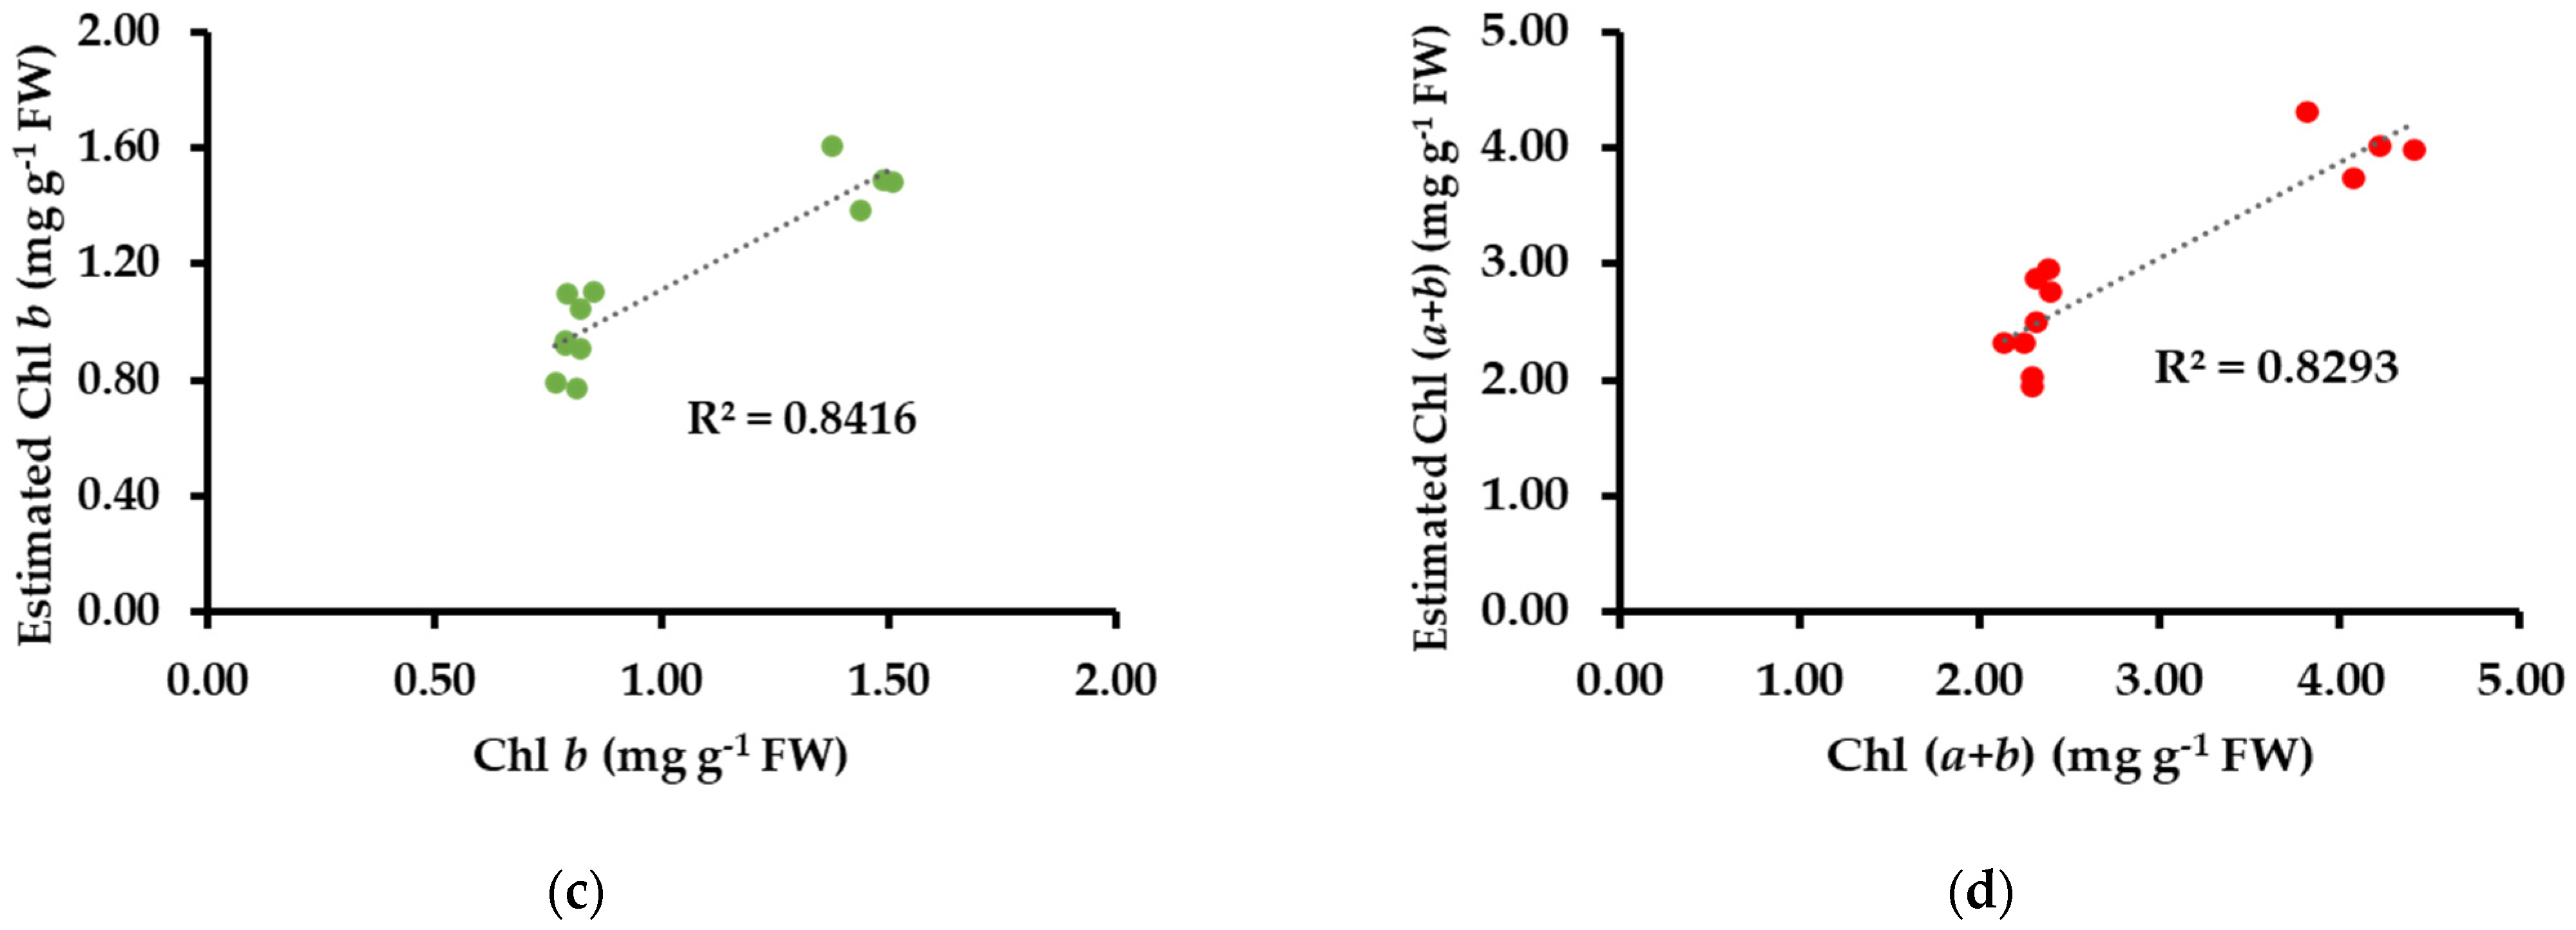
The total N concentration correlated positively with B and b values (r= 0.86 and 0.89, respectively) and negatively with G, g, GMR, GDR, and VI. The concentration of Chl a was not correlated with the vegetation indices (GMR, GDR, and VI), but it showed a positive correlation with the R, G, and g values and a negative correlation with the B and b values. Similarly, the Chl b and Chl a + b concentrations were negatively correlated with the B and b values, but they were positively correlated with R, G, g, and the vegetation indices (GMR, GDR, and VI, respectively) (Table 4). The values of G and B were correlated with total N and Chl b with R2 values around 0.70, while the a + b concentrations showed a correlation of R2= 0.55 with the Chl a concentration in the determined equations (Table 5 and Figure 3).
3.4. Correlations of RGB Values, Vegetation Indices, Pigment Concentration, and Nitrogen Status in Rosemary Plants
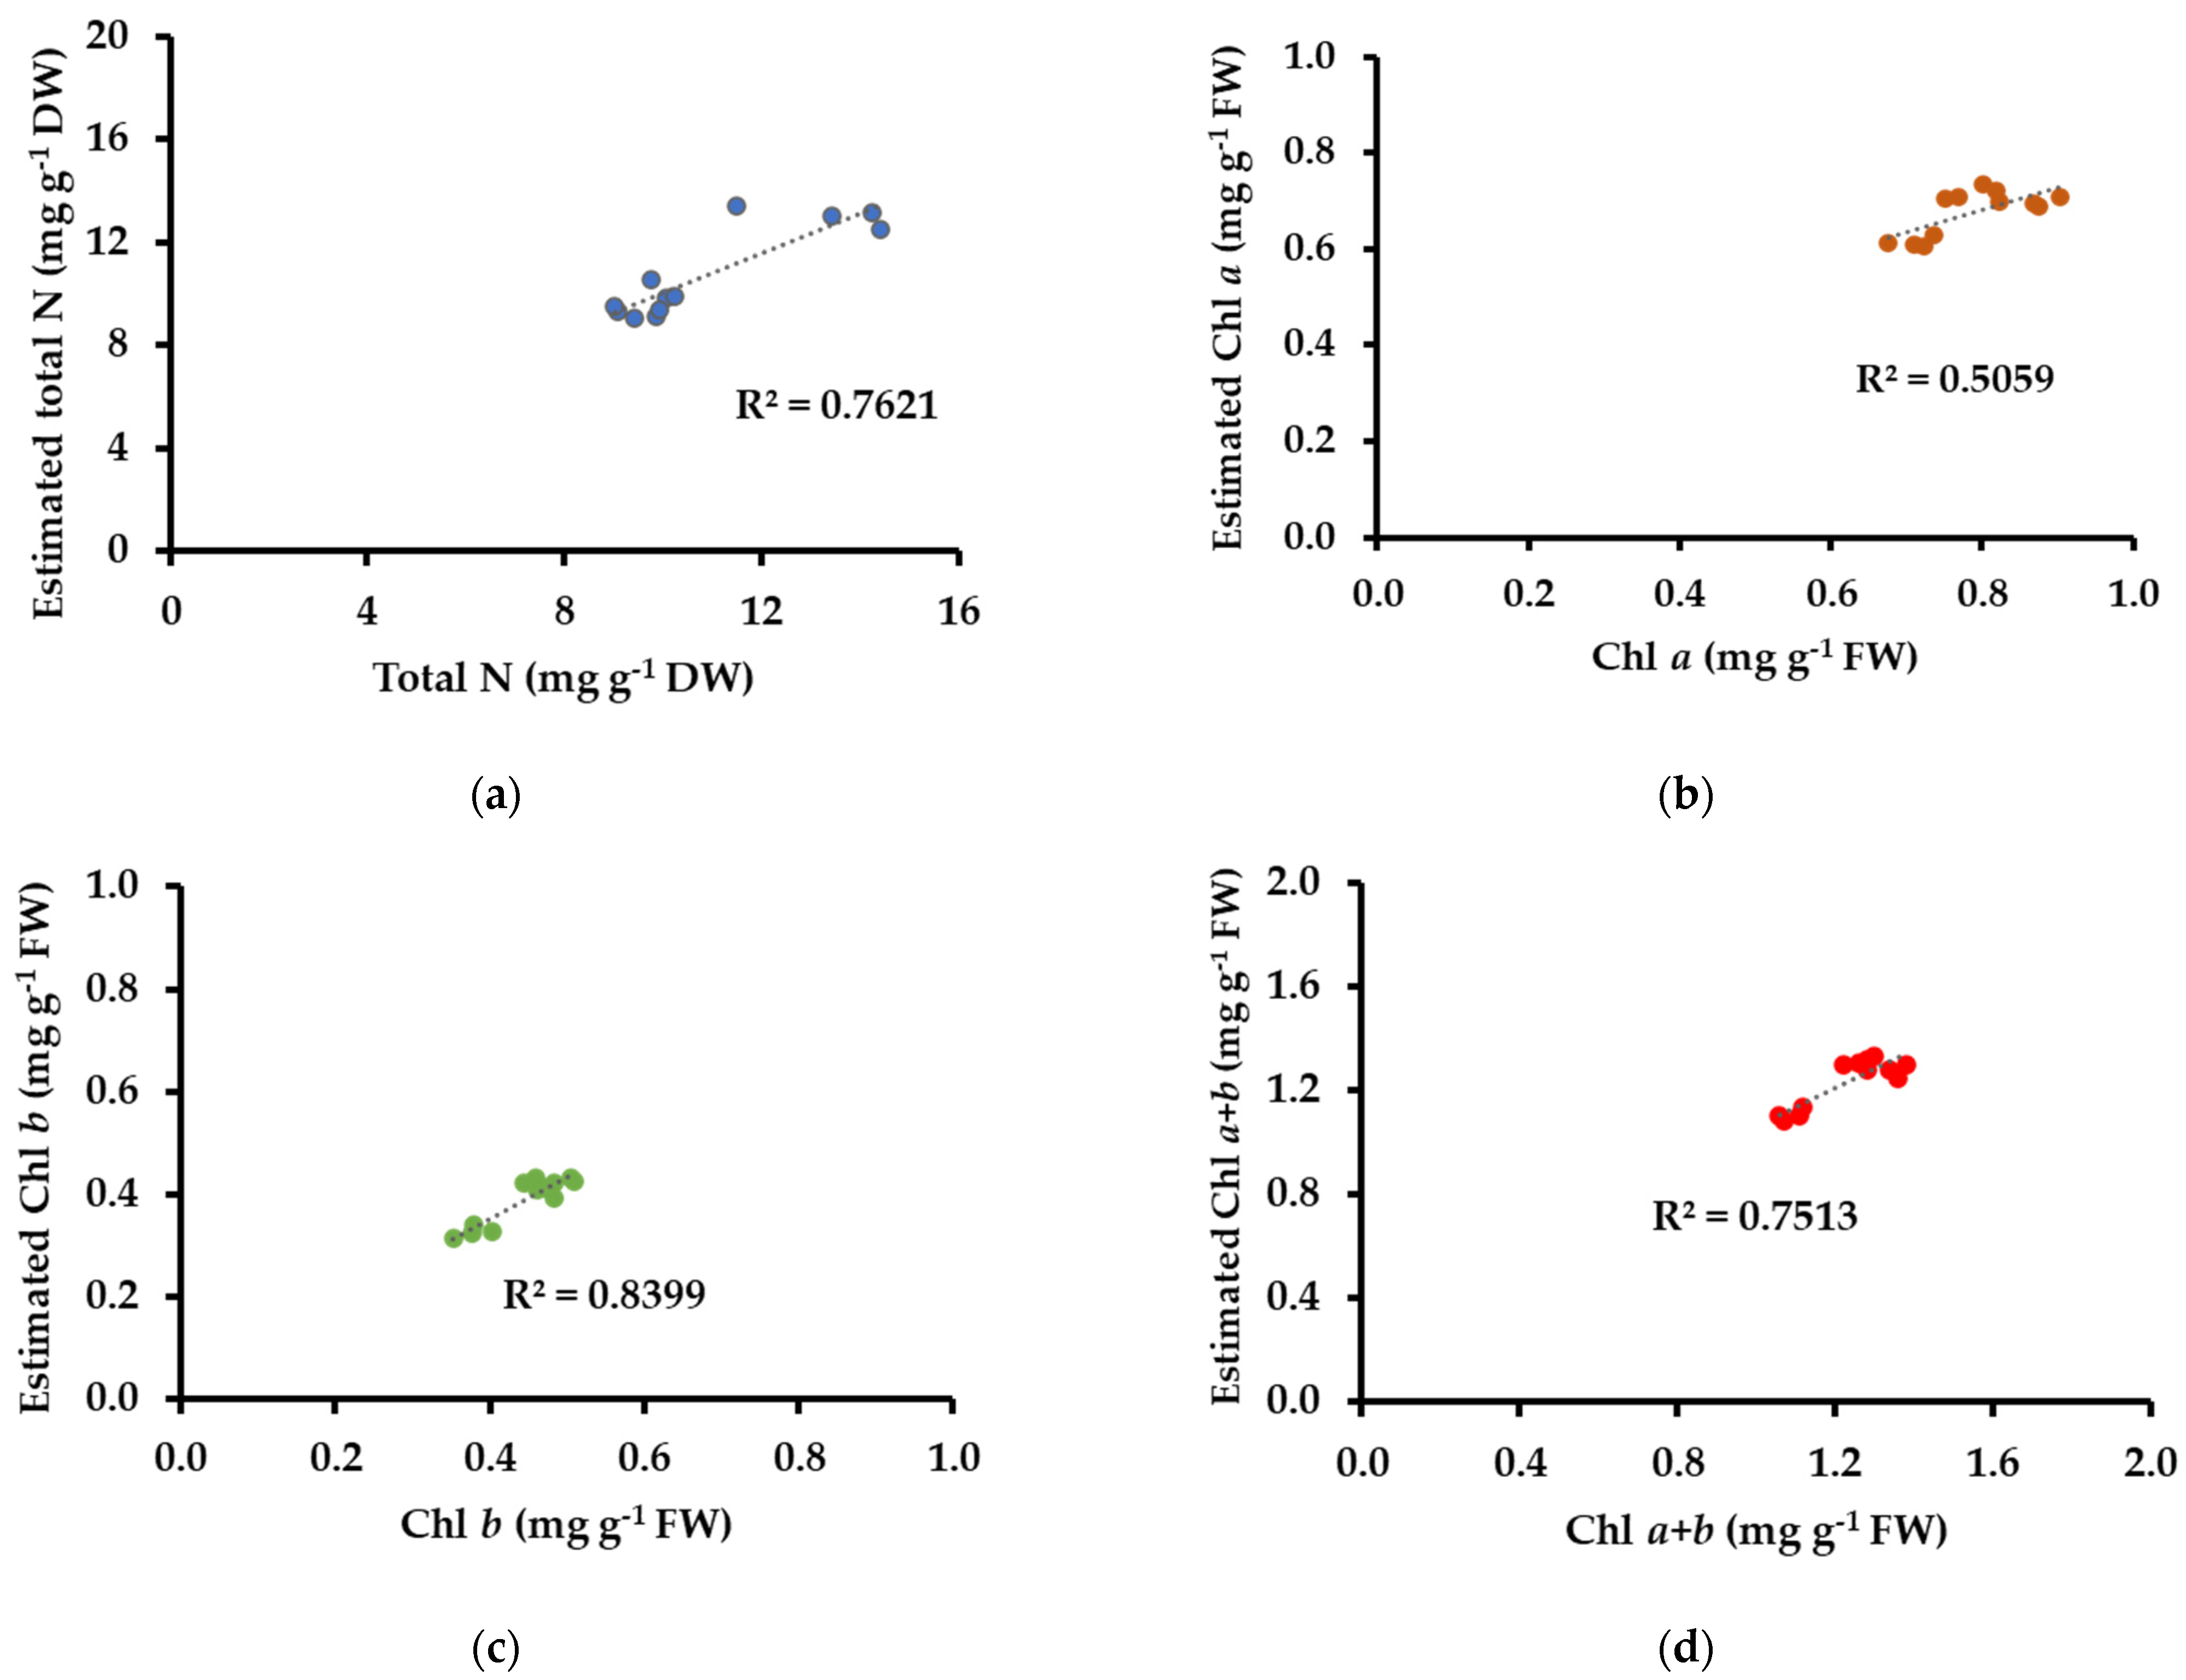
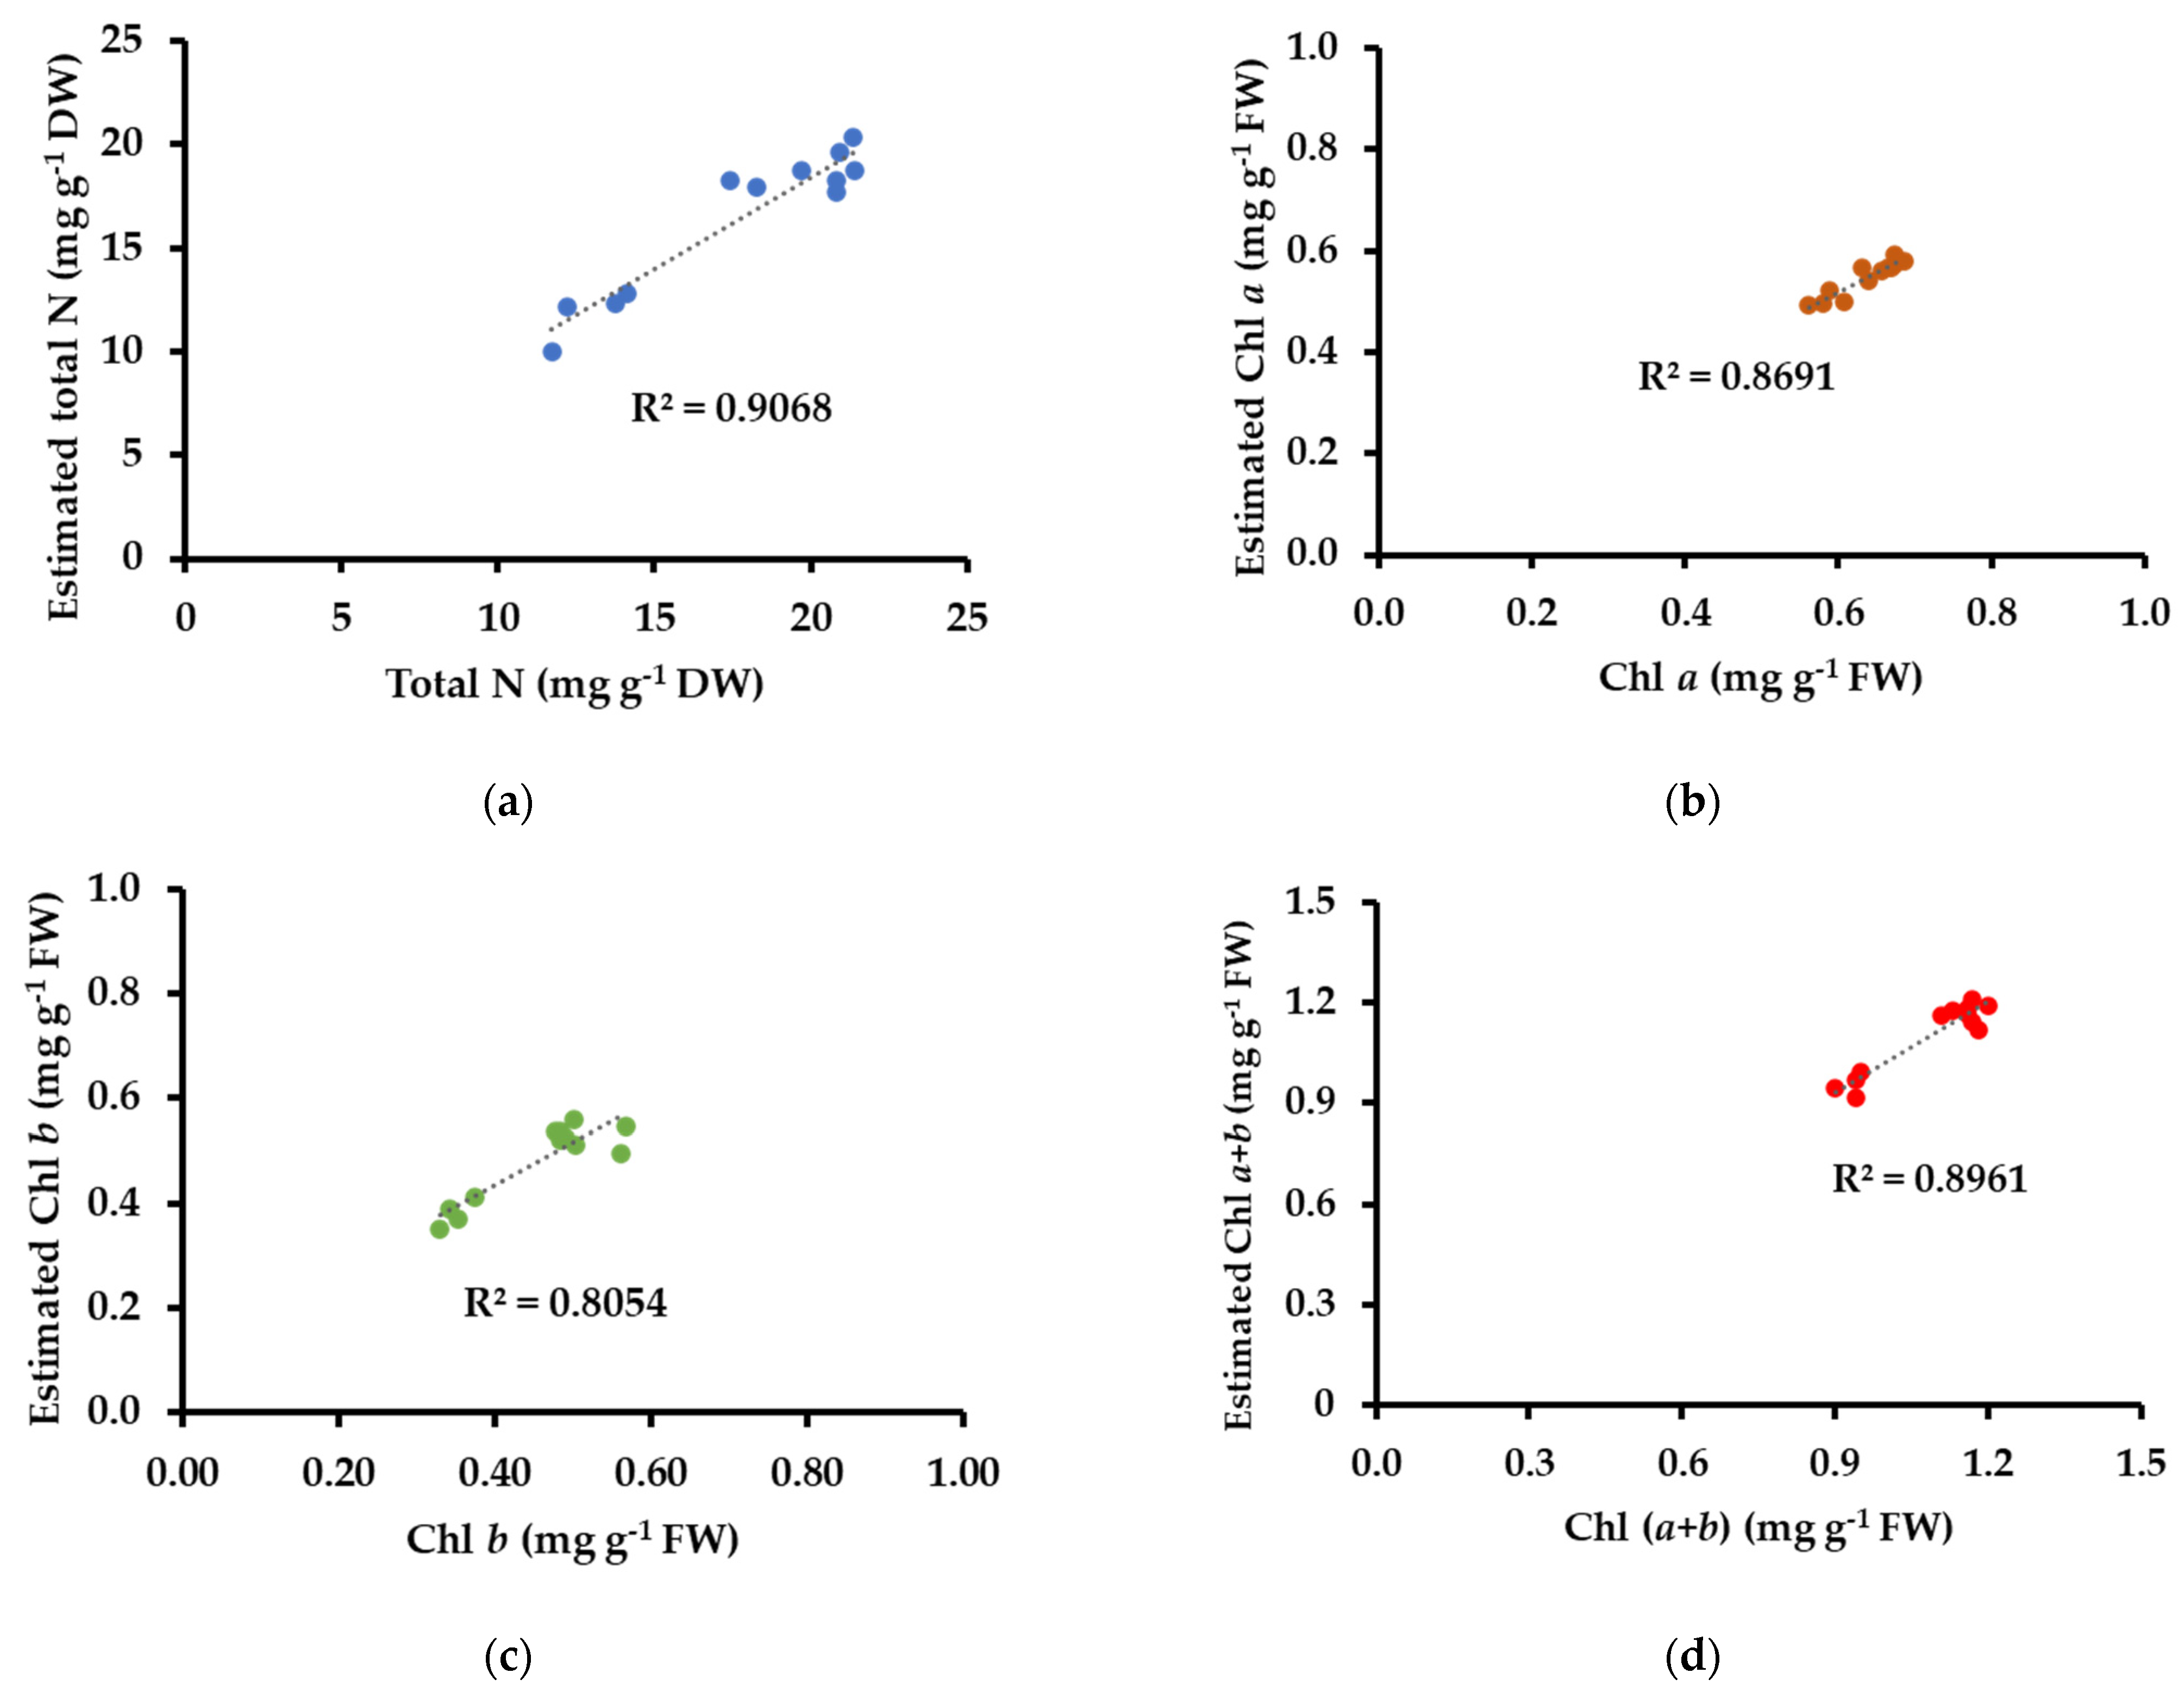
The total N, Chl a, Chl b, and Chl a + b concentrations correlated positively with the R, G, and B values and they correlated negatively with thw g values. In addition, no correlations were found between the total N, Chl a, Chl b, and Chl a + b concentrations and r and b values or with the vegetation indices (GMR, GDR, and VI, respectively) (Table 6). The values of R, G, and B showed a positive correlation (R2;~0.90) with the total N, Chl a, Chl b, and Chl a + b in the determined equations (Table 7 and Figure 4).
4. Discussion
The relationships between the R, G, and B values with nitrogen and chlorophyll concentrations showed a number of species-specific trends. Baby rubber plants showed a positive correlation between the R and G values and nitrogen concentration and a negative correlation with chlorophyll concentration. The direct correlation between the R and G values and nitrogen concentration in our experiment disagrees with the results reported by Vibhute and Bodhe [31] who found an inverse correlation (r values around −0.68) between these parameters in a vineyard in India. With respect to the correlation between the R and G values and chlorophyll concentration, in an experiment conducted on micropropagated potato plants grown in vitro with a medium of sucrose and agar, Yadav et al. [26] reported that R and G were negatively correlated with the chlorophyll concentration measured by SPAD with an R2 of 0.74 and 0.77, respectively. It is possible that the results reported here are due to a more stable light intensity compared to the measurements taken outside, where ambient light may affect the readings as reported Yuzhu et al. [32].
The confetti tree showed different trends according to the RGB values studied. There were positive correlations for R and G values with chlorophyll concentration in this species, while the B values showed a negative correlation. Similarly, the R and G values have shown a positive correlation with chlorophyll concentration in an experiment conducted on Betel vine (Piper betle), where the RGB values were measured via a scanner, and the chlorophyll concentrations were measured using a non-invasive approach (atLEAF meter) [33]. The negative correlation between B and chlorophyll concentration in confetti tree plants was not in line with the findings reported by Rigon et al. [34] who found a direct relationship between the B values and the chlorophyll concentration in the leaves of soybean. With respect to the relationship between the RGB values and the nitrogen concentration, the values of G in the confetti tree showed a negative correlation and the values of B showed a positive correlation. Different results were reported by other researchers such as Auearunyawat et al. [35] who established a direct correlation between the G values and N concentration in sugarcane leaves and Mercado-Luna et al. [36] who developed a method of taking images of tomato leaves grown in a greenhouse showing an inverse correlation between B values and N concentration. These opposite results between the G and B values with N concentration in our experiment could be due to image processing calibration errors as reported by Bielinis et al. [37].
Rosemary plants presented a positive correlation between RGB values and nitrogen and chlorophyll concentrations. The direct correlation between the chlorophyll concentration measured with a chlorophyll meter and the values of RGB obtained through image processing (RGB values) has been reported in some crops such as betel vine (Piper betle) [38] and Eucalyptus dunii [39]. The relationship between the N concentration and RGB values showed a positive correlation in rosemary (R2~0.90), which agreed with the results obtained by Rorie et al. [40] who also reported a positive correlation between both factors (R2~0.80) in sweet corn growing in containers supplied with a mixture of vermiculite, perlite, and peat moss. The results obtained in the rosemary plants in this experiment indicate the feasibility of using digital images as an adequate tool to determine the nitrogen and photosynthetic status of these species.
As far as normalized values of RGB (rgb) are concerned, there were different trends according to the species studied. The performance of RGB to rgb in all species in our experiment reduced the correlation with chlorophyll and N concentrations. On the contrary, Yadav et al. [26] reported a better correlation between the normalized values of RGB (rgb) and chlorophyll concentration in micropropagated potato plants. Different trends of rgb values with chlorophyll concentration between species may be related to the nonuniform distribution of chlorophyll in leaves as an effect of the clustered structural organization of chlorophyll molecules in chloroplasts, chloroplasts in cells, and cells in leaves [41]. Different trends of rgb values with N concentration between the species may be related to the different values of nitrogen concentration in the leaves of each species.
Baby rubber plants showed a positive correlation between r and nitrogen concentration and a negative correlation with pigment concentration, while g and b showed no relationship. The direct correlation between the r values and the N concentration in baby rubber plants was in line with the findings reported by Tewari et al. [42] who reported the same trend in rice. On the other hand, Hu et al. [43] reported an inverse correlation between the r values and the chlorophyll concentration in barley cultivars, which was similar to the results for baby rubber plants reported here.
The confetti tree plants only correlated with the g and b values. With respect to g, there was a negative correlation with nitrogen concentration and a positive correlation with pigment concentration. In the case of b values, the trend was the opposite. This relationship between the g and b values and nitrogen concentration was also reported by Treder et al. [44] who conducted an experiment with two-year-old ‘Ligol’ apple trees (Malus domestica Borkh.) grown in 12 L containers filled with a 3:1 mixture of peat and coconut. They determined that there was an inverse correlation between the g values and N concentration and a direct correlation between the b values and N concentration. With respect to the relationship between the g and b values and the pigment concentrations, our results in confetti tree plants disagree with the findings of Gupta et al. [45] and Hu et al. [43] who reported an inverse correlation between the g values and chlorophyll concentration and a direct correlation between the b values and chlorophyll concentration in micropropagated potato plants and barley cultivars, respectively.
The rosemary plants were negatively correlated for the g values and nitrogen and pigment concentrations. Similarly, in an experiment conducted on pepper plants, Yuzhu et al. [32] investigated the relationship between nitrogen status and color images (RGB values) and reported that the normalized value of g showed a negative correlation with nitrogen concentration. The inverse correlation between the chlorophyll concentration and the g values was also reported in an experiment conducted on potato plantlets regenerated in vitro from nodal cuttings grown in a medium with sucrose and agar [45].
Concerning the vegetation indices (GMR and GDR), the baby rubber and confetti tree plants showed a negative correlation between both of the parameters and the N concentration and a positive correlation with the pigment concentration, while for the rosemary plants, there was no relationship between these parameters.
The negative correlation between the vegetation indices (GMR and GDR) and the nitrogen concentration was not in line with the findings of other researchers. For instance, Wang et al. [21] reported a direct correlation between GDR and N concentration and no relationship between GMR and N concentration in rice. In an experiment also conducted on rice, Saberioon et al. [46] determined no clear correlation between GDR and GMR with the N concentration in the leaves.
The positive correlation between the vegetation indices (GMR and GDR) and the pigment concentration has also been reported by other researchers. Adamsen et al. [47] observed a direct correlation between GDR and SPAD values, and GDR efficiently responded to the changes in leaf chlorophyll concentrations. Moreover, Ali et al. [13] also established that GDR was positively correlated with chlorophyll concentration in tomato and lettuce plants. Finally, Vesali et al. [27] reported a direct correlation between chlorophyll concentrations and GMR in corn leaves.
With respect to VI, the baby rubber and confetti tree plants showed a positive correlation with pigment concentrations, but for nitrogen concentration, there were two trends: a positive correlation for baby rubber plants and a negative correlation for confetti tree plants. The direct correlation between VI and pigment concentration agreed with the results obtained by Wang et al. [48] who reported the same trend in rice. On the other hand, the lack of correlation in VI green in rosemary plants agreed with the conclusion reported by Rigon et al. [34] explaining that the lower values of the VI green index could be due to this index mainly being used for images taken above the vegetation covering multiple plants and not being used in studies with individual plants.
5. Conclusions
The feasibility of the use of image analysis to determine the nitrogen and pigment status of plants was found to be species-dependent. Baby rubber plants only correlated well with the R and G values, the confetti tree was well correlated with the G and B values, and the rosemary was correlated positively with the R, G, and B values. The use of normalized values of RGB resulted in a lower correlation with nitrogen and chlorophyll concentrations in all of the species. Vegetation indices only showed a close relationship with chlorophyll concentration in rubber and confetti tree plants because for the nitrogen concentration, this relationship was variable depending on the species studied. The results from this study suggest that image analysis can be a useful tool for estimation of nitrogen or chlorophyll concentrations in the species that were tested, with it being necessary to point out that these determinations are only repeatable in experiments carried out with the same species under the same agronomic conditions. This implies the needed to calibrate the models according to the specific crop system and varieties. To conclude, we suggest using the same scanner and the most updated model to obtain digitized images and reducing in this way the possible uncertainties related to the use of different models of scanners in the applied methodology.
Author Contributions
Conceptualization, methodology, and supervision, M.T.L.; formal analysis, writing—review and editing, and original draft preparation: A.L.; writing—review and editing, visualization, and validation, P.G.-C. All authors have read and agreed to the published version of the manuscript.
Funding
This research received no external funding.
Conflicts of Interest
The authors declare no conflict of interest.
References
- Nowaczyk, M.M.; Plumere, N. Photosynthesis: Short circuit at the chlorophyll. Nat. Chem. Biol. 2016, 12, 990–991. [Google Scholar] [CrossRef] [PubMed]
- Ashraf, M.; Harris, P.J.C. Photosynthesis under stressful environments: An overview. Photosynthetica 2013, 51, 163–190. [Google Scholar] [CrossRef]
- Blackburn, G.A. Hyperspectral remote sensing of plant pigments. J. Exp. Bot. 2006, 58, 855–867. [Google Scholar] [CrossRef] [PubMed] [Green Version]
- Marschner, H. Marschner’s Mineral Nutrition of Higher Plants, 3rd ed.; Academic press: Cambridge, MA, USA, 2011; p. 672. [Google Scholar]
- Dordas, C. Nitrogen nutrition index and leaf chlorophyll concentration and its relationship with nitrogen use efficiency in barley (Hordeum vulgare L.). J. Plant Nutr. 2017, 40, 1190–1203. [Google Scholar] [CrossRef]
- Ata-Ul-Karim, S.T.; Cao, Q.; Zhu, Y.; Tang, L.; Rehmani, M.I.A.; Cao, W. Non-destructive assessment of plant nitrogen parameters using leaf chlorophyll measurements in rice. Front. Plant Sci. 2016, 7, 1829. [Google Scholar] [CrossRef] [PubMed] [Green Version]
- Baresel, J.P.; Rischbeck, P.; Hu, Y.; Kipp, S.; Barmeier, G.; Mistele, B. Use of a digital camera as alternative method for non-destructive detection of the leaf chlorophyll content and the nitrogen nutrition status in wheat. Comp. Elec. Agri. 2017, 140, 25–33. [Google Scholar] [CrossRef]
- Arnon, D.I. Copper enzymes in isolated chloroplasts. Polyphenoloxidase in Beta vulgaris. Plant Physiol. 1949, 24, 1–15. [Google Scholar] [CrossRef] [Green Version]
- Wintermans, J.F.G.M.; De Mots, A. Spectrophotometric characteristics of chlorophylls a and b and their pheophytins in ethanol. Bioch. Bioph. Acta 1965, 109, 448–453. [Google Scholar]
- Kjeldahl, J. Neue Methode zur Bestimmung des stickstoffs in organischen Körpern. Z. Fur Anal. Chem. 1883, 22, 366–382. [Google Scholar] [CrossRef] [Green Version]
- Muñoz-Huerta, R.F.; Guevara-Gonzalez, R.G.; Contreras-Medina, L.M.; Torres-Pacheco, I.; Prado-Olivarez, J.; Ocampo-Velazquez, R.V. A review of methods for sensing the nitrogen status in plants: Advantages, disadvantages and recent advances. Sensors 2013, 13, 10823–10843. [Google Scholar] [CrossRef]
- Hebbar, K.B.; Subramanian, P.; Sheena, T.L.; Shwetha, K.; Sugatha, P.; Arivalagan, M.; Varaprasad, P.V. Chlorophyll and nitrogen determination in coconut using a non-destructive method. J. Plant Nutr. 2016, 39, 1610–1619. [Google Scholar] [CrossRef]
- Ali, M.M.; Al-Ani, A.; Eamus, D.; Tan, D.K.Y. Leaf nitrogen determination using non-destructive techniques—A review. J. Plant Nutr. 2016, 40, 928–953. [Google Scholar] [CrossRef]
- Xu, C.; Qu, J.J.; Hao, X.; Cosh, M.H.; Zhu, Z.; Gutenberg, L. Monitoring crop water content for corn and soybean fields through data fusion of MODIS and Landsat measurements in Iowa. Agric. Water Manag. 2020, 227, 105844. [Google Scholar] [CrossRef]
- Niyogi, D.; Jamshidi, S.; Smith, D.; Kellner, O. Evapotranspiration climatology of indiana using in situ and remotely sensed products. J. Appl. Meteorol. Climatol. 2020, 59, 2093–2111. [Google Scholar] [CrossRef]
- Croft, H.; Arabian, J.; Chen, J.M.; Shang, J.; Liu, J. Mapping within-field leaf chlorophyll content in agricultural crops for nitrogen management using Landsat-8 imagery. Precis. Agric. 2020, 21, 856–880. [Google Scholar] [CrossRef] [Green Version]
- Jamshidi, S.; Zand-Parsa, S.; Niyogi, D. Assessing crop water stress index of citrus using in-situ measurements, landsat, and sentinel-2 data. Int. J. Remote Sens. 2021, 42, 1893–1916. [Google Scholar] [CrossRef]
- Hemming, J.; Rath, T. Computer-vision based weed identification under field condition using controlled lighting. J. Agric. Engin. Res. 2000, 78, 233–243. [Google Scholar] [CrossRef] [Green Version]
- Karcher, D.E.; Rechardson, M.D. Quantifying turfgrass color using digital image analysis. Crop Sci. 2003, 43, 943–951. [Google Scholar] [CrossRef]
- Aldea, M.; Frank, T.D.; Delucia, E.H. A method for quantitative analysis for spatially variable physiological processes across leaf surfaces. Photos. Res. 2006, 90, 161–172. [Google Scholar] [CrossRef]
- Wang, Y.; Wang, D.; Zhang, G.; Wang, J. Estimating nitrogen status of rice using the image segmentation of G–R thresholding method. Crops Res. 2013, 149, 33–39. [Google Scholar] [CrossRef]
- Díaz-Maroto, M.C.; Pérez-Coello, M.S.; Sánchez-Palomo, E.; González-Viñas, M.A. Impact of drying and storage time on sensory characteristics of rosemary (Rosmarinus officinalis L.). J. Sen. Std. 2007, 22, 34–48. [Google Scholar] [CrossRef]
- Ilyas, S.; Naz, S.; Aslam, F.; Parveen, Z.; Ali, A. Chemical composition of essential oil from in vitro grown Peperomia obtusifolia through GC-MS. Pak. J. Bot. 2014, 46, 667–672. [Google Scholar]
- Lopez, G. Guía de los Árboles y Arbustos de la Península Ibérica y Baleares, 2nd ed.; Mundiprensa: Madrid, Spain, 2004. [Google Scholar]
- Jiménez, R.M.; Caballero, M.R. El Cultivo Industrial de Plantas en Maceta; Ediciones de Horticultura, S.L.: Barcelona, Spain, 1990; p. 664. [Google Scholar]
- Yadav, S.P.; Ibaraki, Y.; Gupta, S.D. Estimation of the chlorophyll content of micropropagated potato plants using RGB based image analysis. Plant Cell Tissue Organ Cult. 2010, 100, 183–188. [Google Scholar] [CrossRef]
- Vesali, F.; Omid, M.; Kaleita, A.; Mobil, H. Development of an android app to estimate chlorophyll content of corn leaves based on contact imaging. Comp. Elect. Agric. 2015, 116, 211–220. [Google Scholar] [CrossRef]
- Wellburn, A. The spectral determination of chlorophylls a and b, as well as total carotenoids, using various solvent with spectrophotometers of different resolution. Plant Physiol. 1994, 144, 307–313. [Google Scholar] [CrossRef]
- Csáky, A.G.; Martínez-Grau, M.A. Técnicas Experimentales en Síntesis Orgánica; Ediciones de Síntesis: Madrid, Spain, 1998. [Google Scholar]
- Krom, M.D. Spectrophotometric determination of ammonia: Study of a modified Berthelot reaction using salicylate and dicholoroisocyanurate. Analyst 1980, 105, 305–316. [Google Scholar] [CrossRef]
- Vibhute, A.; Bodhe, S.K. Color image processing approach for nitrogen estimation of vineyard. Int. J. Agri. Sci. Res. 2013, 3, 189–196. [Google Scholar]
- Yuzhu, H.; Xiaomei, W.; Shuyao, S. Nitrogen determination in pepper (Capsicum frutescens L.) plants by color image analysis (RGB). Afr. J. Biotech. 2011, 10, 17737–17741. [Google Scholar]
- Padmaja, V.; Dey, M.A.K. Evaluation of leaf chlorophyll content by a non-invasive approach. Int. J. Inn. Res. Elec. Elec. Instr. Control Eng. 2015, 3, 7–10. [Google Scholar]
- Rigon, J.P.G.; Capuani, S.; Fernandes, D.M.; Guimaraes, T.M. A novel method for the estimation of soybean chlorophyll content using a smartphone and image analysis. Photosynthetica 2016, 54, 559–566. [Google Scholar] [CrossRef] [Green Version]
- Auearunyawat, P.; Kasetkasem, T.; Wongmaneeroj, A.; Nishihara, A.; Keinprasit, R. An automatic nitrogen estimation method in sugarcane leaves using image processing techniques. In Proceedings of the International Conference on Agricultural, Environment and Biological Sciences (ICAEBS 2012), Phuket, Thailand, 26–27 May 2012; pp. 26–27. [Google Scholar]
- Mercado-Luna, A.; Rico-Garcia, E.; Lara-Herrera, A.; Soto-Zarazua, G.; Ocampo-Velazquez, R.L.; Gonzalez-Guevara, R.; Herrera-Ruiz, G.; Torres-Pacheco, I. Nitrogen determination on tomato (Lycopersicon esculentum Mill.) seedlings by color image analysis (RGB). Afr. J. Biotech. 2010, 9, 5326–5332. [Google Scholar]
- Bielinis, E.; Jóźwiak, W.; Robakowski, P. Modelling of the relationship between the SPAD values and photosynthetic pigments content in Quercus petraea and Prunus serotina leaves. Dendrobiology 2015, 73, 125–134. [Google Scholar] [CrossRef] [Green Version]
- Dey, A.K.; Sharma, M.; Meshram, M.R. An analysis of leaf chlorophyll measurement method using chlorophyll meter and image processing technique. Procedia Comput. Sci. 2016, 85, 286–292. [Google Scholar] [CrossRef] [Green Version]
- Lopes-Dranski, J.A.; Malavasi, U.C.; Malavasi, M.M. Estimating chlorophyll content from Eucalyptus dunnii leaves by reflectance values. Semin. Cienc. Agrar. 2016, 37, 1277–1284. [Google Scholar] [CrossRef] [Green Version]
- Rorie, R.L.; Purcell, L.C.; Karcher, D.E.; King, C.A. The assessment of leaf nitrogen in corn from digital images. Crop Sci. 2011, 51, 2174–2180. [Google Scholar] [CrossRef] [Green Version]
- Fukshansky, L.; Martinez, A.; Remisowsky, V.; McLendon, J.; Ritterbusch, A.; Richter, T.; Mohr, H. Absorption spectra of leaves corrected for scattering and distributional error: A radiative transfer and absorption statistics treatment. Photochem. Photobiol. 1993, 57, 538–555. [Google Scholar] [CrossRef]
- Tewari, V.K.; Arudra, A.K.; Kumar, S.P.; Pandey, V.; Chandel, N.S. Estimation of plant nitrogen content using digital image processing. Agric. Eng. Inter. CIGR J. 2013, 15, 78–86. [Google Scholar]
- Hu, H.; Liu, H.; Zhang, H.; Zhu, J.; Yao, X.; Zhang, X.; Zheng, K. Assessment of chlorophyll content based on image color analysis, comparison with SPAD-502. In Proceedings of the 2010 2nd International Conference on Information Engineering and Computer Science, Wuhan, China, 25–26 December 2010. [Google Scholar]
- Treder, W.; Klamkowski, K.; Kowalczyk, W.; Sas, D.; Wojcik, K. Possibilities of using image analysis to estimate the nitrogen nutrition status of apple trees. Zemdirb. Agric. 2016, 103, 319–326. [Google Scholar] [CrossRef] [Green Version]
- Gupta, S.D.; Ibaraki, Y.; Pattanayak, A.K. Development of a digital image analysis method for real-time estimation of chlorophyll content in micropropagated potato plants. Plant Biotech. Rep. 2013, 7, 91–97. [Google Scholar] [CrossRef]
- Saberioon, M.M.; Amin, M.S.M.; Aimrun, W.; Ghholizadeh, A.; Anuar, A.A.R. Assessment of colour indices derived from conventional digital camera for determining nitrogen status in rice plants. J. Food Agric. Environ. 2013, 11, 655–662. [Google Scholar]
- Adamsen, F.J.; Pinter, P.J.; Barnes, E.M.; Lamorte, R.L.; Wall, G.W.; Leavitt, S.W.; Kimball, B.A. Measuring wheat senescence with a digital camera. Crop Sci. 1999, 39, 719–724. [Google Scholar] [CrossRef]
- Wang, Y.; Wang, D.; Shi, P.; Omasa, K. Estimating rice chlorophyll content and leaf nitrogen concentration with a digital still color camera under natural light. Plant Methods 2014, 10, 36. [Google Scholar] [CrossRef] [PubMed]
Figure 1.
Leaf scanning in the different ornamental species studied: (a) baby rubber (Peperomia obtusifolia L.), (b) confetti tree (Maythenus senegalensis Lam. Exell), and (c) rosemary (Rosmarinus officinalis L).
Figure 1.
Leaf scanning in the different ornamental species studied: (a) baby rubber (Peperomia obtusifolia L.), (b) confetti tree (Maythenus senegalensis Lam. Exell), and (c) rosemary (Rosmarinus officinalis L).

Figure 2.
Visualization of the different correlations studied in P. obtusifolia. (a) Total N (mg g−1 DW), (b) Chl a (mg g−1 FW), (c) Chl b (mg g−1 FW), (d) Chl (a + b) (mg g−1 FW).
Figure 2.
Visualization of the different correlations studied in P. obtusifolia. (a) Total N (mg g−1 DW), (b) Chl a (mg g−1 FW), (c) Chl b (mg g−1 FW), (d) Chl (a + b) (mg g−1 FW).


Figure 3.
Visualization of the different correlations studied in M. senegalensis. (a) Total N (mg g−1 DW), (b) Chl a (mg g−1 FW), (c) Chl b (mg g−1 FW), (d) Chl a+b (mg g−1 FW).
Figure 3.
Visualization of the different correlations studied in M. senegalensis. (a) Total N (mg g−1 DW), (b) Chl a (mg g−1 FW), (c) Chl b (mg g−1 FW), (d) Chl a+b (mg g−1 FW).

Figure 4.
Visualization of the different correlations studied in R. officinalis. (a) Total N (mg g−1 DW), (b) Chl a (mg g−1 FW), (c) Chl b (mg g−1 FW), (d) Chl a+b (mg g−1 FW).
Figure 4.
Visualization of the different correlations studied in R. officinalis. (a) Total N (mg g−1 DW), (b) Chl a (mg g−1 FW), (c) Chl b (mg g−1 FW), (d) Chl a+b (mg g−1 FW).


Table 1.
Maximum and minimum values of RGB in P. obtusifolia, M. senegalensis, and R. officinalis.
| Species | R | G | B | |
|---|---|---|---|---|
| P. obtusifolia | Maximum | 95.01 | 123.32 | 73.56 |
| Minimum | 81.22 | 114.09 | 63.94 | |
| M. senegalensis | Maximum | 91.92 | 123.65 | 44.46 |
| Minimum | 87.85 | 108.38 | 34.48 | |
| R. officinalis | Maximum | 105.90 | 111.60 | 72.20 |
| Minimum | 90.70 | 100.45 | 61.50 |
Table 2.
Coefficients of determination (R2) for the linear regression value between total N, Chl a, b and a + b and RGB values, rgb normalized values, and vegetation indices in P. obtusifolia.
Table 2.
Coefficients of determination (R2) for the linear regression value between total N, Chl a, b and a + b and RGB values, rgb normalized values, and vegetation indices in P. obtusifolia.
| R | G | B | r | g | b | GMR | GDR | VI | |
|---|---|---|---|---|---|---|---|---|---|
| Total N | 0.79 | 0.86 | 0.25 | 0.81 | 0.28 | 0.28 | 0.52 | 0.70 | 0.69 |
| Chl a | 0.80 | 0.81 | 0.33 | 0.79 | 0.38 | 0.18 | 0.60 | 0.75 | 0.74 |
| Chl b | 0.81 | 0.84 | 0.27 | 0.82 | 0.32 | 0.25 | 0.57 | 0.73 | 0.72 |
| Chl a + b | 0.81 | 0.82 | 0.31 | 0.80 | 0.36 | 0.20 | 0.60 | 0.74 | 0.74 |
The values in bold correspond to the values higher than 0.60 at p < 0.05.
Table 3.
Equations and the coefficient of determination (R2) for the linear regression value between total N, Chl a, b and a + b (Y), and R and G (X) in P. obtusifolia.
Table 3.
Equations and the coefficient of determination (R2) for the linear regression value between total N, Chl a, b and a + b (Y), and R and G (X) in P. obtusifolia.
| Y | R2 | |
|---|---|---|
| Total N | y = −229.86 − 0.085 × R + 2.297 × G | 0.85 |
| Chl a | y = 17.27 − 0.050 × R − 0.092 × G | 0.82 |
| Chl b | y = 10.76 − 0.013 × R − 0.071 × G | 0.84 |
| Chl a + b | y = 28.03 − 0.063 × R − 0.163 × G | 0.83 |
Table 4.
Coefficients of determination (R2) for the linear regression value between total N, Chl a, b and a + b and RGB values, rgb normalized values, and vegetation indices in M. senegalensis.
Table 4.
Coefficients of determination (R2) for the linear regression value between total N, Chl a, b and a + b and RGB values, rgb normalized values, and vegetation indices in M. senegalensis.
| R | G | B | R | g | b | GMR | GDR | VI | |
|---|---|---|---|---|---|---|---|---|---|
| Total N | 0.19 | 0.67 | 0.74 | 0.02 | 0.75 | 0.75 | 0.68 | 0.66 | 0.67 |
| Chl a | 0.49 | 0.42 | 0.50 | 0.08 | 0.41 | 0.53 | 0.30 | 0.26 | 0.27 |
| Chl b | 0.41 | 0.75 | 0.81 | 0.00 | 0.79 | 0.85 | 0.67 | 0.63 | 0.64 |
| Chl a + b | 0.53 | 0.64 | 0.74 | 0.03 | 0.66 | 0.77 | 0.52 | 0.47 | 0.48 |
The values in bold correspond to the values higher than 0.60 at p < 0.05.
Table 5.
Equations and coefficient of determination (R2) for the linear regression value between total N, Chl a, b and a + b (Y), and G and B (X) in M. senegalensis.
Table 5.
Equations and coefficient of determination (R2) for the linear regression value between total N, Chl a, b and a + b (Y), and G and B (X) in M. senegalensis.
| Y | R2 | |
|---|---|---|
| Total N | y = 10.25 − 0.110 × G + 0.340 × B | 0.76 |
| Chl a | y = 1.03 + 0.001 × G − 0.012 × B | 0.51 |
| Chl b | y = 0.39 + 0.003 × G − 0.009 × B | 0.84 |
| Chl a + b | y = 1.43 + 0.005 × G − 0.020 × B | 0.75 |
Table 6.
Coefficients of determination (R2) for the linear regression value between total N, Chl a, b and a + b and RGB values, rgb normalized values, and vegetation indices in R. officinalis.
Table 6.
Coefficients of determination (R2) for the linear regression value between total N, Chl a, b and a + b and RGB values, rgb normalized values, and vegetation indices in R. officinalis.
| R | G | B | R | g | b | GMR | GDR | VI | |
|---|---|---|---|---|---|---|---|---|---|
| Total N | 0.78 | 0.87 | 0.80 | 0.00 | 0.65 | 0.36 | 0.10 | 0.18 | 0.17 |
| Chl a | 0.75 | 0.62 | 0.79 | 0.01 | 0.73 | 0.43 | 0.27 | 0.35 | 0.34 |
| Chl b | 0.74 | 0.68 | 0.73 | 0.01 | 0.66 | 0.35 | 0.19 | 0.27 | 0.27 |
| Chl a + b | 0.81 | 0.78 | 0.82 | 0.01 | 0.62 | 0.41 | 0.18 | 0.27 | 0.27 |
The values in bold correspond to the values higher than 0.60 at p < 0.05.
Table 7.
Equations and coefficient of determination (R2) for the linear regression value between total N, Chl a, b and a + b (Y), and R, G, and B (X) in R. officinalis.
Table 7.
Equations and coefficient of determination (R2) for the linear regression value between total N, Chl a, b and a + b (Y), and R, G, and B (X) in R. officinalis.
| Y | R2 | |
|---|---|---|
| Total N | y = −72.58 + 0.190 × R + 0.520*G + 0.210 × B | 0.91 |
| Chl a | y = 0.11 + 0.005 × R − 0.005*G + 0.007 × B | 0.87 |
| Chl b | y = −1.05 + 0.009 × R + 0.0009*G + 0.008 × Bs | 0.81 |
| Chl a + b | y = −1.134 + 0.011 × R + 0.003*G + 0.012 × B | 0.90 |
Disclaimer/Publisher’s Note: The statements, opinions and data contained in all publications are solely those of the individual author(s) and contributor(s) and not of MDPI and/or the editor(s). MDPI and/or the editor(s) disclaim responsibility for any injury to people or property resulting from any ideas, methods, instructions or products referred to in the content. |
© 2023 by the authors. Licensee MDPI, Basel, Switzerland. This article is an open access article distributed under the terms and conditions of the Creative Commons Attribution (CC BY) license (https://creativecommons.org/licenses/by/4.0/).
Share and Cite
MDPI and ACS Style
Garcia-Caparros, P.; Llanderal, A.; Lao, M.T. Correlations between R, G, and B Values, Pigment Concentration, and Nitrogen Status in Three Ornamental Potted Plants. Agronomy 2023, 13, 177. https://doi.org/10.3390/agronomy13010177
AMA Style
Garcia-Caparros P, Llanderal A, Lao MT. Correlations between R, G, and B Values, Pigment Concentration, and Nitrogen Status in Three Ornamental Potted Plants. Agronomy. 2023; 13(1):177. https://doi.org/10.3390/agronomy13010177
Chicago/Turabian StyleGarcia-Caparros, Pedro, Alfonso Llanderal, and María Teresa Lao. 2023. "Correlations between R, G, and B Values, Pigment Concentration, and Nitrogen Status in Three Ornamental Potted Plants" Agronomy 13, no. 1: 177. https://doi.org/10.3390/agronomy13010177
Note that from the first issue of 2016, this journal uses article numbers instead of page numbers. See further details here.