Article

Alternative Splicing (AS) Dynamics in Dwarf Soybean Derived from Cross of Glycine max and Glycine soja

1
Department of Agriculture and Life Industry, Kangwon National University, Chuncheon 24341, Korea
2
Agriculture and Life Sciences Research Institute, Kangwon National University, Chuncheon 24341, Korea
3
Syngenta Crop Protection LLC, 9 Davis Drive, Research Triangle Park, Durham, NC 27709, USA
*
Authors to whom correspondence should be addressed.
Agronomy 2022, 12(7), 1685; https://doi.org/10.3390/agronomy12071685
Submission received: 10 June 2022 / Revised: 8 July 2022 / Accepted: 15 July 2022 / Published: 16 July 2022
(This article belongs to the Special Issue Genetics, Genomics and Breeding of Cereals and Grain Legumes)

Abstract

:
Short crop height is the preferred breeding trait since there is a positive correlation between lodging resistance and a crop yield increase. Alternative splicing can alter transcriptome diversity and contribute to plant adaptation to environmental stress. We characterized the transcriptomes obtained from dwarf and normal soybean lines derived from a cross of Glycine max var. Peking (G. max) and G. soja var. IT182936 in an F7 RIL population to study the differences between the isoforms. Full-length mRNA derived from leaf tissues was sequenced using the PacBio RSII platform, generating 904,474 circular consensus sequence (CCS) reads. Using the Structural and Quality Annotation of Novel Transcript Isoforms (SQANTI) process, 42,582 and 44,762 high-quality isoforms, and 91 and 179 polished low-quality isoforms were obtained in dwarf and normal cells, respectively. As a result, 832 and 36,772 nonredundant transcripts were generated. Approximately 30% of the identified genes were estimated to produce two or more isoforms. We detected an average of 166,171 splice junctions (SJs), of which 93.8% were canonical SJs. We identified that novel isoforms accounted for 19% of all isoforms, among which 12% fell within coding regions. The dwarf soybean demonstrated a greater number of isoforms in most of the annotated genes, particularly in genes related to growth hormones and defense responses. Our study provides comprehensive isoform and gene information that may accelerate transcriptome research in G. max and provide a basis to further study the impact of these isoforms on plant growth.

1. Introduction

Soybean (G. max (L.) Merrill) is a pulse (grain legume) crop cultivated for its seeds, which are rich in both energy and proteins and are used for food, feed, and industrial uses [1]. Since the 1950s, global soybean production has increased 15 times, and its significance has soared due to the increased demands on renewable fuel and plant-based proteins as examples. Dwarf plant height is one of the main domestication and breeding traits. It enhances crop productivity by increasing pod bearing and decreasing the degree of lodging, resulting in an increased yield [2,3,4]. In addition, it was the key trait of the Green Revolution between the 1950s and 1970s: the incorporation of semi-dwarf varieties of rice and wheat in breeding programs led to an increase in yields [5,6,7]. In soybean, too, immense studies proved that shorter stands could lead to a yield increase [8,9,10].
The cellular machinery of plants has evolved to control various daily activities in response to environmental conditions and involves crosstalk among multiple layers of regulation, particularly gene regulation at the cotranscriptional, post-transcriptional, and post-transregulation levels [11,12,13,14]. Alternative splicing is one mechanism that generates two or more mRNAs from the same precursor mRNA (pre-mRNA) and may contribute to protein diversity and genome complexity [15]. Various studies demonstrated that more than 70% of multiexon genes undergo alternative splicing [16,17,18,19,20]. Among all alternative splicing events observed in plants, intron retention (IR) was found to be present in Arabidopsis, soybean, and tomato examples [17,21,22,23]. IR causes the production of mRNAs with pretermination codons (PTCs) that are either degraded by nonsense-mediated mRNA decay (NMD) pathways or produce a truncated protein that affects the function and abundance of its full-length counterpart [24,25,26]. New isoforms of transcripts may act as dominant-negative regulators/inhibitors of authentic proteins via interaction and dimerization [15]. However, it is still inexplicit how plants modulate the timing of sense vs. nonsense alternative splicing transcript production.
RNA-Seq analysis that uses single-molecule sequencing to obtain long reads on the PacBio [27,28] and Nanopore [29] platforms is a powerful tool for conducting transcriptome research, as it minimizes the limitations of conventional short-read sequencing [30]. The major classification of transcripts in most PacBio transcriptome studies is carried out by comparison with reference sequences and reports to identify the majority of novel genes [28,31]. Large numbers of full-length (FL) and non-full-length (non-FL) sequences are typically mapped to gene loci and different processing pipelines can result in significantly dissimilar final transcript calls. Tardaguila et al. identified ~90,000, 13,000, and 16,000 different transcripts using the TAPIS, IDP, and ToFU pipelines, respectively [32]. We applied a similar transcript annotation pipeline, the SQANTI pipeline, which distinguishes long-read transcripts according to 47 individual descriptors. The SQANTI pipeline takes full-length transcripts, reference genomes, and associated annotations as input and provides a deep characterization of isoforms at both the transcript and junction level. It generates a gene model and classifies transcripts based on splice junctions and donor and acceptor sites. In addition, it also filters out isoforms that are likely to be artifacts. This classification is based on comparisons between the SJs of transcripts and the provided reference genome. Transcripts that perfectly match the reference transcripts are referred to as full splice matches (FSMs) (transcripts matching the reference transcripts at all splice junctions) or incomplete splice matches (ISMs) (input transcripts matching a few, but not all, SJs of the reference transcripts). The novel transcripts of known genes are categorized as novel in category (NIC) (transcripts that contain new combinations of previously annotated SJs or novel SJs from already annotated junction donors and acceptors) or novel not in category (NNC) (transcripts that contain novel donors and/or acceptors of previously annotated genes). The transcripts of novel genes are classified as intergenic (transcripts occurring outside the boundaries of an annotated gene), genomic intron (transcripts present within the boundaries of an annotated intron), or genomic (transcripts consisting of partial exons and intron/intergenic regions of an annotated gene). The final classification of the transcripts concerns whether they are fusion transcripts (transcripts spanning two annotated loci) or antisense transcripts (transcripts containing poly [A] sequences that overlap the complementary strand of an annotated transcript) (Figure 1). SQANTI categorizes the transcripts in relation to their SJs, which can be canonical (GT-AG, GC-AG, and AT-AC) or noncanonical (all other possible combinations) [32].
We created an RIL population by crossing a cultivar (G. max var. Peking) and a wild soybean (G. soja var. IT182936). The population segregated into a dwarf phenotype since the F2 generation and inherited the same phenotype in subsequent generations (Figure 2). We surveyed SNPs and genes that were differentially expressed in selected progeny showing dwarf and normal in F6 using Illumina short-read RNA-Seq analysis [33,34] in our previous study. In this study, we aimed to investigate the differences in the isoforms between two progenies of the F7 generation, which revealed distinct phenotypes (normal height and dwarf height) using the long-read sequencing method of PacBio.

2. Materials and Methods

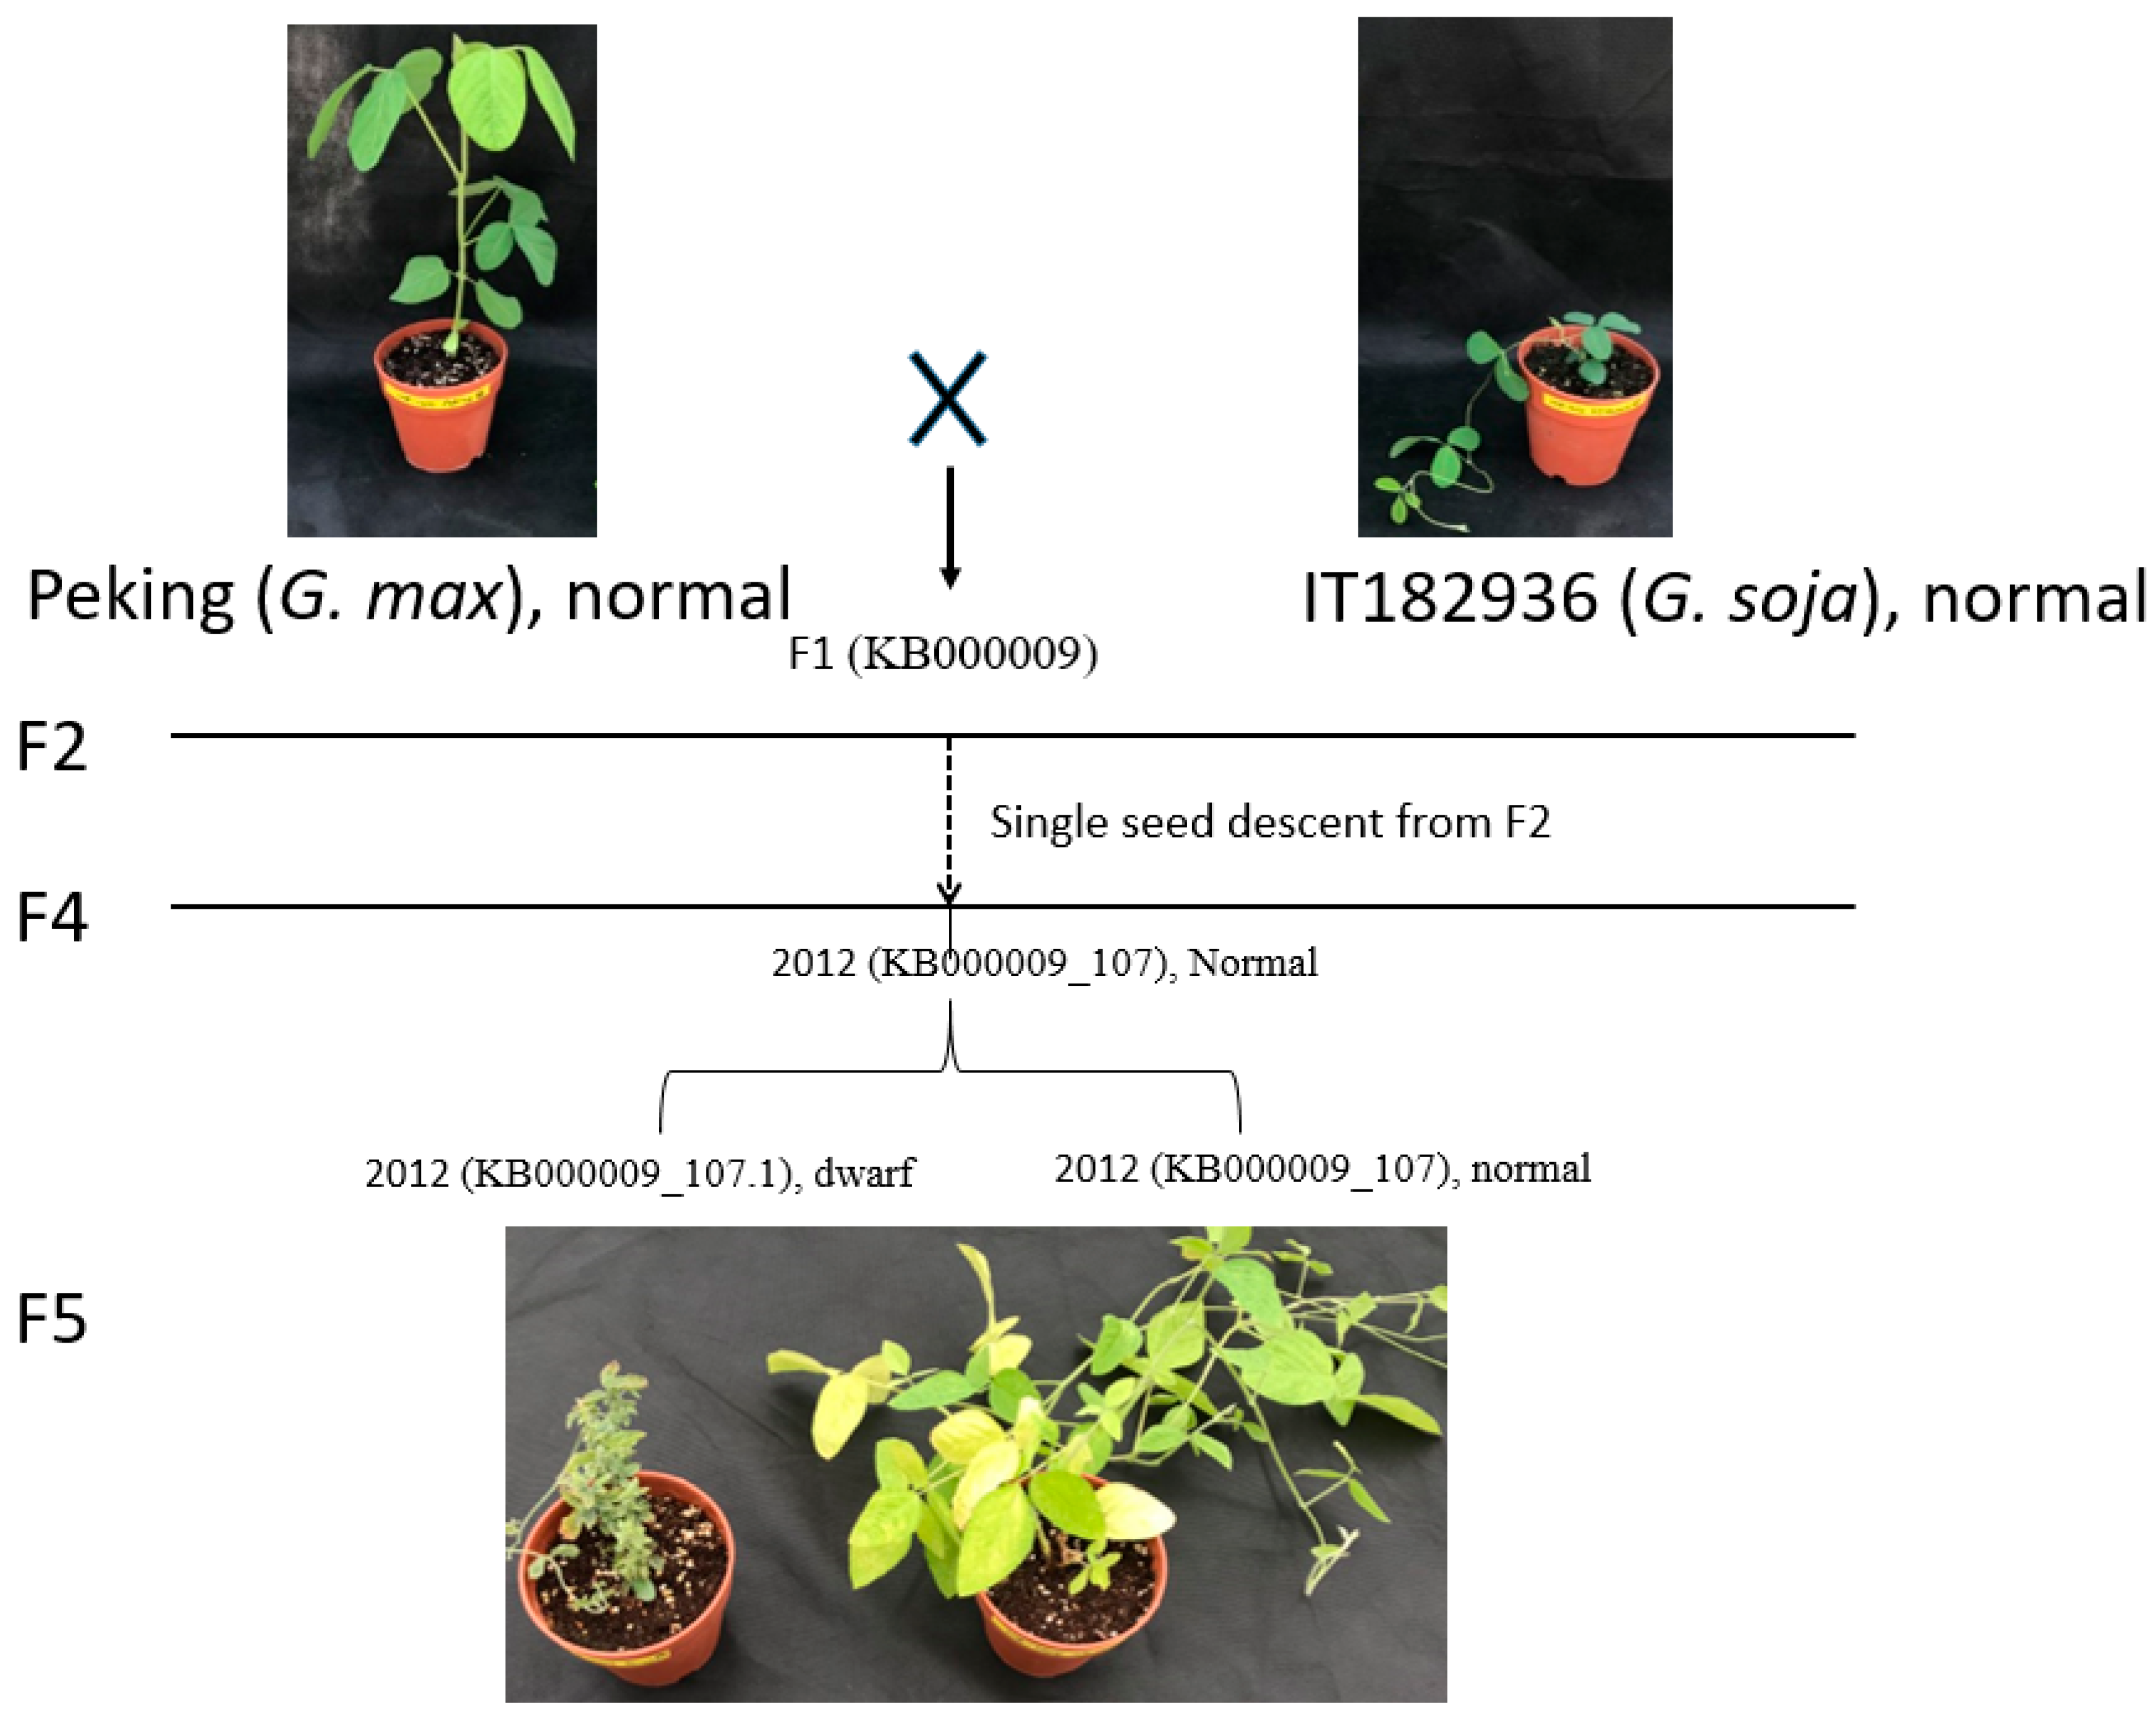
2.1. Plant Material and RNA Isolation

The soybean plants used in the current study were harvested from the field of Kangwon National University in Chuncheon (Gangwon-do, South Korea). The use of plant parts in the present study complies with international, national, and/or institutional guidelines. The G. max var. Peking and G. soja var. IT182936 hybrids were developed until F5. The RILs began to exhibit two distinct phenotypes, classified as tall/normal or dwarf, in the F2 generation (Figure 2), although the dwarf line did not produce any seeds. In the F3 generation, five dwarf lines were observed, out of which three produced seeds. The dwarf seeds continued to produce dwarf progenies in their next generations. Three leaf tissues (15 days after sowing) from such segregated plants in the F7 generation exhibiting both normal and dwarf phenotypes were collected, immediately frozen in liquid nitrogen, and stored at −80 °C. RNA isolation from the leaves was performed using a RiboPure Kit (Applied Biosynthesis, Foster City, CA, USA) following the manufacturer’s protocol. The RNA concentration was checked with a NanoDrop ND1000 spectrophotometer (NanoDrop Technologies, Wilmington, DE, USA), and the RNA quality was analyzed using an Agilent 2100 Bioanalyzer (Agilent Technologies, Santa Clara, CA, USA). Samples with RIN values ≥ 8 were used for cDNA generation.

2.2. Full-Length cDNA Sequencing

First-strand cDNA was prepared with a Clontech SMARTer PCR cDNA synthesis kit (Takara Bio USA, Inc., San Jose, CA, USA). The quality of the cDNA samples was assessed by the OD 260/280 ratio and gel electrophoresis [27]. Through an optimized PCR cycling procedure, large double-stranded cDNA products were obtained. A SMRTbell library and full-length cDNA sequences were obtained from the amplified double-stranded cDNAs using a SMRTbell library kit (Pacific Biosciences, Menlo Park, CA, USA) and the PacBio RSII platform according to the manufacturer’s protocol (Pacific Biosciences Inc., CA, USA) at the National Instrumentation Center for Educational Management (NICEM, Seoul National University, Seoul, South Korea). Library extraction was conducted in batches of approximately 1–2, 2–3, and 3–6 kb using the BluePippinTM Size Selection System (Sage Science, Beverly, MA, USA), and each size-dependent library was sequenced. Two SMRT bell libraries were constructed with the Pacific Biosciences DNA Template Prep Kit 2.0, and SMRT sequencing was then performed on a Pacific Biosciences Sequel System [27].

2.3. Defining Full-Length cDNA Sequence

PacBio polymerase reads were processed, and polymerase reads <50 bp in length were removed. The obtained subread BAM file reads were processed into error-corrected circular consensus sequences (CCSs) with the following parameters: full passes ≥0 and predicted consensus accuracy > 0.75. By identifying the 5′ and 3′ adapters and poly (A) tail sequences, full-length and non-full-length reads were obtained from the CCSs. CCSs with both 5′ and 3′ sequence reads were referred to as nonconcatemer reads with 5′ and 3′ sequences, whereas those with all three elements that did not contain any additional copies of the adapter sequence within the DNA fragment were referred to as nonconcatemer reads with 5′ and 3′ primers and a poly-A tail, or full-length nonconcatemer (FLNC) reads. The FLNC reads were clustered into consensus sequences using the Iterative Clustering for Error Correction (ICE) algorithm (https://www.pacb.com/products-and-services/analytical-software, accessed on 15 June 2017). These reads were combined with non-full-length transcripts and further refined into clusters to obtain full-length high-quality polished consensus sequences using Quiver [35] with the following parameters: hq_quiver_min_accuracy 0.99, bin_by_primer false, 300 bin_size_kb 1, qv_trim_5p 100, and qv_trim_3p 30. The consensus sequences were further subjected to the removal of redundant sequences with the CD-Hit package [36]. The polished consensus sequences (FLNC and corrected isoforms) were aligned against the reference genome using the Genomic Mapping and Alignment Program (GMAP) [37] for mRNAs. To collapse redundant sequences obtained from different clusters, the mapping output was processed with the Cupcake ToFU package (https://github.com/Magdoll/cDNA_Cupcake, accessed on 15 June 2017), and unique isoforms were then defined from the processed output [38]. Full-length transcripts with a postcorrection accuracy > 99% were used for further analysis.

2.4. Isoform Prediction and Annotations

Corrected isoform prediction, characterization, and splice junction analysis were conducted using SQANTI, and the splice junctions of transcripts were compared against the G. max version 2.0 genome as a reference. For functional annotation, unigenes were searched in the NCBI Nucleotide (NT), Gene Ontology (GO), NCBI nonredundant Protein (NR), UniProt, and EggNOG databases using BLASTN of NCBI BLAST and BLASTX of DIAMOND software with a default E-value cutoff of 1.0 × 10⁻⁵. All transcript sequences were analyzed for homology via searches against various databases. The database version of GlymaID from G. max version 2.0 was used for the analysis. From all the predictions, only those that were primarily predicted were included in the analyses (http://phytozome.jgi.doe.gov/pz/portal.html#!info?alias=Org_Gmax, accessed on 15 June 2017). Matches were determined via BLASTP searches of G. max 2.0 primary proteins against Uniref100 (version 03/27/2014).

3. Results

3.1. Output of PacBio Sequencing and Error Correction

A multiple-tissue hybrid library was sequenced on the PacBio Sequel platform with 2 SMRT Cells (viz., 2012-1-D-Cell1 for the dwarf lines and 2012-N-Cell3 for normal lines), from which 904,474 reads of inserts (ROIs) or CCS reads were generated (Table 1). The average lengths of the CCSs in the two SMRT Cells (2012–1–D–Cell1 and 2012–N–Cell3) were 2522  and 2422 bp, respectively (Table 1). Further analysis revealed 388,646 and 417,041 reads with 5′ and 3′ primers and 379,564 and 405,629 FLNC reads in dwarf and normal cells, respectively. After ICE clustering and Quiver analysis, we obtained 42,582 and 44,762 high-quality isoforms with 91 and 179 polished low-quality isoforms from dwarf and normal cells, respectively. Finally, the CD-HIT and Cupcake ToFU packages were used to collapse these consensus sequences, yielding 34,832 and 36,772 nonredundant transcripts in dwarf and normal cells, respectively (Table 1).

3.2. Isoform Detection and Characterization

The nonredundant transcripts were analyzed using SQANTI [32,39], an automated pipeline for characterizing long-read transcriptomes for sequence identification and quantification. The distribution of annotated genes between dwarf and normal individuals was similar. We identified 15,570 and 16,608 genes in dwarf and normal soybean plants, respectively, with 0.9% annotated as novel genes. The total number of alternative splicing events/SJs identified was 166,171, on average. The annotated genes showed similar exon distributions between the two soybean types. In contrast, among the novel genes, the percentage of mono-exon transcripts in the dwarf samples was lower than in the normal samples (Supplementary Figure S1). We identified 16,887 isoforms, with lengths ranging from 147 to 11,317 bp (average 2366 bp) in dwarf cells and 17,926 isoforms and with lengths ranging from 172 to 8310 bp (2235 bp) in normal cells (Table 1). More than 50% of the genes were found to have only one isoform. By contrast, approximately 15% of the genes exhibited at least two isoforms, and 4.5% of the genes had three isoforms in both dwarf and normal cells (Figure 3). The isoforms of dwarf and normal soybean are listed in detail in Supplementary Tables S1 and S2.
On average, 79% and 1.2% of the transcripts were identified as FSM and ISM, respectively, in both dwarf and normal individuals (Table 2, Figure 4, Supplementary Tables S3 and S4), in accordance with known references. The novel transcripts in the known genes categories (NIC, NNC) accounted for approximately 16.19% of our transcripts. Novel gene transcripts (intergenic and genomic intron categories) accounted for 0.57% of the transcripts, and transcripts in the genomic, antisense, and fusion classes accounted for 2.18%, 0.36%, and 0.11%, respectively. The transcripts in the ISM category had longer transcript lengths and greater exon numbers than those in the FSM category (Supplementary Figure S2A–D). The median lengths of all categories were similar except for the fusion category (Supplementary Figure S2A,B), which had not only a higher median length but also included multi-exon transcripts. This was in contrast with the remaining novel gene categories, which were composed mainly of mono-exon transcripts (Supplementary Figure S2C,D). The majority of the isoforms identified had ORFs in all categories except those in the intergenic and antisense categories, which presented a lower proportion of genes in the coding regions (Supplementary Table S3). In terms of the completeness of FSM isoforms, there was no significant difference between the normal and dwarf samples (Supplementary Figure S3). Less than 20% of FSMs showed an exact match with the transcription start site (TSS) and transcription termination site (TTS). The majority of the FSM transcripts were annotated in the upstream regions of both TSSs and TTSs (Supplementary Figure S3A–D). We found that the majority of isoforms had TSSs and TTSs upstream from the annotated isoforms, and only ~24% were in the range of 0–20 bp of annotated TSSs and TTSs (Supplementary Figure S3).

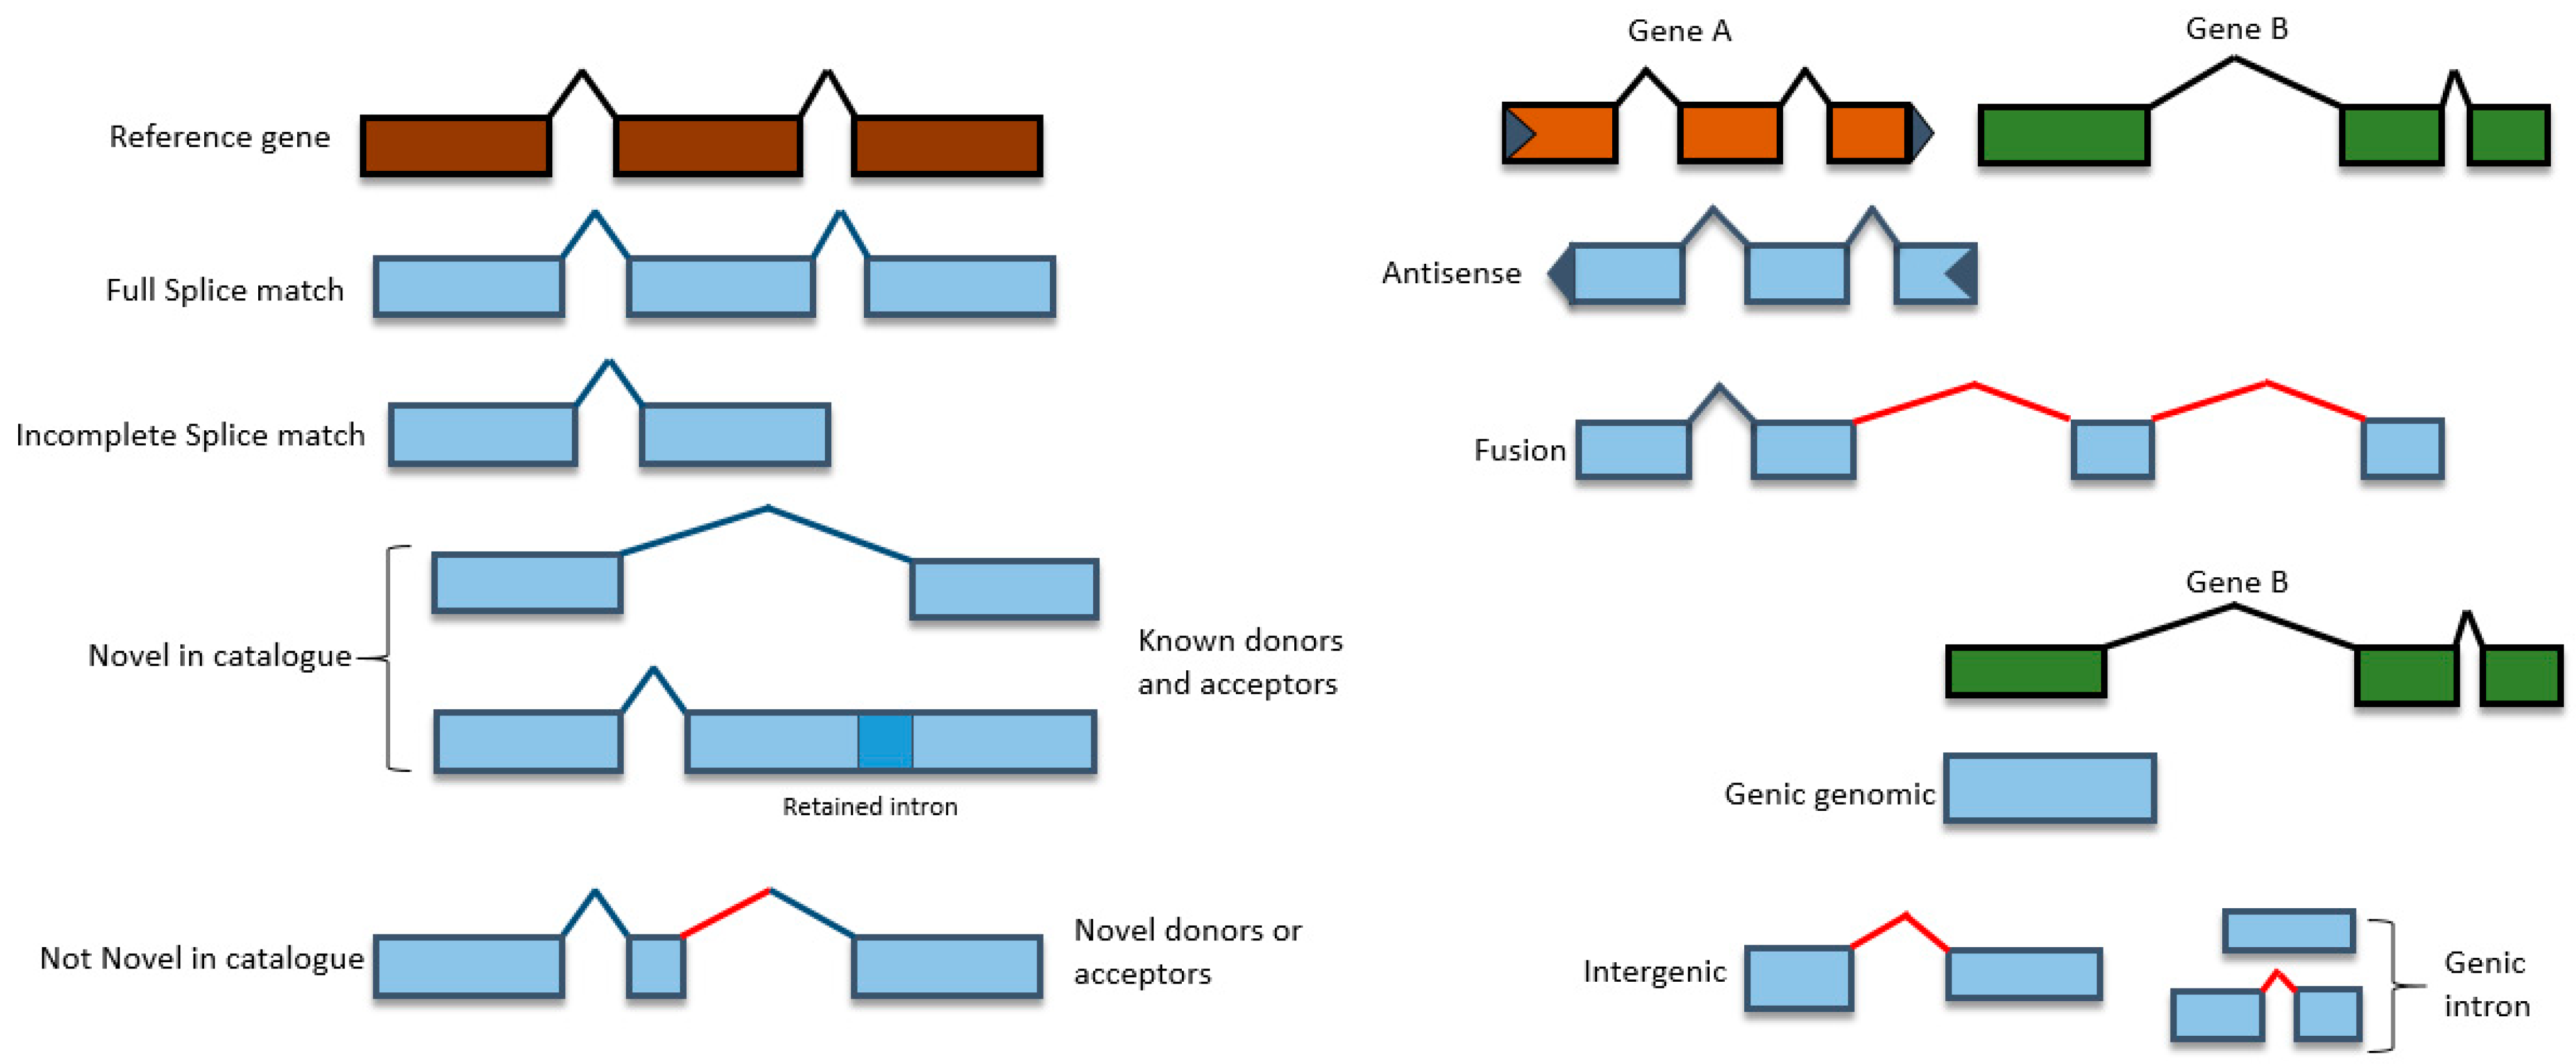
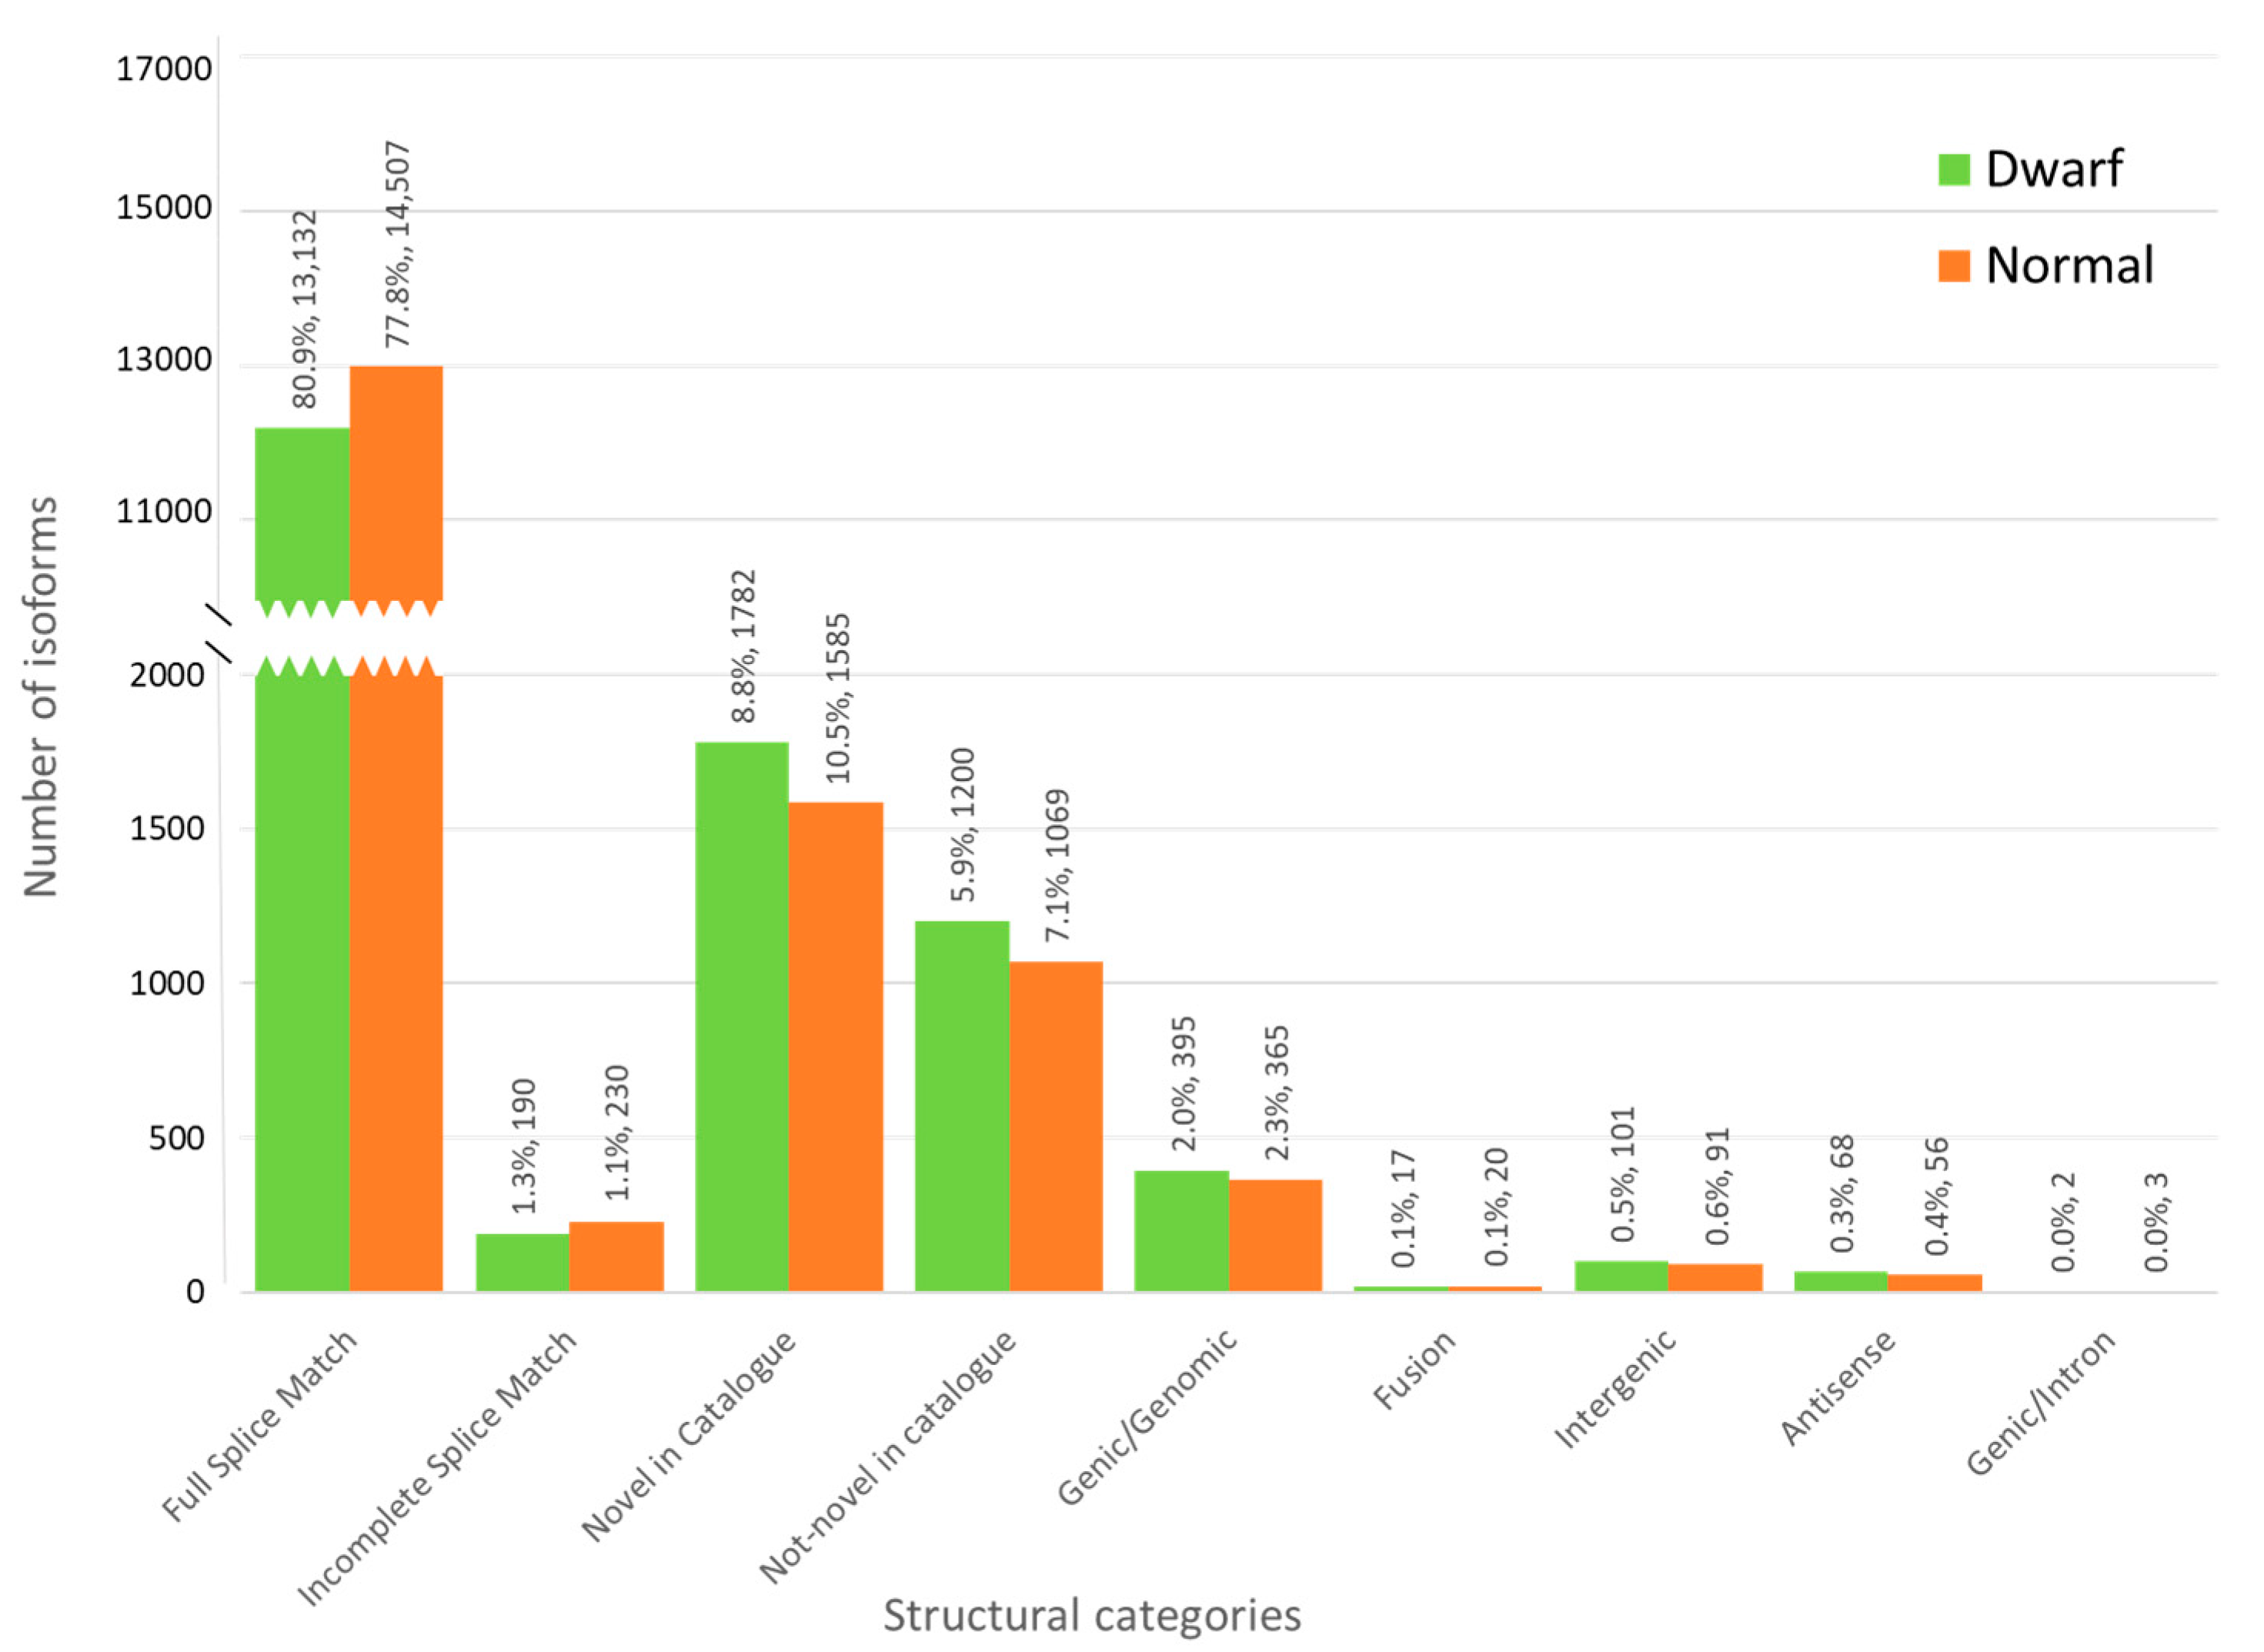
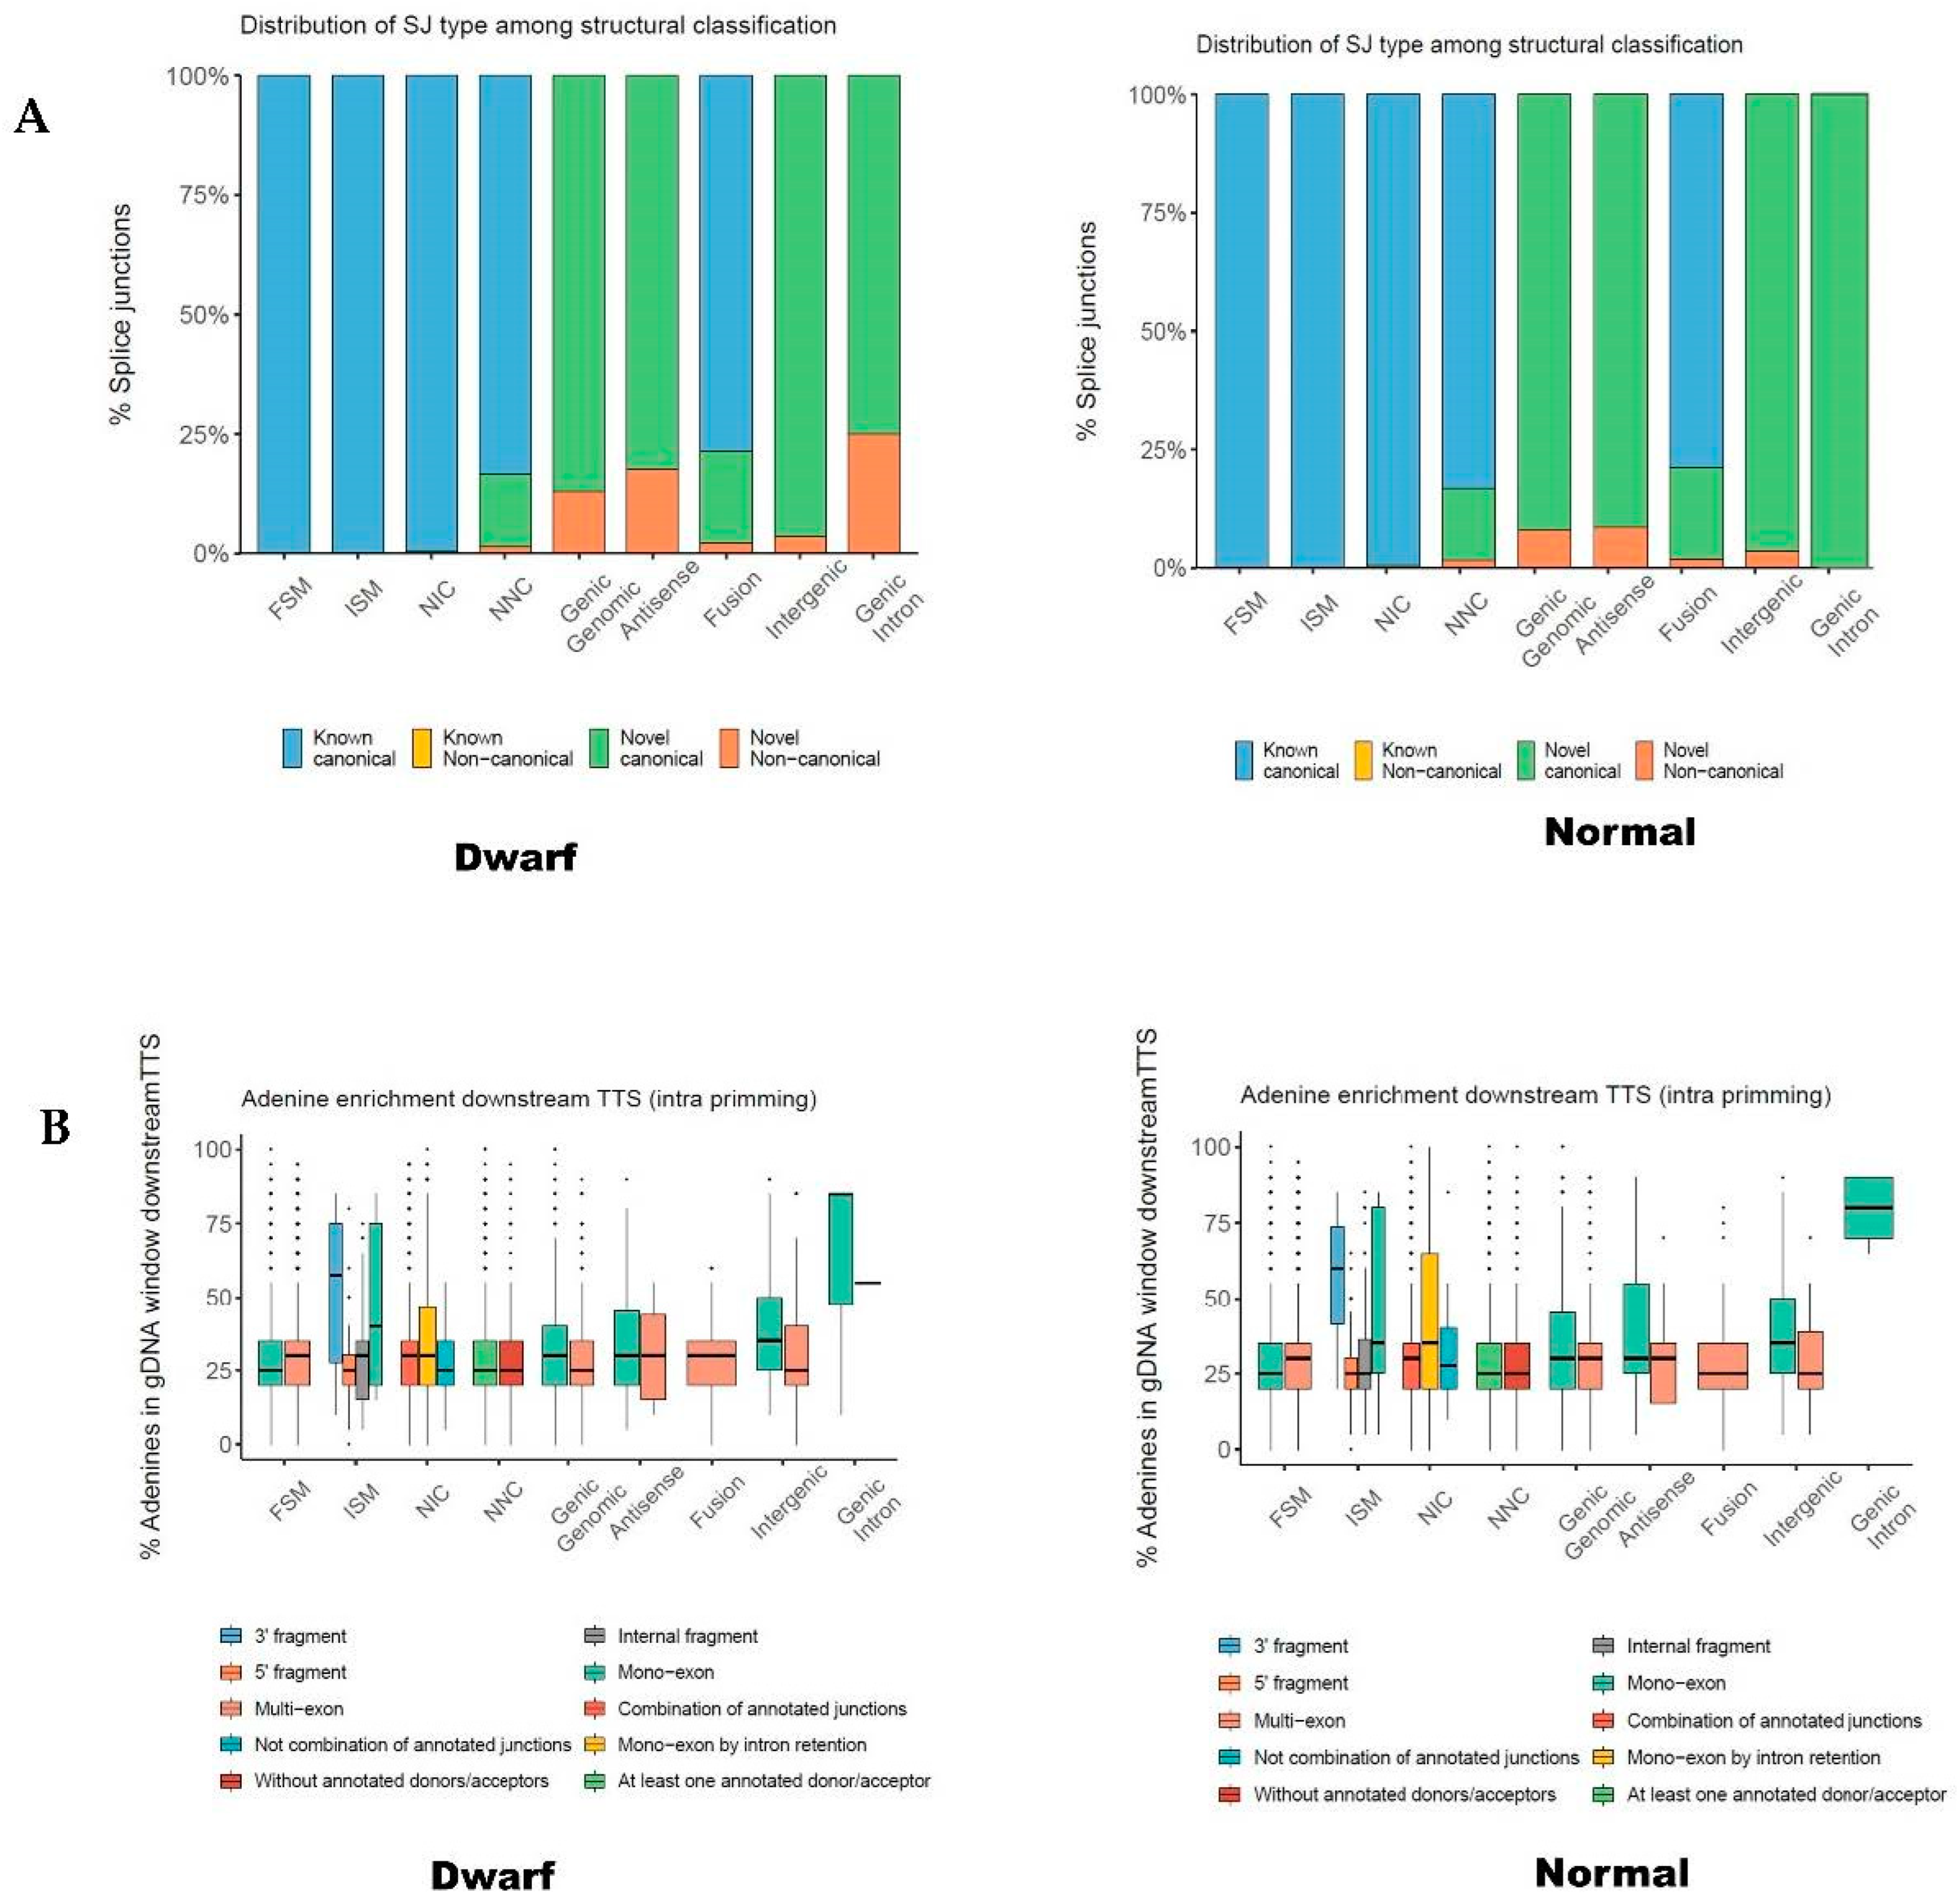
3.3. Characterization of Transcripts Based on Splice Junctions (SJs)

The percentage distribution of SJs was similar in both dwarf and normal individuals (Figure 5A). When we examined the SJ distribution, the known SJs included all canonical types in both dwarf and normal individuals (dwarf 155,268 and normal 156,073: Table 2). However, among the novel SJs, 92% (9937 dwarf and 9343 normal) were canonical, and approximately 8% (858 dwarf and 863 normal) were noncanonical types (Table 2). Across the structural categories, the noncanonical SJs were absent in the NIC, FSM, and ISM categories (Figure 5A). The NNC and fusion categories included three types of SJs (viz., known canonical, novel canonical, and novel noncanonical SJs). In contrast, the genic genomic, antisense, intergenic, and genic intron categories consisted of only novel canonical and novel noncanonical SJs (Figure 5A). The only exception was the normal soybean genic intron category, comprising only novel canonical SJs. Across the structural subcategories, they all included monoexon and multiexon isoforms except for ISM, NIC, and NNC (Supplementary Table S4). The ISMs consisted of isoforms formed by 3′ fragments, 5′ fragments, internal fragments, and monoexons; NIC consisted of monoexons associated with intron retention and a combination of annotated junctions; and NNC consisted of two types of isoforms (viz., those with at least one annotated donor/acceptor and those with no annotated donor/acceptor) (Figure 5B).

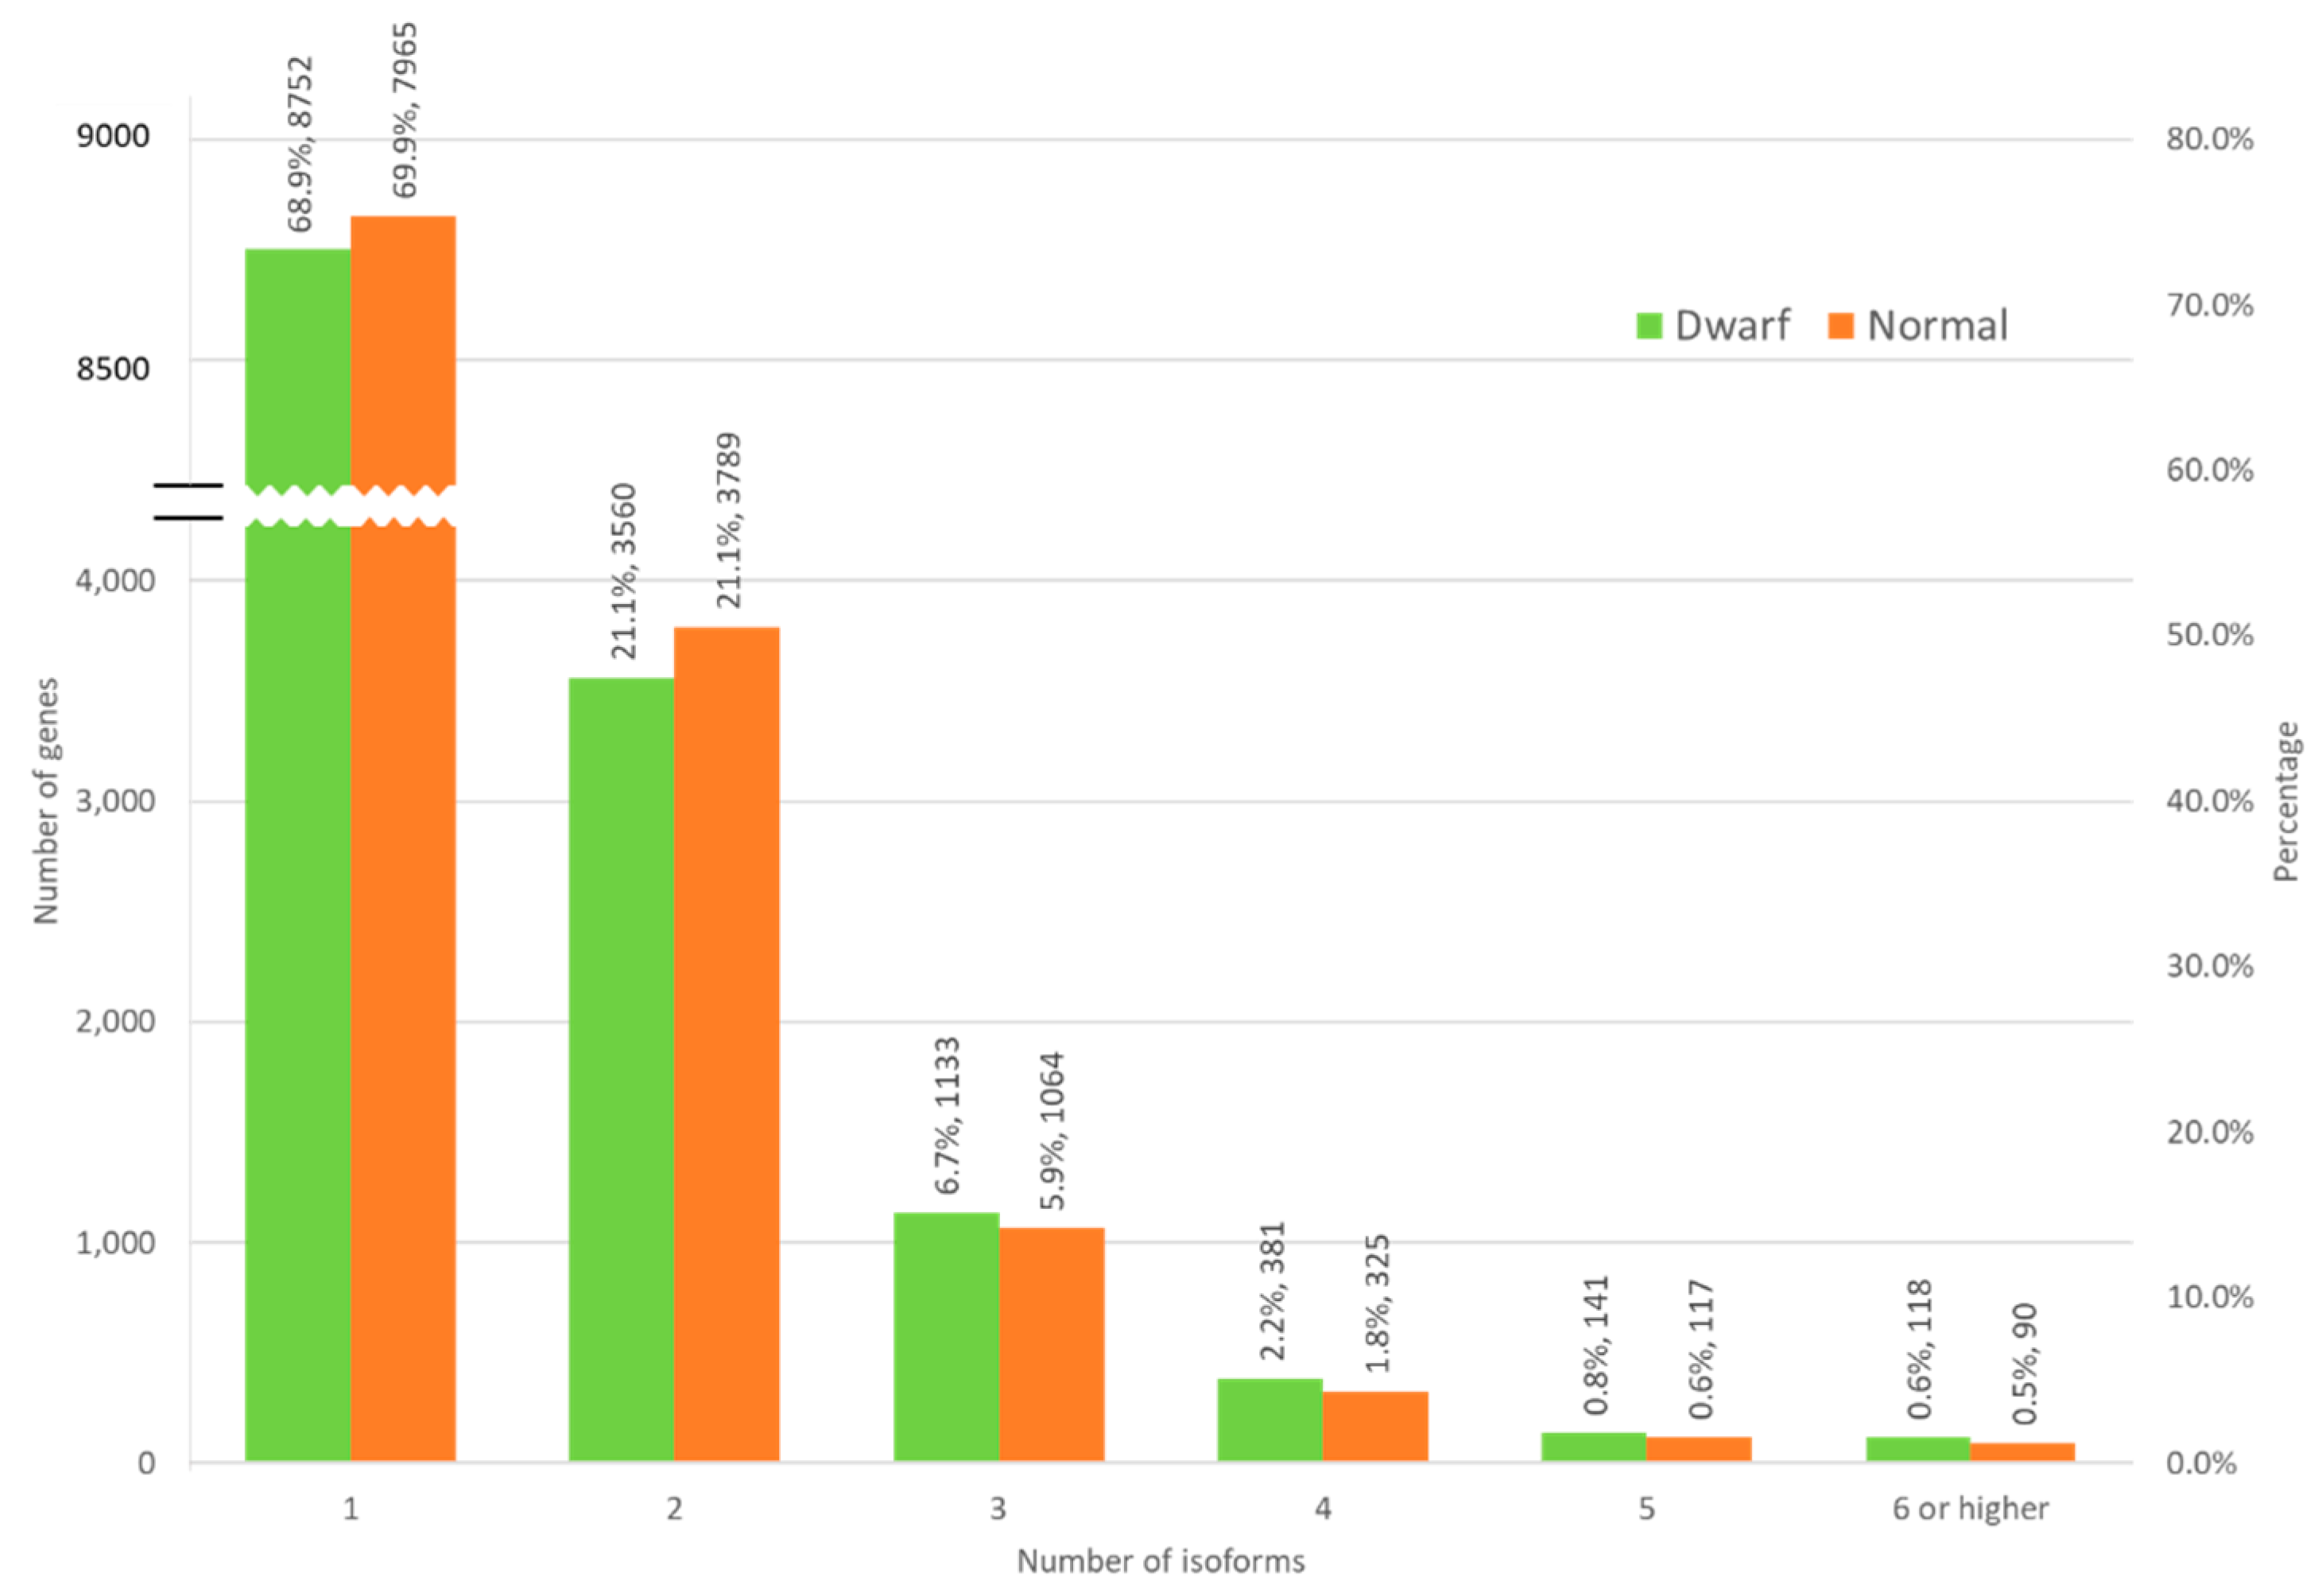
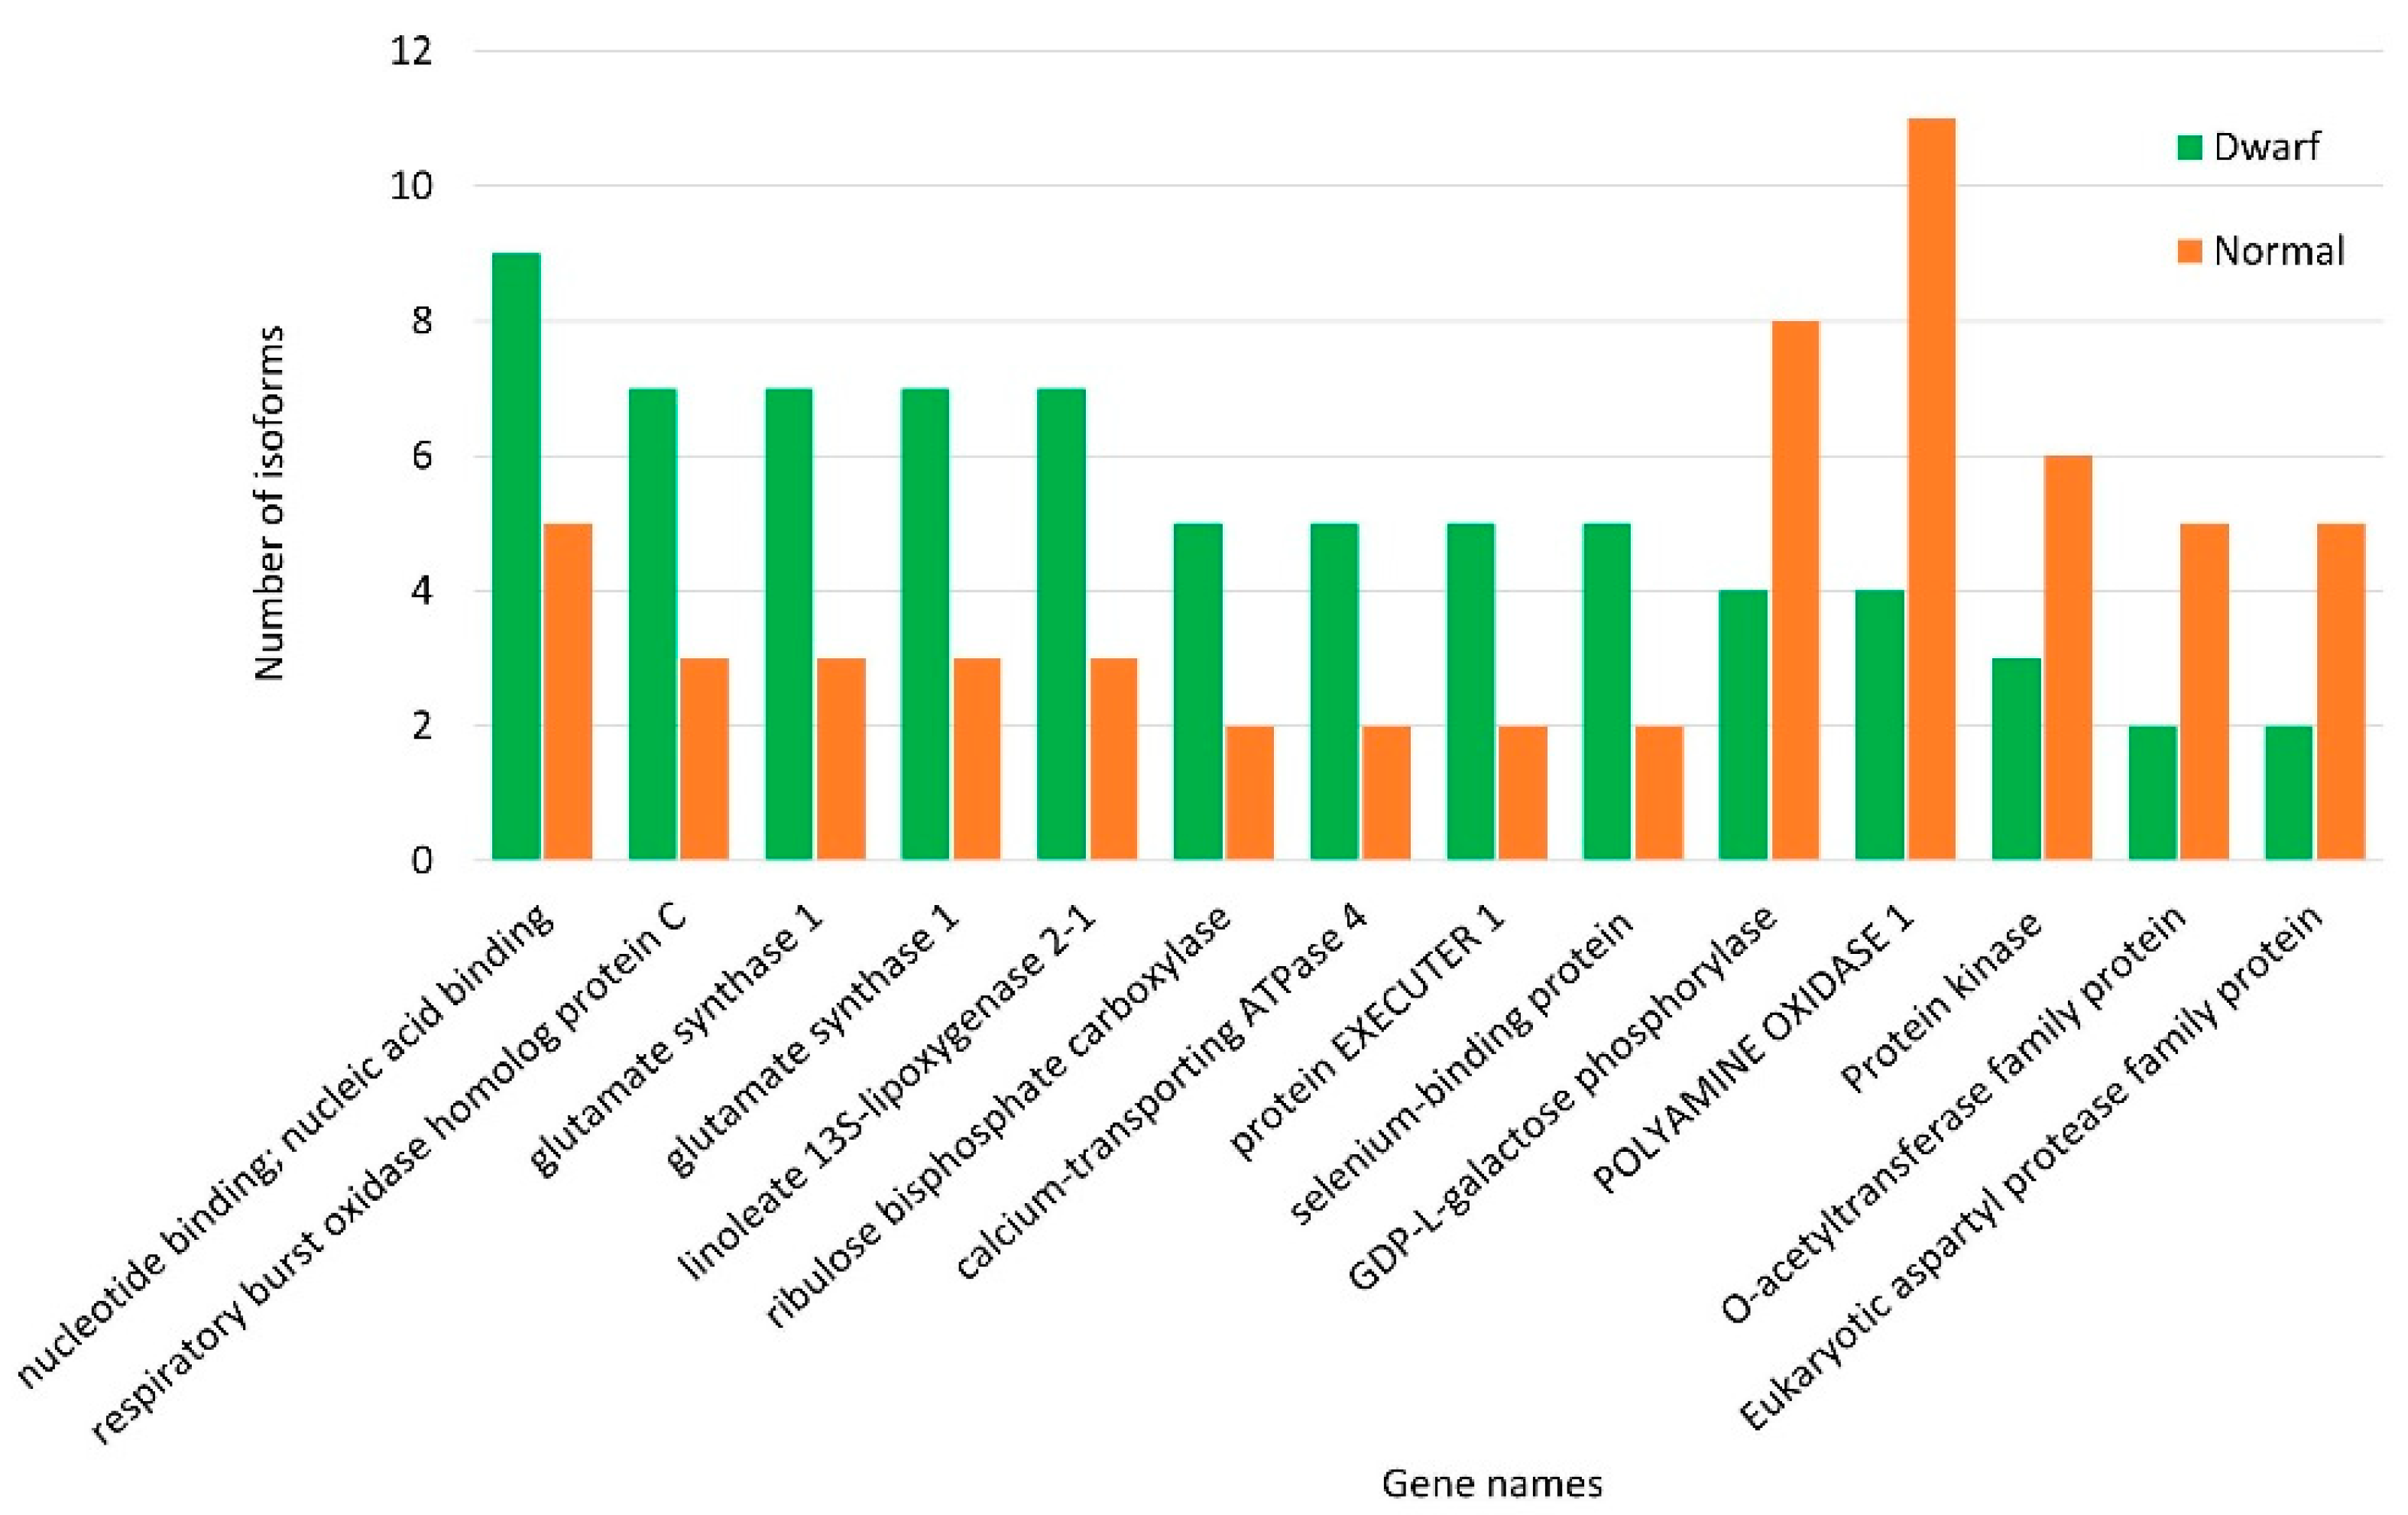
3.4. Isoform Distribution across Normal and Dwarf Lines

We observed that the isoforms in a number of genes demonstrated different numbers in the dwarf and normal lines. We shortlisted such isoforms, and 61 genes showed a difference of 3 or more between dwarf and normal lines (Supplementary Table S5). For example, the GLYMA_14G209400 gene had 4 isoforms in the dwarf line and 11 isoforms in the normal lines. Moreover, GLYMA_14G092800 had 10 isoforms in the dwarf line and 7 in the normal lines. We observed the dwarf line compared with normal controls. Among the 61 genes, 14 were related to the defense response, with the dwarf type demonstrating the greatest number of isoforms of all the genes (Figure 6). Among the shortlisted isoforms, the 61 genes produced 283 and 258 isoforms in the dwarf and normal plants, respectively (Supplementary Tables S5 and S6). Approximately 50% of the identified isoforms were novel in both the dwarf and normal lines (129 in dwarf and 100 in normal). The majority of isoforms were produced from canonical SJs.

4. Discussion

In the current study, we obtained a large number of isoforms from the majority of the identified genes. Among an average of 16,089 genes from both lines (normal and dwarf), 69.18% were annotated with no isoforms compared to the remaining 30.7%, which had at least two or more isoforms. We identified 166,171 SJ events, among which 93.8% were canonical and ~6% were novel canonical and noncanonical SJs. This number is higher than the 115,881 events reported in a previous work [40], of which 95% were canonical SJs, higher than the percentage identified in the current study. Another study in G. max reported 99.69% canonical junctions [23]. SQANTI analysis confirmed the enrichment of RT switching among novel SJs in NNCs. The higher percentage of noncanonical junctions might have occurred due to RT switching (Supplementary Figure S4). The average number of isoforms identified in our study was 2.5 per gene, which is lower than the numbers reported in other plants, such as Zea mays (6.56 isoforms per gene) [31] and Brassica napus (3.81) [22]. The genome size of soybean and B. napus is similar, thus; we assumed there is no simple correlation between genome size and isoform numbers. In addition, the numbers of ORF coding genes are doubled in soybean compared to maize, but the average numbers of isoforms in maize are 2.5 times higher than in soybean. Further investigation is suggested.
The event of alternative splicing among transcripts decreases from the 5′ end to the 3′ end [41], as confirmed by our data. We observed that the maximum number of isoforms were distributed near TSSs rather than TTSs (Supplementary Figure S3A–D). The nonfunctional isoform synthesis in plants illustrated how they avoid the unfavorable effects and metabolic costs that occur under the effect of stress when functional proteins confer resistance [42]. Mastrangelo et al. [43] suggested alteration in the splicing sites under biotic/abiotic stresses occurred, and the production of full-length proteins saved time and energy in the transcriptional activation and accumulation of necessary mRNAs. Furthermore, it was reported that the formation of a large number of unproductive isoforms is a widespread phenomenon among plant circadian clock genes [25].
According to the SQANTI classification of unigenes, 96.79% of the identified genes belonged to the known categories (FSM, ISM, NIC, and NNC) compared with the remaining genes, which were classified as novel genes. The NIC and NNC comprised those isoforms that were predicted to become known genes, among which the NNC contained the greatest number of genes. Intron retention contributes to the majority of alternative splicing events in plants [22,31,44]. In the SQANTI analysis, possible isoforms resulting from intron retention (in addition to NIC transcripts) can be classified under the fusion, genic genomic, or genic intron categories since partial introns are also included. The total number of isoforms in all of the above categories accounted for 17% of all isoforms. Shen et al. reported 26.47% IR alternative splicing events in G. max [23], which is an extremely high percentage compared to that observed in our study. This can be attributed to the fact that we surveyed alternative splicing events from a single leaf tissue instead of multiple tissues. In addition, we used a classification system based on SQANTI with 47 separate subcategories and ASTALAVISTA [45], which only performed categorization in 11 classes. By comparing multiexon genes, we discovered that 86.65% of these genes revealed AS. Reddy et al. [13] demonstrated that more than 60% of multiexon genes in plants indicated alternative splicing under biotic/abiotic stresses [46]. We established that the identified novel isoforms accounted for 19% of the isoforms present in our plants (Supplementary Tables S1 and S2), with 12% located in coding regions. The impact of these genes on protein alterations and their effect on phenotypes need further investigation.
Our primary objective was to observe the major differences in the number of isoforms between the two soybean lines (normal and dwarf); therefore, we shortlisted the genes that were common to the two lines and illustrated extreme contrast in the isoform count. Among the identified genes, we observed that the maximum genes associated with plant stress responses were discovered to have fewer isoforms in the dwarf line than in the normal line. For example, GLYMA_04G017500 and GLYMA_08G293100 were found to negatively regulate growth in response to biotic/abiotic stresses and have more than double the isoforms numbers in the dwarf line (Supplementary Table S5). In our previous work, we established that the expression of defense response genes was upregulated while that of genes related to photosynthesis was downregulated [33]. The greater number of isoforms in dwarf lines may indicate the production of nonfunctional isoforms that could be responsible for the dwarf phenotype. In post-transcriptional gene regulation, alternative splicing isoforms may produce stop codons due to frameshifts in mature mRNA sequences leading to the occurrence of NMD [26]. Similarly, genes associated with carbohydrate metabolism primarily indicated a greater number of isoforms in the dwarf line. Apart from a few exceptions, most of the stress response and growth-related genes showed higher numbers of isoforms in the dwarf line. In contrast, GLYMA_14G209400 and GLYMA_08G303800, both of which are flavin-containing amine oxidases, showed fewer isoforms in the dwarf line. In Arabidopsis and Brassica juncea, it has been reported that shoots in which flavin amino oxidase is downregulated are highly regenerative, suggesting an effect on plant growth [47]. This indicates that greater numbers of isoforms are correlated with non-functionality. This study, however, has few limitations. The tissue sample size is small, and we were not able to check the reproducibility and repeatability of the AS due to cost constraints. The list of genes presented here could be a valuable asset to further research to understand the impacts of these isoforms on plant growth.

5. Conclusions

The current study is one of the first to adopt the SQANTI process to identify isoforms in plants. Prior to this, the method was reported only in mouse [32] and human cells [48]. More than 30% of the identified genes indicated two or more isoforms, among which 17% were categorized as novel isoforms. In addition, the results in this study have enhanced the knowledge of the unexplored process of alternative splicing. Tissue-specific analysis, along with isoform expression analyses, need to be performed to understand the detailed role of genome expression/functions in driving the growth phenotype of soybean. This information could be essential to comprehensive trait characterization for gene discovery in genome editing examples

Supplementary Materials

The following supporting information can be downloaded at: https://www.mdpi.com/article/10.3390/agronomy12071685/s1, Figure S1: Percentage distribution of mono exon and multi exon transcripts in dwarf and normal soybean, Figure S2: A and B – Transcript length distribution across structural categories, C and D – Exon number distribution across transcripts, Figure S3: (A) Overlap at 5’ and (B) 3’ ends between the FSM and their respective matched reference transcripts. (TSS) transcription start site, (TTS) transcription termination site in dwarf soybean. Negative values indicate that the sequenced TTS is upstream annotated TTS, (C) Overlap at 5’ and (D) 3’ ends between the FSM and their respective matched reference transcripts. (TSS) transcription start site, (TTS) transcription termination site in dwarf soybean. Negative values indicate that the sequenced TTS is upstream annotated TTS, Figure S4: Detection of RT switching in structural categories by Sqanti algorithm; Table S1: List of Isoforms in Normal soybean line, Table S2: List of Isoforms in Dwarf soybean line, Table S3: Number of distribution of isoforms into structural categories based on SQANTI, Table S4: Distribution of isoforms into sub categories on the basis of sqanti, Table S5: list of isoforms showing extreme differences in number among dwarf and normal soybean, Table S6: Details of structural categories and type of shortlisted isoforms (of Supplementary table 3) among dwarf and normal.

Author Contributions

I.-Y.C. and K.-C.P. conceived and designed the project and edited the manuscript. N.S.R., P.B. and R.V.R. prepared the sample materials, analyzed the data, and drafted the manuscript. T.U. and J.-K.Y. contributed to writing and editing the manuscript. All authors have read and agreed to the published version of the manuscript.

Funding

This work was supported by the National Research Foundation of Korea (NRF) grant funded by the Korea government (MSIT) (NRF-2020R1I1A3052662).

Informed Consent Statement

Not applicable.

Data Availability Statement

All raw sequencing data were submitted to the National Centre for Biotechnology Information (NCBI) under Bio Project ID PRJNA757530 and sample accessions as SAMN20965967 for dwarf soybean (submitted on 25 August 2021, https://www.ncbi.nlm.nih.gov/biosample/20965967, accessed on 25 August 2021), SAMN20965968 for normal soybean (https://www.ncbi.nlm.nih.gov/biosample/20965968, accessed on 25 August 2021). The data is available for public access using the above URLs.

Conflicts of Interest

The authors declare no conflict of interest.

References

  1. Beverly, R.L. Safety of Food and Beverages: Cereals and Derived Products. In Encyclopedia of Food Safety; Motarjemi, Y., Ed.; Academic Press: Cambridge, MA, USA, 2014; pp. 309–314. [Google Scholar] [CrossRef]
  2. Su, C.F. QTL mapping, validation and candidate genes analysis for plant height in maize. Indian J. Genet. Plant Breed. 2018, 78, 443–453. [Google Scholar] [CrossRef]
  3. Chen, X.; Xu, P.; Zhou, J.; Tao, D.; Yu, D. Mapping and breeding value evaluation of a semi-dominant semi-dwarf gene in upland rice. Plant Divers. 2018, 40, 238–244. [Google Scholar] [CrossRef] [PubMed]
  4. Chairi, F.; Sanchez-Bragado, R.; Serret, M.D.; Aparicio, N.; Nieto-Taladriz, M.T.; Luis Araus, J. Agronomic and physiological traits related to the genetic advance of semi-dwarf durum wheat: The case of Spain. Plant Sci. 2020, 295, 110210. [Google Scholar] [CrossRef] [PubMed]
  5. Hedden, P. The genes of the Green Revolution. Trends Genet. 2003, 19, 5–9. [Google Scholar] [CrossRef]
  6. Khush, G.S. Green revolution: The way forward. Nat. Rev. Genet. 2001, 2, 815–822. [Google Scholar] [CrossRef]
  7. Peng, J.; Richards, D.E.; Hartley, N.M.; Murphy, G.P.; Devos, K.M.; Flintham, J.E.; Beales, J.; Fish, L.J.; Worland, A.J.; Pelica, F.; et al. Green revolution’ genes encode mutant gibberellin response modulators. Nature 1999, 400, 256–261. [Google Scholar] [CrossRef]
  8. Chen, Y.W.; Nelson, R.L. Variation in early plant height in wild soybean. Crop Sci. 2006, 46, 865–869. [Google Scholar] [CrossRef]
  9. Josie, J.; Alcivar, A.; Rainho, J.; Kassem, M.A. Research Article: Genomic regions containing QTL for plant height, internodes length, and flower color in soybean [Glycine max (L.) Merr]. Bios 2007, 78, 119–126. [Google Scholar] [CrossRef]
  10. Xue, H.; Tian, X.C.; Zhang, K.X.; Li, W.B.; Qi, Z.Y.; Fang, Y.L.; Li, X.Y.; Wang, Y.; Song, J.; Li, W.X.; et al. Mapping developmental QTL for plant height in soybean [Glycine max (L.) Merr.] using a four-way recombinant inbred line population. PLoS ONE 2019, 14, e0224897. [Google Scholar] [CrossRef] [Green Version]
  11. Becklin, K.M.; Anderson, J.T.; Gerhart, L.M.; Wadgymar, S.M.; Wessinger, C.A.; Ward, J.K. Examining Plant Physiological Responses to Climate Change through an Evolutionary Lens. Plant Physiol. 2016, 172, 635–649. [Google Scholar] [CrossRef]
  12. Guerra, D.; Crosatti, C.; Khoshro, H.H.; Mastrangelo, A.M.; Mica, E.; Mazzucotelli, E. Post-transcriptional and post-translational regulations of drought and heat response in plants: A spider’s web of mechanisms. Front. Plant Sci. 2015, 6, 57. [Google Scholar] [CrossRef] [Green Version]
  13. Reddy, A.S.; Marquez, Y.; Kalyna, M.; Barta, A. Complexity of the alternative splicing landscape in plants. Plant Cell 2013, 25, 3657–3683. [Google Scholar] [CrossRef] [PubMed] [Green Version]
  14. Skelly, M.J.; Frungillo, L.; Spoel, S.H. Transcriptional regulation by complex interplay between post-translational modifications. Curr. Opin. Plant Biol. 2016, 33, 126–132. [Google Scholar] [CrossRef] [PubMed] [Green Version]
  15. Syed, N.H.; Kalyna, M.; Marquez, Y.; Barta, A.; Brown, J.W. Alternative splicing in plants—Coming of age. Trends Plant Sci. 2012, 17, 616–623. [Google Scholar] [CrossRef] [PubMed] [Green Version]
  16. Chamala, S.; Feng, G.; Chavarro, C.; Barbazuk, W.B. Genome-wide identification of evolutionarily conserved alternative splicing events in flowering plants. Front. Bioeng. Biotechnol. 2015, 3, 33. [Google Scholar] [CrossRef] [Green Version]
  17. Filichkin, S.A.; Priest, H.D.; Givan, S.A.; Shen, R.; Bryant, D.W.; Fox, S.E.; Wong, W.K.; Mockler, T.C. Genome-wide mapping of alternative splicing in Arabidopsis thaliana. Genome Res. 2010, 20, 45–58. [Google Scholar] [CrossRef] [Green Version]
  18. Marquez, Y.; Brown, J.W.; Simpson, C.; Barta, A.; Kalyna, M. Transcriptome survey reveals increased complexity of the alternative splicing landscape in Arabidopsis. Genome Res. 2012, 22, 1184–1195. [Google Scholar] [CrossRef] [Green Version]
  19. Thatcher, S.R.; Zhou, W.; Leonard, A.; Wang, B.B.; Beatty, M.; Zastrow-Hayes, G.; Zhao, X.; Baumgarten, A.; Li, B. Genome-wide analysis of alternative splicing in Zea mays: Landscape and genetic regulation. Plant Cell 2014, 26, 3472–3487. [Google Scholar] [CrossRef] [Green Version]
  20. Schmutz, J.; Cannon, S.B.; Schlueter, J.; Ma, J.; Mitros, T.; Nelson, W.; Hyten, D.L.; Song, Q.; Thelen, J.J.; Cheng, J.; et al. Genome sequence of the palaeopolyploid soybean. Nature 2010, 463, 178–183. [Google Scholar] [CrossRef] [Green Version]
  21. Keller, M.; Hu, Y.; Mesihovic, A.; Fragkostefanakis, S.; Schleiff, E.; Simm, S. Alternative splicing in tomato pollen in response to heat stress. DNA Res. 2017, 24, 205–217. [Google Scholar] [CrossRef] [Green Version]
  22. Yao, S.; Liang, F.; Gill, R.A.; Huang, J.; Cheng, X.; Liu, Y.; Tong, C.; Liu, S. A global survey of the transcriptome of allopolyploid Brassica napus based on single-molecule long-read isoform sequencing and Illumina-based RNA sequencing data. Plant J. 2020, 103, 843–857. [Google Scholar] [CrossRef] [PubMed]
  23. Shen, Y.; Zhou, Z.; Wang, Z.; Li, W.; Fang, C.; Wu, M.; Ma, Y.; Liu, T.; Kong, L.A.; Peng, D.L.; et al. Global dissection of alternative splicing in paleopolyploid soybean. Plant Cell 2014, 26, 996–1008. [Google Scholar] [CrossRef] [PubMed] [Green Version]
  24. Filichkin, S.A.; Cumbie, J.S.; Dharmawardhana, P.; Jaiswal, P.; Chang, J.H.; Palusa, S.G.; Reddy, A.S.N.; Megraw, M.; Mockler, T.C. Environmental Stresses Modulate Abundance and Timing of Alternatively Spliced Circadian Transcripts in Arabidopsis. Mol. Plant 2015, 8, 207–227. [Google Scholar] [CrossRef] [PubMed] [Green Version]
  25. Filichkin, S.A.; Mockler, T.C. Unproductive alternative splicing and nonsense mRNAs: A widespread phenomenon among plant circadian clock genes. Biol. Direct 2012, 7, 20. [Google Scholar] [CrossRef] [PubMed] [Green Version]
  26. Kalyna, M.; Simpson, C.G.; Syed, N.H.; Lewandowska, D.; Marquez, Y.; Kusenda, B.; Marshall, J.; Fuller, J.; Cardle, L.; McNicol, J.; et al. Alternative splicing and nonsense-mediated decay modulate expression of important regulatory genes in Arabidopsis. Nucleic Acids Res. 2012, 40, 2454–2469. [Google Scholar] [CrossRef] [PubMed] [Green Version]
  27. Kim, J.A.; Roy, N.S.; Lee, I.H.; Choi, A.Y.; Choi, B.S.; Yu, Y.S.; Park, N.I.; Park, K.C.; Kim, S.; Yang, H.S.; et al. Genome-wide transcriptome profiling of the medicinal plant Zanthoxylum planispinum using a single-molecule direct RNA sequencing approach. Genomics 2019, 111, 973–979. [Google Scholar] [CrossRef]
  28. Sharon, D.; Tilgner, H.; Grubert, F.; Snyder, M. A single-molecule long-read survey of the human transcriptome. Nat. Biotechnol. 2013, 31, 1009–1014. [Google Scholar] [CrossRef]
  29. Oikonomopoulos, S.; Wang, Y.C.; Djambazian, H.; Badescu, D.; Ragoussis, J. Benchmarking of the Oxford Nanopore MinION sequencing for quantitative and qualitative assessment of cDNA populations. Sci. Rep. 2016, 6, 31602. [Google Scholar] [CrossRef] [Green Version]
  30. Pearman, W.S.; Freed, N.E.; Silander, O.K. Testing the advantages and disadvantages of short- and long- read eukaryotic metagenomics using simulated reads. BMC Bioinform. 2020, 21, 220. [Google Scholar] [CrossRef]
  31. Wang, B.; Tseng, E.; Regulski, M.; Clark, T.A.; Hon, T.; Jiao, Y.; Lu, Z.; Olson, A.; Stein, J.C.; Ware, D. Unveiling the complexity of the maize transcriptome by single-molecule long-read sequencing. Nat. Commun. 2016, 7, 11708. [Google Scholar] [CrossRef] [Green Version]
  32. Tardaguila, M.; de la Fuente, L.; Marti, C.; Pereira, C.; Pardo-Palacios, F.J.; Del Risco, H.; Ferrell, M.; Mellado, M.; Macchietto, M.; Verheggen, K.; et al. SQANTI: Extensive characterization of long-read transcript sequences for quality control in full-length transcriptome identification and quantification. Genome Res. 2018, 28, 396–411. [Google Scholar] [CrossRef] [PubMed] [Green Version]
  33. Ban, Y.W.; Roy, N.S.; Yang, H.; Choi, H.K.; Kim, J.H.; Babu, P.; Ha, K.S.; Ham, J.K.; Park, K.C.; Choi, I.Y. Comparative transcriptome analysis reveals higher expression of stress and defense responsive genes in dwarf soybeans obtained from the crossing of G. max and G. soja. Genes Genom. 2019, 41, 1315–1327. [Google Scholar] [CrossRef] [PubMed]
  34. Roy, N.S.; Ban, Y.W.; Yoo, H.; Ramekar, R.V.; Cheong, E.J.; Park, N.I.; Na, J.K.; Park, K.C.; Choi, I.Y. Analysis of genome variants in dwarf soybean lines obtained in F6 derived from cross of normal parents (cultivated and wild soybean). Genom. Inf. 2021, 19, e19. [Google Scholar] [CrossRef] [PubMed]
  35. Chin, C.S.; Alexander, D.H.; Marks, P.; Klammer, A.A.; Drake, J.; Heiner, C.; Clum, A.; Copeland, A.; Huddleston, J.; Eichler, E.E.; et al. Nonhybrid, finished microbial genome assemblies from long-read SMRT sequencing data. Nat. Methods 2013, 10, 563–569. [Google Scholar] [CrossRef]
  36. Fu, L.; Niu, B.; Zhu, Z.; Wu, S.; Li, W. CD-HIT: Accelerated for clustering the next-generation sequencing data. Bioinformatics 2012, 28, 3150–3152. [Google Scholar] [CrossRef]
  37. Wu, T.D.; Watanabe, C.K. GMAP: A genomic mapping and alignment program for mRNA and EST sequences. Bioinformatics 2005, 21, 1859–1875. [Google Scholar] [CrossRef] [Green Version]
  38. Bayega, A.; Fahiminiya, S.; Oikonomopoulos, S.; Ragoussis, J. Current and Future Methods for mRNA Analysis: A Drive toward Single Molecule Sequencing. Methods Mol. Biol. 2018, 1783, 209–241. [Google Scholar] [CrossRef]
  39. Soneson, C.; Yao, Y.; Bratus-Neuenschwander, A.; Patrignani, A.; Robinson, M.D.; Hussain, S. A comprehensive examination of Nanopore native RNA sequencing for characterization of complex transcriptomes. Nat. Commun. 2019, 10, 3359. [Google Scholar] [CrossRef] [Green Version]
  40. Iniguez, L.P.; Ramirez, M.; Barbazuk, W.B.; Hernandez, G. Identification and analysis of alternative splicing events in Phaseolus vulgaris and Glycine max. BMC Genom. 2017, 18, 650. [Google Scholar] [CrossRef] [Green Version]
  41. Bentley, D.L. Coupling mRNA processing with transcription in time and space. Nat. Rev. Genet. 2014, 15, 163–175. [Google Scholar] [CrossRef] [Green Version]
  42. Dubrovina, A.S.; Kiselev, K.V.; Zhuravlev, Y.N. The role of canonical and noncanonical pre-mRNA splicing in plant stress responses. Biomed Res. Int. 2013, 2013, 264314. [Google Scholar] [CrossRef] [PubMed]
  43. Mastrangelo, A.M.; Marone, D.; Laido, G.; De Leonardis, A.M.; De Vita, P. Alternative splicing: Enhancing ability to cope with stress via transcriptome plasticity. Plant Sci. 2012, 185–186, 40–49. [Google Scholar] [CrossRef] [PubMed]
  44. Schmutz, J.; McClean, P.E.; Mamidi, S.; Wu, G.A.; Cannon, S.B.; Grimwood, J.; Jenkins, J.; Shu, S.; Song, Q.; Chavarro, C.; et al. A reference genome for common bean and genome-wide analysis of dual domestications. Nat. Genet. 2014, 46, 707–713. [Google Scholar] [CrossRef] [PubMed] [Green Version]
  45. Foissac, S.; Sammeth, M. ASTALAVISTA: Dynamic and flexible analysis of alternative splicing events in custom gene datasets. Nucleic Acids Res. 2007, 35, W297–W299. [Google Scholar] [CrossRef] [PubMed] [Green Version]
  46. Staiger, D.; Brown, J.W.S. Alternative Splicing at the Intersection of Biological Timing, Development, and Stress Responses. Plant Cell 2013, 25, 3640–3656. [Google Scholar] [CrossRef] [Green Version]
  47. Lim, T.S.; Chitra, T.R.; Han, P.; Pua, E.C.; Yu, H. Cloning and characterization of Arabidopsis and Brassica juncea flavin-containing amine oxidases. J. Exp. Bot. 2006, 57, 4155–4169. [Google Scholar] [CrossRef] [PubMed] [Green Version]
  48. Ray, T.A.; Cochran, K.; Kozlowski, C.; Wang, J.; Alexander, G.; Cady, M.A.; Spencer, W.J.; Ruzycki, P.A.; Clark, B.S.; Laeremans, A.; et al. Comprehensive identification of mRNA isoforms reveals the diversity of neural cell-surface molecules with roles in retinal development and disease. Nat. Commun. 2020, 11, 3328. [Google Scholar] [CrossRef]
Figure 1. Alternative spliced isoforms based on the SQANTI classification according to their splice junctions and donor and acceptor sites. Splice donors and acceptors are indicated in blue lines and red lines indicate novel donors and acceptors. The categories are full splice match (FSM), incomplete splice match (ISM), novel in catalogues (NIC), not novel in catalogues (NNC), antisense, fusion, genic genomic, intergenic, and genic intron. Black boxes refer to reference gene linked with black lines as introns and grey boxes refer to transcripts in which blue and red lines represent introns where blue introns are formed due to known splice sites and red introns are formed due to unknown splice sites (donor or acceptors).
Agronomy 12 01685 g001
Figure 2. Schematic representation of RIL lines obtained from the cross of the cultivar soybean Peking and wild relative soja; both parents have normal phenotype as shown in the top. The plants in the bottom represent the normal and dwarf lines obtained in this cross.
Agronomy 12 01685 g002
Figure 3. Isoform distribution. The chart represents the number of genes exhibiting the number of isoforms where the maximum number of genes have single unigenes and more than 30% of the genes have at least two or more isoforms.
Agronomy 12 01685 g003
Figure 4. Alternative spliced isoform distribution across structural categories based on SQANTI in soybean. The maximum number of isoforms were under the FSM category whereas ~15% of the isoforms under newly formed from known genes were NIC and NNC. The novel categories were genic genomic, fusion, intergenic, antisense, and genic intron.
Agronomy 12 01685 g004
Figure 5. (A) Distribution of splice junction (SJ) types across SQANTI categories. NNC, genic genomic, antisense, fusion, intergenic, and genic intron are enriched in noncanonical SJs. (B) Percentage of adenine in the 20 nt window of genomic DNA downstream from TTS. All groups had monoexon and multiexon isoforms except ISM and NIC. NIC consisted of a combination of annotated junctions, mono exon by intron retention, and not combination of annotated junctions. ISM consisted of isoforms formed by 3′ fragment, 5′ fragment, internal fragment, and monoexons. NNC consisted of two types of isoforms viz. at least one annotated donor/acceptor and combination of annotated.
Agronomy 12 01685 g005
Figure 6. Number of isoforms in dwarf and normal soybean lines among genes related to the defense response. The maximum number of genes had an increased number of isoforms in dwarf as compared to normal soybean.
Agronomy 12 01685 g006
Table 1. Pacbio summary statistics in dwarf and normal soybean.
Analysis Metric2012-1-D-Cell12012-N-Cell3
Circular consensus sequence (CCS) reads432,188472,286
Reads with 5′ and 3′ Primers388,646417,041
Nonconcatamer Reads with 5′ and 3′ Primers379,934405,227
Nonconcatamer Reads with 5′ and 3′ Primers and Poly-A Tail379,564404,629
Unique Primers11
Number of CCS bases1,090,153,0551,144,205,297
CCS Read Length (mean)25222422
Mean Reads per Primer388,646417,041
Reads without Primers43,54255,245
Transcript clustering
Number of polished high-quality isoforms42,58244,762
Number of polished low-quality isoforms91179
CD-Hit: Collapsing redundant
Non-redundant Transcripts34,83236,772
Number of Isoforms16,88717,926
Min Isoform length147 bp172 bp
Max Isoform length11,317 bp8310 bp
Average Isoform length2366 bp2235 bp
Total length of contigs82,427,510 bp82,191,889 bp
Table 2. Distribution of transcripts and splice junctions (SJs) in the structural categories in dwarf and normal soybean.
ClassificationCategoriesNumber in DwarfNumber in NormalAverage Percentage
Genes15,57016,608
Isoforms16,88717,926
Gene ClassificationAnnotated Genes15,41316,46299.12
Novel Genes1571460.89
SJ classificationKnown canonical155,268156,07393.86
Known Noncanonical000
Novel canonical993793435.61
Novel Noncanonical8588630.51
Characterization of transcripts based on splice junctionsFSM13,13214,50779.39
ISM1902301.21
NIC178215859.67
NNC120010696.52
Genic Genomic3953652.18
Fusion17200.11
Intergenic101910.55
Antisense68560.36
Genic Intron230.01
Publisher’s Note: MDPI stays neutral with regard to jurisdictional claims in published maps and institutional affiliations.

