
Short- and Medium-Term Effects of On-Farm Compost Addition on the Physical and Hydraulic Properties of a Clay Soil


Council for Agricultural Research and Economics, Research Centre for Agriculture and Environment (CREA-AA), Via C. Ulpiani 5, 70125 Bari, Italy
*
Authors to whom correspondence should be addressed.
Agronomy 2022, 12(6), 1446; https://doi.org/10.3390/agronomy12061446
Submission received: 16 May 2022
/
Revised: 11 June 2022
/
Accepted: 15 June 2022
/
Published: 16 June 2022
(This article belongs to the Special Issue Water Use Efficiency for Resilient Economies: Innovative Experimental Approaches Based on the Soil Conditioners)
Abstract
:Compost amendment is a widespread agronomic practice, but little information is available about the short- and medium-term effects on clay soils. In this investigation, we selected three soil compost rates (treatments, T), i.e., fertilizer (T2 = 1.5 kg m−2), amending (T3 = 15 kg m−2), and organic (T4 = 75 kg m−2), that were compared to a control (T1). Our research accounts for the effects reached on representative large boxes (about 0.75 m3), without crops and for about eighteen months. An overall assessment of the physical and hydraulic properties of the soil was made, including infiltration rate or saturated hydraulic conductivity (Ks), water content and water retention (θ) of the soil, bulk density and structure, and several physical quality indicators obtained from the water retention curve, accounting for the optimal balance between water/air into the soil, pore volume distribution function, and soil features in the inflection point of the soil water retention curve. Additionally, the temporal changes of Ks were evaluated. The main results showed that (i) after eighteen months, and regardless of T, θ significantly improved by a factor of 1.2–1.3, but these improvements (up to 1%) were detected only close to water saturation (i.e., until 6 cm of soil pressure head) when little (T2) or no compost (T1) addition was considered, while a larger range was detected (until 60 cm) when higher rates (T3–T4) were used; (ii) Ks determination allowed to establish that compost effects vanished after about eleven months, but it was not possible to verify that composting increased the permeability of the investigated clay soil within that time frame; (iii) some significant correlations between Ks and some soil physical indicators estimated from both the inflection point of the water retention curve or bulk density suggested possible improvements in soil permeability. Because some factors (water content of the soil above all) could have affected the comparison of Ks measurements, further research on this topic is needed.
1. Introduction
Intensive agriculture can lead to soil degradation, and the increase in world food demand is expected to accentuate this issue [1]. One of the main causes of soil degradation is loss of soil fertility due to the progressive organic matter depletion of soil medium [1,2]. Therefore, with a decrease in structural porosity, loss of soil structure is expected, which can lead to a worsening of hydrodynamic soil properties [3,4]. Consequently, farm cropping systems should take account of such risk and manage, or stabilize, soil organic matter levels over time.
Horticultural crops typically produce a relatively large amount of organic waste due to the difference between marketable yields and plant residues. The on-farm composting of organic waste has been found to be environmentally sustainable in many investigations, both in terms of energy consumption and carbon emissions [5,6,7]. Therefore, using zero-kilometer compost may represent an agronomic practice to be suggested, especially when combined with other agroecological techniques [7,8].
It is well known that adding compost to soil improves the physical and hydraulic characteristics of the porous medium, including bulk density or porosity, water retention, and hydraulic conductivity (among others, e.g, [9,10,11]). For instance, Glab et al. [12] reported the effects of the addition of different co-composted maize, sewage sludge, and biochar mixtures on the physical properties of a sandy soil. Compared with unamended soil (control), the physical properties of amended soil were significantly improved, with positive effects that were dependent on both the compost rate and the type of feedstock. Another field investigation by Reynolds et al. [13], which evaluated the effects of compost addition (i.e., a control without compost application and compost rate of 75 and 300 dry t ha−1) on the physical quality of a clay loam soil, showed that (i) the control was substantially non-optimal, as poor aeration capacity, limited plant available water capacity, low macroporosity, high risk for structural degradation, and poor structural quality were detected; (ii) adding 75 t ha−1 of compost to the soil improved most of the aforementioned soil physical indicators, although some of them still indicated restricted aeration and plant available water or poor structural quality (i.e., RFC and PAWC or Sgi; Table 3a of aforementioned paper); (iii) the higher compost rate improved the overall physical quality of the investigated soil, values of the indicators reached the optimal values suggested by the literature, and the maize yields increased accordingly [13]. Furthermore, the aforementioned authors have shown that the application of soil physical quality indicators, mainly derived from the soil water retention curve, can be effective for studying the impact of compost addition on the physical and hydraulic properties of soil. They concluded that adding 75 t ha−1 of compost clearly improved both the physical quality and maize yield of the investigated soil, but the addition of 300 t ha−1 of compost was required to achieve optimal soil physical quality and the maximum measured maize yield. This research accounts for the effects recognized two years after compost application.
Overall, the long-term effects of compost addition to soil have been extensively investigated [14], and some studies have sporadically investigated the effects on structural stability in the medium term, namely, two–three years after amendments [15,16]. Rivier et al. [11], for example, pointed out that of the approximately six hundred articles published on the topic of compost use, only about 10% of them focused on evaluating the impact on soil structure and changes in hydraulic properties [17]. Furthermore, the short- or medium-term effect is largely underrepresented. However, regardless of the general attention paid by the scientific community to this issue, specific soils should be carefully considered, especially when subject to flooding and water stagnation for prolonged time periods [8,18]. In other words, investigations evaluating the short–medium-term effects on the physical and hydraulic properties of fine-textured soils are missing, and providing experimental results on this topic is necessary for various reasons, not least, to better calibrate the applied amendment rate, as well as the number of amendments over time.
The physical and hydraulic properties of a clay soil were quantified after the implementation of three levels of compost, and the short- and medium-term effects were evaluated. An overall assessment of the physical and hydraulic properties of the soil was made, including infiltration rate or saturated hydraulic conductivity, soil water content and soil water retention, and soil bulk density and structure, as well as a large number of soil physical quality indicators accounting for (i) soil compaction or balance between water/air of the soil, (ii) soil pore volume distribution function, and (iii) inflection point of the soil water retention curve.
2. Materials and Methods
2.1. Site and Experimental Devices
The investigation was carried out at the experimental farm “Campo 7” of the Italian Council for Agricultural Research and Economics-Research Centre for Agriculture and Environment (CREA-AA) at Metaponto, southern Italy, and lasted a total of about 18 months. The farm is substantially flat, but it is located at a lower elevation than the soils facing west and north-west. Because of heavy rainfall events, frequent flooding can occur with a rapid increase in groundwater levels.
The soil texture of the upper layer of the experimental farm (0–0.5 m) was a clay with 58.8 and 35.8% of clay and silt, respectively [19]. Further information on the study site can be found in Persiani et al. [7].
At the beginning of autumn 2019, four plastic boxes of about 0.67 m3 (1.1 m × 1.1 m × 0.55 m) were filled with air-dried soil collected on the farm, and four different soil and compost mixtures (i.e., soil treatments, Ts) were considered. To do this, about four cubic meters of soil were collected from the MITIORG field experiment on the experimental farm. This is an organic long-term experiment (started in 2014), where different combined agroecological practices are tested in horticultural rotations to study the adaptation of the vegetable systems to extreme rainfall and flooding events [8].
To assess the impact of compost addition on the physical and hydraulic properties of the soil, an on-farm compost produced in a small-scale composting plant setup at the experimental farm was used. Crop residues used for the composting process were: vicia faba minor L., plants and fruits of Cucurbita pepo L., Festuca arundinacea Schreb/Trifolium repens L. (ratio 50/50%), Festuca arundinacea Schreb/Trifolium repens L. (ratio 70/30%), and compost as a starter. Three compost–soil mixtures, i.e., three treatments (T2 to T4), were compared with a control without compost addition (T1). In particular, a fertilizer (T2, equal to 1.5 kg m−2), amending (T3, equal to 15 kg m−2), and organic (T4, 75 kg m−2) dose were considered. Practically, after filling the four boxes with untreated (unamended) soil, the same soil of the three boxes (i.e., T2 to T4) corresponding to a depth of 30 cm deep was moved to the work surface, where it was manually mixed to different air-dried compost amounts, namely 2 kg (T2), 18 kg (T3), and 91 kg (T4). Boxes were then filled again with the obtained soil mixtures, and no particular layer-by-layer compaction procedure was adopted, in order to reproduce relatively high soil porosity conditions.
During box filling, holes were created on one side of each box with a drill for the (horizontal) insertion of 10 cm probes for measuring the soil water content (θp) at two depths, i.e., 10 and 20 cm, from the soil surface. Therefore, an unmonitored buffer soil layer (i.e., between 20 and 30 cm) was created over the untreated soil.
Measurements were acquired and recorded in a data logger, and the on-farm weather station provided the hourly rainfall. An image of the experimental device is reported as Supplementary Material (Figure S1). Monitoring of soil water content and rainfall began at the end of November 2019 and ended at the end of May 2021.
2.2. Soil Measurements
Soil physical properties, i.e., water retention and bulk density, were determined both at the beginning and at the end of the investigation. Specifically, to characterize the soil water retention curve, i.e., the relationship between volumetric water content (θ) and soil pressure head (h), and soil dry bulk density (BD), two soil cores (5 cm in height by 8 cm in diameter, equal to 251 cm3) were collected in the surface soil layer of each box at the beginning of the investigation (i.e., in January 2020, two months after box preparation). This relatively small sample size was considered adequate given the lack of structure of the disturbed soil considered. After core sampling, more soil was poured into the holes to restore the flat soil surface. A similar soil sampling was carried out at the end of the investigation (after 20 months), and four soil cores were collected for each soil treatment.
Soil water retention was determined by the tension hanging water column apparatus [20] for pressure head h (cm) values ranging from −5 to −100 cm and the pressure plate extractors [21] for h values ranging from −1030 to −15,300 cm. Following a standard methodology, the soil cores were first saturated within the buchners (funnels) by capillary rising. After saturation, a drainage process was imposed, and seven h values (−5, −10, −20, −40, −60, −80, and −100 cm) were set to determine the corresponding volumetric soil water content (θ) values [22]. In addition, three other θ values were determined on the repacked soil samples at low h values (−1030, −3060, and −15,300 cm). BD was determined at the end of the tension experiments (i.e., at h = −100 cm) assuming a particle density of 2.65 g cm–3 [10,22]. The pairs of θ-h values were fitted by the van Genuchten model (vG) using the SWRC Fit (web interface) by Seki [23], and the soil water retention curve, i.e., the θ(h) function, was obtained.
Saturated soil hydraulic conductivity (Ks) was determined from early October 2020 (i.e., eleven months after box filling) to mid-May 2021 by the SSBI method [24] over six dates (hereafter referred to as sampling dates (SDs)). For each box, six infiltrations were carried out on the soil surface. Consequently, 144 (4 treatments × 6 sampling dates × 6 replicates) infiltrations were carried out in this investigation.
The SSBI method involves carrying out infiltration tests of the Beerkan type. In detail, Beerkan tests were performed using an 8 cm inner-diameter steel cylinder, inserted to a depth of about 1 cm to avoid lateral loss of ponded water. A known volume of water (55 mL) was repeatedly poured into the cylinder, establishing a height of water of about 1 cm, and the time needed for complete infiltration was logged. The procedure was repeated for a total of 18 water volumes, and experimental cumulative infiltration, I(t), and infiltration rate, ir, were thus deduced. In accordance with Bagarello et al. [24], saturated soil hydraulic conductivity was deduced by the equation:
where is (L T−1) is the slope of the straight line defined by the last part of the cumulative infiltration describing the steady-state conditions, r (L) is the radius of the ring, 1.3635 is a coefficient accounting for the shape of the wetting–drainage front and the geometrical correction of the infiltration front shape [24], and α* (L−1) is a parameter expressing the relative importance of gravity and capillary forces during the infiltration process [25]. A value of α* equal to 4 m–1, suggested for soils with strong capillarity (i.e., porous materials that are both fine textured and massive, including unstructured clayey and silty soils, as well as very fine to fine structureless sandy materials), was used in this investigation. For further details, please refer to the original manuscript by Bagarello et al. [24], while for a brief overview of current applications, see the review by Castellini et al. [26].
Total organic carbon (TOC), determined only at the end of the investigation, was quantified through the dry combustion method using a TOC Vario Select analyzer (Elementar, Germany) [27].
2.3. Soil Physical Quality Determination
For each treatment, averaged retention curves (and bulk density values) were used to estimate several soil physical quality indicators accounting for (i) soil compaction or balance between the liquid/aeriform phase of the soil (Group 1); (ii) the pore volume distribution function (Group 2); and (iii) the inflection point of the “S-shaped” water retention function, i.e., the point that discriminates the non-capillary (macropores) from capillary porosity (Group 3). Specifically, Group 1 includes BD and four widely used soil indicators such as macroporosity (PMAC), air capacity (AC), relative field capacity (RFC), and plant available water capacity (PAWC) [13]; Group 2 includes the “location parameters”, i.e., modal (dmod), median (dmed) and mean (dm) pore diameter, and the “shape parameters”, i.e., standard deviation (Sd), skewness (Sk), and kurtosis (Ku) of the pore volume distribution function [13]; Group 3 includes the soil pressure head at the inflection point of the water retention curve (hinf), the corresponding volumetric soil water content (θinf), soil porosity at hinf (PORinf), S-index by Dexter [28], namely the slope of the gravimetric water retention curve at the inflection, and the pore distribution index, λinf by Han et al. [29] (i.e., the ratio between S-index and θinf). According to the procedure indicated by Reynolds et al. [13], the pore volume distribution functions of the considered treatments were calculated. These water-retention-curve–derived indicators are widely used and suggested in the literature [30,31], also to verify plausible correlations with respect to independent variables (for example, Ks) and check the consistency of the results [32,33].
2.4. Data Analysis
For each main variable considered in this investigation, i.e., BD, θ-h, θi, PMAC, AC, RFC, PAWC, dmod, dmed, hinf, θinf, PORinf, S-index, and λinf, arithmetic means and corresponding coefficients of variation were always calculated, with the exception of Ks, dm, Sd, Sk, and Ku because of log-normal distributions, and, therefore, geometric means and associated coefficients of variation are generally suggested for these soil properties [34].
A Tukey HSD (honestly significant difference) test was used to evaluate temporal changes by comparing mean values and to establish multiple comparisons among treatments [35], whereas a two-tailed paired t-test was used to check the statistical significance of the soil water retention data. A probability level of p = 0.05 was assumed.
Regression analysis was carried out between saturated hydraulic conductivity and independent soil variables, namely soil physical quality indicators obtained from the soil water retention curve or bulk density. With this aim, the full set of data (i.e., soil physical quality indicators obtained after early and final soil sampling) or partial set of data (only after early or final soil sampling) were correlated with corresponding Ks values, and only the correlations that were both significant and expected from a physical point of view were considered for comparison between treatments [32,33].
3. Results
3.1. Impact on Water Content, Water Retention, and Bulk Density of the Soil
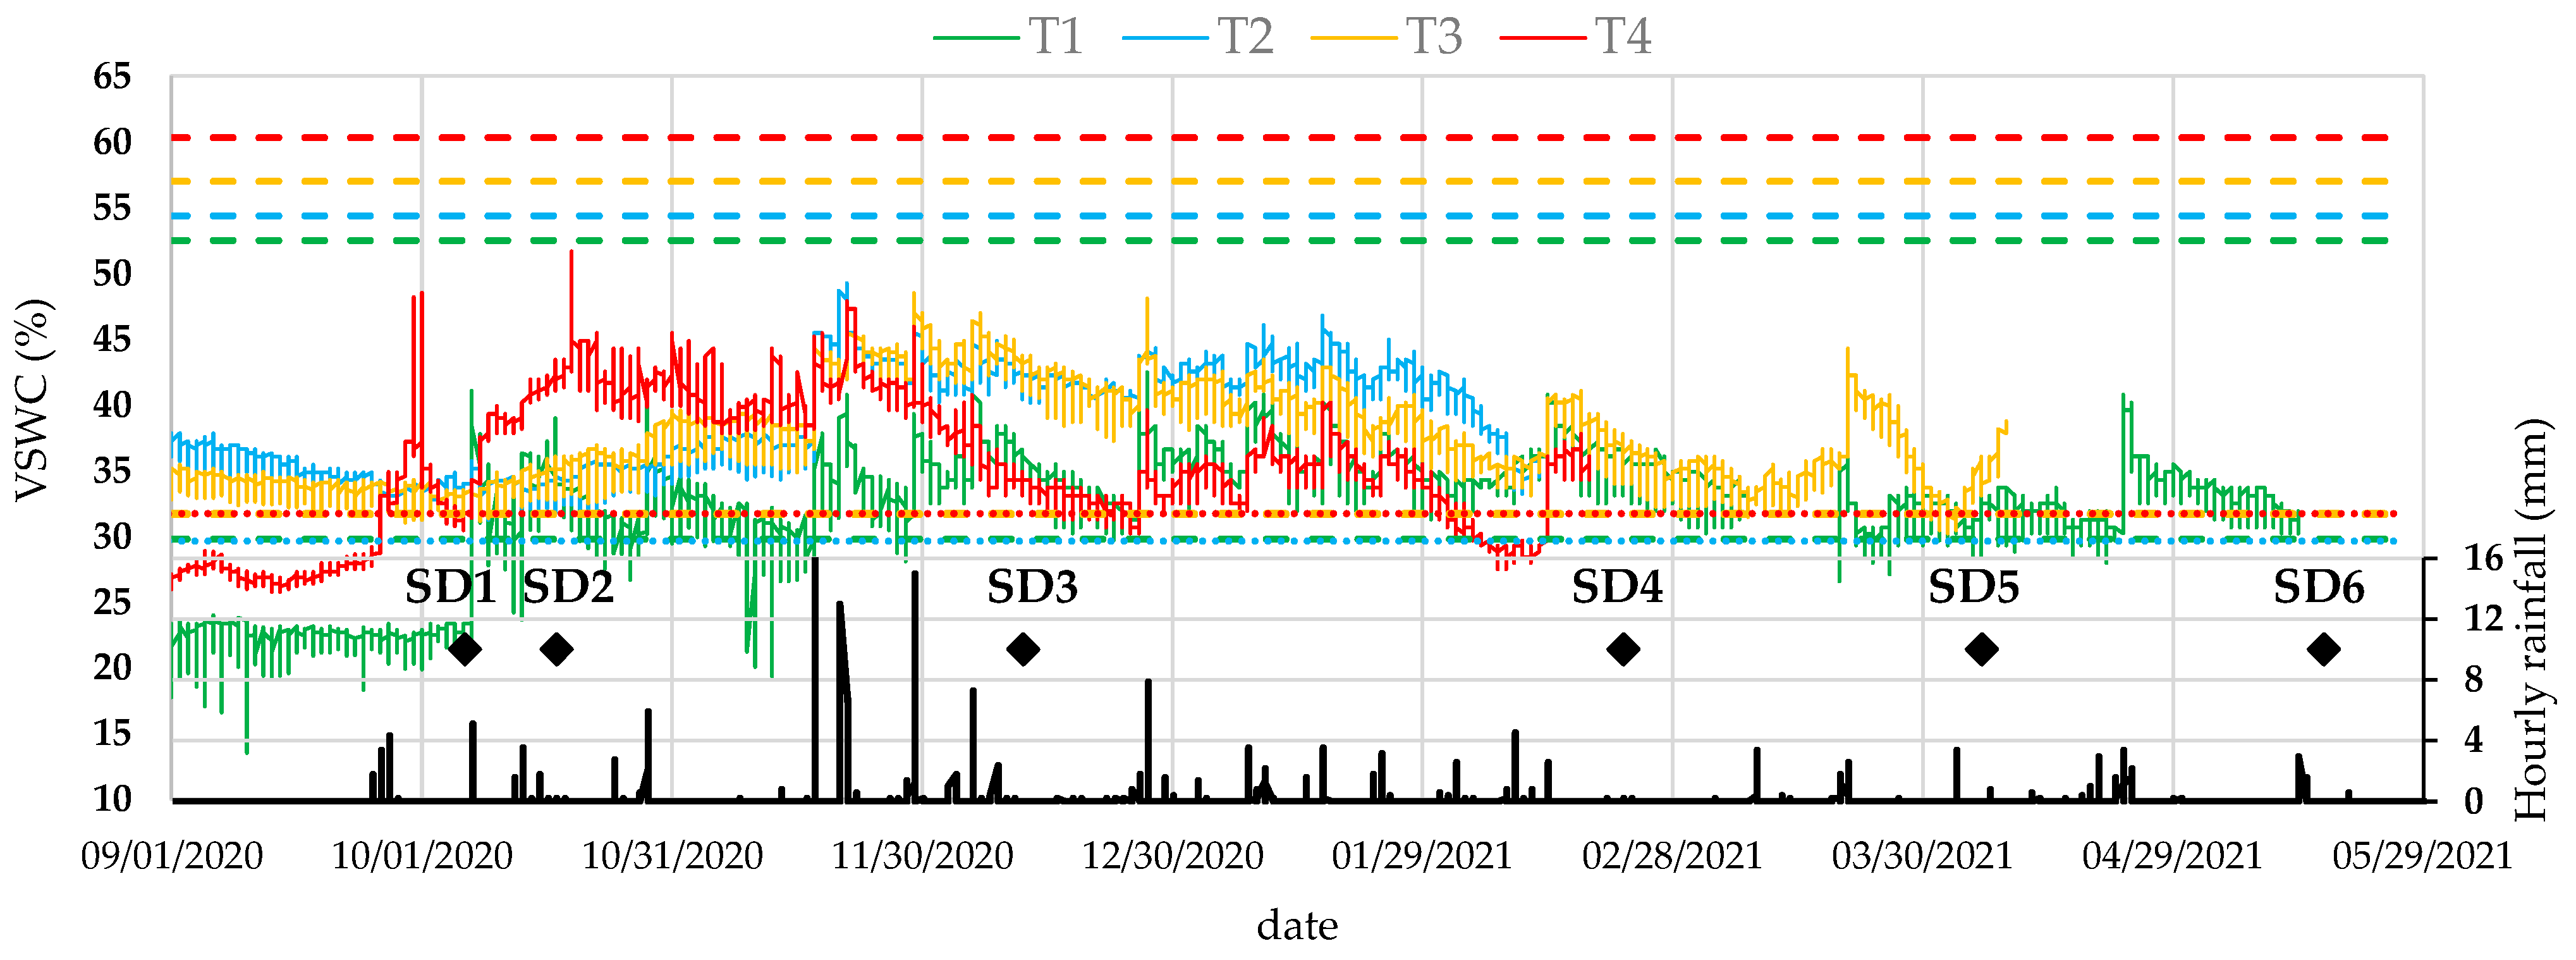
The temporal changes in mean soil water content (SWC) corresponding to the four treatments (T1 to T4) and the hourly rainfall events are reported in Figure 1. Except for the first months (September–October 2020), the soil water content was generally always higher than the field capacity and lower than the full saturation. Overall, an inadequate soil–probes contact probably caused SWC underestimation in Treatments 1 and 4 (T1 and T4) at the beginning of monitoring, and a probe malfunction did not allow to obtain reliable measurements from March onwards in T2 and T4. Therefore, a full dataset for specific analysis (correlations) was obtained for only four out of six sampling dates (i.e., SD1 to SD4). Both measured field capacity and estimated saturated soil water contents account for the soil condition at the end of the investigation, i.e., after a plausible complete soil structure restoration, because they were determined at the end of the research. In particular, mean values of field capacity of about 0.30 or 0.32 cm3 cm−3 were detected for T1 and T2, or T3 and T4, while estimated saturated soil water content increased with increasing compost concentration, ranging from 0.53 cm3 cm−3 (T1) to 0.60 cm3 cm−3 (T4) (Figure 1).
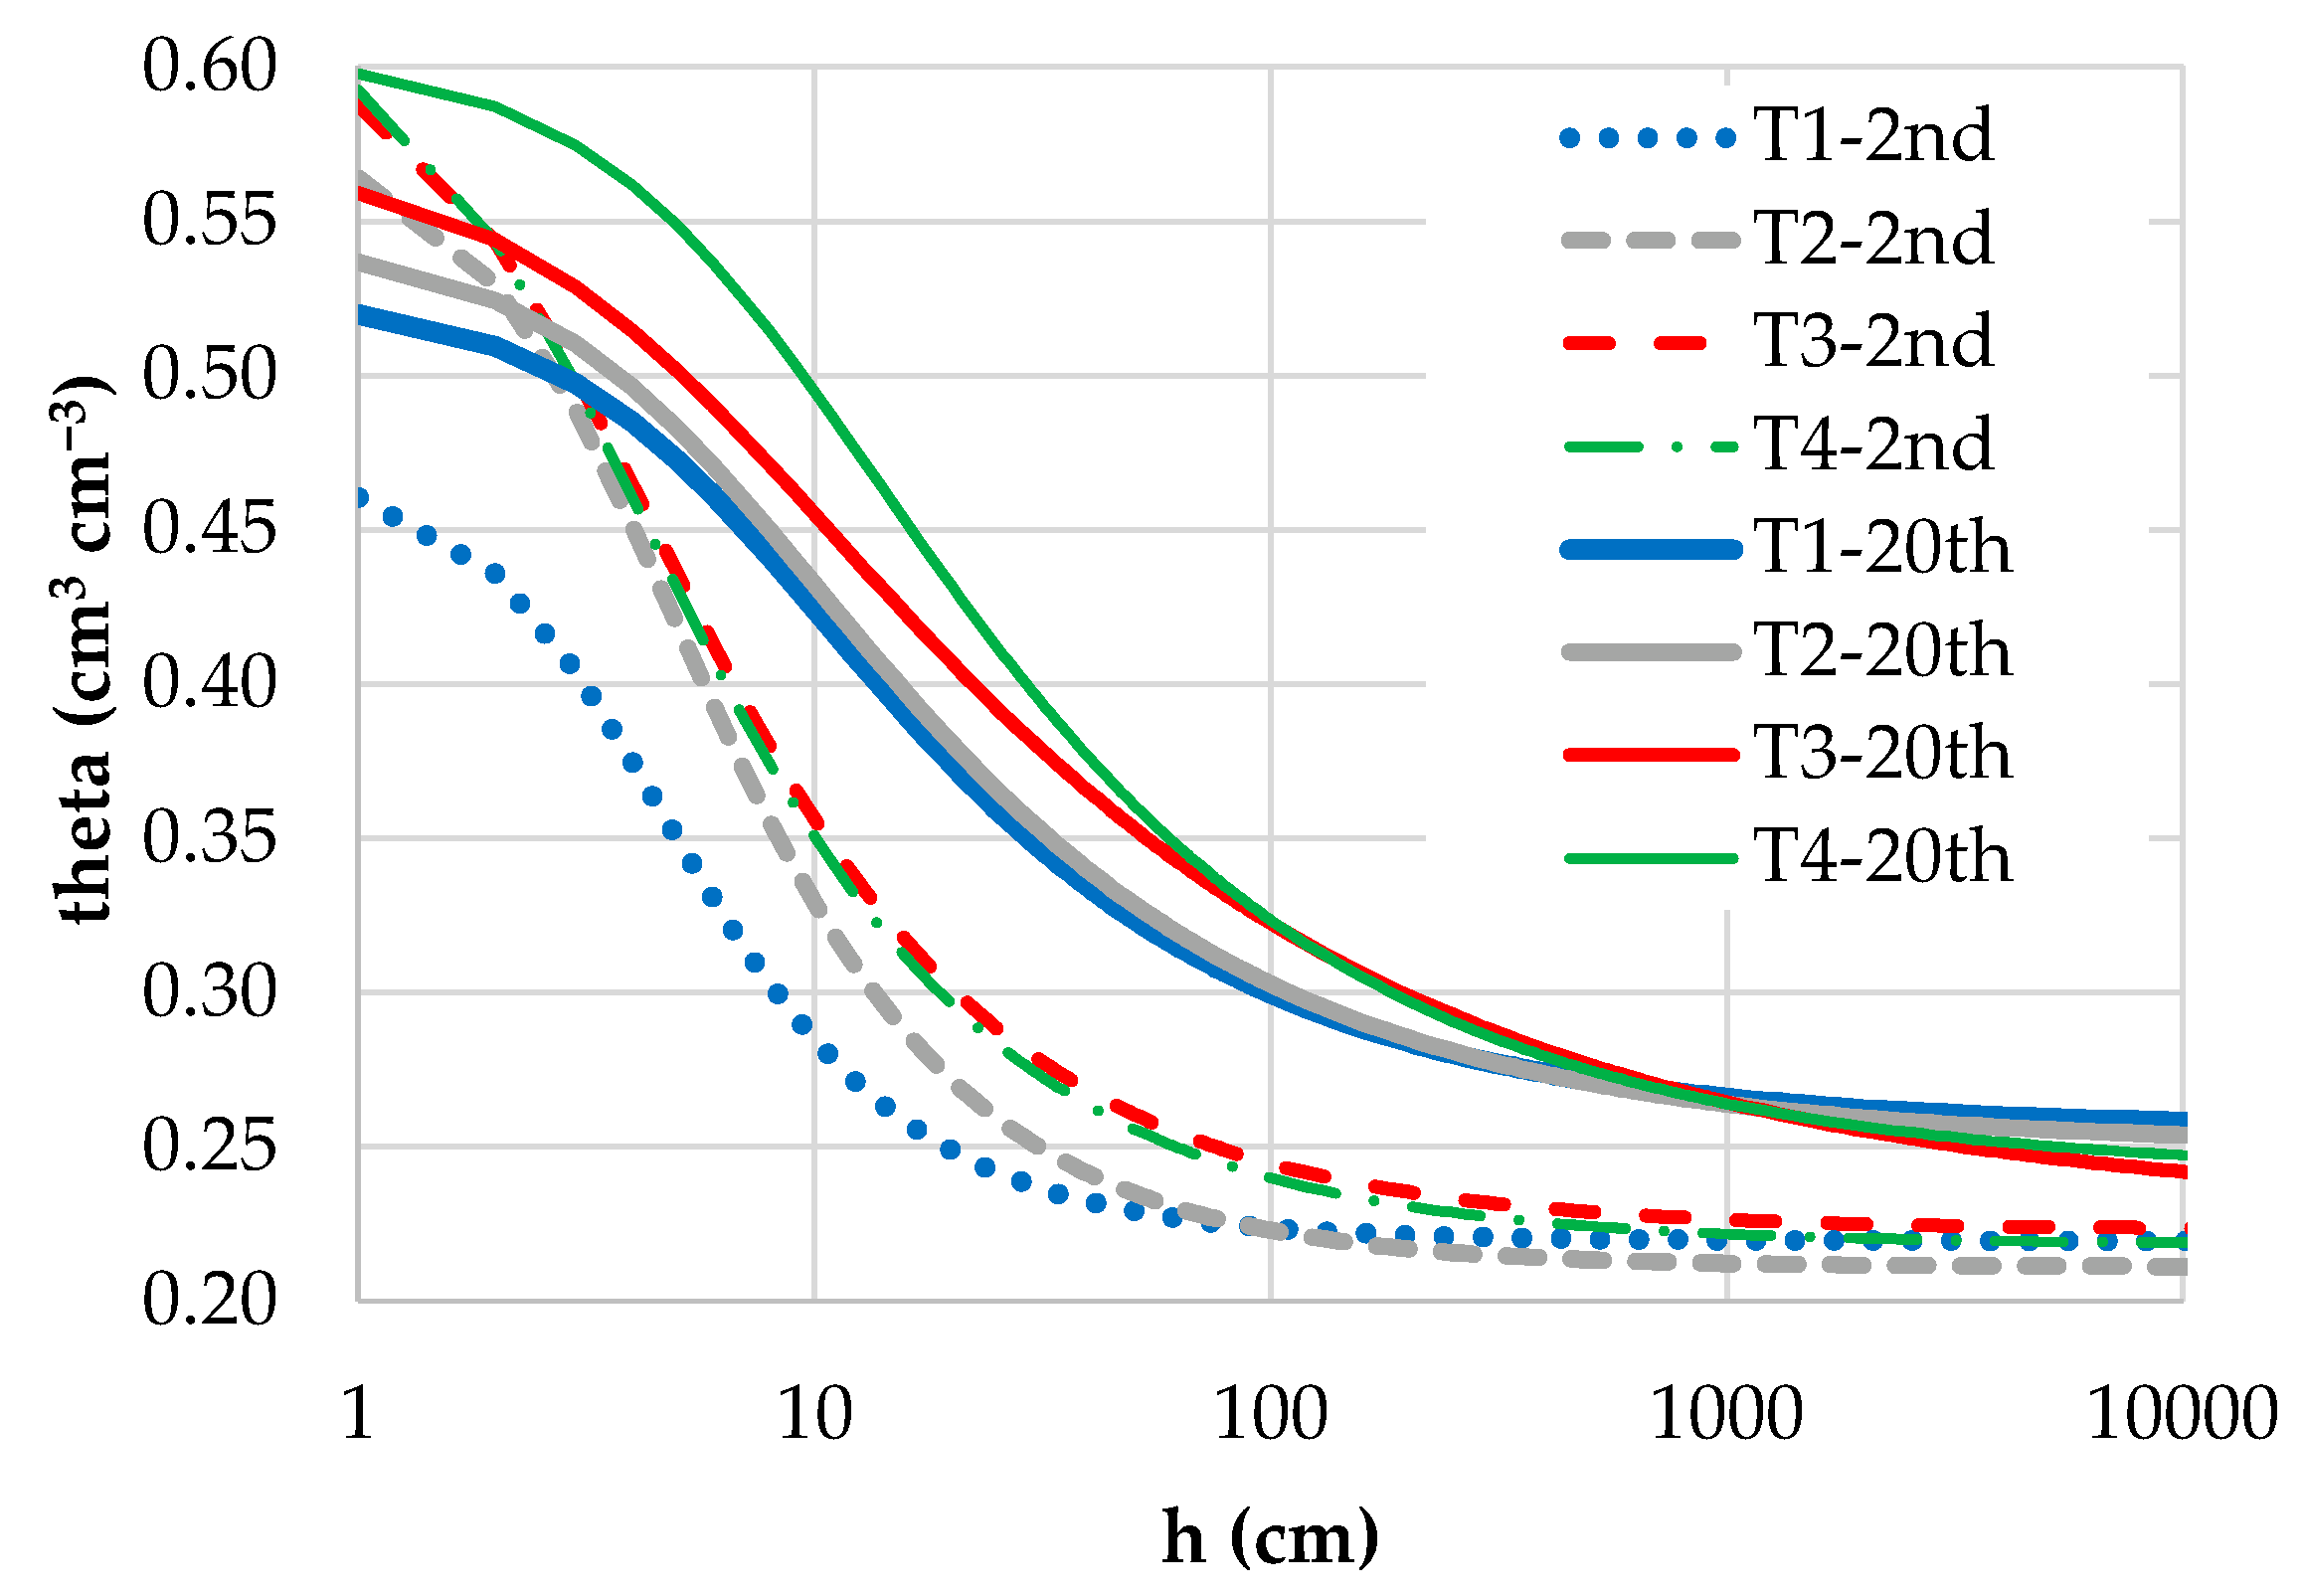
The comparison between treatments in terms of soil water retention in the early (2nd month) and final (20th month, after SD6) stages of the investigation is reported in Figure 2. Overall, a quite clear induced effect of compost addition (i.e., addition of increasing doses of compost) on soil water retention capacity improvement was always detected (i.e., in both stages). However, with reference to the final phase, a similarity between pairs of curves was identified (T1–T2 and T3–T4), and some improvements in soil water retention (up to 1%) were detected only close to water saturation (i.e., range of soil pressure heads of about 0–6 cm) when little (T2) or no compost (T1) addition was considered, while a larger range was detected (0–60 cm) when higher rates (T3–T4) were used (Figure 2).
As expected, significantly higher soil water contents were always detected at the end of the experiment, according to the two-tailed paired t-test (p = 0.05). Regardless of the stages of the investigation (early or final), no particular correlation between van Genuchten model parameters (θr, α, and n) of the soil water retention curve and compost rate was identified. Conversely, the expected increasing relationships between the selected main values of the soil water content (θs, θ10, and θ100, respectively, equal to the water contents of the saturated soil, matrix, and at field capacity) and compost rate were always verified. Moreover, when similar correlations were checked using some capacitive indicators obtained from the soil retention curve (i.e., aeration capacity (AC), plant available water capacity (PAWC), relative field capacity (RFC)) or soil bulk density (BD), we verified that AC and PAWC increased with the rate, while RFC and BD instead decreased. These results were logical from a soil physics point of view, because it is expected that available water or soil air can increase with the compost rate; likewise, relative field capacity and soil density will decrease.
T4 showed the greatest impact as compared to the remaining treatments. For instance, when we considered BD changes over time, i.e., between the beginning and the end (shortly after SD6) of the investigation, we detected a higher increase in BD values under T1–T3 (by a factor of 1.31–1.36) than T4 (a factor of 1.11); BD values ranged from 0.81 to 1.11 g cm−3 under T1–T3 and 0.77 to 0.86 g cm−3 under T4. Therefore, treatment 4 experienced less compaction. A similar comparison was carried out for soil water retention close to water saturation (range: 5–100 cm), and the results showed that the differences (i.e., improvements) in water retention between the beginning and the end of the investigation ranged between 8–9% (T2-T3) and 11% (T4), as compared to T1 (7%); consequently, an increase between 2 and 4% could be attributed to the effect of compost addition.
3.2. Impact on Infiltration Rate and Saturated Hydraulic Conductivity of the Soil
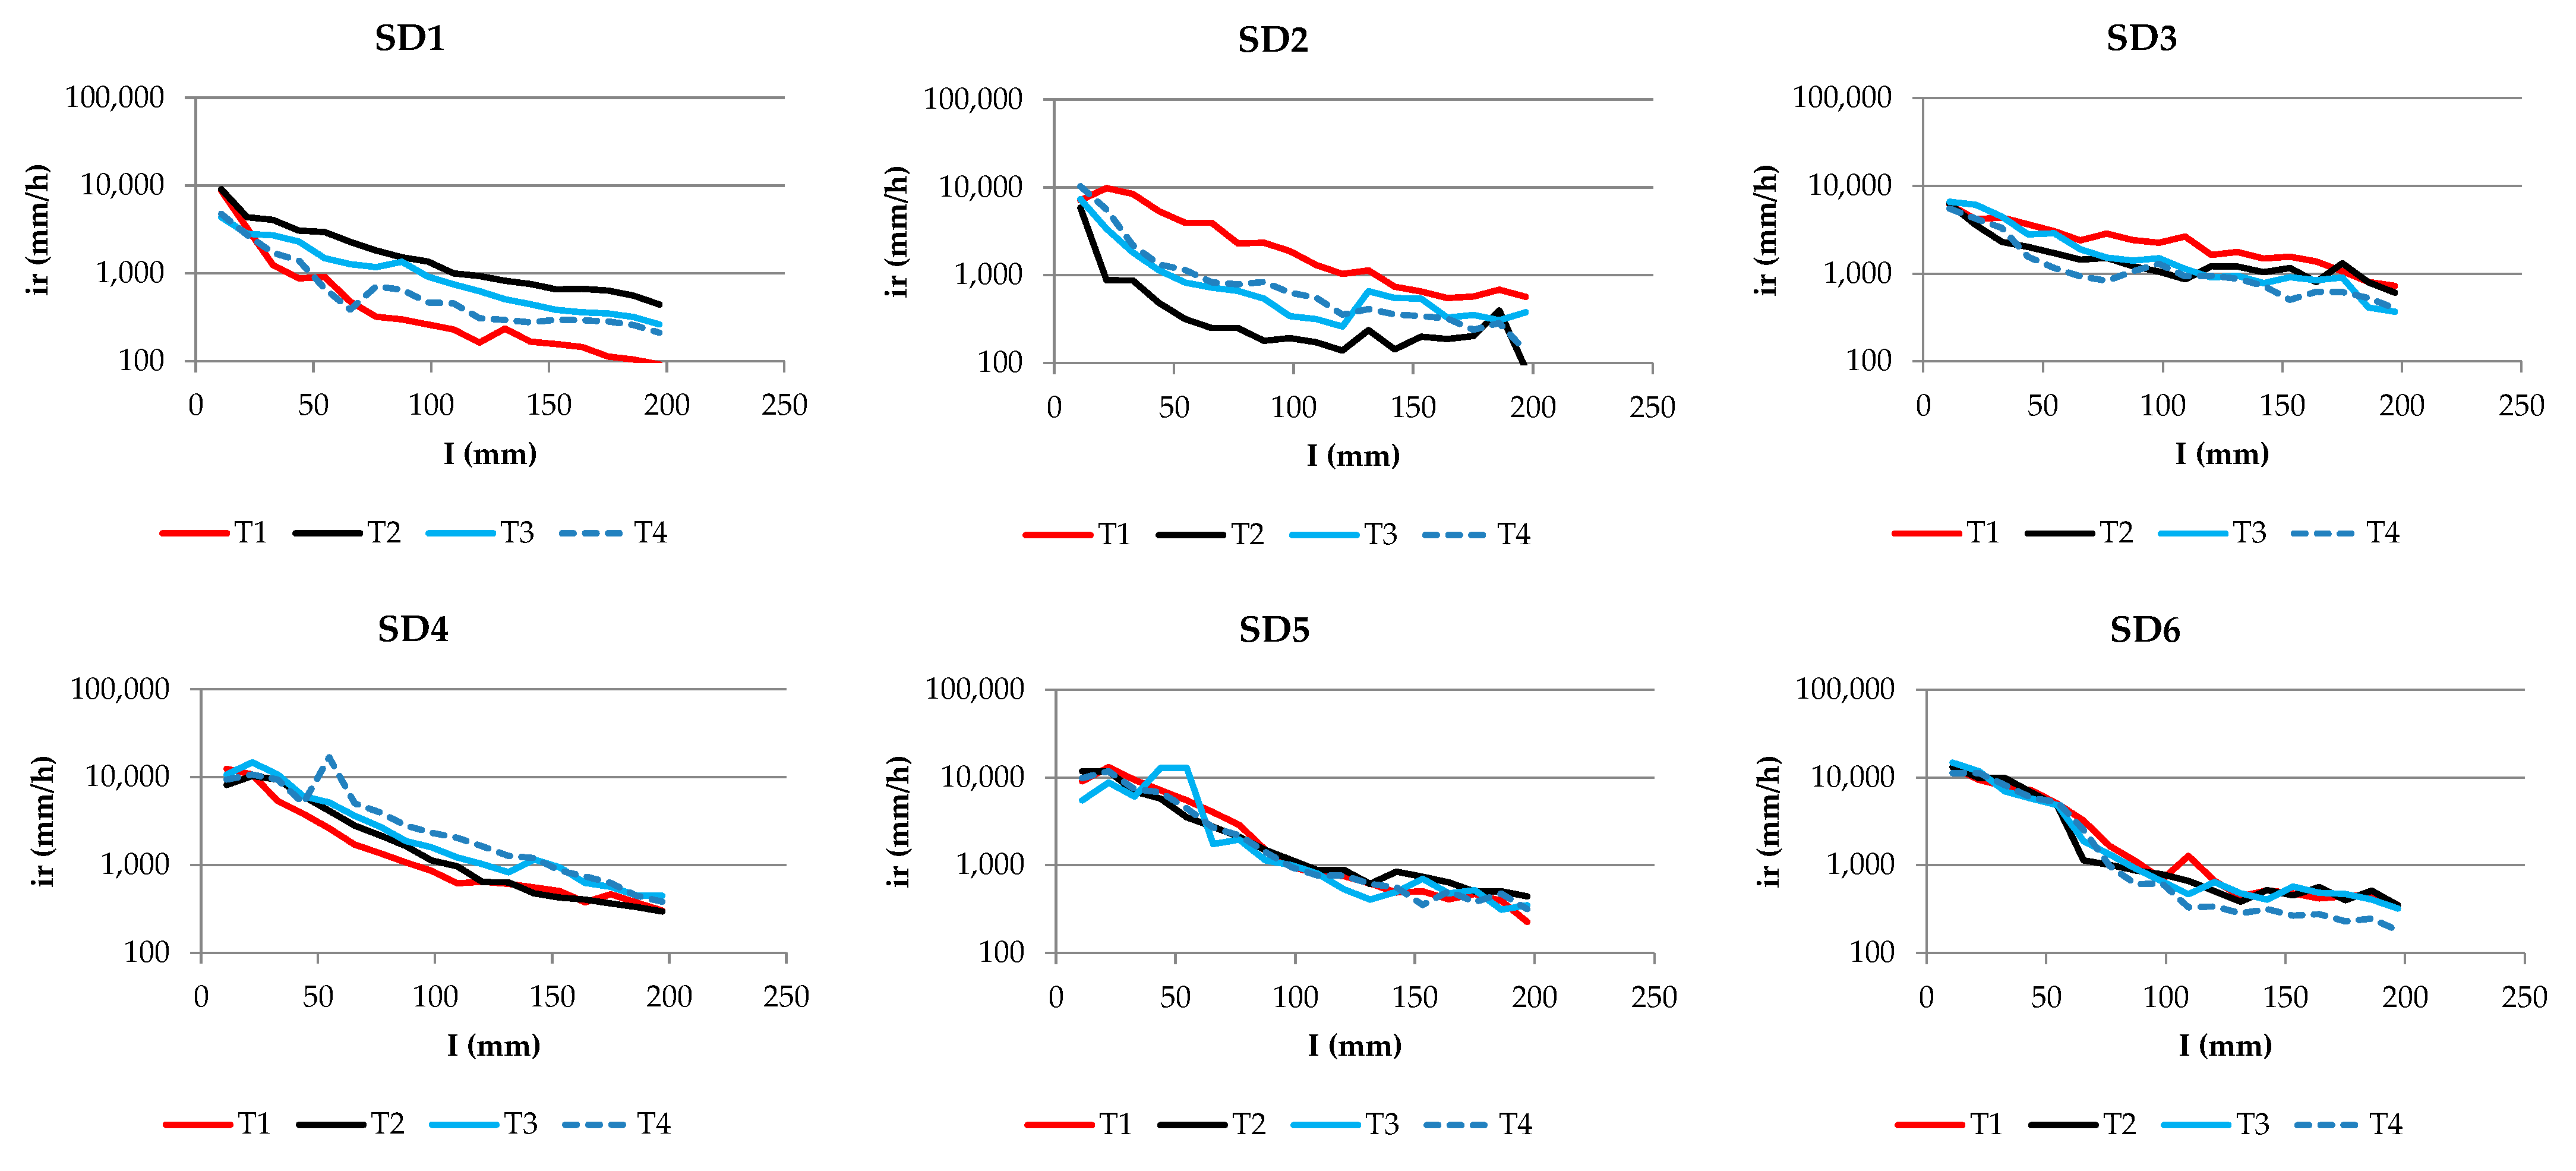
The infiltration rate curves, plotted against cumulative infiltration in order to simplify comparisons between treatments, revealed a curve overlap from SD3 onwards (Figure 3). However, detectable differences were obtained at the beginning of the trial with the reference soil (control), T1, which showed both the lowest (SD1) and the highest (SD2) infiltration rates, when compared with the composted soils (Figure 3). Therefore, the impact of the amendment waned over time.
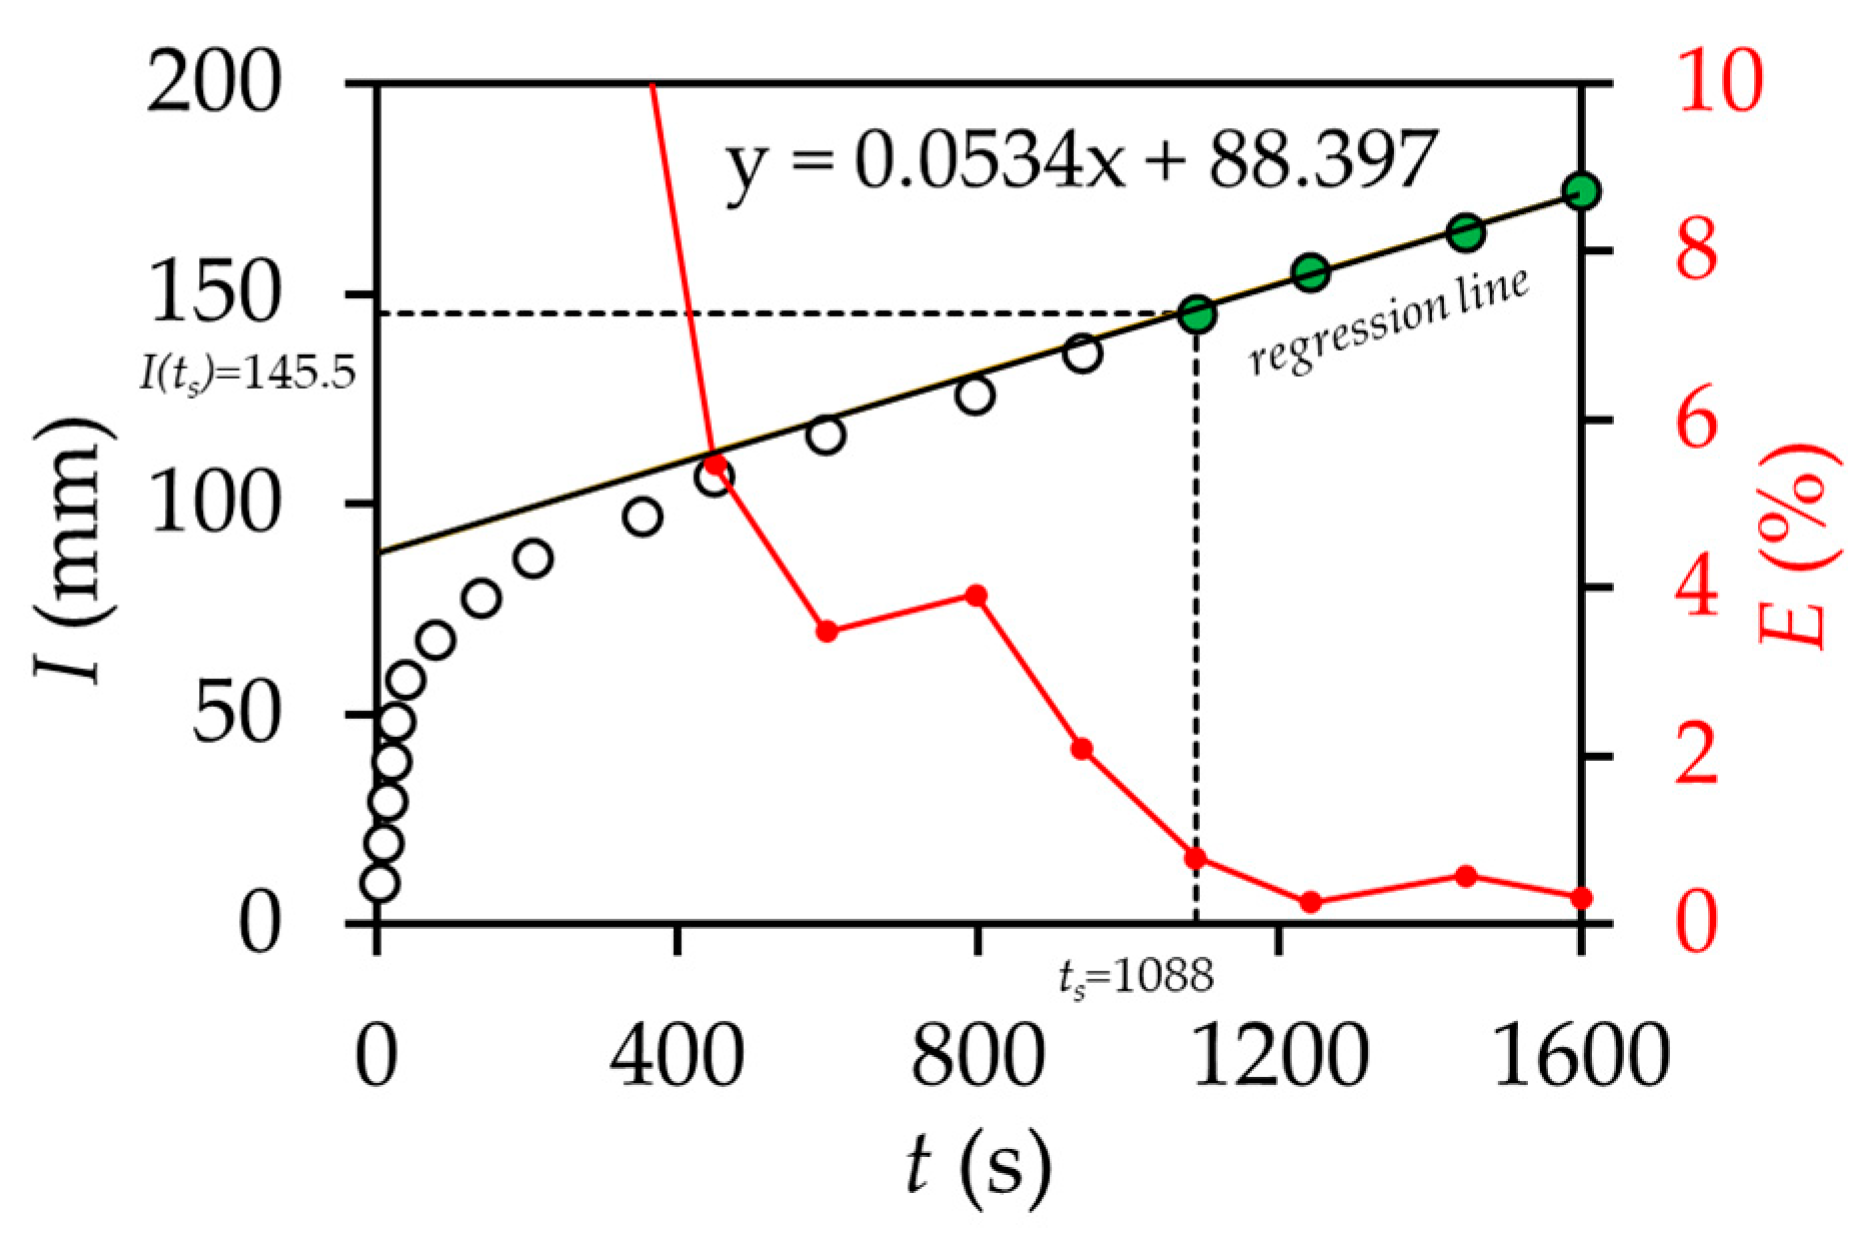
Figure 4 shows an illustrative example of the equilibration time (ts) and infiltrated depth at the equilibration time (I(ts)) determination from cumulative infiltration, using the common criteria by Angulo-Jaramillo et al. [36] for analyzing cumulative infiltration data, while Table 2 summarizes the corresponding results obtained in this investigation. Similar to the information reported, ts and I(ts) changed mainly in the first two sampling dates, then remained constant and comparable in the following ones. A certain inaccuracy of estimates was obtained for SD2-T2, with values of ts that, on average, were two or three times higher.
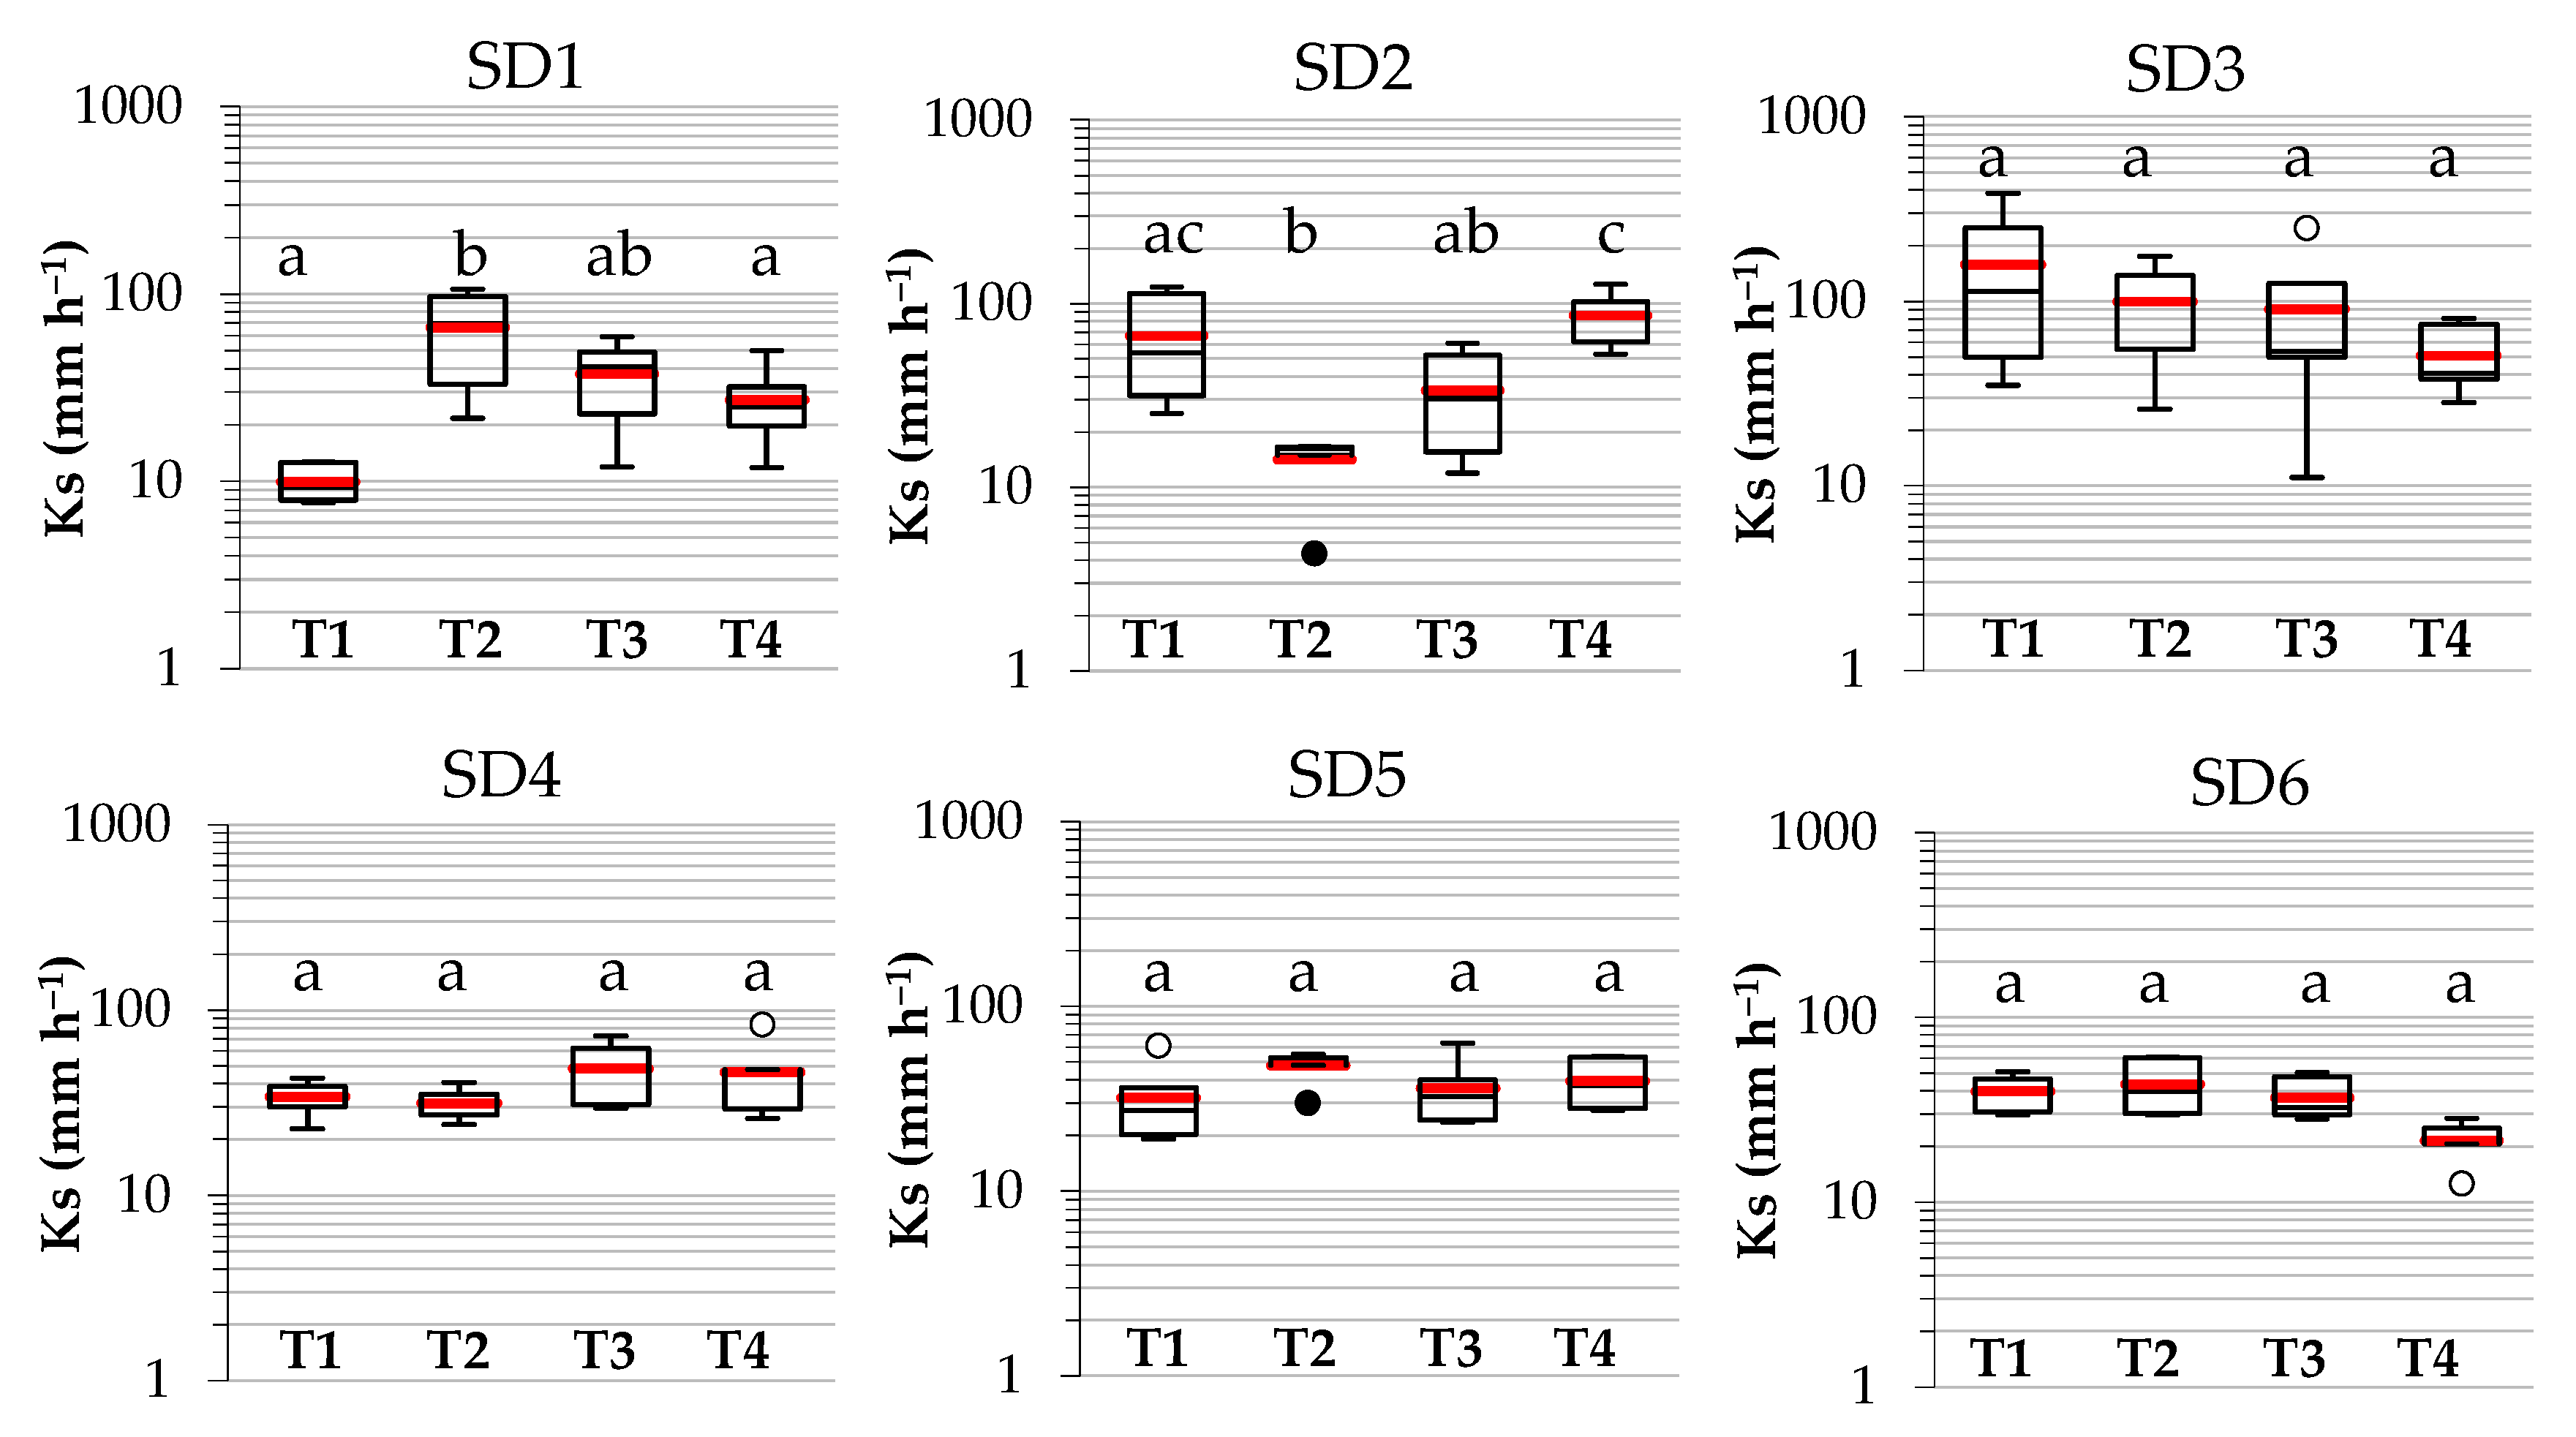
Box plots of saturated hydraulic conductivity, Ks, reported in Figure 5, show some significant differences only in SD1 and SD2. Overall, a comparable variability among sampling dates was detected, as mean values of the coefficient of variation were within the range of 26–47%. However, an almost double variability was detected in SD3, as a probable effect of the previous rainfall events, which impacted differently on the different treatments. Regarding the first two dates, relatively lower Ks mean values were detected for T1 under SD1 and T2 under SD2 (Figure 5). According to the Tukey HSD test (p = 0.05), saturated hydraulic conductivity values obtained from the fertilizer dose were significantly higher than control in SD1 and significantly lower in SD2; after that, the small discrepancies observed vanished in the following sampling dates (SD3 to SD6) (Figure 5).
Although there was a lack of differences between treatments on sampling dates 3 to 6, the results showed some temporal changes, especially for T1, T2, and T4. As an example of the extreme treatments, i.e., control and organic dose (T1 and T4), the results of the Tukey HSD test highlighted significantly higher Ks values in SD3 and SD2, respectively, for T1 and T4 (Table 3).
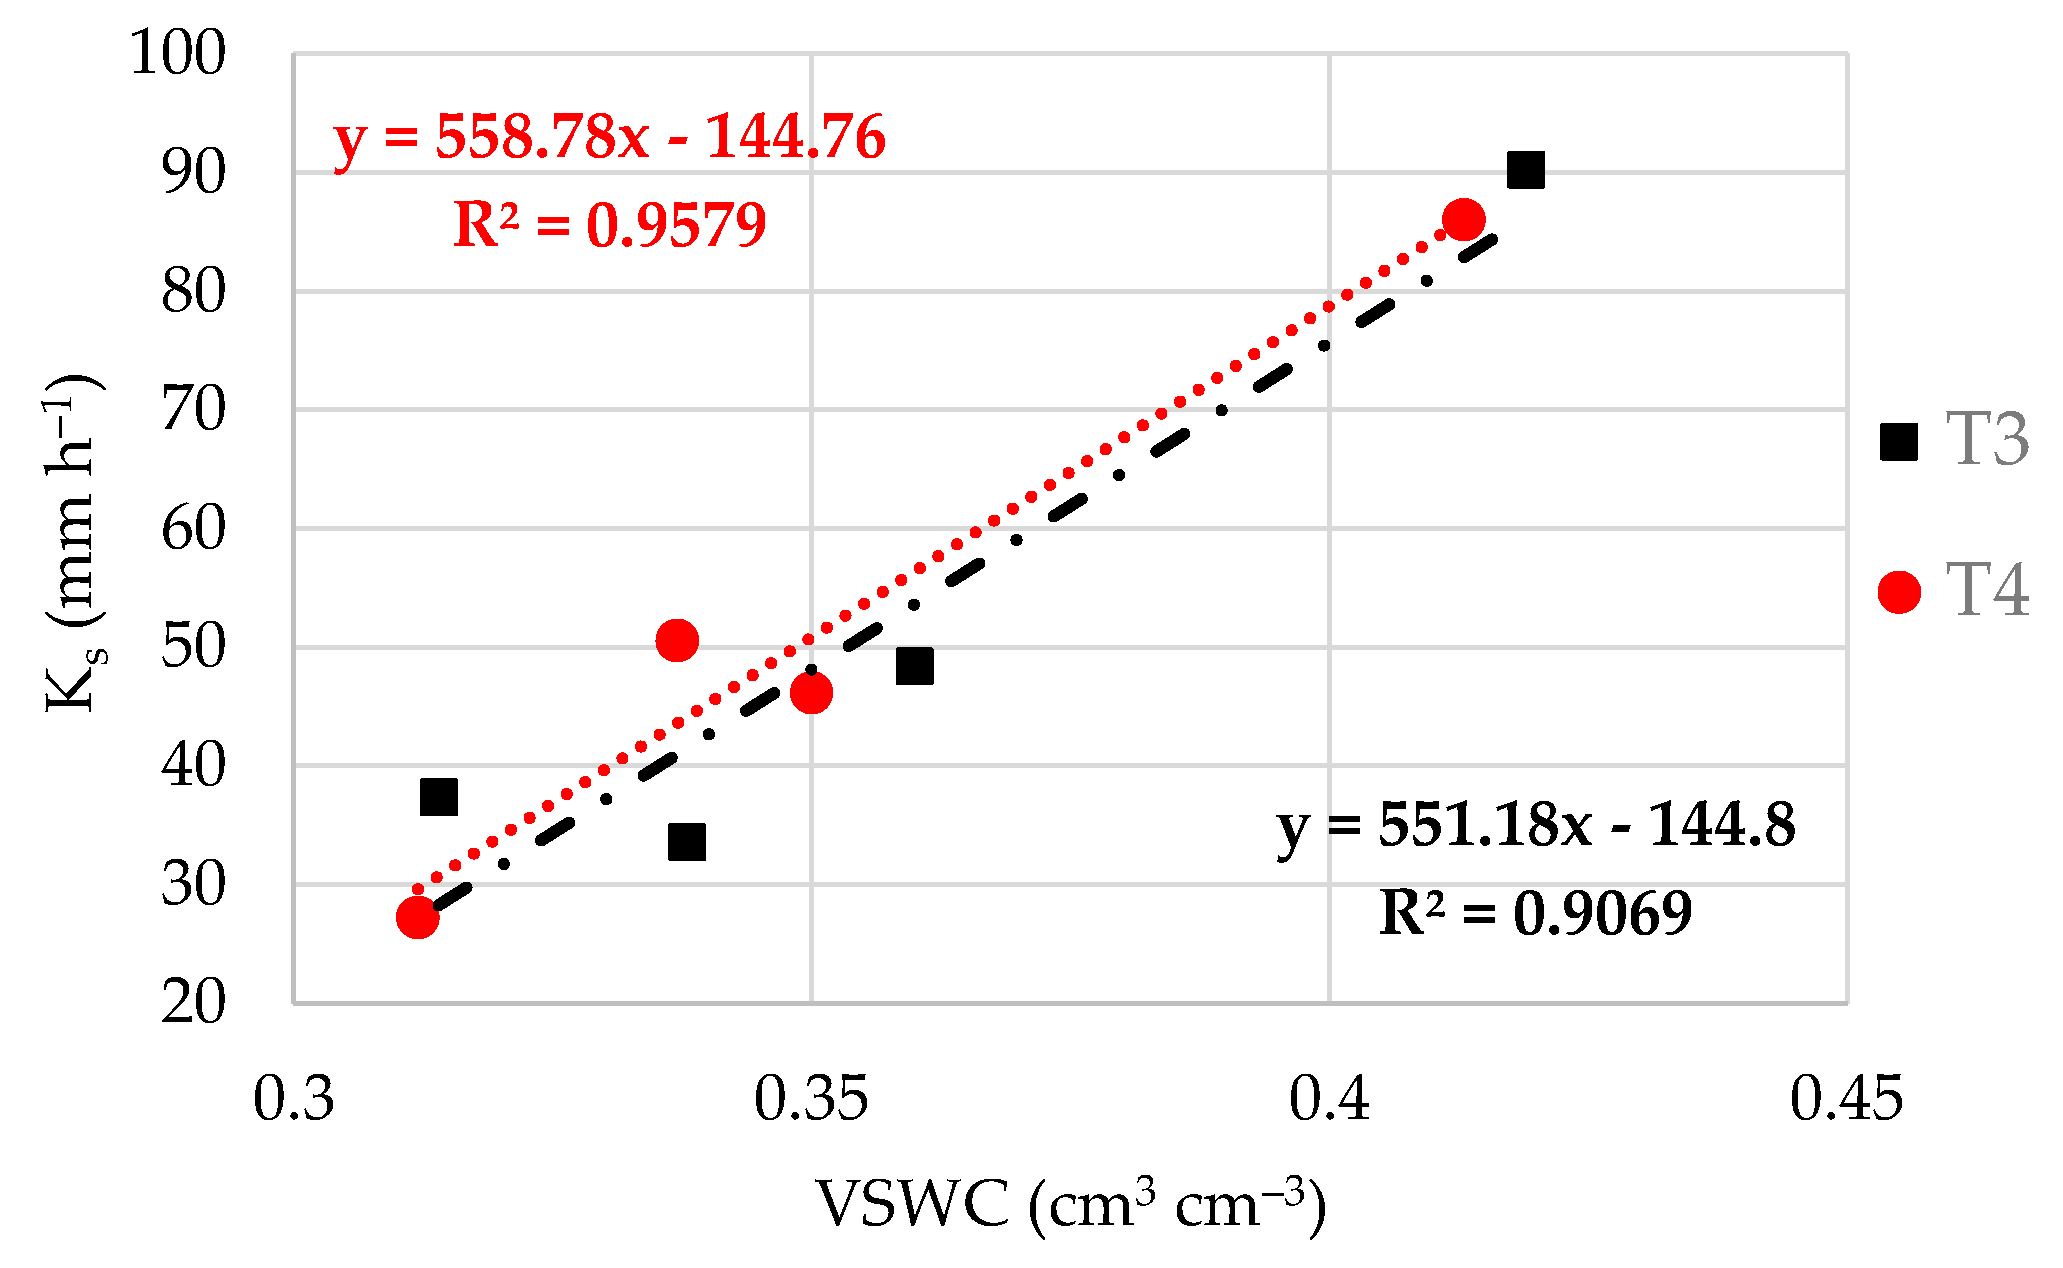
Adding compost to the soil increases its water content, and this can affect the hydrodynamic properties of the porous medium. Limited to the first four sampling dates, due to the lack of the remaining soil moisture values, the results showed a plausible positive relationship between saturated soil hydraulic conductivity and volumetric soil water content (i.e., Ks increases with increasing soil moisture), with a coefficient of determination that increased with increasing compost rate (R2 = 0.46, 0.62, 0.91 and 0.96). However, only the two highest compost concentrations were found to be significant (T3 and T4), thus suggesting a negligible effect for T1 (Figure 6).
3.3. Impact on Soil Physical Quality
Regardless of the soil treatment, the transition from an unstructured to a more structured soil resulted in an increase in bulk density, relative field capacity, plant available water capacity, soil pressure head at water retention curve inflection point, and corresponding porosity, as well as shape parameters of pore volume distribution function; detected discrepancies ranged by a factor of 1.0 (Ku) to 3.4 (PAWC) (Table 4). Conversely, soil indicators accounting for the air capacity, macroporosity, or pore diameter, decreased accordingly by a factor ranging from 1.4 (AC) and 3.8 (dm). Moreover, a halving of Dexter’s S-index value was detected, since it changed from 0.16 to 0.08 (Table 4).
The comparison between normalized pore volume distributions of considered treatments and the differences between start and end of the investigation is reported as Supplementary Material (Figures S2 and S3, respectively).
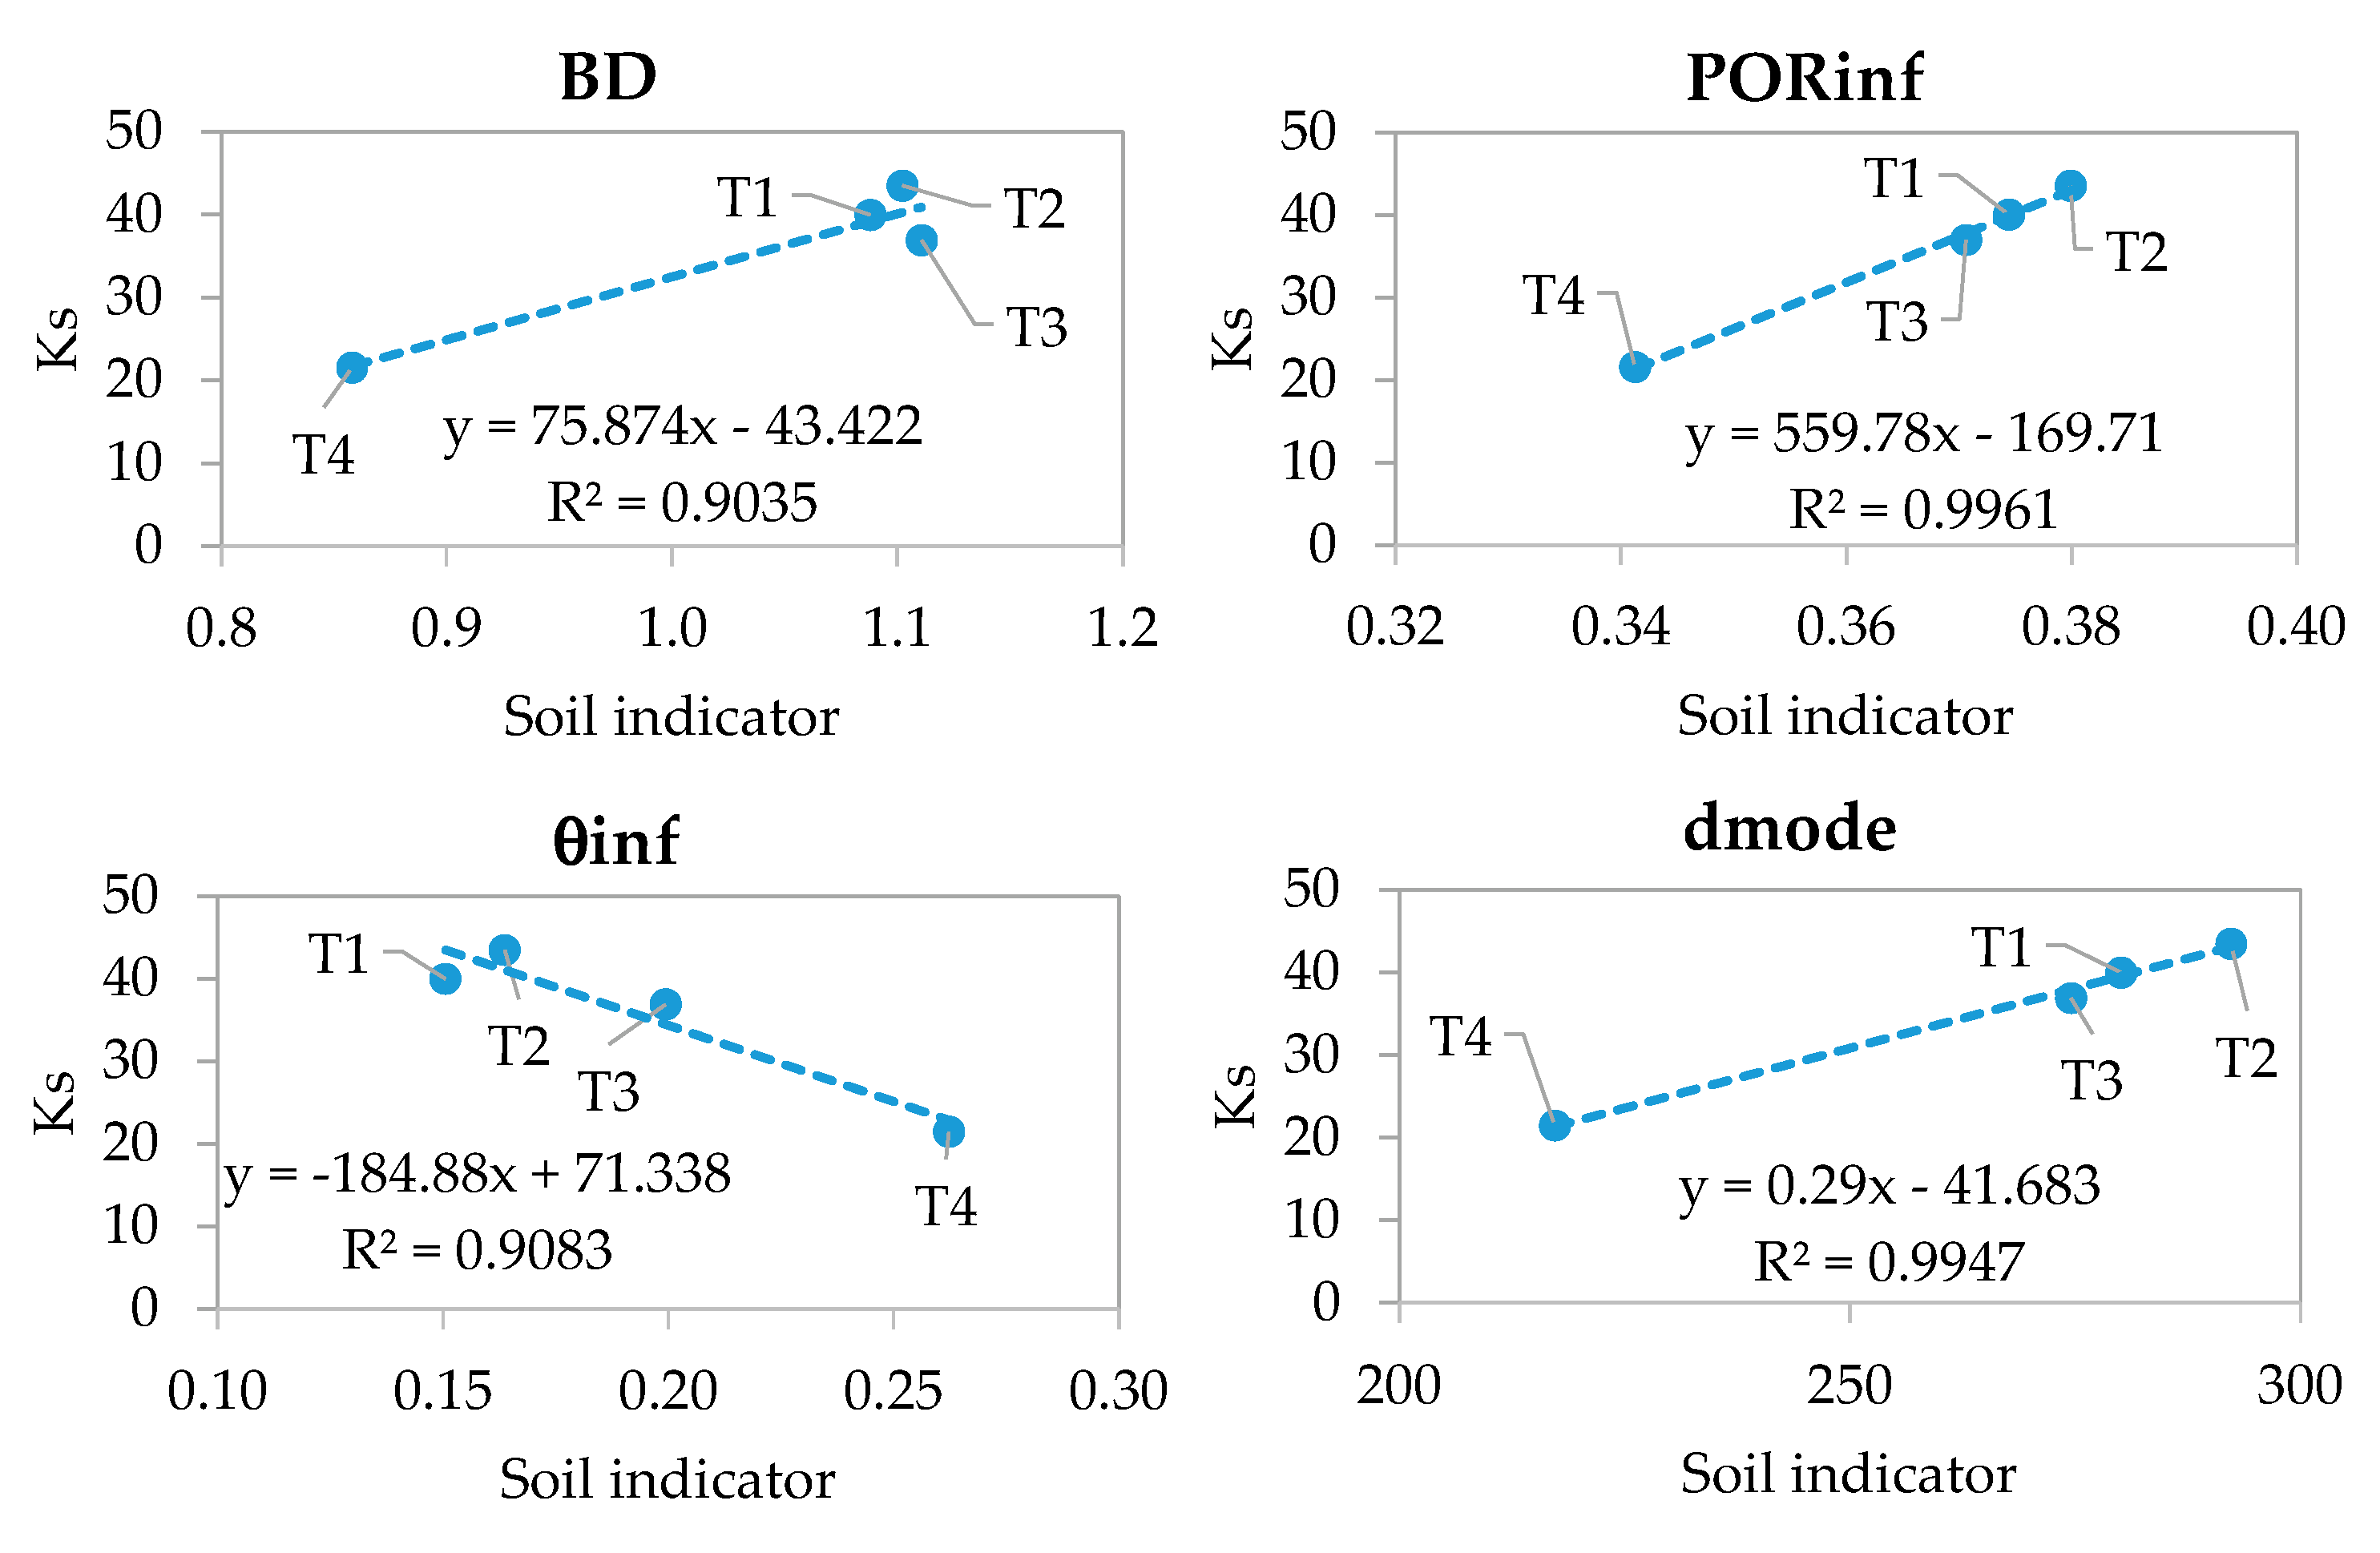
The mean values of the seventeen soil physical quality indicators estimated from the water retention curve and bulk density data were correlated with the corresponding Ks mean values, and only the significant correlations were evaluated to establish their consistency with theoretical expectations. The overall data set, i.e., characterized by data corresponding to both the beginning and the end of the investigation, never provided significant correlations. However, when the two sub-datasets were considered separately, plausible and significant correlations between variables were detected only for the structured soil (Figure 7). Specifically, when the soil at the start of the investigation (i.e., poorly structured soil) was considered, Ks was never significantly correlated with independent soil variables. Conversely, increasing significant correlations were identified for the better-structured soil, as Ks increased with increasing soil bulk density (BD) and modal diameter (dmod) of the pore volume distribution function; porosity at the inflection point of the water retention curve (PORinf) increased significantly as well, while consequently, θinf decreased as Ks decreased (Figure 7). Finally, according to the observed sequence of Tn values around the regression line, although the expected sequence (i.e., T1 towards T4 or vice versa) was not always detected, T4 was always associated with the lowest Ks values and corresponding correlated variables, then generally followed by T3 (Figure 7); an inversion between T1 and T2 also suggests that the lowest compost rate had a negligible effect on the changes in the soil physical and hydraulic properties.
4. Discussion
Soil amendment with compost is a widespread agronomic practice with a view to restore the chemical–physical fertility of soil and, therefore, to counterbalance the risks of soil degradation due to intensive agriculture [9,37,38]. Furthermore, this practice takes on greater environmental significance when compost is produced directly on the farm, starting from the use of waste produced [7]. However, the impacts of this practice on the hydrodynamic properties of clay soils are significant and require experimental checks under real (or representative) conditions.
We investigated the short- and medium-term effects of on-farm compost addition on the physical and hydraulic properties of a clay soil with a relatively low organic fertility.
By making use of some widely applied literature indicators, the investigated reference soil (control without amendment) was structurally degraded, as the structure stability index (SSI) by Pieri [39] was lower than the minimum threshold suggested in the literature (SSI < 5%). Following the suggestions by Prout et al. [2], which relate observed organic matter with clay content, we point out that the investigated soil had about a quarter of the minimum optimal organic level to be defined as “not degraded”. TOC levels a little higher than 1%, however, are quite common in Mediterranean agro-environments [31], and for this reason, farmers should be encouraged to progressively improve such soil quality parameters over time.
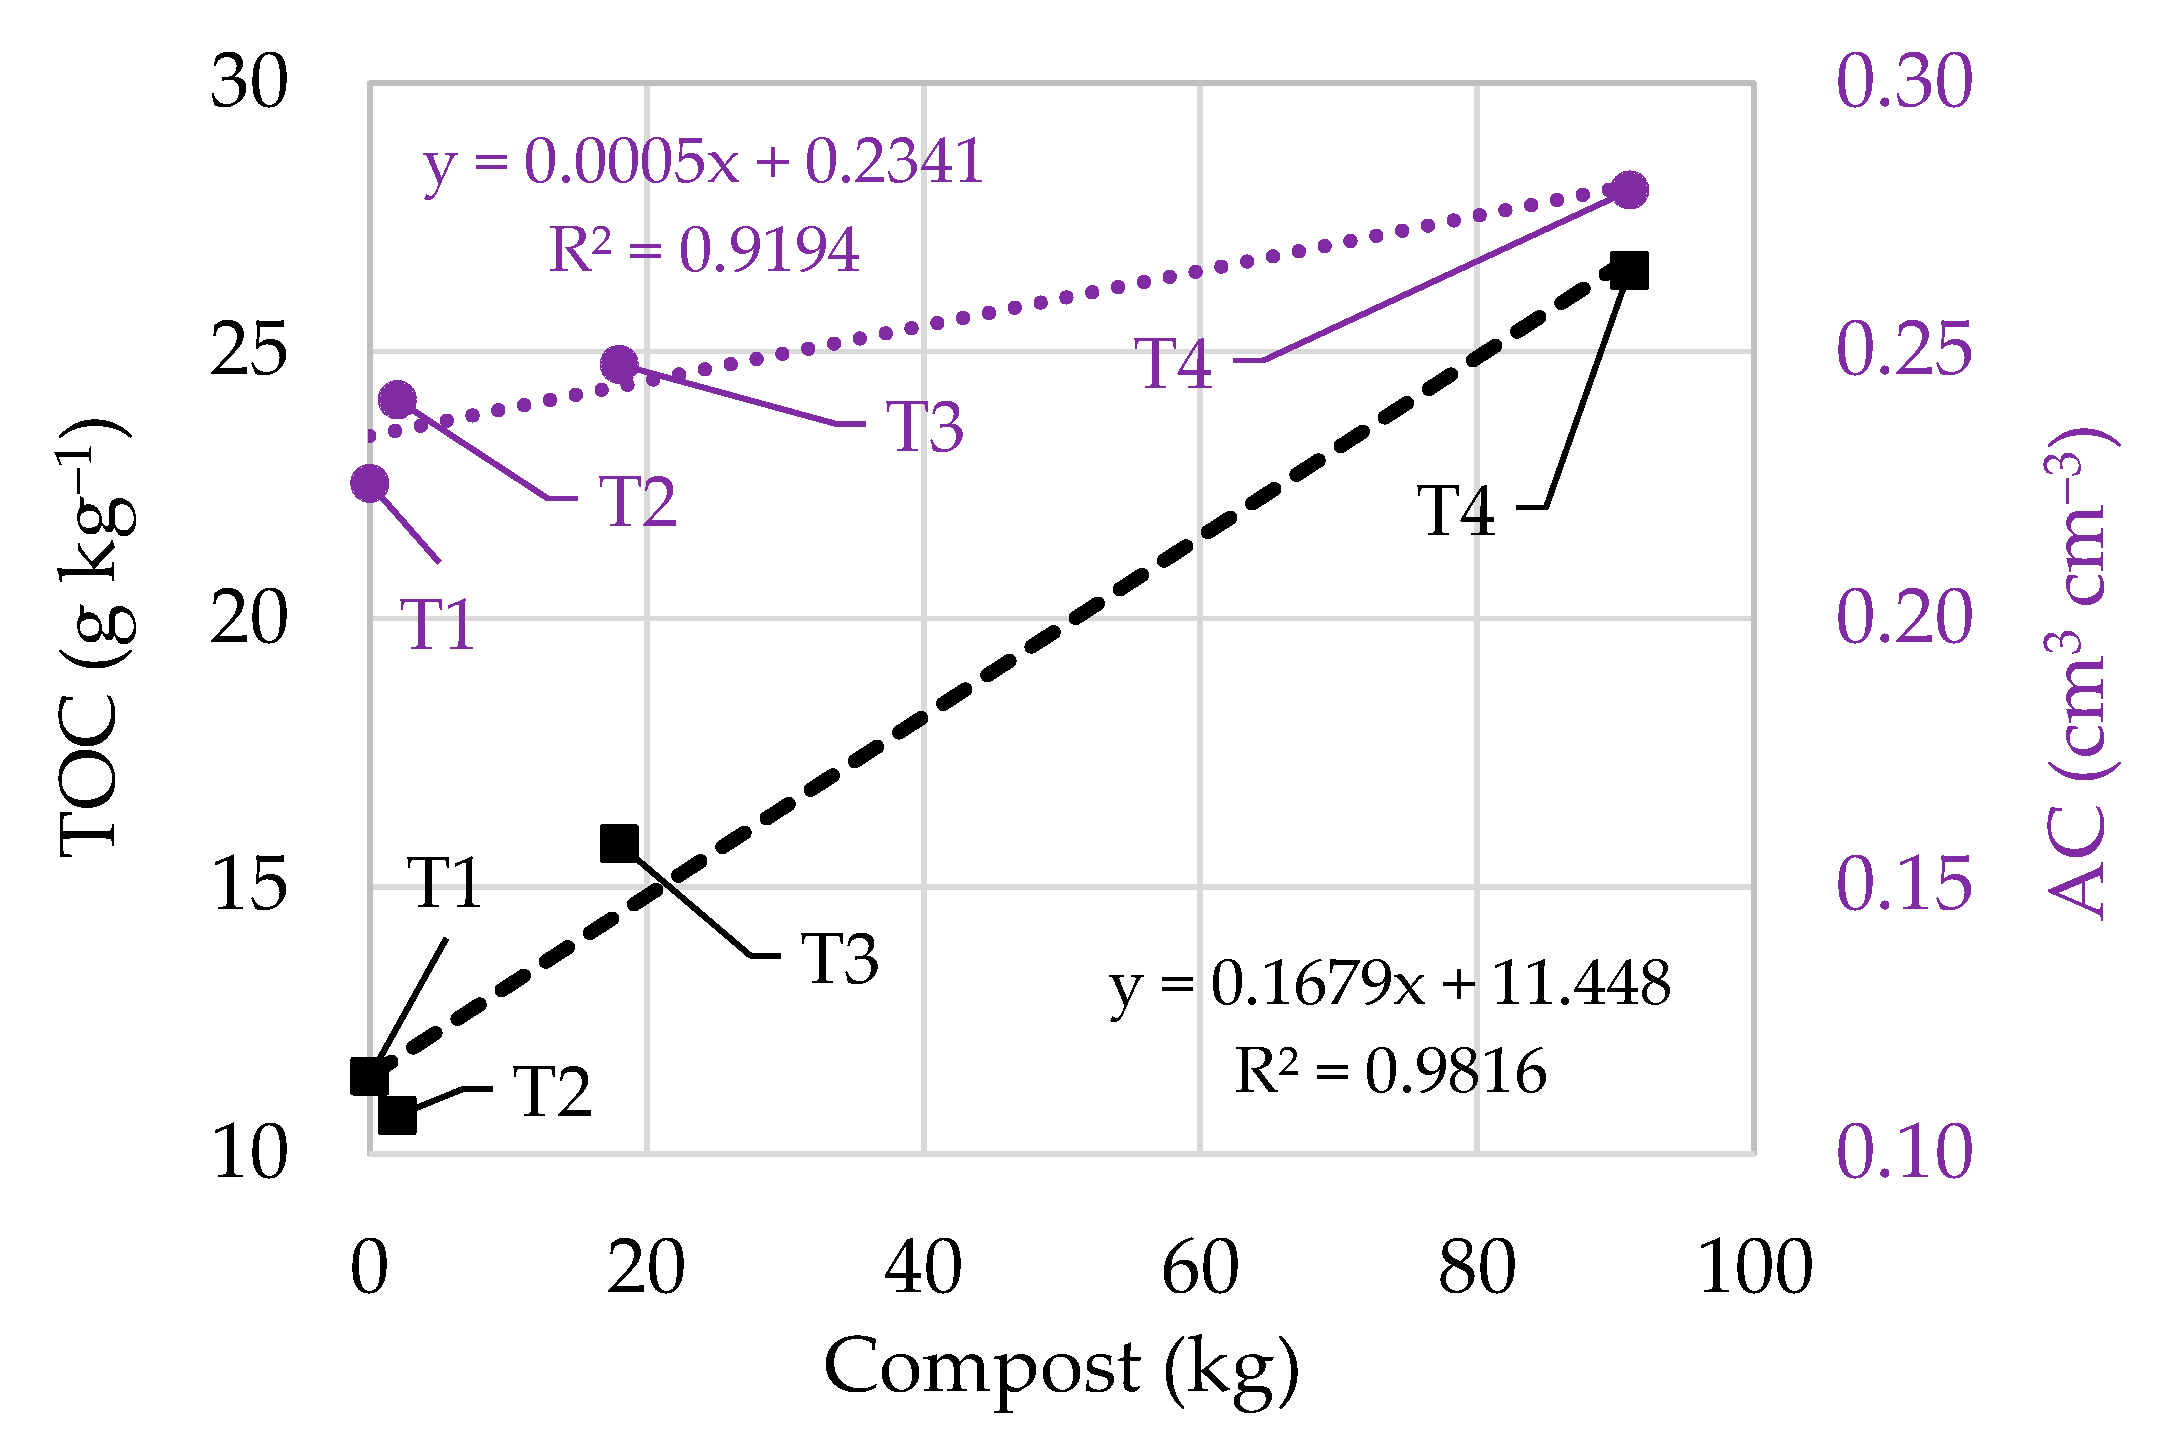
Compost addition affected the water retention and bulk density of the investigated soil. By way of example, Figure 8 shows a summary of the effects in the final stage of the investigation: the addition of increasing compost doses to the investigated soil obviously increased the total organic carbon content that, consequently, positively affected the air capacity of the soil. The highly significant linear regression obtained provided further evidence of the positive effect of soil amendment on water retention. Overall, our results showed that only the highest amendment (T4) was effective in improving the structural stability of the soil (SSI = 5.4%). Since SSI assessment refers to the end of the investigation, it is possible to state that the highest compost rate (75 kg m−2) was adequate to guarantee minimum structural stability for eighteen months at least.
Regardless of the statistical significance detected, the discrepancies in terms of Ks among treatments, at the time of sampling, were generally low and probably negligible from a practical point of view, as the maximum discrepancies among treatments were lower than a factor of 6 in sampling dates 1 and 2; our results also suggest that differences further reduced in the following, as they were never greater than a factor of 2. We hypothesized that (1) the different soil water content at the time of sampling was a key factor capable of affecting the comparison of Ks measurements, and (2) some effects may not have been detected as the first soil measurement (SD1) was carried out approximately eleven months after box filling.
Soil water content at the time of measurements is a main factor affecting the saturated hydraulic conductivity measurements [36]. Our investigation accounted for soil water content that was generally always higher than the field capacity and lower than the water saturation. In this respect, our investigation is placed in a medium–high range of soil water conditions at the time of measurements.
Although it is quite expected that compost may improve (increase) soil water retention (e.g., [37]), temporal changes in hydraulic conductivity (or in infiltration rate) are less obvious and/or easy to interpret overall. It is worth noting that only the highest compost rates, namely amending (T3) and organic (T4) doses, were significantly correlated with saturated hydraulic conductivity, as Ks increased with increasing soil moisture values (Figure 6). However, the results do not allow us to draw general conclusions, as some signals, although not statistically significant, would suggest a relatively greater permeability of unamended soil (i.e., for T1, regression of Ks vs. VSWC had the same slope as compared to T3 and T4 but was placed to the left and higher up than the regressions shown in Figure 6).
When Ks was correlated with independently obtained soil variables, i.e., BD or with indicators obtained from the water retention curve (i.e., PORinf, θinf or dmode), we were also able to obtain information from the relative position of the treatments considered. In this regard, it is worth noting that while the expected positive relationship between compost rate and TOC or AC returns an increasing sequence of treatments (i.e., T1 < T2 < T3 < T4), a different positioning around the regression line is obtained when the effects on conductive features are considered (Figure 7 and Figure 8, respectively), probably due to a negligible effect of the fertilizer dose (T2). The rationale used to interpret our findings, successfully applied in other investigations both in natural [33,40] and agricultural [41] environments, however, was not applicable when the full dataset (initial + ending soil sampling) or when only initial soil condition (initial soil sampling) was considered (Table 4). This result seems obvious enough and may be attributed to the lack of soil structure after box setup. In order to not alter the soil surface of boxes during the investigation, it was not possible to determine water retention at intermediate dates; this prevented establishing after how long a more stable soil structure was reached. However, hydraulic conductivity of saturated soil is, in itself, an indicator that accounts for the soil structure, and checking the short- or medium-term effects of compost addition on soil structure deserves further study. Our results, in fact, highlighted some convincing results, especially those related to the extreme treatments (e.g., the control showed significantly lower Ks values in SD1, as compared to subsequent dates), while no temporal changes were detected for the amending dose (T3). Heavy rainfall events may cause compaction of the upper layers of agricultural soils [42], and some studies have recently investigated such effects, highlighting negative effects on both the Ks [43] and the physical quality of soil [44]. In our investigation, some rainfall events occurred just before the third sampling date, but their effects could not be quantified. Since implementing organic matter into the soil, or creating a mulching layer, is suggested as a viable solution to mitigate such risk factors, more articulated research is desirable to increase our knowledge on these topics.
5. Conclusions
The water retention and bulk density of a clay soil were improved by compost implementation at a rate of 75 kg m−2 (organic dose, T4) and 15 kg m−2 (amending dose, T3), while a lower dosage, equal to 1.5 kg m−2 (fertilizer dose, T2), was found to be comparable with the control (soil not amended, T1). The results allowed to verify that some soil indicators obtained from the water retention curve showed the expected trends, because air capacity (AC) and plant available water capacity (PAWC) increased with the compost rate, while relative field capacity (RFC) and soil bulk density (BD) instead decreased. However, only T4 adequately increased soil organic levels, as suggested, for example, by the structural stability index.
The saturated hydraulic conductivity (Ks) determination allowed to unequivocally establish that compost effects vanished after about eleven months. Conversely, it was not possible to state that composting significantly improved (increased) the permeability of the investigated soil. In fact, although some indirect information would suggest that higher compost rates (T3 or T4) may have improved the soil hydrodynamic properties (e.g., Ks monotonically increased with increasing soil water contents), the results of the first two sampling dates were uncertain, and, moreover, the main effects probably were lost, as Ks measurement began eleven months after box filling. However, significant correlations between Ks and the soil variables independently obtained (soil physical quality indicators carried out from the water retention curve or BD) were detected only after a relatively long time (after 20 months, rather than 2 months). Consequently, if the purpose is to evaluate the impact of compost implementation on Ks improvement, we could conclude that the time frame is limited to about six months after box filling or, by analogy, after conventional soil tillage.
In conclusion, the results obtained were more convincing for the effects on hydrostatic properties than hydrodynamic ones. The experimental factor that probably contributed to this was the different water content of the soil, as compost is known to help improve soil moisture. Further studies could help improve our knowledge of the effects of compost incorporation on soil structure, hydraulic properties, and physical quality.
Supplementary Materials
The following supporting information can be downloaded at: https://www.mdpi.com/article/10.3390/agronomy12061446/s1, Figure S1. View of experimental boxes with indication of the four treatments (T) considered. Note that boxes arrangement in figure corresponds to schematization on the side. Figure S2. Normalized pore volume distributions of the four treatments obtained at the start and end of investigation. Figure S3. Comparison of normalized pore volume distributions between start and end of investigation for each considered treatment (T1 to T4). The reference curve by Reynolds et al. [13] was also reported.
Author Contributions
Conceptualization, M.C.; methodology, M.C. and M.D.; formal analysis, M.C.; investigation, M.C.; resources, M.D. and F.M.; data curation, A.P.; writing—original draft preparation, M.C.; writing—review and editing, M.C., M.D., A.P. and F.M.; supervision, M.C.; funding acquisition, M.C. and M.D. All authors have read and agreed to the published version of the manuscript.
Funding
The work was supported by the projects (i) “Water4AgriFood, Miglioramento delle produzioni agroalimentari mediterranee in condizioni di carenza di risorse idriche”, PNR 2015–2020”, funded by MIUR, PON ARS01_00825 “Ricerca e Innovazione” 2014–2020; (ii) AGROCAMBIO (Sistemi e tecniche AGROnomiche di adattamento ai CAMbiamenti climatici in sistemi agricoli BIOlogici) and RETIBIO (Attivita di supporto nel settore dell’agricoltura biologica per il mantenimento dei dispositivi sperimentali di lungo termine e il rafforzamento delle reti di relazioni esistenti a livello nazionale e internazionale), funded by the Organic Farming Office of the Italian Ministry of Agriculture.
Informed Consent Statement
Not applicable.
Data Availability Statement
Not applicable.
Acknowledgments
The authors want to acknowledge Marco Favale, Angelo Fiore, Luisa Giglio, Angelo Quaranta, and Rosalba Scazzariello, for their skillful work in the field and laboratory.
Conflicts of Interest
The authors declare no conflict of interest.
References
- Smith, P.; House, J.I.; Bustamante, M.; Sobocká, J.; Harper, R.; Pan, G.; West, P.C.; Clark, J.M.; Adhya, T.; Rumpel, C.; et al. Global change pressures on soils from land use and management. Glob. Change Biol. 2016, 22, 1008–1028. [Google Scholar] [CrossRef] [PubMed]
- Prout, J.M.; Shepherd, K.D.; McGrath, S.P.; Kirk, G.J.D.; Hassall, K.L.; Haefele, S.M. Changes in organic carbon to clay ratios in different soils and land uses in England and Wales over time. Sci. Rep. 2022, 12, 5162. [Google Scholar] [CrossRef] [PubMed]
- Virto, I.; Imaz, M.J.; Fernández-Ugalde, O.; Gartzia-Bengoetxea, N.; Enrique, A.; Bescansa, P. Soil degradation and soil quality in Western Europe: Current situation and future perspectives. Sustainability 2014, 7, 313–365. [Google Scholar] [CrossRef] [Green Version]
- Iovino, M.; Castellini, M.; Bagarello, V.; Giordano, G. Using static and dynamic indicators to evaluate soil physical quality in a Sicilian area. Land Degrad. Dev. 2016, 27, 200–210. [Google Scholar] [CrossRef]
- Pane, C.; Celano, G.; Piccolo, A.; Villecco, D.; Spaccini, R.; Palese, M.A.; Zaccardelli, M. Effects of on-farm composted tomato residues on soil biological activity and yields in a tomato cropping system. Chem. Biol. Technol. Agric. 2015, 2, 4. [Google Scholar] [CrossRef] [Green Version]
- Diacono, M.; Persiani, A.; Testani, E.; Montemurro, F.; Ciaccia, C. Recycling agricultural wastes and by-products in organic farming: Biofertilizers production, yield performance and carbon footprint analysis. Sustainability 2019, 11, 3824. [Google Scholar] [CrossRef] [Green Version]
- Persiani, A.; Montemurro, F.; Diacono, M. Agronomic and Environmental Performances of On-Farm Compost Production and Application in an Organic Vegetable Rotation. Agronomy 2021, 11, 2073. [Google Scholar] [CrossRef]
- Diacono, M.; Persiani, A.; Castellini, M.; Giglio, L.; Montemurro, F. Intercropping and rotation with leguminous plants in organic vegetables: Crop performance, soil properties and sustainability assessment. Biol. Agric. Hortic. 2021, 37, 141–167. [Google Scholar] [CrossRef]
- Arthur, E.; Cornelis, W.M.; Vermang, J.; de Rocker, E. Amending a loamy sand with three compost types: Impact on soil quality. Soil Use Manag. 2011, 27, 116–123. [Google Scholar] [CrossRef]
- Bondì, C.; Castellini, M.; Iovino, M. Compost Amendment Impact on Soil Physical Quality Estimated from Hysteretic Water Retention Curve. Water 2022, 14, 1002. [Google Scholar] [CrossRef]
- Rivier, P.-A.; Jamniczky, D.; Nemes, A.; Makó, A.; Barna, G.; Uzinger, N.; Rékási, M.; Farkas, C. Short-term effects of compost amendments to soil on soil structure, hydraulic properties, and water regime. J. Hydrol. Hydromech. 2022, 70, 74–88. [Google Scholar] [CrossRef]
- Glab, T.; Zabinski, A.; Sadowska, U.; Gondek, K.; Kopec, M.; Mierzwa-Hersztek, M.; Tabor, S. Effects of co-composted maize, sewage sludge, and biochar mixtures on hydrological and physical qualities of sandy soil. Geoderma 2018, 315, 27–35. [Google Scholar] [CrossRef]
- Reynolds, W.D.; Drury, C.F.; Tan, C.S.; Fox, C.A.; Yang, X.M. Use of indicators and pore volume-function characteristics to quantify soil physical quality. Geoderma 2009, 152, 252–263. [Google Scholar] [CrossRef]
- Börjesson, G.; Kätterer, T. Soil fertility effects of repeated application of sewage sludge in two 30-year-old field experiments. Nutr. Cycl. Agroecosyst. 2018, 112, 369–385. [Google Scholar] [CrossRef] [Green Version]
- Yüksel, O.; Kavdir, Y. Improvement of soil quality parameters by municipal solid waste compost application in clay-loam soil. Turk. J. Agric.-Food Sci. Technol. 2020, 8, 603–609. [Google Scholar] [CrossRef] [Green Version]
- Curci, M.; Lavecchia, A.; Cucci, G.; Lacolla, G.; De Corato, U.; Crecchio, C. Short-Term Effects of Sewage Sludge Compost Amendment on Semiarid Soil. Soil Syst. 2020, 4, 48. [Google Scholar] [CrossRef]
- Whelan, A.; Kechavarzi, C.; Coulon, F.; Sakrabani, R.; Lord, R. Influence of compost amendments on the hydraulic functioning of brownfield soils. Soil Use Manag. 2013, 29, 260–270. [Google Scholar] [CrossRef] [Green Version]
- De Benedetto, D.; Montemurro, F.; Diacono, M. Impacts of agro-ecological practices on soil losses and cash crop yield. Agriculture 2017, 7, 103. [Google Scholar] [CrossRef] [Green Version]
- Ventrella, D.; Losavio, N.; Vonella, A.V.; Leij, F.J. Estimating hydraulic conductivity of a fine-textured soil using tension infiltrometry. Geoderma 2005, 124, 267–277. [Google Scholar] [CrossRef]
- Dane, J.H.; Hopmans, J.W. 3.3.2.2 Hanging water column. In Methods of Soil Analysis, Part 4, Physical Methods, Number 5 in the Soil Science Society of America Book Series; Dane, J.H., Topp, G.C., Eds.; Soil Science Society of America, Inc.: Madison, WI, USA, 2002; pp. 680–683. [Google Scholar]
- Dane, J.H.; Hopmans, J.W. 3.3.2.4 Pressure plate extractor. In Methods of Soil Analysis, Part 4, Physical Methods, Number 5 in the Soil Science Society of America Book Series; Dane, J.H., Topp, G.C., Eds.; Soil Science Society of America, Inc.: Madison, WI, USA, 2002; pp. 688–690. [Google Scholar]
- Castellini, M.; Iovino, M. Pedotransfer functions for estimating soil water retention curve of Sicilian soils. Arch. Agron. Soil Sci. 2019, 65, 1401–1416. [Google Scholar] [CrossRef]
- Seki, K. SWRC fit—A nonlinear fitting program with a water retention curve for soils having unimodal and bimodal pore structure. Hydrol. Earth Syst. Sci. 2007, 4, 407–437. [Google Scholar] [CrossRef] [Green Version]
- Bagarello, V.; Di Prima, S.; Iovino, M. Estimating saturated soil hydraulic conductivity by the near steady-state phase of a Beerkan infiltration test. Geoderma 2017, 303, 70–77. [Google Scholar] [CrossRef]
- Reynolds, W.D.; Elrick, D.E. Ponded infiltration from a single ring: I. Analysis of steady flow. Soil Sci. Soc. Am. J. 1990, 54, 1233–1241. [Google Scholar] [CrossRef]
- Castellini, M.; Di Prima, S.; Moret-Fernández, D.; Lassabatere, L. Rapid and accurate measurement methods for determining soil hydraulic properties: A review. J. Hydrol. Hydromech. 2021, 69, 121–139. [Google Scholar] [CrossRef]
- Vitti, C.; Stellacci, A.M.; Leogrande, R.; Mastrangelo, M.; Cazzato, E.; Ventrella, D. Assessment of organic carbon in soils: A comparison between the Springer–Klee wet digestion and the dry combustion methods in Mediterranean soils (Southern Italy). Catena 2016, 137, 113–119. [Google Scholar] [CrossRef]
- Dexter, A.R. Soil physical quality: Part I. Theory, effects of soil texture, density, and organic matter, and effects on root growth. Geoderma 2004, 120, 201–214. [Google Scholar] [CrossRef]
- Han, H.; Giménez, D.; Lilly, A. Textural averages of saturated soil hydraulic conductivity predicted from water retention data. Geoderma 2008, 146, 121–128. [Google Scholar] [CrossRef]
- Stellacci, A.M.; Castellini, M.; Diacono, M.; Rossi, R.; Gattullo, C.E. Assessment of soil quality under different soil management strategies: Combined use of statistical approaches to select the most informative soil physico-chemical indicators. Appl. Sci. 2021, 11, 5099. [Google Scholar] [CrossRef]
- Castellini, M.; Stellacci, A.M.; Tomaiuolo, M.; Barca, E. Spatial variability of soil physical and hydraulic properties in a durum wheat field: An assessment by the BEST-Procedure. Water 2019, 11, 1434. [Google Scholar] [CrossRef] [Green Version]
- Manici, L.M.; Castellini, M.; Caputo, F. Soil-inhabiting fungi can integrate soil physical indicators in multivariate analysis of Mediterranean agroecosystem dominated by old olive groves. Ecol. Indic. 2019, 106, 105490. [Google Scholar] [CrossRef]
- Castellini, M.; Iovino, M.; Pirastru, M.; Niedda, M.; Bagarello, V. Use of BEST procedure to assess soil physical quality in the Baratz Lake catchment (Sardinia, Italy). Soil Sci. Soc. Am. J. 2016, 80, 742–755. [Google Scholar] [CrossRef]
- Lee, D.M.; Elrick, D.E.; Reynolds, W.D.; Clothier, B.E. A comparison of three field methods for measuring saturated hydraulic conductivity. Can. J. Soil Sci. 1985, 65, 563–573. [Google Scholar] [CrossRef]
- Bagarello, V.; Sgroi, A. Using the simplified falling head technique to detect temporal changes in field-saturated hydraulic conductivity at the surface of a sandy loam soil. Soil Till. Res. 2007, 94, 283–294. [Google Scholar] [CrossRef]
- Angulo-Jaramillo, R.; Bagarello, V.; Iovino, M.; Lassabatere, L. Saturated Soil Hydraulic Conductivity. In Infiltration Measurements for Soil Hydraulic Characterization; Springer International Publishing: Berlin/Heidelberg, Germany, 2016; pp. 43–180. ISBN 978-3-319-31786-1. [Google Scholar]
- Kranz, C.N.; McLaughlin, R.A.; Johnson, A.; Miller, G.; Heitman, J.L. The effects of compost incorporation on soil physical properties in urban soils—A concise review. J. Environ. Manag. 2020, 261, 110209. [Google Scholar] [CrossRef] [PubMed]
- Montemurro, F.; Persiani, A.; Diacono, M. Organic vegetable crops managed with agro-ecological practices: Environmental sustainability assessment by DEXi-met decision support system. Appl. Sci. 2019, 9, 4148. [Google Scholar] [CrossRef] [Green Version]
- Pieri, C.J.M.G. Fertility of Soils: A Future for Farming in the West African Savannah; Springer: Berlin/Heidelberg, Germany, 1992. [Google Scholar]
- Lozano-García, B.; Parras-Alcántara, L. Changes in soil properties and soil solution nutrients due to conservation versus conventional tillage in Vertisols. Arch. Agron. Soil Sci. 2014, 60, 1429–1444. [Google Scholar] [CrossRef]
- Castellini, M.; Vonella, A.V.; Ventrella, D.; Rinaldi, M.; Baiamonte, G. Determining soil hydraulic properties using infiltrometer techniques: An assessment of temporal variability in a long-term experiment under minimum- and no-tillage soil management. Sustainability 2020, 12, 5019. [Google Scholar] [CrossRef]
- Panagos, P.; Ballabio, C.; Borrelli, P.; Meusburger, K.; Klik, A.; Rousseva, S.; Tadić, M.P.; Michaelides, S.; Hrabalíková, M.; Olsen, P.; et al. Rainfall erosivity in Europe. Sci. Total Environ. 2015, 511, 801–814. [Google Scholar] [CrossRef] [Green Version]
- Castellini, M.; Stellacci, A.M.; Di Prima, S.; Iovino, M.; Bagarello, V. Improved beerkan run methodology to assess water impact effects on infiltration and hydraulic properties of a loam soil under conventional- and no-tillage. Soil Sci. Soc. Am. J. 2021, 85, 235–248. [Google Scholar] [CrossRef]
- Castellini, M.; Stellacci, A.M.; Sisto, D.; Iovino, M. The mechanical impact of water affected the soil physical quality of a loam soil under minimum tillage and no-tillage: An assessment using Beerkan multi-height runs and BEST-procedure. Land 2021, 10, 195. [Google Scholar] [CrossRef]
Figure 1.
Temporal evolution of mean values of volumetric soil water content (VSWC%) of different soil treatments (T1 to T4), with indication of both observed hourly rainfall events (black line) and infiltration sampling dates (SDx, black diamonds). Note that the VSWC curves represent the average values observed at 10 and 20 cm depths. For each soil treatment, dashed lines represent the measured field capacity and estimated saturated water contents of the soil. T1: control without compost; T2: fertilizer dose; T3: amending dose; T4: organic dose.

Figure 2.
Soil water retention curves comparison between considered soil treatments (T1–T4) at 2 (2nd) and 20 (20th) months after box preparation. T1: control without compost; T2: fertilizer dose; T3: amending dose; T4: organic dose.
Figure 2.
Soil water retention curves comparison between considered soil treatments (T1–T4) at 2 (2nd) and 20 (20th) months after box preparation. T1: control without compost; T2: fertilizer dose; T3: amending dose; T4: organic dose.

Figure 3.
Infiltration rates (ir) obtained for soil treatments (T1 to T4) against cumulative infiltration (I), for each considered sampling date (SD1 to SD6). T1: control without compost; T2: fertilizer dose; T3: amending dose; T4: organic dose.
Figure 3.
Infiltration rates (ir) obtained for soil treatments (T1 to T4) against cumulative infiltration (I), for each considered sampling date (SD1 to SD6). T1: control without compost; T2: fertilizer dose; T3: amending dose; T4: organic dose.

Figure 4.
Example of estimation of the equilibration time, ts (s), and infiltrated depth at the equilibration time, I(ts) (mm), from cumulative infiltration. The error (E%) between measures and estimates, to define a given threshold (i.e., 2%) and to check linearity, was also reported. Note that transient infiltration conditions (white circles) occur from time 0 until 1088 s (i.e., when E > 2%), while steady-state conditions (green circles) for data measured after 1088 s (i.e., E < 2%).

Figure 5.
Box plots of saturated soil hydraulic conductivity, Ks, obtained for each treatment (T) and sampling date (SD). Note that the thick-red line within each box represents the mean value (the fine-black line, the median); open circles represent outliers, and closed circles are extreme outliers. Mean values marked with same letters are not significantly different according to a Tukey HSD test (p = 0.05). T1: control without compost; T2: fertilizer dose; T3: amending dose; T4: organic dose.

Figure 6.
Relationship between saturated hydraulic conductivity (Ks) and volumetric soil water content (VSWC) for sampling dates 1 to 4. T3: amending dose; T4: organic dose.
Figure 6.
Relationship between saturated hydraulic conductivity (Ks) and volumetric soil water content (VSWC) for sampling dates 1 to 4. T3: amending dose; T4: organic dose.

Figure 7.
Representative relationships between saturated hydraulic conductivity, Ks (mm h−1), and soil indicators, i.e., dry bulk density, BD (g cm−3), porosity at the inflection point of water retention curve PORinf (cm3 cm−3), water content at the inflection point of water retention curve θinf (cm3 cm−3), modal diameter of pore volume distribution, dmode (μm). Note that data refer only to the final stage (end) of investigation. T1: control without compost; T2: fertilizer dose; T3: amending dose; T4: organic dose.

Figure 8.
Relationships between total organic carbon (TOC) and air capacity (AC) as a function of compost addition to experimental boxes (T1 to T4). Note that data refer to the final stage (end) of investigation. T1: control without compost; T2: fertilizer dose; T3: amending dose; T4: organic dose.
Figure 8.
Relationships between total organic carbon (TOC) and air capacity (AC) as a function of compost addition to experimental boxes (T1 to T4). Note that data refer to the final stage (end) of investigation. T1: control without compost; T2: fertilizer dose; T3: amending dose; T4: organic dose.


Table 1.
Days of composting process, and mean values (and standard deviations) of dry matter, pH, electrical conductivity (EC), total nitrogen (N) content, total organic carbon (C) content, and C/N ratio of the compost used in the investigation.
Table 1.
Days of composting process, and mean values (and standard deviations) of dry matter, pH, electrical conductivity (EC), total nitrogen (N) content, total organic carbon (C) content, and C/N ratio of the compost used in the investigation.
| Composting Process (d) | Dry Matter (%) | pH | EC (Meq 100 g−1) | N (%) | C (%) | C/N |
|---|---|---|---|---|---|---|
| 90 | 60.26 ± 1.90 | 7.98 ± 0.05 | 11.91 ± 0.07 | 2.79 ± 0.10 | 22.02 ± 0.45 | 7.90 |
Table 2.
Mean values of the equilibration time (ts), infiltrated depth at the equilibration time (I(ts)) and percentage of infiltrated depth at the equilibration time (ID) obtained for considered soil treatments (T1 to T4) and sampling date (SD1 to SD6). T1: control without compost; T2: fertilizer dose; T3: amending dose; T4: organic dose.
| SD1 | SD2 | SD3 | SD4 | SD5 | SD6 | ||
|---|---|---|---|---|---|---|---|
| T1 | ts (s) | 1895 | 266 | 264 | 617 | 588 | 483 |
| I(ts) (mm) | 142 | 132 | 142 | 147 | 150 | 132 | |
| ID (%) | 81 | 76 | 81 | 84 | 86 | 76 | |
| T2 | ts (s) | 407 | 1211 | 409 | 449 | 402 | 627 |
| I(ts) (mm) | 134 | 145 | 142 | 136 | 134 | 141 | |
| ID (%) | 77 | 83 | 81 | 78 | 77 | 81 | |
| T3 | ts (s) | 677 | 976 | 444 | 343 | 633 | 446 |
| I(ts) (mm) | 141 | 144 | 150 | 145 | 152 | 124 | |
| ID (%) | 81 | 82 | 86 | 83 | 87 | 71 | |
| T4 | ts (s) | 1209 | 971 | 568 | 323 | 407 | 842 |
| I(ts) (mm) | 144 | 141 | 144 | 152 | 132 | 134 | |
| ID (%) | 82 | 81 | 82 | 87 | 76 | 77 |
Table 3.
Results of Tukey HSD test performed on saturated hydraulic conductivity values obtained for considered soil treatments (T), among different sampling dates (SD) (* p < 0.05; ** p < 0.01; n.s. not significant). T1: control without compost; T2: fertilizer dose; T3: amending dose; T4: organic dose.
| T1 | T2 | T3 | T4 | |||||
|---|---|---|---|---|---|---|---|---|
| SD | p-Value | Inference | p-Value | Inference | p-Value | Inference | p-Value | Inference |
| 1 vs. 2 | 0.574 | n.s. | 0.030 | * | 0.900 | n.s. | 0.001 | ** |
| 1 vs. 3 | 0.002 | ** | 0.295 | n.s. | 0.186 | n.s. | 0.250 | n.s. |
| 1 vs. 4 | 0.900 | n.s. | 0.277 | n.s. | 0.900 | n.s. | 0.470 | n.s. |
| 1 vs. 5 | 0.900 | n.s. | 0.845 | n.s. | 0.900 | n.s. | 0.825 | n.s. |
| 1 vs. 6 | 0.900 | n.s. | 0.694 | n.s. | 0.900 | n.s. | 0.900 | n.s. |
| 2 vs. 3 | 0.127 | n.s. | 0.001 | ** | 0.134 | n.s. | 0.021 | * |
| 2 vs. 4 | 0.900 | n.s. | 0.876 | n.s. | 0.900 | n.s. | 0.007 | ** |
| 2 vs. 5 | 0.900 | n.s. | 0.303 | n.s. | 0.900 | n.s. | 0.001 | ** |
| 2 vs. 6 | 0.900 | n.s. | 0.453 | n.s. | 0.900 | n.s. | 0.001 | ** |
| 3 vs. 4 | 0.015 | * | 0.002 | ** | 0.421 | n.s. | 0.900 | n.s. |
| 3 vs. 5 | 0.013 | * | 0.029 | * | 0.167 | n.s. | 0.888 | n.s. |
| 3 vs. 6 | 0.023 | * | 0.015 | * | 0.179 | n.s. | 0.087 | n.s. |
| 4 vs. 5 | 0.900 | n.s. | 0.900 | n.s. | 0.900 | n.s. | 0.900 | n.s. |
| 4 vs. 6 | 0.900 | n.s. | 0.900 | n.s. | 0.900 | n.s. | 0.199 | n.s. |
| 5 vs. 6 | 0.900 | n.s. | 0.900 | n.s. | 0.900 | n.s. | 0.522 | n.s. |
Table 4.
Soil physical quality indicators obtained for initial (start) and final (end) stage of investigation, in the treatments T1 to T4. T1: control without compost; T2: fertilizer dose; T3: amending dose; T4: organic dose.
Table 4.
Soil physical quality indicators obtained for initial (start) and final (end) stage of investigation, in the treatments T1 to T4. T1: control without compost; T2: fertilizer dose; T3: amending dose; T4: organic dose.
| BD | PMAC | AC | RFC | PAWC | hinf | θinf | Dinf | Sinf | PORinf | λinf | dmod | dmed | dm | SD | Sk | Ku | |
|---|---|---|---|---|---|---|---|---|---|---|---|---|---|---|---|---|---|
| Start | |||||||||||||||||
| T1 | 0.831 | 0.184 | 0.245 | 0.477 | 0.024 | 4.5 | 0.170 | 656 | 0.133 | 0.299 | 0.786 | 656 | 565 | 527 | 2.8 | −0.22 | 1.13 |
| T2 | 0.810 | 0.249 | 0.355 | 0.386 | 0.023 | 4.9 | 0.261 | 608 | 0.178 | 0.317 | 0.681 | 608 | 500 | 457 | 3.2 | −0.25 | 1.14 |
| T3 | 0.826 | 0.255 | 0.367 | 0.400 | 0.045 | 4.4 | 0.278 | 680 | 0.156 | 0.333 | 0.559 | 680 | 514 | 451 | 4.1 | −0.30 | 1.14 |
| T4 | 0.773 | 0.269 | 0.380 | 0.387 | 0.040 | 4.1 | 0.308 | 722 | 0.171 | 0.312 | 0.557 | 722 | 545 | 477 | 4.1 | −0.30 | 1.14 |
| End | |||||||||||||||||
| T1 | 1.088 | 0.101 | 0.225 | 0.571 | 0.100 | 10.6 | 0.151 | 280 | 0.070 | 0.374 | 0.462 | 280 | 189 | 157 | 5.4 | −0.35 | 1.15 |
| T2 | 1.102 | 0.111 | 0.241 | 0.557 | 0.103 | 10.2 | 0.164 | 292 | 0.071 | 0.380 | 0.431 | 292 | 188 | 152 | 6.1 | −0.37 | 1.15 |
| T3 | 1.111 | 0.115 | 0.247 | 0.566 | 0.123 | 10.9 | 0.199 | 275 | 0.064 | 0.371 | 0.321 | 275 | 132 | 92 | 11.2 | −0.46 | 1.16 |
| T4 | 0.858 | 0.109 | 0.280 | 0.536 | 0.124 | 13.7 | 0.262 | 217 | 0.108 | 0.341 | 0.410 | 217 | 134 | 106 | 6.7 | −0.38 | 1.15 |
BD = dry bulk density (g cm−3), PMAC = macroporosity (cm3 cm−3), AC = air capacity (cm3 cm−3), RFC = relative field capacity (-), PAWC = plant available water capacity (cm3 cm−3), hinf = soil pressure head at the inflection point of water retention curve (cm), θinf = soil water content at hinf (cm3 cm−3), Dinf = pore diameter at hinf (μm), Sinf = S-Dexter (-), PORinf = porosity at hinf (cm3 cm−3), λinf = pores distribution index (-), dmod = modal diameter of pore volume distribution (μm), dmed = median diameter of pore volume distribution (μm), dm = mean diameter of pore volume distribution (μm), SD = standard deviation of pore volume distribution (-), Sk = asymmetry of pore volume distribution (-), Ku = kurtosys of pore volume distribution (-).
Publisher’s Note: MDPI stays neutral with regard to jurisdictional claims in published maps and institutional affiliations. |
© 2022 by the authors. Licensee MDPI, Basel, Switzerland. This article is an open access article distributed under the terms and conditions of the Creative Commons Attribution (CC BY) license (https://creativecommons.org/licenses/by/4.0/).
Share and Cite
MDPI and ACS Style
Castellini, M.; Diacono, M.; Preite, A.; Montemurro, F. Short- and Medium-Term Effects of On-Farm Compost Addition on the Physical and Hydraulic Properties of a Clay Soil. Agronomy 2022, 12, 1446. https://doi.org/10.3390/agronomy12061446
AMA Style
Castellini M, Diacono M, Preite A, Montemurro F. Short- and Medium-Term Effects of On-Farm Compost Addition on the Physical and Hydraulic Properties of a Clay Soil. Agronomy. 2022; 12(6):1446. https://doi.org/10.3390/agronomy12061446
Chicago/Turabian StyleCastellini, Mirko, Mariangela Diacono, Antonio Preite, and Francesco Montemurro. 2022. "Short- and Medium-Term Effects of On-Farm Compost Addition on the Physical and Hydraulic Properties of a Clay Soil" Agronomy 12, no. 6: 1446. https://doi.org/10.3390/agronomy12061446
Note that from the first issue of 2016, this journal uses article numbers instead of page numbers. See further details here.