Article

Evaluating the Fertilising Potential of Blended Recovered Nutrients in Horticultural Growing Medium on Viola x wittrockiana L.

by
Ana A. Robles-Aguilar
1,*,†,
Oliver Grunert
2,3,4,†,
Erik Meers
1 and
Nicolai D. Jablonowski
5
1
Department of Green Chemistry and Technology, Faculty of Bioscience Engineering, Ghent University, Coupure Links 653, 9000 Gent, Belgium
2
Aphea.Bio, Technologiepark 21, 9052 Zwijnaarde, Belgium
3
Agaris Belgium NV, Skaldenstraat 7A, 9042 Gent, Belgium
4
Laboratory of Microbial Ecology and Technology (LabMET), Ghent University, Coupure Links 653, 9000 Gent, Belgium
5
Institute of Bio- and Geosciences, IBG-2: Plant Sciences, Forschungszentrum Jülich GmbH, 52425 Jülich, Germany
*
Author to whom correspondence should be addressed.
Both authors contributed equally to this work.
Agronomy 2022, 12(1), 182; https://doi.org/10.3390/agronomy12010182
Submission received: 23 December 2021 / Revised: 7 January 2022 / Accepted: 9 January 2022 / Published: 12 January 2022

Abstract

:
Viola x wittrockiana L. is an ornamental plant in high demand in horticulture. It is becoming more critical for greenhouse growers to focus on sustainable production to enhance plant quality while reducing negative environmental impacts. Therefore, assessing the effect of recycled phosphorous (P) and nitrogen (N) sources on the growth of viola could become very useful for producers in terms of sustainability. This experiment analysed the optimal fertiliser composition to grow viola using recovered fertilisers in a greenhouse trial under controlled conditions. Well-rooted viola plugs were grown in a standard peat-based growing medium. Using recycled sources of P and N as struvite and potassium struvite, ammonium sulphate, and ammonium nitrate, 14 fertiliser blends were prepared, tested, and compared with the slow-release commercial fertiliser Osmocote. Plants treated with ammonium nitrate showed healthy growth and optimal plant N concentrations. In contrast, most blends using the recovered ammonium sulphate resulted in an unacceptable increase of ammonium concentrations in the growing medium. The combination of ammonium sulphate and potassium sulphate caused an increase in the electrical conductivity in the growing medium, negatively affecting plant growth. However, blend 13 containing struvite, ammonium sulphate and potassium struvite expressed the best chemical composition with non-significant differences in the biomass from the positive controls, as it reduced the amount of potassium sulphate needed. Our results indicate that fertiliser blends containing P as struvite, N as ammonium nitrate or reduced amount of ammonium sulphate, and K as potassium struvite can substitute the use of mineral fertiliser blends to grow ornamental plant species as viola.

1. Introduction

The fertiliser industry produces many different fertilising products for soil and growing media, mainly containing guaranteed contents of nitrogen (N), phosphorus (P), and potassium (K) as the major plant nutrients. In the past, abundant use of fertilisers in the greenhouse industry was common practice [1]. The soilless culture systems (SCS) are a leading technological factor of the modern greenhouse industry to reduce fertiliser input and overall costs. In open SCS, the fertigation solution that leaches out is discharged, while in closed SCS, the solution is collected and reused. Water-based culture systems are essentially closed systems, as the nutrient solution that runs off from the root zone is difficult to control through the water retention capacity of a porous medium. Crops like viola cultivated on growing media can perform either as an open or closed soilless culture system. The drainage of the fertilizer in open soilless culture systems results in a non-negligible loss of the economic benefits arising from fertilizer savings, but more importantly, potentially jeopardising the environmental benefits of soilless culture systems, with lower land and water use than conventional agriculture, and thus improving yields and resource use efficiency [2]. Furthermore, without limitations in the use and type of fertilisers, leached irrigation water from these growing media-based systems containing high concentrations of nutrients results in potential eutrophication and water pollution when discharged to the environment [3,4]. Due to exceeded nitrate threshold limits in ground and surface water, fertiliser-related environmental pollution over recent years has become a subject of growing attention for the European Union and its member states [5].
Moreover, a circular bioeconomy system that closes nutrient loops and gives waste streams a new life is an upcoming approach in agriculture and horticultural business. Following this idea of a closed nutrient loop, using recycled nutrients obtained after the biomass conversion, e.g., bioenergy and further treatment of the by-product as a fertiliser, can be a promising approach [6]. The recovered fertilisers can also be stable and free of contaminants, thus reducing the need for synthetically produced or mined fertilisers such as N and P [7]. Furthermore, the EU emphasises reduction of the import dependency on P from exhaustible mineral deposits and the partial reliance on fossil fuels to synthesise N-fertilizer via the Haber–Bosch process [8].
In the last decade, increasing numbers of fertilising products on the EU market were produced from organic waste streams. However, the existing EU Regulation does not yet control these novel fertilisers. The European Commission (EC) foresees replacing the currently valid Regulation No 2003/2003, expanding its scope to secondary raw materials, i.e., recovered and bio-based fertilising products [9]. This new agreement on the Fertilising Products Regulation will open the market for new and more sustainable fertilisers that can also be interesting for the horticulture business. Still, their effectiveness and environmental risk need to be assessed.
In this experiment, two alternative sources of N recovered from digested manure (ammonium nitrate and ammonium sulphate), and two sources of P recovered from manure or wastewater, namely struvite (MgNH4PO4·6H2O) and potassium-struvite (MgKPO4·6H2O), were used to grow viola in a randomised greenhouse experiment under controlled conditions. The N sources used in this experiment are candidates to be included in the REcovered Nitrogen from manURE (RENURE) category. RENURE products refer to an end-of-manure status vis-à-vis the EU Nitrates Directive, which would position such product en-par with synthetic chemical fertilisers from a legal perspective [10]. Likewise, in the new EU Fertilising Products Regulation, secondary raw P materials, such as struvite, could also be classified into the component material category and commercialised as ‘EC fertilisers’. This will help to boost its acceptance by the EU farmer community, as nowadays some recovered products (e.g., struvite) are still considered a waste in many countries and cannot be commercialised as a fertiliser.
So far, the fertilising effect of recycled products has been proved when compared against their commercial mineral analogues. Sigurnjak et al. [11] demonstrated in pot and field experiments that ammonium nitrate and ammonium sulphate recycled from manure led to a similar effect on crop yield and risk for nitrate leaching as compared to conventional synthetic N fertilisers. Van Gerrewey et al. [12] investigated the impact of urine-derived fertilisers on plant performance and the root-associated bacterial community of hydroponically grown lettuce (Lactuca sativa L.). K-struvite promoted root-associated bacterial communities that correlated most strongly with control NPK fertiliser. In recent studies, struvite has also been proposed as an effective slow-release fertiliser [13,14,15].
In the present study, the fertilising effect of the recovered products was assessed after mixing them in different blends and comparing them with the high-value Controlled Release Fertilizer (CRF) Osmocote®. Osmocote® is a commercial fertiliser coated with a tiny layer of polymer that allows the nutrients to be released in a very timely and targeted way to various crops (trees, flowers, some cash crops) [16]. However, early in 2018, the European Commission adopted a European Strategy for Plastics in a Circular Economy in which plastics have been identified as key priority. Reduction in microplastics is part of this scheme. Within its framework, the European Commission has therefore put forward a proposal to restrict (according to Annex XIIII of REACH) by 2021 some microplastics that are intentionally added to products, including polymers used fertilizers. Hence, knowledge regarding alternative fertilizer could potentially be used to develop sustainable plastic free strategies in soilless culture systems. Osmocote is generally used in closed environments such as potted plants or greenhouses, as the nutrients such as N, P, and K are released to the plants in a more targeted way and there are fewer losses to air or water.
Furthermore, the fertilising effect of recovered products has been studied mainly on crops (lettuce, maise), with a lack of research done on ornamental plants. Ornamental plants include live trees, shrubs, bushes, and other goods commonly supplied by nursery gardeners or florists for planting or ornamental use. Increasing levels of flower production and cultivation of ornamental plants give the EU one of the world’s highest densities of flower production per hectare—10% of total world area and 44% of world flower and pot-plant production. The EU is a net exporter of pot plants, conifers, and hardy perennial plants, bulbs and corms, a net importer of cut flowers and cut foliage, and has a net trade surplus for live plants and floriculture products. Some 62,000 firms in the EU cultivate ornamental plants on approximately 56,000 ha of land, partly under glass and other protective covers, and in 2019 trades totalled at least 22,099 million euros. This segment of horticulture is increasing in size and value [17].
Ornamental plants are susceptible to the nutrients applied. An excessive fertiliser application could result in excessive seedling size, nutrient toxicity, and environmental contamination [18]. Furthermore, the application rate can influence the shoot dry weight, branch number and length, total leaf area, and flower number [19]. Therefore, it is crucial to investigate the effect of applying recycled nutrients to grow viola and its performance before their recommendation as potential fertilisers for such ornamental plants.
This experiment aimed to assess the optimal blend composition using recycled nutrient sources to grow viola under controlled greenhouse conditions. We hypothesised that recycled fertiliser blends would be suitable for the growth of viola (Viola x wittrockiana L.), which will be affected by the final chemical composition of the growing medium.

2. Materials and Methods

2.1. Recovered Nutrients and Blends Preparation

The codification and origin of the recovered nutrients and positive controls used to produce the different blends are listed in Table 1. A complete characterisation of the different recovered products (ammonium struvite, potassium struvite, ammonium nitrate, and ammonium sulphate) and growing medium samples was carried out in terms of macro-/micronutrients (N, P, K, Ca, Mg, SO4, Fe, Mn, Na, Cl). The main chemical characteristics of the different recovered nutrients are shown in Table A1. The analyses were performed in triplicate to ensure reliable and reproducible results. The NH4+-N content was determined according to Directive 77/535/EG method 2.1, the P2O5 in mineral acid was determined according to directive 77/535/EG method 3.1.1 employing Inductive Coupled Plasma spectrometry (ICP-OES). The total MgO and K content was analysed according to 89/519/EG method 8.1, and further determination was conducted with an ICP-OES.
Table 1 shows the different origins of the products, specifying whether they were recovered from a pilot plant, from a lab-scale experiment, or were commercially available.
The organic growing medium used (GB, Grow Bag, Agaris, Belgium) consisted of a mixture of white peat [80% v/v] and coconut fibre [20% v/v], which was ground to have a suitable physical granulometry (4–10 mm) for growing viola. According to the Belgian legislation (KB 13 March 2013), the pH for growing media should range between 4.5–7.0 ±0.3 and exhibit an electrical conductivity below 750 µS/cm.
Fourteen fertiliser blends were prepared (Table 2) using the recovered nutrients described in Table 1.
B1 and B2 were the fast release blends containing ammonium nitrate/-sulphate, triple-superphosphate (TSP) and potassium sulphate. B14 was made from a commercial controlled-release fertiliser (CRF), named “Osmocote® 15+9+11+2 MgO and trace elements and release period of 8–9 months”, and was used as a positive control. An additional negative control with no fertiliser was used in the test (BNF). Triple-superphosphate (TSP) and potassium sulphate (K2SO4), characterised by a high solubility and easy plant-uptake, were used in all the fertiliser blends to reach the optimal levels of P and K if the recovered products did not provide these elements sufficiently. The differences between the ratio of ammonium-N/nitrate-N given by each blend were not compensated, nor the concentration of the other nutrients (Ca, Mg, S). The controlled-release fertiliser Osmocote® was used as a benchmark at a concentration of 6 kg/m3. The blends were prepared according to an N-P-K ratio of 1:0.26:0.61 and a concentration of 900 g N/m3, 235 g P/m3, and 548 g K/m3. The overview of the different blends of recovered nutrients and standard fertilisers used for the growth of viola is shown in Table 2. Units are in kg/m3. Based on these calculations, a theoretical nutrient composition for each blend was obtained (Table A2) to have a similar N-P-K ratio as the Osmocote®-CRF treatment (blend 14).
After the preparation of the blends, plant-available nutrients, electrical conductivity (EC) (EN 13038), and pH in H2O (EN 13037) in the growing medium were measured in a 1:5 soil to water (v/v) suspension. Water-extractable PO4-P, Cl, SO4, and NO3-N were measured with a Dionex DX-3000 IC ion chromatography (Dionex, Sunnyvale, CA). NH4-N was measured with a Skalar SAN++ flow analyser (Skalar Analytical B.V, Breda, The Netherlands). Water-extractable C, Fe, Si, K, Ca, Mg, and Na concentrations were measured with ICP-OES.

2.2. Experimental Setup

The pot experiment was conducted in a research greenhouse (located in Jülich, Germany, 50.89942° N 6.39211° E) covered with low-iron float glass with a predominant diffuse light transmission. Additional assimilation lighting (SON–T AGRO 400, Philips, Koninklijke Philips N.V., Amsterdam, The Netherlands) was used whenever natural light intensity was below 400 μ mol s−1 m−2, providing a total daily light period of 16 h. Average temperature during the course of the experiment was 20 °C during the day and 17 °C at night, with 60% relative humidity during the day, and 50% at night as the standard controlled operation temperatures for day and night of the greenhouses at IBG-2: Plant Sciences, Forschungszentrum Jülich GmbH, Germany.
For the peat-based growing medium preparation, 33.75 kg of the organic growing medium was mixed with 0.375 kg/m3 of lime to raise the pH to the desired value of pH 6. The fertiliser blending process in the organic growing medium was as follows: (i) preparation of the different recovered nutrients; (ii) weighing the corresponding amount of the recovered fertilisers needed for each blend (Table 2); (iii) grinding together all the recovered fertilisers needed for each blend; (iv) labelling of the blends; (v) manual mixing of the fertilisers into the organic growing medium to prepare the blends; and (vi) granular ammonium sulphate addition in the necessary amounts and liquid ammonium nitrate addition in the necessary amounts. Five replicates for each of the 15 treatments (14 blends and the NFB) were prepared. The volume of the pots was 1 L with a final weight of 250 g. One viola seedling (Viola x wittrockiana L., Raesplant, Destelbergen, Belgium) was transplanted in the centre of each pot. Plants were harvested at the onset of flowering, approximately five weeks after planting. Viola was chosen as a horticultural test plant with an average nutrient demand, a moderate salt sensitivity (Na, Cl and EC), and the desired pH of 5.2–6.0, according to Bemestings Adviesbasis Potplanten (https://edepot.wur.nl/218456, accessed on 8 January 2022).

2.3. Plant Monitoring and Nutrient Content Analyses

The phenological stage of the viola plants, nutrient deficiency symptoms (colour and appearance of leaves), and flowering time were recorded manually every week. In addition, the water content, temperature, and electrical conductivity (EC) were measured twice per week after watering using a portable system (TEROS-12 from METER Group (formally Decagon)) to ensure that the pots were kept at approximately 50% water holding capacity.
At harvesting, plants were cut below the soil surface using secateurs. Plant fresh weight was measured by balance (Mettler Toledo XS205, Gießen, Germany) directly after harvesting. For further analysis, the biomass samples were dried at 60 °C until constant weight. Nutrient contents of dried plant samples were determined by digestion and further elemental analysis via inductively coupled plasma optical emission spectrometry (ICP-OES, VarioELcube, Elementar, Langenselbold, Germany). The plant’s P, K, and Mg content were analysed in plant tissues of viola for the blends that allowed a healthy plant growth until the end of the experiment and therefore provided enough plant material for the analyses. Plant N and C content were analysed in all the blends. Soil pH was determined using standard electrodes (Hanna Instruments pH 209 pH meter, Smithfield, VA, USA), using 1:5 distilled water extracts at 20 °C.

2.4. Statistical Analyses

Statistical analyses were performed using the statistical program R.2.16.3 (R: A Language and Environment for Statistical Computing (2012) http://www.R-project.org/ last accessed on 8 January 2022). Measurements were compared with a one-way analysis of variance (ANOVA). Data were calculated as arithmetic means ± standard error of the mean of the indicated replicates.
We applied mixture models [20]. Growing media blends from recycled fertilisers can be described as mixtures of components whose proportions sum to one. The proportion of component i of the mixture can be denoted by xi and the number of components by q. Then, the mixture constrained that proportions add up to one is given by: i = 1 q x i = 1 . Blends were composed thereby respecting as much as possible the following nutrient composition: 900 g N/m3, 235 g P/m3, and 548 g K/m3, hence depending on the type of nutrients present and the concentration of the recovered nutrients used, the proportion of the recovered fertiliser was calculated. Osmocote® was used as a reference, not taking into account the controlled release effect that would delay the nutrients release.
When the response is modelled as a function of proportions of components in a mixture, the mixture constraint significantly impacts the models that can be fitted. The first consequence is that a linear regression model for mixture data cannot contain an intercept. Furthermore, cross products xixj and squares x2i cannot be simultaneously included as regressors in the model since this leads to perfect collinearity.

3. Results

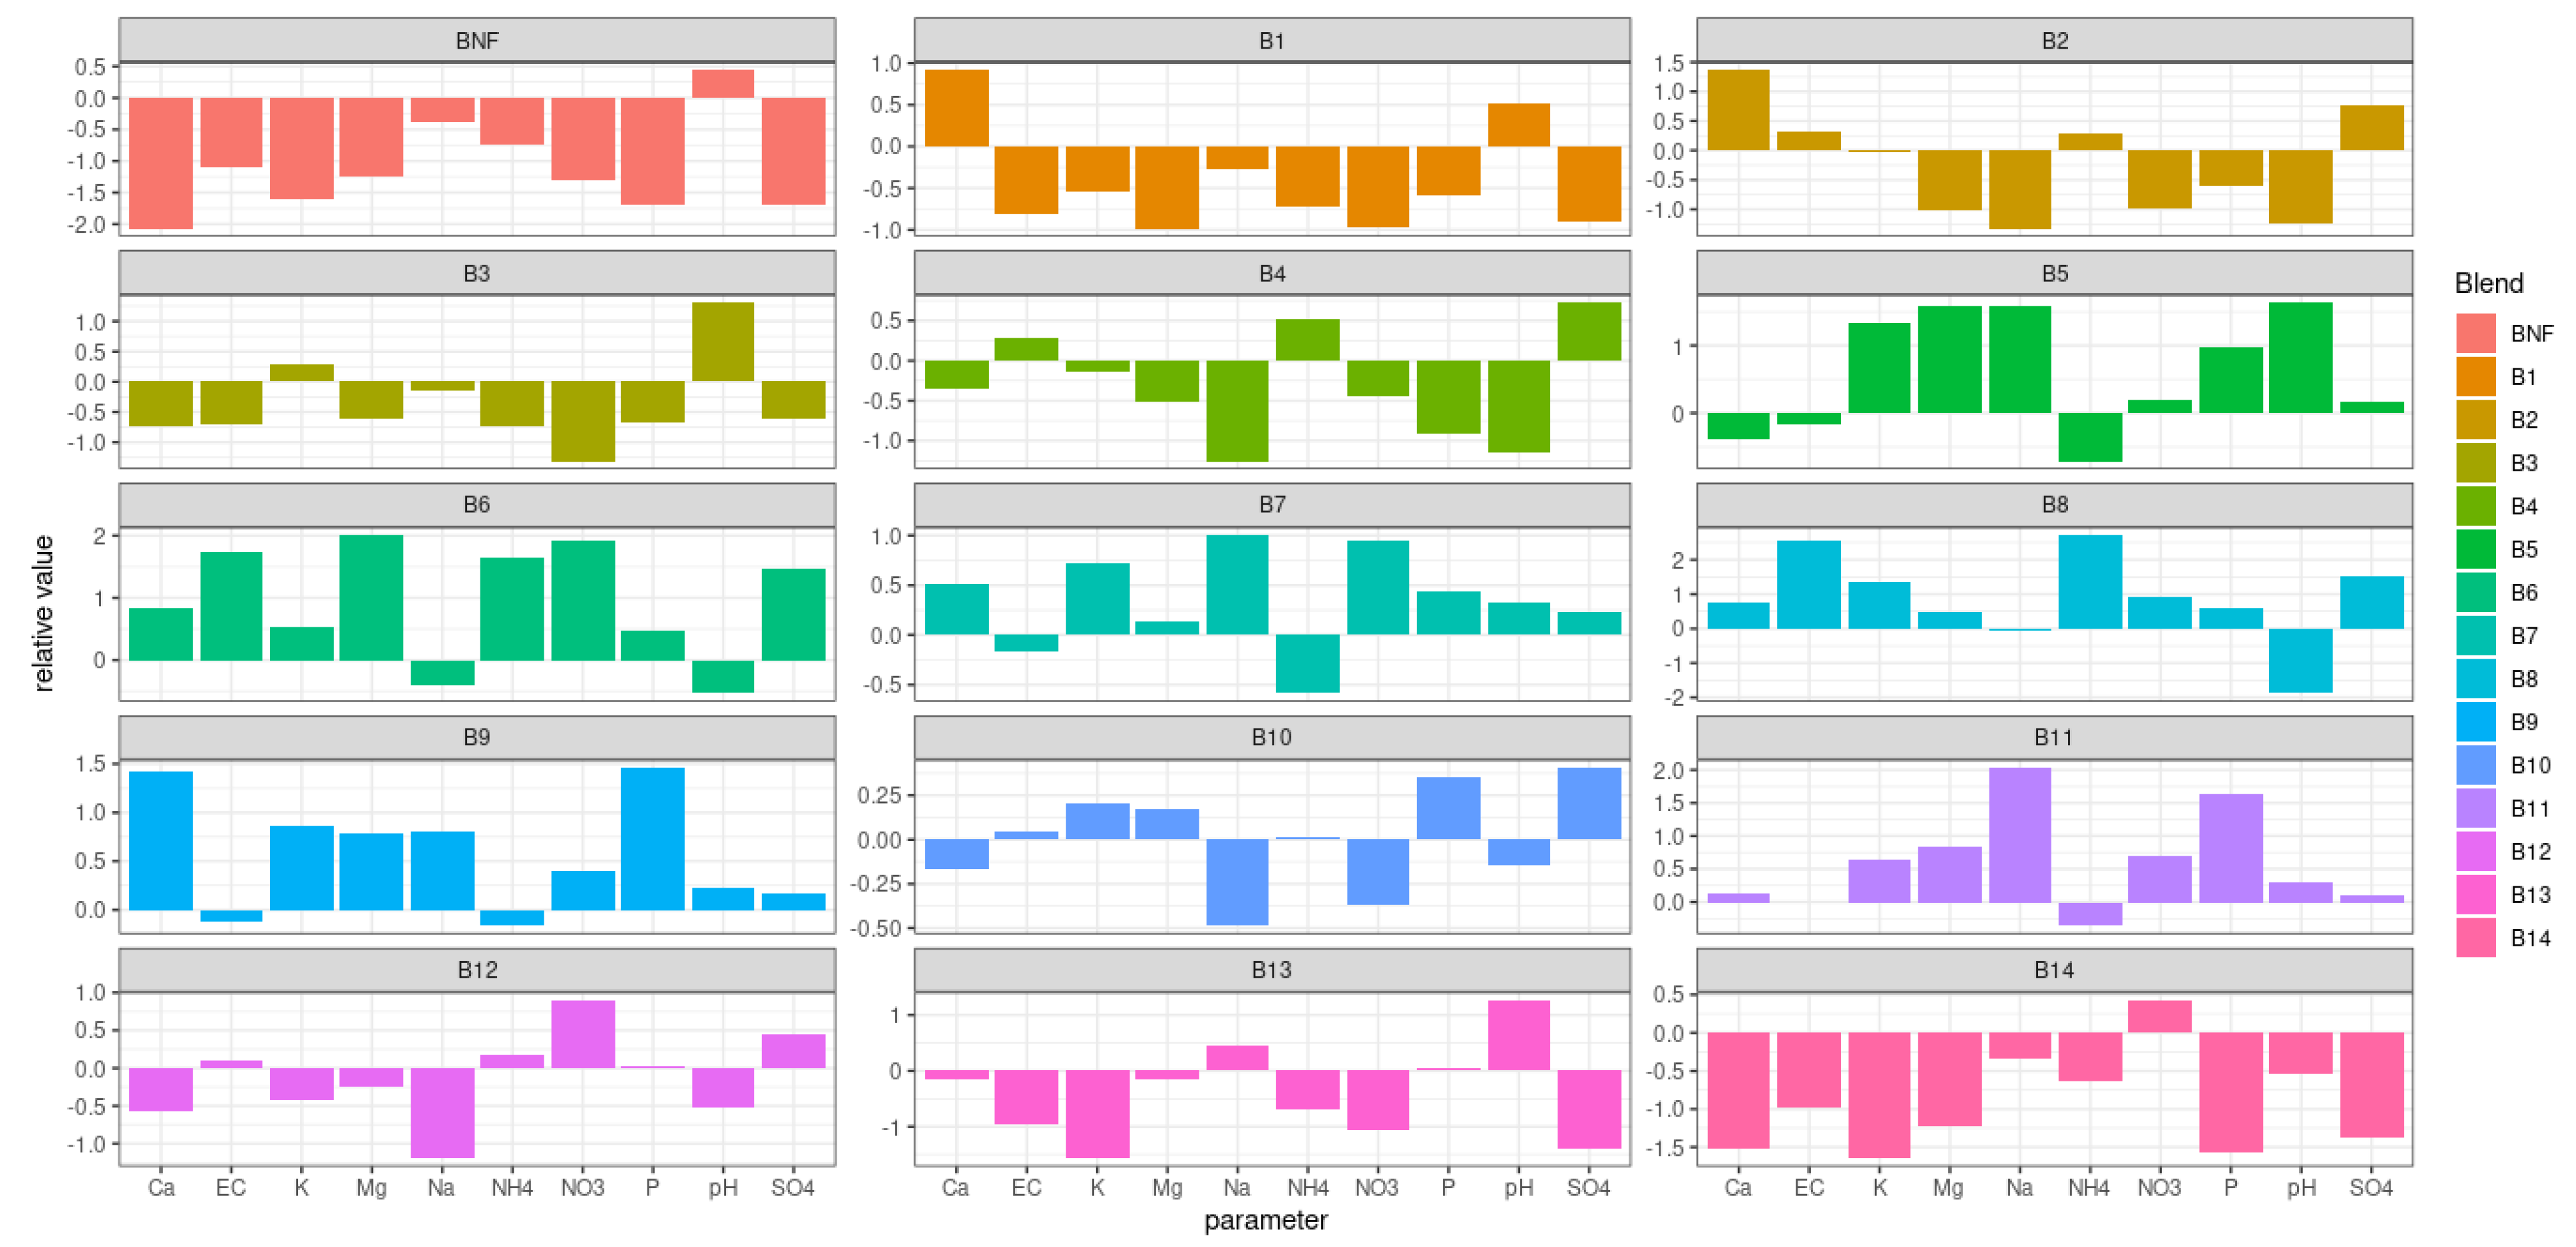
3.1. Plant Available Nutrients in the Growing Medium after the Application of the Recycled Fertiliser Blends

The fertilisers used in this experiment (Table 1) were mixed into 14 different blends (Table 2). In summary: blend B14 (“Osmocote® 15+9+11+2 MgO and trace elements”) was used as a positive control. Blends 1 and 2 were considered the fast nutrient release blends, as they contained TSP as a P source and not struvite. Odd-numbered blends (B3 to B11) had ammonium nitrate as the primary source of N, and blends with even numbers (B4 to B12) contained ammonium sulphate. Blend 13 contained ammonium sulphate as the primary source of N, but the P was supplied as both struvite and K-struvite. Therefore, less potassium sulphate and less ammonium sulphate were needed (see Table 2 for the amounts of nutrients added to each blend).
The plant-available nutrients, electrical conductivity, and pH measured in the growing medium after mixing the respective blends are presented in Table 3. After applying even blends (B2, B4, B6, B8, B10, and B12) containing ammonium sulphate, the NH4:NO3 ratio in the growing medium was higher than 10, with NH4 concentration > 400 mg L−1 growing medium. Furthermore, these blends led to a pH < 5 in the growing medium, representing a low value according to the preferred pH for Violaceae (between 5.5 and 6.5), and an EC > 1800 μS/cm, which is regarded as extremely high. On the other hand, when blends containing ammonium nitrate (B1, B3, B5, B7, B9, B11) were applied, the growing medium had lower ammonium concentrations and an NH4:NO3 ratio of < 2.5. Also, these blends led to higher pH values (pH > 5) in the growing medium. In most cases, except for blend 7, EC values for the ammonium nitrate blends were lower than those containing ammonium sulphate. Blends 7, 8, and 13 had the requested amount of 235 g P/m3; however, all other blends contained significantly more P.
Data of the nutrient concentration in each blend underwent a ‘z-transformation’ to better visualise the nutrient concentration range in each blend. Values near 0 are average, +2 is exceptionally high, –2 is extremely low compared to the others (Figure 1).

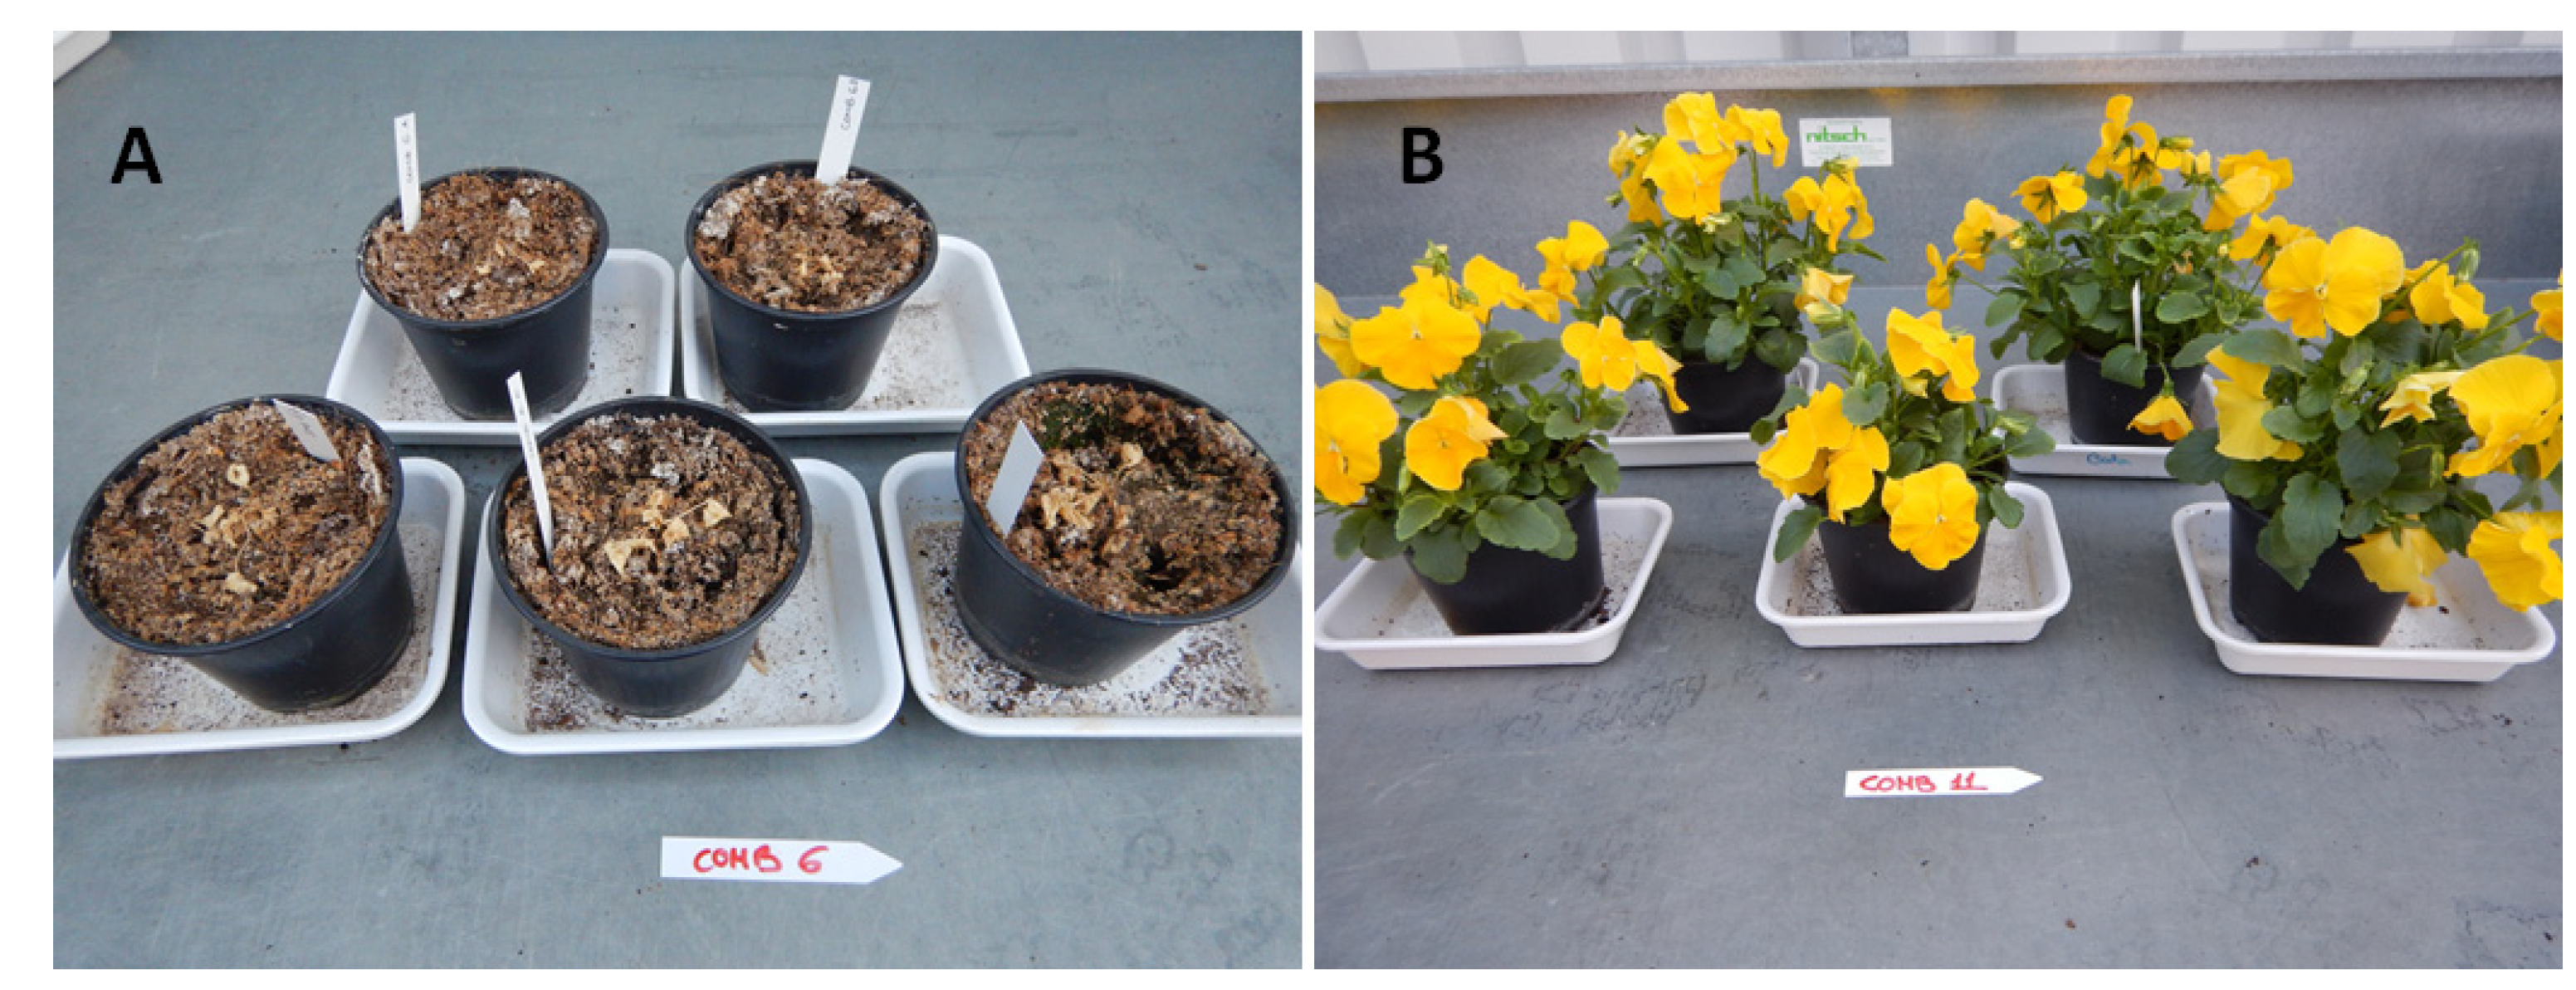
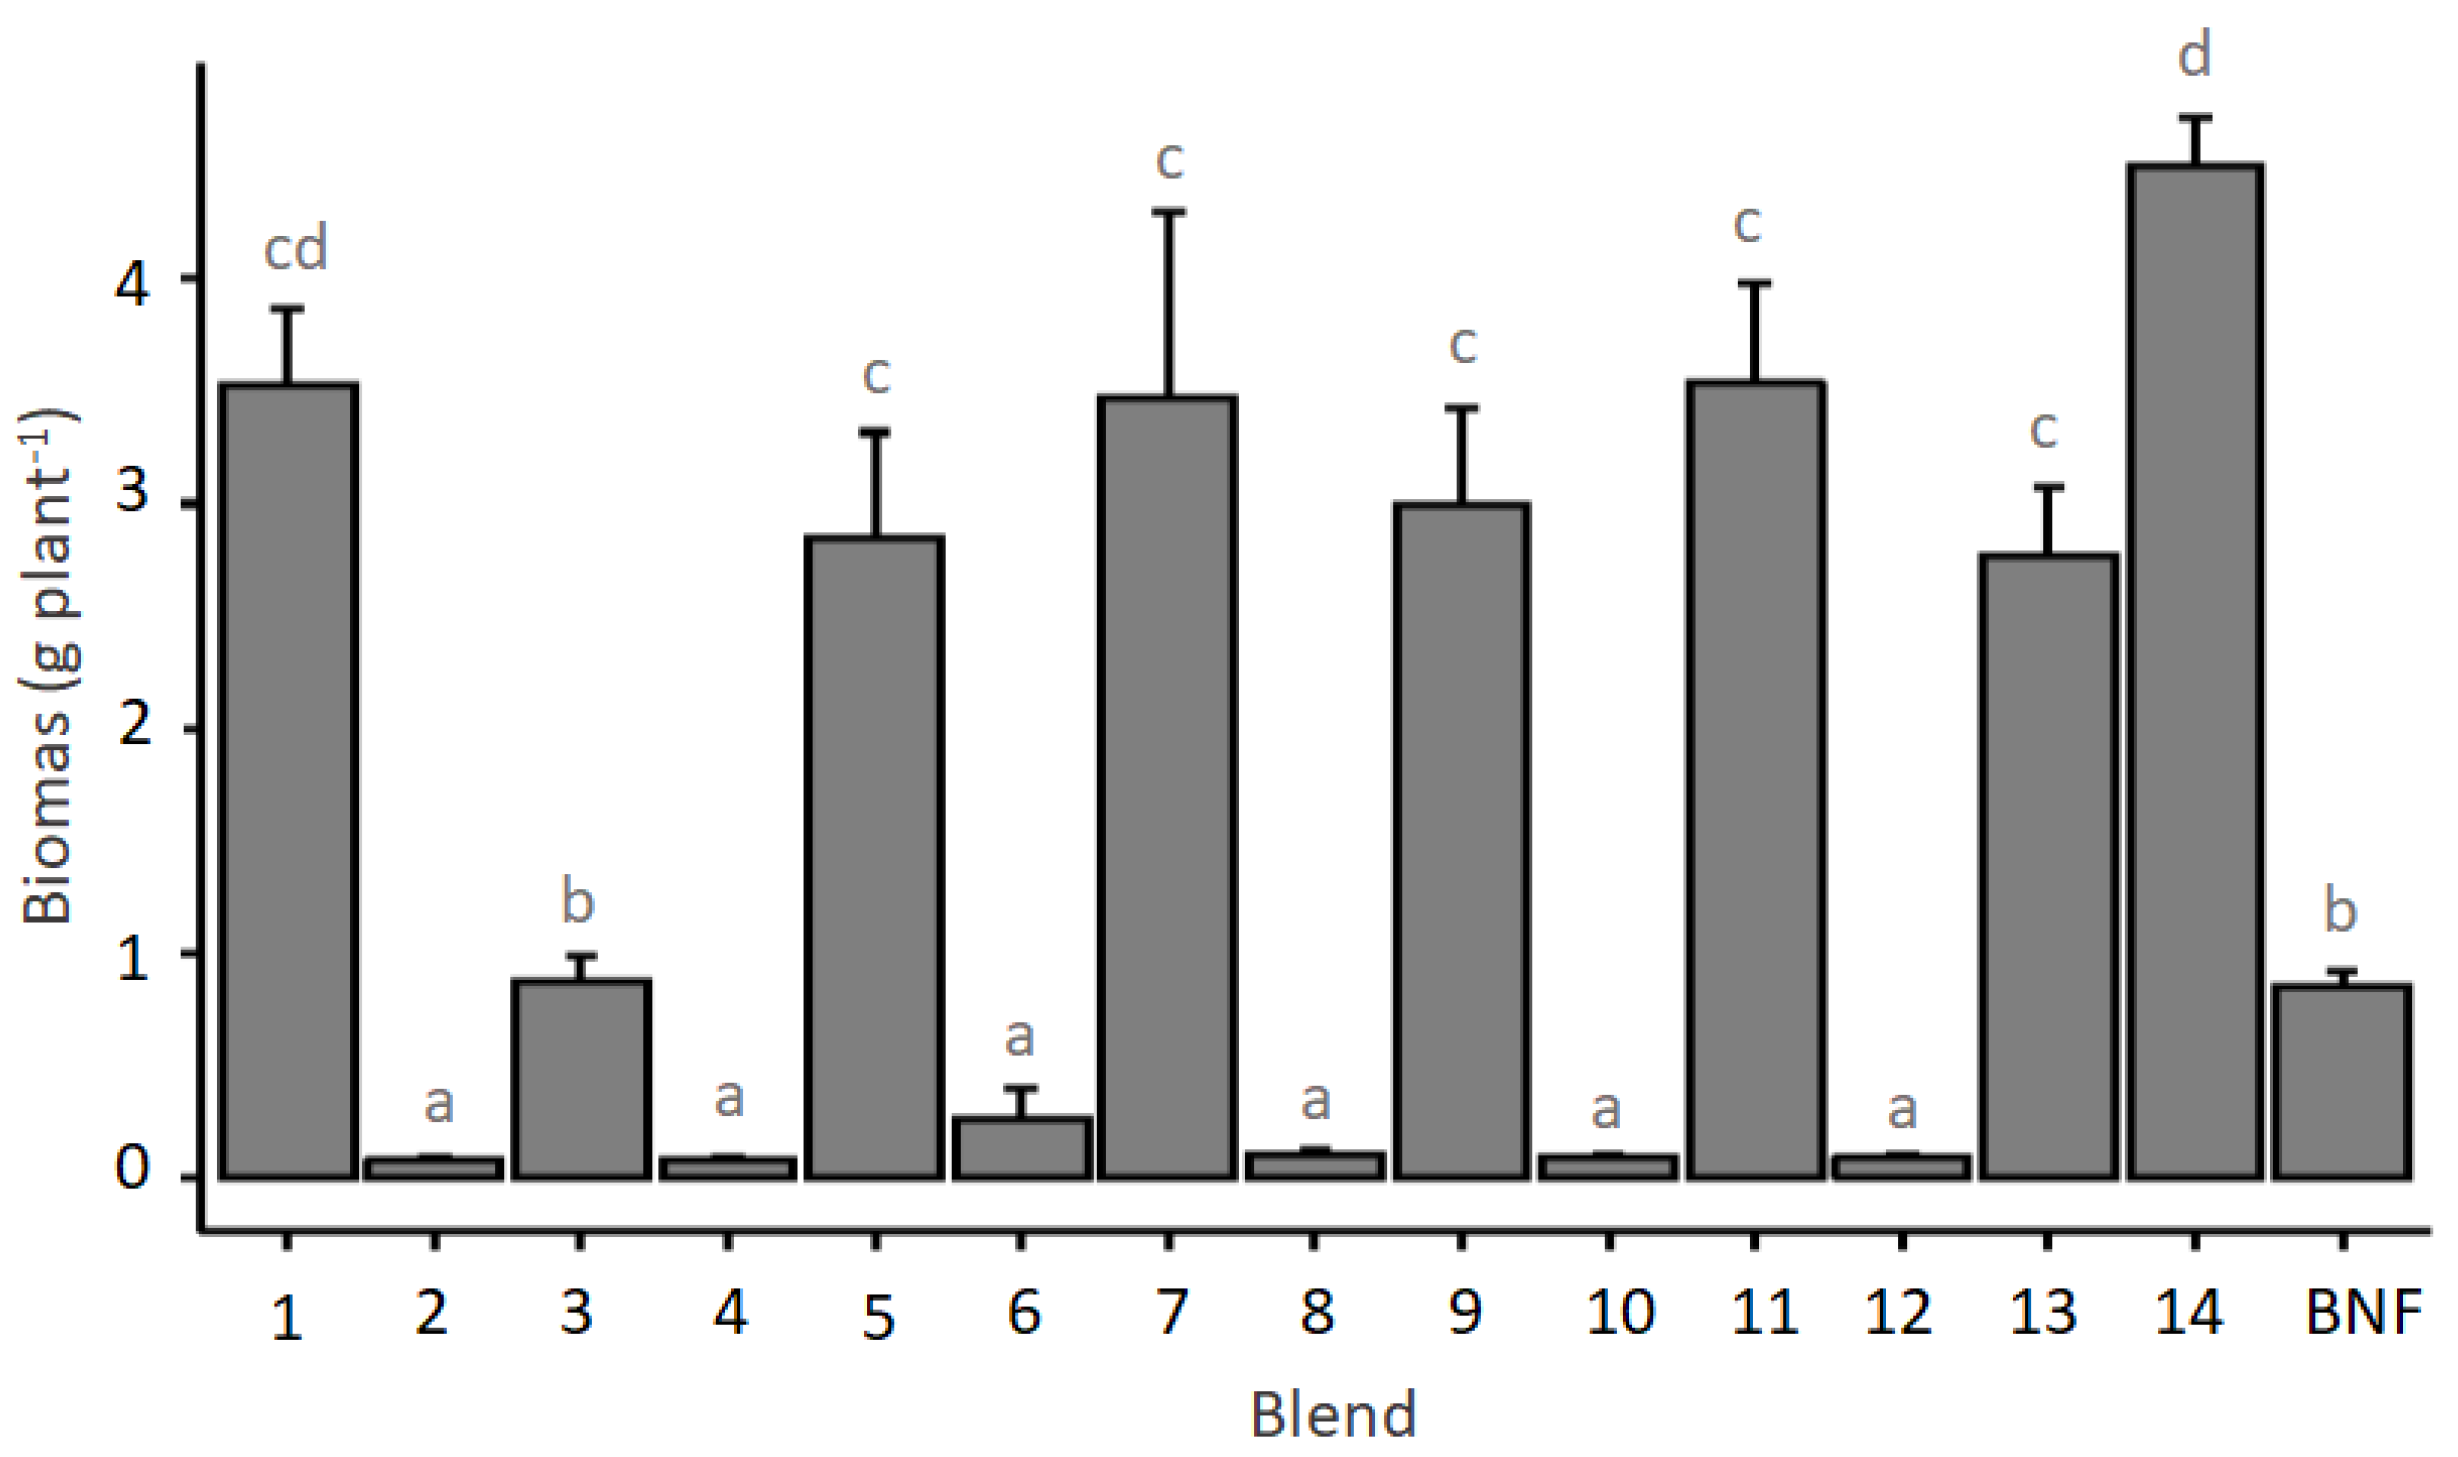
3.2. Plant Performance

The biomass of viola plants treated with different fertiliser blends was compared at the end of the experiment, i.e., the flowering stage of the positive control plants treated with Osmocote® (Blend 14). Most plants fertilised with blends B2, B4, B6, B8, B10, B12, which had in common the addition of ammonium sulphate as an N-source, were negatively affected, reduced their growth, and were not able to flower (Figure 2A). There were no significant differences (p < 0.05) in the biomass of plants treated with those blends. In contrast, plants growing with ammonium nitrate as the main N-source, i.e., B1, B3, B5, B7, B9, and B11, grew healthily (Figure 2B).
B1, which contained TSP as P source and ammonium nitrate as N source, showed no significant differences in plant dry weight compared with the positive control B14, i.e., Osmocote®. B2, also using TSP as P source but ammonium sulphate as N source, significantly inhibited the growth of the plants. Within the blends using ammonium nitrate, B3, which used the potassium struvite from lab scale, resulted in lower biomass than the B5, also using potassium struvite but from pilot-scale containing higher concentrations of potassium (Table A1). Blends B7, B9, and B11 using struvites (laboratory grade or pilot-scale) showed no significant differences in biomass among them (Figure 3), although they had different origins (Table 1). B13 using a combination of both struvite and potassium struvite showed no significant differences with the blends using only struvite. B14 (Osmocote®) resulted in the highest biomass.
The Non-Metric Multidimensional Scaling (NMDS) graph (Figure 4) was used to represent the original position of data (plant dry weight and chemical growing medium analysis) in multidimensional space as accurately as possible using a reduced number of dimensions. In this ordination, the closer the two points, the more similar the corresponding samples are concerning the variables that created the NMDS plot. The graph clearly shows that the BNF blend and the B14 cluster closely, although they show contrasting dry weight values. In addition, B13 and B1 cluster closely together and have similar dry weight values. Next to that, B2, B4, B10, and B12 group are close to each other with a low dry matter content and in contrast, blends B5, B7, B9, and B11 also cluster together, having similar high dry weights. Finally, blends B6 and B8 do not cluster with any of the other blends indicating distinct different chemical compositions from the other blends.

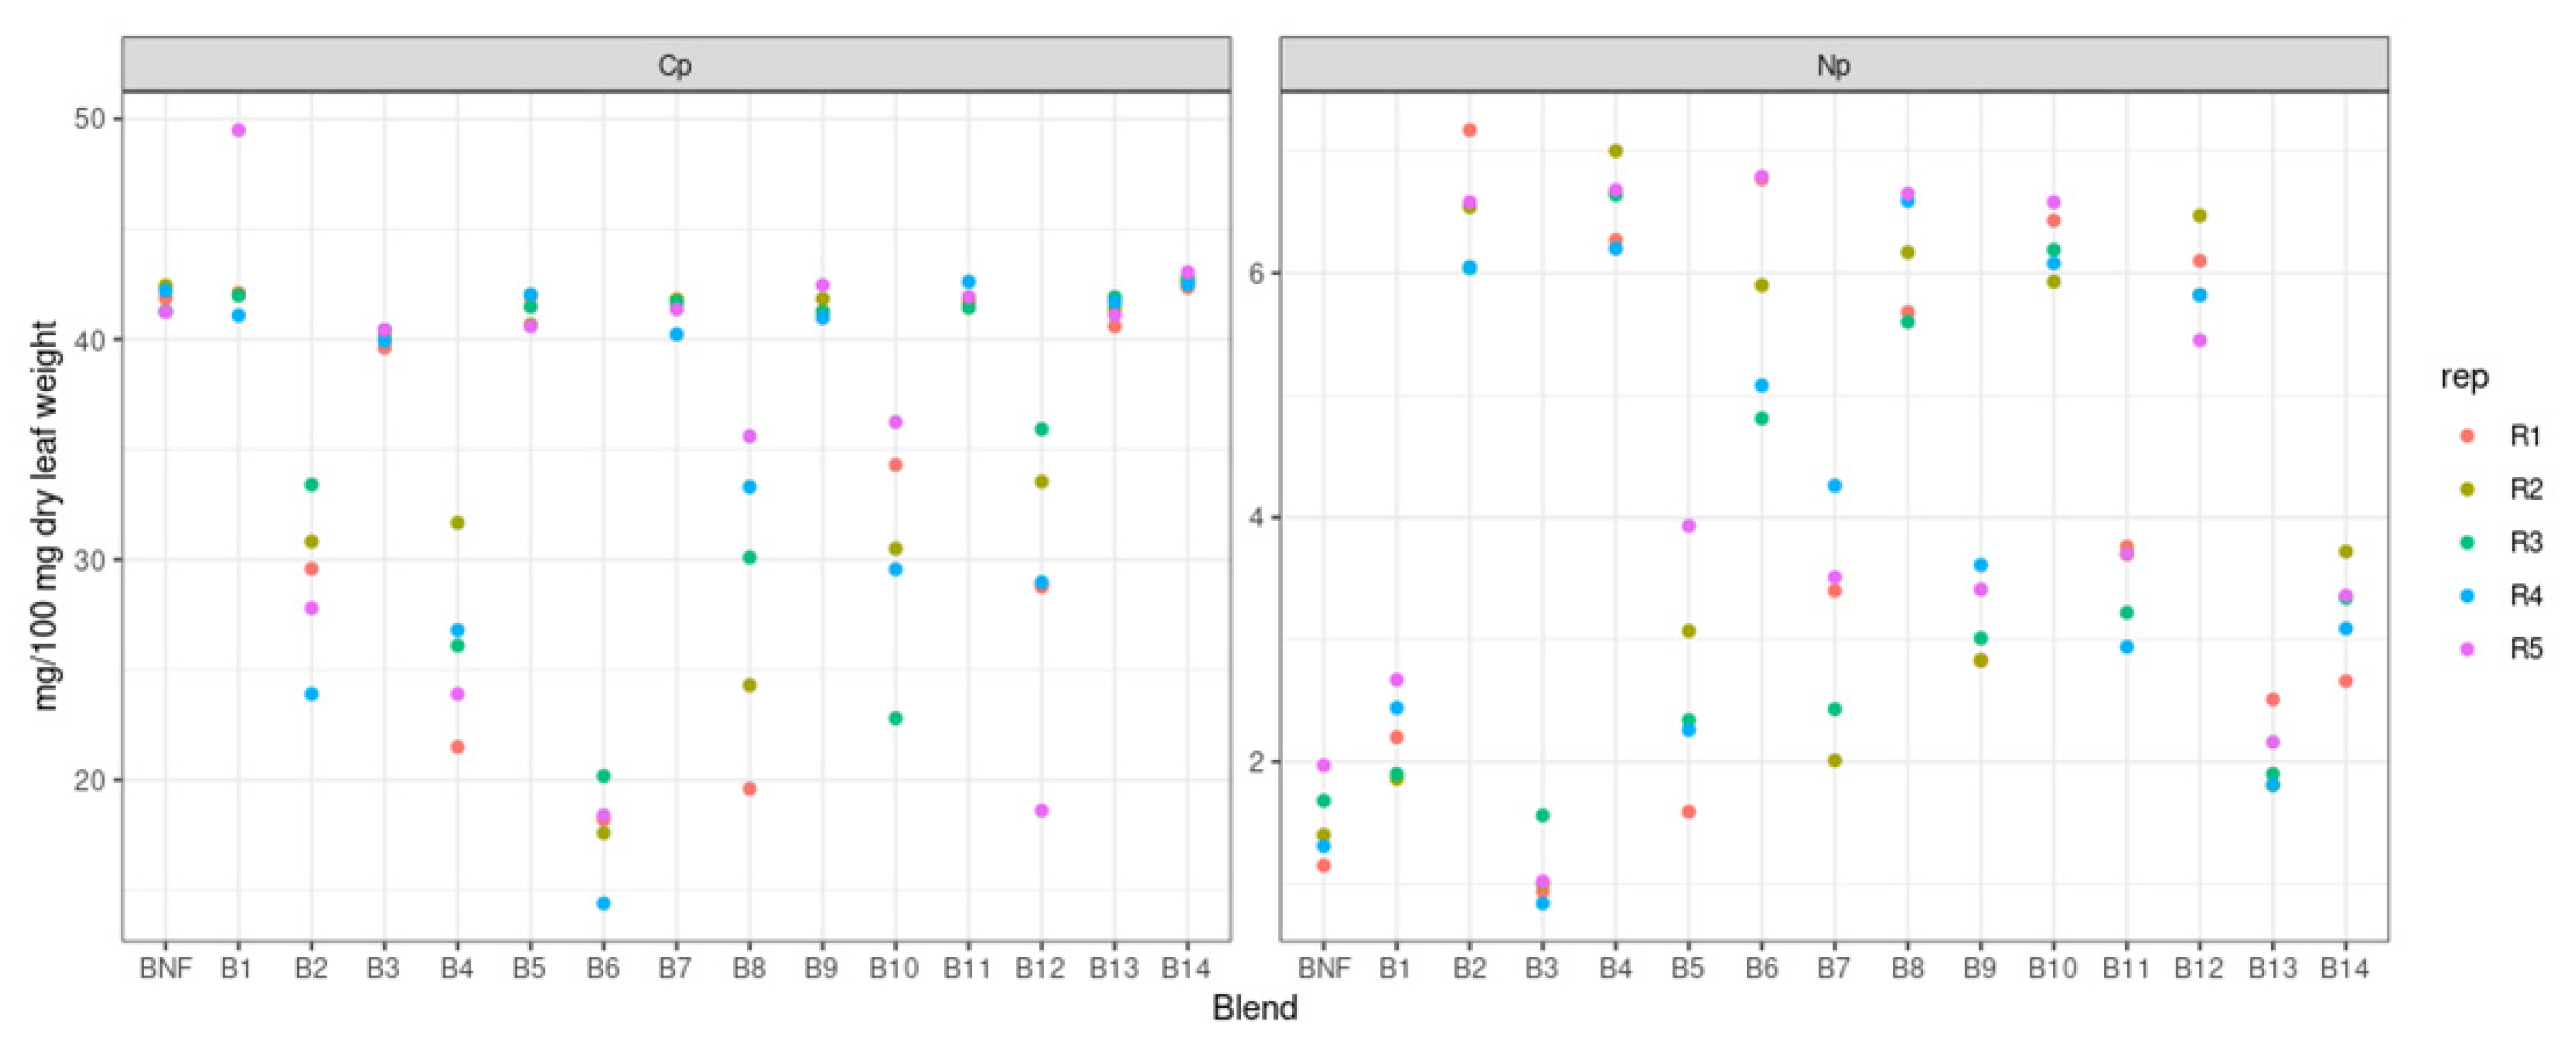
3.3. Nutrient Analyses in the Plant Tissue

The P, K, and Mg contents in the plant biomass (mg plant−1) were analysed in plant tissues of viola for the blends that allowed a healthy plant growth until the end of the experiment, and therefore provided enough plant material for the analyses. In addition, C and N content in the plants were measured for all the applied blends (Figure A1).
Comparing nutrient concentration rather than content (or recovery) might allow, in some cases, a more precise diagnosis of plant nutritional state. Therefore, nutrient concentration in the plants (mg 100 mg−1 dry matter) was also analysed. Plant N and C concentration in each blend’s replicate are shown in Figure 5.
We observed that the N concentration in plants treated with blends containing the recovered ammonium nitrate (B3, B5, B7, B9, B11, B13) showed healthy growth and resulted in sufficient or regular N concentration, accounting for around 3% in plant dry weight, which represents acceptable values as reported by Fonteno et al. [21]. On the contrary, N levels were deficient in the no fertiliser blend (BNF), with N concentrations lower than 2%. On the other hand, for the unhealthy plants (B2, B4, B6, B8, B10, and B12), it was observed that even though the total N uptake was minimal (Figure A1), the N concentration was extremely high (>6% on average).
The C concentration was in the expected range in the healthy plants (>40%), with slight variations between replicates. However, the C range was lower than expected for the unhealthy plants—with a higher deviation between plants, making the C:N ratio values much lower than for the other blends (Figure 5).
Nutrient concentration in the plants (mg 100 mg−1 dry matter) was also analysed after a ‘z-transformation’ of the data, where basically a value xi is transformed to zi via: zi = (xi − mean(x))/sd(x) and where x are all observations. This transformation was done to facilitate the overview of the nutrient concentration in all the blends, as 0 would be an average mean value, +2 would be extremely high, and –2 would be extremely low compared to the others (Figure 6).
It was shown that B2, B4, B6, B8, B10, and B12, led to plants with low concentrations of all nutrients compared to the plant tissues obtained with the other blends (in the −1 range), except for N that is always in the +1 range. The opposite is observed for the odd-numbered blends leading to the healthy plants (B1 to B13). B14, Osmocote® positive control, and B5, B7, B9, and B11 showed an average N concentration, indicated by “0” in Figure 6.

4. Discussion

Plant leaves are mainly composed of organs containing several organic compounds with different C content [22]. In leaves of healthy plants, a high proportion of these C-rich compounds are found compared to unhealthy or undeveloped plants [23]. This is in accordance with the shoot nutrient analyses of the plants fertilised with blends containing ammonium nitrate as the primary N source (B1, B3, B5, B7, B9, B11), which had a normal C concentration (>40%) and grew healthily (Figure 2), compared to the plants fertilised with the ammonium sulphate as N source (B2, B4, B6, B8, B10, B12) whose growth was highly inhibited (Figure 2) and the C concentration reduced (C < 30% on average) (Figure 4).
It was also observed that the N concentration in healthy plants, accounting for around 3% dry weight, was considered sufficient according to Fonteno et al., who defined acceptable N concentration values in plant tissue as between 2.5% to 4.5% [21]. In the negative control (no fertiliser blend—BNF), N levels were lower than 2%, and plants showed symptoms of N deficiency. This agrees with the reported values as insufficient N concentrations, i.e., lower than 2.5% [21]. However, in the unhealthy plants, we observed that even though the total N uptake was minimal (Figure A1), the N concentration in the plant tissue was extremely high (>6% on average) (Figure 5). This concentration is considered higher than acceptable [21,24] as the excess N supply can promote the formation of reactive oxygen species in plants, which would explain the inhibition of plant growth under the respective blends [25].
Therefore, it seemed that the ammonium sulphate had an inhibitory effect on the growth of viola. This could be explained first by the higher ammonium levels (NH4:NO3 ratio was higher than 10) measured in the growing medium where blends containing ammonium sulphate were applied (Table 3), as it is known that viola plants are susceptible to ammoniacal-nitrogen (NH4-N) toxicity [26]. The high ammonium concentrations might be associated with a decrease in the growing medium pH in these treatments (pH < 5), which could have inhibited the nitrification and consequently avoided the ammonium being transformed into nitrate, as the NH4+-fed plants normally acidify the external medium [27]. Previous studies showed that the absorption of NO3- by pansy was negligible if any NH4+ was present [28,29]. Hence, excessive ammonium uptake could have occurred in the blends containing ammonium sulphate.
The blends containing ammonium nitrate (B1, B3, B5, B7, B9, B11) led, on the other hand, to lower ammonium concentrations in the growing medium and a lower NH4:NO3 ratio (<2.5). This is because the mineralisation of ammonium to nitrate plus the ammonium uptake directly by the plant in these treatments might have reduced the NH4+ in the growing medium. Consequently, these blends showed higher pH values (pH > 5), from which only B3, B5, and B13 were according to the preferred pH for Violaceae (between pH 5.5 and 6.5) [30].
Moreover, the inhibitory effect of the ammonium sulphate could also be explained by the very high electrical conductivities (which increased up to 2000 μS/cm) measured in the growing medium where blends containing the combination of both sulphate forms (ammonium sulphate and potassium sulphate, i.e., blends 2, 4, 6, 8, 10, 12) were applied. When the electrical conductivity is too high, plants suffer osmotic stress and, consequently, decreased water uptake, and even chemical burning of the roots may appear [31]. Specific osmotic effects can be distinguished into effects through nutrition and effects through toxicity. It is not always possible to clearly determine what the particular cause of adverse osmotic effects is; however, as in the case with the ammonium sulphate, the best-known phenomenon is the wilting of plants with sudden decreased osmotic potential, related to a lost or a reduced osmotic gradient for water absorption. Furthermore, an increase of the electrical conductivity (EC) in the growing medium indicates that fertiliser is released faster than the plants can take it up, while a low or decreasing EC suggests that there are not enough nutrients available for optimal plant growth [32].
Therefore, the limited growth in the specified blends might have combined the two factors: (i) a high ammonium concentration in the growing medium, and (ii) a high EC.
For instance, plants could grow well in those treatments where EC was high, but the ammonium concentration was kept in a good range (B5, B7, B9, B11). In addition, in B13, even though the ammonium sulphate was part of the blend, it was combined with a reduced amount of potassium sulphate (Table 3) because the potassium struvite provided the primary source of K in this case. Consequently, the EC of the B13 growing medium was not that high, similar to the EC from the positive control, and the pH was kept lower (pH < 5). Under these conditions, the ammonium could be mineralised to nitrate, as confirmed by less ammonium measured in the growing medium.
This made B13 the most promising combination, as confirmed by the NMDS analyses where the B13 clustered near the B14-Osmocote®. The reason why BNF is also clustered together can be explained by the similarity in chemical properties of both combinations at the beginning of the experiment, as the B14 (Osmocote®) would have released the nutrients slowly after the experiment started. However, the nutrient content and biomass analyses showed that the positive control B14 and B13 increased plant biomass compared to the BNF at the end of the experiment.
As investigated in this study, we could observe that fertiliser blends using recovered nutrients such as P from struvite and N as ammonium nitrate can successfully substitute the use of mineral fertiliser blends to grow ornamental plant species such as viola, as has been previously shown in other horticulture plants [33]. Still, preparing green and sustainable fertiliser blends based on recovered nutrients from various waste streams requires exhaustive control and knowledge of every nutrient added [34]. This includes the careful and clean mining of the nutrients as well as the understanding of the fertilising effects on the desired target plants. The effect of struvite as a P source to be added into a fertiliser blend needs to be further evaluated to enable a successful blend with other recovered materials. Specific blends will significantly affect soil chemical properties and, therefore, plant growth, and those results might be species dependent and need careful and further research [14].
Fertiliser companies already use struvite as an additive or raw material substitute in standard fertiliser production technology [35]. Moreover, previous studies and EU reports highlighted the suitability of most struvites to enter the EU fertiliser market (STRUBIAS) [15]. Nevertheless, the additional use of ammonium and potassium to formulate a balanced NPK fertiliser together with struvite is necessary. For struvite to be part of a fertiliser blend suitable for green horticulture or sustainable agriculture, it needs to be combined with other nutrients, ideally also from a biobased origin. In this experiment, the extra ammonium was added in the form of ammonium nitrate or ammonium sulphate recycled from digested manure. The new fertiliser regulation could allow manure-derived nitrogen fertilisers, referring to them as REcovered Nitrogen from manURE (RENURE).

5. Conclusions

Mixing the different recovered nutrients affected the chemical composition of the final blend. In addition, the blends influenced the pH, electrical conductivity, and total nitrogen, phosphorous, and potassium content of the growing medium, and consequently, the plant growth and performance.
The use of ammonium sulphate was correlated to higher ammonium accumulation in the growing medium. This might be explained by a decrease in the growing medium pH that could have inhibited the nitrification. Furthermore, the blends that combined ammonium sulphate with high concentrations of potassium sulphate caused an increase in the growing medium’s electrical conductivity, creating high osmotic stress and resulting in plant growth inhibition or total damage. However, those blends that combined the ammonium sulphate with a reduced amount of potassium sulphate, e.g., blends that used the potassium struvite as K source, maintained the EC similar to the positive control and a lower pH. This was the case for blend 13, containing struvite as a P source, ammonium sulphate as N source, and K-struvite as a K source (and thus, less potassium sulphate was needed to reach the desired K levels). Consequently, blend 13 showed the best chemical composition and an overall positive fertilising effect on viola plant (Viola x wittrockiana L.) growth and performance.
We conclude that fertiliser blends using recovered nutrients can successfully substitute the use of slow-release commercial fertilisers to grow ornamental plant species such as viola.

Author Contributions

Conceptualisation, A.A.R.-A., O.G. and N.D.J.; data curation, A.A.R.-A. and O.G.; funding acquisition, N.D.J. and E.M.; writing—original draft, A.A.R.-A.; writing—review and editing, A.A.R.-A., O.G., N.D.J. and E.M. All authors have read and agreed to the published version of the manuscript.

Funding

The work was conducted within the ManureEcoMine project, funded by the European Community’s Framework Programme (FP7/2007–2013) under Grant Agreement number 603744, and subsequently from the Nutri2cycle project from the EU Horizon 2020 framework programme for R&I under grant agreement 773682. The results were presented and discussed at the II International Symposium on Growing Media, Soilless Cultivation, and Compost Utilization in Horticulture as a part of the Nutri2Cycle project. The related work presented in the Symposium was part of the conferences proceedings.

Institutional Review Board Statement

Not applicable.

Informed Consent Statement

Not applicable.

Conflicts of Interest

The authors declare no conflict of interest. The funders had no role in the design of the study; in the collection, analyses, or interpretation of data; in the writing of the manuscript, or in the decision to publish the results.

Appendix A

Figure A1. Plant nutrient content (mg plant−1).
Agronomy 12 00182 g0a1
Table A1. Chemical composition of the different recovered nutrients.
Recovered Nutrients & Fertilizers NH4-N
(%)
NO3-N
(%)
P
(%)
K
(%)
Mg
(%)
SO3
(%)
A*0.000.005.817.344.560.0
B0.000.0314.110.3010.630.0
C6.640.0013.180.0010.250.0
D4.970.005.632.457.760.0
E8.240.008.960.5012.600.0
F7.898.630.000.000.000.0
G19.470.000.000.000.0060.0
H0.000.0020.080.000.000.0
I0.000.000.0043.150.0045.90
* See description of the letter code in Table 1.
Table A2. Theoretical nutrient composition for each blend based in the amounts described in Table 3.
BlendNH4-N (mg/L)NO3-N (mg/L)Nmin
(mg N/L)
P
(mg/L)
K
(mg/L)
Mg (mg/L)SO4
(mg/L)
1434.0474.7908.6241.0561.00.0716.0
2895.60.0895.6241.0561.00.04028.0
3434.0475.2909.1239.9566.1180.7716.0
4895.60.5896.1239.9566.1180.74028.0
5434.0474.7908.6238.2732.4187.0550.8
6895.60.0895.6238.2559.8187.03642.5
7460.3405.6865.9101.3605.1139.7716.0
8985.10.0985.1101.3605.1139.74028.0
9610.3362.5972.7553.6561.0430.5716.0
10979.80.0979.8553.6561.0430.53308.0
11537.7353.8891.6233.0574.0327.6716.0
12915.20.0915.2233.0574.0327.63308.0
13872.80.0872.8125.1122.7148.32996.1
14504.0396.0900.0235.4547.872.4
BNFwithout fertiliser

References

  1. Sonneveld, C.; Voogt, W. Plant nutrition in future greenhouse production. In Plant Nutrition of Greenhouse Crops; Springer: Dordrecht, The Netherlands, 2009. [Google Scholar] [CrossRef]
  2. van Delden, S.H.; SharathKumar, M.; Butturini, M.; Graamans, L.J.A.; Heuvelink, E.; Kacira, M.; Kaiser, E.; Klamer, R.S.; Klerkx, L.; Kootstra, G.; et al. Current status and future challenges in implementing and upscaling vertical farming systems. Nat. Food 2021, 2, 944–956. [Google Scholar] [CrossRef]
  3. Carpenter, S.R. Eutrophication of aquatic ecosystems: Bistability and soil phosphorus. Proc. Natl. Acad. Sci. USA 2005, 102, 10002–10005. [Google Scholar] [CrossRef] [PubMed] [Green Version]
  4. Kalkhajeh, Y.K.; Huang, B.; Hu, W.Y.; Holm, P.E.; Hansen, H.C.B. Phosphorus saturation and mobilization in two typical Chinese greenhouse vegetable soils. Chemosphere 2017, 187, 440–441. [Google Scholar] [CrossRef] [PubMed]
  5. Vaneeckhaute, C.; Ghekiere, G.; Michels, E.; Vanrolleghem, P.A.; Tack, F.M.G.; Meers, E. Assessing Nutrient Use Efficiency and Environmental Pressure of Macronutrients in Biobased Mineral Fertilizers: A Review of Recent Advances and Best Practices at Field Scale. Adv. Agron. 2014, 128, 137–180. [Google Scholar] [CrossRef] [Green Version]
  6. Vaneeckhaute, C.; Meers, E.; Michels, E.; Buysse, J.; Tack, F.M.G. Ecological and economic benefits of the application of bio-based mineral fertilizers in modern agriculture. Biomass Bioenerg. 2013, 49, 239–248. [Google Scholar] [CrossRef] [Green Version]
  7. Haraldsen, T.K.; Andersen, U.; Krogstad, T.; Sorheim, R. Liquid digestate from anaerobic treatment of source-separated household waste as fertilizer to barley. Waste Manag. Res. 2011, 29, 1271–1276. [Google Scholar] [CrossRef]
  8. Galloway, J.N.; Townsend, A.R.; Erisman, J.W.; Bekunda, M.; Cai, Z.; Freney, J.R.; Martinelli, L.A.; Seitzinger, S.P.; Sutton, M.A. Transformation of the nitrogen cycle: Recent trends, questions, and potential solutions. Science 2008, 320, 889–892. [Google Scholar] [CrossRef] [Green Version]
  9. Regulation (eu) 2019/1009 of the European Parliament and of the Council of 5 June 2019 Laying down Rules on the Making Available on the Market of EU Fertilising Products and Amending Regulations (EC) No 1069/2009 and (EC) No 1107/2009 and Repealing Regulation (EC) No 2003/2003. 2019. Available online: https://eur-lex.europa.eu/legal-content/EN/TXT/?uri=CELEX:32019R1009 (accessed on 8 January 2022).
  10. Reuland, G.; Sigurnjak, I.; Dekker, H.; Michels, E.; Meers, E. The Potential of Digestate and the Liquid Fraction of Digestate as Chemical Fertiliser Substitutes under the RENURE Criteria. Agronomy 2021, 11, 1374. [Google Scholar] [CrossRef]
  11. Sigurnjak, I.; Brienza, C.; Snauwaert, E.; De Dobbelaere, A.; De Mey, J.; Vaneeckhaute, C.; Michels, E.; Schoumans, O.; Adani, F.; Meers, E. Production and performance of bio-based mineral fertilizers from agricultural waste using ammonia (stripping-)scrubbing technology. Waste Manag. 2019, 89, 265–274. [Google Scholar] [CrossRef]
  12. Van Gerrewey, T.; El-Nakhel, C.; De Pascale, S.; De Paepe, J.; Clauwaert, P.; Kerckhof, F.M.; Boon, N.; Geelen, D. Root-Associated Bacterial Community Shifts in Hydroponic Lettuce Cultured with Urine-Derived Fertilizer. Microorganisms 2021, 9, 1326. [Google Scholar] [CrossRef]
  13. Robles-Aguilar, A.A.; Grunert, O.; Hernandez-Sanabria, E.; Mysara, M.; Meers, E.; Boon, N.; Jablonowski, N.D. Effect of Applying Struvite and Organic N as Recovered Fertilizers on the Rhizosphere Dynamics and Cultivation of Lupine (Lupinus angustifolius). Front Plant Sci. 2020, 11, 572741. [Google Scholar] [CrossRef]
  14. Robles-Aguilar, A.A.; Pang, J.Y.; Postma, J.A.; Schrey, S.D.; Lambers, H.; Jablonowski, N.D. The effect of pH on morphological and physiological root traits of Lupinus angustifolius treated with struvite as a recycled phosphorus source. Plant Soil 2019, 434, 65–78. [Google Scholar] [CrossRef] [Green Version]
  15. Muys, M.; Phukan, R.; Brader, G.; Samad, A.; Moretti, M.; Haiden, B.; Pluchon, S.; Roest, K.; Vlaeminck, S.E.; Spiller, M. A systematic comparison of commercially produced struvite: Quantities, qualities and soil-maize phosphorus availability. Sci Total Env. 2021, 756, 143726. [Google Scholar] [CrossRef]
  16. Rakhimol, K.R.; Thomas, S.; Volova, T.; Jayachandran, K. (Eds.) Controlled Release Fertilizers for Sustainable Agriculture; Academic Press: Cambridge, MA, USA, 2021; pp. 183–194. [Google Scholar] [CrossRef]
  17. Schmilewski, G. Socio-Economic Impact of the Peat and Growing Media Industry on Horticulture in the EU; European Peat and Growing Media Association (EPAGMA): Saterland-Sedelsberg, Germany, 2019. [Google Scholar]
  18. Zhang, F.S.; Cui, Z.L.; Chen, X.P.; Ju, X.T.; Shen, J.B.; Chen, Q.; Liu, X.J.; Zhang, W.F.; Mi, G.H.; Fan, M.S.; et al. Integrated Nutrient Management for Food Security and Environmental Quality in China. Adv. Agron. 2012, 116, 1–40. [Google Scholar] [CrossRef]
  19. Gadagi, R.S.; Krishnaraj, P.U.; Kulkarni, J.H.; Sa, T.M. The effect of combined Azospirillum inoculation and nitrogen fertilizer on plant growth promotion and yield response of the blanket flower Gaillardia pulchella. Sci Hortic-Amst. 2004, 100, 323–332. [Google Scholar] [CrossRef]
  20. Ruseckaite, A.; Fok, D.; Goos, P. Flexible Mixture-Amount Models UsingMultivariate Gaussian Processes. J. Bus. Econ. Stat. 2018, 38, 257–271. [Google Scholar] [CrossRef]
  21. Fonteno, W.C.; Nelson, P.V.; Bailey, D.A. Testing Procedures for Bedding Plants; North Carolina Flower Growers’ Bul: Asheville, NC, USA, 1996; pp. 1–11. [Google Scholar]
  22. Poorter, H.; Bergkotte, M. Chemical-Composition of 24 Wild-Species Differing in Relative Growth-Rate. Plant Cell Env. 1992, 15, 221–229. [Google Scholar] [CrossRef]
  23. Ma, S.H.; He, F.; Tian, D.; Zou, D.T.; Yan, Z.B.; Yang, Y.L.; Zhou, T.C.; Huang, K.Y.; Shen, H.H.; Fang, J.Y. Variations and determinants of carbon content in plants: A global synthesis. Biogeosciences 2018, 15, 693–702. [Google Scholar] [CrossRef] [Green Version]
  24. Mills, H.A.; Jones, J.B., Jr. Plant Nutrition Hand-Book II.; Micro-Macro: Athens, GA, USA, 1996. [Google Scholar]
  25. Yanez-Mansilla, E.; Cartes, P.; Reyes-Diaz, M.; Ribera-Fonseca, A.; Rengel, Z.; Lobos, W.; Alberdi, M. Leaf nitrogen thresholds ensuring high antioxidant features of Vaccinium corymbosum cultivars. J. Soil Sci. Plant Nut 2015, 15, 574–586. [Google Scholar] [CrossRef]
  26. Whipker, B.E.; Gibson, J.L.; Pitchay, D.S.; Nelson, P.V.; Baker, J.R.; Faust, J.E.; Thomas, P.A.; Benson, M.; Cavins, T.J.; Williams-Woodward, J.L. Diagnosing Common Pansy Problems. In GPN 2000. Available online: https://gpnmag.com/article/diagnosing-common-pansy-problems/ (accessed on 8 January 2022).
  27. Britto, D.T.; Kronzucker, H.J. NH4+ toxicity in higher plants: A critical review. J. Plant Physiol. 2002, 159, 567–584. [Google Scholar] [CrossRef] [Green Version]
  28. Hamlin, R.L.; Mills, H.A. Pansy floral development and nutrient absorption as influenced by temperature, nitrogen form, and stage of plant development. J. Plant Nutr. 2001, 24, 1975–1985. [Google Scholar] [CrossRef]
  29. Hamlin, R.L.; Mills, H.A.; Randle, W.M. Growth and nutrition of pansy as influenced by N-form ratio and temperature. J. Plant Nutr. 1999, 22, 1637–1650. [Google Scholar] [CrossRef]
  30. Straver, N.; de Kreij, C.; Verberkt, H. Bemestingsadviesbasis Potplanten; 1999. Available online: https://edepot.wur.nl/218456 (accessed on 8 January 2022).
  31. Garcia-Caparros, P.; Lao, M.T. The effects of salt stress on ornamental plants and integrative cultivation practices. Sci. Hortic-Amst. 2018, 240, 430–439. [Google Scholar] [CrossRef]
  32. James, E.C.; van Iersel, M.W. Fertilizer concentration affects growth and flowering of subirrigated petunias and begonias. Hortscience 2001, 36, 40–44. [Google Scholar] [CrossRef] [Green Version]
  33. Carreras-Sempere, M.; Caceres, R.; Viñas, M.; Biel, C. Use of Recovered Struvite and Ammonium Nitrate in Fertigation in Tomato (Lycopersicum esculentum) Production for boosting Circular and Sustainable Horticulture. Agriculture 2021, 11, 1063. [Google Scholar] [CrossRef]
  34. Saputra, A.; Suprihati, S.; Pudjihartati, E. The Effect of Phosphorus and Potassium on the Growth and Quality of Viola (Viola cornuta L.) Seed Production. J. Sustain. Agric. 2019, 35, 12–22. [Google Scholar] [CrossRef]
  35. Li, X.Z.; Zhao, Q.L. MAP precipitation from landfill leachate and seawater bittern waste. Env. Technol. 2002, 23, 989–1000. [Google Scholar] [CrossRef] [PubMed] [Green Version]
Figure 1. Available nutrient contents in blends B1–B14 and BNF, pH, and EC in the growing medium after ‘z-transformation’ of the data. 0 is average, +2 is extremely high, −2 is extremely low compared to the others. B = Blend, BNF = no fertiliser control.
Agronomy 12 00182 g001
Figure 2. (A): Appearance of viola plants (Viola x wittrockiana L.) growing under blend 6 (treated with ammonium sulphate). (B): viola plants (Viola x wittrockiana L.) growing under blend 11 (with ammonium nitrate).
Agronomy 12 00182 g002
Figure 3. Average biomass (g dry weight) (n = 5) of viola plants for each fertiliser blend. Numbers refer to each specific blend that combines different recovered nutrients applied. Blend 14 is Osmocote®, a commercial slow-release fertiliser, BNF = blank/control, containing no additional fertiliser. “Different letters (a–d) indicate significant differences (p < 0.05) between fertilizer blends. Error bar represents the standard error of the mean (n = 5).
Agronomy 12 00182 g003
Figure 4. The NMDS graph was used to represent the original position of the dry weight and chemical growing medium composition in multidimensional space as accurately as possible using a reduced number of dimensions. In this ordination, the closer the two points, the more similar the corresponding samples are concerning the variables that made the NMDS plot. DW = dry weight.
Agronomy 12 00182 g004
Figure 5. Carbon (Cp) and Nitrogen (Np) concentration in the plant tissues (mg 100 mg−1 dry matter) for all the tested blends showing all the replicates (n = 5).
Agronomy 12 00182 g005
Figure 6. Relative nutrient concentration in the plant shoots tissue at the end of the experiment under the different blends (B = blend, BNF = no fertiliser).
Agronomy 12 00182 g006
Table 1. Codification of the different recovered nutrients and fertilisers used.
CodeDescriptionStateOriginProvided by
APotassium struviteSolidDigested manure from pilot plantStichting Mestverwerking Gelderlan
(www.smg.nl, last accessed on 8 January 2022)
BPotassium struviteSolidLab-scale waste water streamLequia (http://www.lequia.udg.edu, last accessed on 8 January 2022)
CAmmonium struviteSolidDigested manure from pilot plantLequia (http://www.lequia.udg.edu, last accessed on 8 January 2022)
DAmmonium struviteSolidWaste water treatment plantLequia (http://www.lequia.udg.edu, last accessed on 8 January 2022)
EAmmonium struviteSolidDigested manureLequia (http://www.lequia.udg.edu, last accessed on 8 January 2022)
FAmmonium nitrateLiquidLab-scale digested manureBOKU (https://boku.ac.at/ last accessed on 8 January 2022)
GAmmonium sulphateLiquidLab-scale digested manureBOKU (https://boku.ac.at/ last accessed on 8 January 2022)
HTriple-superphosphateSolidCommercial product-Agaris (https://www.agaris.com/ last accessed on 8 January 2022)
IPotassium sulphateSolidCommercial productAgaris (https://www.agaris.com/ last accessed on 8 January 2022)
Table 2. Overview of the different amounts of recovered nutrients and standard fertilisers used for each blend (kg/m3 for the solid materials and in mL/m3 for the liquid materials); BNF = blank/control, containing no additional fertiliser.
BlendA*BCDEFGHI
BNFwithout fertilizer
1-----5.5-1.21.3
2------4.61.21.3
3-1.7---5.5--1.3
4-1.7----4.6-1.3
54.1----5.5--1.0
64.1-----4.6-0.6
7---1.8-4.7--1.3
8---1.8--4.6-1.3
9--4.2--4.2--1.3
10--4.2---3.6-1.3
11----2.64.1--1.3
12----2.6-3.6-1.3
130.7--1.5- 4.1-0.08
14Osmocote 15 +9+11+2 MgO and trace elements—8–9 M (6 kg/m3)
* See description of the letter code in Table 1.
Table 3. pH, EC, and plant available nutrients measured in the growing medium after the addition of the 14 fertilizer blends, and in the BNF = blank/control, containing no additional fertiliser.
BlendpHEC (µS/cm)NO3-N
(mg/L)
NH4-N
(mg/L)
P
(mg/L)
K
(mg/L)
Ca
(mg/L)
Mg
(mg/L)
SO4
(mg/L)
BNF5.347201320122614277686
15.3807162427559911233421310
24.721171563527682012003312655
35.69550122569648414371552
44.72093417761997769074572615
55.81557732963714429029822160
64.9378315614705211072111110863209
75.36057109102516116442456222215
84.447371082120553145310927083245
95.2160382359751122912087792172
105.11807454724939289376292360
115.317479823979211289887952105
124.918771065654206518715242396
135.66401236426133942548910
14-Osmocote®4.960384684998708282950
Publisher’s Note: MDPI stays neutral with regard to jurisdictional claims in published maps and institutional affiliations.

