
The Impact of Selenium Fertilization on the Quality Characteristics of Spring Wheat Grain

 , , and
Abstract
:1. Introduction
2. Materials and Methods
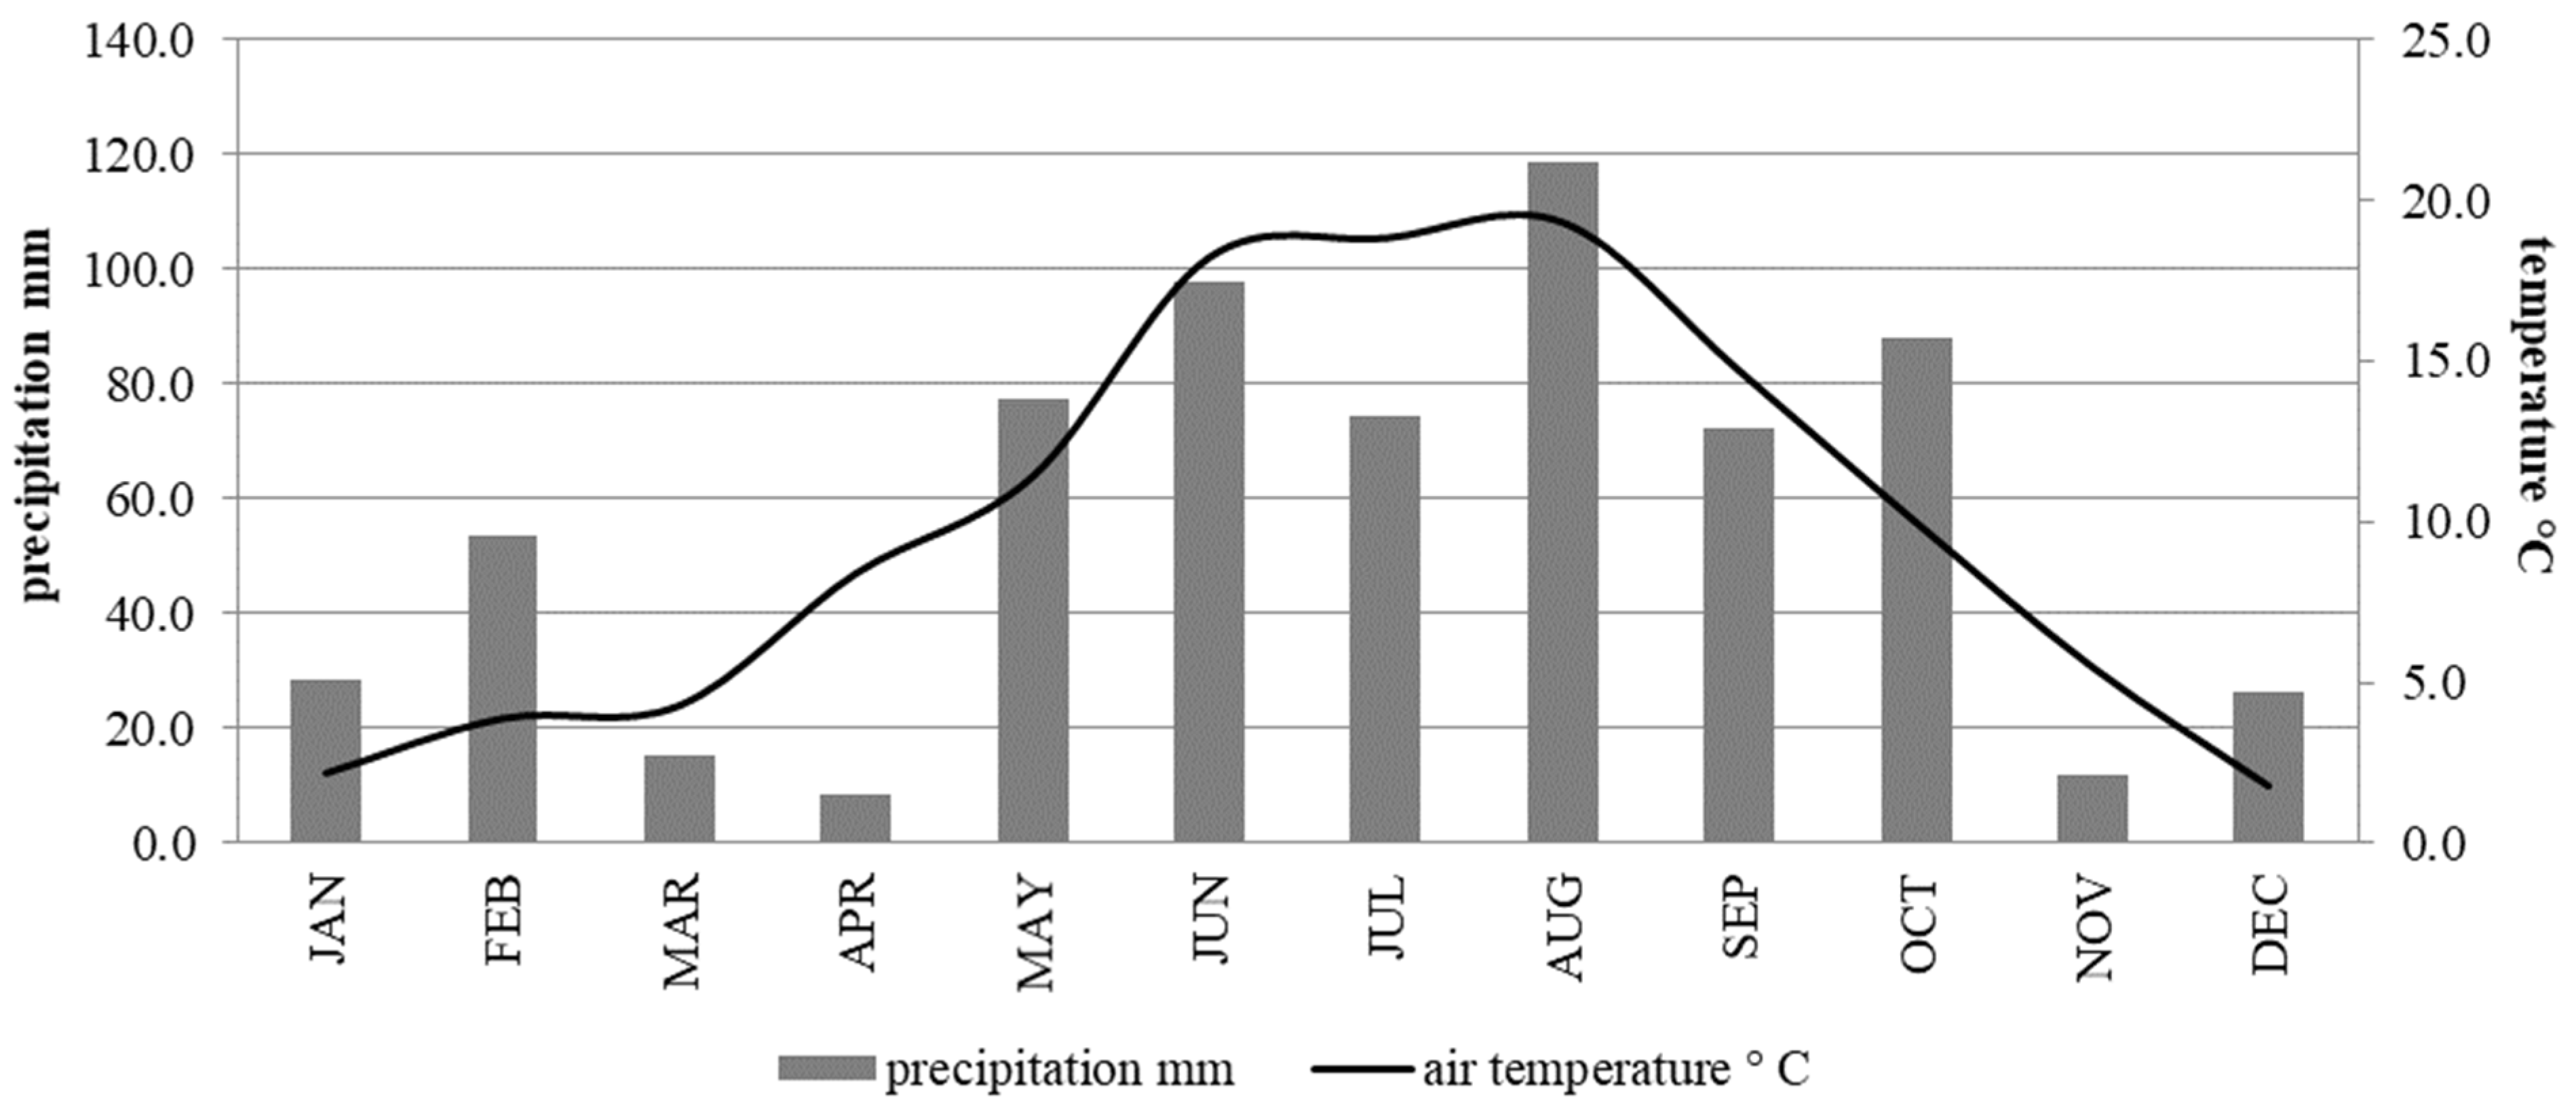
2.1. Study Area
2.2. Plant Growth
2.3. Selenium Fertilizers
2.4. Sampling and Analysis
2.5. Statistical Analyses
3. Results
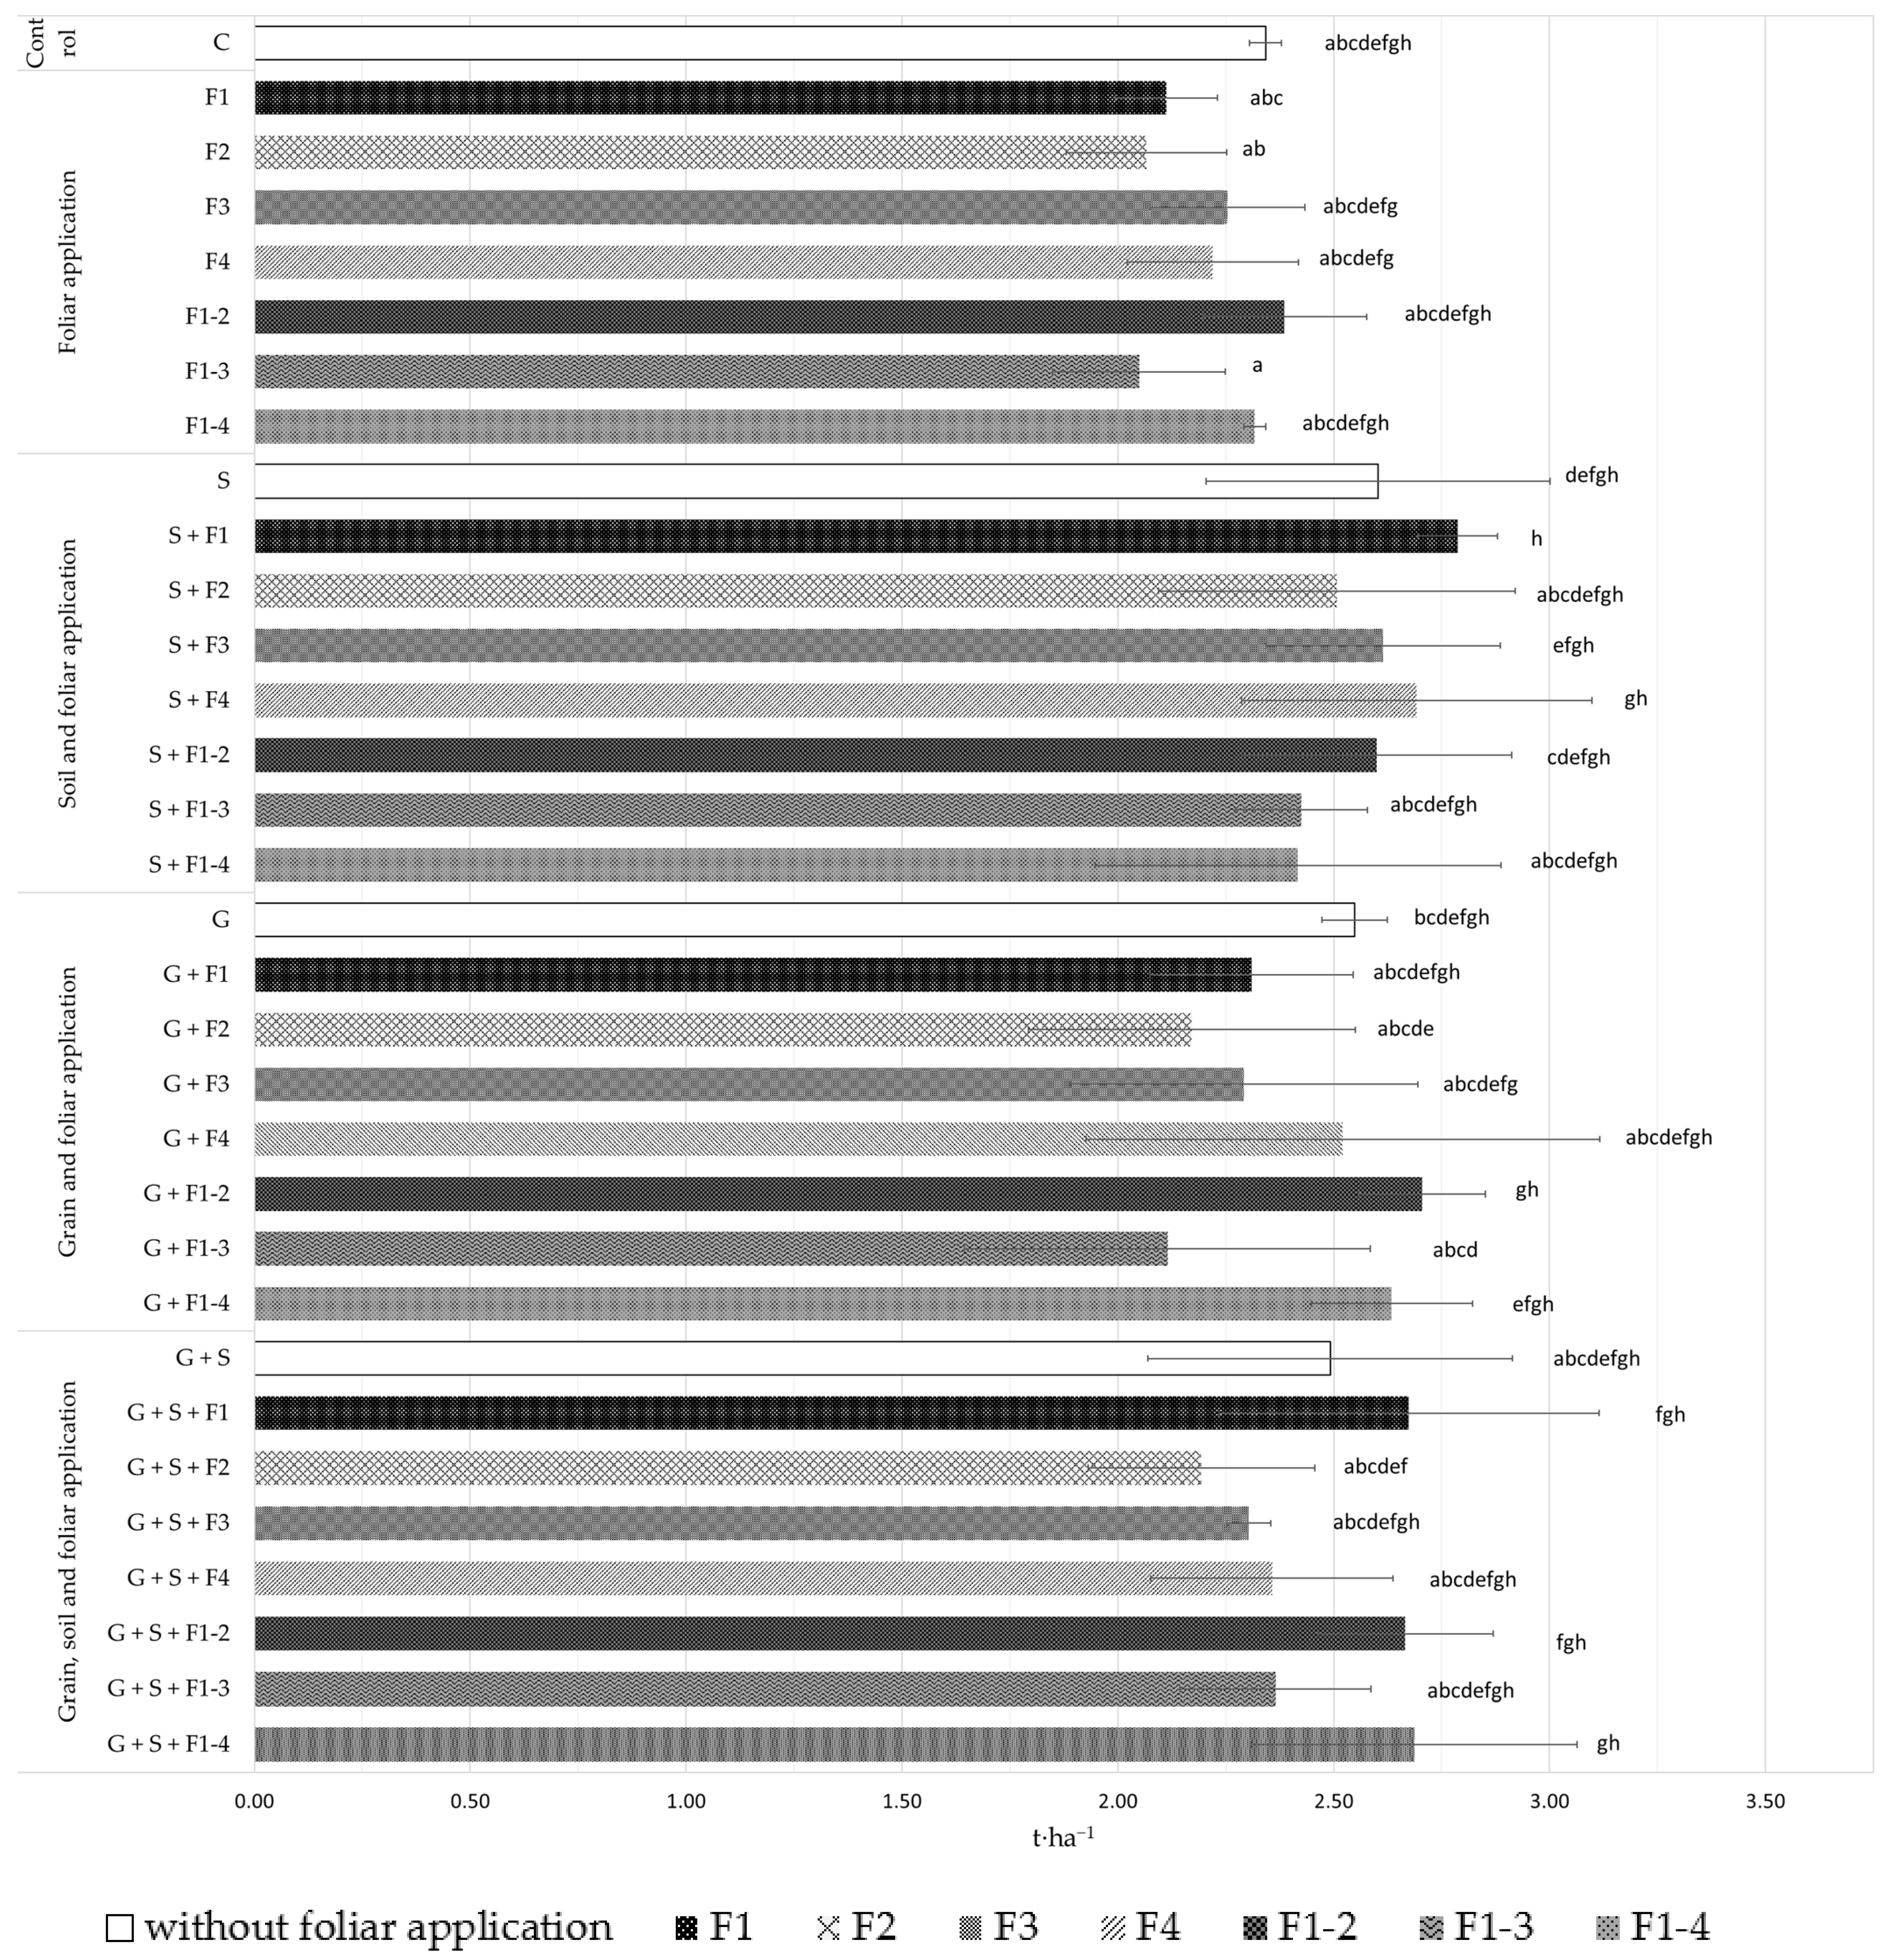
3.1. Grain Yield
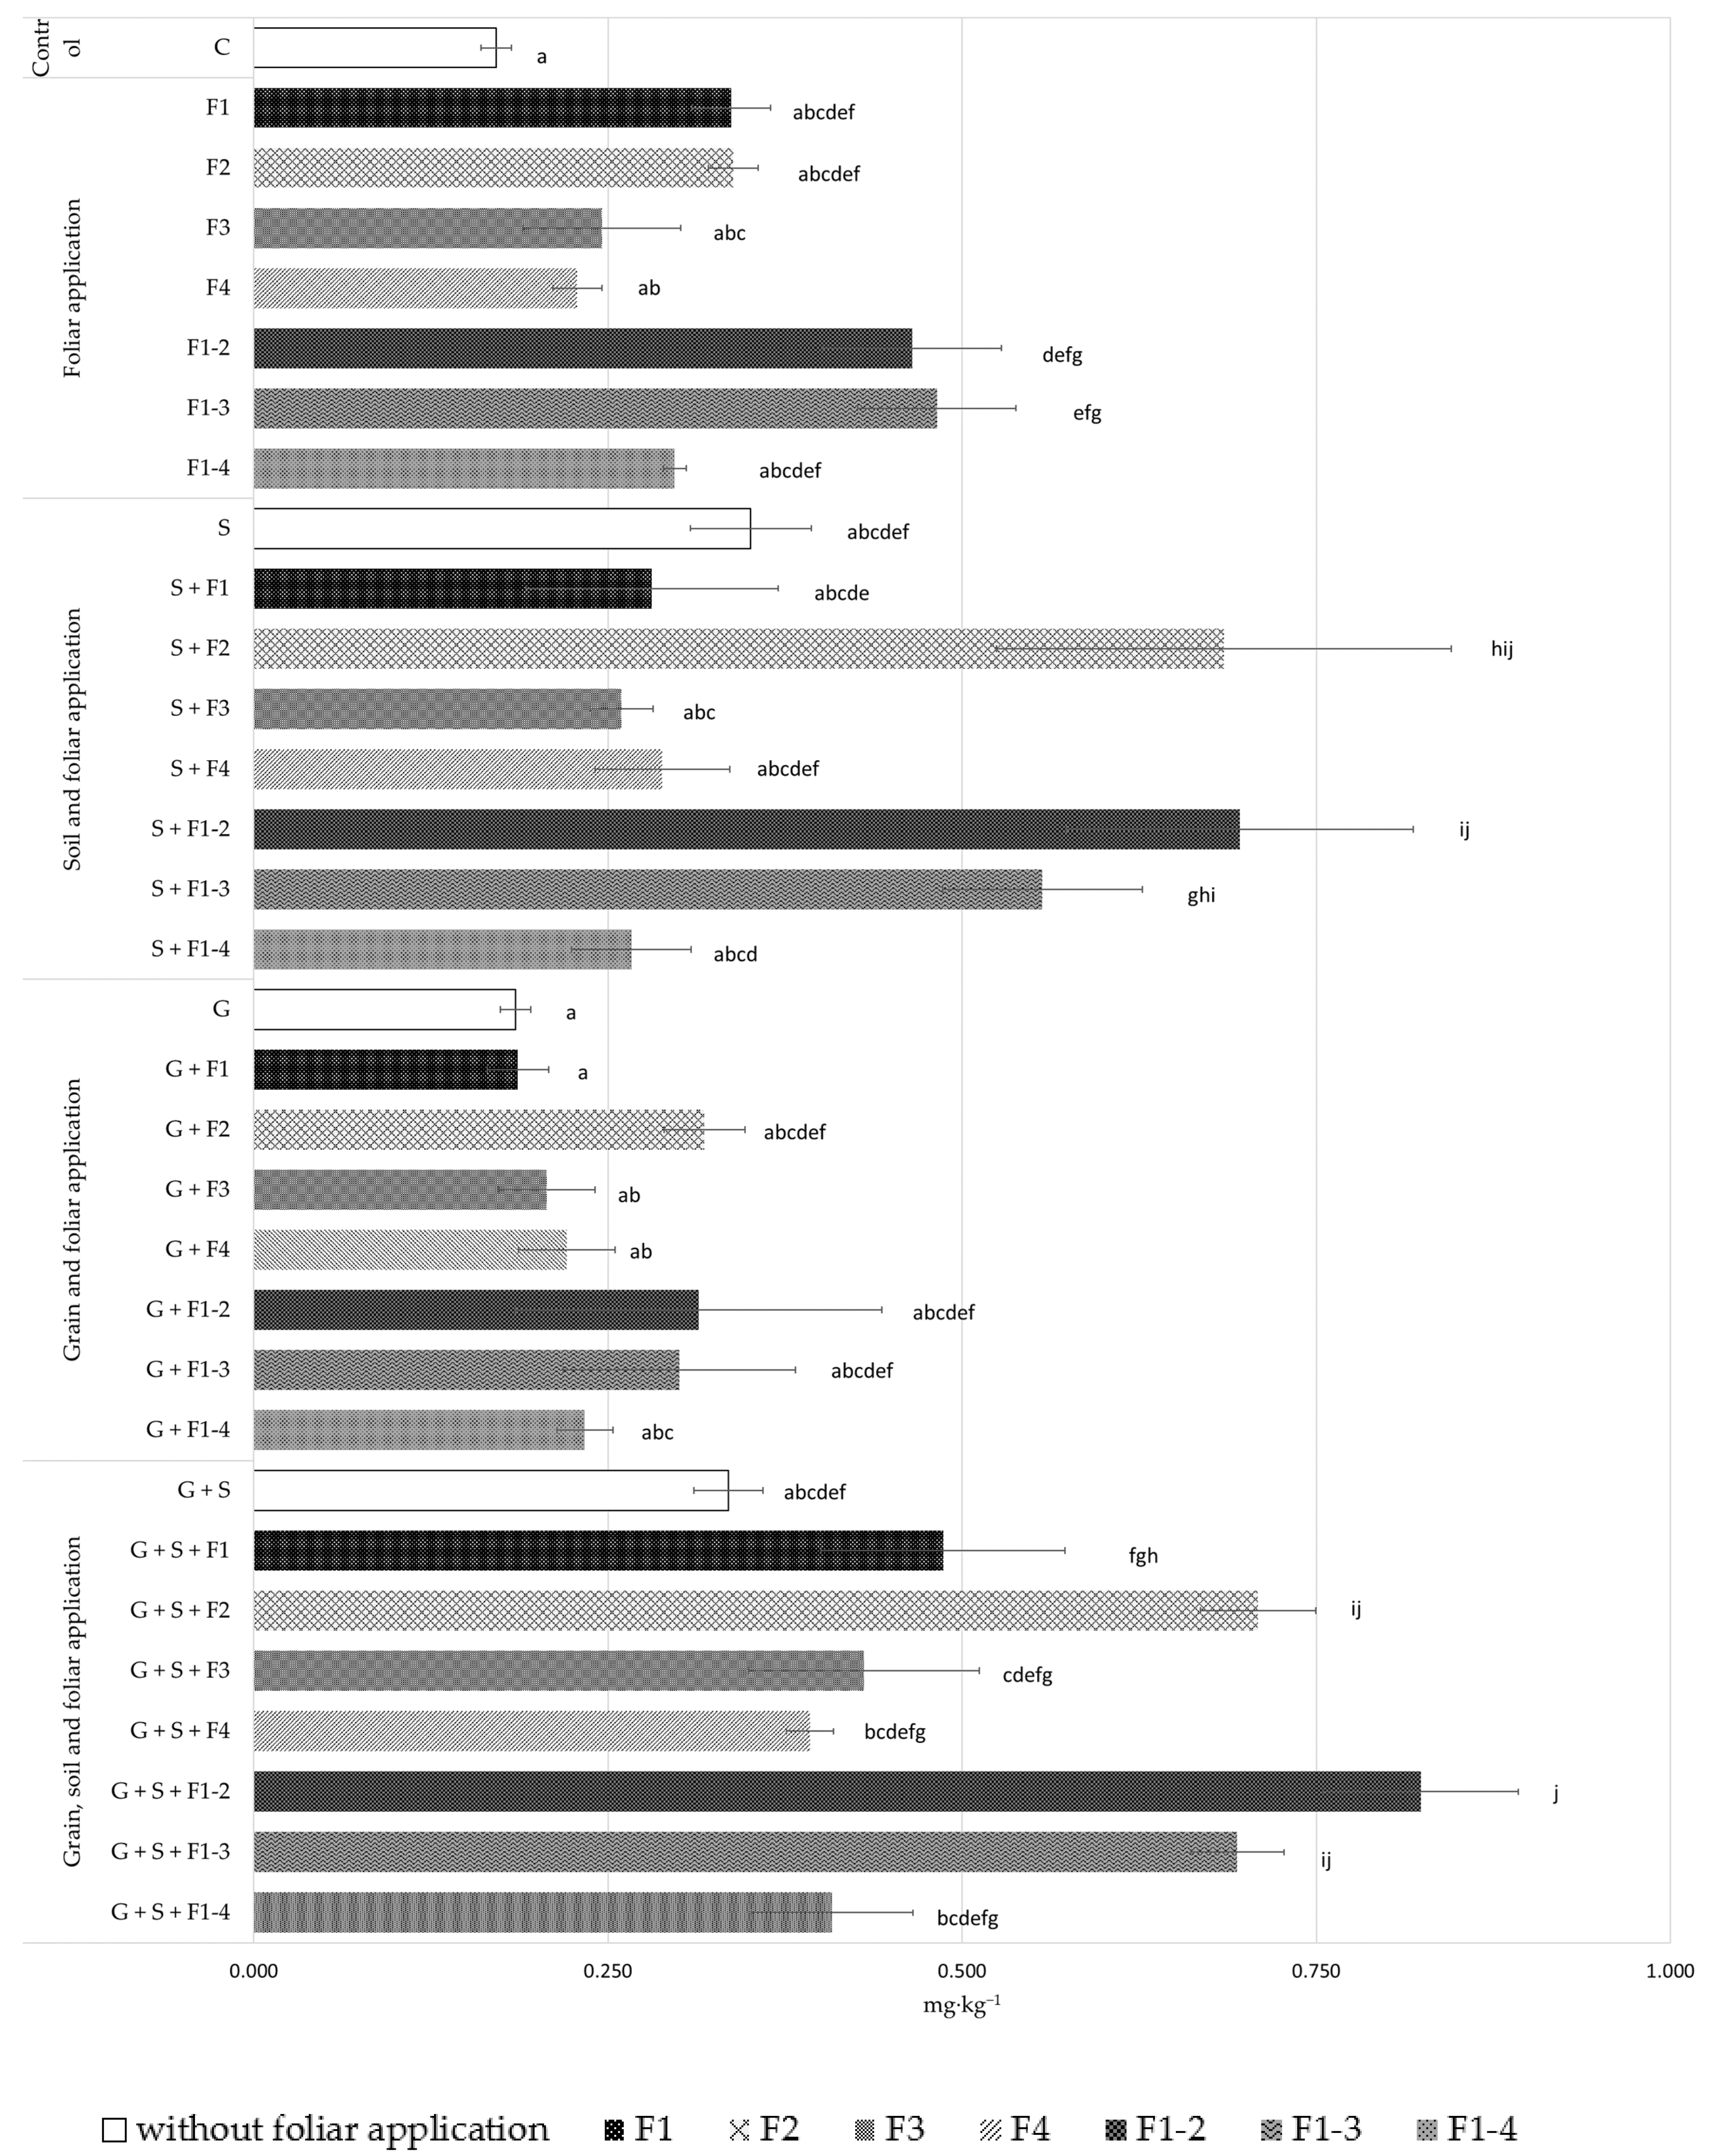
3.2. Selenium Content in Grain
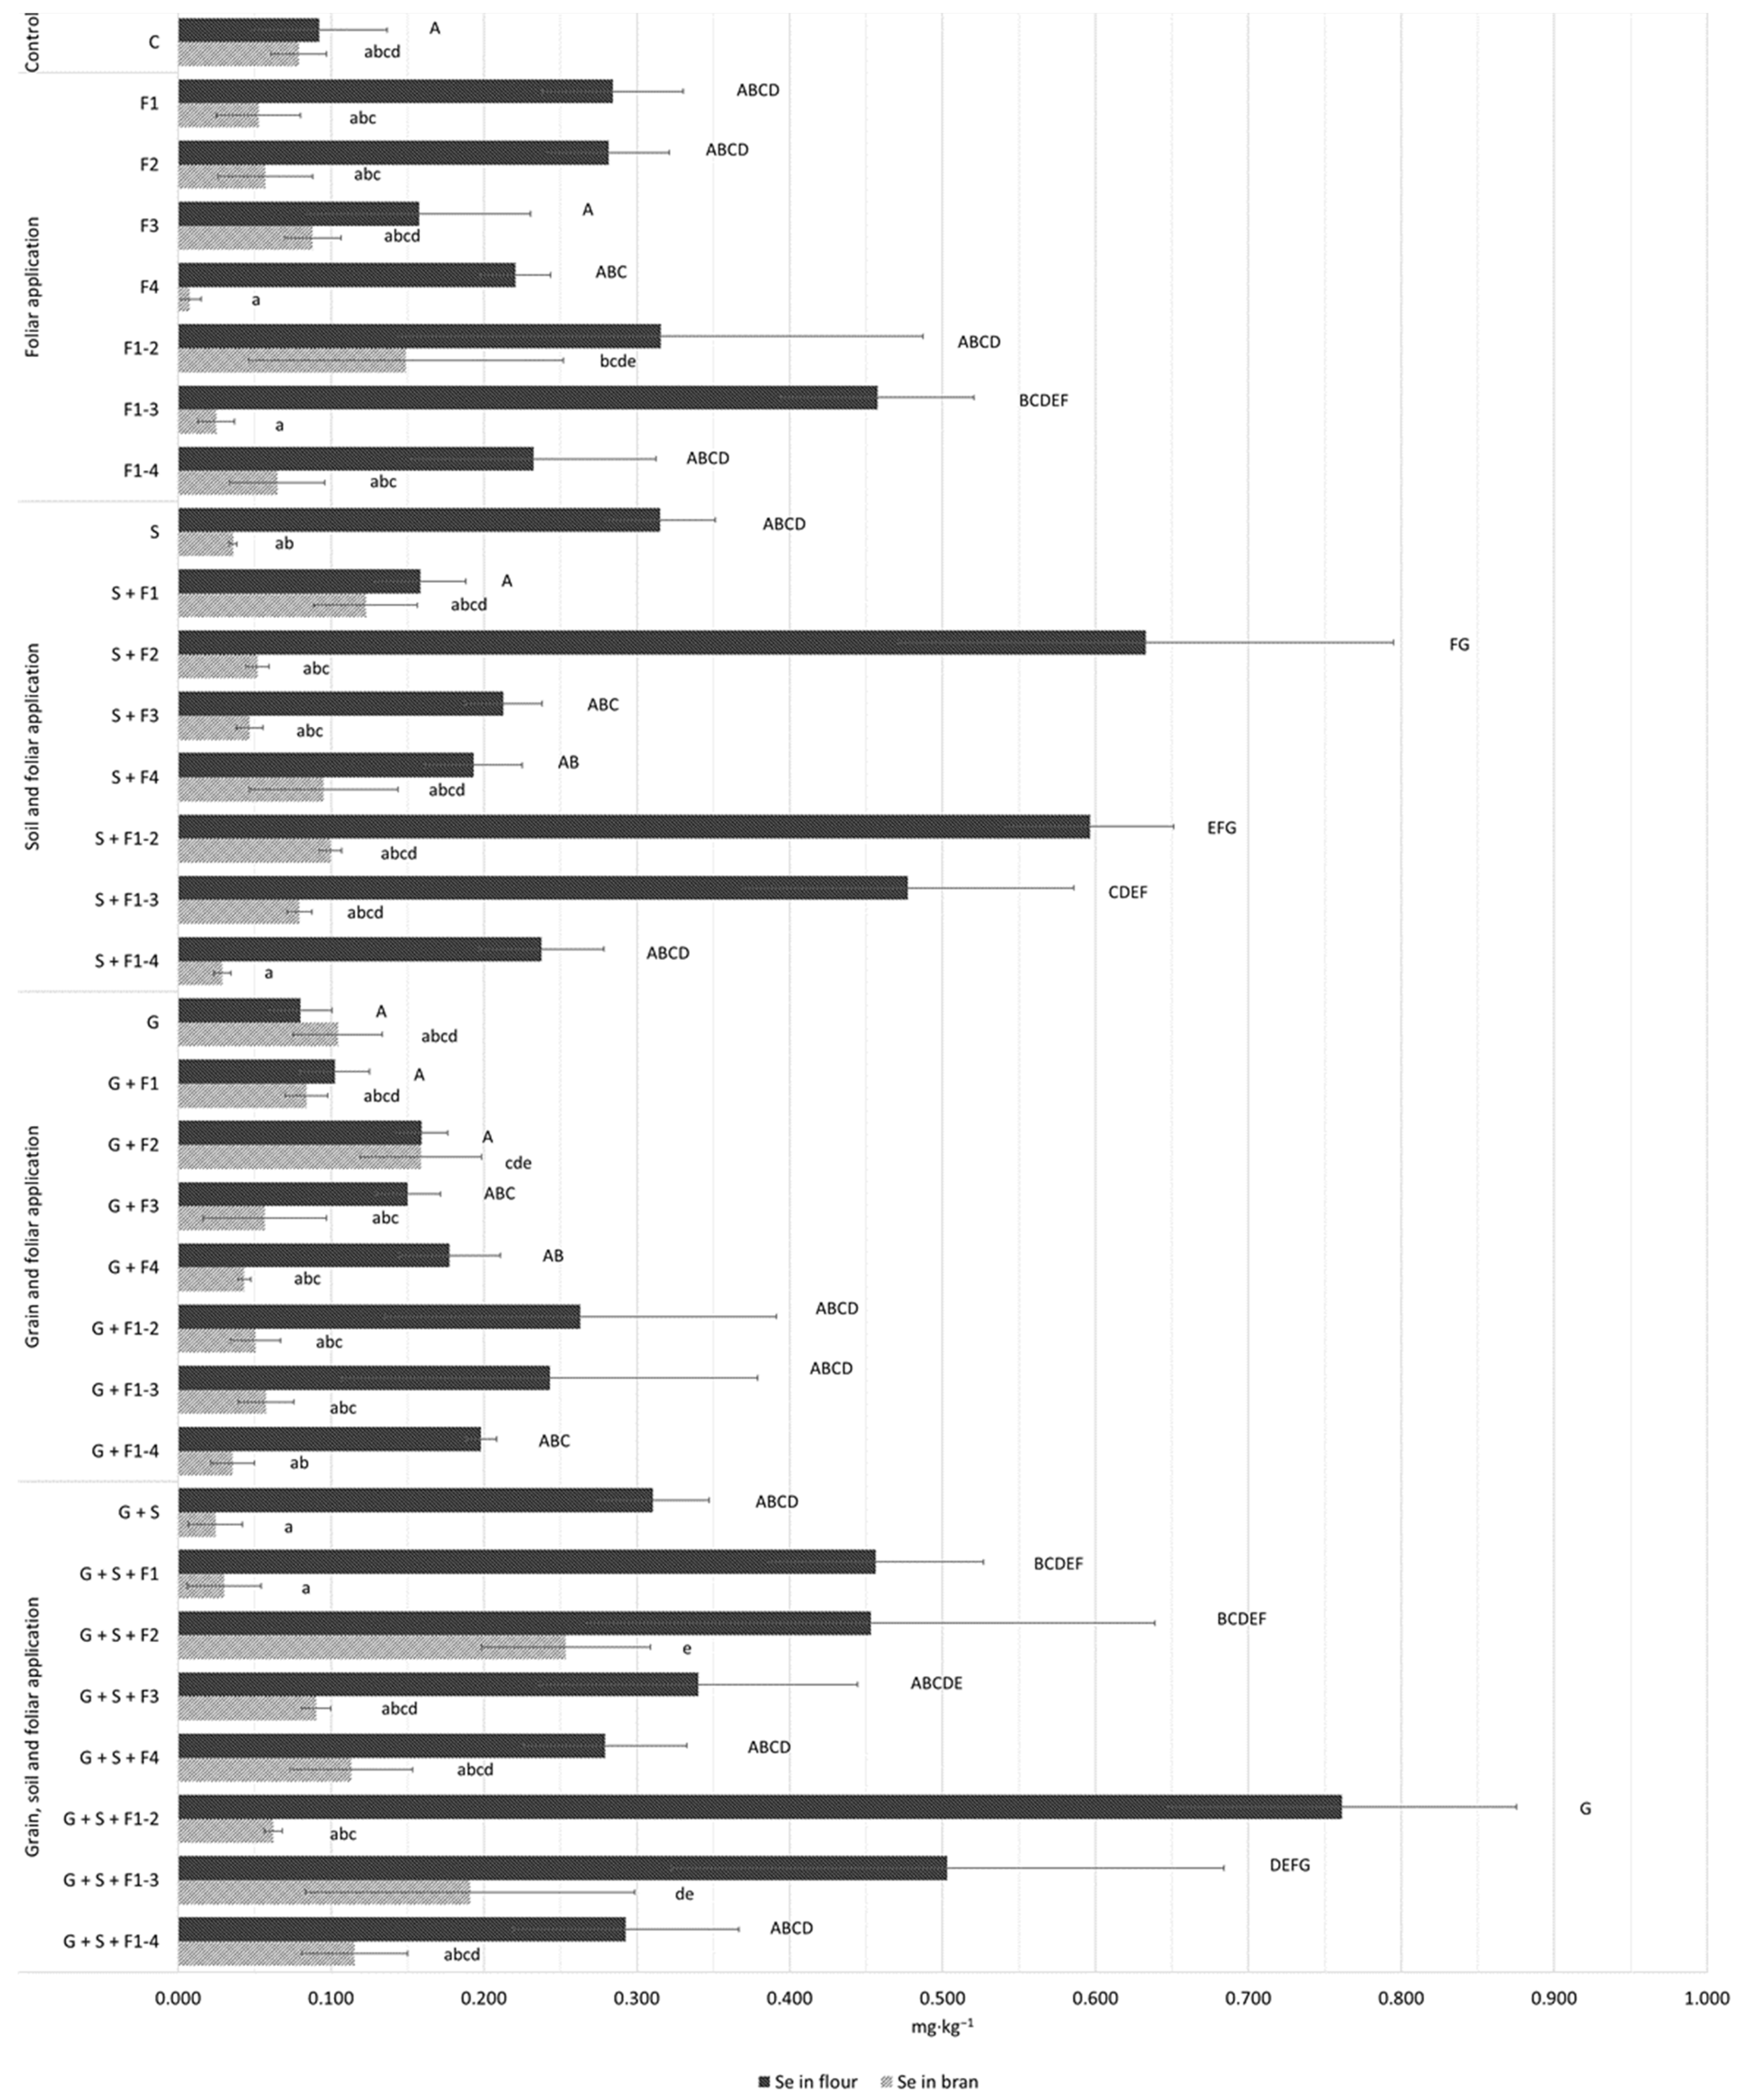
3.3. Selenium Concentration in Flour and Bran
3.4. Subsection
4. Discussion
5. Conclusions
Author Contributions
Funding
Data Availability Statement
Conflicts of Interest
References
- Velu, G.; Ortiz-Monasterio, I.; Cakmak, I.; Hao, Y.; Singh, R. Biofortification strategies to increase grain zinc and iron concentrations in wheat. J. Cereal Sci. 2014, 59, 365–372. [Google Scholar] [CrossRef]
- Shukla, A.K.; Behera, S.K.; Pakhre, A.; Chaudhari, S.K. Micronutrients in soils, plants, animals and humans. Indian J. Fertil. 2018, 14, 30–54. [Google Scholar]
- Peng, Q.; Li, J.; Wang, D.; Wei, T.-J.; Chen, C.-E.L.; Liang, D.-L. Effects of ageing on bioavailability of selenium in soils assessed by diffusive gradients in thin-films and sequential extraction. Plant Soil 2019, 436, 159–171. [Google Scholar] [CrossRef]
- Sahebari, M.; Rezaieyazdi, Z.; Khodashahi, M. Selenium and Autoimmune Diseases: A Review Article. Curr. Rheumatol. Rev. 2019, 15, 123–134. [Google Scholar] [CrossRef]
- Khouzam, R.B.; Lobinski, R.; Pohl, P. Multi-element analysis of bread, cheese, fruit and vegetables by double-focusing sec-tor-field inductively coupled plasma mass spectrometry. Anal. Methods 2011, 3, 2115–2120. [Google Scholar] [CrossRef]
- Maurer, J. The pork meat enriched with organic selenium and its effect on selenium concentration and total antioxidant status in healthy volunteers. Biotechnol. Anim. Husb. 2011, 27, 791–798. [Google Scholar] [CrossRef]
- World Health Organization. Trace Elements in Human Nutrition and Health; World Health Organization: Geneva, Switzerland, 1996; pp. 105–120. [Google Scholar]
- Sonet, J.; Mounicou, S.; Chavatte, L. Nonradioactive isotopic labeling and tracing of selenoproteins in cultured cell lines. In Selenoproteins; Humana Press: New York, NY, USA, 2018; pp. 193–203. [Google Scholar]
- Rayman, M.P. Selenium in cancer prevention: A review of the evidence and mechanism of action. Proc. Nutr. Soc. 2005, 64, 527–542. [Google Scholar] [CrossRef] [Green Version]
- Combs, G.F. Selenium in global food systems. Br. J. Nutr. 2001, 85, 517–547. [Google Scholar] [CrossRef] [Green Version]
- Combs, G.F. Current Evidence and Research Needs to Support a Health Claim for Selenium and Cancer Prevention. J. Nutr. 2005, 135, 343–347. [Google Scholar] [CrossRef] [Green Version]
- Lv, Q.; Liang, X.; Nong, K.; Gong, Z.; Qin, T.; Qin, X.; Wang, D.; Zhu, Y. Advances in Research on the Toxicological Effects of Selenium. Bull. Environ. Contam. Toxicol. 2021, 106, 715–726. [Google Scholar] [CrossRef]
- Zhou, Y.-J.; Zhang, S.-P.; Liu, C.-W.; Cai, Y.-Q. The protection of selenium on ROS mediated-apoptosis by mitochondria dysfunction in cadmium-induced LLC-PK1 cells. Toxicol. Vitr. 2009, 23, 288–294. [Google Scholar] [CrossRef] [PubMed]
- Jat, M.L.; Singh, B.; Stirling, C.M.; Jat, H.S.; Tetarwal, J.P.; Jat, R.K.; Singh, R.; Lopez-Ridaura, S.; Shirsath, P.B. Soil Processes and Wheat Cropping Under Emerging Climate Change Scenarios in South Asia. Adv. Agron. 2018, 148, 111–171. [Google Scholar] [CrossRef]
- Hartikainen, H. Biogeochemistry of selenium and its impact on food chain quality and human health. J. Trace Elem. Med. Biol. 2005, 18, 309–318. [Google Scholar] [CrossRef] [PubMed]
- Weber, R. Influence of tillage method and stubble height on the quality features of grain of selected winter wheat cultivars. Sci. Nat. Technol. 2013, 7, 18. [Google Scholar]
- Buczek, J.; Tobiasz-Salach, R.; Bobrecka-Jamro, D. Effect of foliar fertilization and reduced doses of herbicide on the yield and quality features of winter wheat grain. Fragm. Agron. 2012, 29, 7–15. [Google Scholar]
- Migut, D. Effect of Foliar Fertilization with Dr Green Technology on the Growth, Development, Yield and Quality of Maize Grain. Available online: https://repozytorium.ur.edu.pl/handle/item/6288?show=full (accessed on 1 June 2021).
- Najewski, A.; Szarzyńska, J. Technological value of wheat varieties. Grain Milling Rev. 2013, 57, 2–6. Available online: https://yadda.icm.edu.pl/yadda/element/bwmeta1.element.agro-a0b3c9fd-c45a-4491-a01e-e1eec352a55b (accessed on 1 June 2021).
- Klikocka, H.; Cybulska, M. Influence of nitrogen and sulfur fertilization on the grain yield and quality characteristics of spring wheat. Agron. Sci. 2020, 75, 117–129. [Google Scholar] [CrossRef]
- Stępniewska, S. Technological value of grain of selected wheat varieties. Acta Agrophys. 2015, 22, 103–114. Available online: http://yadda.icm.edu.pl/yadda/element/bwmeta1.element.agro-e7add463-2959-4f66-81bb-741dff9aca8b (accessed on 1 June 2021).
- Kottek, M.; Grieser, J.; Beck, C.; Rudolf, B.; Rubel, F. World Map of the Köppen-Geiger climate classification updated. Meteorol. Z. 2006, 15, 259–263. [Google Scholar] [CrossRef]
- Working Group World Reference Base for Soil Resources. The International Union of Soil Sciences. International Soil Clas-sification System for Naming Soils and Creating Legends for Soil Maps. Available online: http://www.fao.org/soils-portal/data-hub/soil-classification/world-reference-base/en/ (accessed on 12 December 2020).
- British Standard ISO 11466. Available online: https://www.iso.org/standard/19418.html (accessed on 20 January 2021).
- Norm, P. PN-EN ISO 7971-2:2019-03. Cereal Grains—Determination of the Loose Density Called Hectolitre—Part 2: System for Checking Measuring Instruments Against the International Standard Measuring Instrument; Polish Committee for Standardization: Warsaw, Poland, 2019. [Google Scholar]
- Norm, P. PN-R-04013: 1988. Chemical and Agricultural Analysis of Plants. Determination of Air-Dry and Dry Mass; Polish Committee for Standardization: Warsaw, Poland, 1988. [Google Scholar]
- Ramkissoon, C. Selenium Dynamics in Cereal Biofortification: Optimising Fertiliser Strategies and Assessing Residual Fate. Ph.D. Thesis, University of Adelaide, Adelaide, Australia, 2020. Available online: https://digital.library.adelaide.edu.au/dspace/handle/2440/126970 (accessed on 10 March 2021).
- Curtin, D.; Hanson, R.; Van Der Weerden, T.J. Effect of selenium fertiliser formulation and rate of application on selenium concentrations in irrigated and dryland wheat(Triticum aestivum). N. Z. J. Crop. Hortic. Sci. 2008, 36, 1–7. [Google Scholar] [CrossRef] [Green Version]
- De Vita, P.; Platani, C.; Fragasso, M.; Ficco, D.B.M.; Colecchia, S.A.; Del Nobile, M.A.; Padalino, L.; Di Gennaro, S.; Petrozza, A. Selenium-enriched durum wheat improves the nutritional profile of pasta without altering its organoleptic properties. Food Chem. 2017, 214, 374–382. [Google Scholar] [CrossRef] [PubMed]
- Lara, T.S.; Lessa, J.H.D.L.; de Souza, K.R.D.; Corguinha, A.P.B.; Martins, F.A.D.; Lopes, G.; Guilherme, L.R.G. Selenium biofortification of wheat grain via foliar application and its effect on plant metabolism. J. Food Compos. Anal. 2019, 81, 10–18. [Google Scholar] [CrossRef]
- Ekanayake, L.J.; Thavarajah, D.; Vial, E.; Schatz, B.; McGee, R.; Thavarajah, P. Selenium fertilization on lentil (Lens culinaris Medikus) grain yield, seed selenium concentration, and antioxidant activity. Field Crop. Res. 2015, 177, 9–14. [Google Scholar] [CrossRef]
- Nawaz, F.; Ashraf, M.Y.; Ahmad, R.; Waraich, E.A.; Shabbir, R.N.; Hussain, R.A. Selenium supply methods and time of application influence spring wheat (Triticum aestivum L.) yield under water deficit conditions. J. Agric. Sci. 2016, 155, 643–656. [Google Scholar] [CrossRef]
- Gupta, M.; Gupta, S. An Overview of Selenium Uptake, Metabolism, and Toxicity in Plants. Front. Plant Sci. 2017, 7, 2074. [Google Scholar] [CrossRef] [Green Version]
- White, P.J. Selenium accumulation by plants. Ann. Bot. 2015, 117, 217–235. [Google Scholar] [CrossRef] [Green Version]
- Tan, J.A. The Atlas of Endemic Diseases and Their Environment; Science Press: Beijing, China, 1989. [Google Scholar]
- Kaur, N.; Sharma, S.; Kaur, S.; Nayyar, H. Selenium in agriculture: A nutrient or contaminant for crops? Arch. Agron. Soil Sci. 2014, 60, 1593–1624. [Google Scholar] [CrossRef]
- Dinh, Q.T.; Cui, Z.; Huang, J.; Tran, T.A.T.; Wang, D.; Yang, W.; Zhou, F.; Wang, M.; Yu, D.; Liang, D. Selenium distribution in the Chinese environment and its relationship with human health: A review. Environ. Int. 2018, 112, 294–309. [Google Scholar] [CrossRef] [PubMed]
- Bañuelos, G.S.; Freeman, J.; Arroyo, I. Accumulation and speciation of selenium in biofortified vegetables grown under high boron and saline field conditions. Food Chem. X 2019, 5, 100073. [Google Scholar] [CrossRef]
- Lyons, G.H.; Genc, Y.; Stangoulis, J.; Palmer, L.T.; Graham, R.D. Selenium Distribution in Wheat Grain, and the Effect of Postharvest Processing on Wheat Selenium Content. Biol. Trace Elem. Res. 2005, 103, 155–168. [Google Scholar] [CrossRef]
- Rachoń, L.; Kulpa, D. Assessment of the usefulness of durum wheat [Triticum durum Desf.] For the production of bread. Ann. Univ. Mariae Curie-Sklodowska Sect. E Agric. 2004, 59, 995–1000. Available online: https://www.czasopisma.up.lublin.pl/index.php/as/article/view/1959 (accessed on 12 March 2021).
- Rachoń, L.; Krochmal-Marczak, B.; Cebulak, T. Przydatność ziarna jarej pszenicy zwyczajnej, twardej i orkiszowej do produkcji pieczywa w zależności od intensywności technologii produkcji. Agron. Sci. 2020, 75, 25–36. [Google Scholar] [CrossRef]
- Radomski, G.; Bać, A.; Mierzejewska, S. A comparative assessment of baking value of wheat flour and German wheat flour. Agric. Eng. 2007, 5, 369–374. [Google Scholar]
- Knapowski, T.; Kozera, W.; Murawska, B.; Wszelaczyńska, E.; Pobereżny, J.; Mozolewski, W.; Keutgen, A.J. Assessment of technological parameters of selected winter wheat cultivars in terms of baking. Inż. Ap. Chem. 2015, 54, 255–256. [Google Scholar]
- Knapowski, T.; Szczepanek, M.; Wilczewski, E.; Pobereżny, J. Response of wheat to seed dressing with humus and foliar potassium fertilization. J. Agric. Sci. Tech. 2015, 17, 1559–1569. [Google Scholar]
- Krawczyk, P.; Ceglińska, A.; Izdebska, K. Comparing rheological properties of dough and quality of bread made of spelt and common wheat flours. Food Sci. Technol. Qual. 2008, 4, 141–151. Available online: https://agris.fao.org/agris-search/search.do?recordID=PL2009000520 (accessed on 13 March 2021).
- Sztuder, H.; Świerczewska, M. Influence of foliar fertilizers on the quality features of grains of some varieties of winter and spring wheat. Probl. J. Adv. Agric. Sci. 2002, 2, 669–674. Available online: http://agro.icm.edu.pl/agro/element/bwmeta1.element.agro-article-06431938-83e9-4b74-8c13-baa1f31d7543 (accessed on 21 June 2021).
- Augustyniak, B.; Pawłowski, M. Yield and qualitative values of winter wheat grain depending on fertilization with micro-elements. In Problems of Natural and Technical Sciences; Department of Student Affairs of the University of Life Sciences in Wrocław: Wroclaw, Poland, 2018; pp. 12–17. [Google Scholar]
- Spychaj-Fabisiak, E.; Ložek, O.; Knapowski, T.; Ralcewicz, M. The assessment of selected baking parameters of winter wheats under the influence of diverse nitrogen fertilization. Mengen Spurenelem. 2006, 23, 403–408. [Google Scholar]
- Cacak-Pietrzak, G.; Ceglinska, A.; Jonczyk, K. The baking value of flour from wheat varieties grown in an ecological production system. Probl. J. Adv. Agric. Sci. 2014, 576, 23–32. Available online: http://yadda.icm.edu.pl/yadda/element/bwmeta1.element.agro-cff644b4-bee9-4a92-8e91-cf7139468888 (accessed on 21 June 2021).
- Mazurkiewicz, J. Comparison of technological quality of wheat and rye grown in conventional conditions and in an organic farm. Acta Agrophys. 2005, 6, 729–741. [Google Scholar]
- Knapowski, T.; Ralcewicz, M.; Spychaj-Fabisiak, E.; Lożek, O. Assessment of winter wheat grain quality under conditions of differentiated nitrogen fertilization. Fragm. Agron. 2010, 27, 73–80. [Google Scholar]
- Sułek, A. Selected elements of spring wheat technology grown for milling and baking purposes. Stud. Rep. IUNG-PIB 2014, 41, 117–128. [Google Scholar]
- Sułek, A.; Nieróbca, A.; Cacak-Pietrzak, G. The impact of the autumn sowing date on the yield and quality of spring wheat grain. Pol. J. Agron. 2017, 29, 43–50. [Google Scholar]
- Siwek, H.; Sobolewska, M. Wpływ nawożenia popiołem z biomasy i wapnem na cechy jakościowe ziarna, mąki i ciasta z pszenicy ozimej odmiany RGT Kilimanjaro (Triticum aestivum var. Kilimanjaro). Agron. Sci. 2017, 72, 1–9. [Google Scholar] [CrossRef]
- Podolska, G.; Sulek, A. The main elements of the production technology that determine the high quality of wheat grain. Puławski’s Diary 2002, 130, 597–605. [Google Scholar]
- Segit, Z.; Szwed-Urbaś, K. Evaluation of yield structure and technological value of 6 durum wheat (Triticum durum Desf.) lines grain. Ann. UMCS Agric. 2009, 64. [Google Scholar] [CrossRef]
- Borkowska, B.; Banach, D. Assessment of selected physicochemical properties of wheat and rye from the northern and southern region of Poland. Ann. Pol. Assoc. Agric. Agribus. Econ. 2018, 20, 18–22. [Google Scholar] [CrossRef]
- Dziura, M.; Gorzelany, J.; Migut, D.; Matłok, N.; Belcar, J. Assessment of physical and chemical parameters of wheat grain delivered to the SR San purchase in Głuchów in 2015–2016. Food Process. Eng. 2017, 3, 14–18. Available online: http://yadda.icm.edu.pl/yadda/element/bwmeta1.element.ekon-element-000171503107 (accessed on 15 May 2021).
- Stępniewska, S.; Abramczyk, D. Relationship between grain quality parameters of selected winter wheat cultivars. Adv. J. Food. Sci. Technol. 2013, 1, 65–78. Available online: https://www.infona.pl/resource/bwmeta1.element.agro-c8d76ab5-38f3-4c8f-864f-f26a23c337ff/tab/summary (accessed on 15 May 2021).
- Miziniak, W.; Matysiak, K.; Kiniec, A. Influence of application of retardants with pinoxaden on selected quality characteristics of winter wheat grain. Prog. Plant Prot. 2018, 58, 203–208. [Google Scholar] [CrossRef]


| Treatment | Dose of Se | Total Dose of Se | |
|---|---|---|---|
| Control | C | 0.00 g·ha−1 | 0.00 g·ha−1 |
| Foliar application | F1 | 5.00 g·ha−1 | 5.00 g·ha−1 |
| F2 | 5.00 g·ha−1 | 5.00 g·ha−1 | |
| F3 | 5.00 g·ha−1 | 5.00 g·ha−1 | |
| F4 | 5.00 g·ha−1 | 5.00 g·ha−1 | |
| F1-2 | 2.50 g·ha−1 in each treatment | 5.00 g·ha−1 | |
| F1-3 | 1.67 g·ha−1 in each treatment | 5.00 g·ha−1 | |
| F1-4 | 1.25 g·ha−1 in each treatment | 5.00 g·ha−1 | |
| Grain and foliar application | G | 50.00 µmol grain | 50.00 µmol |
| G + F1 | 50.00 µmol grain + 5.00 g·ha−1 foliar | 50.00 µmol + 5.00 g·ha−1 | |
| G + F2 | 50.00 µmol grain + 5.00 g·ha−1 foliar | 50.00 µmol + 5.00 g·ha−1 | |
| G + F3 | 50.00 µmol grain + 5.00 g·ha−1 foliar | 50.00 µmol + 5.00 g·ha−1 | |
| G + F4 | 50.00 µmol grain + 5.00 g·ha−1 foliar | 50.00 µmol + 5.00 g·ha−1 | |
| G + F1-2 | 50.00 µmol grain + 2.5 g·ha−1 foliar in each treatment | 50.00 µmol + 5.00 g·ha−1 | |
| G + F1-3 | 50.00 µmol grain + 1.67 g·ha−1 foliar in each treatment | 50.00 µmol + 5.00 g·ha−1 | |
| G + F1-4 | 50.00 µmol grain + 1.25 g·ha−1 foliar in each treatment | 50.00 µmol + 5.00 g·ha−1 | |
| Soil and foliar application | S | 5.00 g·ha−1 | 5.00 g·ha−1 |
| S + F1 | 5.00 g·ha−1 soil + 5.00 g·ha−1 foliar | 10.00 g·ha−1 | |
| S + F2 | 5.00 g·ha−1 soil + 5.00 g·ha−1 foliar | 10.00 g·ha−1 | |
| S + F3 | 5.00 g·ha−1 soil + 5.00 g·ha−1 foliar | 10.00 g·ha−1 | |
| S + F4 | 5.00 g·ha−1 soil + 5.00 g·ha−1 foliar | 10.00 g·ha−1 | |
| S + F1-2 | 5.00 g·ha−1 soil + 2.50 g·ha−1 foliar in each treatment | 10.00 g·ha−1 | |
| S + F1-3 | 5.00 g·ha−1 soil + 1.67 g·ha−1 foliar in each treatment | 10.00 g·ha−1 | |
| S + F1-4 | 5.00 g·ha−1 soil + 1.25 g·ha−1 foliar in each treatment | 10.00 g·ha−1 | |
| Grain, soil and foliar application | G + S | 5.00 g·ha−1 µmol grain + 5.00 g·ha−1 soil | 50.00 µmol + 5.00 g·ha−1 |
| G + S + F1 | 50.00 µmol grain + 5.00 g·ha−1 soil + 5.00 g·ha−1 foliar | 50.00 µmol + 10.00 g·ha−1 | |
| G + S + F2 | 50.00 µmol grain + 5.00 g·ha−1 soil + 5.00 g·ha−1 foliar | 50.00 µmol + 10.00 g·ha−1 | |
| G + S + F3 | 50.00 µmol grain + 5.00 g·ha−1 soil + 5.00 g·ha−1 foliar | 50.00 µmol + 10.00 g·ha−1 | |
| G + S + F4 | 50.00 µmol grain + 5.00 g·ha−1 soil + 5.00 g·ha−1 foliar | 50.00 µmol + 10.00 g·ha−1 | |
| G + S + F1-2 | 50.00 µmol grain + 5.00 g·ha−1 soil + 2.50 g·ha−1 foliar in each treatment | 50.00 µmol + 10.00 g·ha−1 | |
| G + S + F1-3 | 50.00 µmol grain + 5.00 g·ha−1 soil + 1.67 g·ha−1 foliar in each treatment | 50.00 µmol + 10.00 g·ha−1 | |
| G + S + F1-4 | 50.00 µmol grain + 5.00 g·ha−1 soil + 1.25 g·ha−1 foliar in each treatment | 50.00 µmol + 10.00 g·ha−1 | |
| Experience Factor | Fertilization and Application Time |
|---|---|
| yield | 0.927 |
| Se content in grain | 0.000 |
| Se content in flour | 0.000 |
| Se content in bran | 0.000 |
| falling number | 0.000 |
| bulk density | 0.225 |
| total protein content | 0.012 |
| wet gluten yield | 0.838 |
| starch content | 0.977 |
| Zeleny sedimentation index | 0.169 |
| Yield | Se Content in Grain | Se Content in Flour | Se Content in Bran | Falling Number | Bulk Density | Total Protein Content | Wet Gluten Yield | Starch Content | Zeleny Sedimentation Index | |
|---|---|---|---|---|---|---|---|---|---|---|
| Yield | n.d. | n.d. | n.d. | 0.429 | n.d. | n.d. | n.d. | n.d. | n.d. | |
| Se content in grain | 0.917 | 0.309 | n.d. | n.d. | 0.242 | 0.238 | −0.222 | 0.240 | ||
| Se content in flour | n.d. | n.d. | n.d. | n.d. | n.d. | n.d. | n.d. | |||
| Se content in bran | n.d. | n.d. | n.d. | n.d. | n.d. | n.d. | ||||
| Falling number | n.d. | n.d. | n.d. | n.d. | n.d. | |||||
| Bulk density | n.d. | n.d. | n.d. | n.d. | ||||||
| Total protein content | 0.891 | −0.798 | 0.905 | |||||||
| Wet gluten yield | −0.895 | 0.918 | ||||||||
| Starch content | −0.827 | |||||||||
| Zeleny sedimentation index |
| Treatment | Falling Number (s) | Bulk Density (kg·hl−1) | Total Protein Content (%) | Wet Gluten Content (%) | Starch Content (%) | Wskaźnik Sed. Zeleny’ego | |
|---|---|---|---|---|---|---|---|
| Control | C | 255.3 ± 10.69 abc | 77.33 ± 0.69 a | 12.36 ± 0.02 bcdefgh | 27.74 ± 0.94 abc | 69.43 ± 0.47 a | 38.33 ± 2.17 efghij |
| Foliar application | F1 | 257.3 ± 10.12 abc | 77.17 ± 0.57 a | 12.00 ± 0.08 abcdefg | 26.56 ± 2.23 abc | 69.57 ± 0.70 a | 34.37 ± 2.22 bcde |
| F2 | 249.0 ± 12.17 ab | 77.13 ± 0.61 a | 11.43 ± 0.03 abcde | 24.77 ± 0.75 abc | 70.20 ± 0.80 a | 32.97 ± 1.50 abcd | |
| F3 | 274.3 ± 11.5 abcd | 77.72 ± 0.91 a | 11.27 ± 0.01 abcd | 24.82 ± 0.36 abc | 70.30 ± 0.10 a | 33.93 ± 1.50 bcde | |
| F4 | 252.7 ± 9.02 abc | 76.81 ± 0.68 a | 11.53 ± 0.07 abcdef | 25.61 ± 2.31 abc | 70.50 ± 0.61 a | 33.33 ± 0.67 abcd | |
| F1-2 | 260.3 ± 11.24 abcd | 77.57 ± 1.14 a | 11.43 ± 0.02 abcde | 25.4 ± 0.57 abc | 69.97 ± 0.67 a | 41.10 ± 3.22 hijk | |
| F1-3 | 251.0 ± 8.89 abc | 77.00 ± 0.68 a | 11.67 ± 0.07 abcdef | 25.92 ± 0.80 abc | 69.47 ± 0.81 a | 41.63 ± 2.47 ijk | |
| F1-4 | 249.0 ± 15.1 ab | 77.52 ± 1.08 a | 11.57 ± 0.02 abcdef | 25.21 ± 0.38 abc | 69.90 ± 0.46 a | 42.83 ± 2.04 jk | |
| Grain and foliar application | G | 262.0 ± 6.08 abcd | 78.19 ± 0.96 a | 12.23 ± 0.03 bcdefgh | 27.80 ± 1.10 abc | 69.67 ± 0.25 a | 36.20 ± 2.55 cdefg |
| G + F1 | 272.0 ± 11.53 abcd | 77.63 ± 1.82 a | 11.90 ± 0.04 abcdefg | 27.12 ± 1.50 abc | 69.77 ± 0.31 a | 39.77 ± 3.01 fghijk | |
| G + F2 | 247.0 ± 14.8 a | 78.37 ± 0.22 a | 11.93 ± 0.07 abcdefg | 26.47 ± 2.40 abc | 69.47 ± 0.67 a | 40.37 ± 3.30 fghijk | |
| G + F3 | 284.7 ± 10.97 bcd | 78.19 ± 0.61 a | 10.60 ± 0.05 a | 22.57 ± 2.68 a | 70.77 ± 0.86 a | 44.07 ± 1.56 k | |
| G + F4 | 256.0 ± 11.53 abc | 76.81 ± 0.45 a | 10.90 ± 0.05 ab | 23.56 ± 1.62 ab | 70.60 ± 0.53 a | 42.50 ± 1.30 ijk | |
| G + F1-2 | 271.7 ± 12.5 abcd | 77.47 ± 1.01 a | 11.50 ± 0.08 abcdef | 25.69 ± 2.28 abc | 70.10 ± 0.79 a | 42.70 ± 3.28 jk | |
| G + F1-3 | 250.0 ± 7.55 abc | 77.30 ± 0.52 a | 11.57 ± 0.13 abcdef | 25.51 ± 3.97 abc | 69.80 ± 10 a | 38.30 ± 1.82 efghij | |
| G + F1-4 | 270.7 ± 9.07 abcd | 77.08 ± 0.94 a | 12.03 ± 0.04 abcdefg | 26.97 ± 1.37 abc | 69.53 ± 0.45 a | 35.77 ± 2.27 cdef | |
| Soil and foliar application | S | 259.7 ± 8.33 abcd | 78.21 ± 1.29 a | 12.37 ± 0.02 bcdefgh | 29.66 ± 2.07 bc | 68.77 ± 0.67 a | 33.00 ± 2.19 abcd |
| S + F1 | 281.3 ± 2.52 abcd | 77.42 ± 1.09 a | 12.67 ± 0.04 cdefgh | 29.32 ± 2.46 bc | 69.03 ± 0.91 a | 35.9 ± 2.40 cdef | |
| S + F2 | 286.7 ± 8.33 cd | 78.19 ± 0.52 a | 12.97 ± 0.06 efgh | 29.99 ± 2.08 bc | 68.93 ± 1.01 a | 28.83 ± 1.62 a | |
| S + F3 | 263.0 ± 11.27 abcd | 77.77 ± 1.20 a | 12.80 ± 0.03 defgh | 28.54 ± 1.96 abc | 69.07 ± 1.33 a | 30.27 ± 1.17 ab | |
| S + F4 | 269.0 ± 16.46 abcd | 78.33 ± 1.51 a | 13.07 ± 0.08 fgh | 28.79 ± 5.63 abc | 69.10 ± 1.71 a | 33.13 ± 5.02 abcd | |
| S + F1-2 | 259.7 ± 17.47 abcd | 78.4 ± 0.72 a | 13.73 ± 0.01 h | 30.62 ± 1.95 c | 68.73 ± 0.86 a | 34.23 ± 9.22 bcde | |
| S + F1-3 | 265.7 ± 17.39 abcd | 78.68 ± 0.40 a | 12.57 ± 0.03 cdefgh | 29.78 ± 1.45 bc | 68.80 ± 0.70 a | 36.67 ± 2.65 cdefgh | |
| S + F1-4 | 262.7 ± 11.72 abcd | 76.50 ± 0.66 a | 13.30 ± 0.05 gh | 29.51 ± 2.87 bc | 68.73 ± 0.61 a | 37.73 ± 2.35 defghi | |
| Grain, soil and foliar application | G + S | 257.0 ± 60 abc | 78.76 ± 0.40 a | 12.23 ± 0.06 bcdefgh | 27.43 ± 1.58 abc | 69.50 ± 0.53 a | 32.90 ± 0.78 abcd |
| G + S + F1 | 279.3 ± 4.16 abcd | 79.06 ± 0.07 a | 11.77 ± 0.03 abcdefg | 26.12 ± 0.67 abc | 70.07 ± 0.47 a | 34.50 ± 1.45 bcde | |
| G + S + F2 | 251.3 ± 12.06 abc | 77.80 ± 1.40 a | 12.43 ± 0.03 bcdefgh | 27.86 ± 0.93 abc | 68.97 ± 0.29 a | 38.30 ± 1.87 efghij | |
| G + S + F3 | 250.7 ± 10.5 abc | 78.58 ± 0.25 a | 11.43 ± 0.03 abcde | 25.90 ± 0.72 abc | 70.00 ± 0.46 a | 36.53 ± 4.17 cdefgh | |
| G + S + F4 | 278.7 ± 13.65 abcd | 79.14 ± 0.4 a | 11.17 ± 0.03 abc | 25.45 ± 2.32 abc | 69.93 ± 0.57 a | 32.77 ± 1.44 abc | |
| G + S + F1-2 | 286.0 ± 7.21 bcd | 77.98 ± 0.14 a | 12.23 ± 0.06 bcdefgh | 27.79 ± 1.56 abc | 69.47 ± 0.45 a | 37.73 ± 1.52 defghi | |
| G + S + F1-3 | 254.7 ± 20.21 abc | 78.02 ± 0.81 a | 11.90 ± 0.02 abcdefg | 26.69 ± 1.98 abc | 69.93 ± 1.11 a | 36 ± 5.71 cdef | |
| G + S + F1-4 | 294.7 ± 6.03 d | 78.33 ± 0.70 a | 12.53 ± 0.01 cdefgh | 29.06 ± 0.14 abc | 69.40 ± 0.30 a | 41.03 ± 0.71 ghijk | |
Publisher’s Note: MDPI stays neutral with regard to jurisdictional claims in published maps and institutional affiliations. |
© 2021 by the authors. Licensee MDPI, Basel, Switzerland. This article is an open access article distributed under the terms and conditions of the Creative Commons Attribution (CC BY) license (https://creativecommons.org/licenses/by/4.0/).
Share and Cite
Radawiec, A.; Rutkowska, B.; Tidaback, J.A.; Gozdowski, D.; Knapowski, T.; Szulc, W. The Impact of Selenium Fertilization on the Quality Characteristics of Spring Wheat Grain. Agronomy 2021, 11, 2100. https://doi.org/10.3390/agronomy11112100
Radawiec A, Rutkowska B, Tidaback JA, Gozdowski D, Knapowski T, Szulc W. The Impact of Selenium Fertilization on the Quality Characteristics of Spring Wheat Grain. Agronomy. 2021; 11(11):2100. https://doi.org/10.3390/agronomy11112100
Chicago/Turabian StyleRadawiec, Aleksandra, Beata Rutkowska, Justina Anna Tidaback, Dariusz Gozdowski, Tomasz Knapowski, and Wiesław Szulc. 2021. "The Impact of Selenium Fertilization on the Quality Characteristics of Spring Wheat Grain" Agronomy 11, no. 11: 2100. https://doi.org/10.3390/agronomy11112100